Embed Size (px)
Citation preview
General rights Copyright and moral rights for the publications made accessible in the public portal are retained by the authors and/or other copyright owners and it is a condition of accessing publications that users recognise and abide by the legal requirements associated with these rights.
• Users may download and print one copy of any publication from the public portal for the purpose of private study or research. • You may not further distribute the material or use it for any profit-making activity or commercial gain • You may freely distribute the URL identifying the publication in the public portal
If you believe that this document breaches copyright please contact us providing details, and we will remove access to the work immediately and investigate your claim.
Downloaded from orbit.dtu.dk on: Apr 21, 2018
Gas Temperature and Radiative Heat Transfer in Oxy-fuel Flames
Bäckström, Daniel; Johansson, Robert; Andersson, Klas; Johnsson, Filip; Clausen, Sønnik; Fateev,Alexander
Publication date:2012
Link back to DTU Orbit
Citation (APA):Bäckström, D., Johansson, R., Andersson, K., Johnsson, F., Clausen, S., & Fateev, A. (2012). Gas Temperatureand Radiative Heat Transfer in Oxy-fuel Flames. Paper presented at 37th International Technical Conference onClean Coal & Fuel Systems. The Clearwater Clean Coal Conference, Clearwater, FL, United States.
*Corresponding author. Tel +46 31 772 5257, [email protected]
GAS TEMPERATURE AND RADIATIVE HEAT TRANSFER IN OXY-FUEL
FLAMES
Daniel Bäckström*, Robert Johansson, Klas Andersson, Filip Johnsson
Department of Energy and Environment, Chalmers University of Technology, Sweden
Sønnik Clausen, Alexander Fateev
Department of Chemical and Biochemical Engineering, Technical University of Denmark,
DTU, DK-2800 Kgs. Lyngby, Denmark
ABSTRACT
This work presents measurements of the gas temperature, including fluctuations, and its
influence on the radiative heat transfer in oxy-fuel flames. The measurements were carried out
in the Chalmers 100 kW oxy-fuel test unit. The in-furnace gas temperature was measured by a
suction pyrometer and by an optical system based on FTIR-spectroscopy. The radiation
intensity was measured by a Narrow Angle Radiometer and the gas radiation was calculated
with a Statistical Narrow Band model. The overall agreement between the two temperature
measurement techniques was good. The optical system showed a lower temperature than the
suction pyrometer in the low velocity regions of the furnace, a difference which is likely to be
an effect of the purge gas added in the optical probe. The measured temperature fluctuations
were evaluated by modeling of the gas radiation. The influence from the measured
fluctuations on the radiative heat transfer shows no effect of turbulence-radiation interaction.
However, by comparing with temperature fluctuations in other flames it can be seen that the
fluctuations measured here are relatively small. Further research is needed to clarify to which
extent the applied methods can account for the turbulence-radiation interaction in the
investigated flame.
INTRODUCTION
One of the main options proposed for capture of CO2 from fossil based power production is
oxy-fuel combustion [1]. In this technology the combustion air is replaced by oxygen and
recirculated flue gases thereby replacing the N2 in the furnace with CO2 and H2O. This has an
impact on the radiative heat transfer since both CO2 and H2O absorb and emit radiation in
contrast to N2, which is an inactive gas with respect to radiation. Radiation is the main heat
transfer mechanism in combustion chambers and has accordingly been identified as a key
research question for development of the oxy-fuel technology. The emitted radiation is
proportional to the temperature to the power of four, and it is therefore crucial to accurately
measure the in-furnace temperature for understanding of the radiative heat transfer. The
temperature in flames is constantly changing. Applying a time average of these fluctuations in
modeling of radiation can therefore not be done without introducing errors due to the strongly
non-linear relation between temperature and radiation. The interaction between these
fluctuations and radiation is called Turbulence-Radiation Interaction (TRI). In a review on the
subject [2], it was concluded that it is important to include TRI in the modeling of heat
transfer in turbulent reacting flows for accurate heat transfer predictions.
Therefore, it is important for the understanding of radiatiative heat transfer to be able to
measure temperature fluctuations in furnace flames.
There are several ways to measure the flame temperature, ranging from simple techniques
based on a thermocouple to advanced laser techniques. When bare thermocouples are used,
the radiation loss from the thermocouple to a colder surrounding is a problem. To overcome
the problem, a suction pyrometer can be used. In this technique flue gases are sucked with a
high velocity over a shielded thermocouple, thus increasing the convective heat transfer and
suppressing the radiative heat loss. A problem with the suction pyrometer is that the flame is
disturbed by the removal of gas and by the cold probe itself. The technique has also a poor
time resolution due to thermal inertia. Therefore, optical measurement techniques are
appealing since they allow non-intrusive measurements with high temporal resolution. The
optical techniques can be divided into line-of-sight techniques and point measurement
techniques. Examples of line-of-sight techniques used in combustion diagnostics are
pyrometers or spectroscopic techniques. Point measurement techniques in combustion are
often advanced laser based techniques. The laser technique most frequently used for
temperature measurements in large scale combustion applications is Coherent Anti-Stokes
Raman Spectroscopy (CARS). In this work an optical technique based on FTIR-spectroscopy
[3] is applied as it is relatively simple compared to laser techniques, at the same time it gives
more information on the flame characteristic than a pyrometer since the entire spectrum
instead of single wavenumbers is analyzed.
Measurements of radiation intensity and gas temperature have been carried out in the
Chalmers 100 kW oxy-fuel test rig since 2003 [4-7]. The gas temperature has so far been
measured with a suction pyrometer and no information on temperature fluctuations in the
flames is therefore available. The aim with the experiments carried out in this work was to
also obtain information of temperature fluctuations in the Chalmers oxy-fuel test rig. This was
done by measuring the gas temperature with the optical FTIR technique [7]. The optical
measurements are compared with suction pyrometer measurements and their performance is
evaluated for the flames investigated. The influence of the measured fluctuations on the
radiative heat transfer is examined by modeling of gas radiation, and the modeled gas
radiation is compared with measurements of the total radiation intensity.
METHODOLOGY
Experiments
The measurements were carried out in the Chalmers 100 kW oxy-fuel test rig, a down-fired
and refractory lined furnace presented in more detail by Andersson et. al. [5]. The cylindrical
furnace has an inner height of 2.4 m and an inner diameter of 0.8 m. The burner is a swirl
burner with two air registers and a central fuel lance for either propane or coal. In the
experiments of this work propane was used as a fuel in order to establish well-defined
combustion conditions and dry recycling was applied in the oxy-fuel flames. The test rig
allows in-furnace measurements in seven measurements ports distributed along the height of
the reactor. Measurements were done by traversing water cooled probes radially through the
furnace.
Three different flames were investigated: one air fired and two oxy-fuel flames with 25
respectively 30 vol-% O2 in the oxidizer. The oxy-fuel flames are referred to as OF25 and
OF30. The stoichiometric ratio was kept constant at 1.15 in all experiments, and the
concentration of O2 in the oxidizer was controlled by changing the recycling rate of the flue
gas. Table 1 lists the test conditions. The wall temperature in the furnace was monitored by a
number of thermocouples mounted inside the wall. During the experiments, temperature, gas
concentrations and radiation intensity were measured in one measurement port in the high
temperature flame zone (384 mm from the burner).
Table 1. Test conditions in the three investigated flames.
Test case O2 in oxidizer
[vol-%]
Stoichiometric
ratio
O2 in stack
[vol-%]
Fuel input
[kW]
Air 21 1.15 3.0 80
OF25 25 1.15 3.5 80
OF30 30 1.15 4.3 80
The gas temperature was measured with a water cooled suction pyrometer and with the
optical technique based on FTIR. The suction pyrometer is equipped with a B-type
thermocouple allowing temperature measurements up to 1700°C.
The system used in the optical measurement have previously been described by Bak and
Clausen [8]. In principle, the technique measure emitted radiation from a gas column between
a cooled background and the probe tip, at a distance g in Fig. 1. The optical measurement
system gives an estimation of temperature fluctuations since the time resolution is in the order
of 10-4
s. The time resolution is limited by the scanning velocity of the spectrometer and the
width of the spectral region used for estimation of the temperature. The time to scan the entire
spectrum was approximately 1 s in these measurements, giving a measurement frequency of 1
Hz. To be able to carry out in-situ measurements of temperature, the setup is integrated in a
water cooled probe (Fig. 1). The optics is protected by an uncooled ceramic tube, and by a
small purge gas flow of argon.
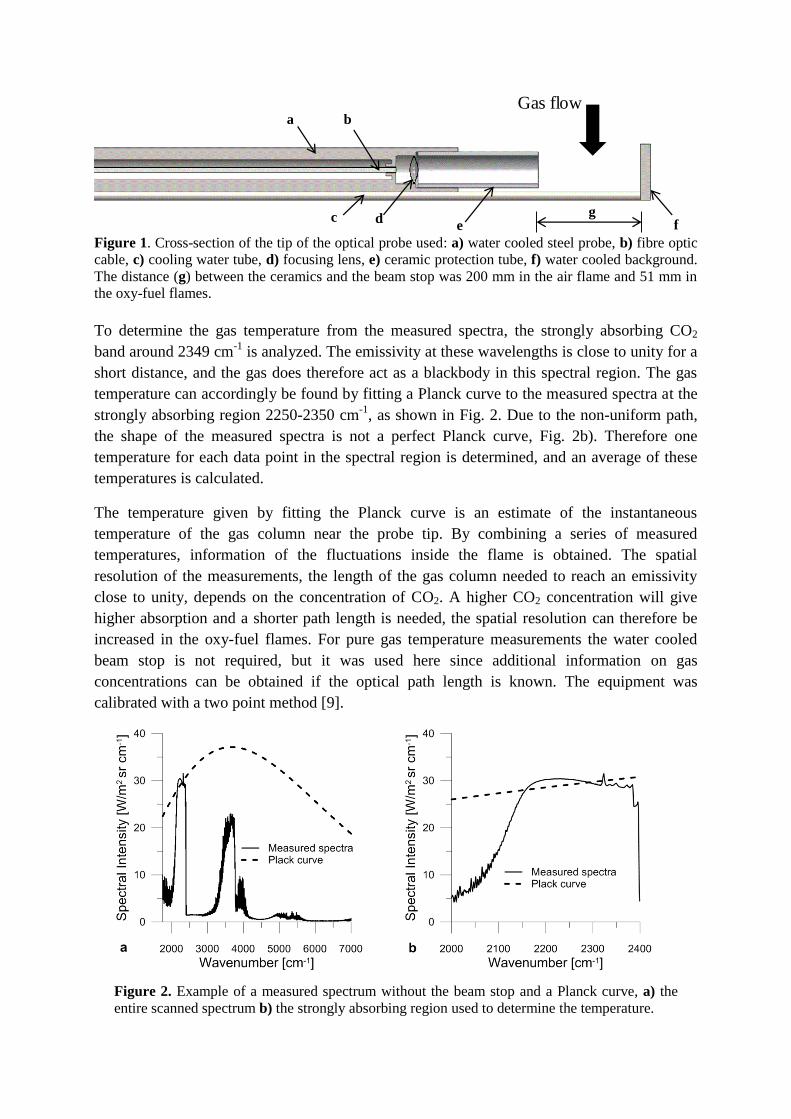
Figure 1. Cross-section of the tip of the optical probe used: a) water cooled steel probe, b) fibre optic
cable, c) cooling water tube, d) focusing lens, e) ceramic protection tube, f) water cooled background.
The distance (g) between the ceramics and the beam stop was 200 mm in the air flame and 51 mm in
the oxy-fuel flames.
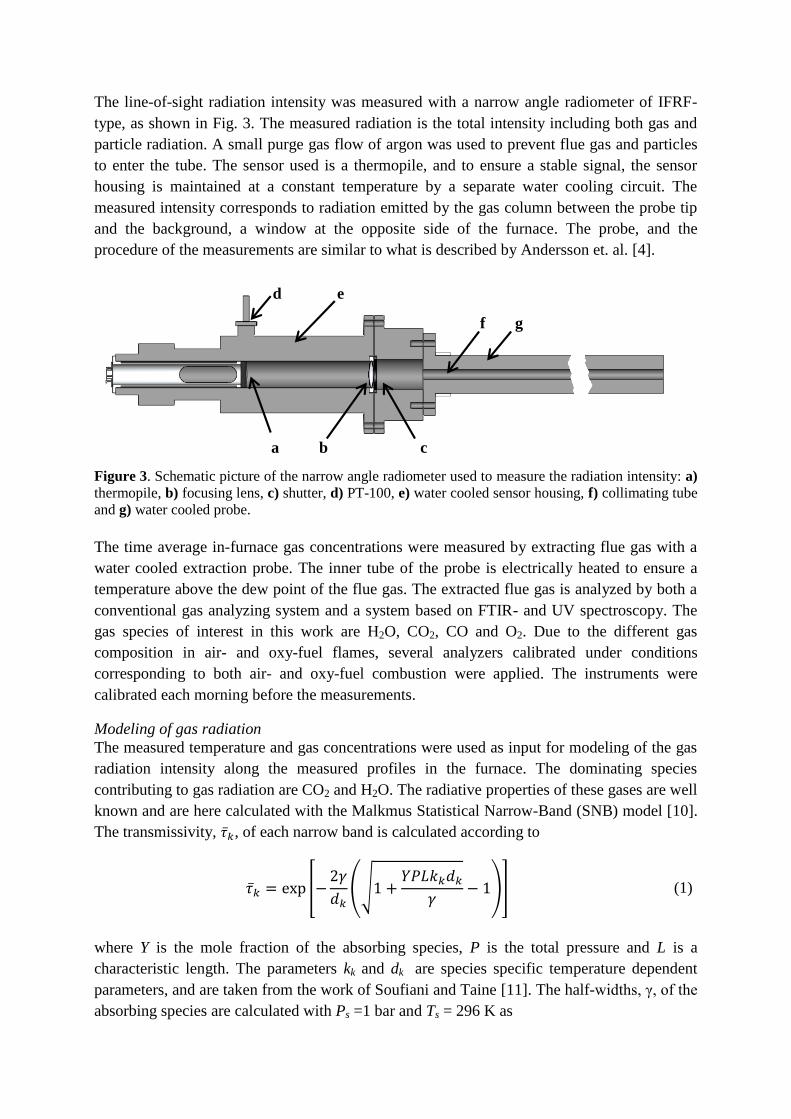
To determine the gas temperature from the measured spectra, the strongly absorbing CO2
band around 2349 cm-1
is analyzed. The emissivity at these wavelengths is close to unity for a
short distance, and the gas does therefore act as a blackbody in this spectral region. The gas
temperature can accordingly be found by fitting a Planck curve to the measured spectra at the
strongly absorbing region 2250-2350 cm-1
, as shown in Fig. 2. Due to the non-uniform path,
the shape of the measured spectra is not a perfect Planck curve, Fig. 2b). Therefore one
temperature for each data point in the spectral region is determined, and an average of these
temperatures is calculated.
The temperature given by fitting the Planck curve is an estimate of the instantaneous
temperature of the gas column near the probe tip. By combining a series of measured
temperatures, information of the fluctuations inside the flame is obtained. The spatial
resolution of the measurements, the length of the gas column needed to reach an emissivity
close to unity, depends on the concentration of CO2. A higher CO2 concentration will give
higher absorption and a shorter path length is needed, the spatial resolution can therefore be
increased in the oxy-fuel flames. For pure gas temperature measurements the water cooled
beam stop is not required, but it was used here since additional information on gas
concentrations can be obtained if the optical path length is known. The equipment was
calibrated with a two point method [9].
Figure 2. Example of a measured spectrum without the beam stop and a Planck curve, a) the
entire scanned spectrum b) the strongly absorbing region used to determine the temperature.
Gas flowa b
c de f
g
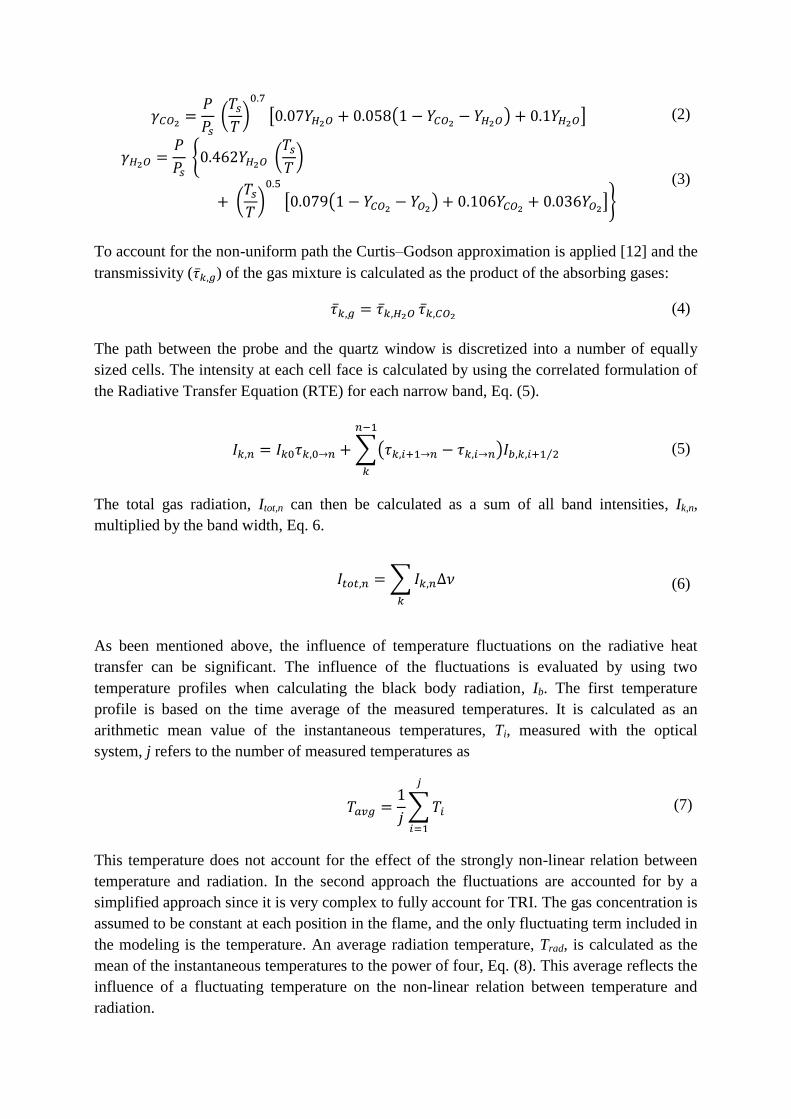
The line-of-sight radiation intensity was measured with a narrow angle radiometer of IFRF-
type, as shown in Fig. 3. The measured radiation is the total intensity including both gas and
particle radiation. A small purge gas flow of argon was used to prevent flue gas and particles
to enter the tube. The sensor used is a thermopile, and to ensure a stable signal, the sensor
housing is maintained at a constant temperature by a separate water cooling circuit. The
measured intensity corresponds to radiation emitted by the gas column between the probe tip
and the background, a window at the opposite side of the furnace. The probe, and the
procedure of the measurements are similar to what is described by Andersson et. al. [4].
Figure 3. Schematic picture of the narrow angle radiometer used to measure the radiation intensity: a)
thermopile, b) focusing lens, c) shutter, d) PT-100, e) water cooled sensor housing, f) collimating tube
and g) water cooled probe.
The time average in-furnace gas concentrations were measured by extracting flue gas with a
water cooled extraction probe. The inner tube of the probe is electrically heated to ensure a
temperature above the dew point of the flue gas. The extracted flue gas is analyzed by both a
conventional gas analyzing system and a system based on FTIR- and UV spectroscopy. The
gas species of interest in this work are H2O, CO2, CO and O2. Due to the different gas
composition in air- and oxy-fuel flames, several analyzers calibrated under conditions
corresponding to both air- and oxy-fuel combustion were applied. The instruments were
calibrated each morning before the measurements.
Modeling of gas radiation
The measured temperature and gas concentrations were used as input for modeling of the gas
radiation intensity along the measured profiles in the furnace. The dominating species
contributing to gas radiation are CO2 and H2O. The radiative properties of these gases are well
known and are here calculated with the Malkmus Statistical Narrow-Band (SNB) model [10].
The transmissivity, , of each narrow band is calculated according to
*
(√
)+ (1)
where Y is the mole fraction of the absorbing species, P is the total pressure and L is a
characteristic length. The parameters kk and dk are species specific temperature dependent
parameters, and are taken from the work of Soufiani and Taine [11]. The half-widths, γ, of the
absorbing species are calculated with Ps =1 bar and Ts = 296 K as
a b c
d
f g
e
( )
[ ( ) ] (2)
{ (
)
( )
[ ( ) ]}
(3)
To account for the non-uniform path the Curtis–Godson approximation is applied [12] and the
transmissivity ( ) of the gas mixture is calculated as the product of the absorbing gases:
(4)
The path between the probe and the quartz window is discretized into a number of equally
sized cells. The intensity at each cell face is calculated by using the correlated formulation of
the Radiative Transfer Equation (RTE) for each narrow band, Eq. (5).
The total gas radiation, Itot,n can then be calculated as a sum of all band intensities, Ik,n,
multiplied by the band width, Eq. 6.
∑
(6)
As been mentioned above, the influence of temperature fluctuations on the radiative heat
transfer can be significant. The influence of the fluctuations is evaluated by using two
temperature profiles when calculating the black body radiation, Ib. The first temperature
profile is based on the time average of the measured temperatures. It is calculated as an
arithmetic mean value of the instantaneous temperatures, Ti, measured with the optical
system, j refers to the number of measured temperatures as
∑
(7)
This temperature does not account for the effect of the strongly non-linear relation between
temperature and radiation. In the second approach the fluctuations are accounted for by a
simplified approach since it is very complex to fully account for TRI. The gas concentration is
assumed to be constant at each position in the flame, and the only fluctuating term included in
the modeling is the temperature. An average radiation temperature, Trad, is calculated as the
mean of the instantaneous temperatures to the power of four, Eq. (8). This average reflects the
influence of a fluctuating temperature on the non-linear relation between temperature and
radiation.
∑( ) ⁄
(5)
√
∑
(8)
Eq. (8) is a simple way of accounting for TRI in modeling of radiative heat transfer, as it only
accounts for temperature fluctuations and the temperature fluctuations in each position in the
flame are assumed to be independent.
RESULTS AND DISCUSSION
Figure 4 gives the measured temperature profiles in the flames investigated. The temperature
measurements were not performed on the same day with the optical system and the suction
pyrometer, but the wall temperatures and combustion conditions were the same in each case
i.e. similar flame temperatures are expected. The peak temperature in the air- and the OF30
flame is above 1500°C, while the peak temperature in the OF25 flame is lower, around
1400°C. The temperature difference between the two oxy-fuel flames is due to a higher
recycle rate in the OF25 flame, i.e. more cold CO2 is added to the flame. The increased
emission and absorption from CO2 and H2O is a likely reason for the slight broadening of the
temperature profile in the oxy fuel flames. Cold CO2 is absorbing radiation emitted by the
flame, thus increasing the gas temperature close to the walls.
In general, the agreement is good between the two measurement techniques. Yet, the optical
measurement gives a slightly higher temperature in the center of the flame and a lower
temperature in the low temperature regions. The region outside the flame where the
temperature and temperature gradients are relatively low, the suction pyrometer should give a
good estimation of the average temperature. The difference of up to 200°C between the
optical technique and the suction pyrometer may be explained by cooling and dilution by the
purge gas (argon) that is added to protect the optics. In this region the velocity is low and it is
therefore likely that the flue gas flow is not able to entirely remove the argon, thus decreasing
the concentration of CO2 as well as cooling the CO2 which makes the calculated temperature
from the spectra too low. To avoid this effect, the flow of purge gas should be kept at a
minimum, especially in low-velocity regions. The problem of self-absorption from cold CO2
is further discussed in the work by Clausen [3].
The spatial resolution of the optical measurements in the air fired flame is lower than in the
oxy-fuel flames due to a lower CO2 concentration. The distance between the beam stop and
optics can therefore be decreased in the oxy-fuel flames. The influence from the purge gas,
discussed above, seems to increase when the measurements are performed on a shorter gas
column and the distance between the beam stop and the optics is decreased. This can be seen
by looking at the temperature difference between the suction pyrometer and the optical system
close to the walls in the air flame compared to the oxy-fuel flames.
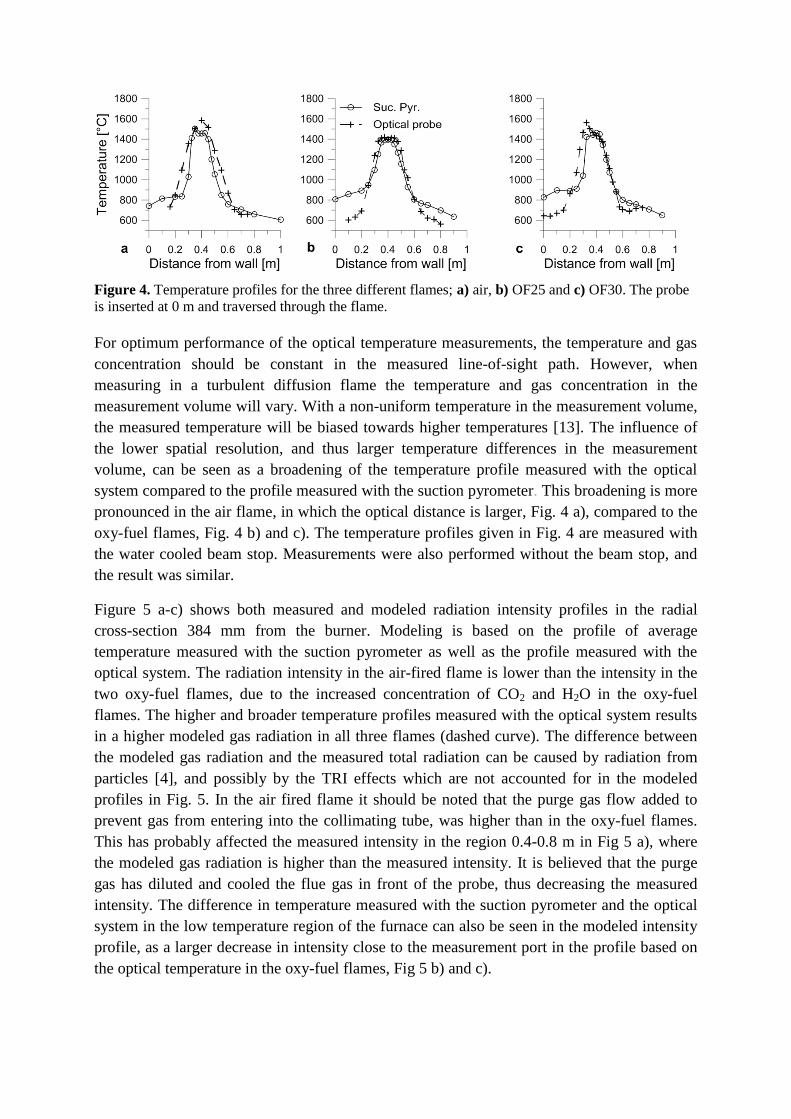
Figure 4. Temperature profiles for the three different flames; a) air, b) OF25 and c) OF30. The probe
is inserted at 0 m and traversed through the flame.
For optimum performance of the optical temperature measurements, the temperature and gas
concentration should be constant in the measured line-of-sight path. However, when
measuring in a turbulent diffusion flame the temperature and gas concentration in the
measurement volume will vary. With a non-uniform temperature in the measurement volume,
the measured temperature will be biased towards higher temperatures [13]. The influence of
the lower spatial resolution, and thus larger temperature differences in the measurement
volume, can be seen as a broadening of the temperature profile measured with the optical
system compared to the profile measured with the suction pyrometer. This broadening is more
pronounced in the air flame, in which the optical distance is larger, Fig. 4 a), compared to the
oxy-fuel flames, Fig. 4 b) and c). The temperature profiles given in Fig. 4 are measured with
the water cooled beam stop. Measurements were also performed without the beam stop, and
the result was similar.
Figure 5 a-c) shows both measured and modeled radiation intensity profiles in the radial
cross-section 384 mm from the burner. Modeling is based on the profile of average
temperature measured with the suction pyrometer as well as the profile measured with the
optical system. The radiation intensity in the air-fired flame is lower than the intensity in the
two oxy-fuel flames, due to the increased concentration of CO2 and H2O in the oxy-fuel
flames. The higher and broader temperature profiles measured with the optical system results
in a higher modeled gas radiation in all three flames (dashed curve). The difference between
the modeled gas radiation and the measured total radiation can be caused by radiation from
particles [4], and possibly by the TRI effects which are not accounted for in the modeled
profiles in Fig. 5. In the air fired flame it should be noted that the purge gas flow added to
prevent gas from entering into the collimating tube, was higher than in the oxy-fuel flames.
This has probably affected the measured intensity in the region 0.4-0.8 m in Fig 5 a), where
the modeled gas radiation is higher than the measured intensity. It is believed that the purge
gas has diluted and cooled the flue gas in front of the probe, thus decreasing the measured
intensity. The difference in temperature measured with the suction pyrometer and the optical
system in the low temperature region of the furnace can also be seen in the modeled intensity
profile, as a larger decrease in intensity close to the measurement port in the profile based on
the optical temperature in the oxy-fuel flames, Fig 5 b) and c).
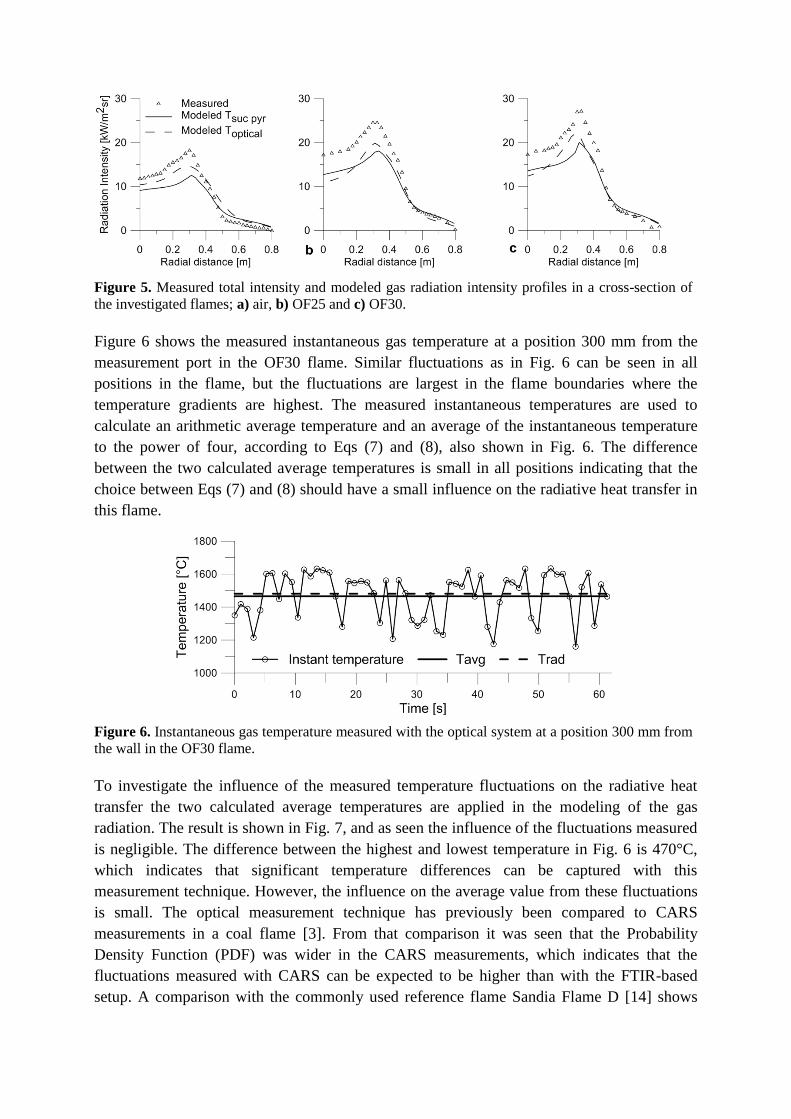
Figure 5. Measured total intensity and modeled gas radiation intensity profiles in a cross-section of
the investigated flames; a) air, b) OF25 and c) OF30.
Figure 6 shows the measured instantaneous gas temperature at a position 300 mm from the
measurement port in the OF30 flame. Similar fluctuations as in Fig. 6 can be seen in all
positions in the flame, but the fluctuations are largest in the flame boundaries where the
temperature gradients are highest. The measured instantaneous temperatures are used to
calculate an arithmetic average temperature and an average of the instantaneous temperature
to the power of four, according to Eqs (7) and (8), also shown in Fig. 6. The difference
between the two calculated average temperatures is small in all positions indicating that the
choice between Eqs (7) and (8) should have a small influence on the radiative heat transfer in
this flame.
Figure 6. Instantaneous gas temperature measured with the optical system at a position 300 mm from
the wall in the OF30 flame.
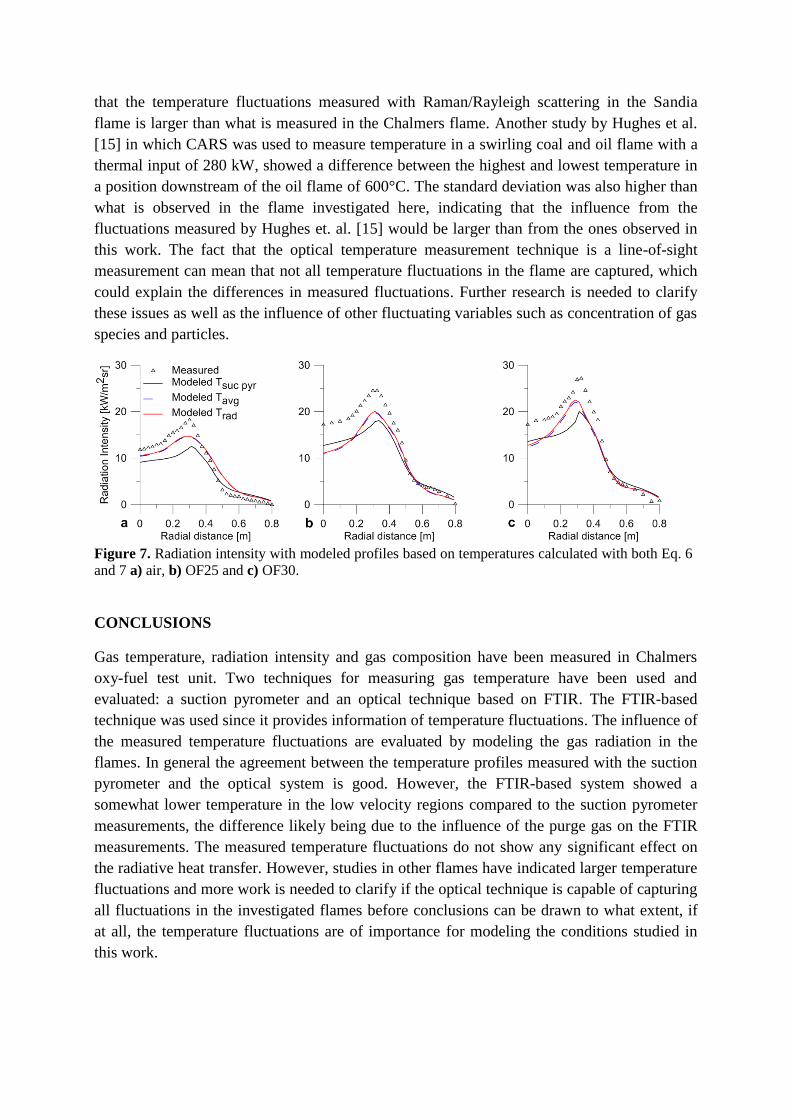
To investigate the influence of the measured temperature fluctuations on the radiative heat
transfer the two calculated average temperatures are applied in the modeling of the gas
radiation. The result is shown in Fig. 7, and as seen the influence of the fluctuations measured
is negligible. The difference between the highest and lowest temperature in Fig. 6 is 470°C,
which indicates that significant temperature differences can be captured with this
measurement technique. However, the influence on the average value from these fluctuations
is small. The optical measurement technique has previously been compared to CARS
measurements in a coal flame [3]. From that comparison it was seen that the Probability
Density Function (PDF) was wider in the CARS measurements, which indicates that the
fluctuations measured with CARS can be expected to be higher than with the FTIR-based
setup. A comparison with the commonly used reference flame Sandia Flame D [14] shows
that the temperature fluctuations measured with Raman/Rayleigh scattering in the Sandia
flame is larger than what is measured in the Chalmers flame. Another study by Hughes et al.
[15] in which CARS was used to measure temperature in a swirling coal and oil flame with a
thermal input of 280 kW, showed a difference between the highest and lowest temperature in
a position downstream of the oil flame of 600°C. The standard deviation was also higher than
what is observed in the flame investigated here, indicating that the influence from the
fluctuations measured by Hughes et. al. [15] would be larger than from the ones observed in
this work. The fact that the optical temperature measurement technique is a line-of-sight
measurement can mean that not all temperature fluctuations in the flame are captured, which
could explain the differences in measured fluctuations. Further research is needed to clarify
these issues as well as the influence of other fluctuating variables such as concentration of gas
species and particles.
Figure 7. Radiation intensity with modeled profiles based on temperatures calculated with both Eq. 6
and 7 a) air, b) OF25 and c) OF30.
CONCLUSIONS
Gas temperature, radiation intensity and gas composition have been measured in Chalmers
oxy-fuel test unit. Two techniques for measuring gas temperature have been used and
evaluated: a suction pyrometer and an optical technique based on FTIR. The FTIR-based
technique was used since it provides information of temperature fluctuations. The influence of
the measured temperature fluctuations are evaluated by modeling the gas radiation in the
flames. In general the agreement between the temperature profiles measured with the suction
pyrometer and the optical system is good. However, the FTIR-based system showed a
somewhat lower temperature in the low velocity regions compared to the suction pyrometer
measurements, the difference likely being due to the influence of the purge gas on the FTIR
measurements. The measured temperature fluctuations do not show any significant effect on
the radiative heat transfer. However, studies in other flames have indicated larger temperature
fluctuations and more work is needed to clarify if the optical technique is capable of capturing
all fluctuations in the investigated flames before conclusions can be drawn to what extent, if
at all, the temperature fluctuations are of importance for modeling the conditions studied in
this work.
ACKNOWLEDGEMENTS
The Swedish Energy Agency is acknowledged for financial support.
REFERENCES
1. Toftegaard, M.B., et al., Oxy-fuel combustion of solid fuels. Progress in Energy and
Combustion Science, 2010. 36(5): p. 581-625.
2. P.J, C., Numerical simulation of the interaction between turbulence and radiation in
reactive flows. Progress in Energy and Combustion Science, 2007. 33(4): p. 311-383.
3. Clausen, S., Local measurement of gas temperature with an infrared fibre-optic probe.
Measurement Science and Technology, 1996. 7(6): p. 888-896.
4. Andersson, K., et al., Radiation intensity of lignite-fired oxy-fuel flames. Experimental
Thermal and Fluid Science, 2008. 33(1): p. 67-76.
5. Andersson, K., et al., Radiation Intensity of Propane-Fired Oxy-Fuel Flames:
Implications for Soot Formation. Energy & Fuels, 2008. 22(3): p. 1535-1541.
6. Andersson, K. and F. Johnsson, Flame and radiation characteristics of gas-fired
O2/CO2 combustion. Fuel, 2007. 86(5–6): p. 656-668.
7. Hjärtstam, S., et al., Combustion characteristics of lignite-fired oxy-fuel flames. Fuel,
2009. 88(11): p. 2216-2224.
8. Bak, J. and S. Clausen, FTIR emission spectroscopy methods and procedures for real
time quantitative gas analysis in industrial environments. Measurement Science and
Technology, 2002. 13(2): p. 150-156.
9. Clausen, S., A. Morgenstjerne, and O. Rathmann, Measurement of surface
temperature and emissivity by a multitemperature method for Fourier-transform
infrared spectrometers. Appl. Opt., 1996. 35(28): p. 5683-5691.
10. Malkmus, W., Random Lorentz Band Model with Exponential-Tailed S-1 Line-
Intensity Distribution Function. J. Opt. Soc. Am., 1967. 57(3): p. 323-329.
11. Soufiani, A. and J. Taine, High temperature gas radiative property parameters of
statistical narrow-band model for H2O, CO2 and CO, and correlated-K model for
H2O and CO2. International Journal of Heat and Mass Transfer, 1997. 40(4): p. 987-
991.
12. Stephen J, Y., Nonisothermal band model theory. Journal of Quantitative
Spectroscopy and Radiative Transfer, 1977. 18(1): p. 1-28.
13. Murphy, J.J. and C.R. Shaddix, Influence of scattering and probe-volume
heterogeneity on soot measurements using optical pyrometry. Combustion and Flame,
2005. 143(1–2): p. 1-10.
14. Barlow, R.S. TNF Workshop web site 2006; Available from:
http://www.ca.sandia.gov/TNF.
15. Hughes, P.M.J., R.J. Lacelle, and T. Parameswaran, Comparison of suction pyrometer
and CARS derived temperatures in an industrial scale flame. Combustion science and
technology, 1995. 105(1-3): p. 131-145.