Embed Size (px)
Citation preview
Gas Winter Outlook 2020/21
October 2020
Contents
1. Welcome 1
2. Executive summary 2
3. Supply Margin 4
4. Demand 6
Demand 7
COVID-19 Spotlight 9
5. Supply 10
Supply 11
Liquified natural gas 12
Connections to Europe 13
Storage 14
6. Operational Toolbox 15
7. Appendix 18
8. Glossary 22
Continuing the conversation 26

Welcome
1
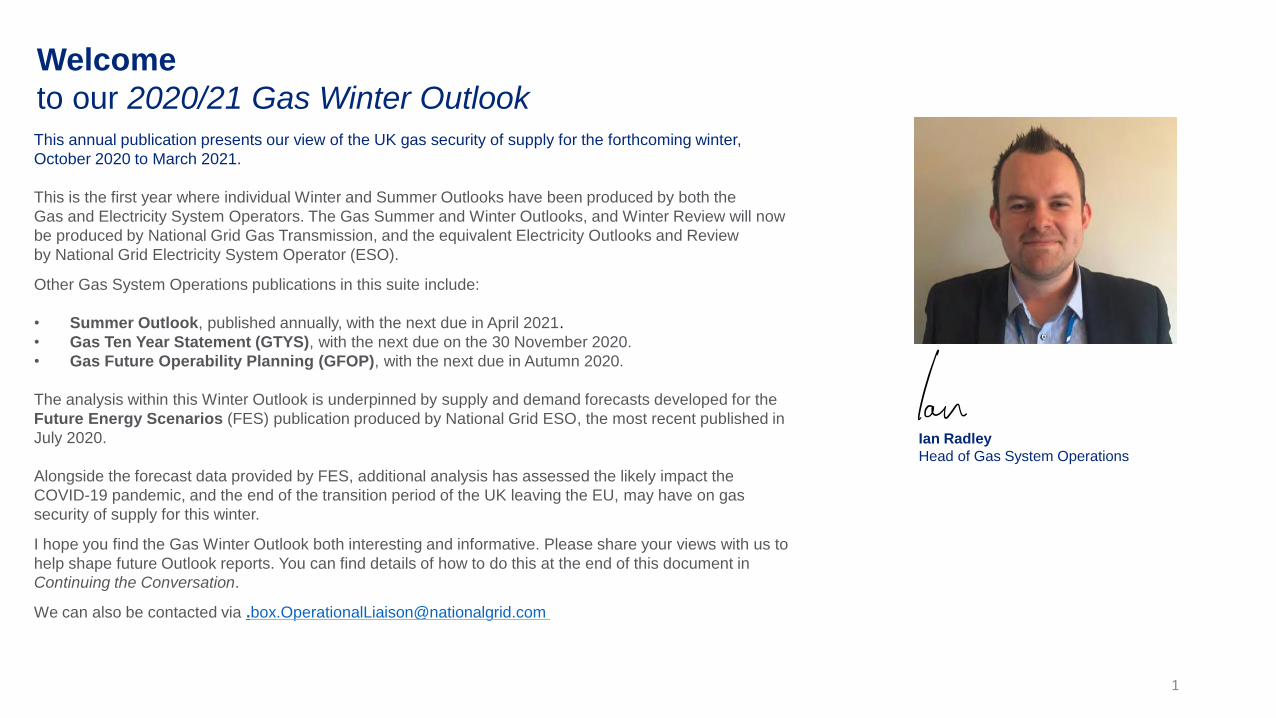
Welcome
to our 2020/21 Gas Winter Outlook
Ian Radley
Head of Gas System Operations
1
This annual publication presents our view of the UK gas security of supply for the forthcoming winter,
October 2020 to March 2021.
This is the first year where individual Winter and Summer Outlooks have been produced by both the
Gas and Electricity System Operators. The Gas Summer and Winter Outlooks, and Winter Review will now
be produced by National Grid Gas Transmission, and the equivalent Electricity Outlooks and Review
by National Grid Electricity System Operator (ESO).
Other Gas System Operations publications in this suite include:
• Summer Outlook, published annually, with the next due in April 2021.
• Gas Ten Year Statement (GTYS), with the next due on the 30 November 2020.
• Gas Future Operability Planning (GFOP), with the next due in Autumn 2020.
The analysis within this Winter Outlook is underpinned by supply and demand forecasts developed for the
Future Energy Scenarios (FES) publication produced by National Grid ESO, the most recent published in
July 2020.
Alongside the forecast data provided by FES, additional analysis has assessed the likely impact the
COVID-19 pandemic, and the end of the transition period of the UK leaving the EU, may have on gas
security of supply for this winter.
I hope you find the Gas Winter Outlook both interesting and informative. Please share your views with us to
help shape future Outlook reports. You can find details of how to do this at the end of this document in
Continuing the Conversation.
We can also be contacted via [email protected]
Executive summaryKey messages
2
2
Executive summaryKey Messages
3
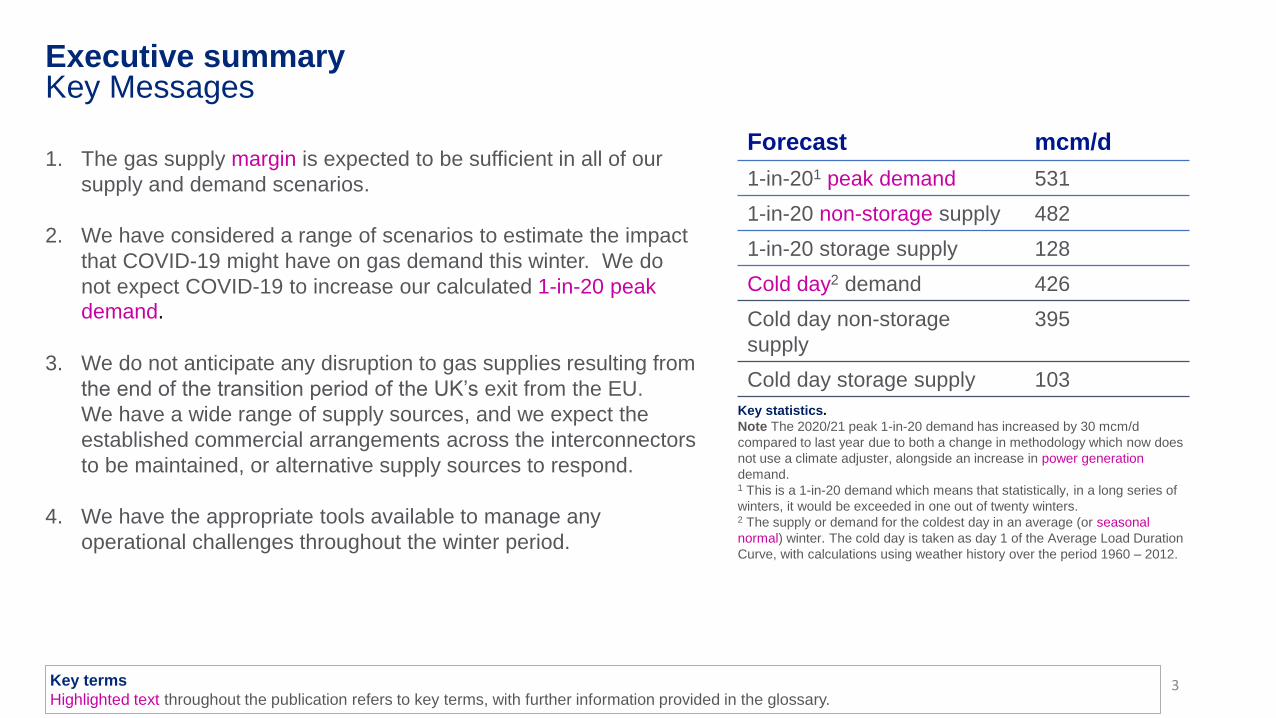
1. The gas supply margin is expected to be sufficient in all of our
supply and demand scenarios.
2. We have considered a range of scenarios to estimate the impact
that COVID-19 might have on gas demand this winter. We do
not expect COVID-19 to increase our calculated 1-in-20 peak
demand.
3. We do not anticipate any disruption to gas supplies resulting from
the end of the transition period of the UK’s exit from the EU.
We have a wide range of supply sources, and we expect the
established commercial arrangements across the interconnectors
to be maintained, or alternative supply sources to respond.
4. We have the appropriate tools available to manage any
operational challenges throughout the winter period.
Key terms
Highlighted text throughout the publication refers to key terms, with further information provided in the glossary.
Key statistics.
Note The 2020/21 peak 1-in-20 demand has increased by 30 mcm/d
compared to last year due to both a change in methodology which now does
not use a climate adjuster, alongside an increase in power generation
demand. 1 This is a 1-in-20 demand which means that statistically, in a long series of
winters, it would be exceeded in one out of twenty winters.2 The supply or demand for the coldest day in an average (or seasonal
normal) winter. The cold day is taken as day 1 of the Average Load Duration
Curve, with calculations using weather history over the period 1960 – 2012.
Forecast mcm/d
1-in-201 peak demand 531
1-in-20 non-storage supply 482
1-in-20 storage supply 128
Cold day2 demand 426
Cold day non-storage
supply
395
Cold day storage supply 103

Supply Margin
3
4
Supply margin
5
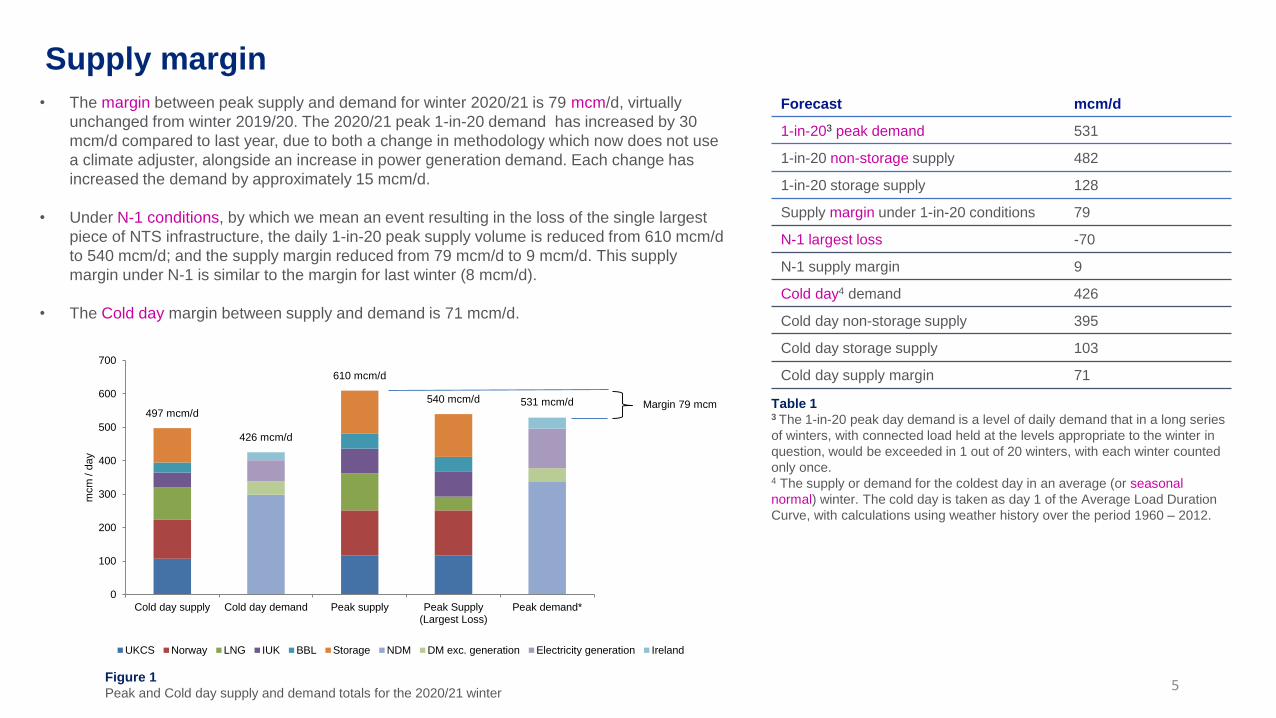
• The margin between peak supply and demand for winter 2020/21 is 79 mcm/d, virtually
unchanged from winter 2019/20. The 2020/21 peak 1-in-20 demand has increased by 30
mcm/d compared to last year, due to both a change in methodology which now does not use
a climate adjuster, alongside an increase in power generation demand. Each change has
increased the demand by approximately 15 mcm/d.
• Under N-1 conditions, by which we mean an event resulting in the loss of the single largest
piece of NTS infrastructure, the daily 1-in-20 peak supply volume is reduced from 610 mcm/d
to 540 mcm/d; and the supply margin reduced from 79 mcm/d to 9 mcm/d. This supply
margin under N-1 is similar to the margin for last winter (8 mcm/d).
• The Cold day margin between supply and demand is 71 mcm/d.
Figure 1
Peak and Cold day supply and demand totals for the 2020/21 winter
Table 13 The 1-in-20 peak day demand is a level of daily demand that in a long series
of winters, with connected load held at the levels appropriate to the winter in
question, would be exceeded in 1 out of 20 winters, with each winter counted
only once. 4 The supply or demand for the coldest day in an average (or seasonal
normal) winter. The cold day is taken as day 1 of the Average Load Duration
Curve, with calculations using weather history over the period 1960 – 2012.
Forecast mcm/d
1-in-203 peak demand 531
1-in-20 non-storage supply 482
1-in-20 storage supply 128
Supply margin under 1-in-20 conditions 79
N-1 largest loss -70
N-1 supply margin 9
Cold day4 demand 426
Cold day non-storage supply 395
Cold day storage supply 103
Cold day supply margin 71
497 mcm/d
426 mcm/d
610 mcm/d
540 mcm/d 531 mcm/d
0
100
200
300
400
500
600
700
Cold day supply Cold day demand Peak supply Peak Supply(Largest Loss)
Peak demand*
mcm
/ d
ay
UKCS Norway LNG IUK BBL Storage NDM DM exc. generation Electricity generation Ireland
Margin 79 mcm

DemandKey messages
COVID-19 spotlight
4
6
Demand
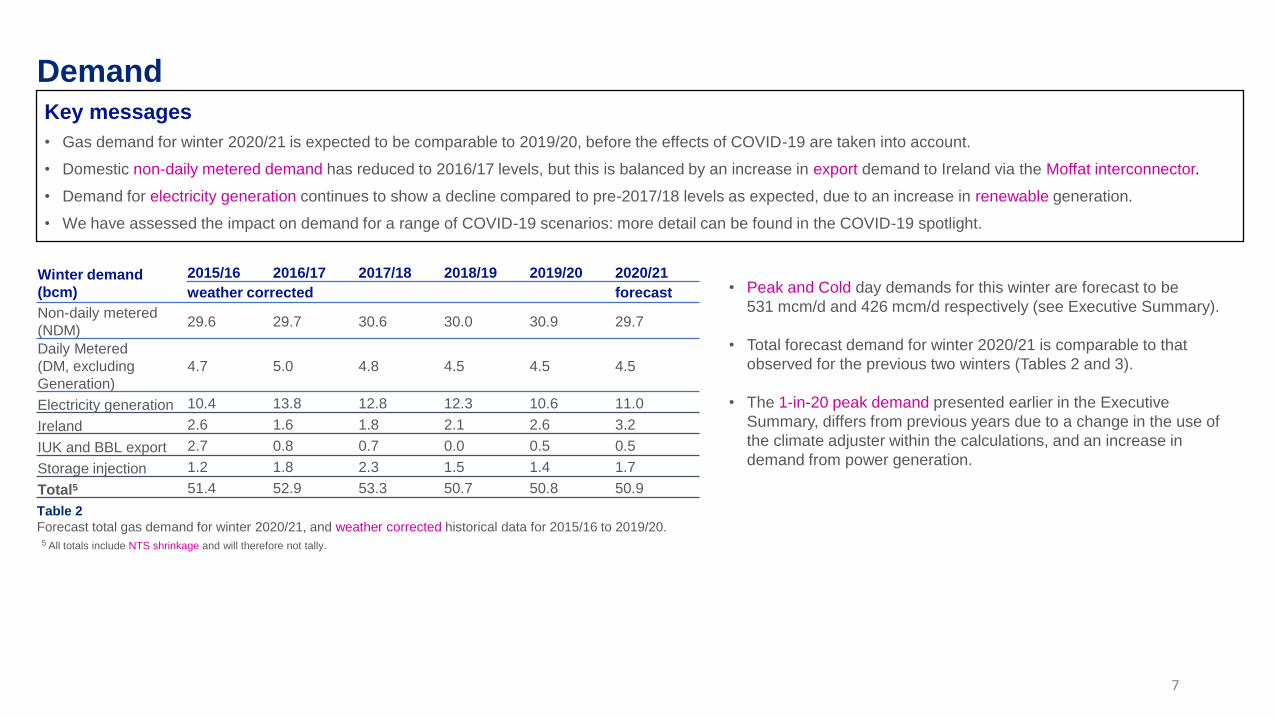
Table 2
Forecast total gas demand for winter 2020/21, and weather corrected historical data for 2015/16 to 2019/20.
7
5 All totals include NTS shrinkage and will therefore not tally.
• Peak and Cold day demands for this winter are forecast to be
531 mcm/d and 426 mcm/d respectively (see Executive Summary).
• Total forecast demand for winter 2020/21 is comparable to that
observed for the previous two winters (Tables 2 and 3).
• The 1-in-20 peak demand presented earlier in the Executive
Summary, differs from previous years due to a change in the use of
the climate adjuster within the calculations, and an increase in
demand from power generation.
Key messages
• Gas demand for winter 2020/21 is expected to be comparable to 2019/20, before the effects of COVID-19 are taken into account.
• Domestic non-daily metered demand has reduced to 2016/17 levels, but this is balanced by an increase in export demand to Ireland via the Moffat interconnector.
• Demand for electricity generation continues to show a decline compared to pre-2017/18 levels as expected, due to an increase in renewable generation.
• We have assessed the impact on demand for a range of COVID-19 scenarios: more detail can be found in the COVID-19 spotlight.
Winter demand
(bcm)
2015/16 2016/17 2017/18 2018/19 2019/20 2020/21
weather corrected forecast
Non-daily metered
(NDM)29.6 29.7 30.6 30.0 30.9 29.7
Daily Metered
(DM, excluding
Generation)
4.7 5.0 4.8 4.5 4.5 4.5
Electricity generation 10.4 13.8 12.8 12.3 10.6 11.0
Ireland 2.6 1.6 1.8 2.1 2.6 3.2
IUK and BBL export 2.7 0.8 0.7 0.0 0.5 0.5
Storage injection 1.2 1.8 2.3 1.5 1.4 1.7
Total5 51.4 52.9 53.3 50.7 50.8 50.9
Demand
8
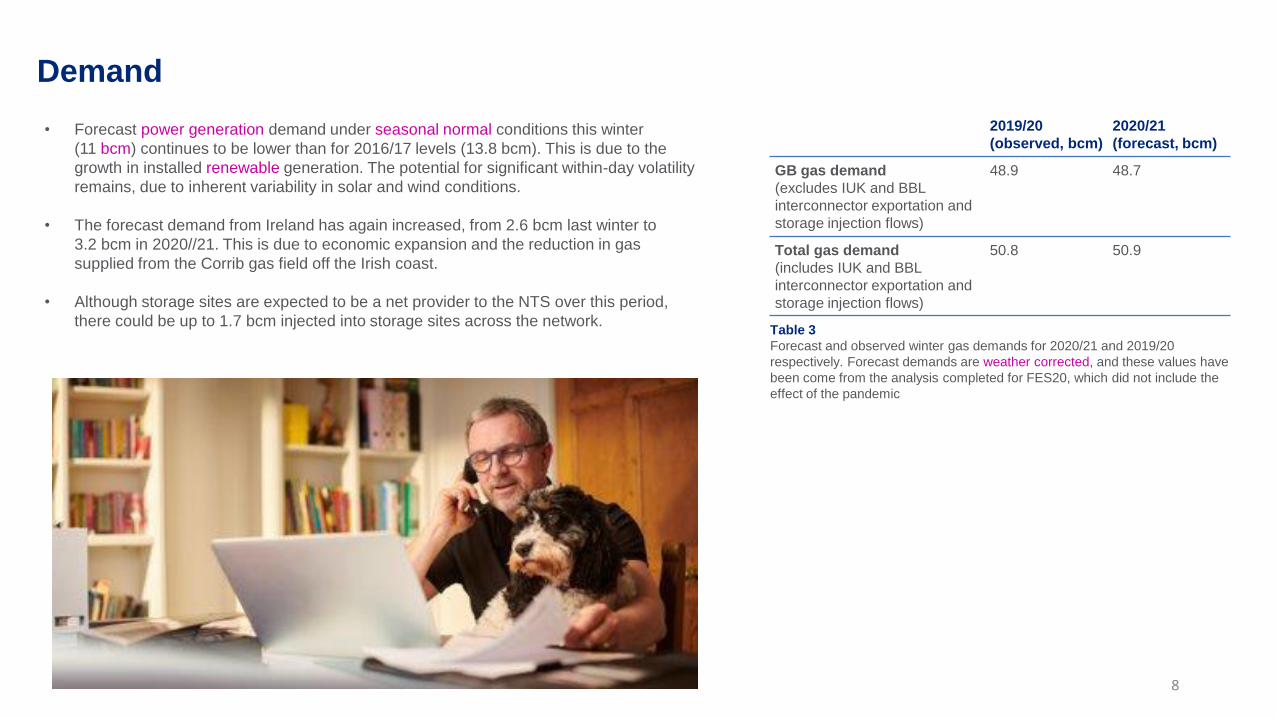
• Forecast power generation demand under seasonal normal conditions this winter
(11 bcm) continues to be lower than for 2016/17 levels (13.8 bcm). This is due to the
growth in installed renewable generation. The potential for significant within-day volatility
remains, due to inherent variability in solar and wind conditions.
• The forecast demand from Ireland has again increased, from 2.6 bcm last winter to
3.2 bcm in 2020//21. This is due to economic expansion and the reduction in gas
supplied from the Corrib gas field off the Irish coast.
• Although storage sites are expected to be a net provider to the NTS over this period,
there could be up to 1.7 bcm injected into storage sites across the network.Table 3
Forecast and observed winter gas demands for 2020/21 and 2019/20
respectively. Forecast demands are weather corrected, and these values have
been come from the analysis completed for FES20, which did not include the
effect of the pandemic
2019/20
(observed, bcm)
2020/21
(forecast, bcm)
GB gas demand
(excludes IUK and BBL
interconnector exportation and
storage injection flows)
48.9 48.7
Total gas demand
(includes IUK and BBL
interconnector exportation and
storage injection flows)
50.8 50.9
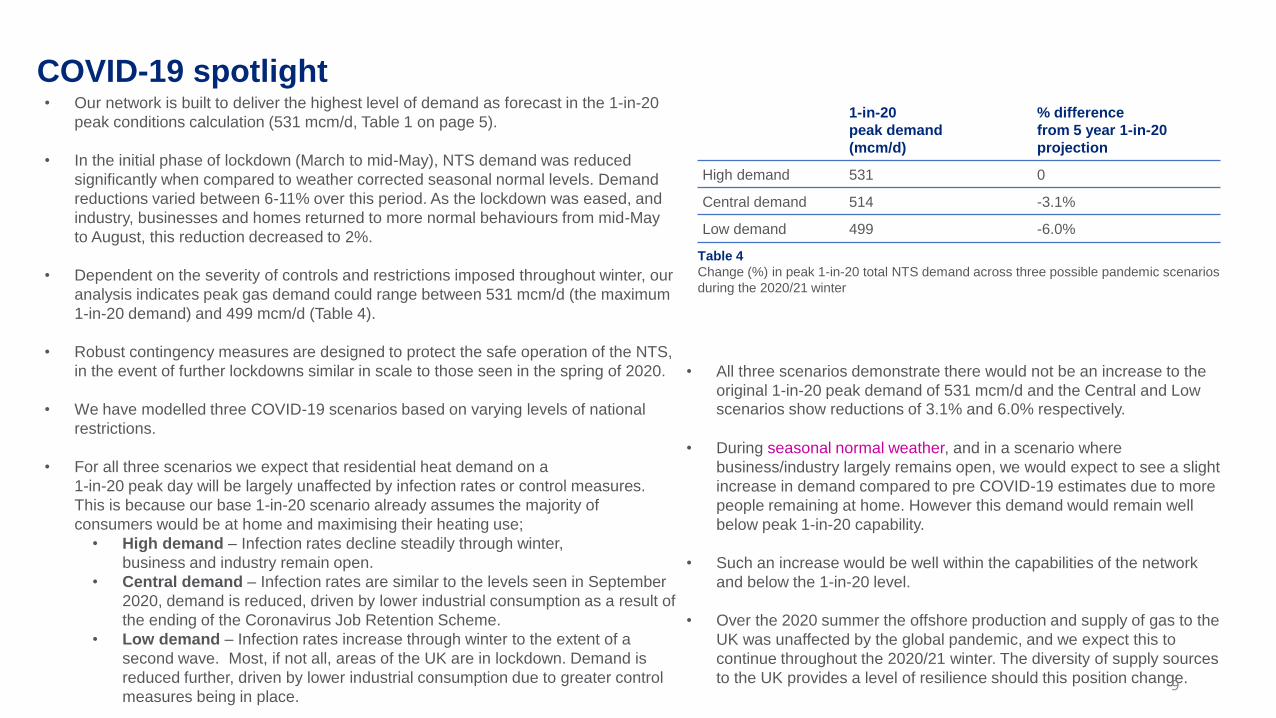
• All three scenarios demonstrate there would not be an increase to the
original 1-in-20 peak demand of 531 mcm/d and the Central and Low scenarios show reductions of 3.1% and 6.0% respectively.
• During seasonal normal weather, and in a scenario where
business/industry largely remains open, we would expect to see a slight
increase in demand compared to pre COVID-19 estimates due to more
people remaining at home. However this demand would remain well
below peak 1-in-20 capability.
• Such an increase would be well within the capabilities of the network
and below the 1-in-20 level.
• Over the 2020 summer the offshore production and supply of gas to the
UK was unaffected by the global pandemic, and we expect this to
continue throughout the 2020/21 winter. The diversity of supply sources
to the UK provides a level of resilience should this position change.
COVID-19 spotlight
9
• Our network is built to deliver the highest level of demand as forecast in the 1-in-20
peak conditions calculation (531 mcm/d, Table 1 on page 5).
• In the initial phase of lockdown (March to mid-May), NTS demand was reduced
significantly when compared to weather corrected seasonal normal levels. Demand
reductions varied between 6-11% over this period. As the lockdown was eased, and
industry, businesses and homes returned to more normal behaviours from mid-May
to August, this reduction decreased to 2%.
• Dependent on the severity of controls and restrictions imposed throughout winter, our
analysis indicates peak gas demand could range between 531 mcm/d (the maximum
1-in-20 demand) and 499 mcm/d (Table 4).
• Robust contingency measures are designed to protect the safe operation of the NTS,
in the event of further lockdowns similar in scale to those seen in the spring of 2020.
• We have modelled three COVID-19 scenarios based on varying levels of national
restrictions.
• For all three scenarios we expect that residential heat demand on a
1-in-20 peak day will be largely unaffected by infection rates or control measures.
This is because our base 1-in-20 scenario already assumes the majority of
consumers would be at home and maximising their heating use;
• High demand – Infection rates decline steadily through winter,
business and industry remain open.
• Central demand – Infection rates are similar to the levels seen in September
2020, demand is reduced, driven by lower industrial consumption as a result of
the ending of the Coronavirus Job Retention Scheme.
• Low demand – Infection rates increase through winter to the extent of a
second wave. Most, if not all, areas of the UK are in lockdown. Demand is
reduced further, driven by lower industrial consumption due to greater control
measures being in place.
Table 4
Change (%) in peak 1-in-20 total NTS demand across three possible pandemic scenarios
during the 2020/21 winter
1-in-20
peak demand
(mcm/d)
% difference
from 5 year 1-in-20
projection
High demand 531 0
Central demand 514 -3.1%
Low demand 499 -6.0%
SupplyKey messages
Liquified natural gas
Connections to Europe
Storage
5
10
Supply
11
Key messages
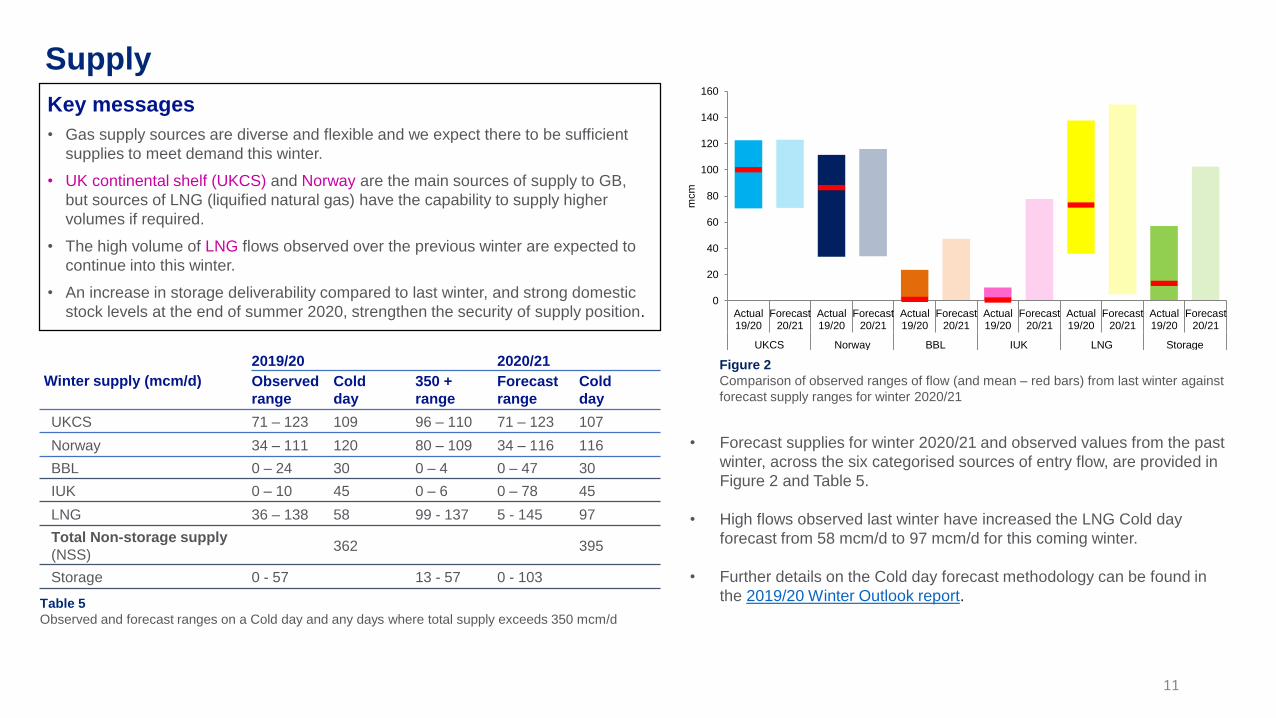
• Gas supply sources are diverse and flexible and we expect there to be sufficient
supplies to meet demand this winter.
• UK continental shelf (UKCS) and Norway are the main sources of supply to GB,
but sources of LNG (liquified natural gas) have the capability to supply higher
volumes if required.
• The high volume of LNG flows observed over the previous winter are expected to
continue into this winter.
• An increase in storage deliverability compared to last winter, and strong domestic
stock levels at the end of summer 2020, strengthen the security of supply position.
• Forecast supplies for winter 2020/21 and observed values from the past
winter, across the six categorised sources of entry flow, are provided in
Figure 2 and Table 5.
• High flows observed last winter have increased the LNG Cold day
forecast from 58 mcm/d to 97 mcm/d for this coming winter.
• Further details on the Cold day forecast methodology can be found in
the 2019/20 Winter Outlook report.Table 5
Observed and forecast ranges on a Cold day and any days where total supply exceeds 350 mcm/d
Figure 2
Comparison of observed ranges of flow (and mean – red bars) from last winter against
forecast supply ranges for winter 2020/21 Winter supply (mcm/d)
2019/20 2020/21
Observed
range
Cold
day
350 +
range
Forecast
range
Cold
day
UKCS 71 – 123 109 96 – 110 71 – 123 107
Norway 34 – 111 120 80 – 109 34 – 116 116
BBL 0 – 24 30 0 – 4 0 – 47 30
IUK 0 – 10 45 0 – 6 0 – 78 45
LNG 36 – 138 58 99 - 137 5 - 145 97
Total Non-storage supply
(NSS)362 395
Storage 0 - 57 13 - 57 0 - 103
0
20
40
60
80
100
120
140
160
Actual19/20
Forecast20/21
Actual19/20
Forecast20/21
Actual19/20
Forecast20/21
Actual19/20
Forecast20/21
Actual19/20
Forecast20/21
Actual19/20
Forecast20/21
UKCS Norway BBL IUK LNG Storage
mcm
Liquified natural gas
12
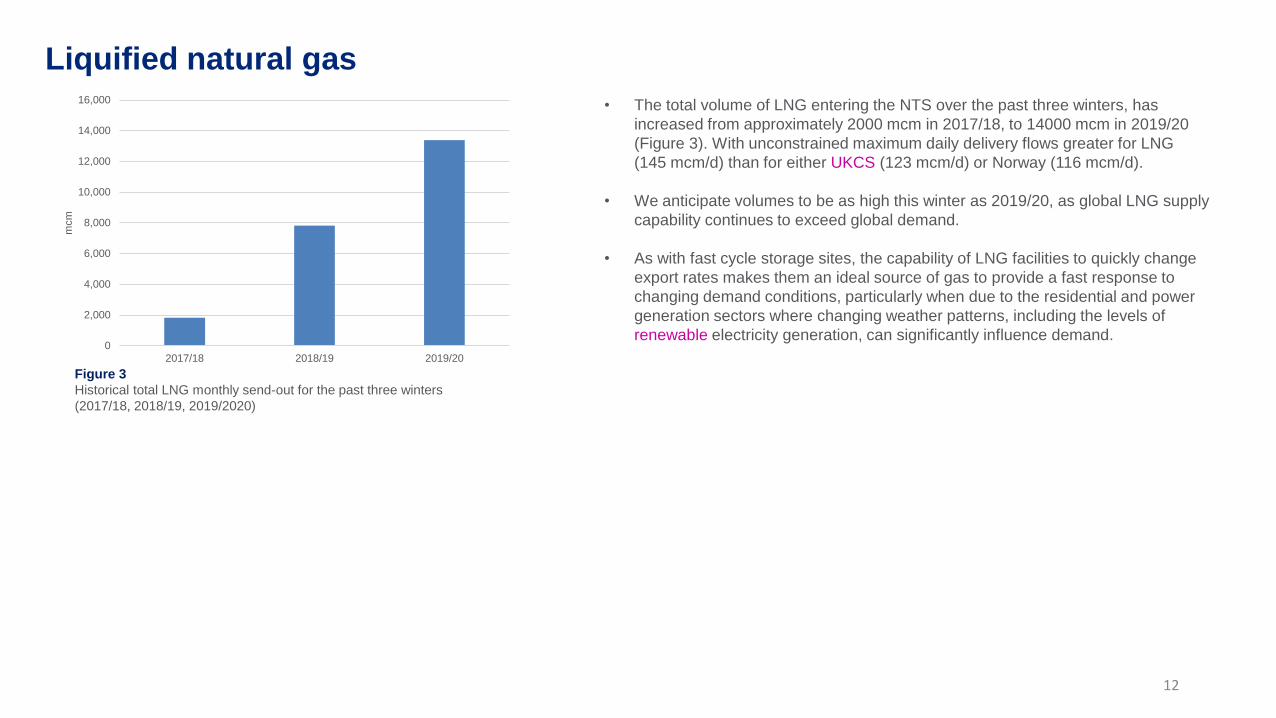
• The total volume of LNG entering the NTS over the past three winters, has
increased from approximately 2000 mcm in 2017/18, to 14000 mcm in 2019/20
(Figure 3). With unconstrained maximum daily delivery flows greater for LNG
(145 mcm/d) than for either UKCS (123 mcm/d) or Norway (116 mcm/d).
• We anticipate volumes to be as high this winter as 2019/20, as global LNG supply
capability continues to exceed global demand.
• As with fast cycle storage sites, the capability of LNG facilities to quickly change
export rates makes them an ideal source of gas to provide a fast response to
changing demand conditions, particularly when due to the residential and power
generation sectors where changing weather patterns, including the levels of
renewable electricity generation, can significantly influence demand.0
2,000
4,000
6,000
8,000
10,000
12,000
14,000
16,000
2017/18 2018/19 2019/20
mcm
Figure 3
Historical total LNG monthly send-out for the past three winters
(2017/18, 2018/19, 2019/2020)
Connections to Europe
13
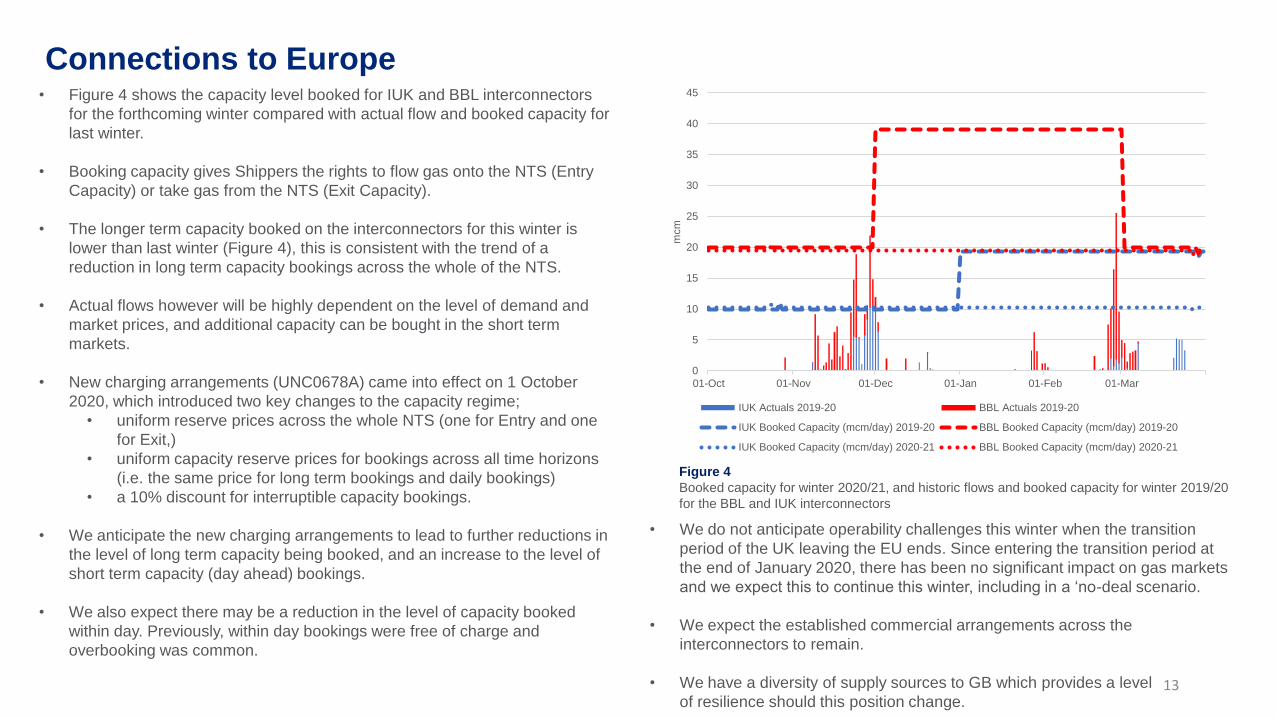
• Figure 4 shows the capacity level booked for IUK and BBL interconnectors
for the forthcoming winter compared with actual flow and booked capacity for
last winter.
• Booking capacity gives Shippers the rights to flow gas onto the NTS (Entry
Capacity) or take gas from the NTS (Exit Capacity).
• The longer term capacity booked on the interconnectors for this winter is
lower than last winter (Figure 4), this is consistent with the trend of a
reduction in long term capacity bookings across the whole of the NTS.
• Actual flows however will be highly dependent on the level of demand and
market prices, and additional capacity can be bought in the short term
markets.
• New charging arrangements (UNC0678A) came into effect on 1 October
2020, which introduced two key changes to the capacity regime;
• uniform reserve prices across the whole NTS (one for Entry and one
for Exit,)
• uniform capacity reserve prices for bookings across all time horizons
(i.e. the same price for long term bookings and daily bookings)
• a 10% discount for interruptible capacity bookings.
• We anticipate the new charging arrangements to lead to further reductions in
the level of long term capacity being booked, and an increase to the level of
short term capacity (day ahead) bookings.
• We also expect there may be a reduction in the level of capacity booked
within day. Previously, within day bookings were free of charge and
overbooking was common.
• We do not anticipate operability challenges this winter when the transition
period of the UK leaving the EU ends. Since entering the transition period at
the end of January 2020, there has been no significant impact on gas markets
and we expect this to continue this winter, including in a ‘no-deal scenario.
• We expect the established commercial arrangements across the
interconnectors to remain.
• We have a diversity of supply sources to GB which provides a level
of resilience should this position change.
Figure 4
Booked capacity for winter 2020/21, and historic flows and booked capacity for winter 2019/20
for the BBL and IUK interconnectors
0
5
10
15
20
25
30
35
40
45
01-Oct 01-Nov 01-Dec 01-Jan 01-Feb 01-Mar
mcm
IUK Actuals 2019-20 BBL Actuals 2019-20
IUK Booked Capacity (mcm/day) 2019-20 BBL Booked Capacity (mcm/day) 2019-20
IUK Booked Capacity (mcm/day) 2020-21 BBL Booked Capacity (mcm/day) 2020-21
Storage
14
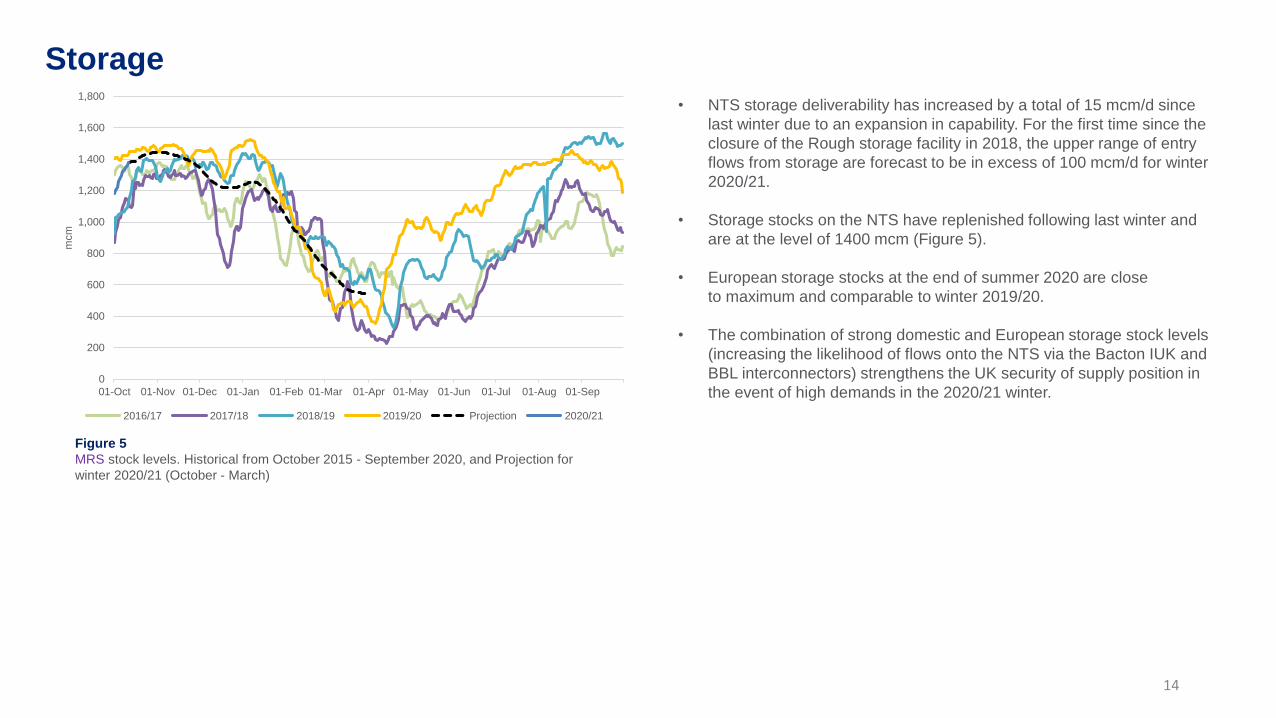
• NTS storage deliverability has increased by a total of 15 mcm/d since
last winter due to an expansion in capability. For the first time since the
closure of the Rough storage facility in 2018, the upper range of entry
flows from storage are forecast to be in excess of 100 mcm/d for winter
2020/21.
• Storage stocks on the NTS have replenished following last winter and
are at the level of 1400 mcm (Figure 5).
• European storage stocks at the end of summer 2020 are close
to maximum and comparable to winter 2019/20.
• The combination of strong domestic and European storage stock levels
(increasing the likelihood of flows onto the NTS via the Bacton IUK and
BBL interconnectors) strengthens the UK security of supply position in
the event of high demands in the 2020/21 winter.
Figure 5
MRS stock levels. Historical from October 2015 - September 2020, and Projection for
winter 2020/21 (October - March)
0
200
400
600
800
1,000
1,200
1,400
1,600
1,800
01-Oct 01-Nov 01-Dec 01-Jan 01-Feb 01-Mar 01-Apr 01-May 01-Jun 01-Jul 01-Aug 01-Sep
mcm
2016/17 2017/18 2018/19 2019/20 Projection 2020/21
Operational
toolbox
6
15
16
Operational Toolbox
Gas Margins Notice (MN)
A Margins Notice is a day-ahead announcement to the market indicating there
is a potential gas supply and demand deficit for the next gas day. The MN is
designed to encourage NTS users to reassess their balancing position against
the forecasts in the rolling Daily Margins Notice Report. This report gives all
energy industry participants a rolling five-day view of forecast gas supply and
demand, as well as data relating to the storage safety monitors, and is
published on our website.
Once an MN notice has been issued, it cannot be withdrawn and will stay in
place until the end of the gas day to which it applies, unless it is superseded by
a Gas Balancing Notification.
Last year, together with industry, we reviewed our processes and
calculation methodology in relation to Margins Notices and implemented a
package of reforms via UNC Modification Proposals 0698S and 0703S
https://www.gasgovernance.co.uk/0698
https://www.gasgovernance.co.uk/0703.
The proposals include a new methodology to determine the contribution from
LNG to the expected level of supply capability and an additional early
notification to shippers when 95% of the MN trigger level is reached.
Gas Balancing Notification (GBN)
The purpose of a GBN is to provide a within-day message to GB market
participants to provide more gas or reduce demand. We will issue a GBN if there
is a shortfall in gas supply compared to gas demand that presents a material risk
to the end of day system balance. A GBN was previously known as a Gas Deficit
Warning (GDW) and only one such notification has ever been issued, on
1 March 2018.
Both the MN and the GBN processes are described in more detail on our
website at https://www.nationalgrid.com/uk/gas-transmission/balancing/margins-
notices-and-gas-balancing-notifications
In our role as System Operator of the high pressure gas network, we act as Residual Balancer. This means that we must ensure
the overall balance of gas on the NTS is within safe physical operating limits at all times. A selection of operational tools can be
used to achieve this, including some that are mainly used when conditions on the network are more challenging.
17
Operational Toolbox
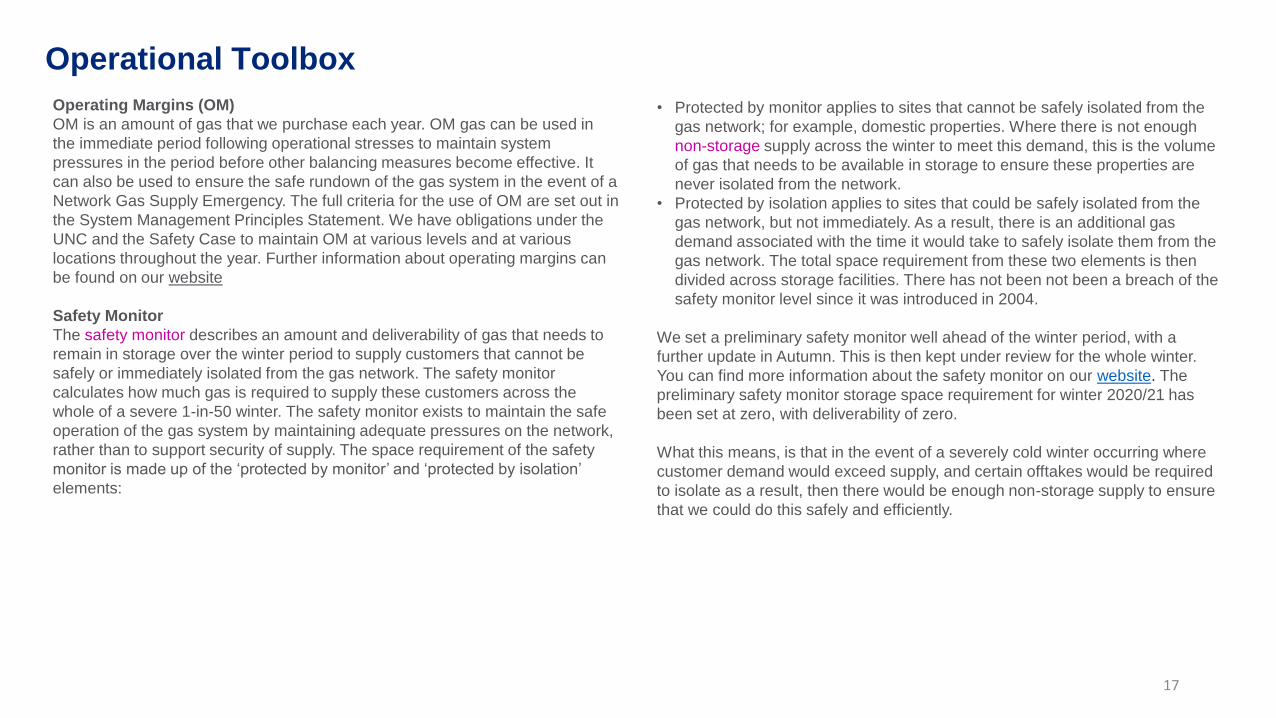
Operating Margins (OM)
OM is an amount of gas that we purchase each year. OM gas can be used in
the immediate period following operational stresses to maintain system
pressures in the period before other balancing measures become effective. It
can also be used to ensure the safe rundown of the gas system in the event of a
Network Gas Supply Emergency. The full criteria for the use of OM are set out in
the System Management Principles Statement. We have obligations under the
UNC and the Safety Case to maintain OM at various levels and at various
locations throughout the year. Further information about operating margins can
be found on our website
Safety Monitor
The safety monitor describes an amount and deliverability of gas that needs to
remain in storage over the winter period to supply customers that cannot be
safely or immediately isolated from the gas network. The safety monitor
calculates how much gas is required to supply these customers across the
whole of a severe 1-in-50 winter. The safety monitor exists to maintain the safe
operation of the gas system by maintaining adequate pressures on the network,
rather than to support security of supply. The space requirement of the safety
monitor is made up of the ‘protected by monitor’ and ‘protected by isolation’
elements:
• Protected by monitor applies to sites that cannot be safely isolated from the
gas network; for example, domestic properties. Where there is not enough
non-storage supply across the winter to meet this demand, this is the volume
of gas that needs to be available in storage to ensure these properties are
never isolated from the network.
• Protected by isolation applies to sites that could be safely isolated from the
gas network, but not immediately. As a result, there is an additional gas
demand associated with the time it would take to safely isolate them from the
gas network. The total space requirement from these two elements is then
divided across storage facilities. There has not been not been a breach of the
safety monitor level since it was introduced in 2004.
We set a preliminary safety monitor well ahead of the winter period, with a
further update in Autumn. This is then kept under review for the whole winter.
You can find more information about the safety monitor on our website. The
preliminary safety monitor storage space requirement for winter 2020/21 has
been set at zero, with deliverability of zero.
What this means, is that in the event of a severely cold winter occurring where
customer demand would exceed supply, and certain offtakes would be required
to isolate as a result, then there would be enough non-storage supply to ensure
that we could do this safely and efficiently.
Appendix
7
18
Appendix – mcm to GWh conversion
19
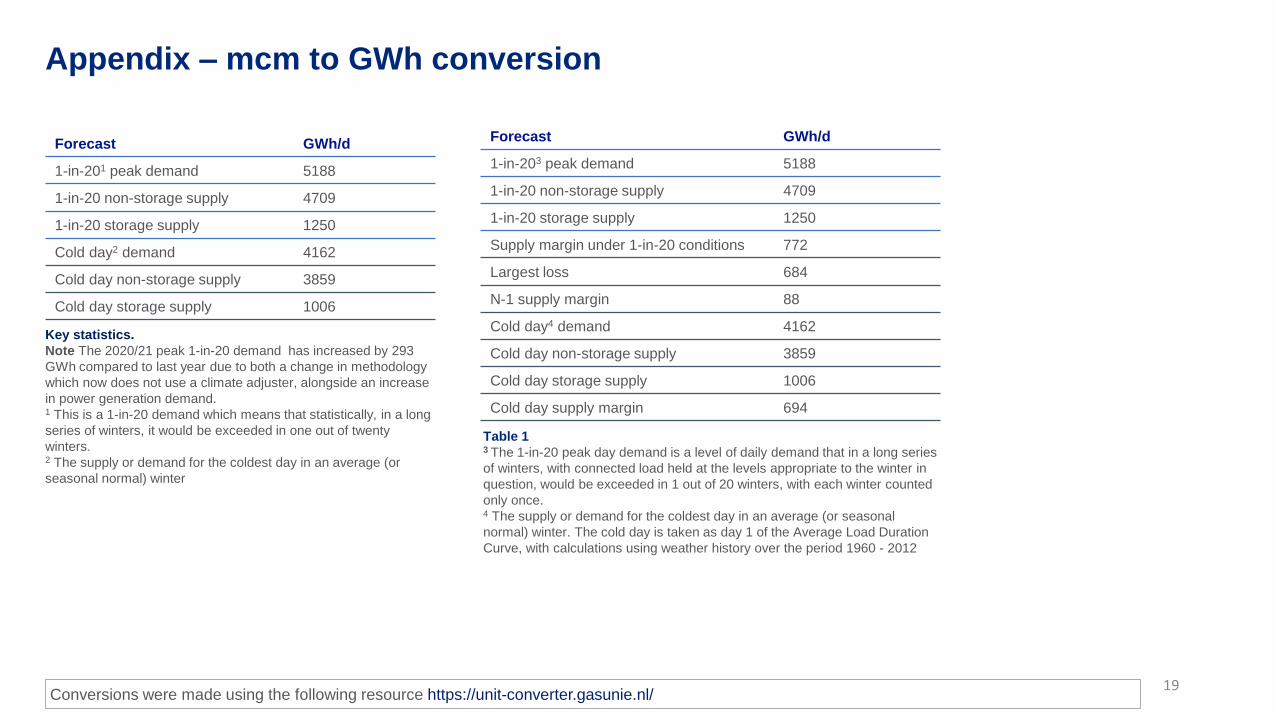
Table 13 The 1-in-20 peak day demand is a level of daily demand that in a long series
of winters, with connected load held at the levels appropriate to the winter in
question, would be exceeded in 1 out of 20 winters, with each winter counted
only once. 4 The supply or demand for the coldest day in an average (or seasonal
normal) winter. The cold day is taken as day 1 of the Average Load Duration
Curve, with calculations using weather history over the period 1960 - 2012
Key statistics.
Note The 2020/21 peak 1-in-20 demand has increased by 293
GWh compared to last year due to both a change in methodology
which now does not use a climate adjuster, alongside an increase
in power generation demand. 1 This is a 1-in-20 demand which means that statistically, in a long
series of winters, it would be exceeded in one out of twenty
winters.2 The supply or demand for the coldest day in an average (or
seasonal normal) winter
Conversions were made using the following resource https://unit-converter.gasunie.nl/
Forecast GWh/d
1-in-201 peak demand 5188
1-in-20 non-storage supply 4709
1-in-20 storage supply 1250
Cold day2 demand 4162
Cold day non-storage supply 3859
Cold day storage supply 1006
Forecast GWh/d
1-in-203 peak demand 5188
1-in-20 non-storage supply 4709
1-in-20 storage supply 1250
Supply margin under 1-in-20 conditions 772
Largest loss 684
N-1 supply margin 88
Cold day4 demand 4162
Cold day non-storage supply 3859
Cold day storage supply 1006
Cold day supply margin 694
Appendix - mcm to GWh conversion
20
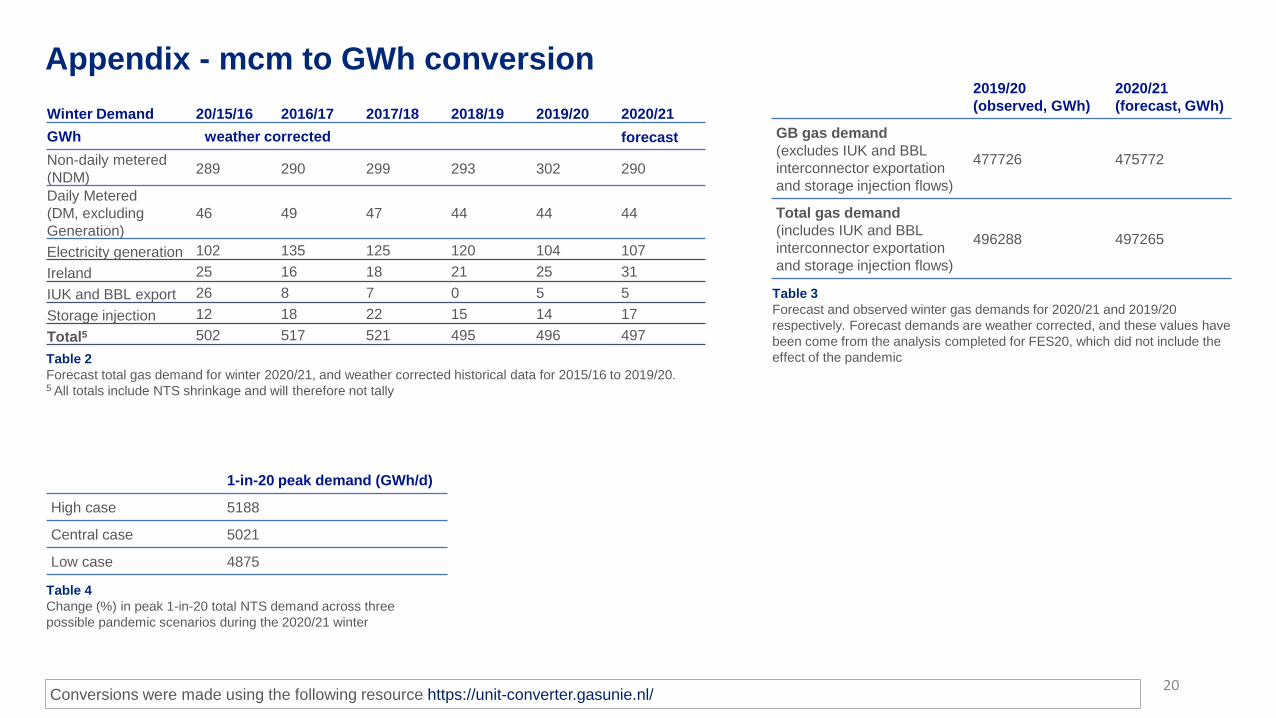
Table 2
Forecast total gas demand for winter 2020/21, and weather corrected historical data for 2015/16 to 2019/20. 5 All totals include NTS shrinkage and will therefore not tally
Table 3
Forecast and observed winter gas demands for 2020/21 and 2019/20
respectively. Forecast demands are weather corrected, and these values have
been come from the analysis completed for FES20, which did not include the
effect of the pandemic
Table 4
Change (%) in peak 1-in-20 total NTS demand across three
possible pandemic scenarios during the 2020/21 winter
Conversions were made using the following resource https://unit-converter.gasunie.nl/
Winter Demand 20/15/16 2016/17 2017/18 2018/19 2019/20 2020/21
GWh weather corrected forecast
Non-daily metered
(NDM)289 290 299 293 302 290
Daily Metered
(DM, excluding
Generation)
46 49 47 44 44 44
Electricity generation 102 135 125 120 104 107
Ireland 25 16 18 21 25 31
IUK and BBL export 26 8 7 0 5 5
Storage injection 12 18 22 15 14 17
Total5 502 517 521 495 496 497
2019/20
(observed, GWh)
2020/21
(forecast, GWh)
GB gas demand
(excludes IUK and BBL
interconnector exportation
and storage injection flows)
477726 475772
Total gas demand
(includes IUK and BBL
interconnector exportation
and storage injection flows)
496288 497265
1-in-20 peak demand (GWh/d)
High case 5188
Central case 5021
Low case 4875
Appendix - mcm to GWh conversion
21
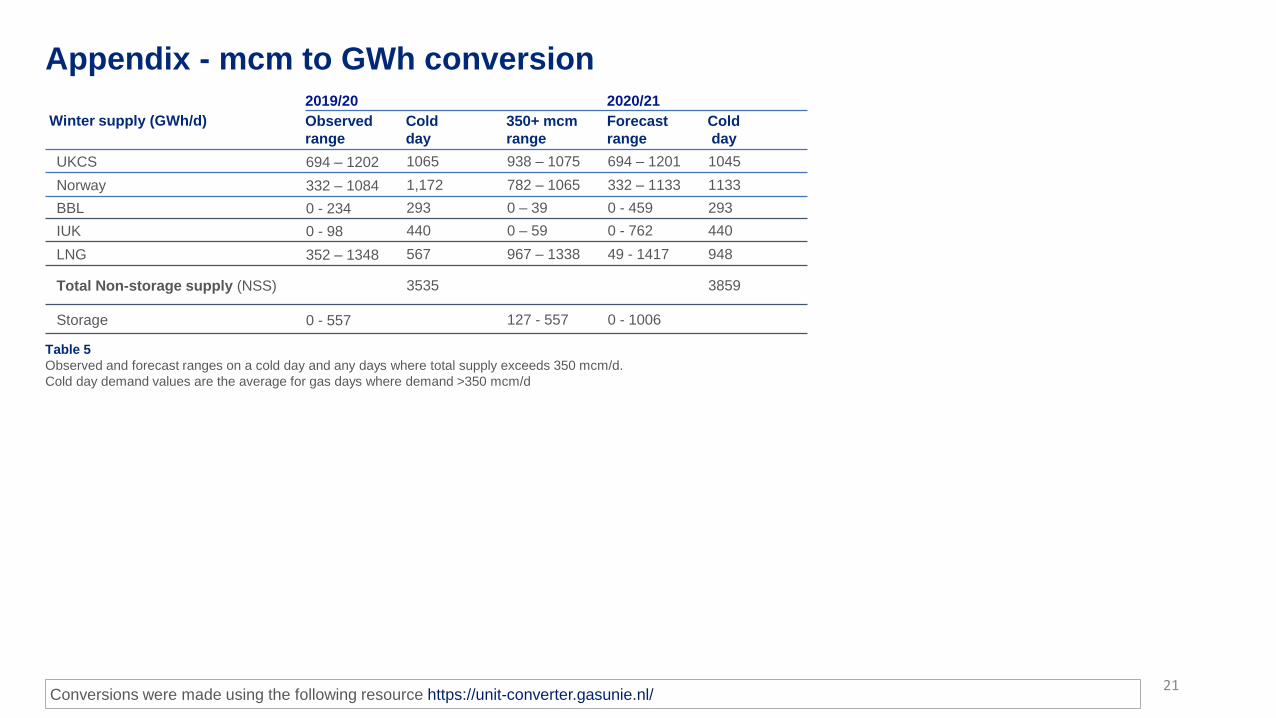
Table 5
Observed and forecast ranges on a cold day and any days where total supply exceeds 350 mcm/d.
Cold day demand values are the average for gas days where demand >350 mcm/d
Conversions were made using the following resource https://unit-converter.gasunie.nl/
Winter supply (GWh/d)
2019/20 2020/21
Observed
range
Cold
day
350+ mcm
range
Forecast
range
Cold
day
UKCS 694 – 1202 1065 938 – 1075 694 – 1201 1045
Norway 332 – 1084 1,172 782 – 1065 332 – 1133 1133
BBL 0 - 234 293 0 – 39 0 - 459 293
IUK 0 - 98 440 0 – 59 0 - 762 440
LNG 352 – 1348 567 967 – 1338 49 - 1417 948
Total Non-storage supply (NSS) 3535 3859
Storage 0 - 557 127 - 557 0 - 1006

Glossary
8
22
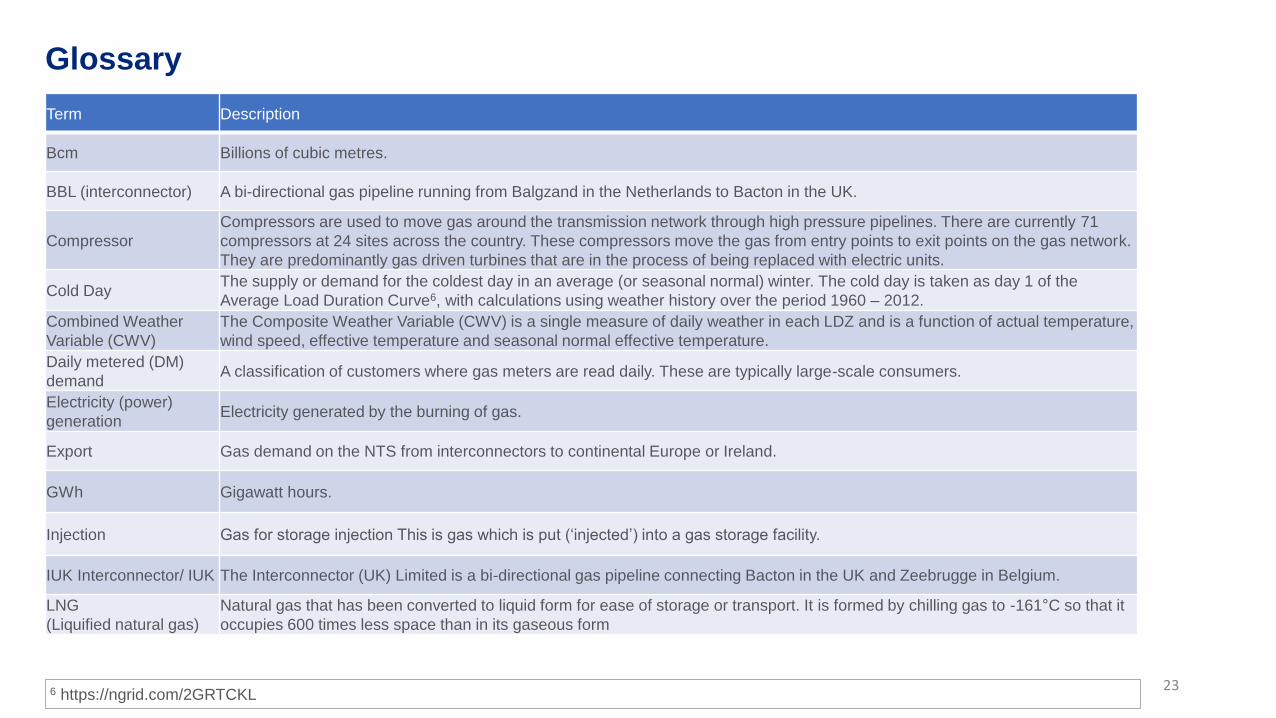
Term Description
Bcm Billions of cubic metres.
BBL (interconnector) A bi-directional gas pipeline running from Balgzand in the Netherlands to Bacton in the UK.
Compressor
Compressors are used to move gas around the transmission network through high pressure pipelines. There are currently 71
compressors at 24 sites across the country. These compressors move the gas from entry points to exit points on the gas network.
They are predominantly gas driven turbines that are in the process of being replaced with electric units.
Cold DayThe supply or demand for the coldest day in an average (or seasonal normal) winter. The cold day is taken as day 1 of the
Average Load Duration Curve6, with calculations using weather history over the period 1960 – 2012.
Combined Weather
Variable (CWV)
The Composite Weather Variable (CWV) is a single measure of daily weather in each LDZ and is a function of actual temperature,
wind speed, effective temperature and seasonal normal effective temperature.
Daily metered (DM)
demandA classification of customers where gas meters are read daily. These are typically large-scale consumers.
Electricity (power)
generationElectricity generated by the burning of gas.
Export Gas demand on the NTS from interconnectors to continental Europe or Ireland.
GWh Gigawatt hours.
Injection Gas for storage injection This is gas which is put (‘injected’) into a gas storage facility.
IUK Interconnector/ IUK The Interconnector (UK) Limited is a bi-directional gas pipeline connecting Bacton in the UK and Zeebrugge in Belgium.
LNG
(Liquified natural gas)
Natural gas that has been converted to liquid form for ease of storage or transport. It is formed by chilling gas to -161°C so that it
occupies 600 times less space than in its gaseous form
Glossary
236 https://ngrid.com/2GRTCKL
Glossary
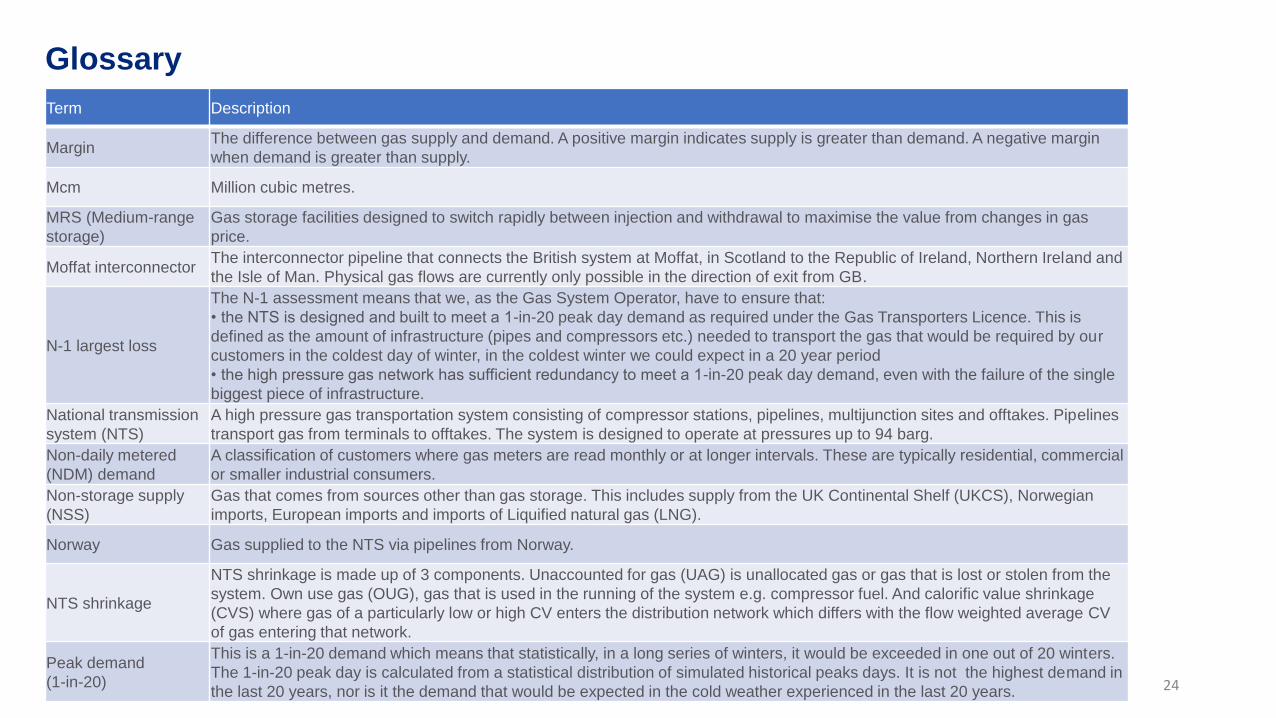
Term Description
MarginThe difference between gas supply and demand. A positive margin indicates supply is greater than demand. A negative margin
when demand is greater than supply.
Mcm Million cubic metres.
MRS (Medium-range
storage)
Gas storage facilities designed to switch rapidly between injection and withdrawal to maximise the value from changes in gas
price.
Moffat interconnectorThe interconnector pipeline that connects the British system at Moffat, in Scotland to the Republic of Ireland, Northern Ireland and
the Isle of Man. Physical gas flows are currently only possible in the direction of exit from GB.
N-1 largest loss
The N-1 assessment means that we, as the Gas System Operator, have to ensure that:
• the NTS is designed and built to meet a 1-in-20 peak day demand as required under the Gas Transporters Licence. This is
defined as the amount of infrastructure (pipes and compressors etc.) needed to transport the gas that would be required by our
customers in the coldest day of winter, in the coldest winter we could expect in a 20 year period
• the high pressure gas network has sufficient redundancy to meet a 1-in-20 peak day demand, even with the failure of the single
biggest piece of infrastructure.
National transmission
system (NTS)
A high pressure gas transportation system consisting of compressor stations, pipelines, multijunction sites and offtakes. Pipelines
transport gas from terminals to offtakes. The system is designed to operate at pressures up to 94 barg.
Non-daily metered
(NDM) demand
A classification of customers where gas meters are read monthly or at longer intervals. These are typically residential, commercial
or smaller industrial consumers.
Non-storage supply
(NSS)
Gas that comes from sources other than gas storage. This includes supply from the UK Continental Shelf (UKCS), Norwegian
imports, European imports and imports of Liquified natural gas (LNG).
Norway Gas supplied to the NTS via pipelines from Norway.
NTS shrinkage
NTS shrinkage is made up of 3 components. Unaccounted for gas (UAG) is unallocated gas or gas that is lost or stolen from the
system. Own use gas (OUG), gas that is used in the running of the system e.g. compressor fuel. And calorific value shrinkage
(CVS) where gas of a particularly low or high CV enters the distribution network which differs with the flow weighted average CV
of gas entering that network.
Peak demand
(1-in-20)
This is a 1-in-20 demand which means that statistically, in a long series of winters, it would be exceeded in one out of 20 winters.
The 1-in-20 peak day is calculated from a statistical distribution of simulated historical peaks days. It is not the highest demand in
the last 20 years, nor is it the demand that would be expected in the cold weather experienced in the last 20 years. 24
Glossary
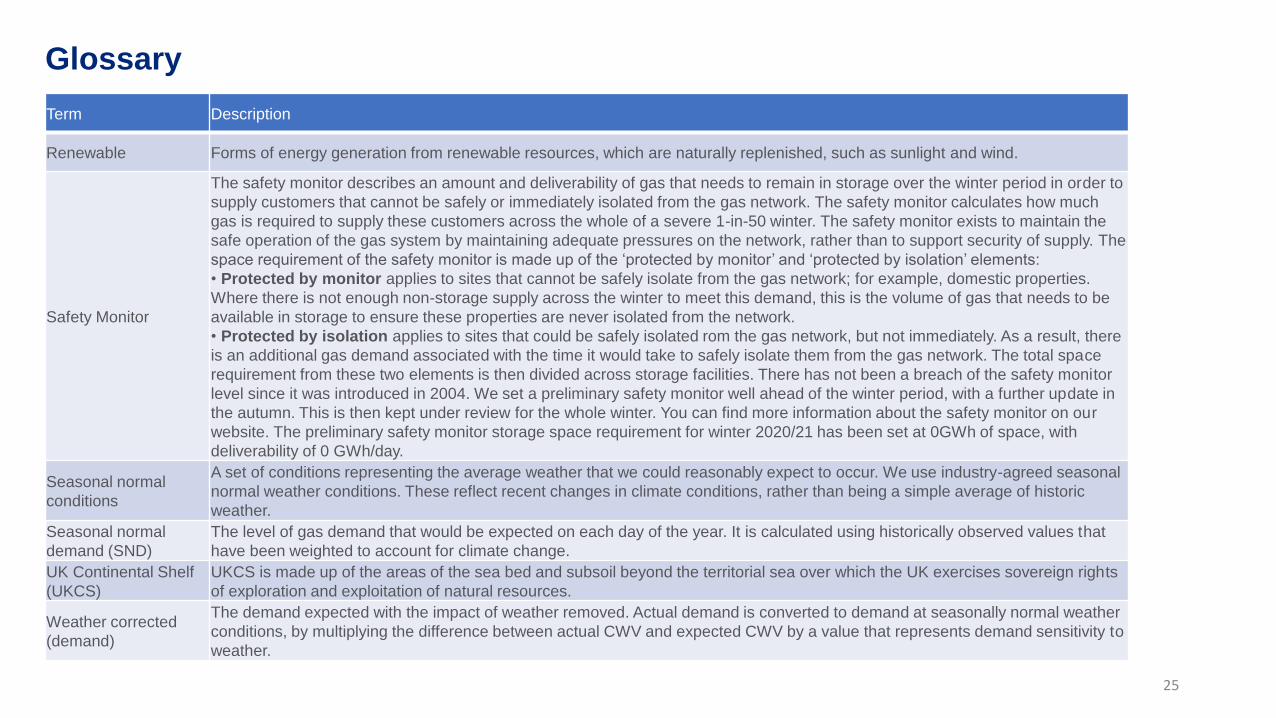
Term Description
Renewable Forms of energy generation from renewable resources, which are naturally replenished, such as sunlight and wind.
Safety Monitor
The safety monitor describes an amount and deliverability of gas that needs to remain in storage over the winter period in order to
supply customers that cannot be safely or immediately isolated from the gas network. The safety monitor calculates how much
gas is required to supply these customers across the whole of a severe 1-in-50 winter. The safety monitor exists to maintain the
safe operation of the gas system by maintaining adequate pressures on the network, rather than to support security of supply. The
space requirement of the safety monitor is made up of the ‘protected by monitor’ and ‘protected by isolation’ elements:
• Protected by monitor applies to sites that cannot be safely isolate from the gas network; for example, domestic properties.
Where there is not enough non-storage supply across the winter to meet this demand, this is the volume of gas that needs to be
available in storage to ensure these properties are never isolated from the network.
• Protected by isolation applies to sites that could be safely isolated rom the gas network, but not immediately. As a result, there
is an additional gas demand associated with the time it would take to safely isolate them from the gas network. The total space
requirement from these two elements is then divided across storage facilities. There has not been a breach of the safety monitor
level since it was introduced in 2004. We set a preliminary safety monitor well ahead of the winter period, with a further update in
the autumn. This is then kept under review for the whole winter. You can find more information about the safety monitor on our
website. The preliminary safety monitor storage space requirement for winter 2020/21 has been set at 0GWh of space, with
deliverability of 0 GWh/day.
Seasonal normal
conditions
A set of conditions representing the average weather that we could reasonably expect to occur. We use industry-agreed seasonal
normal weather conditions. These reflect recent changes in climate conditions, rather than being a simple average of historic
weather.
Seasonal normal
demand (SND)
The level of gas demand that would be expected on each day of the year. It is calculated using historically observed values that
have been weighted to account for climate change.
UK Continental Shelf
(UKCS)
UKCS is made up of the areas of the sea bed and subsoil beyond the territorial sea over which the UK exercises sovereign rights
of exploration and exploitation of natural resources.
Weather corrected
(demand)
The demand expected with the impact of weather removed. Actual demand is converted to demand at seasonally normal weather
conditions, by multiplying the difference between actual CWV and expected CWV by a value that represents demand sensitivity to
weather.
25

Continuing the conversation
National Grid plcNational Grid House,Warwick Technology Park,Gallows Hill, Warwick.CV34 6DA United KingdomRegistered in England and WalesNo. 4031152
www.nationalgrid.com
Email us with your views on the Gas Winter Outlook at:
26
Legal Notice
National Grid has prepared this outlook document in good faith, and has endeavoured to prepare this outlook document in
a manner which is, as far as reasonably possible, objective, using information collected and compiled by National Grid
from users of the gas transportation, together with its own forecasts of the future development of those systems.
While National Grid has not sought to mislead any person as to the contents of this outlook document and whilst such
content represents National Grid’s best views as at the time of publication, readers of this document should not place any
reliance on the contents of this outlook document.
The contents of this outlook document must be considered as illustrative only and no warranty can be or is made as to the
accuracy and completeness of such contents, nor shall anything within this outlook document constitute an offer capable
of acceptance or form the basis of any contract.
Other than in the event of fraudulent misstatement or fraudulent misrepresentation, National Grid does not accept any
responsibility for any use which is made of the information contained within this outlook document.
Copyright
Any and all copyright and all other intellectual property rights contained in this outlook document belong to National Grid. To the extent that you re-use the outlook
document, in its original form and without making any modifications or adaptations thereto, you
must reproduce, clearly and prominently, the following copyright statement in your own documentation:
© National Grid plc, all rights reserved.

31


![NGET An.nn [document title] - National Grid plc](https://img.pdfslide.net/doc/110x75/623fdf194029604cc2040bbc/nget-annn-document-title-national-grid-plc.jpg)