Embed Size (px)
Citation preview

© 2015 Energy Technologies Institute LLP - Subject to notes on page 1
© 2015 Energy Technologies Institute LLP The information in this document is the property of Energy Technologies Institute LLP and may not be copied or communicated to a third party, or used for any purpose other than that for which it is supplied without the express written consent of Energy Technologies Institute LLP.This information is given in good faith based upon the latest information available to Energy Technologies Institute LLP, no warranty or representation is given concerning such information, which must not be taken as establishing any contractual or other commitment binding upon Energy Technologies Institute LLP or any of its subsidiary or associated companies.
Gasification: A Key Technology EnablerPaul Winstanley CEng. MEI. MSOE. MCIBSE. Project Manager
© 2015 Energy Technologies Institute LLP - Subject to notes on page 1
Agenda
• The ETI• UK energy use• Why energy from waste• Why gasification• What is Gasification• Phase 1 Waste Gasification project• Phase 2 Waste Gasification

© 2015 Energy Technologies Institute LLP - Subject to notes on page 1
The Energy Technologies Institute (ETI)
• The Energy Technologies Institute is a public-private partnership between global energy and engineering companies and UK Government
• The UK is facing increasing energy demands and stringent GHG emission targets out to 2050 (> 500 MtCO2e to 105 MtCO2e)
• This will require significant change to our energy system
• ETI was set up to identify and accelerate the development and demonstration of an integrated set of low carbon technologies to deliver this step change
• Part of a robust and affordable future energy system in the UK
ETI programme associate
ETI members

© 2015 Energy Technologies Institute LLP - Subject to notes on page 1
ETI covers 9 technology programme areas & invests in projects at three levels
Delivering...• New knowledge
o Up to £5M / 2 years• Technology development
o £5-15M / 2-4 years / TRL 3-5• Technology demonstration
• £15-30M+ / 3-5 years / TRL 5-6+
• Reduced risk

© 2015 Energy Technologies Institute LLP - Subject to notes on page 1
UK (ESME) energy flows 2015• Primary energy
• Bioenergy/waste excepted. most primary energy is imported
• Petroleum dominates -nearly 150 mtoe.
• Most electricity is indigenously produced
• Final UK energy consumption• 2013:150.1mtoe/6304 PJ• Transport accounts for
35½% of all of the energy consumed in the UK
• Domestic sector accounts for 29% & industrial sector accounts for 16%

© 2015 Energy Technologies Institute LLP - Subject to notes on page 1
62 million people 77-79 million people
2010 2050
24 million cars 35-43 million cars
24 million domestic dwellings 80% still in use in 2050, growing to 38 million houses
• Over 90GW generation capacity (1MW to 3.9GW)• Over 200 ‘significant’ power stations …. average age > 20 years old• 50% of power generation capacity held in 30 plants - average age 30 years old
Demand is growing, assets are ageing, prices are rising… irrespective of the UK’s GHG emission reduction targets
Need to design a future UK energy system which is sustainable, affordable and secure
The UK Energy Challenge…

© 2015 Energy Technologies Institute LLP - Subject to notes on page 1
BioenergyA key lever – particularly with CCS - Requires sustainable supplies – imports and indigenous
• Major potential for creating ‘negative emissions’ via CCS
• Could support a range of conversion and utilisation routes– Hydrogen– SNG– Heat
• ETI investing in soil science, logistics and value chain models
• Informing decisions– “what do we grow ?”– “where do we grow it ?” – “how do we handle it ?”

© 2015 Energy Technologies Institute LLP - Subject to notes on page 1
Future scenarios: emissions comparisonNegative emissions are highly desirable
• Both scenarios target is 105 million tonnes of CO2 in 2050• Clockwork has 30 MT of extra negative emissions from implementation of biomass + CCS
– This extra headroom helps avoid expensive abatement actions such as in transport– Provides more flexibility on transition
Clo
ckw
ork
Patc
hwor
k
© 2015 Energy Technologies Institute LLP - Subject to notes on page 1
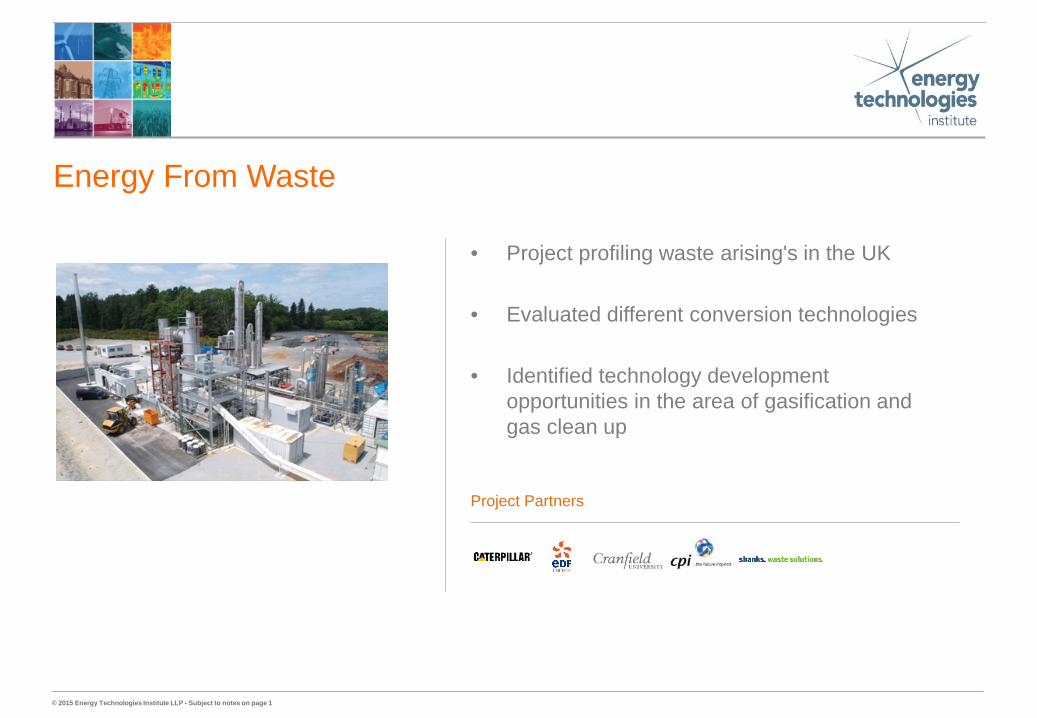
Energy From Waste
Project Partners
• Project profiling waste arising's in the UK
• Evaluated different conversion technologies
• Identified technology development opportunities in the area of gasification and gas clean up

© 2015 Energy Technologies Institute LLP - Subject to notes on page 1
Why energy from waste• Drivers to use waste as a fuel
– Reduce waste sector emissions – 3.2% of UK GHG emissions in 2009– Landfill diversion – landfill tax and landfill diversion targets– UK commitments
• Reduction of UK emissions by 80% by 2050• To supply 15% of energy from renewable sources by 2020
• Energy from Waste FRP project
1. UK Waste Arisings
2. Technology Assessment
3. Modeling of System Performance Configurations As is vs Developed
4. Benefits Case

© 2015 Energy Technologies Institute LLP - Subject to notes on page 1
1. Waste system analysis• About 90MT of UK waste is energy bearing• Key waste streams are MSW and C&I – C&D is about 70% non combustible• C&I contains more paper and card than MSW – due to different recycling targets
– Both contain large percentages of thin film plastics with high CV• Plastics contribute significantly to waste CV – economically favourable to extract energy from
these providing efficiency is high enough• But, waste streams will always contain some recyclable materials as these can’t be
continuously recycled
England Wales Scotland Northern Ireland Total
MSW 29.1 1.8 2.1 1.1 34.1C&I waste 58.7 3.6 8.1 1.6 72.0C&D waste 89.6 12.2 11.8 1.7 115.3Total 177.4 17.6 22.0 4.4 221.4

© 2015 Energy Technologies Institute LLP - Subject to notes on page 1
2. Improve the definition of the opportunity for significant levels of primarily electricity and heat generation from the waste available in the UK, today and in coming decades.
• Overview of new technologies followed by testing program• FB gasification most suitable technology; downdraft possibly suitable at smaller scales• Strong focus on fuel feeding and syngas gas cleaning needed
– Feedstock pre-treatment may be necessary to homogenise the waste feed• Holistic system design is essential• Gasification and pyrolysis technologies tested were able to process mixed wastes of widely
varying composition• Operating engines on syngas shown to be feasible• Integrated AD / gasification set up is an opportunity

© 2015 Energy Technologies Institute LLP - Subject to notes on page 1
3. Opportunity - Identification of combinations of technologies for development and related technology improvement opportunities to fill gaps in the value chain.
• Current EFW’s are regional scale only.– Town scale is a major development opportunity– Local CHP plants will have strongest impact on reducing emissions from energy from wastes
• EFW technologies must be able to cope with changing wastes - drives towards thermal processes
– MSW and C&I production rates are reducing and mix of materials within wastes is changing with changes in recycling. Elemental composition is relatively stable
– Opportunity to develop waste pre-treatment technologies to homogenise waste• Limited range of options for wet wastes garden waste and food waste; AD appears most
attractive. – AD efficiency is low for the size of plant – work needed to improved process intensities
• Gasification* is preferred to liquefaction by pyrolysis for MSW & C&I– Liquefaction by pyrolysis more suited to consistent quality feedstock streams such as tyres
*including Pyrolysis/Gasification combinations and gasification by pyrolysis

© 2015 Energy Technologies Institute LLP - Subject to notes on page 1
4. UK benefits case - Clear UK benefits case for development and deployment of the identified technologiesCity34% of UK population live in cities500k people taken as scenario scale UK has 5 cities over 500k people and 26 between 200k and 500kMixed economy of residential, industrial and serviceNo agricultural
Town43% of UK population live in towns50k people taken as scenario scaleResidential and commercial (with surrounding agricultural).
Village21% of UK population live in villages5k people taken as scenario scale Residential, little commercial
Rural Agricultural2% of UK population live in a rural setting500 people taken as scenario scaleMainly farming and light industrial (arable or livestock)

© 2015 Energy Technologies Institute LLP - Subject to notes on page 1
Benefits Case Outcomes• Projected achievable electrical generation is approximately 25TWh per year
– Equivalent to 5-8% of UK electricity demand• Advanced EFW technologies can potentially contribute to a net decrease 5 to 10
MTCO2e/year at midpoint technology conversion and waste arisings scenarios• High total conversion efficiency technologies drive highest GHG savings• Focus on town and village scale technologies, especially gasification/pyrolysis
– City scale well served by incineration– Cost effective syngas clean-up is essential for community scale systems
City Town Village Rural
Av Population 500,000 50,000 5,000 500
% UK Popn. 34% 43% 21% 2%
Waste kT/yr (Mwe) 500 (75) 50 (8) 5 (0.8) 0.5 (0.1)
Number of plants 76 946 4,544 4,544

© 2015 Energy Technologies Institute LLP - Subject to notes on page 1
• Incineration and Anaerobic Digestion TRL 9• Pyrolysis and Gasification TRL5 (Laboratory scale, similar
system validation in relevant environment)• But, Gasification;
– Integrates well with upstream recycling activities– Provides great energy sector flexibility (power, gas,
liquids)– Is future proof, as an intermediate and destination
technology– Greatest potential for ETI to deliver LCOE and efficacy
improvements• Coupling of key elements (sorting, gasification, gas clean-
up, gas utilisation) of the system are vital
Technology Choices

© 2015 Energy Technologies Institute LLP - Subject to notes on page 1
Summary / Our Vision
• Town scale systems using local waste arisings• Gasification systems providing clean syngas, but
– Gasification systems today are just developing – close coupled systems are rolling out– Gas clean-up systems need development and demonstration– Utilisation of cleaned syngas in engines and turbines to give enhanced efficiencies not
yet commercially demonstrated– Finance community needs proven systems
• Flexible use of syngas, providing– Power at high efficiency plus heat– Fuels including hydrogen plus heat if possible

© 2015 Energy Technologies Institute LLP - Subject to notes on page 1
The Gasification Story – gasification is not new
1609 • Belgian Chemist Jan Baptisa Van Helmon
1788 • First Gasifier Patent
1878 • Gasifier used with internal combustion engine
1926 • Winkler fluidised bed gasifier
1931 • Lurgi pressurised bed gasifier
1939 • Germany produce fuels from coal
1940’s • Wide use of towns gas to fuel vehicles
~1974 • UK abandons the use of towns gas
© 2015 Energy Technologies Institute LLP - Subject to notes on page 1
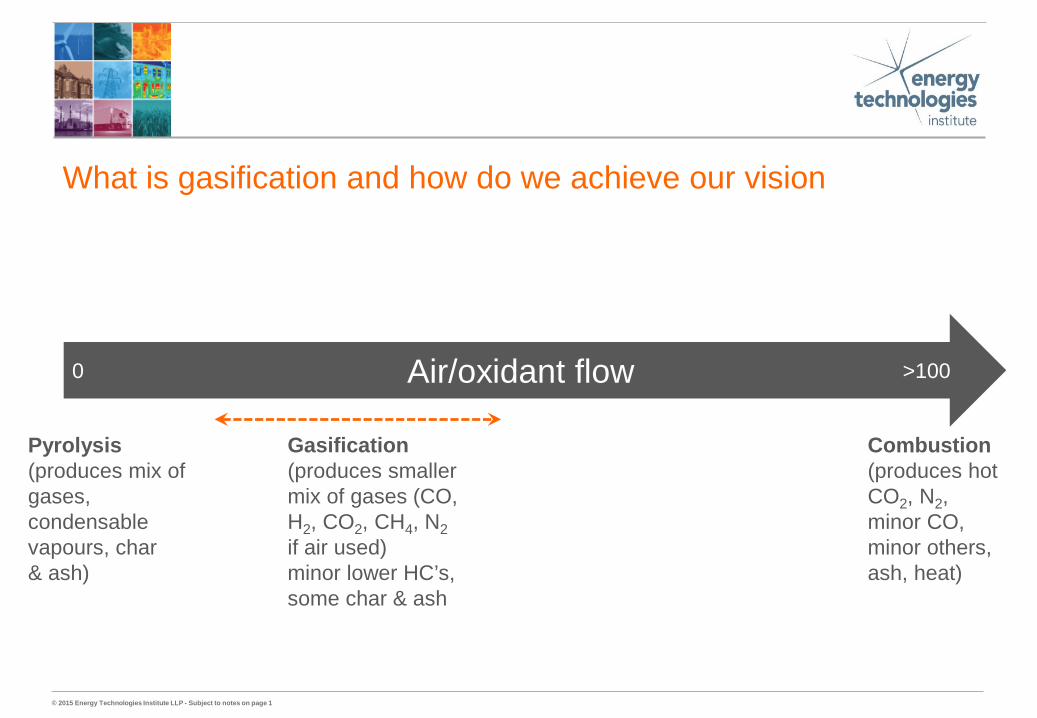
What is gasification and how do we achieve our vision
Air/oxidant flow0 >100
Pyrolysis(produces mix ofgases,condensablevapours, char& ash)
Combustion(produces hotCO2, N2, minor CO, minor others,ash, heat)
Gasification(produces smallermix of gases (CO,H2, CO2, CH4, N2if air used) minor lower HC’s,some char & ash

© 2015 Energy Technologies Institute LLP - Subject to notes on page 1
400°C
600°C
1000°C
1500°C
400°C
Oil vapours and gas Pyrolysis of wood
Oil vapours crack to hydrocarbons and tar
Gases from soot (luminous)
Combustion of gas, tar and soot
Air diffusion in plume
Combustion products
Combustion / Gasification / Pyrolysis are all closely related

© 2015 Energy Technologies Institute LLP - Subject to notes on page 1
Unreacted feedstock (15°C)
Drying (<100°C)
Pyrolysis (100-400°C)
Oxidation (~1000°C)
Char and gas reduction (1000-700°C)
(too) cool char and ash (<700°C)
Feed + oxidant
flows
Hot raw syngas
Heat dries biomass as it approaches reaction zone
Heat devolatilises biomass to yield vapours, gases and char
C + O2 = CO2 + heatC+ 1/2O2 = CO
All “air consumed”C + CO2 = 2CO, C + H2O = CO + H2, C + 2H2 = CH42CO + O2 = 2CO2, CO + 3H2 = CH4 + H2O, 2H2 + O2 = 2H2O, CH4 + 3/2O2 = CO + 2H2OCO + H2O = CO2 + H2, CH4 + H2O = CO + 3H2
Chemical quenching in reduction zone meanstemperatures are too low to sustain reactions
Contains tars, particulates which need removal
e.g. RDF, wood chips

© 2015 Energy Technologies Institute LLP - Subject to notes on page 1
Market attractiveness (town scale, waste)
• Each has its own strengths and weaknesses– Each may be more or less suited to a
particular feedstock and/or application• Market attractiveness very much depends on
application and resource to be gasified– For high hazard wastes, plasma becomes
much more desirable– For fuels production from torrefied
woodchips, entrained flow becomes more desirable
• Lack of gasification technologies for clean syngas in <10MWe scale
– Atmospheric BFB starting to emerge– Pressurised BFB not far behind– CFB’s may be too large for town scale
high
low
Mar
ket
attra
ctiv
enes
s
strongest weakestTechnology strength
ABFB
ACFB
PBFB
PCFBplasma
EF
downdraft
Up draft

© 2015 Energy Technologies Institute LLP - Subject to notes on page 1
System integration is biggest challenge• Gasification needs demonstration• More innovation and demonstration needed in gas cleaning
– Cleaning can be by, for example, high temperature cracking and washing, low temperature scrubbing (e.g. OLGA)
• Waste handling – although simple on face of it, lack of focus here can jeopardise a whole project
Air
Waste handling
gasifier
O2
Cleaning / conditioning
Raw syngas
Clean syngas
Furnace / steam
engine
Gas turbine
Chem synthesis

© 2015 Energy Technologies Institute LLP - Subject to notes on page 1
Raw syngas quality is not sufficient for advanced processes
Courtesy of Progressive Energy

© 2015 Energy Technologies Institute LLP - Subject to notes on page 1
Methane (bioSNG)
Mixed alcohols synthesis
Furnace/Boiler
Fuel cell
Ethanol (fermentation)
Fischer Tropsch
Engine/Turbine
direct combustion
chemical synthesis
Gasification
Methanol synthesis
Carbon monoxide
Hydrogen
Ammonia
DiMethylEther (DME)
Diesel / jet fuel
n-paraffins
Fertilisers
Acetyls
MTO / MOGDFormaldehyde
Cleaned syngas
chemicals and m
aterials
Pow
er
HeatFuels
Gasification to produce clean syngas provides flexibility; mitigating against future energy system uncertainties Courtesy of NNFCC
Gasification provides flexibility – provided there is clean syngas

© 2015 Energy Technologies Institute LLP - Subject to notes on page 1
Deployment of gasification projects using Rankine (steam) cycles
Deployment of projects using clean syngas fuelling engines, turbines for power. CHP
Deployment of fully flexible options (turbines, H2, jet fuels etc)
High value job creation
IP creation
Increased R&D opportunities
Security of supply
Effective use of wastes
Use of widerresource base
GHG savings
Meeting 2050 targets
CHP opportunity
Today

© 2015 Energy Technologies Institute LLP - Subject to notes on page 1
Waste Gasification Project
Aim: Competition to design an economically and commercially viable, efficient energy from waste gasification demonstrator plant.in the 5-20 MWe scale range.
Outputs:- Process designs, site identification, costs, planning and permittingOutcomes:- Technical capabilities, deliverability, finance-ability
• Three companies commissioned to deliver their design• Designs supported with a combination of laboratory and pilot scale testing on
different feedstocks and through process modelling• £2.8 million over 1 year• Launched April 2012

© 2015 Energy Technologies Institute LLP - Subject to notes on page 1
Advanced Plasma Power• Site location West Midlands (Tyseley)• ≈ 5MWe reciprocating engines• Novelty of design: plasma torch syngas
cleaning and tar cracking
Broadcrown• Site Location West Midlands
(Wednesbury)• ≈ 3MWe reciprocating engines• Novelty of design: thermal syngas cleaning
and tar cracking
Royal Dahlman• Site location NE (Grimsby)• ≈ 7MWe Combined cycle gas turbine plant• Novelty of design: indirect gasifier, turbine
and chemical washing of syngas with “heavies” recycle back to gasifier

© 2015 Energy Technologies Institute LLP - Subject to notes on page 1
In Summary / Our Vision
• ETI has identified Bioenergy as very important – negative emissions of CO2
• Gasification is a key enabling technology– Flexibility – can yield a variety of energy outputs– Town scale systems using local waste arisings– Improved thermal integration
• Gasification systems today are just developing – close coupled systems are rolling out– Systems need development and robust demonstration– Advanced gasification systems are emerging

© 2015 Energy Technologies Institute LLP - Subject to notes on page 1
For more information about the ETI visit www.eti.co.uk
For the latest ETI news and announcements email [email protected]
The ETI can also be followed on Twitter @the_ETI
Registered Office Energy Technologies InstituteHolywell BuildingHolywell ParkLoughboroughLE11 3UZ
For all general enquiries telephone the ETI on 01509 202020.