Embed Size (px)
Citation preview
dia 0
Gertjan Lankhorst
CEO
GasTerra B.V.
dia 1
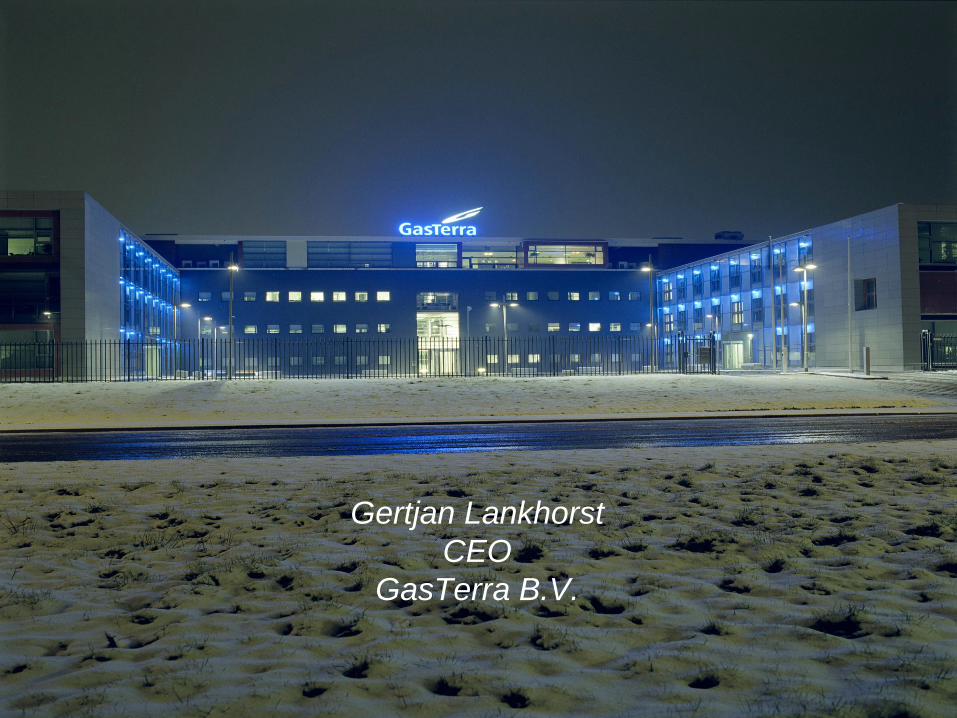
Demand for natural gas on the different continents - 2007
Source: IEA Natural gas information 2008
Caloric value 40 MJ/m³
817
129
572
520
487
97
34
370
21
-17
260-168
83
-110
-56
-14
dia 2
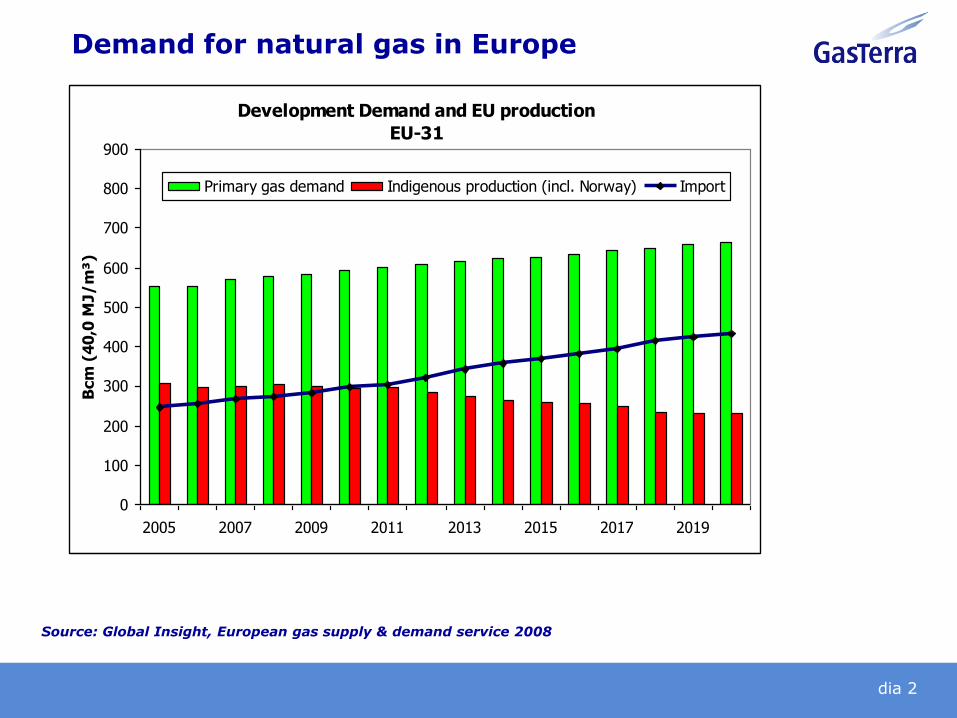
Demand for natural gas in Europe
Source: Global Insight, European gas supply & demand service 2008
Development Demand and EU production
EU-31
0
100
200
300
400
500
600
700
800
900
2005 2007 2009 2011 2013 2015 2017 2019
Bcm
(4
0,0
MJ/
m³)
Primary gas demand Indigenous production (incl. Norway) Import
dia 3
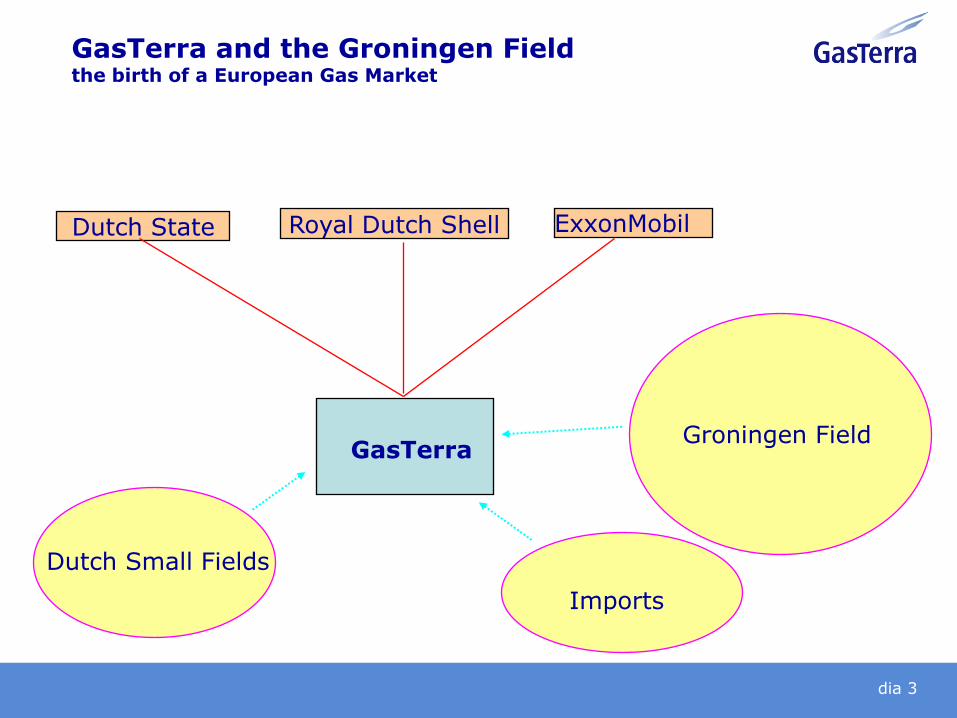
GasTerra and the Groningen Fieldthe birth of a European Gas Market
Dutch State Royal Dutch Shell ExxonMobil
GasTerraGroningen Field
Dutch Small Fields
Imports
dia 4
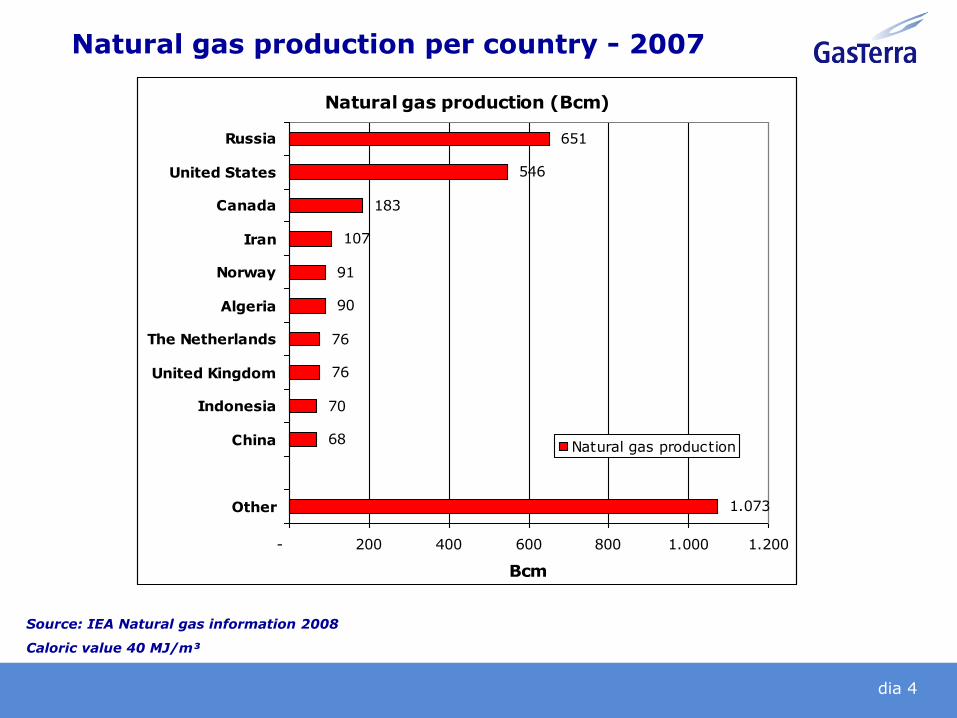
Natural gas production per country - 2007
Source: IEA Natural gas information 2008
Caloric value 40 MJ/m³
Natural gas production (Bcm)
1.073
68
70
76
76
90
91
107
183
546
651
- 200 400 600 800 1.000 1.200
Other
China
Indonesia
United Kingdom
The Netherlands
Algeria
Norway
Iran
Canada
United States
Russia
Bcm
Natural gas production
dia 5
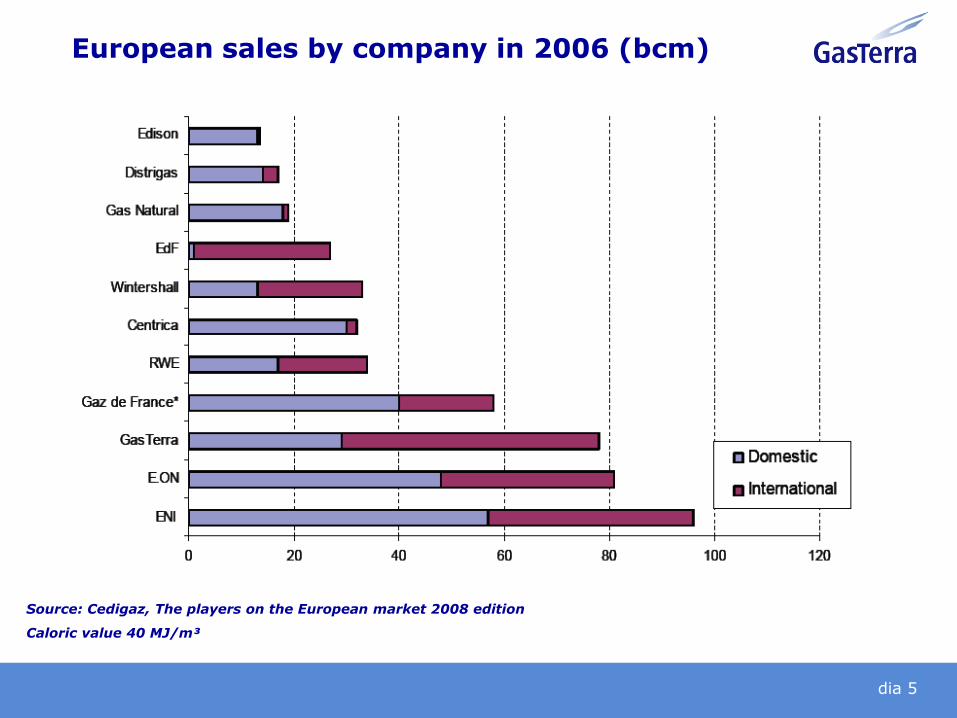
European sales by company in 2006 (bcm)
Source: Cedigaz, The players on the European market 2008 edition
Caloric value 40 MJ/m³
dia 6
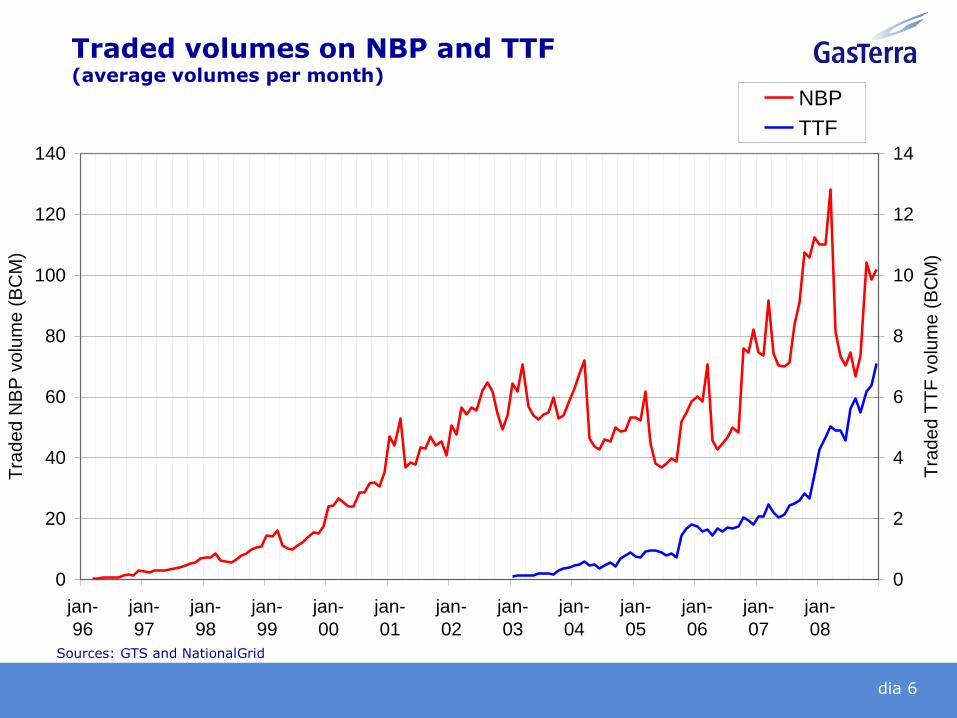
Sources: GTS and NationalGrid
Traded volumes on NBP and TTF(average volumes per month)
0
20
40
60
80
100
120
140
jan-
96
jan-
97
jan-
98
jan-
99
jan-
00
jan-
01
jan-
02
jan-
03
jan-
04
jan-
05
jan-
06
jan-
07
jan-
08
Tra
de
d N
BP
vo
lum
e (
BC
M)
0
2
4
6
8
10
12
14
Tra
de
d T
TF
vo
lum
e (
BC
M)
NBP
TTF
dia 7
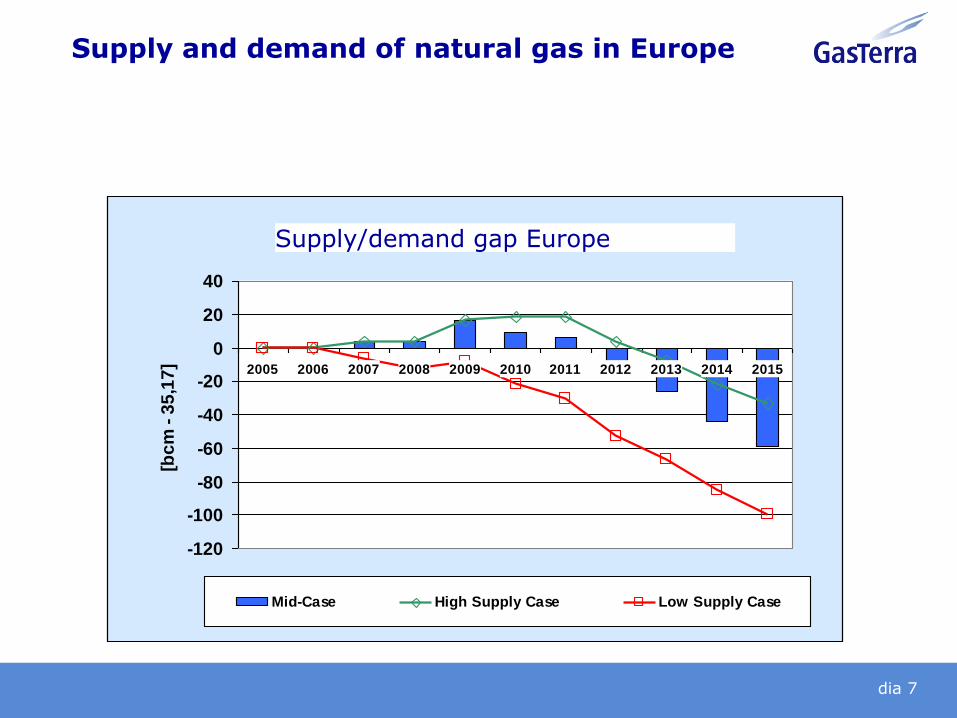
Supply and demand of natural gas in Europe
Verwacht overschot / tekort op Europese Gasbalans
-120
-100
-80
-60
-40
-20
0
20
40
2005 2006 2007 2008 2009 2010 2011 2012 2013 2014 2015
[bc
m -
35
,17
]
Mid-Case High Supply Case Low Supply Case
Supply/demand gap Europe
dia 8
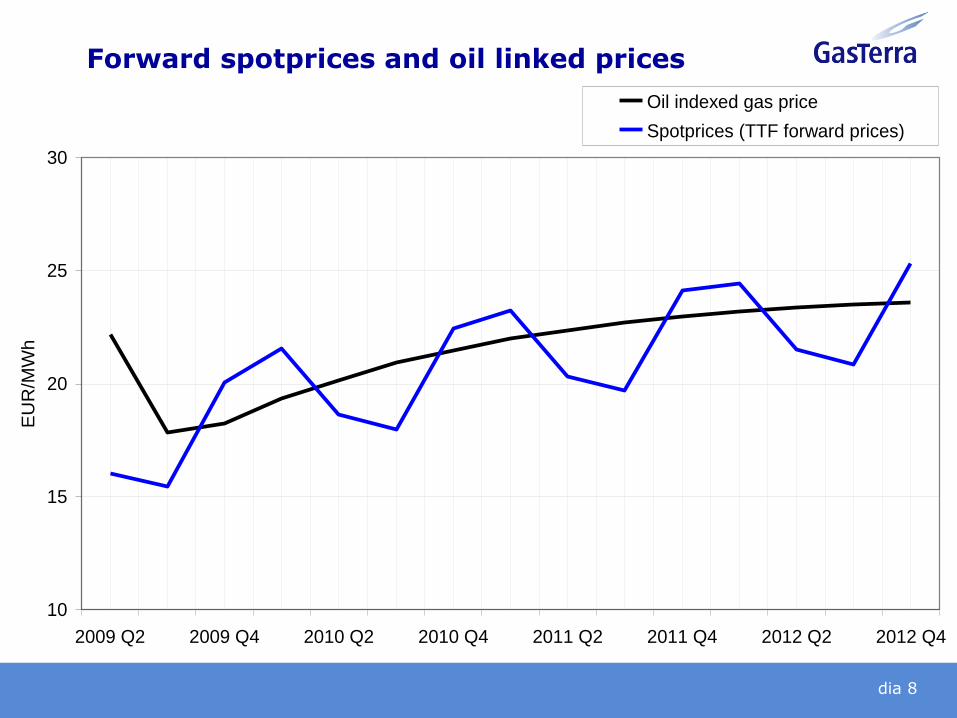
Forward spotprices and oil linked prices
10
15
20
25
30
2009 Q2 2009 Q4 2010 Q2 2010 Q4 2011 Q2 2011 Q4 2012 Q2 2012 Q4
EU
R/M
Wh
Oil indexed gas price
Spotprices (TTF forward prices)
dia 9
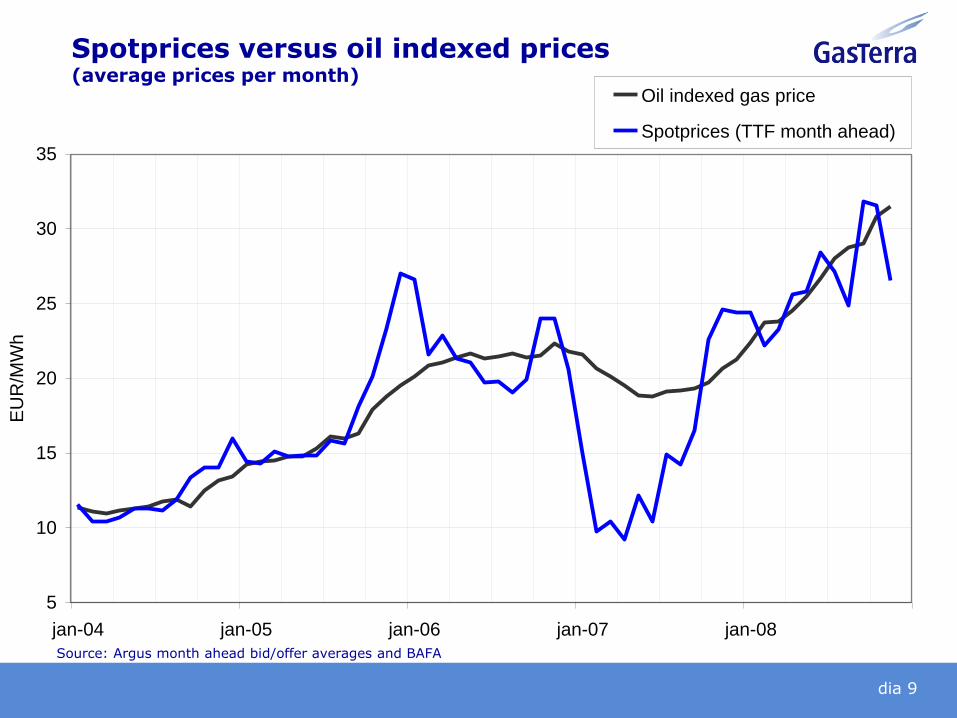
Spotprices versus oil indexed prices(average prices per month)
Source: Argus month ahead bid/offer averages and BAFA
5
10
15
20
25
30
35
jan-04 jan-05 jan-06 jan-07 jan-08
EU
R/M
Wh
Oil indexed gas price
Spotprices (TTF month ahead)
dia 10
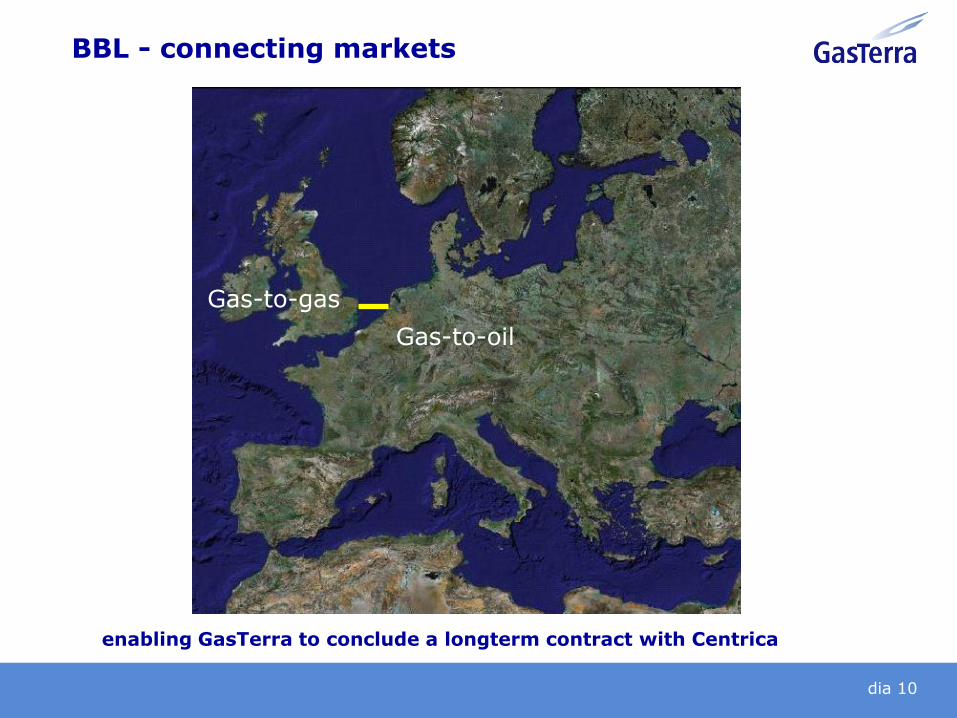
BBL - connecting markets
enabling GasTerra to conclude a longterm contract with Centrica
Gas-to-gas
Gas-to-oil
dia 11
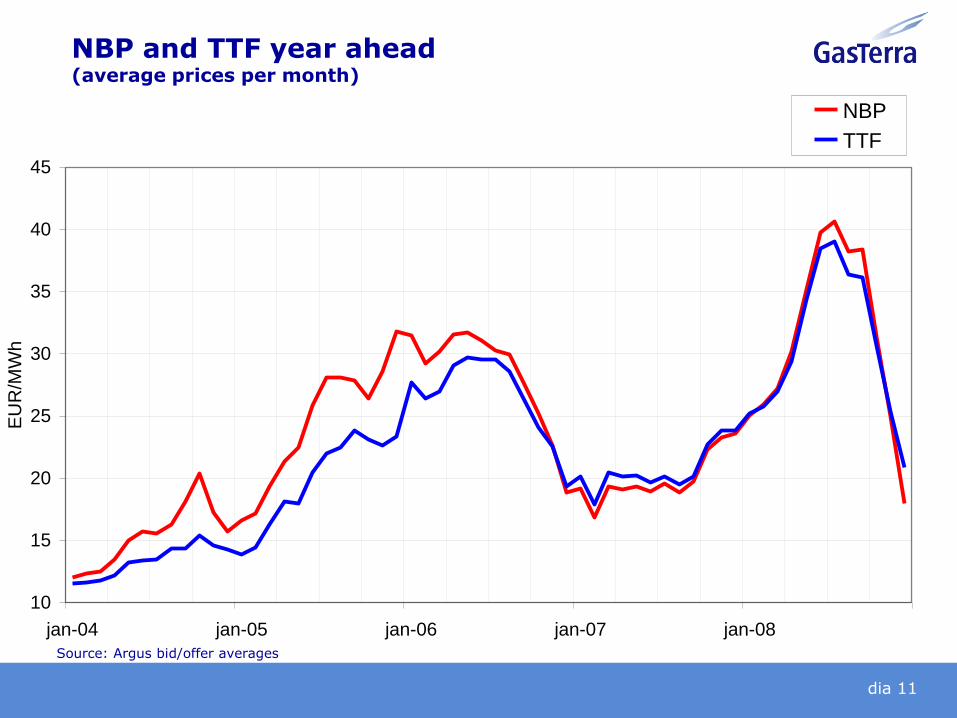
Source: Argus bid/offer averages
NBP and TTF year ahead (average prices per month)
10
15
20
25
30
35
40
45
jan-04 jan-05 jan-06 jan-07 jan-08
EU
R/M
Wh
NBP
TTF
dia 12
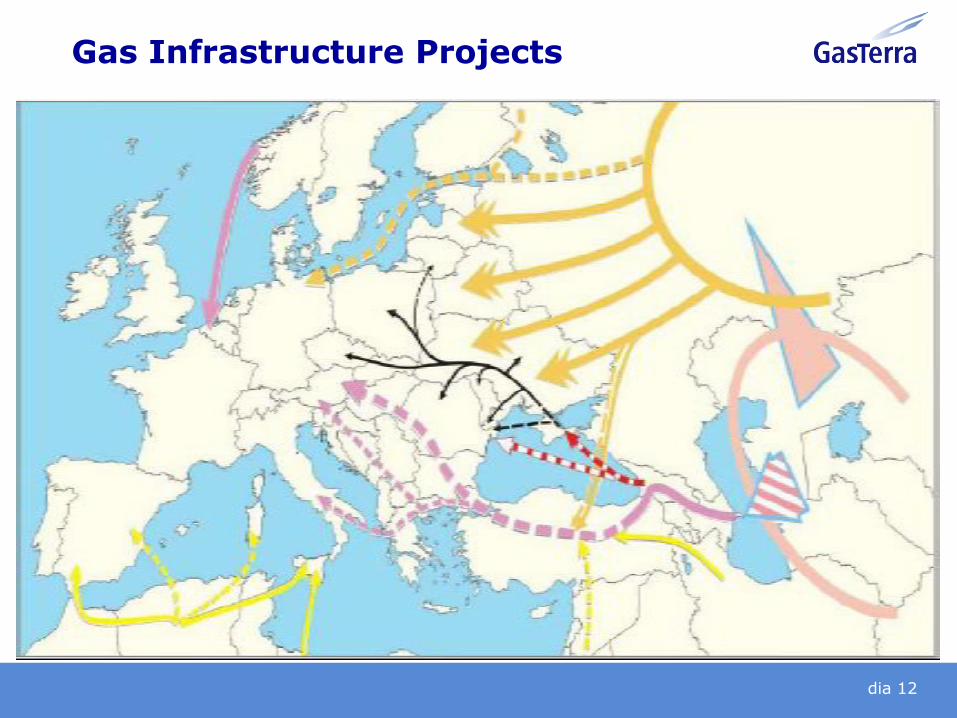
Gas Infrastructure Projects


![GasTerra OA 2018-2019 Final Clean - the ICE Agreement [contractLegalName] Definitions GasTerra OA 2018-2019 Final Clean.docx page 3 2.10 Gas Market Instrument Specifications refers](https://img.pdfslide.net/doc/110x75/5aa5cd157f8b9ae7438dfb5b/gasterra-oa-2018-2019-final-clean-the-ice-agreement-contractlegalname-definitions.jpg)