Embed Size (px)
Citation preview
1
Gates Industrial Reports First-Quarter 2020 Results
Denver, CO, May 5, 2020
First-Quarter 2020 Financial Summary
Net sales down 11.8% year-over-year to $710.1 million, representing a core revenue decline of 10.1%.
Net income attributable to shareholders of $35.6 million, or $0.12 per diluted share, compared to prior-year
net income attributable to shareholders of $613.7 million, or $2.08 per diluted share.
Adjusted Net Income of $61.6 million, or $0.21 per diluted share.
First-quarter Adjusted EBITDA of $120.8 million and Adjusted EBITDA margin of 17.0%.
Net cash provided by operations of $31.1 million with capital expenditures of $14.9 million, resulting in free
cash flow of $16.2 million.
Gates Industrial Corporation plc (NYSE:GTES), a leading global provider of application-specific fluid power and
power transmission solutions, today reported results for the first quarter ended March 28, 2020.
Ivo Jurek, Gates Industrial’s Chief Executive Officer, commented, “During these unprecedented times driven by the
COVID-19 pandemic, our primary objective is the health and safety of our employees, as well as the communities
in which we operate. The vast majority of our production facilities are currently operational and we are focused
on serving our customers, many of whom operate in essential industries. We believe that we have a resilient
business in a strong position to withstand the uncertainty, given the critical applications we support and our
business model that is focused on replacement channels. While we continue to operate around the world, we
expect the sharp reductions in economic activity and uncertain timing of the recovery will have a substantial
impact on our Q2 results, as well as those for the full year. As a result, we are withdrawing our previously issued
guidance for 2020 core revenue and Adjusted EBITDA.”
Jurek continued, “We are navigating the current environment in a strong financial position, with over $1.0 billion
of liquidity as of May 1, 2020, and no material debt principal payments until 2024. Where appropriate, we are
reducing production capacity and taking actions to reduce our controllable costs and discretionary spending.
Further, we have contingency plans in place for a variety of scenarios and, as this fluid situation continues to
evolve, will respond accordingly. We continue to expect strong Free Cash Flow generation, which has been
substantial in prior downturns. While COVID-19 is a developing situation, we believe our business is prepared for
the challenges ahead and well positioned to emerge stronger as the crisis abates.”
First-Quarter Financial Results
First-quarter net sales were $710.1 million, a decrease of 11.8% over the prior-year quarter net sales of
$804.9 million, including a core revenue decline of 10.1%. We estimate the COVID-19 pandemic negatively
impacted our revenues by approximately 7% on a core basis. After a solid start to the quarter, our business in
China experienced significant demand deterioration as a result of the COVID-19 pandemic, before beginning to
show signs of recovery late in the quarter. The industrial end market weakness in Europe and North America
continued, albeit to a lesser degree than expected, before demand in those regions was also negatively impacted
2
by COVID-19 late in the quarter. Sales into replacement channels outperformed those into first-fit channels,
which were negatively impacted by temporary suspensions of production by certain customers.
Net income attributable to shareholders in the first quarter of 2020 was $35.6 million, or $0.12 per diluted share,
compared to $613.7 million, or $2.08 per diluted share in the first quarter of 2019. Adjusted Net Income for the
first quarter of 2020 was $61.6 million, or $0.21 per diluted share, compared to $82.4 million, or $0.28 per diluted
share in the first quarter of 2019. The diluted weighted average number of shares outstanding in the first quarter
of 2020 was 292,111,253 compared to 294,661,913 in the first quarter of 2019.
First-quarter Adjusted EBITDA was $120.8 million, or 17.0% of net sales, compared to $165.5 million, or 20.6% of
net sales in the prior-year quarter. The contraction in Adjusted EBITDA margin was driven by the lower sales and
production volumes in the quarter.
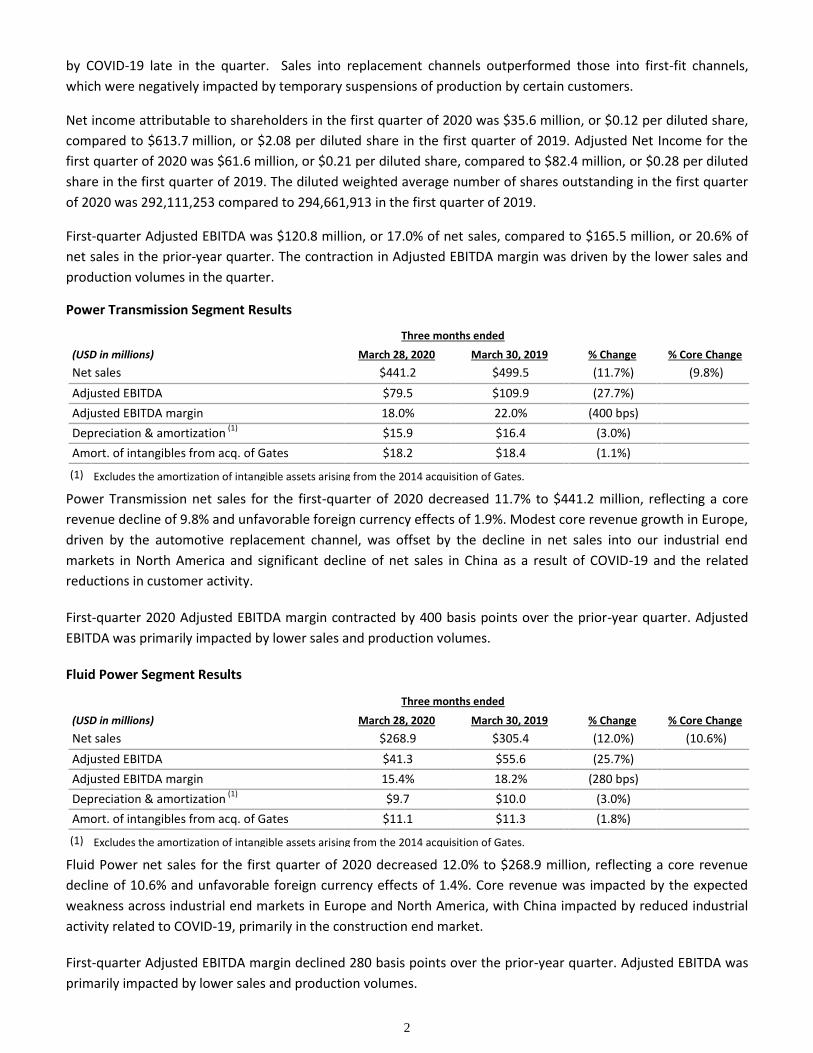
Power Transmission Segment Results
Three months ended
(USD in millions) March 28, 2020 March 30, 2019 % Change % Core Change
Net sales $441.2 $499.5 (11.7%) (9.8%)
Adjusted EBITDA $79.5 $109.9 (27.7%)
Adjusted EBITDA margin 18.0% 22.0% (400 bps)
Depreciation & amortization (1)
$15.9 $16.4 (3.0%)
Amort. of intangibles from acq. of Gates $18.2 $18.4 (1.1%)
(1) Excludes the amortization of intangible assets arising from the 2014 acquisition of Gates.
Power Transmission net sales for the first-quarter of 2020 decreased 11.7% to $441.2 million, reflecting a core
revenue decline of 9.8% and unfavorable foreign currency effects of 1.9%. Modest core revenue growth in Europe,
driven by the automotive replacement channel, was offset by the decline in net sales into our industrial end
markets in North America and significant decline of net sales in China as a result of COVID-19 and the related
reductions in customer activity.
First-quarter 2020 Adjusted EBITDA margin contracted by 400 basis points over the prior-year quarter. Adjusted
EBITDA was primarily impacted by lower sales and production volumes.
Fluid Power Segment Results
Three months ended
(USD in millions) March 28, 2020 March 30, 2019 % Change % Core Change
Net sales $268.9 $305.4 (12.0%) (10.6%)
Adjusted EBITDA $41.3 $55.6 (25.7%)
Adjusted EBITDA margin 15.4% 18.2% (280 bps)
Depreciation & amortization (1)
$9.7 $10.0 (3.0%)
Amort. of intangibles from acq. of Gates $11.1 $11.3 (1.8%)
(1) Excludes the amortization of intangible assets arising from the 2014 acquisition of Gates.
Fluid Power net sales for the first quarter of 2020 decreased 12.0% to $268.9 million, reflecting a core revenue
decline of 10.6% and unfavorable foreign currency effects of 1.4%. Core revenue was impacted by the expected
weakness across industrial end markets in Europe and North America, with China impacted by reduced industrial
activity related to COVID-19, primarily in the construction end market.
First-quarter Adjusted EBITDA margin declined 280 basis points over the prior-year quarter. Adjusted EBITDA was
primarily impacted by lower sales and production volumes.
3
Liquidity and Capital Resources
During the first quarter of 2020, the Company generated $31.1 million of cash from operations, with lower
Adjusted EBITDA offset by lower working capital levels compared to the first quarter of 2019. Capital expenditures
in the first quarter of 2020 declined slightly to $14.9 million from $22.9 million in the prior-year period.
As of March 28, 2020, the Company had total cash and cash equivalents of $626.3 million and total outstanding
debt of $3.0 billion. The Company had total liquidity of $1,066.6 million, which was comprised of the cash balance
and $440.3 million of availability under revolving credit facilities, and no material maturities of current borrowings
until 2024.
2020 Outlook
The Company is withdrawing its full-year 2020 core revenue and Adjusted EBITDA guidance due to an inability to
predict the extent and duration of the unprecedented actions taken globally to limit the spread of the COVID-19
pandemic, which are likely to have a material impact. The Company currently expects total capital expenditures of
approximately $70 million and Free Cash Flow Conversion to be greater than 100% of Adjusted Net Income.
Conference Call and Webcast
Gates Industrial Corporation plc will host a conference call today at 5:00 pm ET to discuss the Company’s financial
results. The live webcast of the conference call and accompanying presentation materials can be accessed
through Gates Industrial’s website at investors.gates.com. Due to potential extended wait times to access the
conference call via dial-in, the Company encourages use of the webcast. For those unable to access the webcast,
the conference call can be accessed by dialing (866) 393-4306 (domestic) or +1 (734) 385-2616 (international) and
requesting the Gates Industrial Corporation First Quarter 2020 Earnings Conference Call. An audio replay of the
conference call can be accessed by dialing (855) 859-2056 (domestic) or +1 (404) 537-3406 (international), and
providing the passcode 5779379, or by accessing Gates Industrial’s website at investors.gates.com.
About Gates Industrial Corporation plc
Gates is a global manufacturer of innovative, highly engineered power transmission and fluid power solutions.
Gates offers a broad portfolio of products to diverse replacement channel customers, and to original equipment
(“first-fit”) manufacturers as specified components. Gates participates in many sectors of the industrial and
consumer markets. Our products play essential roles in a diverse range of applications across a wide variety of
end markets ranging from harsh and hazardous industries such as agriculture, construction, manufacturing and
energy, to everyday consumer applications such as printers, power washers, automatic doors and vacuum
cleaners and virtually every form of transportation. Our products are sold in more than 120 countries across our
four commercial regions: the Americas; Europe, Middle East & Africa; Greater China; and East Asia & India.
4
Forward-Looking Statements
This press release contains forward-looking statements within the meaning of Section 27A of the Securities Act of
1933, as amended, and Section 21E of the Securities Exchange Act of 1934, as amended. In some cases, you can
identify these forward-looking statements by the use of words such as ”outlook,” ”believes,” ”expects,”
”potential,” ”continues,” ”may,” “will,” “should,” ”could,” “seeks,” “projects,” ”predicts,” ”intends,” ”plans,”
”estimates,” ”anticipates” or the negative version of these words or other comparable words. These statements
include, but are not limited to, statements related to expectations regarding the performance of the Company’s
business, financial results, liquidity and capital resources, statements regarding the future impact of the COVID-19
pandemic, and the statements in the “2020 Outlook” section of this press release. Such forward-looking
statements are subject to various risks and uncertainties, including, among others, the uncertainties relating to the
impact of the COVID-19 pandemic and associated governmental measures on the company's business, operations,
employees, financial condition and results of operations, risks inherent to the manufacturing industry,
macroeconomic factors beyond the Company’s control, continued operation of our manufacturing facilities,our
ability to forecast and meet demand, market acceptance of new products, and the significant influence of the
Company’s majority shareholders, investment funds affiliated with The Blackstone Group Inc. Additional factors
that could cause the Company’s results to differ materially from those described in the forward-looking
statements can be found under the section entitled ”Risk Factors” of the Company’s Annual Report on Form 10-K
for the fiscal year ended December 28, 2019, filed with the Securities and Exchange Commission (”SEC”), as will be
supplemented by the risks and uncertainties set forth in the Company’s Quarterly Report on Form 10-Q for the
quarter ended March 28, 2020, as such factors may be further updated from time to time in the Company’s
periodic filings with the SEC, which are accessible on the SEC’s website at www.sec.gov. Accordingly, there are or
will be important factors that could cause actual outcomes or results to differ materially from those indicated in
these statements. These factors should not be construed as exhaustive and should be read in conjunction with the
other cautionary statements that are included in the Company’s filings with the SEC. The Company undertakes no
obligation to publicly update or review any forward-looking statement, whether as a result of new information,
future developments or otherwise, except as required by law.
5
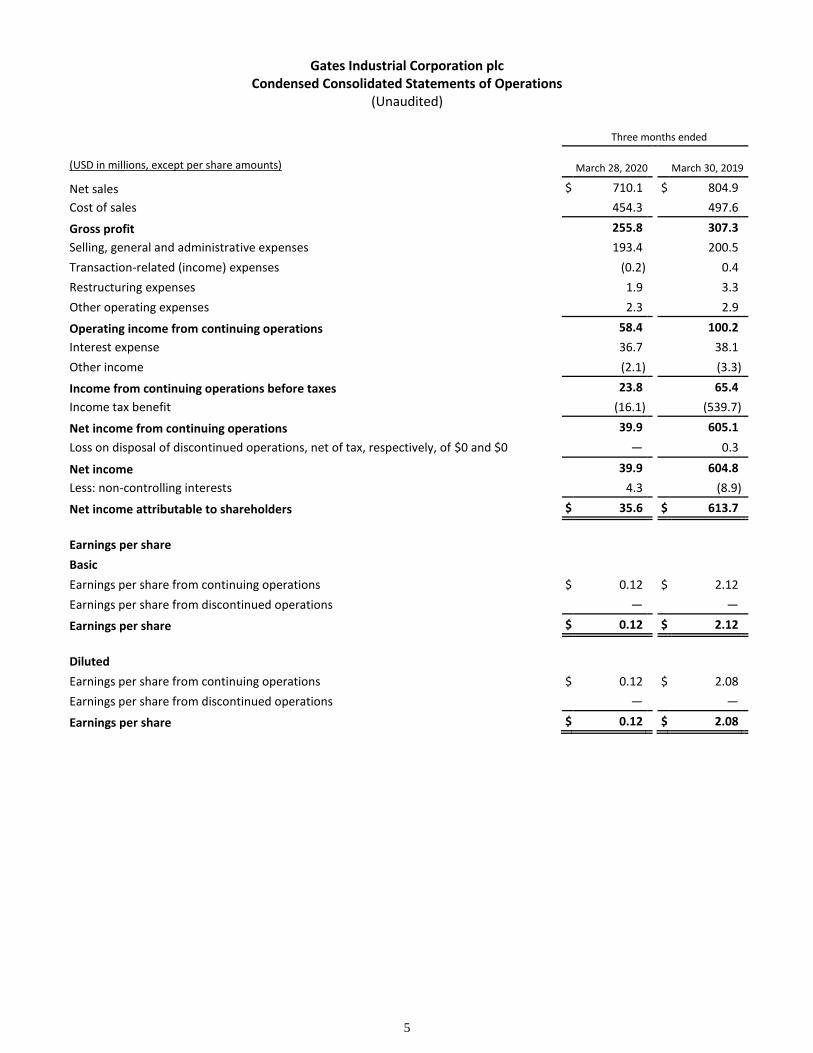
Gates Industrial Corporation plc Condensed Consolidated Statements of Operations
(Unaudited)
Three months ended
(USD in millions, except per share amounts) March 28, 2020 March 30, 2019
Net sales $ 710.1 $ 804.9
Cost of sales 454.3 497.6
Gross profit 255.8 307.3
Selling, general and administrative expenses 193.4 200.5
Transaction-related (income) expenses (0.2) 0.4
Restructuring expenses 1.9 3.3
Other operating expenses 2.3 2.9
Operating income from continuing operations 58.4 100.2
Interest expense 36.7 38.1
Other income (2.1) (3.3)
Income from continuing operations before taxes 23.8 65.4
Income tax benefit (16.1) (539.7)
Net income from continuing operations 39.9 605.1
Loss on disposal of discontinued operations, net of tax, respectively, of $0 and $0 — 0.3
Net income 39.9 604.8
Less: non-controlling interests 4.3 (8.9)
Net income attributable to shareholders $ 35.6 $ 613.7
Earnings per share
Basic
Earnings per share from continuing operations $ 0.12 $ 2.12
Earnings per share from discontinued operations — —
Earnings per share $ 0.12 $ 2.12
Diluted
Earnings per share from continuing operations $ 0.12 $ 2.08
Earnings per share from discontinued operations — —
Earnings per share $ 0.12 $ 2.08
6
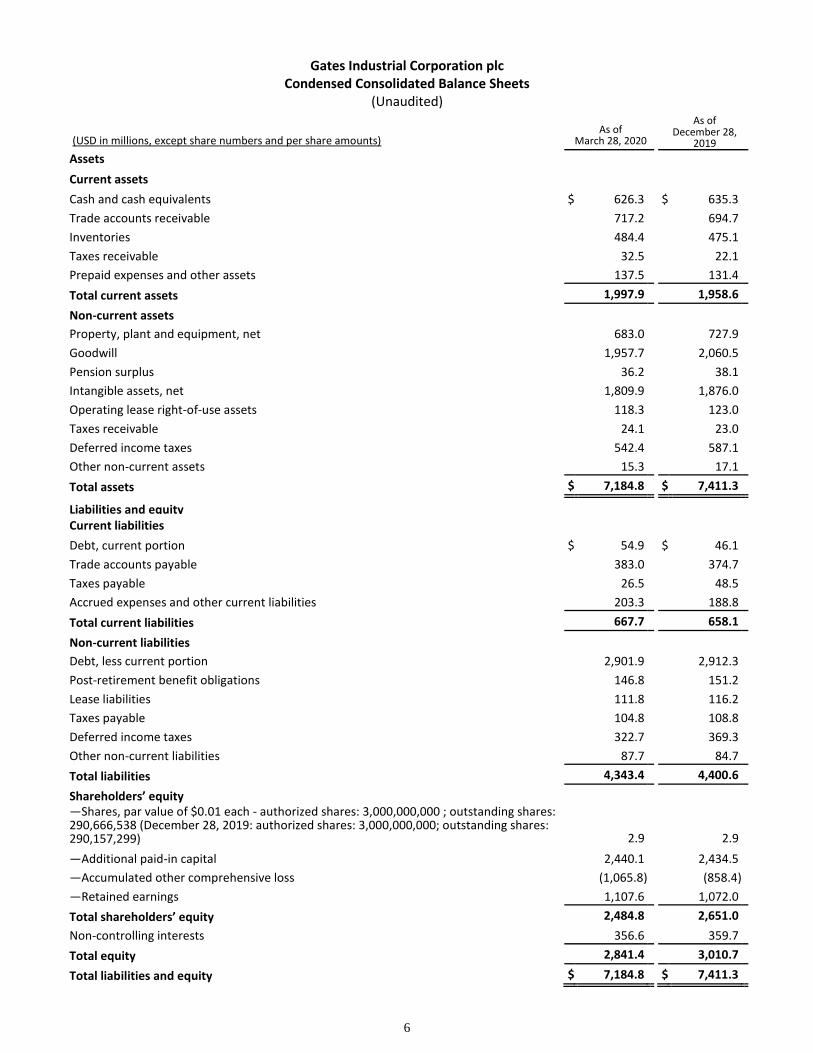
Gates Industrial Corporation plc Condensed Consolidated Balance Sheets
(Unaudited)
(USD in millions, except share numbers and per share amounts) As of
March 28, 2020
As of December 28,
2019
Assets
Current assets
Cash and cash equivalents $ 626.3 $ 635.3 Trade accounts receivable 717.2 694.7 Inventories 484.4 475.1 Taxes receivable 32.5 22.1 Prepaid expenses and other assets 137.5 131.4
Total current assets 1,997.9 1,958.6
Non-current assets
Property, plant and equipment, net 683.0 727.9 Goodwill 1,957.7 2,060.5 Pension surplus 36.2 38.1 Intangible assets, net 1,809.9 1,876.0 Operating lease right-of-use assets 118.3 123.0 Taxes receivable 24.1 23.0 Deferred income taxes 542.4 587.1 Other non-current assets 15.3 17.1
Total assets $ 7,184.8 $ 7,411.3
Liabilities and equity Current liabilities
Debt, current portion $ 54.9 $ 46.1 Trade accounts payable 383.0 374.7 Taxes payable 26.5 48.5 Accrued expenses and other current liabilities 203.3 188.8
Total current liabilities 667.7 658.1
Non-current liabilities
Debt, less current portion 2,901.9 2,912.3 Post-retirement benefit obligations 146.8 151.2 Lease liabilities 111.8 116.2 Taxes payable 104.8 108.8 Deferred income taxes 322.7 369.3 Other non-current liabilities 87.7 84.7
Total liabilities 4,343.4 4,400.6
Shareholders’ equity —Shares, par value of $0.01 each - authorized shares: 3,000,000,000 ; outstanding shares: 290,666,538 (December 28, 2019: authorized shares: 3,000,000,000; outstanding shares: 290,157,299) 2.9 2.9
—Additional paid-in capital 2,440.1 2,434.5 —Accumulated other comprehensive loss (1,065.8) (858.4) —Retained earnings 1,107.6 1,072.0
Total shareholders’ equity 2,484.8 2,651.0
Non-controlling interests 356.6 359.7
Total equity 2,841.4 3,010.7
Total liabilities and equity $ 7,184.8 $ 7,411.3
7
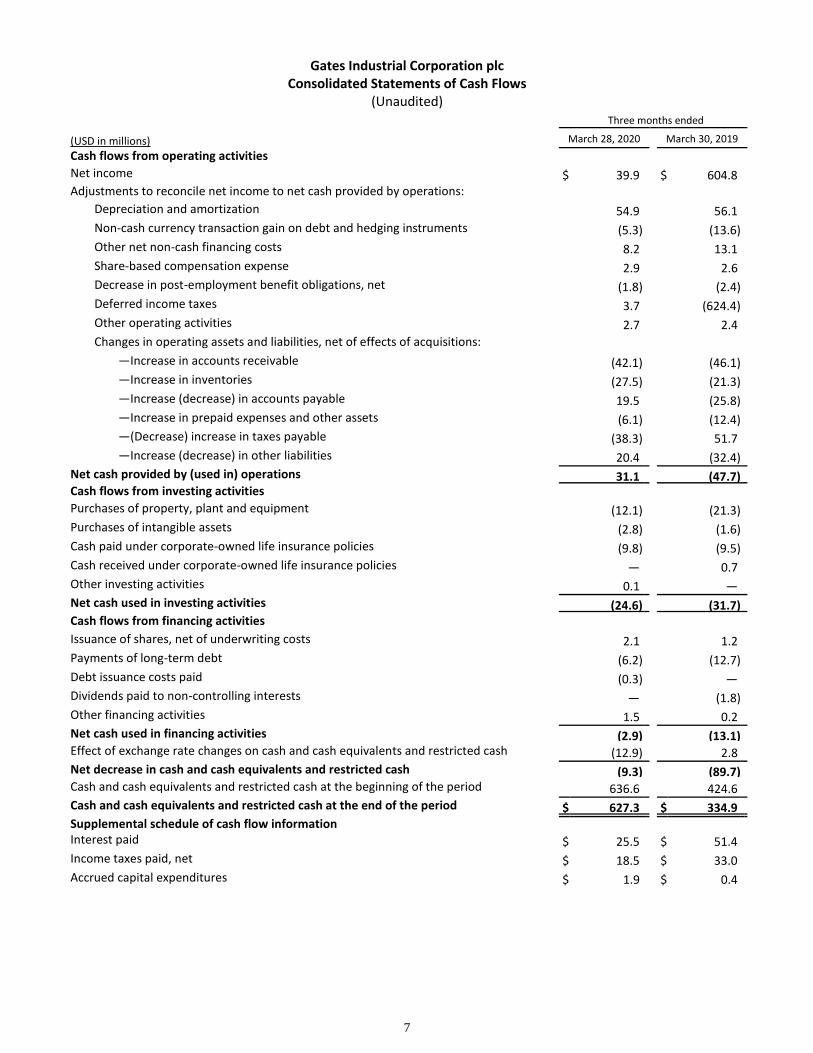
Gates Industrial Corporation plc Consolidated Statements of Cash Flows
(Unaudited)
Three months ended
(USD in millions) March 28, 2020 March 30, 2019 Cash flows from operating activities Net income $ 39.9 $ 604.8 Adjustments to reconcile net income to net cash provided by operations:
Depreciation and amortization 54.9 56.1 Non-cash currency transaction gain on debt and hedging instruments (5.3) (13.6) Other net non-cash financing costs 8.2 13.1 Share-based compensation expense 2.9 2.6 Decrease in post-employment benefit obligations, net (1.8) (2.4) Deferred income taxes 3.7 (624.4) Other operating activities 2.7 2.4 Changes in operating assets and liabilities, net of effects of acquisitions:
—Increase in accounts receivable (42.1) (46.1) —Increase in inventories (27.5) (21.3) —Increase (decrease) in accounts payable 19.5 (25.8) —Increase in prepaid expenses and other assets (6.1) (12.4) —(Decrease) increase in taxes payable (38.3) 51.7 —Increase (decrease) in other liabilities 20.4 (32.4)
Net cash provided by (used in) operations 31.1 (47.7) Cash flows from investing activities Purchases of property, plant and equipment (12.1) (21.3) Purchases of intangible assets (2.8) (1.6) Cash paid under corporate-owned life insurance policies (9.8) (9.5) Cash received under corporate-owned life insurance policies — 0.7 Other investing activities 0.1 — Net cash used in investing activities (24.6) (31.7) Cash flows from financing activities Issuance of shares, net of underwriting costs 2.1 1.2 Payments of long-term debt (6.2) (12.7) Debt issuance costs paid (0.3) — Dividends paid to non-controlling interests — (1.8) Other financing activities 1.5 0.2 Net cash used in financing activities (2.9) (13.1) Effect of exchange rate changes on cash and cash equivalents and restricted cash (12.9) 2.8 Net decrease in cash and cash equivalents and restricted cash (9.3) (89.7) Cash and cash equivalents and restricted cash at the beginning of the period 636.6 424.6 Cash and cash equivalents and restricted cash at the end of the period $ 627.3 $ 334.9 Supplemental schedule of cash flow information Interest paid $ 25.5 $ 51.4 Income taxes paid, net $ 18.5 $ 33.0 Accrued capital expenditures $ 1.9 $ 0.4
8
Non-GAAP Financial Statements
This press release includes certain non-GAAP financial measures, which management believes are useful to
investors, securities analysts and other interested parties. Management uses Adjusted EBITDA as its key
profitability measure. This is a non-GAAP measure that represents EBITDA before certain items that impact
comparison of the performance of our business either period-over-period or with other businesses. We use
Adjusted EBITDA as our measure of segment profitability to assess the performance of our businesses, and it is
used for total Gates as well because we believe it is important to consider our total profitability on a basis that is
consistent with that of our operating segments. Adjusted EBITDA Margin is Adjusted EBITDA for a particular period
expressed as a percentage of revenues for that period.
Management uses Adjusted Net Income as an additional measure of profitability. Adjusted Net Income is a non-
GAAP measure that represents net income attributable to shareholders before certain items that impact
comparison of the performance of our business, either period-over-period or with other businesses.
Core revenue growth is a non-GAAP measure that represents net sales for the period excluding the impacts of
movements in foreign currency rates and the first-year impacts of acquisitions and disposals, where applicable.
We present core revenue growth because it allows for a meaningful comparison of year-over-year performance
without the volatility caused by foreign currency gains or losses, or the incomparability that would be caused by
the impact of an acquisition or disposal.
Management uses Free Cash Flow to measure cash generation and liquidity. Free Cash Flow is a non-GAAP
measure that represents net cash provided by operations less capital expenditures. Free Cash Flow Conversion is a
measure of Free Cash Flow expressed as a percentage of Adjusted Net Income. We use this metric as a measure of
the success of our business in converting Adjusted Net Income into cash.
These non-GAAP financial measures should be considered only as supplemental to, and not as superior to,
financial measures prepared in accordance with GAAP. Please see below for a reconciliation of historical non-
GAAP financial measures to the most directly comparable financial measures prepared in accordance with GAAP.
Because GAAP financial measures on a forward-looking basis are not accessible, and reconciling information is not
available without unreasonable effort, we have not provided reconciliations for forward-looking non-GAAP
measures. For the same reasons, we are unable to address the probable significance of the unavailable
information, which could be material to future results.
9
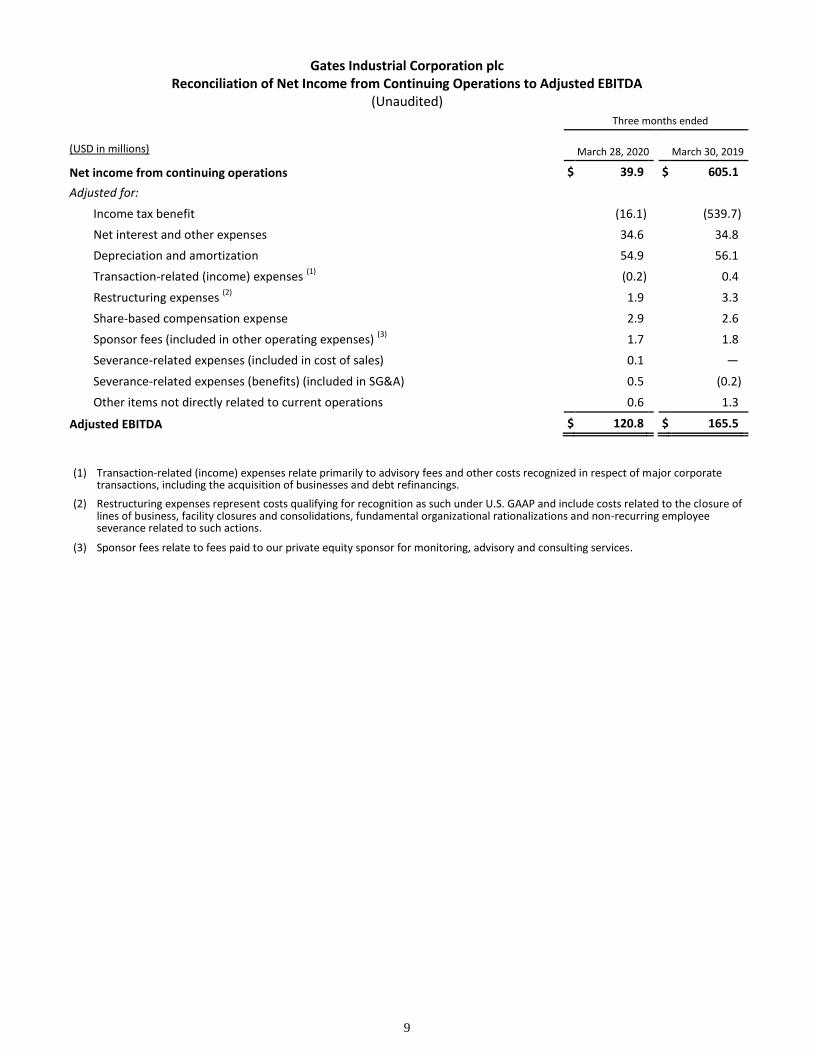
Gates Industrial Corporation plc Reconciliation of Net Income from Continuing Operations to Adjusted EBITDA
(Unaudited)
Three months ended
(USD in millions) March 28, 2020 March 30, 2019
Net income from continuing operations $ 39.9 $ 605.1
Adjusted for:
Income tax benefit (16.1) (539.7)
Net interest and other expenses 34.6 34.8
Depreciation and amortization 54.9 56.1
Transaction-related (income) expenses (1)
(0.2) 0.4
Restructuring expenses (2)
1.9 3.3
Share-based compensation expense 2.9 2.6
Sponsor fees (included in other operating expenses) (3)
1.7 1.8
Severance-related expenses (included in cost of sales) 0.1 —
Severance-related expenses (benefits) (included in SG&A) 0.5 (0.2)
Other items not directly related to current operations 0.6 1.3
Adjusted EBITDA $ 120.8 $ 165.5
(1) Transaction-related (income) expenses relate primarily to advisory fees and other costs recognized in respect of major corporate transactions, including the acquisition of businesses and debt refinancings.
(2) Restructuring expenses represent costs qualifying for recognition as such under U.S. GAAP and include costs related to the closure of lines of business, facility closures and consolidations, fundamental organizational rationalizations and non-recurring employee severance related to such actions.
(3) Sponsor fees relate to fees paid to our private equity sponsor for monitoring, advisory and consulting services.
10
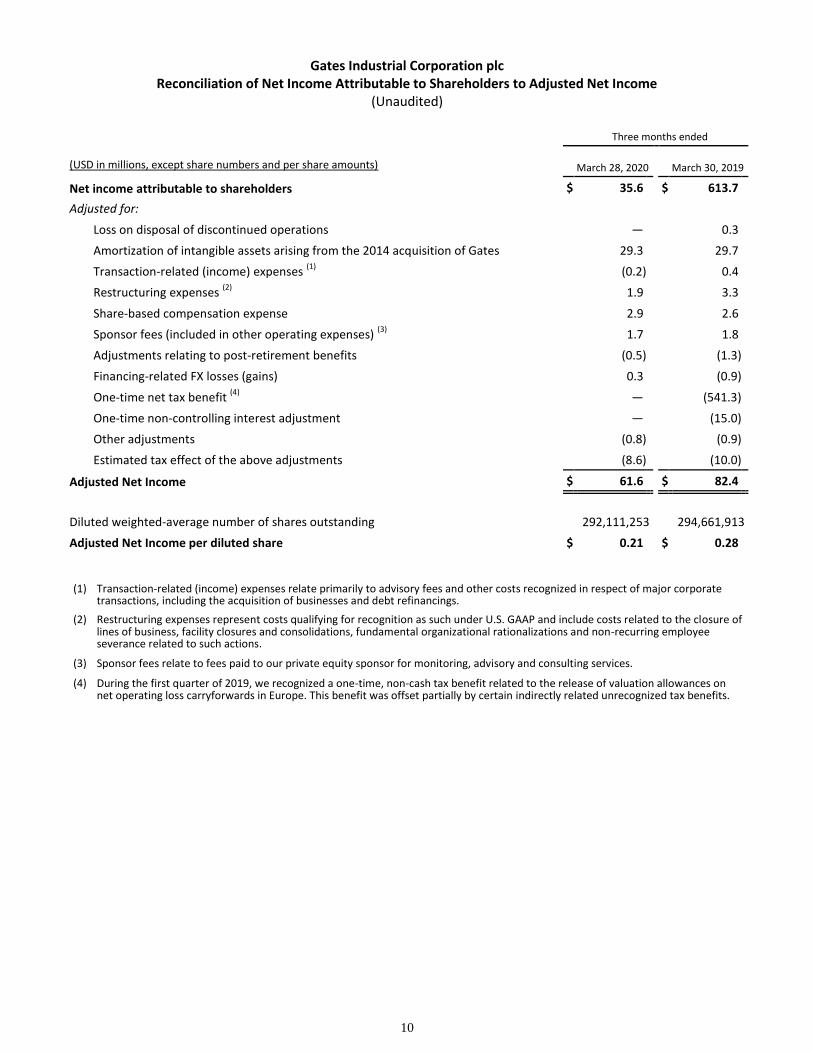
Gates Industrial Corporation plc Reconciliation of Net Income Attributable to Shareholders to Adjusted Net Income
(Unaudited)
Three months ended
(USD in millions, except share numbers and per share amounts) March 28, 2020 March 30, 2019
Net income attributable to shareholders $ 35.6 $ 613.7
Adjusted for:
Loss on disposal of discontinued operations — 0.3
Amortization of intangible assets arising from the 2014 acquisition of Gates 29.3 29.7
Transaction-related (income) expenses (1)
(0.2) 0.4
Restructuring expenses (2)
1.9 3.3
Share-based compensation expense 2.9 2.6
Sponsor fees (included in other operating expenses) (3)
1.7 1.8
Adjustments relating to post-retirement benefits (0.5) (1.3)
Financing-related FX losses (gains) 0.3 (0.9)
One-time net tax benefit (4)
— (541.3)
One-time non-controlling interest adjustment — (15.0)
Other adjustments (0.8) (0.9)
Estimated tax effect of the above adjustments (8.6) (10.0)
Adjusted Net Income $ 61.6 $ 82.4
Diluted weighted-average number of shares outstanding 292,111,253 294,661,913
Adjusted Net Income per diluted share $ 0.21 $ 0.28
(1) Transaction-related (income) expenses relate primarily to advisory fees and other costs recognized in respect of major corporate transactions, including the acquisition of businesses and debt refinancings.
(2) Restructuring expenses represent costs qualifying for recognition as such under U.S. GAAP and include costs related to the closure of lines of business, facility closures and consolidations, fundamental organizational rationalizations and non-recurring employee severance related to such actions.
(3) Sponsor fees relate to fees paid to our private equity sponsor for monitoring, advisory and consulting services.
(4) During the first quarter of 2019, we recognized a one-time, non-cash tax benefit related to the release of valuation allowances on net operating loss carryforwards in Europe. This benefit was offset partially by certain indirectly related unrecognized tax benefits.
11
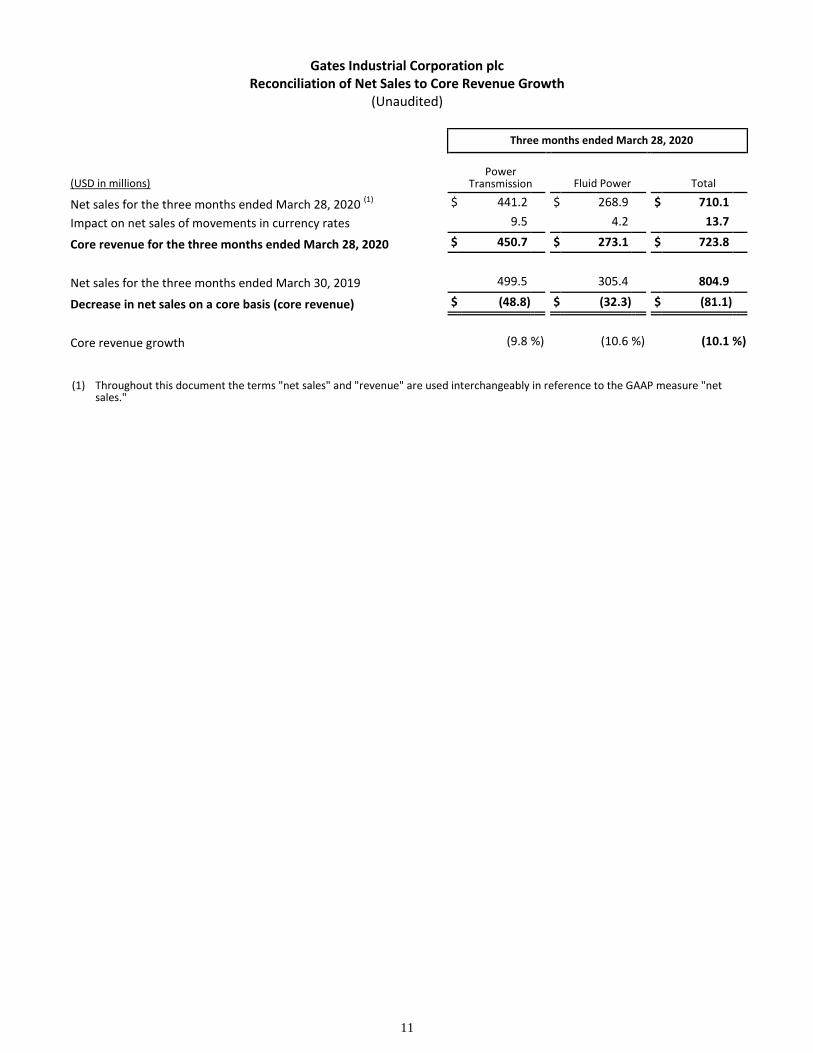
Gates Industrial Corporation plc Reconciliation of Net Sales to Core Revenue Growth
(Unaudited)
Three months ended March 28, 2020
(USD in millions) Power
Transmission Fluid Power Total
Net sales for the three months ended March 28, 2020 (1)
$ 441.2 $ 268.9 $ 710.1
Impact on net sales of movements in currency rates 9.5 4.2 13.7
Core revenue for the three months ended March 28, 2020 $ 450.7 $ 273.1 $ 723.8
Net sales for the three months ended March 30, 2019 499.5 305.4 804.9
Decrease in net sales on a core basis (core revenue) $ (48.8) $ (32.3) $ (81.1)
Core revenue growth (9.8 %) (10.6 %) (10.1 %)
(1) Throughout this document the terms "net sales" and "revenue" are used interchangeably in reference to the GAAP measure "net sales."
12
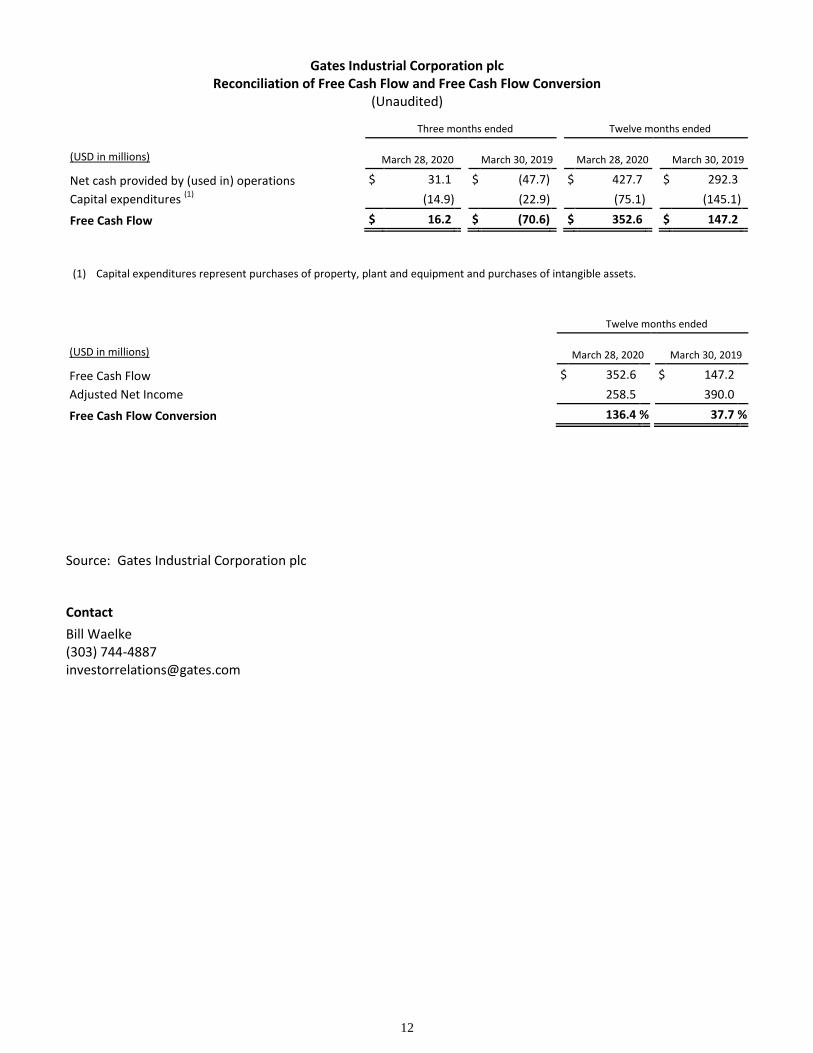
Gates Industrial Corporation plc Reconciliation of Free Cash Flow and Free Cash Flow Conversion
(Unaudited)
Three months ended Twelve months ended
(USD in millions) March 28, 2020 March 30, 2019 March 28, 2020 March 30, 2019
Net cash provided by (used in) operations $ 31.1 $ (47.7) $ 427.7 $ 292.3
Capital expenditures (1)
(14.9) (22.9) (75.1) (145.1)
Free Cash Flow $ 16.2 $ (70.6) $ 352.6 $ 147.2
(1) Capital expenditures represent purchases of property, plant and equipment and purchases of intangible assets.
Twelve months ended
(USD in millions) March 28, 2020 March 30, 2019
Free Cash Flow $ 352.6 $ 147.2
Adjusted Net Income 258.5 390.0
Free Cash Flow Conversion 136.4 % 37.7 %
Source: Gates Industrial Corporation plc
Contact
Bill Waelke (303) 744-4887 [email protected]


![Brighteon.com Bill Gates go to Bill Gates. · 2020. 10. 27. · To get detailed information on Bill Gates go to CorbettReport.com and search for Bill Gates.] Mark Of The Beast WARNING!](https://img.pdfslide.net/doc/110x75/60a08e11b106674f4d152bba/bill-gates-go-to-bill-gates-2020-10-27-to-get-detailed-information-on-bill.jpg)