Embed Size (px)
Citation preview
GAUTENG DEPARTMENT OF HEALTH
DOES PRIMARY HEALTH CARE FACILITIES SUPPORTED BY DEVELOPMENT PARTNERS DO ANY BETTER IN M&E?
‘’Preliminary Findings of a Data Assessment Baseline ’’
1
Adelekan Tsholofelo †, Elvis Ganyaupfu ‡ Anzél Schönfeldt‡ †Gauteng Department of Health, Johannesburg, South Africa ‡John Snow Inc., Pretoria, South Africa

OBJECTIVE
To compare the quality of data generated at PHC sites receiving direct support versus technical assistance.
Provide background on Partnership practices
Use current collaboration with SIFSA as a case study
to demonstrate M&E partnership aimed at providing evidence on current gaps in performance data management
to contribute to evidence based decision making and improve accountability
2

Motivation
Pressure to generate quality data to guide health programmes
Increased need to demonstrate results and maximise use of current resources
Qualified audit outcomes in three consecutive years on non financial data
The need to improve public confidence and obtain a clean audit on Non financial data
3
BACKGROUND
Motivation

Partnerships takes many forms based on mutually agreed objectives
explicit capacity building (Brinkerhoff, 2002),
promoting health and preventing diseases and injury (Mays P, Scutchfield D, 2010)
Guided by USG and SAG framework
BACKGROUND
Current partnership practices between Development Partners and GDOH.
4

Role played by Development partners in Health Systems Strengthening include:
Migration of ART monitoring system from paper based to electronic form with implementation in 90% of facilities
Support in the implementation of PMTCT leading to 86% reduction in MTCT
61 Medical Male Circumcision sites run by partners versus 15 by province
Capacity Building and Social Mobilisation programmes
M&E systems and Data management strengthening efforts
BACKGROUND
5
SCOPE OF WORK AND KEY MILESTONES OF PARTNERSHIPS

What is:
The status of data quality and data management systems in all GDOH Health Facilities
Staffing Capacity at health institutions involved with direct data management
Is there any differences between facilities receiving direct service delivery versus technical assistance
Are facilities following the DHMIS policy and implementing introduced Rationalised Registers
KEY QUESTIONS
Sampling framework
All 377 PHC facilities
Preliminary results for 166 facilities
Data Collection
Pre-programmed Recount and Systems and Staffing tool
Preliminary Analysis
Desktop Analysis of the MOUs signed by Development partners
Summary Statistic
T-test
METHODS
CASE STUDY: BASELINE EVALUATION ON DATA MANAGEMENT SYSTEMS GDOH AND SIFSA PARTNERSHIP TO STRENGTHEN MONITORING AND EVALUATION
6

CASE STUDY: BASELINE EVALUATION ON DATA MANAGEMENT SYSTEMS PROCESS MAP ILLUSTRAITING METHODS
7

PRELIMINARY FINDINGS OF PERFORMANCE INFORMATION BASELINE EVALUATION
8
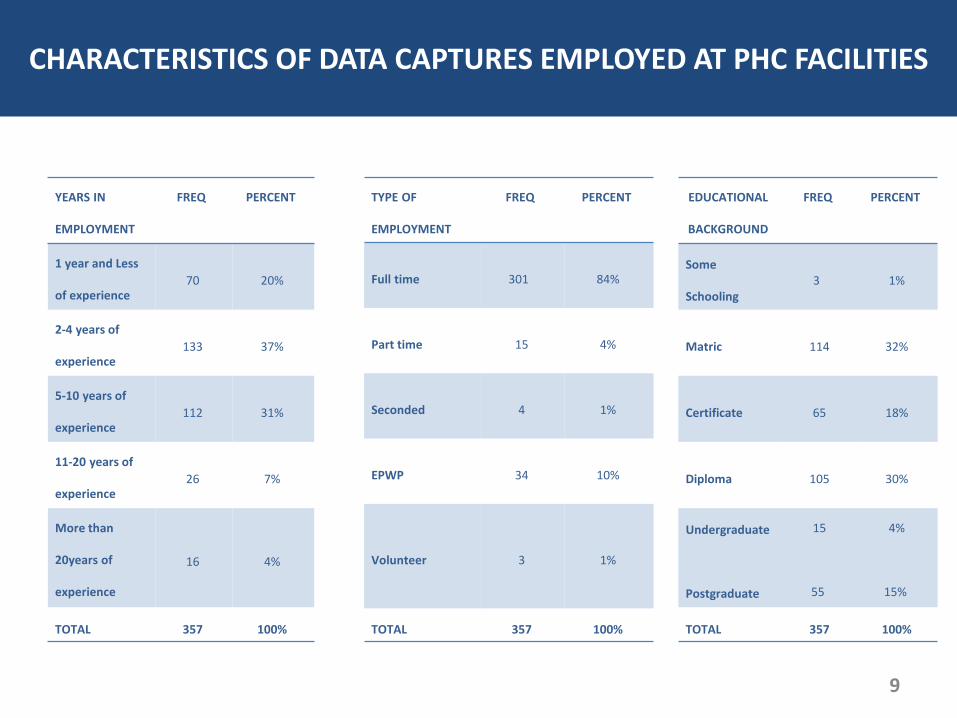
CHARECTERISTICS OF DATA CAPTURES
YEARS IN
EMPLOYMENT
FREQ PERCENT
1 year and Less
of experience 70 20%
2-4 years of
experience 133 37%
5-10 years of
experience 112 31%
11-20 years of
experience 26 7%
More than
20years of
experience
16 4%
TOTAL 357 100%
EDUCATIONAL
BACKGROUND
FREQ PERCENT
Some
Schooling 3 1%
Matric 114 32%
Certificate 65 18%
Diploma 105 30%
Undergraduate
Postgraduate
15
55
4%
15%
TOTAL 357 100%
TYPE OF
EMPLOYMENT
FREQ PERCENT
Full time 301 84%
Part time 15 4%
Seconded 4 1%
EPWP 34 10%
Volunteer 3 1%
TOTAL 357 100%
CHARACTERISTICS OF DATA CAPTURES EMPLOYED AT PHC FACILITIES
9

CHARECTERISTICS OF DATA CAPTURES District Name Total Number
of Sub Districts
Total Number
of Facilities1
Total Number of
Data captures
City of Johannesburg
Metropolitan
Municipality
6 48/89 123
Ekurhuleni Metropolitan
Municipality 5 31/57 127
City of Tshwane
Metropolitan
Municipality
7 34/61 83
West Rand District
Municipality 4 35/48 121
Sedibeng District
Municipality
2 26/33 81
1. Total number of facilities `versus number surveyed
CHARACTERISTICS OF DATA CAPTURES EMPLOYED AT PHC FACILITIES DISTRICTS WITH THE MOST DATA DISPARITIES
10

One-Sample Statistics
N Mean Std. Deviation Std. Error Mean
PHC headcount – total
monthly summary 166 13993.17 12379.759 960.856
PHC headcount - recount 166 11790.54 10427.363 809.320
One-Sample Test
Test Value = 0
t df Sig. (2-
tailed)
Mean
Difference
95% Confidence Interval
of the Difference
Lower Upper
PHC headcount -
total monthly
summary
14.563 165 .000 13993.169 12096.01 15890.33
PHC headcount -
recount 14.568 165 .000 11790.536 10192.58 13388.50
11
One-Sample Statistics
N Mean Std. Deviation Std. Error Mean
PHC headcount - total
monthly summary 166 13993.17 12379.759 960.856
PHC headcount - total DHIS 166 16421.04 14236.582 1104.973
One-Sample Test
Test Value = 0
t df Sig. (2-
tailed)
Mean
Difference
95% Confidence Interval
of the Difference
Lower Upper
PHC headcount - total
monthly summary 14.563 165 .000 13993.169 12096.01 15890.33
PHC headcount - total
DHIS 14.861 165 .000 16421.042 14239.33 18602.75
SIGNIFICANT DIFFERENCES BETWEEN THE COUNTS

COMPARISONS BETWEEN MONTHLY AND RECOUNTS
COMPARISONS BETWEEN MONTHLY AND DHIS
12
21
25
28
19
23
14
6
3
7
6
5
3
6
0 5 10 15 20 25 30
gp City of Johannesburg MetropolitanMunicipality
gp City of Tshwane MetropolitanMunicipality
gp Ekurhuleni MetropolitanMunicipality
gp Sedibeng District Municipality
gp West Rand District Municipality
PHC headcount: DHIS vs Summary
Underreporting Same value Overreporting
33
30
29
19
28
7
4
2
7
7
0 5 10 15 20 25 30 35
gp City of Johannesburg MetropolitanMunicipality
gp City of Tshwane MetropolitanMunicipality
gp Ekurhuleni MetropolitanMunicipality
gp Sedibeng District Municipality
gp West Rand District Municipality
PHC headcounts: Recount vs Summary
Underreporting Overreporting
NATURE OF DATA DISPARITIES

COMPARISONS BETWEEN MONTHLY AND RECOUNTS
COMPARISONS BETWEEN MONTHLY AND DHIS
13
1
14
12
8
6
11
1
3
6
3
9
11
18
20
22
0 5 10 15 20 25
gp City of Tshwane MetropolitanMunicipality
gp Sedibeng District Municipality
gp West Rand District Municipality
gp City of Johannesburg MetropolitanMunicipality
gp Ekurhuleni MetropolitanMunicipality
Clients tested for HIV incl ANC: Recount vs Summary
Underreporting Same value Overreporting
36
29
27
19
26
4
5
4
7
9
0 5 10 15 20 25 30 35 40
gp City of Johannesburg MetropolitanMunicipality
gp City of Tshwane MetropolitanMunicipality
gp Ekurhuleni MetropolitanMunicipality
gp Sedibeng District Municipality
gp West Rand District Municipality
Clients tested for HIV incl ANC: DHIS vs Summary
Underreporting Overreporting
LEVEL OF DATA DISPARITIES DIFFERED ACCORDING TO INDICATOR CATERGORY

COMPARISONS BETWEEN MONTHLY AND RECOUNTS
COMPARISONS BETWEEN MONTHLY AND DHIS
14
4
3
2
1
35
29
31
18
32
1
2
6
2
0 5 10 15 20 25 30 35 40
gp City of Johannesburg MetropolitanMunicipality
gp City of Tshwane MetropolitanMunicipality
gp Ekurhuleni MetropolitanMunicipality
gp Sedibeng District Municipality
gp West Rand District Municipality
Infant 1st PCR test around 6 weeks: Recount vs Summary
Underreporting Same value Overreporting
1
3
1
2
32
27
25
22
30
7
7
3
3
3
0 5 10 15 20 25 30 35
gp City of Johannesburg MetropolitanMunicipality
gp City of Tshwane MetropolitanMunicipality
gp Ekurhuleni MetropolitanMunicipality
gp Sedibeng District Municipality
gp West Rand District Municipality
Infant 1st PCR test around 6 weeks: DHIS vs Summary
Underreporting Same value Overreporting
LEVEL OF DATA DISPARITIES DIFFERED ACCORDING TO INDICATOR CATERGORY

15
LEVEL OF VARIANCE: DIRECT SERVICE BY PARTNERS
District Name % variance between
Headcount Recount vs.
Monthly Summary
% variance between
Headcount Monthly
Summary and DHIS
% variance
between HIV
clients tested
Recount vs.
Monthly
Summary
% variance
between HIV
clients tested
Monthly
Summary vs. DHIS
% variance
between PCR test
Recount vs.
Monthly Summary
% variance
between PCR
test clients
tested Monthly
Summary vs.
DHIS
Facilities within same
Sub-district (with
slightly same PHC
headcount)
Suurman Clinic -25%/3743
(11316/15059) 1% /127
(15059/15186)
1853/0 0/1174 Same value Same value -25%/5%
-4424/857
13587/18011/18868
Holani -1%
(11966/12061)
Same Value
(12061/12061)
30%/412
(967/1379)
-18%/ -210
(1379/1169)
Same value Same value 2% /40%
(300/6625)
16905/16605/23230
Karen Park 14% /2487
(15078/17565)
-1%/213
(17565/17352)
Same value
660
49.8%/666
(660/1326)
Same value Same value 11%/27%
2027/5021
16729/18756/23777
Johan Heyns
8%/ 2389
(26592/28981)
17%/4922
(28981/33903)
22%/442
(2492/2050)
12.8%/301
2050/2351
2/0 0/4 -2%/55%
1522/15275
28085/29607/44882

STRENGTHS
Executive Leadership that values Partnerships in service delivery
MOUs signed with provincial government in the Province
Each Partner had a specific area of Specialisation
Prevention, Care and Treatment
USG and SAG Governance Framework that guide Development partnerships
WEAKNESSES
Uniformity in reporting, capturing of results and alignment Reviews of performance to include Partners is at a discretion
of a district manager /Not all districts have signed SLAs
Role clarification between district and province on
different indicator sets being collected into different systems from the same facilities
None of the SLA/MOU reflected how Data or M&E were to be explicitly improved
OPPORTUNITIES
Funding models of partners and plans aligned to strategic objectives of the department and driven from Strat Plans
Integrating and aligning services and reduce duplications
Common M&E accountability model and Platforms
Results frameworks/Theory of change on Data/Performance information
THREATS
End in funding cycle
Reduction and end in funding reducing capacity for support
High Staff turnover with partnerships affecting progress
Uncertainty in funding of new projects/sustainability
SWOT
FINDINGS FROM THE DESKTOP ANALYSIS OF THE MOUS/SLAS/REPORTS
16

DISCUSSIONS
Disparities between the recounts by partner may be due to lack of access to complete records
The higher the head count at facility the higher the data disparities
Significant differences between data recounts and monthly summaries including differences between monthly summaries and the DHIS points to lack of data verification
Minimal variance on PCR testing due to smaller number of records and no PCR testing versus
the high variance in PHC headcounts due to high number of records Over reporting on the DHIS versus Monthly reports due to lack of systematic corrections
effected on the DHIS but not effected on the source documents Facilities with direct support/secondment had the least variance compared to facilities with
almost same headcount when comparing DHIS and Monthly summary report but comparisons on recounts and monthly summary report did not yield any clear differences except for 1 facility
Limited evidence showing work plans and results frameworks on Data /M&E improvements
could have had a role to play in the variances over and above other organisational factors
17
DISCUSSION

Even with the support of development partners (through both Technical assistance/Direct Service Delivery on data/M&E), facility reports on performance data remains inconsistent with source documents at all levels
The magnitude of data discrepancies between source documents, PHC monthly reports and the DHIS highlights gaps in compliance to current policies, SOPs and weak accountability/supervision by both partners and the department in the area of performance data management
Opportunities exist to further strengthen mutual accountability models between Development Partners and GDOH to improve integrity of performance data through the use of explicit theory of change, harmonised reporting processes, and access or sharing of performance information resources. (OECD-Mutual accountability 2011, ODI 2009, Bailey, 2010)
18
CONCLUSION

Limitations
Small sample with incomplete variables
Incomplete data file and difficulties in differentiating partner involvement per district
Preliminary findings and detailed explanatory variables not part of this analysis
Limitations in exploring the effect of organisational related variables on data quality patterns
Database used to compute the partner spread in the province has 2014 data and has since been replaced
Recommendations
Leverage on existing platforms of HAST programmes to bridge mutual accountability or governance gaps in performance data management
Development of explicit theory of change for both partners and GDOH on performance data management
Standardise MOUs/SLAs, reporting, accountability instruments and access to partner information system
Hold GDOH Managers and Supervisors accountable for performance data disparities
Enforcement of daily verification of data at PHC level for both TA and DSS
Implementation of rigorous evaluations to assess progress made in data management improvement initiatives by both partners and department 19
LIMITATIONS AND RECOMMENDATIONS
LIMITATION AND RECOMMENDATIONS

Thank You
The Baseline Evaluation on Data management system is fully funded by Measure-SIFSA project, as part of a partnership with GDOH to strengthen performance information quality and use at all levels of the provincial government
ACKNOWLEDGEMENT

Brinkerhoff M.J. Public Admin. Dev. 22, 19–30 (2002)
Mays G.P, 2010. Improving Public health system performance through multiorganisational partnerships . Prev Chronic Dis 2010;7(6), pp 1-8.
Steer L, Wathne. Mutual Accountability at country level: Emerging good practice’. 2009, Overseas Development Institute
21
REFERENCES