Embed Size (px)
Citation preview
Disclaimer Gazal Corporation Limited
Copyright © 2000-2003, IBISWorld Pty Ltd Page 1
IBISWorld Company Premium Report
Gazal Corporation Limited
This product has been supplied by IBISWorld Pty Ltd ('IBISWorld') solely for use by its authorised licences strictly in accordance with their licence
agreements with IBISWorld.
IBISWorld makes no representation to any other person with regard to the completeness or accuracy of the data or information contained herein, and it
accepts no responsibility and disclaims all liability (save for liability which cannot be lawfully disclaimed) for loss or damage whatsoever suffered or
incurred by any other person resulting from the use of, or reliance upon, the data or information contained herein.
Information provided is not financial product advice. This report contains general information only. It is not intended as financial product advice and
must not be relied upon as such. You should consider obtaining independent advice tailored to your specific circumstances before making any financial
decisions.
Copyright in this publication is owned by IBISWorld Pty Ltd. The publication is sold on the basis that the purchaser agrees not to copy the material contained
within it for other than the purchasers own purposes. In the event that the purchaser uses or quotes from the material in this publication - in papers,
reports, or opinions prepared for any other person - it is agreed that it will be sourced to:
IBISWorld Pty Ltd.
Contents Gazal Corporation Limited
Copyright © 2000-2003, IBISWorld Pty Ltd Page 2
Gazal Corporation Limited
Contents COMPANY DETAILS........................................................................................................................... 3
SYNOPSIS ........................................................................................................................................... 3 KEY PERSONNEL................................................................................................................................ 5
DIRECTORS AND KEY PERSONNEL OF GAZAL CORPORATION LIMITED............................. 5 OTHER DIRECTORSHIP.................................................................................................................... 6
FINANCIALS ......................................................................................................................................... 7 PROFIT AND LOSS ACCOUNT......................................................................................................... 7 BALANCE SHEET .............................................................................................................................. 7
INDUSTRY AVERAGES ...................................................................................................................... 8
SEGMENTS............................................................................................................................................ 9 OPERATING SEGMENTS .................................................................................................................. 9 KEY RATIOS ...................................................................................................................................... 9 INDUSTRIES BY OPERATING SEGMENT ....................................................................................... 9 GEOGRAPHIC LOCATIONS.............................................................................................................. 9 KEY RATIOS ...................................................................................................................................... 9
COMPETITIVE ENVIRONMENT.................................................................................................... 10 C2241 MEN'S AND BOY'S WEAR MANUFACTURING IN AUSTRALIA ................................ 10 C2242 WOMEN'S AND GIRL'S WEAR MANUFACTURING IN AUSTRALIA ......................... 11 C2243 SLEEPWEAR, UNDERWEAR AND INFANT CLOTHING MANUFACTURING IN AUSTRALIA...................................................................................................................................... 13 C2249 CLOTHING MANUFACTURING N.E.C. IN AUSTRALIA............................................... 15 F4721 TEXTILE PRODUCT WHOLESALING IN AUSTRALIA .................................................. 16 F4722 CLOTHING WHOLESALING IN AUSTRALIA ................................................................. 16 G5221 CLOTHING RETAILING IN AUSTRALIA ........................................................................ 17
SUBSIDIARIES.................................................................................................................................... 19 SUBSIDIARIES, JOINT VENTURES, ASSOCIATES OF GAZAL CORPORATION LIMITED.... 19
SHAREHOLDERS............................................................................................................................... 20
SERVICE PROVIDERS...................................................................................................................... 21 SERVICE PROVIDERS TO GAZAL CORPORATION LIMITED ................................................... 21
NEWS .................................................................................................................................................... 22
Company Details Gazal Corporation Limited
Copyright © 2000-2003, IBISWorld Pty Ltd Page 3
Company Details Company Registered Name Gazal Corporation Limited Commonly Used Name Gazal Corporation Street Address 3-7 McPherson Street BANKSMEADOW 2019 Australia Postal Address Private Bag 27 Post Office BOTANY 1455 Phone 02 9316 2800 Fax 02 9316 7207 Website (URL) www.gazal.com.au Company Type Public Company Incorporated In New South Wales Incorporation Date 22 February 1965 Ownership Type Locally Sector Non Government Major Business Line C224 - Clothing Manufacturing in Australia ACN 004 623 474 ASX Code GZL
Synopsis PRODUCTS/BRANDS YVES SAINT LAURENT Gazal is the largest licensee in Australia for Yves Saint Laurent and supports three separate Yves Saint Laurent product groups: Men's shirts, men's underwear and women's lingerie. NAUTICA Gazal Apparel Pty Ltd (100%) will take up the licence for Australia and New Zealand of the Nautica men's sportswear and apparel brand. The licence is for a period of 5 years from 01/01/1999. As part of the deal, Gazal Corporation has committed to an initial investment of $4-5M. INTIMATE APPAREL The Company markets lingerie through the Lovable, Fineform and Crystelle labels and also sleepwear and swimwear through the Lovable label. The Company is looking at extending the Lovable name into other product categories such as Children's Sleepwear, Fragrance and Slippers. SURF AND CASUAL WEAR The Company operates through the following brands: Mambo; Maui & Sons; Como; Raw; and Crystal Cylinders. BUSINESS SHIRTS
Company Details Gazal Corporation Limited
Copyright © 2000-2003, IBISWorld Pty Ltd Page 4
The Company's Van Heusen brand has a high profile in the market, representing approximately 15% of the total market. The Bisley and Paramount brands are targeted to the discount department store customer. SCHOOLWEAR The Company markets schoolwear through the Midford and Stamina labels. ASIAN OPERATIONS The Company has investments in two joint venture operations in China:
• SHANGHAI GAZAL TEXTILE & GARMENTS CO LTD (CHINA) - A manufacturing plant in Shaghai which manufactures business shirts and woven sports shirts.
• WUXI PALM ISLAND TEXTILE & GARMENTS CO LTD (CHINA) - This factory
employs approx. 600 workers producing woven shirts and knitted garments such as T-Shirts, polo shirts and sweatshirts.
Key Personnel Gazal Corporation Limited
Copyright © 2000-2003, IBISWorld Pty Ltd Page 5
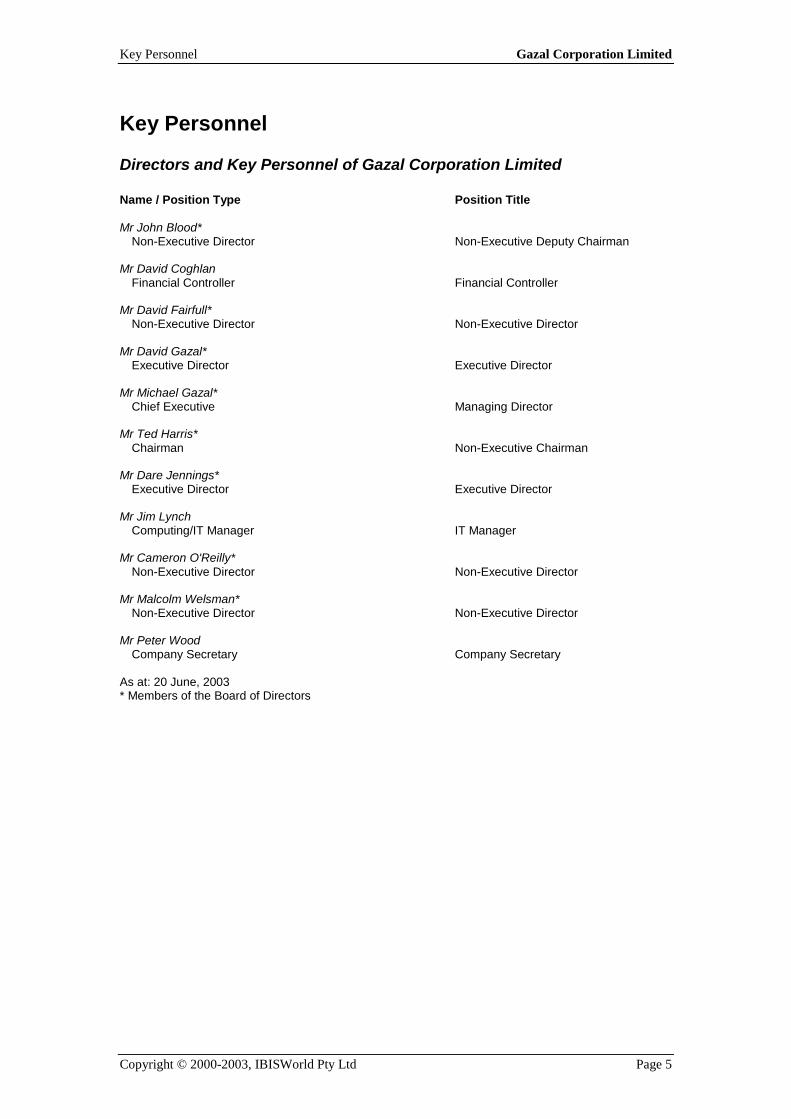
Key Personnel
Directors and Key Personnel of Gazal Corporation Limited Name / Position Type Position Title Mr John Blood* Non-Executive Director Non-Executive Deputy Chairman Mr David Coghlan Financial Controller Financial Controller Mr David Fairfull* Non-Executive Director Non-Executive Director Mr David Gazal* Executive Director Executive Director Mr Michael Gazal* Chief Executive Managing Director Mr Ted Harris* Chairman Non-Executive Chairman Mr Dare Jennings* Executive Director Executive Director Mr Jim Lynch Computing/IT Manager IT Manager Mr Cameron O'Reilly* Non-Executive Director Non-Executive Director Mr Malcolm Welsman* Non-Executive Director Non-Executive Director Mr Peter Wood Company Secretary Company Secretary As at: 20 June, 2003 * Members of the Board of Directors
Key Personnel Gazal Corporation Limited
Copyright © 2000-2003, IBISWorld Pty Ltd Page 6
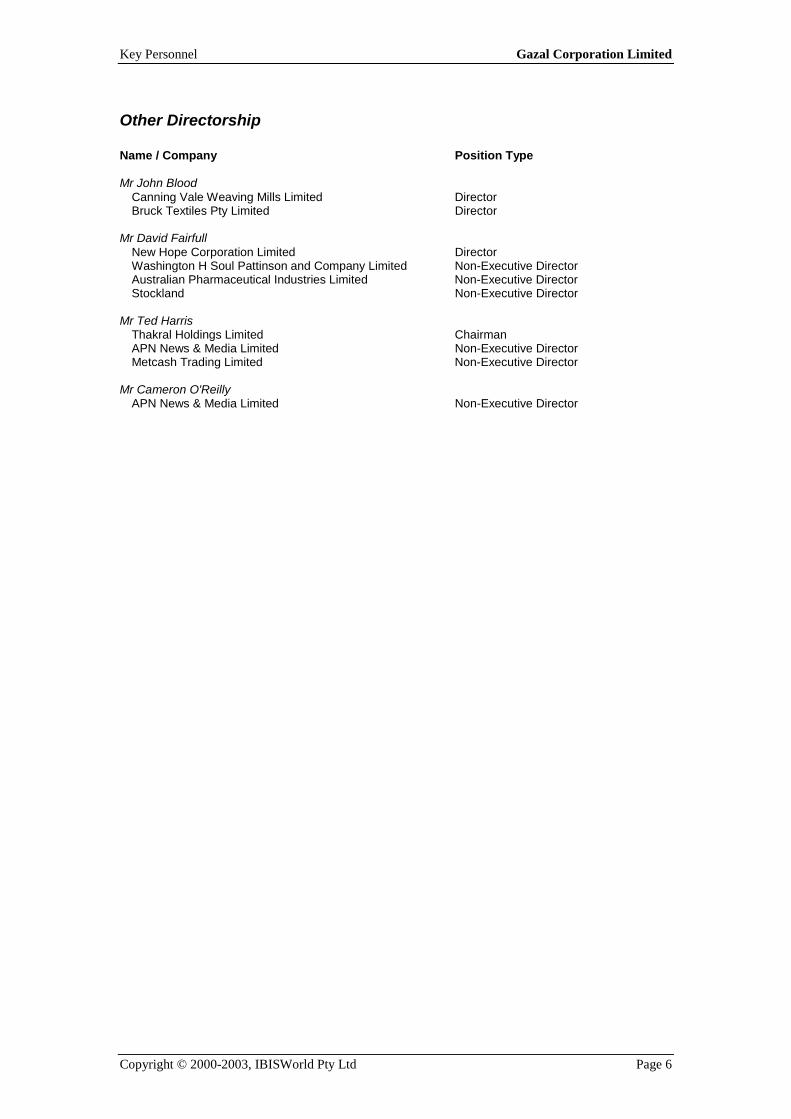
Other Directorship Name / Company Position Type Mr John Blood Canning Vale Weaving Mills Limited Director Bruck Textiles Pty Limited Director Mr David Fairfull New Hope Corporation Limited Director Washington H Soul Pattinson and Company Limited Non-Executive Director Australian Pharmaceutical Industries Limited Non-Executive Director Stockland Non-Executive Director Mr Ted Harris Thakral Holdings Limited Chairman APN News & Media Limited Non-Executive Director Metcash Trading Limited Non-Executive Director Mr Cameron O'Reilly APN News & Media Limited Non-Executive Director
Financials Gazal Corporation Limited
Copyright © 2000-2003, IBISWorld Pty Ltd Page 7
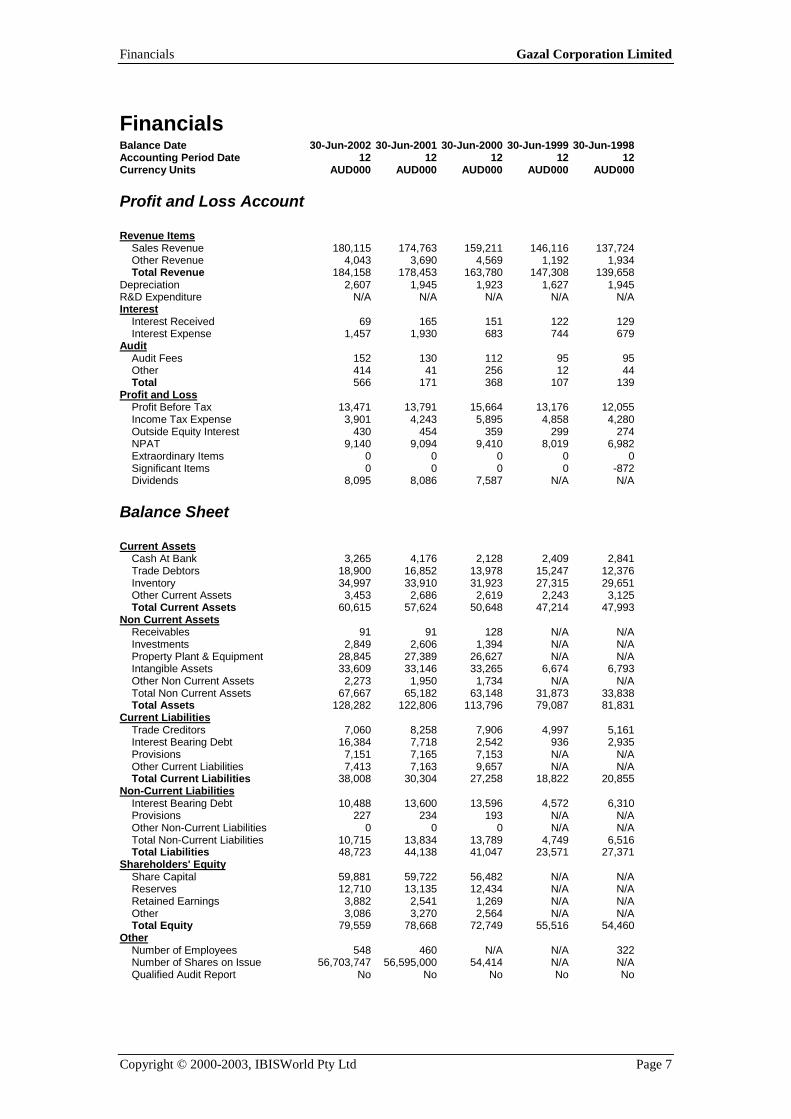
Financials Balance Date 30-Jun-2002 30-Jun-2001 30-Jun-2000 30-Jun-1999 30-Jun-1998 Accounting Period Date 12 12 12 12 12 Currency Units AUD000 AUD000 AUD000 AUD000 AUD000
Profit and Loss Account Revenue Items Sales Revenue 180,115 174,763 159,211 146,116 137,724 Other Revenue 4,043 3,690 4,569 1,192 1,934 Total Revenue 184,158 178,453 163,780 147,308 139,658 Depreciation 2,607 1,945 1,923 1,627 1,945 R&D Expenditure N/A N/A N/A N/A N/A Interest Interest Received 69 165 151 122 129 Interest Expense 1,457 1,930 683 744 679 Audit Audit Fees 152 130 112 95 95 Other 414 41 256 12 44 Total 566 171 368 107 139 Profit and Loss Profit Before Tax 13,471 13,791 15,664 13,176 12,055 Income Tax Expense 3,901 4,243 5,895 4,858 4,280 Outside Equity Interest 430 454 359 299 274 NPAT 9,140 9,094 9,410 8,019 6,982 Extraordinary Items 0 0 0 0 0 Significant Items 0 0 0 0 -872 Dividends 8,095 8,086 7,587 N/A N/A
Balance Sheet Current Assets Cash At Bank 3,265 4,176 2,128 2,409 2,841 Trade Debtors 18,900 16,852 13,978 15,247 12,376 Inventory 34,997 33,910 31,923 27,315 29,651 Other Current Assets 3,453 2,686 2,619 2,243 3,125 Total Current Assets 60,615 57,624 50,648 47,214 47,993 Non Current Assets Receivables 91 91 128 N/A N/A Investments 2,849 2,606 1,394 N/A N/A Property Plant & Equipment 28,845 27,389 26,627 N/A N/A Intangible Assets 33,609 33,146 33,265 6,674 6,793 Other Non Current Assets 2,273 1,950 1,734 N/A N/A Total Non Current Assets 67,667 65,182 63,148 31,873 33,838 Total Assets 128,282 122,806 113,796 79,087 81,831 Current Liabilities Trade Creditors 7,060 8,258 7,906 4,997 5,161 Interest Bearing Debt 16,384 7,718 2,542 936 2,935 Provisions 7,151 7,165 7,153 N/A N/A Other Current Liabilities 7,413 7,163 9,657 N/A N/A Total Current Liabilities 38,008 30,304 27,258 18,822 20,855 Non-Current Liabilities Interest Bearing Debt 10,488 13,600 13,596 4,572 6,310 Provisions 227 234 193 N/A N/A Other Non-Current Liabilities 0 0 0 N/A N/A Total Non-Current Liabilities 10,715 13,834 13,789 4,749 6,516 Total Liabilities 48,723 44,138 41,047 23,571 27,371 Shareholders' Equity Share Capital 59,881 59,722 56,482 N/A N/A Reserves 12,710 13,135 12,434 N/A N/A Retained Earnings 3,882 2,541 1,269 N/A N/A Other 3,086 3,270 2,564 N/A N/A Total Equity 79,559 78,668 72,749 55,516 54,460 Other Number of Employees 548 460 N/A N/A 322 Number of Shares on Issue 56,703,747 56,595,000 54,414 N/A N/A Qualified Audit Report No No No No No
Industry Averages Gazal Corporation Limited
Copyright © 2000-2003, IBISWorld Pty Ltd Page 8
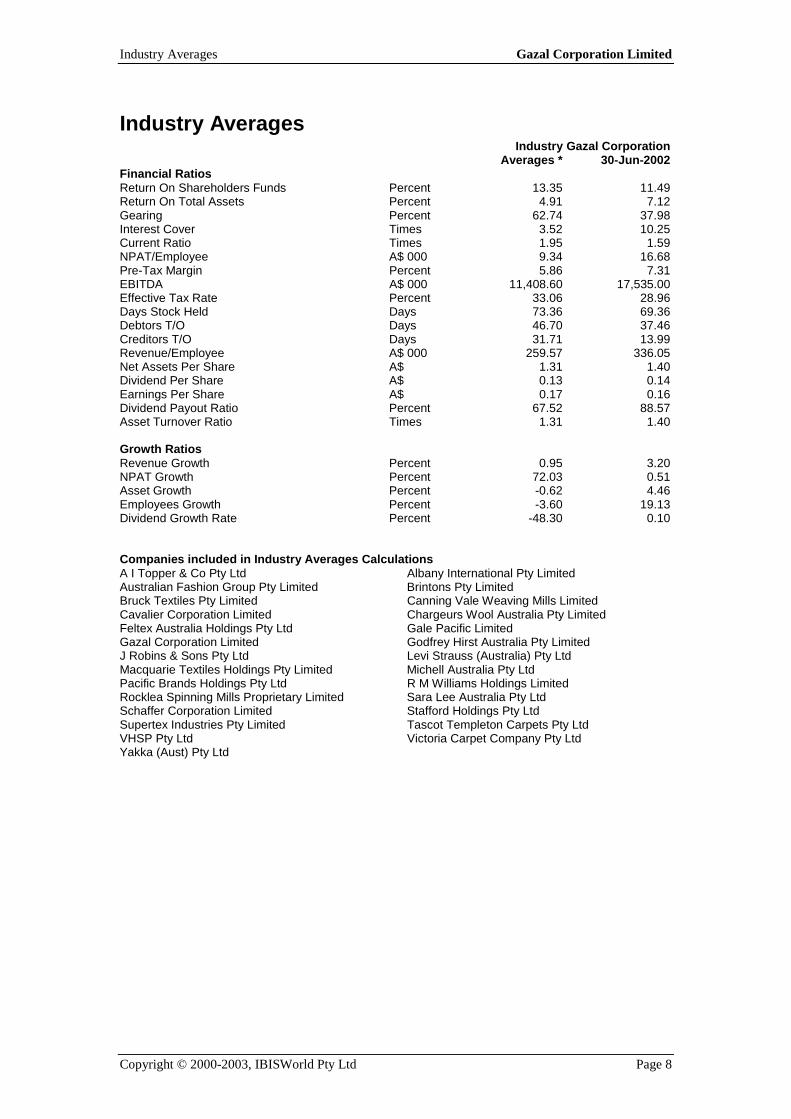
Industry Averages Industry Gazal Corporation Averages * 30-Jun-2002 Financial Ratios Return On Shareholders Funds Percent 13.35 11.49 Return On Total Assets Percent 4.91 7.12 Gearing Percent 62.74 37.98 Interest Cover Times 3.52 10.25 Current Ratio Times 1.95 1.59 NPAT/Employee A$ 000 9.34 16.68 Pre-Tax Margin Percent 5.86 7.31 EBITDA A$ 000 11,408.60 17,535.00 Effective Tax Rate Percent 33.06 28.96 Days Stock Held Days 73.36 69.36 Debtors T/O Days 46.70 37.46 Creditors T/O Days 31.71 13.99 Revenue/Employee A$ 000 259.57 336.05 Net Assets Per Share A$ 1.31 1.40 Dividend Per Share A$ 0.13 0.14 Earnings Per Share A$ 0.17 0.16 Dividend Payout Ratio Percent 67.52 88.57 Asset Turnover Ratio Times 1.31 1.40 Growth Ratios Revenue Growth Percent 0.95 3.20 NPAT Growth Percent 72.03 0.51 Asset Growth Percent -0.62 4.46 Employees Growth Percent -3.60 19.13 Dividend Growth Rate Percent -48.30 0.10 Companies included in Industry Averages Calculations A I Topper & Co Pty Ltd Albany International Pty Limited Australian Fashion Group Pty Limited Brintons Pty Limited Bruck Textiles Pty Limited Canning Vale Weaving Mills Limited Cavalier Corporation Limited Chargeurs Wool Australia Pty Limited Feltex Australia Holdings Pty Ltd Gale Pacific Limited Gazal Corporation Limited Godfrey Hirst Australia Pty Limited J Robins & Sons Pty Ltd Levi Strauss (Australia) Pty Ltd Macquarie Textiles Holdings Pty Limited Michell Australia Pty Ltd Pacific Brands Holdings Pty Ltd R M Williams Holdings Limited Rocklea Spinning Mills Proprietary Limited Sara Lee Australia Pty Ltd Schaffer Corporation Limited Stafford Holdings Pty Ltd Supertex Industries Pty Limited Tascot Templeton Carpets Pty Ltd VHSP Pty Ltd Victoria Carpet Company Pty Ltd Yakka (Aust) Pty Ltd
Segments Gazal Corporation Limited
Copyright © 2000-2003, IBISWorld Pty Ltd Page 9
Segments
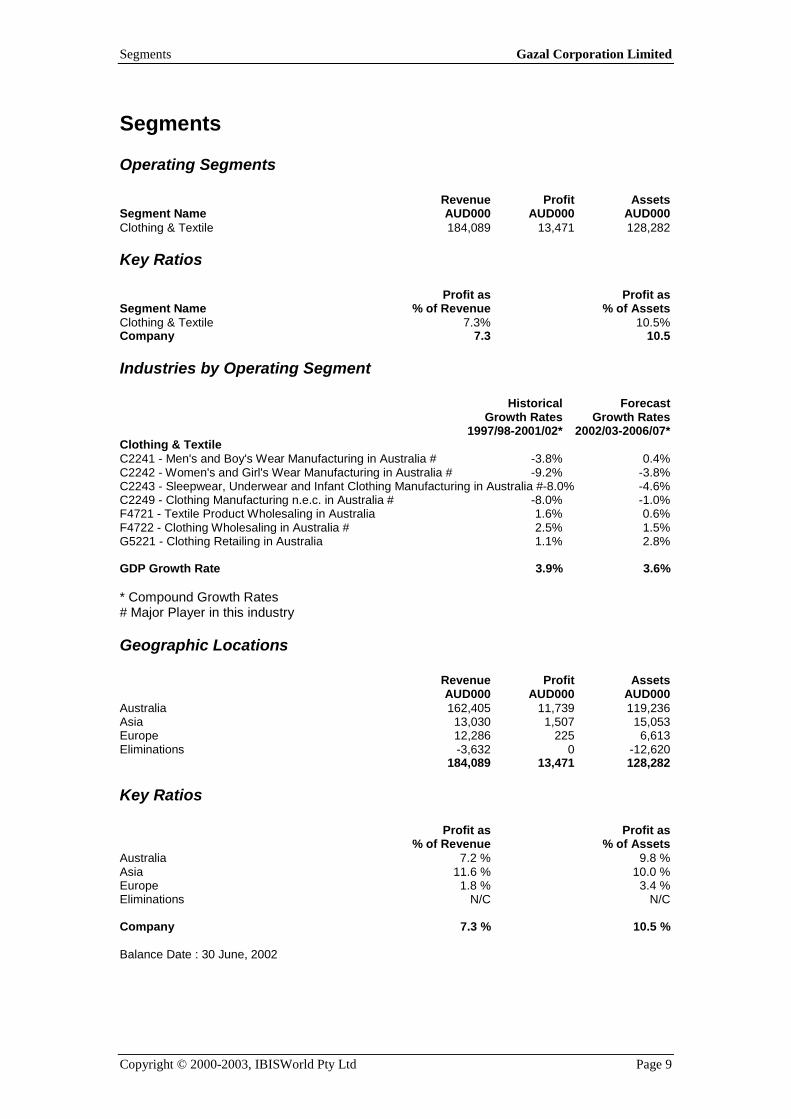
Operating Segments Revenue Profit Assets Segment Name AUD000 AUD000 AUD000 Clothing & Textile 184,089 13,471 128,282
Key Ratios Profit as Profit as Segment Name % of Revenue % of Assets Clothing & Textile 7.3% 10.5% Company 7.3 10.5
Industries by Operating Segment Historical Forecast Growth Rates Growth Rates 1997/98-2001/02* 2002/03-2006/07* Clothing & Textile C2241 - Men's and Boy's Wear Manufacturing in Australia # -3.8% 0.4% C2242 - Women's and Girl's Wear Manufacturing in Australia # -9.2% -3.8% C2243 - Sleepwear, Underwear and Infant Clothing Manufacturing in Australia #-8.0% -4.6% C2249 - Clothing Manufacturing n.e.c. in Australia # -8.0% -1.0% F4721 - Textile Product Wholesaling in Australia 1.6% 0.6% F4722 - Clothing Wholesaling in Australia # 2.5% 1.5% G5221 - Clothing Retailing in Australia 1.1% 2.8% GDP Growth Rate 3.9% 3.6% * Compound Growth Rates # Major Player in this industry
Geographic Locations Revenue Profit Assets AUD000 AUD000 AUD000 Australia 162,405 11,739 119,236 Asia 13,030 1,507 15,053 Europe 12,286 225 6,613 Eliminations -3,632 0 -12,620 184,089 13,471 128,282
Key Ratios Profit as Profit as % of Revenue % of Assets Australia 7.2 % 9.8 % Asia 11.6 % 10.0 % Europe 1.8 % 3.4 % Eliminations N/C N/C Company 7.3 % 10.5 % Balance Date : 30 June, 2002
Competitive Environment Gazal Corporation Limited
Copyright © 2000-2003, IBISWorld Pty Ltd Page 10
Competitive Environment
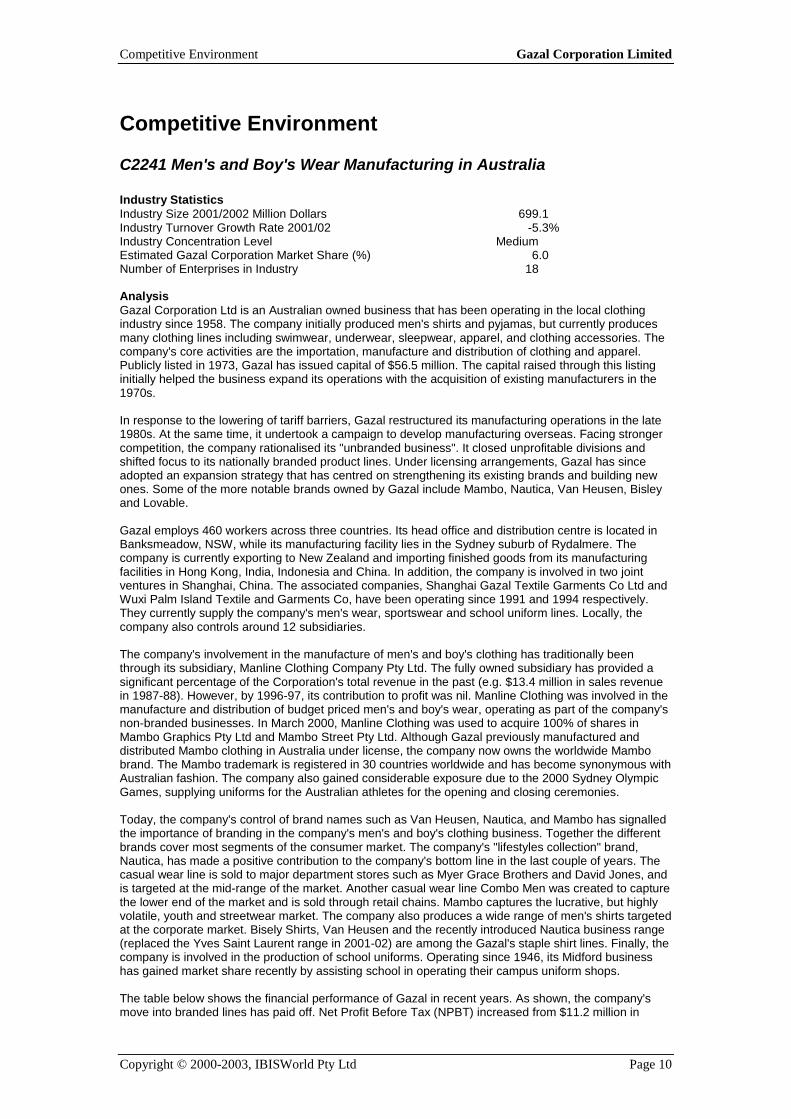
C2241 Men's and Boy's Wear Manufacturing in Australia Industry Statistics Industry Size 2001/2002 Million Dollars 699.1 Industry Turnover Growth Rate 2001/02 -5.3% Industry Concentration Level Medium Estimated Gazal Corporation Market Share (%) 6.0 Number of Enterprises in Industry 18 Analysis Gazal Corporation Ltd is an Australian owned business that has been operating in the local clothing industry since 1958. The company initially produced men's shirts and pyjamas, but currently produces many clothing lines including swimwear, underwear, sleepwear, apparel, and clothing accessories. The company's core activities are the importation, manufacture and distribution of clothing and apparel. Publicly listed in 1973, Gazal has issued capital of $56.5 million. The capital raised through this listing initially helped the business expand its operations with the acquisition of existing manufacturers in the 1970s. In response to the lowering of tariff barriers, Gazal restructured its manufacturing operations in the late 1980s. At the same time, it undertook a campaign to develop manufacturing overseas. Facing stronger competition, the company rationalised its "unbranded business". It closed unprofitable divisions and shifted focus to its nationally branded product lines. Under licensing arrangements, Gazal has since adopted an expansion strategy that has centred on strengthening its existing brands and building new ones. Some of the more notable brands owned by Gazal include Mambo, Nautica, Van Heusen, Bisley and Lovable. Gazal employs 460 workers across three countries. Its head office and distribution centre is located in Banksmeadow, NSW, while its manufacturing facility lies in the Sydney suburb of Rydalmere. The company is currently exporting to New Zealand and importing finished goods from its manufacturing facilities in Hong Kong, India, Indonesia and China. In addition, the company is involved in two joint ventures in Shanghai, China. The associated companies, Shanghai Gazal Textile Garments Co Ltd and Wuxi Palm Island Textile and Garments Co, have been operating since 1991 and 1994 respectively. They currently supply the company's men's wear, sportswear and school uniform lines. Locally, the company also controls around 12 subsidiaries. The company's involvement in the manufacture of men's and boy's clothing has traditionally been through its subsidiary, Manline Clothing Company Pty Ltd. The fully owned subsidiary has provided a significant percentage of the Corporation's total revenue in the past (e.g. $13.4 million in sales revenue in 1987-88). However, by 1996-97, its contribution to profit was nil. Manline Clothing was involved in the manufacture and distribution of budget priced men's and boy's wear, operating as part of the company's non-branded businesses. In March 2000, Manline Clothing was used to acquire 100% of shares in Mambo Graphics Pty Ltd and Mambo Street Pty Ltd. Although Gazal previously manufactured and distributed Mambo clothing in Australia under license, the company now owns the worldwide Mambo brand. The Mambo trademark is registered in 30 countries worldwide and has become synonymous with Australian fashion. The company also gained considerable exposure due to the 2000 Sydney Olympic Games, supplying uniforms for the Australian athletes for the opening and closing ceremonies. Today, the company's control of brand names such as Van Heusen, Nautica, and Mambo has signalled the importance of branding in the company's men's and boy's clothing business. Together the different brands cover most segments of the consumer market. The company's "lifestyles collection" brand, Nautica, has made a positive contribution to the company's bottom line in the last couple of years. The casual wear line is sold to major department stores such as Myer Grace Brothers and David Jones, and is targeted at the mid-range of the market. Another casual wear line Combo Men was created to capture the lower end of the market and is sold through retail chains. Mambo captures the lucrative, but highly volatile, youth and streetwear market. The company also produces a wide range of men's shirts targeted at the corporate market. Bisely Shirts, Van Heusen and the recently introduced Nautica business range (replaced the Yves Saint Laurent range in 2001-02) are among the Gazal's staple shirt lines. Finally, the company is involved in the production of school uniforms. Operating since 1946, its Midford business has gained market share recently by assisting school in operating their campus uniform shops. The table below shows the financial performance of Gazal in recent years. As shown, the company's move into branded lines has paid off. Net Profit Before Tax (NPBT) increased from $11.2 million in
Competitive Environment Gazal Corporation Limited
Copyright © 2000-2003, IBISWorld Pty Ltd Page 11
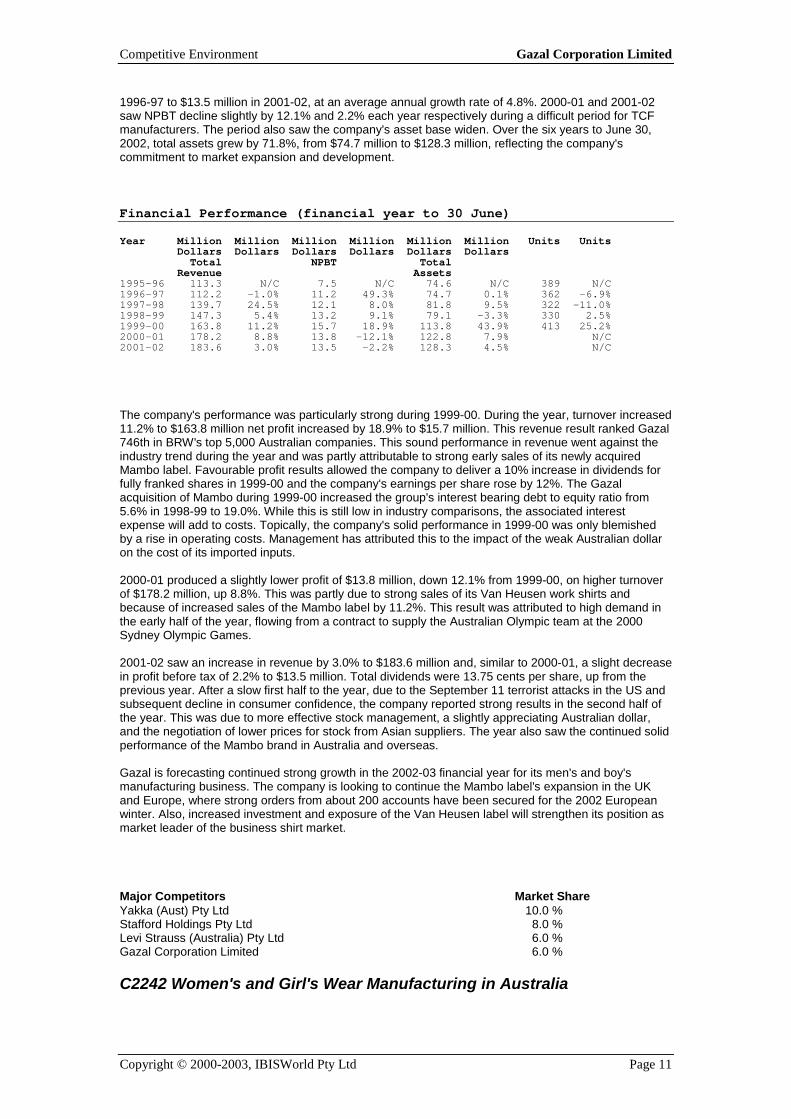
1996-97 to $13.5 million in 2001-02, at an average annual growth rate of 4.8%. 2000-01 and 2001-02 saw NPBT decline slightly by 12.1% and 2.2% each year respectively during a difficult period for TCF manufacturers. The period also saw the company's asset base widen. Over the six years to June 30, 2002, total assets grew by 71.8%, from $74.7 million to $128.3 million, reflecting the company's commitment to market expansion and development. Financial Performance (financial year to 30 June) Year Million Million Million Million Million Million Units Units Dollars Dollars Dollars Dollars Dollars Dollars Total NPBT Total Revenue Assets 1995-96 113.3 N/C 7.5 N/C 74.6 N/C 389 N/C 1996-97 112.2 -1.0% 11.2 49.3% 74.7 0.1% 362 -6.9% 1997-98 139.7 24.5% 12.1 8.0% 81.8 9.5% 322 -11.0% 1998-99 147.3 5.4% 13.2 9.1% 79.1 -3.3% 330 2.5% 1999-00 163.8 11.2% 15.7 18.9% 113.8 43.9% 413 25.2% 2000-01 178.2 8.8% 13.8 -12.1% 122.8 7.9% N/C 2001-02 183.6 3.0% 13.5 -2.2% 128.3 4.5% N/C The company's performance was particularly strong during 1999-00. During the year, turnover increased 11.2% to $163.8 million net profit increased by 18.9% to $15.7 million. This revenue result ranked Gazal 746th in BRW's top 5,000 Australian companies. This sound performance in revenue went against the industry trend during the year and was partly attributable to strong early sales of its newly acquired Mambo label. Favourable profit results allowed the company to deliver a 10% increase in dividends for fully franked shares in 1999-00 and the company's earnings per share rose by 12%. The Gazal acquisition of Mambo during 1999-00 increased the group's interest bearing debt to equity ratio from 5.6% in 1998-99 to 19.0%. While this is still low in industry comparisons, the associated interest expense will add to costs. Topically, the company's solid performance in 1999-00 was only blemished by a rise in operating costs. Management has attributed this to the impact of the weak Australian dollar on the cost of its imported inputs. 2000-01 produced a slightly lower profit of $13.8 million, down 12.1% from 1999-00, on higher turnover of $178.2 million, up 8.8%. This was partly due to strong sales of its Van Heusen work shirts and because of increased sales of the Mambo label by 11.2%. This result was attributed to high demand in the early half of the year, flowing from a contract to supply the Australian Olympic team at the 2000 Sydney Olympic Games. 2001-02 saw an increase in revenue by 3.0% to $183.6 million and, similar to 2000-01, a slight decrease in profit before tax of 2.2% to $13.5 million. Total dividends were 13.75 cents per share, up from the previous year. After a slow first half to the year, due to the September 11 terrorist attacks in the US and subsequent decline in consumer confidence, the company reported strong results in the second half of the year. This was due to more effective stock management, a slightly appreciating Australian dollar, and the negotiation of lower prices for stock from Asian suppliers. The year also saw the continued solid performance of the Mambo brand in Australia and overseas. Gazal is forecasting continued strong growth in the 2002-03 financial year for its men's and boy's manufacturing business. The company is looking to continue the Mambo label's expansion in the UK and Europe, where strong orders from about 200 accounts have been secured for the 2002 European winter. Also, increased investment and exposure of the Van Heusen label will strengthen its position as market leader of the business shirt market. Major Competitors Market Share Yakka (Aust) Pty Ltd 10.0 % Stafford Holdings Pty Ltd 8.0 % Levi Strauss (Australia) Pty Ltd 6.0 % Gazal Corporation Limited 6.0 %
C2242 Women's and Girl's Wear Manufacturing in Australia
Competitive Environment Gazal Corporation Limited
Copyright © 2000-2003, IBISWorld Pty Ltd Page 12
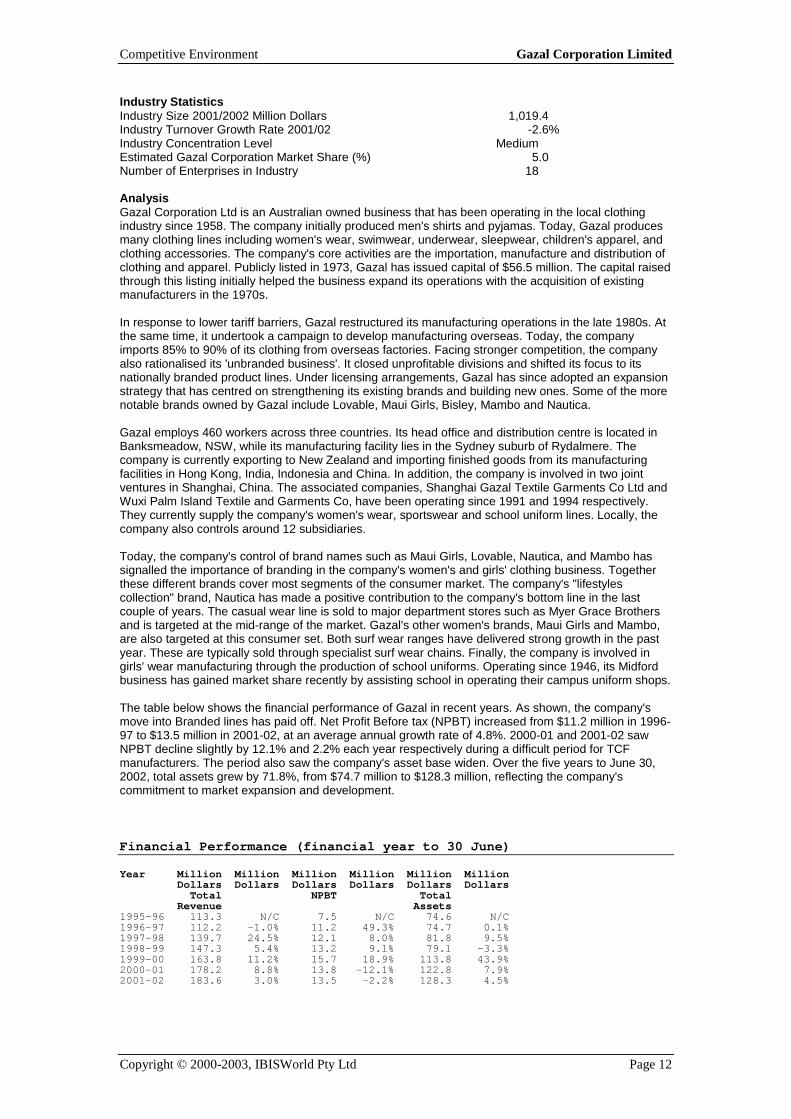
Industry Statistics Industry Size 2001/2002 Million Dollars 1,019.4 Industry Turnover Growth Rate 2001/02 -2.6% Industry Concentration Level Medium Estimated Gazal Corporation Market Share (%) 5.0 Number of Enterprises in Industry 18 Analysis Gazal Corporation Ltd is an Australian owned business that has been operating in the local clothing industry since 1958. The company initially produced men's shirts and pyjamas. Today, Gazal produces many clothing lines including women's wear, swimwear, underwear, sleepwear, children's apparel, and clothing accessories. The company's core activities are the importation, manufacture and distribution of clothing and apparel. Publicly listed in 1973, Gazal has issued capital of $56.5 million. The capital raised through this listing initially helped the business expand its operations with the acquisition of existing manufacturers in the 1970s. In response to lower tariff barriers, Gazal restructured its manufacturing operations in the late 1980s. At the same time, it undertook a campaign to develop manufacturing overseas. Today, the company imports 85% to 90% of its clothing from overseas factories. Facing stronger competition, the company also rationalised its 'unbranded business'. It closed unprofitable divisions and shifted its focus to its nationally branded product lines. Under licensing arrangements, Gazal has since adopted an expansion strategy that has centred on strengthening its existing brands and building new ones. Some of the more notable brands owned by Gazal include Lovable, Maui Girls, Bisley, Mambo and Nautica. Gazal employs 460 workers across three countries. Its head office and distribution centre is located in Banksmeadow, NSW, while its manufacturing facility lies in the Sydney suburb of Rydalmere. The company is currently exporting to New Zealand and importing finished goods from its manufacturing facilities in Hong Kong, India, Indonesia and China. In addition, the company is involved in two joint ventures in Shanghai, China. The associated companies, Shanghai Gazal Textile Garments Co Ltd and Wuxi Palm Island Textile and Garments Co, have been operating since 1991 and 1994 respectively. They currently supply the company's women's wear, sportswear and school uniform lines. Locally, the company also controls around 12 subsidiaries. Today, the company's control of brand names such as Maui Girls, Lovable, Nautica, and Mambo has signalled the importance of branding in the company's women's and girls' clothing business. Together these different brands cover most segments of the consumer market. The company's "lifestyles collection" brand, Nautica has made a positive contribution to the company's bottom line in the last couple of years. The casual wear line is sold to major department stores such as Myer Grace Brothers and is targeted at the mid-range of the market. Gazal's other women's brands, Maui Girls and Mambo, are also targeted at this consumer set. Both surf wear ranges have delivered strong growth in the past year. These are typically sold through specialist surf wear chains. Finally, the company is involved in girls' wear manufacturing through the production of school uniforms. Operating since 1946, its Midford business has gained market share recently by assisting school in operating their campus uniform shops. The table below shows the financial performance of Gazal in recent years. As shown, the company's move into Branded lines has paid off. Net Profit Before tax (NPBT) increased from $11.2 million in 1996-97 to $13.5 million in 2001-02, at an average annual growth rate of 4.8%. 2000-01 and 2001-02 saw NPBT decline slightly by 12.1% and 2.2% each year respectively during a difficult period for TCF manufacturers. The period also saw the company's asset base widen. Over the five years to June 30, 2002, total assets grew by 71.8%, from $74.7 million to $128.3 million, reflecting the company's commitment to market expansion and development. Financial Performance (financial year to 30 June) Year Million Million Million Million Million Million Dollars Dollars Dollars Dollars Dollars Dollars Total NPBT Total Revenue Assets 1995-96 113.3 N/C 7.5 N/C 74.6 N/C 1996-97 112.2 -1.0% 11.2 49.3% 74.7 0.1% 1997-98 139.7 24.5% 12.1 8.0% 81.8 9.5% 1998-99 147.3 5.4% 13.2 9.1% 79.1 -3.3% 1999-00 163.8 11.2% 15.7 18.9% 113.8 43.9% 2000-01 178.2 8.8% 13.8 -12.1% 122.8 7.9% 2001-02 183.6 3.0% 13.5 -2.2% 128.3 4.5%
Competitive Environment Gazal Corporation Limited
Copyright © 2000-2003, IBISWorld Pty Ltd Page 13
The company's performance was particularly strong during 1999-00. During the year, revenue increased 11.2% to $163.8 million, and net profit increased by 18.9% to $15.7 million. This revenue ranked Gazal 746th in BRW's top 5,000 Australian companies. This sound performance in revenue was partly due to increased sales pre-GST when price rises on apparel items were expected after its introduction. Favourable profit results have allowed the company to deliver a 10% increase in dividends for fully franked shares in 1999-00 and the company's earnings per share (EPS) rose by 12%. The Gazal acquisition of Mambo during 1999-00 increased the groups' interest bearing debt to equity ratio from 5.6% in 1999 to 19.0%. While this is still low in industry comparisons, the associated interest expense will add to costs. The company's solid performance in 1999-00 was only blemished by a rise in operating costs. Management has attributed this to the impact of the weak Australian dollar on the cost of its imported inputs. In March 2000, Gazal purchased 100% of shares in Mambo Graphics Pty Ltd and Mambo Street Pty Ltd. Although Gazal previously manufactured and distributed Mambo clothing in Australia under license, the company now owns the worldwide Mambo brand. The Mambo trademark is registered in 30 countries worldwide and has become synonymous with Australian fashion. The company also gained considerable exposure due to the 2000 Sydney Olympic Games, supplying uniforms to the Australian athletes for the opening and closing ceremonies. 2000-01 produced a slightly lower profit of $13.8 million, down 12.1% from 1999-00, on higher turnover of $178.2 million, up 8.8%. The post-GST softness in clothing demand did not seem to affect Gazal, partly because of increased sales of the Mambo label by 11.2%. This result was attributed to high consumer demand in the early half of the year, flowing from a contract to supply the Australian Olympic team at the 2000 Sydney Olympic Games. 2001-02 saw an increase in revenue by 3.0% to $183.6 million and, similar to 2000-01, a slight decrease in profit before tax of 2.2% to $13.5 million. Total dividends were 13.75 cents per share, up from the previous year. After a slow first half to the year, due to the September 11 terrorist attacks in the US and subsequent decline in consumer confidence, the company reported strong results in the second half of the year. This was due to more effective stock management, a slightly appreciating Australian dollar, and the negotiation of lower prices for stock from Asian suppliers. The year also saw the continued solid performance of the Mambo brand in Australia and overseas. Gazal is forecasting continued strong growth in the 2002-03 financial year for its women's and girls' manufacturing business. The company is looking to continue the Mambo label's expansion in the UK and Europe, where strong orders from about 200 accounts have been secured for the 2002 European winter. Also, increased investment and exposure of the Maui Girl label will strengthen its position within the casual street and surf market. Major Competitors Market Share Supre Pty Limited 6.0 % Gazal Corporation Limited 5.0 % Levi Strauss (Australia) Pty Ltd 4.0 % Australian Fashion Group Pty Limited 4.0 % ALSCO Pty Ltd 3.0 %
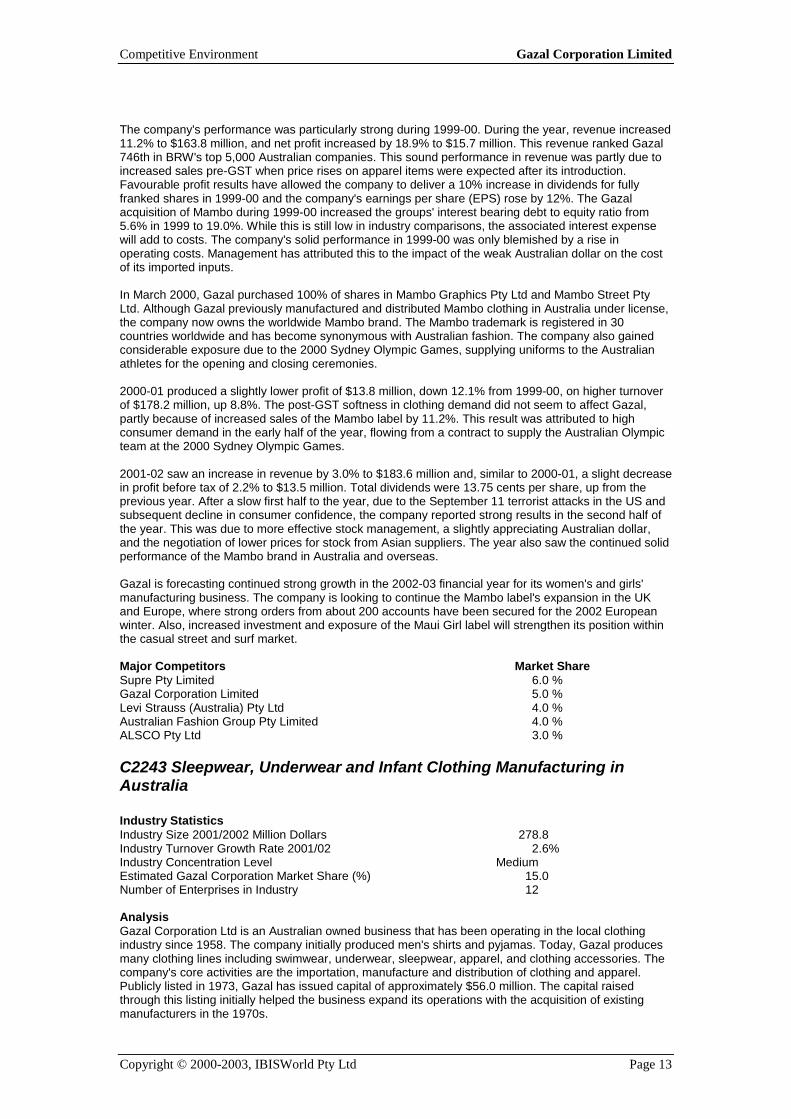
C2243 Sleepwear, Underwear and Infant Clothing Manufacturing in Australia Industry Statistics Industry Size 2001/2002 Million Dollars 278.8 Industry Turnover Growth Rate 2001/02 2.6% Industry Concentration Level Medium Estimated Gazal Corporation Market Share (%) 15.0 Number of Enterprises in Industry 12 Analysis Gazal Corporation Ltd is an Australian owned business that has been operating in the local clothing industry since 1958. The company initially produced men's shirts and pyjamas. Today, Gazal produces many clothing lines including swimwear, underwear, sleepwear, apparel, and clothing accessories. The company's core activities are the importation, manufacture and distribution of clothing and apparel. Publicly listed in 1973, Gazal has issued capital of approximately $56.0 million. The capital raised through this listing initially helped the business expand its operations with the acquisition of existing manufacturers in the 1970s.
Competitive Environment Gazal Corporation Limited
Copyright © 2000-2003, IBISWorld Pty Ltd Page 14
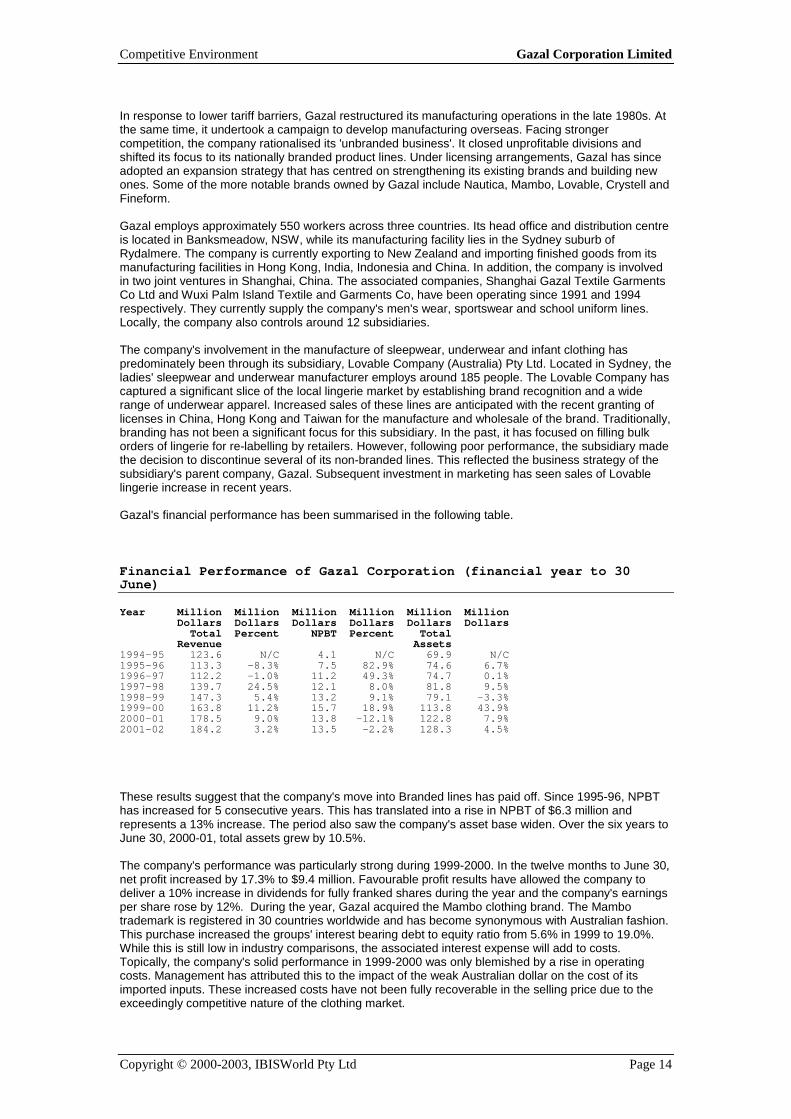
In response to lower tariff barriers, Gazal restructured its manufacturing operations in the late 1980s. At the same time, it undertook a campaign to develop manufacturing overseas. Facing stronger competition, the company rationalised its 'unbranded business'. It closed unprofitable divisions and shifted its focus to its nationally branded product lines. Under licensing arrangements, Gazal has since adopted an expansion strategy that has centred on strengthening its existing brands and building new ones. Some of the more notable brands owned by Gazal include Nautica, Mambo, Lovable, Crystell and Fineform. Gazal employs approximately 550 workers across three countries. Its head office and distribution centre is located in Banksmeadow, NSW, while its manufacturing facility lies in the Sydney suburb of Rydalmere. The company is currently exporting to New Zealand and importing finished goods from its manufacturing facilities in Hong Kong, India, Indonesia and China. In addition, the company is involved in two joint ventures in Shanghai, China. The associated companies, Shanghai Gazal Textile Garments Co Ltd and Wuxi Palm Island Textile and Garments Co, have been operating since 1991 and 1994 respectively. They currently supply the company's men's wear, sportswear and school uniform lines. Locally, the company also controls around 12 subsidiaries. The company's involvement in the manufacture of sleepwear, underwear and infant clothing has predominately been through its subsidiary, Lovable Company (Australia) Pty Ltd. Located in Sydney, the ladies' sleepwear and underwear manufacturer employs around 185 people. The Lovable Company has captured a significant slice of the local lingerie market by establishing brand recognition and a wide range of underwear apparel. Increased sales of these lines are anticipated with the recent granting of licenses in China, Hong Kong and Taiwan for the manufacture and wholesale of the brand. Traditionally, branding has not been a significant focus for this subsidiary. In the past, it has focused on filling bulk orders of lingerie for re-labelling by retailers. However, following poor performance, the subsidiary made the decision to discontinue several of its non-branded lines. This reflected the business strategy of the subsidiary's parent company, Gazal. Subsequent investment in marketing has seen sales of Lovable lingerie increase in recent years. Gazal's financial performance has been summarised in the following table. Financial Performance of Gazal Corporation (financial year to 30 June) Year Million Million Million Million Million Million Dollars Dollars Dollars Dollars Dollars Dollars Total Percent NPBT Percent Total Revenue Assets 1994-95 123.6 N/C 4.1 N/C 69.9 N/C 1995-96 113.3 -8.3% 7.5 82.9% 74.6 6.7% 1996-97 112.2 -1.0% 11.2 49.3% 74.7 0.1% 1997-98 139.7 24.5% 12.1 8.0% 81.8 9.5% 1998-99 147.3 5.4% 13.2 9.1% 79.1 -3.3% 1999-00 163.8 11.2% 15.7 18.9% 113.8 43.9% 2000-01 178.5 9.0% 13.8 -12.1% 122.8 7.9% 2001-02 184.2 3.2% 13.5 -2.2% 128.3 4.5% These results suggest that the company's move into Branded lines has paid off. Since 1995-96, NPBT has increased for 5 consecutive years. This has translated into a rise in NPBT of $6.3 million and represents a 13% increase. The period also saw the company's asset base widen. Over the six years to June 30, 2000-01, total assets grew by 10.5%. The company's performance was particularly strong during 1999-2000. In the twelve months to June 30, net profit increased by 17.3% to $9.4 million. Favourable profit results have allowed the company to deliver a 10% increase in dividends for fully franked shares during the year and the company's earnings per share rose by 12%. During the year, Gazal acquired the Mambo clothing brand. The Mambo trademark is registered in 30 countries worldwide and has become synonymous with Australian fashion. This purchase increased the groups' interest bearing debt to equity ratio from 5.6% in 1999 to 19.0%. While this is still low in industry comparisons, the associated interest expense will add to costs. Topically, the company's solid performance in 1999-2000 was only blemished by a rise in operating costs. Management has attributed this to the impact of the weak Australian dollar on the cost of its imported inputs. These increased costs have not been fully recoverable in the selling price due to the exceedingly competitive nature of the clothing market.
Competitive Environment Gazal Corporation Limited
Copyright © 2000-2003, IBISWorld Pty Ltd Page 15
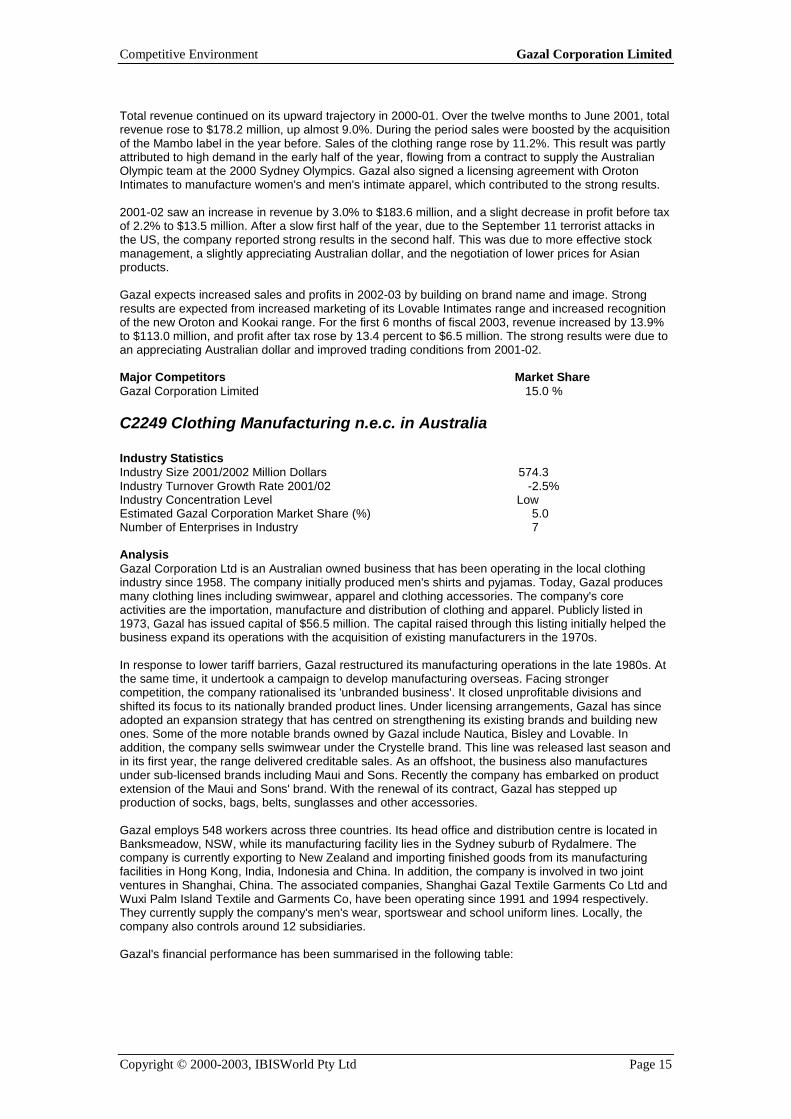
Total revenue continued on its upward trajectory in 2000-01. Over the twelve months to June 2001, total revenue rose to $178.2 million, up almost 9.0%. During the period sales were boosted by the acquisition of the Mambo label in the year before. Sales of the clothing range rose by 11.2%. This result was partly attributed to high demand in the early half of the year, flowing from a contract to supply the Australian Olympic team at the 2000 Sydney Olympics. Gazal also signed a licensing agreement with Oroton Intimates to manufacture women's and men's intimate apparel, which contributed to the strong results. 2001-02 saw an increase in revenue by 3.0% to $183.6 million, and a slight decrease in profit before tax of 2.2% to $13.5 million. After a slow first half of the year, due to the September 11 terrorist attacks in the US, the company reported strong results in the second half. This was due to more effective stock management, a slightly appreciating Australian dollar, and the negotiation of lower prices for Asian products. Gazal expects increased sales and profits in 2002-03 by building on brand name and image. Strong results are expected from increased marketing of its Lovable Intimates range and increased recognition of the new Oroton and Kookai range. For the first 6 months of fiscal 2003, revenue increased by 13.9% to $113.0 million, and profit after tax rose by 13.4 percent to $6.5 million. The strong results were due to an appreciating Australian dollar and improved trading conditions from 2001-02. Major Competitors Market Share Gazal Corporation Limited 15.0 %
C2249 Clothing Manufacturing n.e.c. in Australia Industry Statistics Industry Size 2001/2002 Million Dollars 574.3 Industry Turnover Growth Rate 2001/02 -2.5% Industry Concentration Level Low Estimated Gazal Corporation Market Share (%) 5.0 Number of Enterprises in Industry 7 Analysis Gazal Corporation Ltd is an Australian owned business that has been operating in the local clothing industry since 1958. The company initially produced men's shirts and pyjamas. Today, Gazal produces many clothing lines including swimwear, apparel and clothing accessories. The company's core activities are the importation, manufacture and distribution of clothing and apparel. Publicly listed in 1973, Gazal has issued capital of $56.5 million. The capital raised through this listing initially helped the business expand its operations with the acquisition of existing manufacturers in the 1970s. In response to lower tariff barriers, Gazal restructured its manufacturing operations in the late 1980s. At the same time, it undertook a campaign to develop manufacturing overseas. Facing stronger competition, the company rationalised its 'unbranded business'. It closed unprofitable divisions and shifted its focus to its nationally branded product lines. Under licensing arrangements, Gazal has since adopted an expansion strategy that has centred on strengthening its existing brands and building new ones. Some of the more notable brands owned by Gazal include Nautica, Bisley and Lovable. In addition, the company sells swimwear under the Crystelle brand. This line was released last season and in its first year, the range delivered creditable sales. As an offshoot, the business also manufactures under sub-licensed brands including Maui and Sons. Recently the company has embarked on product extension of the Maui and Sons' brand. With the renewal of its contract, Gazal has stepped up production of socks, bags, belts, sunglasses and other accessories. Gazal employs 548 workers across three countries. Its head office and distribution centre is located in Banksmeadow, NSW, while its manufacturing facility lies in the Sydney suburb of Rydalmere. The company is currently exporting to New Zealand and importing finished goods from its manufacturing facilities in Hong Kong, India, Indonesia and China. In addition, the company is involved in two joint ventures in Shanghai, China. The associated companies, Shanghai Gazal Textile Garments Co Ltd and Wuxi Palm Island Textile and Garments Co, have been operating since 1991 and 1994 respectively. They currently supply the company's men's wear, sportswear and school uniform lines. Locally, the company also controls around 12 subsidiaries. Gazal's financial performance has been summarised in the following table:
Competitive Environment Gazal Corporation Limited
Copyright © 2000-2003, IBISWorld Pty Ltd Page 16
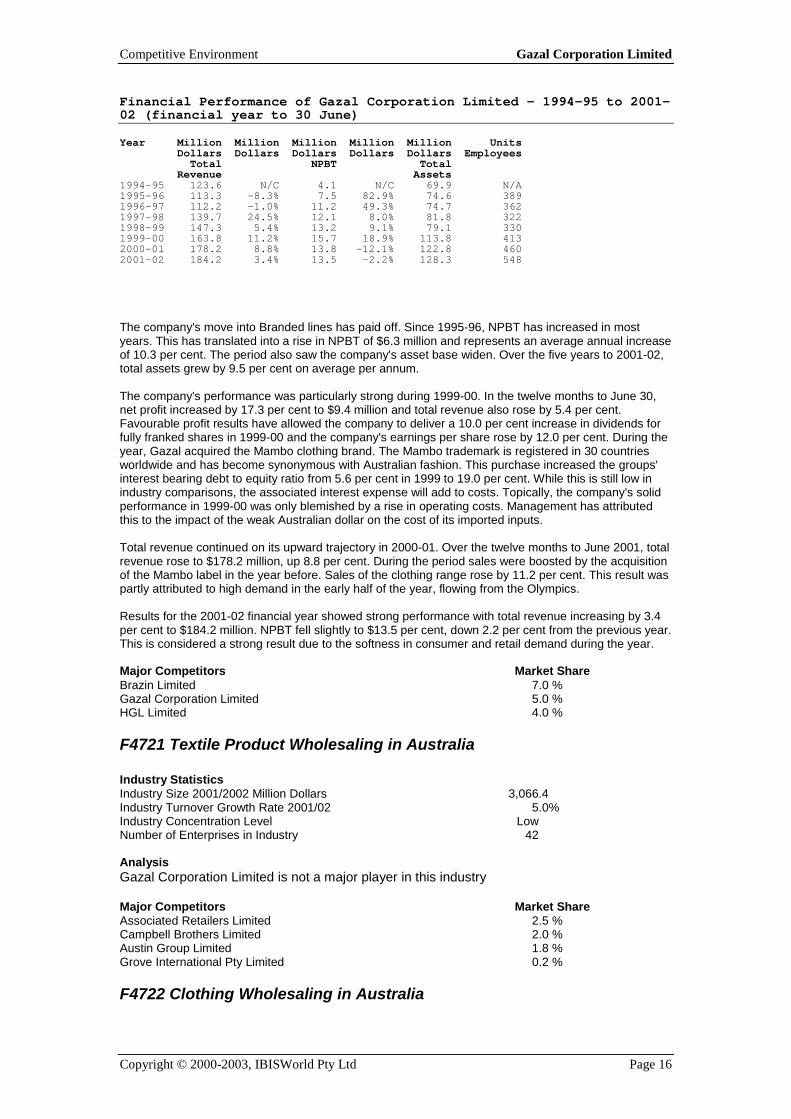
Financial Performance of Gazal Corporation Limited - 1994-95 to 2001-02 (financial year to 30 June) Year Million Million Million Million Million Units Dollars Dollars Dollars Dollars Dollars Employees Total NPBT Total Revenue Assets 1994-95 123.6 N/C 4.1 N/C 69.9 N/A 1995-96 113.3 -8.3% 7.5 82.9% 74.6 389 1996-97 112.2 -1.0% 11.2 49.3% 74.7 362 1997-98 139.7 24.5% 12.1 8.0% 81.8 322 1998-99 147.3 5.4% 13.2 9.1% 79.1 330 1999-00 163.8 11.2% 15.7 18.9% 113.8 413 2000-01 178.2 8.8% 13.8 -12.1% 122.8 460 2001-02 184.2 3.4% 13.5 -2.2% 128.3 548 The company's move into Branded lines has paid off. Since 1995-96, NPBT has increased in most years. This has translated into a rise in NPBT of $6.3 million and represents an average annual increase of 10.3 per cent. The period also saw the company's asset base widen. Over the five years to 2001-02, total assets grew by 9.5 per cent on average per annum. The company's performance was particularly strong during 1999-00. In the twelve months to June 30, net profit increased by 17.3 per cent to $9.4 million and total revenue also rose by 5.4 per cent. Favourable profit results have allowed the company to deliver a 10.0 per cent increase in dividends for fully franked shares in 1999-00 and the company's earnings per share rose by 12.0 per cent. During the year, Gazal acquired the Mambo clothing brand. The Mambo trademark is registered in 30 countries worldwide and has become synonymous with Australian fashion. This purchase increased the groups' interest bearing debt to equity ratio from 5.6 per cent in 1999 to 19.0 per cent. While this is still low in industry comparisons, the associated interest expense will add to costs. Topically, the company's solid performance in 1999-00 was only blemished by a rise in operating costs. Management has attributed this to the impact of the weak Australian dollar on the cost of its imported inputs. Total revenue continued on its upward trajectory in 2000-01. Over the twelve months to June 2001, total revenue rose to $178.2 million, up 8.8 per cent. During the period sales were boosted by the acquisition of the Mambo label in the year before. Sales of the clothing range rose by 11.2 per cent. This result was partly attributed to high demand in the early half of the year, flowing from the Olympics. Results for the 2001-02 financial year showed strong performance with total revenue increasing by 3.4 per cent to $184.2 million. NPBT fell slightly to $13.5 per cent, down 2.2 per cent from the previous year. This is considered a strong result due to the softness in consumer and retail demand during the year. Major Competitors Market Share Brazin Limited 7.0 % Gazal Corporation Limited 5.0 % HGL Limited 4.0 %
F4721 Textile Product Wholesaling in Australia Industry Statistics Industry Size 2001/2002 Million Dollars 3,066.4 Industry Turnover Growth Rate 2001/02 5.0% Industry Concentration Level Low Number of Enterprises in Industry 42 Analysis Gazal Corporation Limited is not a major player in this industry Major Competitors Market Share Associated Retailers Limited 2.5 % Campbell Brothers Limited 2.0 % Austin Group Limited 1.8 % Grove International Pty Limited 0.2 %
F4722 Clothing Wholesaling in Australia
Competitive Environment Gazal Corporation Limited
Copyright © 2000-2003, IBISWorld Pty Ltd Page 17
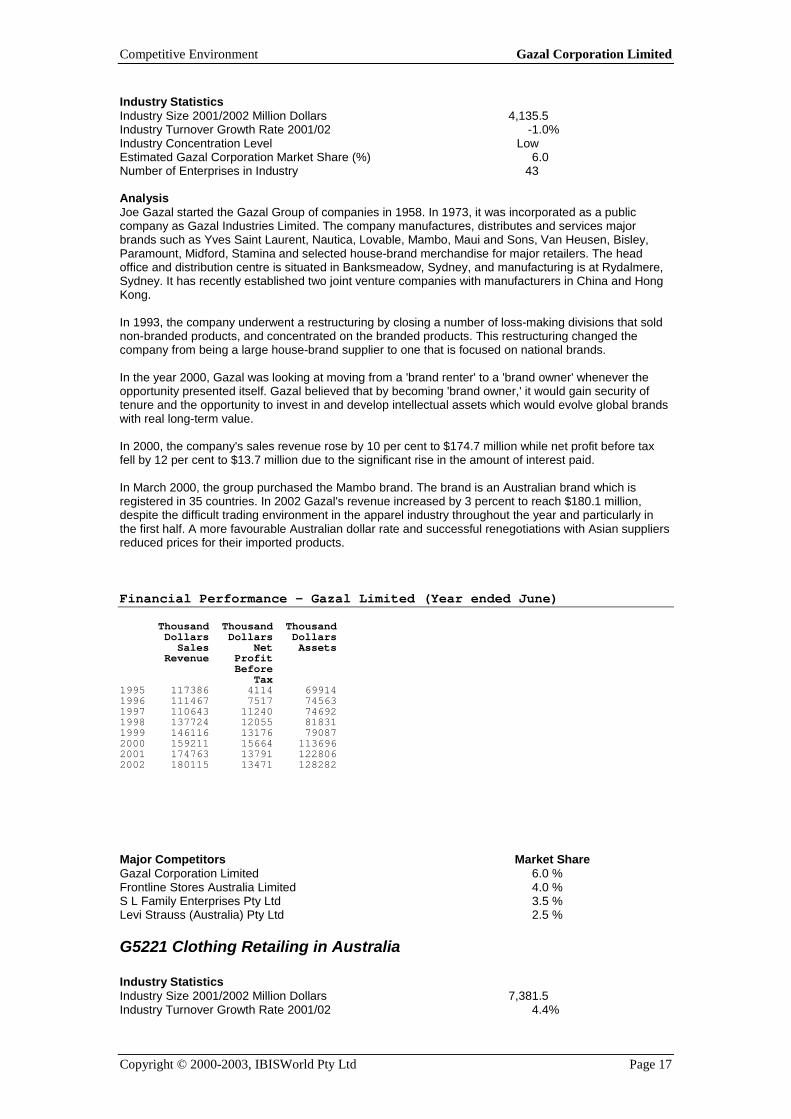
Industry Statistics Industry Size 2001/2002 Million Dollars 4,135.5 Industry Turnover Growth Rate 2001/02 -1.0% Industry Concentration Level Low Estimated Gazal Corporation Market Share (%) 6.0 Number of Enterprises in Industry 43 Analysis Joe Gazal started the Gazal Group of companies in 1958. In 1973, it was incorporated as a public company as Gazal Industries Limited. The company manufactures, distributes and services major brands such as Yves Saint Laurent, Nautica, Lovable, Mambo, Maui and Sons, Van Heusen, Bisley, Paramount, Midford, Stamina and selected house-brand merchandise for major retailers. The head office and distribution centre is situated in Banksmeadow, Sydney, and manufacturing is at Rydalmere, Sydney. It has recently established two joint venture companies with manufacturers in China and Hong Kong. In 1993, the company underwent a restructuring by closing a number of loss-making divisions that sold non-branded products, and concentrated on the branded products. This restructuring changed the company from being a large house-brand supplier to one that is focused on national brands. In the year 2000, Gazal was looking at moving from a 'brand renter' to a 'brand owner' whenever the opportunity presented itself. Gazal believed that by becoming 'brand owner,' it would gain security of tenure and the opportunity to invest in and develop intellectual assets which would evolve global brands with real long-term value. In 2000, the company's sales revenue rose by 10 per cent to $174.7 million while net profit before tax fell by 12 per cent to $13.7 million due to the significant rise in the amount of interest paid. In March 2000, the group purchased the Mambo brand. The brand is an Australian brand which is registered in 35 countries. In 2002 Gazal's revenue increased by 3 percent to reach $180.1 million, despite the difficult trading environment in the apparel industry throughout the year and particularly in the first half. A more favourable Australian dollar rate and successful renegotiations with Asian suppliers reduced prices for their imported products. Financial Performance - Gazal Limited (Year ended June) Thousand Thousand Thousand Dollars Dollars Dollars Sales Net Assets Revenue Profit Before Tax 1995 117386 4114 69914 1996 111467 7517 74563 1997 110643 11240 74692 1998 137724 12055 81831 1999 146116 13176 79087 2000 159211 15664 113696 2001 174763 13791 122806 2002 180115 13471 128282 Major Competitors Market Share Gazal Corporation Limited 6.0 % Frontline Stores Australia Limited 4.0 % S L Family Enterprises Pty Ltd 3.5 % Levi Strauss (Australia) Pty Ltd 2.5 %
G5221 Clothing Retailing in Australia Industry Statistics Industry Size 2001/2002 Million Dollars 7,381.5 Industry Turnover Growth Rate 2001/02 4.4%
Competitive Environment Gazal Corporation Limited
Copyright © 2000-2003, IBISWorld Pty Ltd Page 18
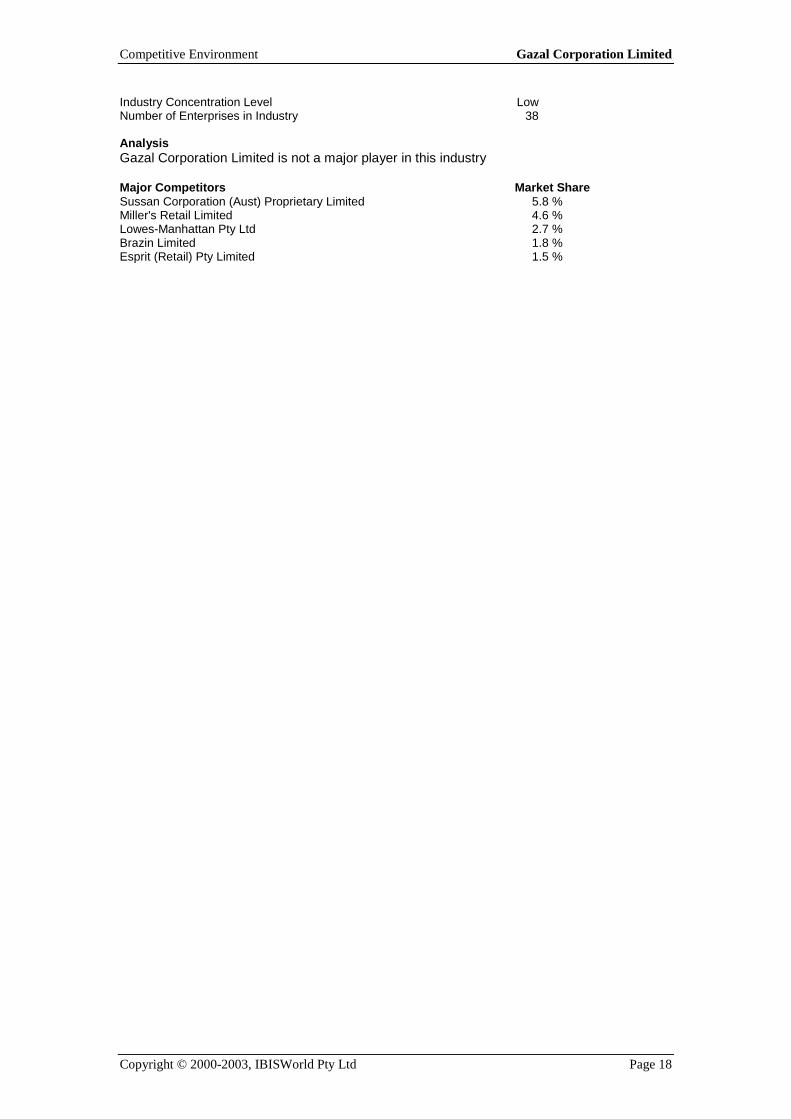
Industry Concentration Level Low Number of Enterprises in Industry 38 Analysis Gazal Corporation Limited is not a major player in this industry Major Competitors Market Share Sussan Corporation (Aust) Proprietary Limited 5.8 % Miller's Retail Limited 4.6 % Lowes-Manhattan Pty Ltd 2.7 % Brazin Limited 1.8 % Esprit (Retail) Pty Limited 1.5 %
Subsidiaries Gazal Corporation Limited
Copyright © 2000-2003, IBISWorld Pty Ltd Page 19
Subsidiaries
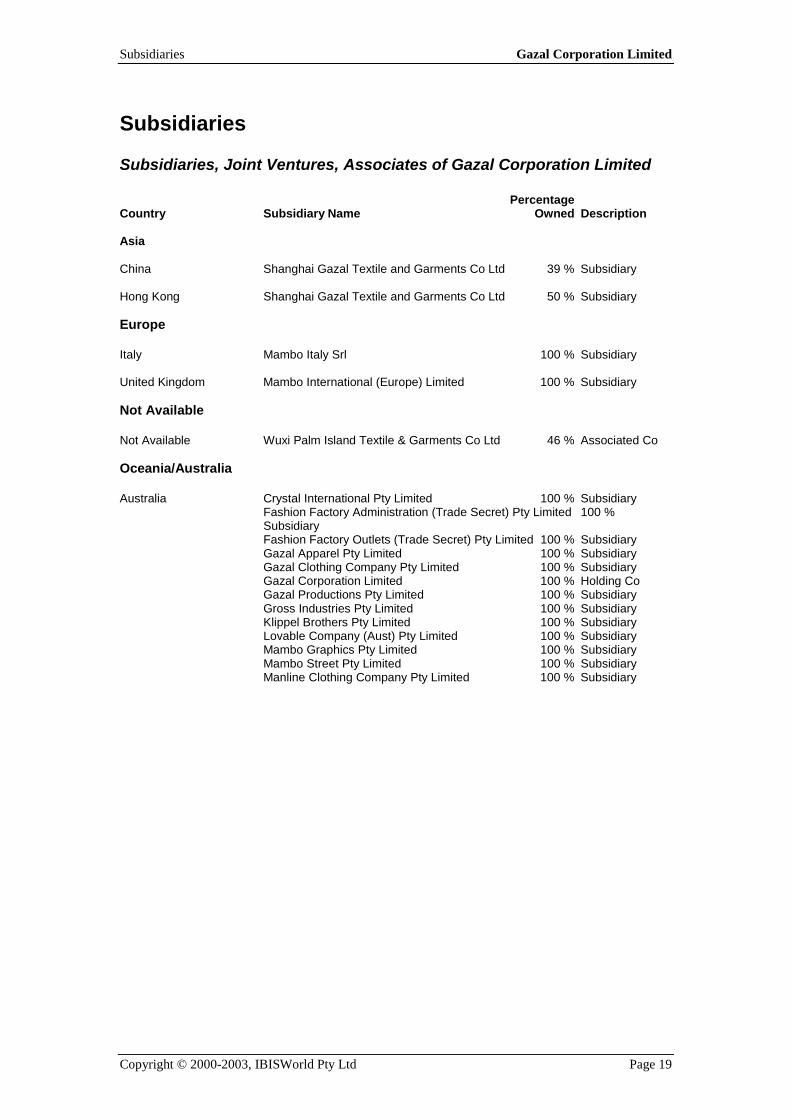
Subsidiaries, Joint Ventures, Associates of Gazal Corporation Limited Percentage Country Subsidiary Name Owned Description Asia China Shanghai Gazal Textile and Garments Co Ltd 39 % Subsidiary Hong Kong Shanghai Gazal Textile and Garments Co Ltd 50 % Subsidiary Europe Italy Mambo Italy Srl 100 % Subsidiary United Kingdom Mambo International (Europe) Limited 100 % Subsidiary Not Available Not Available Wuxi Palm Island Textile & Garments Co Ltd 46 % Associated Co Oceania/Australia Australia Crystal International Pty Limited 100 % Subsidiary Fashion Factory Administration (Trade Secret) Pty Limited 100 % Subsidiary Fashion Factory Outlets (Trade Secret) Pty Limited 100 % Subsidiary Gazal Apparel Pty Limited 100 % Subsidiary Gazal Clothing Company Pty Limited 100 % Subsidiary Gazal Corporation Limited 100 % Holding Co Gazal Productions Pty Limited 100 % Subsidiary Gross Industries Pty Limited 100 % Subsidiary Klippel Brothers Pty Limited 100 % Subsidiary Lovable Company (Aust) Pty Limited 100 % Subsidiary Mambo Graphics Pty Limited 100 % Subsidiary Mambo Street Pty Limited 100 % Subsidiary Manline Clothing Company Pty Limited 100 % Subsidiary
Shareholders Gazal Corporation Limited
Copyright © 2000-2003, IBISWorld Pty Ltd Page 20
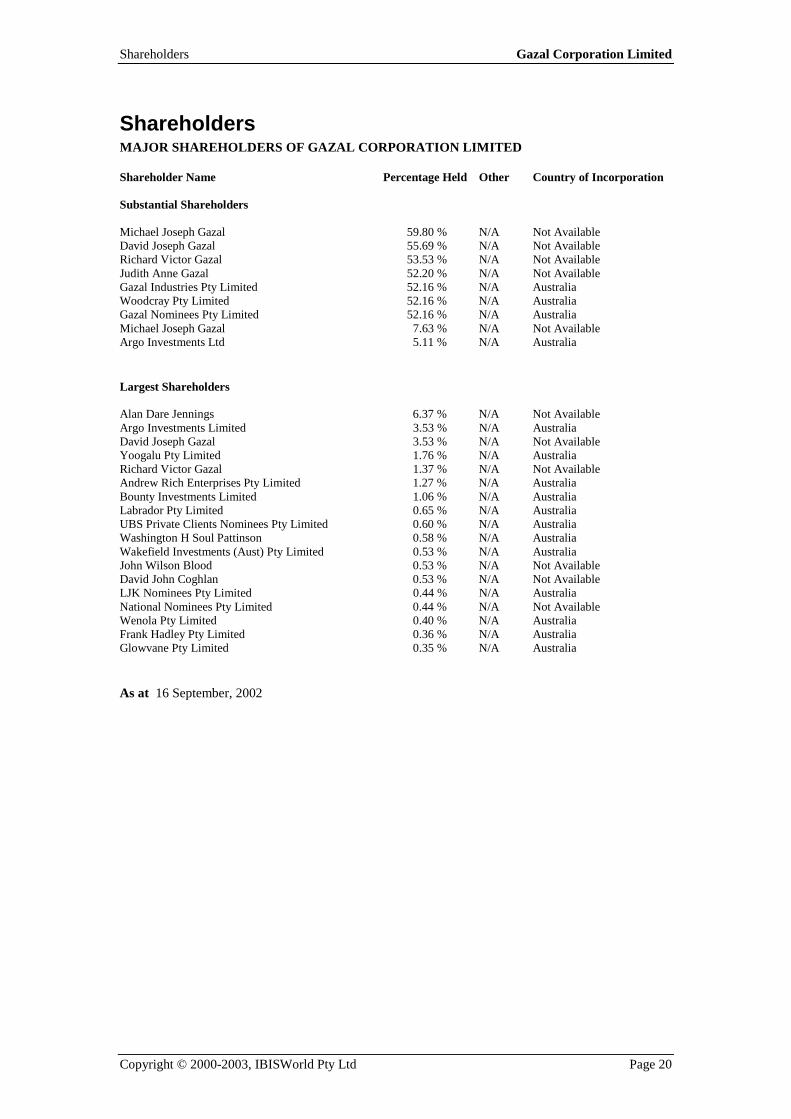
Shareholders MAJOR SHAREHOLDERS OF GAZAL CORPORATION LIMITED Shareholder Name Percentage Held Other Country of Incorporation Substantial Shareholders Michael Joseph Gazal 59.80 % N/A Not Available David Joseph Gazal 55.69 % N/A Not Available Richard Victor Gazal 53.53 % N/A Not Available Judith Anne Gazal 52.20 % N/A Not Available Gazal Industries Pty Limited 52.16 % N/A Australia Woodcray Pty Limited 52.16 % N/A Australia Gazal Nominees Pty Limited 52.16 % N/A Australia Michael Joseph Gazal 7.63 % N/A Not Available Argo Investments Ltd 5.11 % N/A Australia Largest Shareholders Alan Dare Jennings 6.37 % N/A Not Available Argo Investments Limited 3.53 % N/A Australia David Joseph Gazal 3.53 % N/A Not Available Yoogalu Pty Limited 1.76 % N/A Australia Richard Victor Gazal 1.37 % N/A Not Available Andrew Rich Enterprises Pty Limited 1.27 % N/A Australia Bounty Investments Limited 1.06 % N/A Australia Labrador Pty Limited 0.65 % N/A Australia UBS Private Clients Nominees Pty Limited 0.60 % N/A Australia Washington H Soul Pattinson 0.58 % N/A Australia Wakefield Investments (Aust) Pty Limited 0.53 % N/A Australia John Wilson Blood 0.53 % N/A Not Available David John Coghlan 0.53 % N/A Not Available LJK Nominees Pty Limited 0.44 % N/A Australia National Nominees Pty Limited 0.44 % N/A Not Available Wenola Pty Limited 0.40 % N/A Australia Frank Hadley Pty Limited 0.36 % N/A Australia Glowvane Pty Limited 0.35 % N/A Australia As at 16 September, 2002
Service Providers Gazal Corporation Limited
Copyright © 2000-2003, IBISWorld Pty Ltd Page 21
Service Providers
Service Providers to Gazal Corporation Limited Auditor Ernst & Young Banker Westpac Banking Corp Insurance Broker Jardine Lloyd Thompson Solicitor Blake Dawson Waldron Hunt & Hunt Telecommunication Not available As at : 30 June, 2002
News Gazal Corporation Limited
Copyright © 2000-2003, IBISWorld Pty Ltd Page 22
News Mambo trouble a downer for Gazal : 1-September-2003 In spite of the sweltering conditions being felt in many European countries this northern summer, surfwear label Mambo has struggled to make its mark in its first year in the European market. The worse-than-expected Mambo result was the only hiccup for Gazal Corporation, with group net profit rising 6.3% to $9.7 million for fiscal 2003 on sales growth of 9.4% to $200.9 million. Gazal controls a number of well known brands such as: Nautica, Van Heusen and Kookai. Source The Age, (Business 3)
Disclaimer Australian Foundation Investment Company Limited
Copyright © 2000-2003, IBISWorld Pty Ltd Page 1
IBISWorld Company Profile Report
Australian Foundation Investment Company Limited
This product has been supplied by IBISWorld Pty Ltd ('IBIS') solely for use by its authorised licences strictly in accordance with their licence agreements
with IBIS.
IBIS makes no representation to any other person with regard to the completeness or accuracy of the data or information contained herein, and it
accepts no responsibility and disclaims all liability (save for liability which cannot be lawfully disclaimed) for loss or damage whatsoever suffered or
incurred by any other person resulting from the use of, or reliance upon, the data or information contained herein.
Information provided is not financial product advice. This report contains general information only. It is not intended as financial product advice and
must not be relied upon as such. You should consider obtaining independent advice tailored to your specific circumstances before making any financial
decisions.
Copyright in this publication is owned by IBISWorld Pty Ltd. The publication is sold on the basis that the purchaser agrees not to copy the material contained
within it for other than the purchasers own purposes. In the event that the purchaser uses or quotes from the material in this publication - in papers,
reports, or opinions prepared for any other person - it is agreed that it will be sourced to:
IBISWorld Pty Ltd.
Contents Australian Foundation Investment Company Limited
Copyright © 2000-2003, IBISWorld Pty Ltd Page 2
Australian Foundation Investment Company Limited
Contents DETAIL................................................................................................................................................... 3
PERSONNEL.......................................................................................................................................... 4
FINANCIALS ......................................................................................................................................... 5 PROFIT AND LOSS ACCOUNT........................................................................................................ 5 BALANCE SHEET.............................................................................................................................. 5
SEGMENTS............................................................................................................................................ 6
SHAREHOLDERS................................................................................................................................. 7
SUBSIDIARY ......................................................................................................................................... 8
SERVICES.............................................................................................................................................. 9
NEWS .................................................................................................................................................... 10
Detail Australian Foundation Investment Company Limited
Copyright © 2000-2003, IBISWorld Pty Ltd Page 3
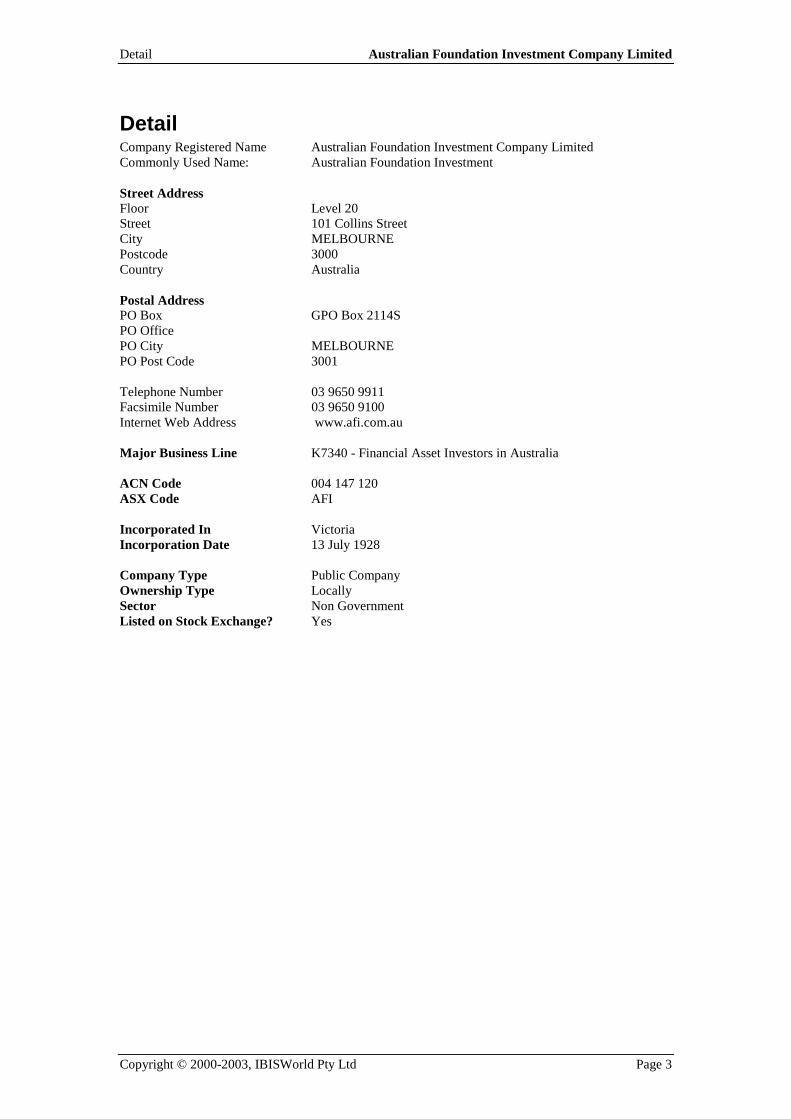
Detail Company Registered Name Australian Foundation Investment Company Limited Commonly Used Name: Australian Foundation Investment Street Address Floor Level 20 Street 101 Collins Street City MELBOURNE Postcode 3000 Country Australia Postal Address PO Box GPO Box 2114S PO Office PO City MELBOURNE PO Post Code 3001 Telephone Number 03 9650 9911 Facsimile Number 03 9650 9100 Internet Web Address www.afi.com.au Major Business Line K7340 - Financial Asset Investors in Australia ACN Code 004 147 120 ASX Code AFI Incorporated In Victoria Incorporation Date 13 July 1928 Company Type Public Company Ownership Type Locally Sector Non Government Listed on Stock Exchange? Yes
Personnel Australian Foundation Investment Company Limited
Copyright © 2000-2003, IBISWorld Pty Ltd Page 4
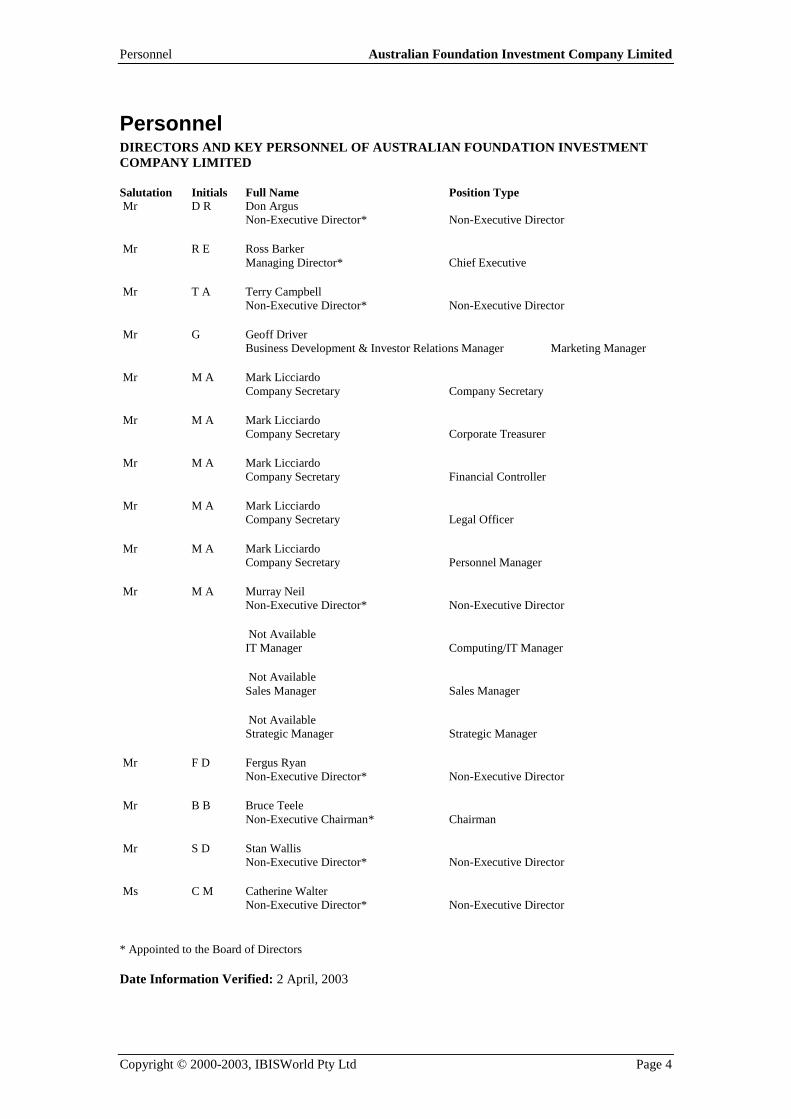
Personnel DIRECTORS AND KEY PERSONNEL OF AUSTRALIAN FOUNDATION INVESTMENT COMPANY LIMITED Salutation Initials Full Name Position Type Mr D R Don Argus Non-Executive Director* Non-Executive Director Mr R E Ross Barker Managing Director* Chief Executive Mr T A Terry Campbell Non-Executive Director* Non-Executive Director Mr G Geoff Driver Business Development & Investor Relations Manager Marketing Manager Mr M A Mark Licciardo Company Secretary Company Secretary Mr M A Mark Licciardo Company Secretary Corporate Treasurer Mr M A Mark Licciardo Company Secretary Financial Controller Mr M A Mark Licciardo Company Secretary Legal Officer Mr M A Mark Licciardo Company Secretary Personnel Manager Mr M A Murray Neil Non-Executive Director* Non-Executive Director Not Available IT Manager Computing/IT Manager Not Available Sales Manager Sales Manager Not Available Strategic Manager Strategic Manager Mr F D Fergus Ryan Non-Executive Director* Non-Executive Director Mr B B Bruce Teele Non-Executive Chairman* Chairman Mr S D Stan Wallis Non-Executive Director* Non-Executive Director Ms C M Catherine Walter Non-Executive Director* Non-Executive Director * Appointed to the Board of Directors Date Information Verified: 2 April, 2003
Financials Australian Foundation Investment Company Limited
Copyright © 2000-2003, IBISWorld Pty Ltd Page 5
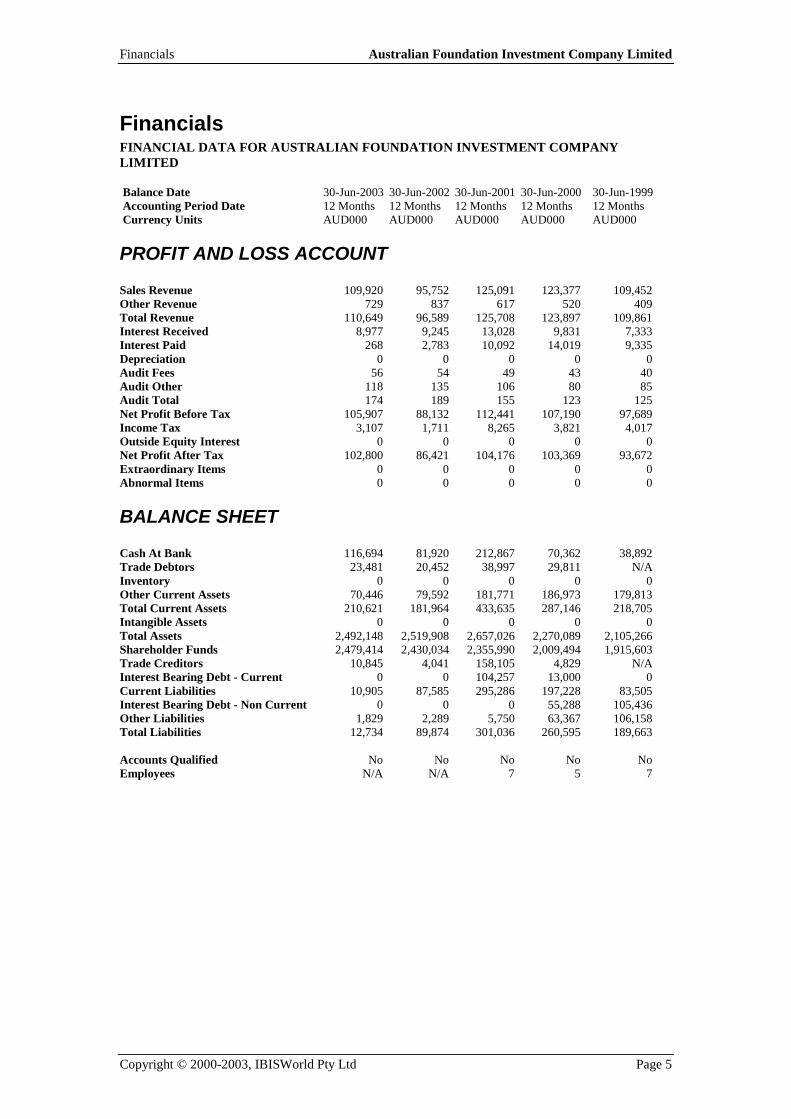
Financials FINANCIAL DATA FOR AUSTRALIAN FOUNDATION INVESTMENT COMPANY LIMITED Balance Date 30-Jun-2003 30-Jun-2002 30-Jun-2001 30-Jun-2000 30-Jun-1999 Accounting Period Date 12 Months 12 Months 12 Months 12 Months 12 Months Currency Units AUD000 AUD000 AUD000 AUD000 AUD000
PROFIT AND LOSS ACCOUNT Sales Revenue 109,920 95,752 125,091 123,377 109,452 Other Revenue 729 837 617 520 409 Total Revenue 110,649 96,589 125,708 123,897 109,861 Interest Received 8,977 9,245 13,028 9,831 7,333 Interest Paid 268 2,783 10,092 14,019 9,335 Depreciation 0 0 0 0 0 Audit Fees 56 54 49 43 40 Audit Other 118 135 106 80 85 Audit Total 174 189 155 123 125 Net Profit Before Tax 105,907 88,132 112,441 107,190 97,689 Income Tax 3,107 1,711 8,265 3,821 4,017 Outside Equity Interest 0 0 0 0 0 Net Profit After Tax 102,800 86,421 104,176 103,369 93,672 Extraordinary Items 0 0 0 0 0 Abnormal Items 0 0 0 0 0
BALANCE SHEET Cash At Bank 116,694 81,920 212,867 70,362 38,892 Trade Debtors 23,481 20,452 38,997 29,811 N/A Inventory 0 0 0 0 0 Other Current Assets 70,446 79,592 181,771 186,973 179,813 Total Current Assets 210,621 181,964 433,635 287,146 218,705 Intangible Assets 0 0 0 0 0 Total Assets 2,492,148 2,519,908 2,657,026 2,270,089 2,105,266 Shareholder Funds 2,479,414 2,430,034 2,355,990 2,009,494 1,915,603 Trade Creditors 10,845 4,041 158,105 4,829 N/A Interest Bearing Debt - Current 0 0 104,257 13,000 0 Current Liabilities 10,905 87,585 295,286 197,228 83,505 Interest Bearing Debt - Non Current 0 0 0 55,288 105,436 Other Liabilities 1,829 2,289 5,750 63,367 106,158 Total Liabilities 12,734 89,874 301,036 260,595 189,663 Accounts Qualified No No No No No Employees N/A N/A 7 5 7
Segments Australian Foundation Investment Company Limited
Copyright © 2000-2003, IBISWorld Pty Ltd Page 6
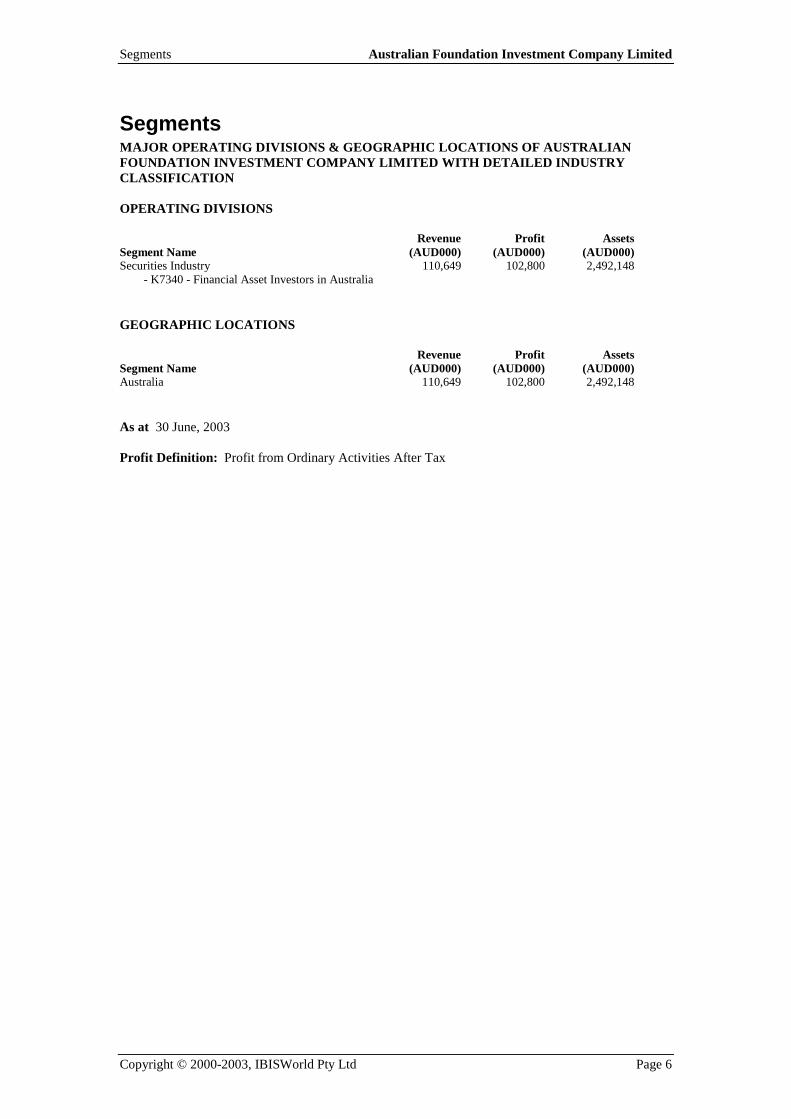
Segments MAJOR OPERATING DIVISIONS & GEOGRAPHIC LOCATIONS OF AUSTRALIAN FOUNDATION INVESTMENT COMPANY LIMITED WITH DETAILED INDUSTRY CLASSIFICATION OPERATING DIVISIONS Revenue Profit Assets Segment Name (AUD000) (AUD000) (AUD000) Securities Industry 110,649 102,800 2,492,148 - K7340 - Financial Asset Investors in Australia GEOGRAPHIC LOCATIONS Revenue Profit Assets Segment Name (AUD000) (AUD000) (AUD000) Australia 110,649 102,800 2,492,148 As at 30 June, 2003 Profit Definition: Profit from Ordinary Activities After Tax
Shareholders Australian Foundation Investment Company Limited
Copyright © 2000-2003, IBISWorld Pty Ltd Page 7
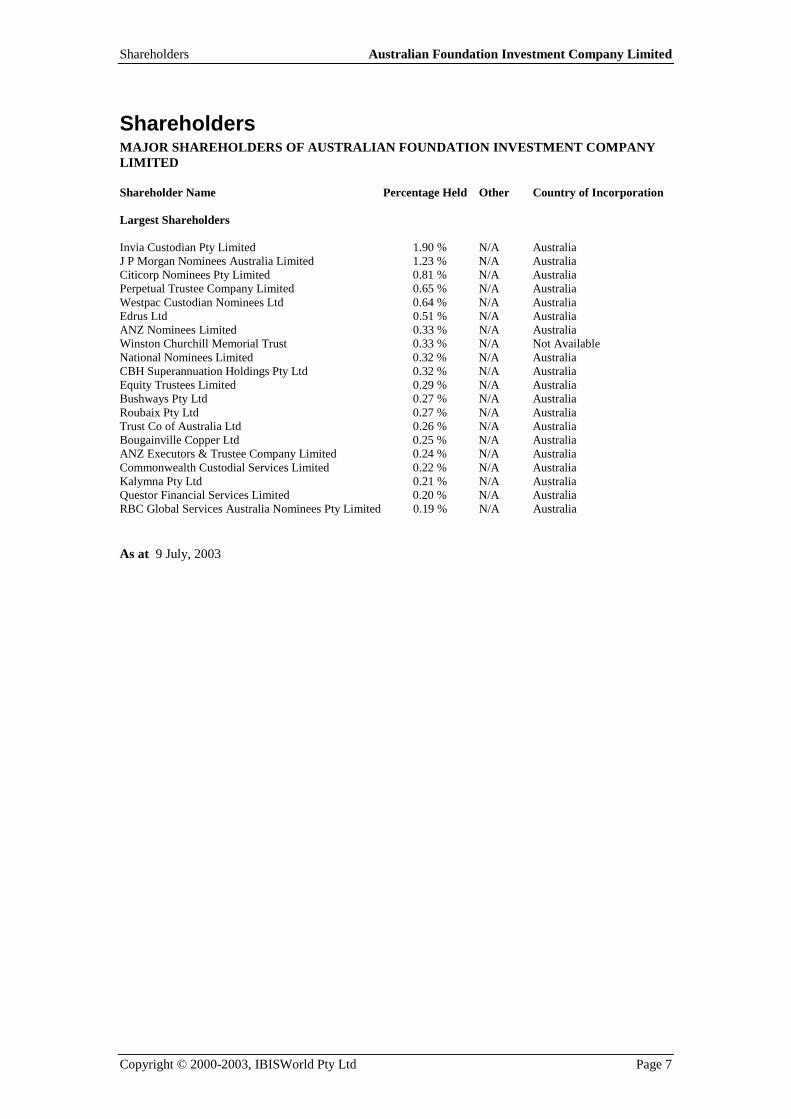
Shareholders MAJOR SHAREHOLDERS OF AUSTRALIAN FOUNDATION INVESTMENT COMPANY LIMITED Shareholder Name Percentage Held Other Country of Incorporation Largest Shareholders Invia Custodian Pty Limited 1.90 % N/A Australia J P Morgan Nominees Australia Limited 1.23 % N/A Australia Citicorp Nominees Pty Limited 0.81 % N/A Australia Perpetual Trustee Company Limited 0.65 % N/A Australia Westpac Custodian Nominees Ltd 0.64 % N/A Australia Edrus Ltd 0.51 % N/A Australia ANZ Nominees Limited 0.33 % N/A Australia Winston Churchill Memorial Trust 0.33 % N/A Not Available National Nominees Limited 0.32 % N/A Australia CBH Superannuation Holdings Pty Ltd 0.32 % N/A Australia Equity Trustees Limited 0.29 % N/A Australia Bushways Pty Ltd 0.27 % N/A Australia Roubaix Pty Ltd 0.27 % N/A Australia Trust Co of Australia Ltd 0.26 % N/A Australia Bougainville Copper Ltd 0.25 % N/A Australia ANZ Executors & Trustee Company Limited 0.24 % N/A Australia Commonwealth Custodial Services Limited 0.22 % N/A Australia Kalymna Pty Ltd 0.21 % N/A Australia Questor Financial Services Limited 0.20 % N/A Australia RBC Global Services Australia Nominees Pty Limited 0.19 % N/A Australia As at 9 July, 2003
Subsidiary Australian Foundation Investment Company Limited
Copyright © 2000-2003, IBISWorld Pty Ltd Page 8
Subsidiary SUBSIDIARIES, JOINT VENTURES, ASSOCIATES ETC. OF AUSTRALIAN FOUNDATION INVESTMENT COMPANY LIMITED Subsidiary Name Percentage Owned Country of Incorporation No Subsidiaries
Services Australian Foundation Investment Company Limited
Copyright © 2000-2003, IBISWorld Pty Ltd Page 9
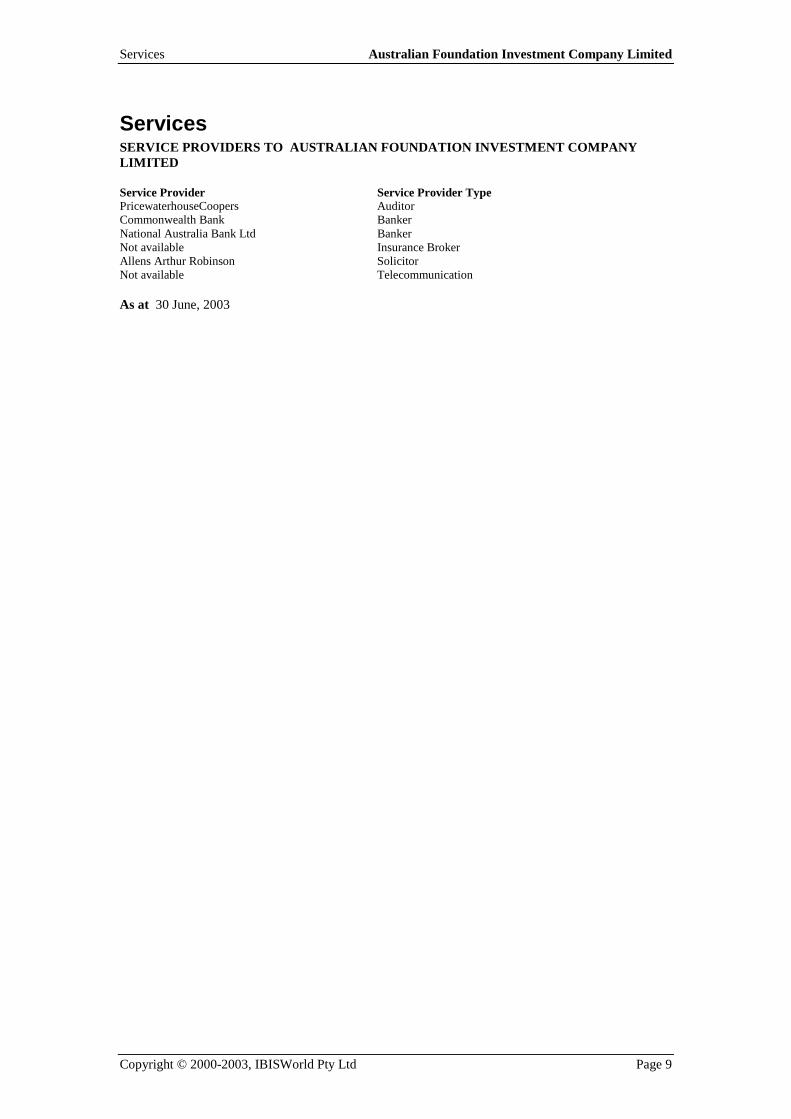
Services SERVICE PROVIDERS TO AUSTRALIAN FOUNDATION INVESTMENT COMPANY LIMITED Service Provider Service Provider Type PricewaterhouseCoopers Auditor Commonwealth Bank Banker National Australia Bank Ltd Banker Not available Insurance Broker Allens Arthur Robinson Solicitor Not available Telecommunication As at 30 June, 2003
News Australian Foundation Investment Company Limited
Copyright © 2000-2003, IBISWorld Pty Ltd Page 10
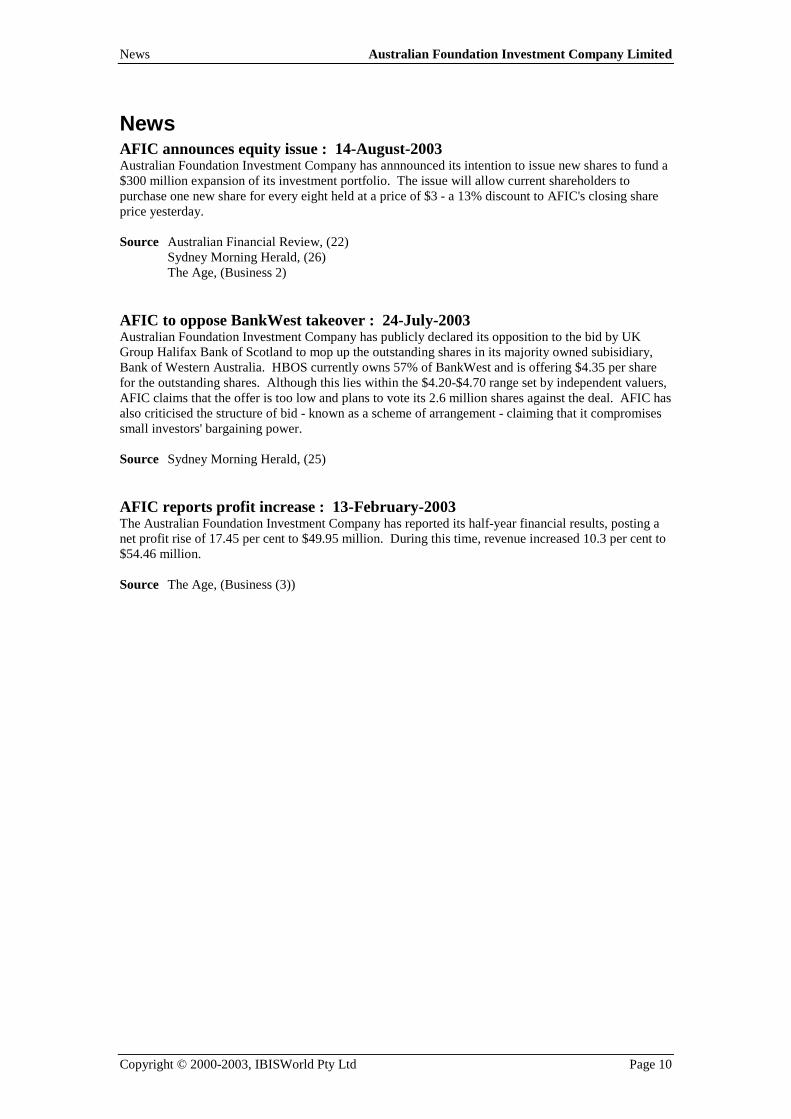
News AFIC announces equity issue : 14-August-2003 Australian Foundation Investment Company has annnounced its intention to issue new shares to fund a $300 million expansion of its investment portfolio. The issue will allow current shareholders to purchase one new share for every eight held at a price of $3 - a 13% discount to AFIC's closing share price yesterday. Source Australian Financial Review, (22) Sydney Morning Herald, (26) The Age, (Business 2) AFIC to oppose BankWest takeover : 24-July-2003 Australian Foundation Investment Company has publicly declared its opposition to the bid by UK Group Halifax Bank of Scotland to mop up the outstanding shares in its majority owned subisidiary, Bank of Western Australia. HBOS currently owns 57% of BankWest and is offering $4.35 per share for the outstanding shares. Although this lies within the $4.20-$4.70 range set by independent valuers, AFIC claims that the offer is too low and plans to vote its 2.6 million shares against the deal. AFIC has also criticised the structure of bid - known as a scheme of arrangement - claiming that it compromises small investors' bargaining power. Source Sydney Morning Herald, (25) AFIC reports profit increase : 13-February-2003 The Australian Foundation Investment Company has reported its half-year financial results, posting a net profit rise of 17.45 per cent to $49.95 million. During this time, revenue increased 10.3 per cent to $54.46 million. Source The Age, (Business (3))
IBISWORLD MARKET SHARE REPORT
Black Coal Mining in Australia
Published Date: 11 September 2003
Disclaimer
This product has been supplied by IBISWorld Pty Ltd ('IBISWorld') solely for use by its authorised licences strictly in accordance with their licence agreements with IBISWorld. IBISWorld makes no representation to any other person with regard to the completeness or accuracy of the data or information contained herein, and it accepts no responsibility and disclaims all liability (save for liability which cannot be lawfully disclaimed) for loss or damage whatsoever suffered or incurred by any other person resulting from the use of, or reliance upon, the data or information contained herein. Copyright in this publication is owned by IBISWorld Pty Ltd. The publication is sold on the basis that the purchaser agrees not to copy the material contained within it for other than the purchasers own purposes. In the event that the purchaser uses or quotes from the material in this publication - in papers, reports, or opinions prepared for any other person - it is agreed that it will be sourced to:
IBISWorld Pty Ltd.
IBISWorld Market Share Report - Contents Black Coal Mining in Australia (Sep 2003)
Copyright © 2003, IBISWorld Pty Ltd Page 2
Table of Contents INDUSTRY SUMMARY .......................................................................................................................3
DESCRIPTION ..................................................................................................................................3 OVERVIEW .......................................................................................................................................3 RECENT ACTIVITY........................................................................................................................3
COMPETITOR PERFORMANCE ANALYSIS .................................................................................4
BHP BILLITON LIMITED ............................................................................................................4 RIO TINTO PLC - RIO TINTO LIMITED ..................................................................................7 ANGLO COAL HOLDINGS AUSTRALIA LIMITED...............................................................9
IBISWorld Market Share Report - Major Players Black Coal Mining in Australia (Sep 2003)
Copyright © 2003, IBISWorld Pty Ltd Page 3
Industry Summary
Description This Class consists of establishments whose main activity is mining black coal. The primary activities of firms in this industry are:
1. Black coal mining
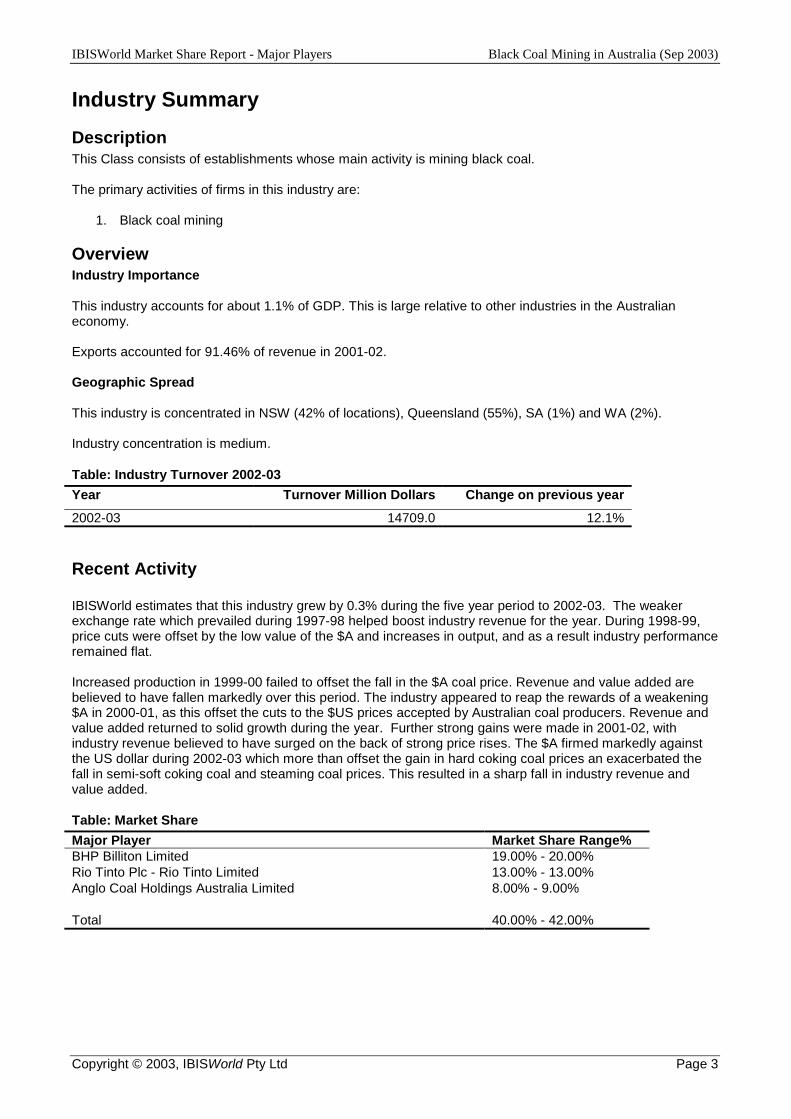
Overview Industry Importance This industry accounts for about 1.1% of GDP. This is large relative to other industries in the Australian economy. Exports accounted for 91.46% of revenue in 2001-02. Geographic Spread This industry is concentrated in NSW (42% of locations), Queensland (55%), SA (1%) and WA (2%). Industry concentration is medium.
Table: Industry Turnover 2002-03 Year Turnover Million Dollars Change on previous year 2002-03 14709.0 12.1%
Recent Activity IBISWorld estimates that this industry grew by 0.3% during the five year period to 2002-03. The weaker exchange rate which prevailed during 1997-98 helped boost industry revenue for the year. During 1998-99, price cuts were offset by the low value of the $A and increases in output, and as a result industry performance remained flat. Increased production in 1999-00 failed to offset the fall in the $A coal price. Revenue and value added are believed to have fallen markedly over this period. The industry appeared to reap the rewards of a weakening $A in 2000-01, as this offset the cuts to the $US prices accepted by Australian coal producers. Revenue and value added returned to solid growth during the year. Further strong gains were made in 2001-02, with industry revenue believed to have surged on the back of strong price rises. The $A firmed markedly against the US dollar during 2002-03 which more than offset the gain in hard coking coal prices an exacerbated the fall in semi-soft coking coal and steaming coal prices. This resulted in a sharp fall in industry revenue and value added.
Table: Market Share Major Player Market Share Range% BHP Billiton Limited 19.00% - 20.00% Rio Tinto Plc - Rio Tinto Limited 13.00% - 13.00% Anglo Coal Holdings Australia Limited 8.00% - 9.00% Total 40.00% - 42.00%
IBISWorld Market Share Report - Major Players Black Coal Mining in Australia (Sep 2003)
Copyright © 2003, IBISWorld Pty Ltd Page 4
Competitor Performance Analysis
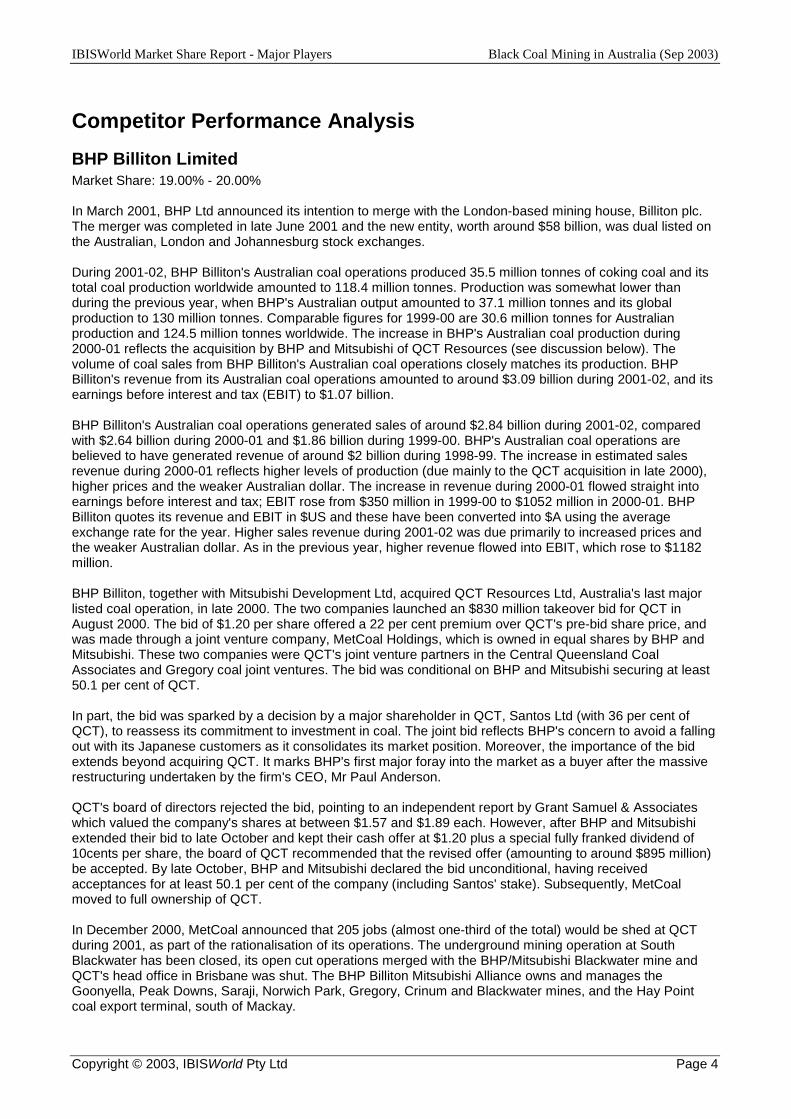
BHP Billiton Limited Market Share: 19.00% - 20.00% In March 2001, BHP Ltd announced its intention to merge with the London-based mining house, Billiton plc. The merger was completed in late June 2001 and the new entity, worth around $58 billion, was dual listed on the Australian, London and Johannesburg stock exchanges. During 2001-02, BHP Billiton's Australian coal operations produced 35.5 million tonnes of coking coal and its total coal production worldwide amounted to 118.4 million tonnes. Production was somewhat lower than during the previous year, when BHP's Australian output amounted to 37.1 million tonnes and its global production to 130 million tonnes. Comparable figures for 1999-00 are 30.6 million tonnes for Australian production and 124.5 million tonnes worldwide. The increase in BHP's Australian coal production during 2000-01 reflects the acquisition by BHP and Mitsubishi of QCT Resources (see discussion below). The volume of coal sales from BHP Billiton's Australian coal operations closely matches its production. BHP Billiton's revenue from its Australian coal operations amounted to around $3.09 billion during 2001-02, and its earnings before interest and tax (EBIT) to $1.07 billion. BHP Billiton's Australian coal operations generated sales of around $2.84 billion during 2001-02, compared with $2.64 billion during 2000-01 and $1.86 billion during 1999-00. BHP's Australian coal operations are believed to have generated revenue of around $2 billion during 1998-99. The increase in estimated sales revenue during 2000-01 reflects higher levels of production (due mainly to the QCT acquisition in late 2000), higher prices and the weaker Australian dollar. The increase in revenue during 2000-01 flowed straight into earnings before interest and tax; EBIT rose from $350 million in 1999-00 to $1052 million in 2000-01. BHP Billiton quotes its revenue and EBIT in $US and these have been converted into $A using the average exchange rate for the year. Higher sales revenue during 2001-02 was due primarily to increased prices and the weaker Australian dollar. As in the previous year, higher revenue flowed into EBIT, which rose to $1182 million. BHP Billiton, together with Mitsubishi Development Ltd, acquired QCT Resources Ltd, Australia's last major listed coal operation, in late 2000. The two companies launched an $830 million takeover bid for QCT in August 2000. The bid of $1.20 per share offered a 22 per cent premium over QCT's pre-bid share price, and was made through a joint venture company, MetCoal Holdings, which is owned in equal shares by BHP and Mitsubishi. These two companies were QCT's joint venture partners in the Central Queensland Coal Associates and Gregory coal joint ventures. The bid was conditional on BHP and Mitsubishi securing at least 50.1 per cent of QCT. In part, the bid was sparked by a decision by a major shareholder in QCT, Santos Ltd (with 36 per cent of QCT), to reassess its commitment to investment in coal. The joint bid reflects BHP's concern to avoid a falling out with its Japanese customers as it consolidates its market position. Moreover, the importance of the bid extends beyond acquiring QCT. It marks BHP's first major foray into the market as a buyer after the massive restructuring undertaken by the firm's CEO, Mr Paul Anderson. QCT's board of directors rejected the bid, pointing to an independent report by Grant Samuel & Associates which valued the company's shares at between $1.57 and $1.89 each. However, after BHP and Mitsubishi extended their bid to late October and kept their cash offer at $1.20 plus a special fully franked dividend of 10cents per share, the board of QCT recommended that the revised offer (amounting to around $895 million) be accepted. By late October, BHP and Mitsubishi declared the bid unconditional, having received acceptances for at least 50.1 per cent of the company (including Santos' stake). Subsequently, MetCoal moved to full ownership of QCT. In December 2000, MetCoal announced that 205 jobs (almost one-third of the total) would be shed at QCT during 2001, as part of the rationalisation of its operations. The underground mining operation at South Blackwater has been closed, its open cut operations merged with the BHP/Mitsubishi Blackwater mine and QCT's head office in Brisbane was shut. The BHP Billiton Mitsubishi Alliance owns and manages the Goonyella, Peak Downs, Saraji, Norwich Park, Gregory, Crinum and Blackwater mines, and the Hay Point coal export terminal, south of Mackay.
IBISWorld Market Share Report - Major Players Black Coal Mining in Australia (Sep 2003)
Copyright © 2003, IBISWorld Pty Ltd Page 5
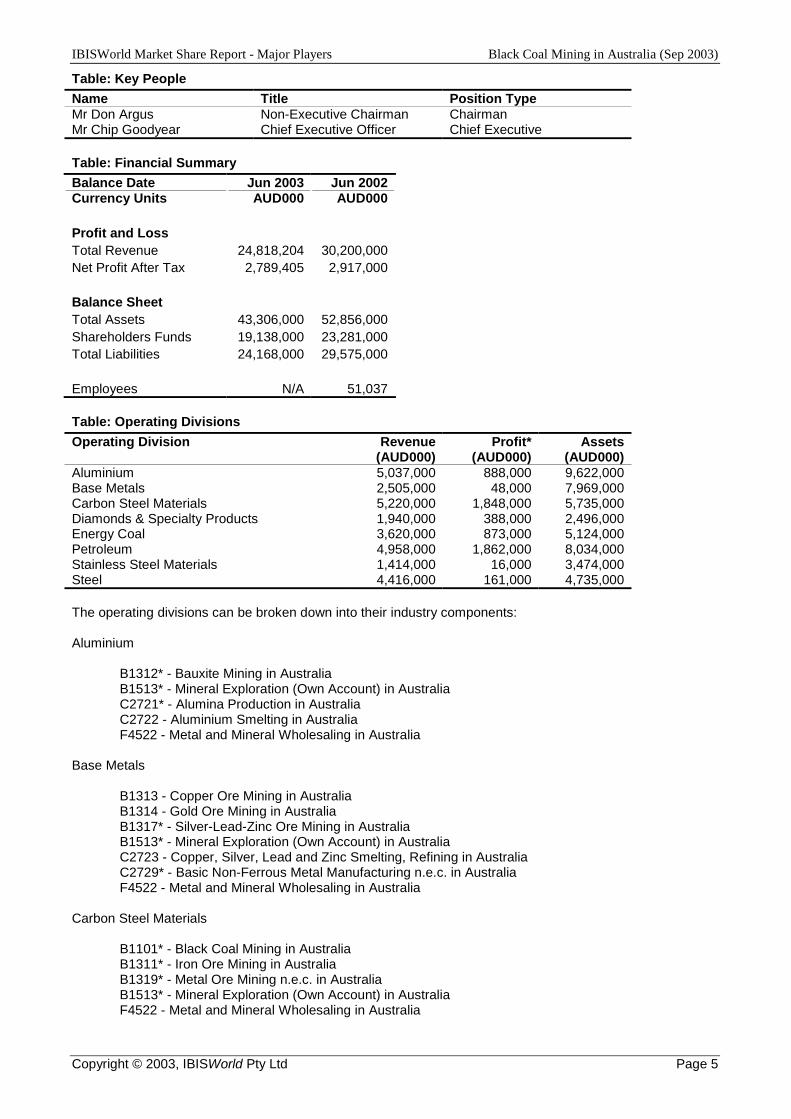
Table: Key People Name Title Position Type Mr Don Argus Mr Chip Goodyear
Non-Executive Chairman Chief Executive Officer
Chairman Chief Executive
Table: Financial Summary Balance Date Jun 2003 Jun 2002 Currency Units AUD000 AUD000 Profit and Loss Total Revenue 24,818,204 30,200,000 Net Profit After Tax 2,789,405 2,917,000 Balance Sheet Total Assets 43,306,000 52,856,000 Shareholders Funds 19,138,000 23,281,000 Total Liabilities 24,168,000 29,575,000 Employees N/A 51,037
Table: Operating Divisions Operating Division Revenue
(AUD000) Profit*
(AUD000) Assets
(AUD000) Aluminium Base Metals Carbon Steel Materials Diamonds & Specialty Products Energy Coal Petroleum Stainless Steel Materials Steel
5,037,000 2,505,000 5,220,000 1,940,000 3,620,000 4,958,000 1,414,000 4,416,000
888,000 48,000
1,848,000 388,000 873,000
1,862,000 16,000
161,000
9,622,000 7,969,000 5,735,000 2,496,000 5,124,000 8,034,000 3,474,000 4,735,000
The operating divisions can be broken down into their industry components: Aluminium
B1312* - Bauxite Mining in Australia B1513* - Mineral Exploration (Own Account) in Australia C2721* - Alumina Production in Australia C2722 - Aluminium Smelting in Australia F4522 - Metal and Mineral Wholesaling in Australia
Base Metals
B1313 - Copper Ore Mining in Australia B1314 - Gold Ore Mining in Australia B1317* - Silver-Lead-Zinc Ore Mining in Australia B1513* - Mineral Exploration (Own Account) in Australia C2723 - Copper, Silver, Lead and Zinc Smelting, Refining in Australia C2729* - Basic Non-Ferrous Metal Manufacturing n.e.c. in Australia F4522 - Metal and Mineral Wholesaling in Australia
Carbon Steel Materials
B1101* - Black Coal Mining in Australia B1311* - Iron Ore Mining in Australia B1319* - Metal Ore Mining n.e.c. in Australia B1513* - Mineral Exploration (Own Account) in Australia F4522 - Metal and Mineral Wholesaling in Australia
IBISWorld Market Share Report - Major Players Black Coal Mining in Australia (Sep 2003)
Copyright © 2003, IBISWorld Pty Ltd Page 6
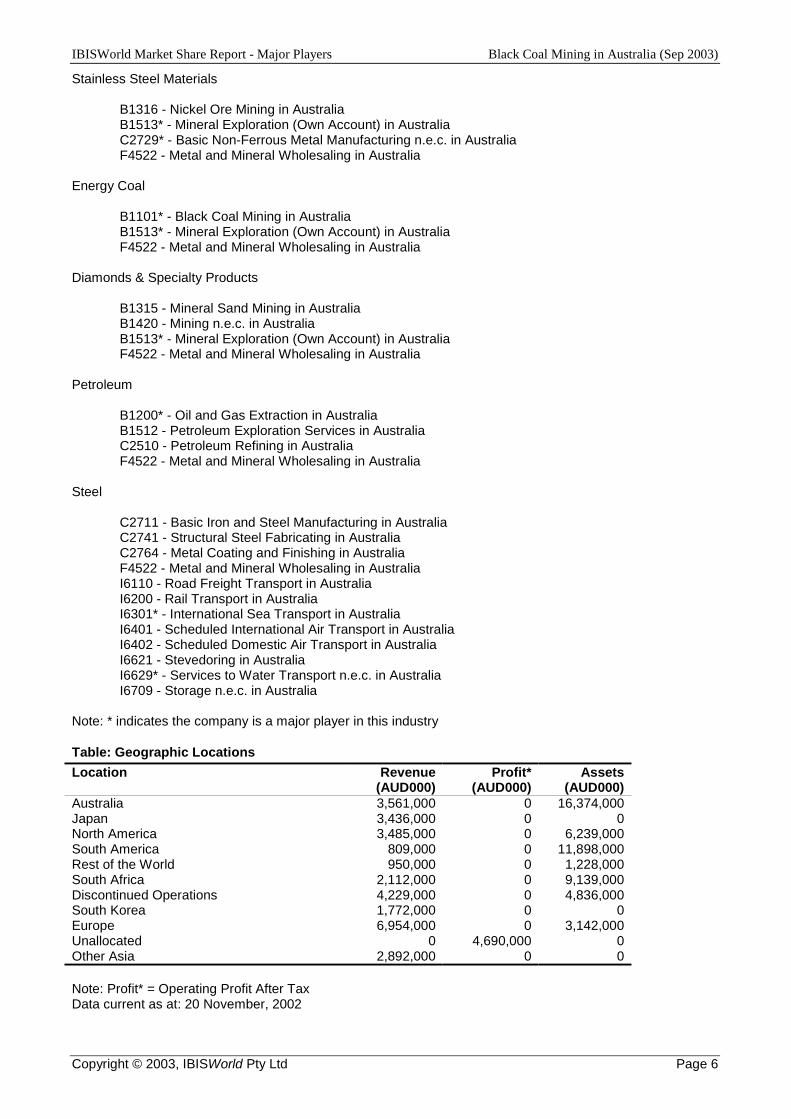
Stainless Steel Materials
B1316 - Nickel Ore Mining in Australia B1513* - Mineral Exploration (Own Account) in Australia C2729* - Basic Non-Ferrous Metal Manufacturing n.e.c. in Australia F4522 - Metal and Mineral Wholesaling in Australia
Energy Coal
B1101* - Black Coal Mining in Australia B1513* - Mineral Exploration (Own Account) in Australia F4522 - Metal and Mineral Wholesaling in Australia
Diamonds & Specialty Products
B1315 - Mineral Sand Mining in Australia B1420 - Mining n.e.c. in Australia B1513* - Mineral Exploration (Own Account) in Australia F4522 - Metal and Mineral Wholesaling in Australia
Petroleum
B1200* - Oil and Gas Extraction in Australia B1512 - Petroleum Exploration Services in Australia C2510 - Petroleum Refining in Australia F4522 - Metal and Mineral Wholesaling in Australia
Steel
C2711 - Basic Iron and Steel Manufacturing in Australia C2741 - Structural Steel Fabricating in Australia C2764 - Metal Coating and Finishing in Australia F4522 - Metal and Mineral Wholesaling in Australia I6110 - Road Freight Transport in Australia I6200 - Rail Transport in Australia I6301* - International Sea Transport in Australia I6401 - Scheduled International Air Transport in Australia I6402 - Scheduled Domestic Air Transport in Australia I6621 - Stevedoring in Australia I6629* - Services to Water Transport n.e.c. in Australia I6709 - Storage n.e.c. in Australia
Note: * indicates the company is a major player in this industry
Table: Geographic Locations Location Revenue
(AUD000) Profit*
(AUD000) Assets
(AUD000) Australia Japan North America South America Rest of the World South Africa Discontinued Operations South Korea Europe Unallocated Other Asia
3,561,000 3,436,000 3,485,000
809,000 950,000
2,112,000 4,229,000 1,772,000 6,954,000
0 2,892,000
0 0 0 0 0 0 0 0 0
4,690,000 0
16,374,000 0
6,239,000 11,898,000 1,228,000 9,139,000 4,836,000
0 3,142,000
0 0
Note: Profit* = Operating Profit After Tax Data current as at: 20 November, 2002
IBISWorld Market Share Report - Major Players Black Coal Mining in Australia (Sep 2003)
Copyright © 2003, IBISWorld Pty Ltd Page 7
Rio Tinto Plc - Rio Tinto Limited Market Share: 13.00% - 13.00% Rio Tinto Ltd became Australia's largest coal producer during 2001. The firm's total black coal output worldwide amounted to around 139 million tonnes during 1999 (114 million tonnes during 1998). Of this, around 23.4 million tonnes was Australian in origin (21 million in 1998). Mines operated by Rio (most of which are not 100 per cent owned by the firm) produced nearly 32 million tonnes of black coal during 1999 (31 million tonnes during 1998). Australian coal earned Rio revenue of around $859 million during 1999 and the total revenue earned by mines operated by Rio in Australia amounted to around $1 billion. Similar revenues were earned during 1998. Rio's global coal production fell to 132 million tonnes during 2000, but production from its Australian mines edged up to 23.9 million tonnes. Rio Tinto' earned revenue of around $1 billion from its Australian coal operations, and the mines it manages in Australia generated revenue of around $1.2 billion. Worldwide, Rio's coal interests yielded revenue of around $2.7 billion during 2000. During October 1995, CRA and its parent company, the British firm RTZ Corp plc, announced plans to merge. The firms subsequently formed a dual-listed company, which operates with a common board, but with each entity remaining listed on its own home exchange. The companies did not transfer any assets, thereby side-stepping capital gains tax. During early 1997, RTZ-CRA announced that it would proceed with a full merger. CRA's assets were merged with those of RTZ and the entire operation has been divided into business units. RTZ was renamed Rio Tinto plc, and CRA became Rio Tinto Ltd. Rio Tinto has rationalised its Australian coal portfolio over recent years. It sold its Kembla Coal and Coke mines (located in New South Wales) to Austral Coal NL and BHP during early 1997. It also closed its Vickery mine in New South Wales during mid 1998 after a fruitless search for a buyer. The company is focussing on its more profitable coal operations in Queensland. As part of this strategy it purchased the Gordonstone mine in Queensland from Atlantic Richfield Co (ARCO). The mine, which was closed in 1997 by ARCO was re-opened by Rio Tinto in 1999 and renamed Kestrel. During late 2000, Coal & Allied Industries Ltd (71 per cent owned by Rio Tinto) purchased the Lemington coal mine from Exxon Mobil and announced the purchase of five open cut mines from the US Peabody group. The five mines are located in the Hunter Valley region of New South Wales and have a combined output of over 20 million tonnes of coal per year. The deal, valued at US$555 million, was completed in early 2001. The purchase means that a number of adjacent mines are now owned by Coal & Allied, offering scope for cost savings through the sharing of services and the elimination of duplication. These purchases lifted Coal & Allied's production capacity to over 36 million tonnes of coal per year, and led to Rio Tinto becoming Australia's major black coal producer. During 2001, it controlled mines with production capacity of around 55 million tonnes per year, and produced 34.4 million tonnes on its own account. Most of the output from these mines is exported to power stations and steel mills in the Asia Pacific region. Worldwide, Rio Tinto's coal output amounted to 148.9 million tonnes during 2001. Rio Tinto's coal revenue worldwide amounted to around $4.1 billion during 2001, with $1.95 billion being generated by the Australian operations it manages. Rio's own revenue from Australian coal production was around $1.6 billion. During early 2002, Rio Tinto agreed to sell its 55 per cent stake in the Moura steaming coal mine to its joint venture partner in the operation, Mitsui. Rio Tinto acquired the holding when its subsidiary purchased Peabody's Australian operations in early 2001. Mitsui subsequently onsold 51 per cent of the operation to Anglo Coal as part of a US$310 million joint venture. Mitsui used its pre-emptive right as a joint venture partner to acquire Rio Tinto's holding. MIM Ltd's US$166 million bid for the holding was the highest received, but Mitsui elected to match it in order to acquire the stake. Anglo Coal is believed to have been one of the losing bidders. During 2002, Rio Tinto managed mines with coal output of around 55 million tonnes and its own production amounted to just under 35 million tonnes. Rio Tinto earned revenue amounting to around $1.93 billion from these operations.
Table: Key People Name Title Position Type Sir Robert Wilson Mr Leigh Clifford
Executive Chairman Chief Executive
Chairman Chief Executive
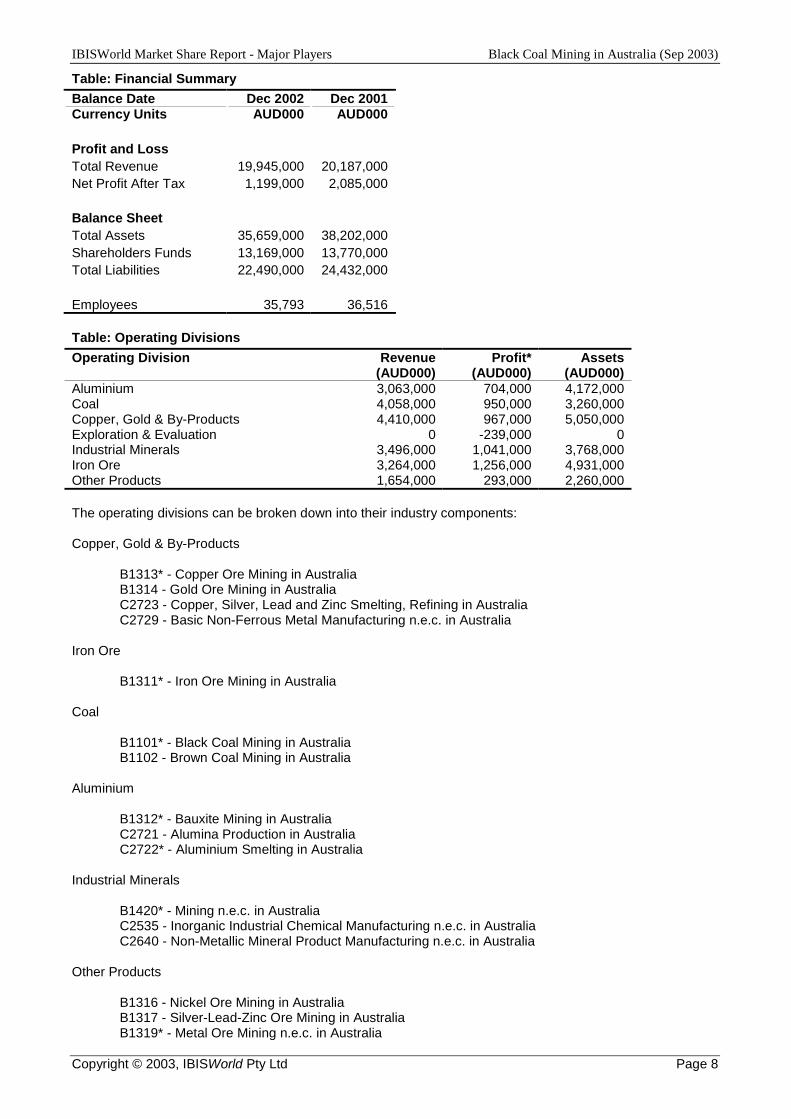
IBISWorld Market Share Report - Major Players Black Coal Mining in Australia (Sep 2003)
Copyright © 2003, IBISWorld Pty Ltd Page 8
Table: Financial Summary Balance Date Dec 2002 Dec 2001 Currency Units AUD000 AUD000 Profit and Loss Total Revenue 19,945,000 20,187,000 Net Profit After Tax 1,199,000 2,085,000 Balance Sheet Total Assets 35,659,000 38,202,000 Shareholders Funds 13,169,000 13,770,000 Total Liabilities 22,490,000 24,432,000 Employees 35,793 36,516
Table: Operating Divisions Operating Division Revenue
(AUD000) Profit*
(AUD000) Assets
(AUD000) Aluminium Coal Copper, Gold & By-Products Exploration & Evaluation Industrial Minerals Iron Ore Other Products
3,063,000 4,058,000 4,410,000
0 3,496,000 3,264,000 1,654,000
704,000 950,000 967,000
-239,000 1,041,000 1,256,000
293,000
4,172,000 3,260,000 5,050,000
0 3,768,000 4,931,000 2,260,000
The operating divisions can be broken down into their industry components: Copper, Gold & By-Products
B1313* - Copper Ore Mining in Australia B1314 - Gold Ore Mining in Australia C2723 - Copper, Silver, Lead and Zinc Smelting, Refining in Australia C2729 - Basic Non-Ferrous Metal Manufacturing n.e.c. in Australia
Iron Ore
B1311* - Iron Ore Mining in Australia Coal
B1101* - Black Coal Mining in Australia B1102 - Brown Coal Mining in Australia
Aluminium
B1312* - Bauxite Mining in Australia C2721 - Alumina Production in Australia C2722* - Aluminium Smelting in Australia
Industrial Minerals
B1420* - Mining n.e.c. in Australia C2535 - Inorganic Industrial Chemical Manufacturing n.e.c. in Australia C2640 - Non-Metallic Mineral Product Manufacturing n.e.c. in Australia
Other Products
B1316 - Nickel Ore Mining in Australia B1317 - Silver-Lead-Zinc Ore Mining in Australia B1319* - Metal Ore Mining n.e.c. in Australia
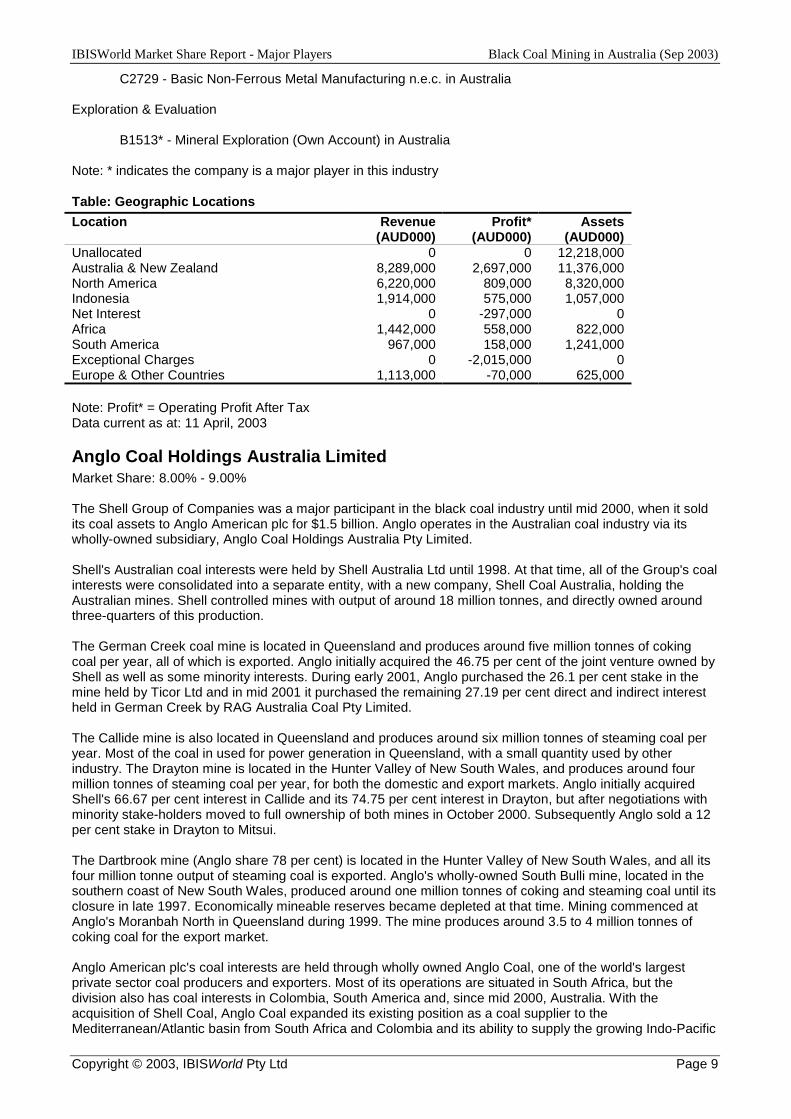
IBISWorld Market Share Report - Major Players Black Coal Mining in Australia (Sep 2003)
Copyright © 2003, IBISWorld Pty Ltd Page 9
C2729 - Basic Non-Ferrous Metal Manufacturing n.e.c. in Australia Exploration & Evaluation
B1513* - Mineral Exploration (Own Account) in Australia Note: * indicates the company is a major player in this industry
Table: Geographic Locations Location Revenue
(AUD000) Profit*
(AUD000) Assets
(AUD000) Unallocated Australia & New Zealand North America Indonesia Net Interest Africa South America Exceptional Charges Europe & Other Countries
0 8,289,000 6,220,000 1,914,000
0 1,442,000
967,000 0
1,113,000
0 2,697,000
809,000 575,000
-297,000 558,000 158,000
-2,015,000 -70,000
12,218,000 11,376,000 8,320,000 1,057,000
0 822,000
1,241,000 0
625,000 Note: Profit* = Operating Profit After Tax Data current as at: 11 April, 2003
Anglo Coal Holdings Australia Limited Market Share: 8.00% - 9.00% The Shell Group of Companies was a major participant in the black coal industry until mid 2000, when it sold its coal assets to Anglo American plc for $1.5 billion. Anglo operates in the Australian coal industry via its wholly-owned subsidiary, Anglo Coal Holdings Australia Pty Limited. Shell's Australian coal interests were held by Shell Australia Ltd until 1998. At that time, all of the Group's coal interests were consolidated into a separate entity, with a new company, Shell Coal Australia, holding the Australian mines. Shell controlled mines with output of around 18 million tonnes, and directly owned around three-quarters of this production. The German Creek coal mine is located in Queensland and produces around five million tonnes of coking coal per year, all of which is exported. Anglo initially acquired the 46.75 per cent of the joint venture owned by Shell as well as some minority interests. During early 2001, Anglo purchased the 26.1 per cent stake in the mine held by Ticor Ltd and in mid 2001 it purchased the remaining 27.19 per cent direct and indirect interest held in German Creek by RAG Australia Coal Pty Limited. The Callide mine is also located in Queensland and produces around six million tonnes of steaming coal per year. Most of the coal in used for power generation in Queensland, with a small quantity used by other industry. The Drayton mine is located in the Hunter Valley of New South Wales, and produces around four million tonnes of steaming coal per year, for both the domestic and export markets. Anglo initially acquired Shell's 66.67 per cent interest in Callide and its 74.75 per cent interest in Drayton, but after negotiations with minority stake-holders moved to full ownership of both mines in October 2000. Subsequently Anglo sold a 12 per cent stake in Drayton to Mitsui. The Dartbrook mine (Anglo share 78 per cent) is located in the Hunter Valley of New South Wales, and all its four million tonne output of steaming coal is exported. Anglo's wholly-owned South Bulli mine, located in the southern coast of New South Wales, produced around one million tonnes of coking and steaming coal until its closure in late 1997. Economically mineable reserves became depleted at that time. Mining commenced at Anglo's Moranbah North in Queensland during 1999. The mine produces around 3.5 to 4 million tonnes of coking coal for the export market. Anglo American plc's coal interests are held through wholly owned Anglo Coal, one of the world's largest private sector coal producers and exporters. Most of its operations are situated in South Africa, but the division also has coal interests in Colombia, South America and, since mid 2000, Australia. With the acquisition of Shell Coal, Anglo Coal expanded its existing position as a coal supplier to the Mediterranean/Atlantic basin from South Africa and Colombia and its ability to supply the growing Indo-Pacific
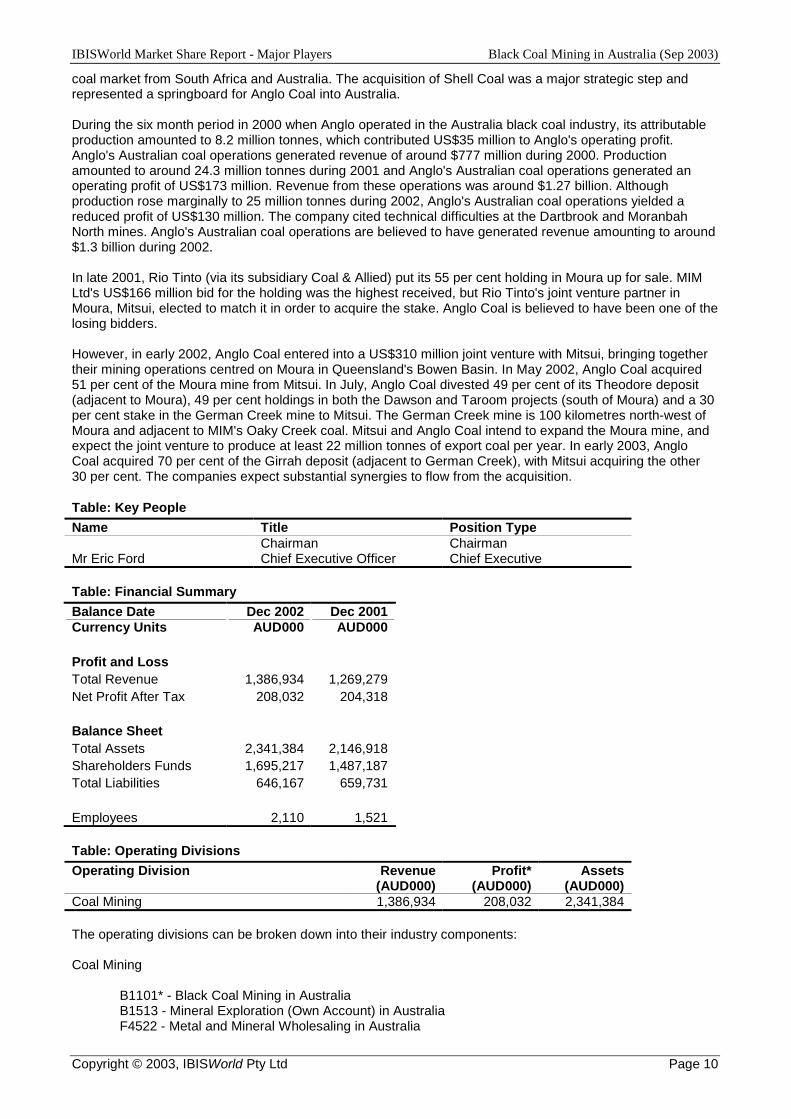
IBISWorld Market Share Report - Major Players Black Coal Mining in Australia (Sep 2003)
Copyright © 2003, IBISWorld Pty Ltd Page 10
coal market from South Africa and Australia. The acquisition of Shell Coal was a major strategic step and represented a springboard for Anglo Coal into Australia. During the six month period in 2000 when Anglo operated in the Australia black coal industry, its attributable production amounted to 8.2 million tonnes, which contributed US$35 million to Anglo's operating profit. Anglo's Australian coal operations generated revenue of around $777 million during 2000. Production amounted to around 24.3 million tonnes during 2001 and Anglo's Australian coal operations generated an operating profit of US$173 million. Revenue from these operations was around $1.27 billion. Although production rose marginally to 25 million tonnes during 2002, Anglo's Australian coal operations yielded a reduced profit of US$130 million. The company cited technical difficulties at the Dartbrook and Moranbah North mines. Anglo's Australian coal operations are believed to have generated revenue amounting to around $1.3 billion during 2002. In late 2001, Rio Tinto (via its subsidiary Coal & Allied) put its 55 per cent holding in Moura up for sale. MIM Ltd's US$166 million bid for the holding was the highest received, but Rio Tinto's joint venture partner in Moura, Mitsui, elected to match it in order to acquire the stake. Anglo Coal is believed to have been one of the losing bidders. However, in early 2002, Anglo Coal entered into a US$310 million joint venture with Mitsui, bringing together their mining operations centred on Moura in Queensland's Bowen Basin. In May 2002, Anglo Coal acquired 51 per cent of the Moura mine from Mitsui. In July, Anglo Coal divested 49 per cent of its Theodore deposit (adjacent to Moura), 49 per cent holdings in both the Dawson and Taroom projects (south of Moura) and a 30 per cent stake in the German Creek mine to Mitsui. The German Creek mine is 100 kilometres north-west of Moura and adjacent to MIM's Oaky Creek coal. Mitsui and Anglo Coal intend to expand the Moura mine, and expect the joint venture to produce at least 22 million tonnes of export coal per year. In early 2003, Anglo Coal acquired 70 per cent of the Girrah deposit (adjacent to German Creek), with Mitsui acquiring the other 30 per cent. The companies expect substantial synergies to flow from the acquisition.
Table: Key People Name Title Position Type Mr Eric Ford
Chairman Chief Executive Officer
Chairman Chief Executive
Table: Financial Summary Balance Date Dec 2002 Dec 2001 Currency Units AUD000 AUD000 Profit and Loss Total Revenue 1,386,934 1,269,279 Net Profit After Tax 208,032 204,318 Balance Sheet Total Assets 2,341,384 2,146,918 Shareholders Funds 1,695,217 1,487,187 Total Liabilities 646,167 659,731 Employees 2,110 1,521
Table: Operating Divisions Operating Division Revenue
(AUD000) Profit*
(AUD000) Assets
(AUD000) Coal Mining 1,386,934 208,032 2,341,384 The operating divisions can be broken down into their industry components: Coal Mining
B1101* - Black Coal Mining in Australia B1513 - Mineral Exploration (Own Account) in Australia F4522 - Metal and Mineral Wholesaling in Australia
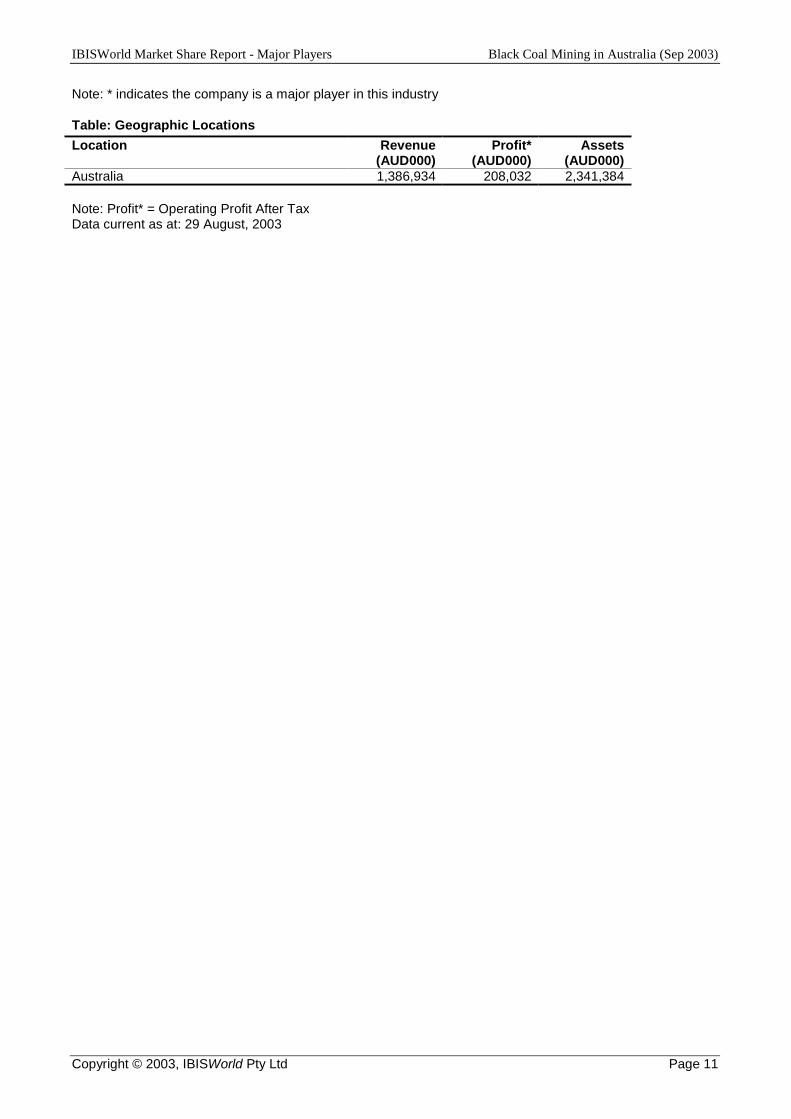
IBISWorld Market Share Report - Major Players Black Coal Mining in Australia (Sep 2003)
Copyright © 2003, IBISWorld Pty Ltd Page 11
Note: * indicates the company is a major player in this industry
Table: Geographic Locations Location Revenue
(AUD000) Profit*
(AUD000) Assets
(AUD000) Australia 1,386,934 208,032 2,341,384 Note: Profit* = Operating Profit After Tax Data current as at: 29 August, 2003
IBISWorld Industry Report - DisclaimerMaterial Handling Equipment Manufacturing in the US (May 2003)
Copyright © 2003, IBISWorld Pty Ltd Page 1
Material Handling Equipment Manufacturing in the US
09 May 2003
This product has been supplied by IBISWorld Pty Ltd ('IBISWorld') solely for use by its authorised licences strictly in accordance with
their licence agreements with IBISWorld.
IBISWorld makes no representation to any other person with regard to the completeness or accuracy of the data or information contained herein, and it accepts no responsibility and disclaims all liability (save for liability which cannot be lawfully disclaimed) for
loss or damage whatsoever suffered or incurred by any other person resulting from the use of, or reliance upon, the data or
information contained herein.
Copyright in this publication is owned by IBISWorld Pty Ltd. The publication is sold on the basis that the purchaser agrees not to
copy the material contained within it for other than the purchasers own purposes. In the event that the purchaser uses or quotes
from the material in this publication - in papers, reports, or opinions prepared for any other person - it is agreed that it will be sourced
to:
IBISWorld Information Service.
IBISWorld Industry Report - ContentsMaterial Handling Equipment Manufacturing in the US (May 2003)
Copyright © 2003, IBISWorld Pty Ltd Page 2
Material Handling Equipment Manufacturing in the US
Contents DEFINITION.......................................................................................................................................... 3
REFERRALS TO OTHER INDUSTRIES....................................................................................................... 3 ACTIVITIES/PRODUCT GROUPS.............................................................................................................. 3
KEY STATISTICS................................................................................................................................. 5 CURRENT PRICES................................................................................................................................... 5 CONSTANT PRICES (2002) ..................................................................................................................... 5 REAL GROWTH...................................................................................................................................... 5 RATIO TABLE ........................................................................................................................................ 5
MARKET CHARACTERISTICS ........................................................................................................ 6 MARKET SIZE........................................................................................................................................ 6 LINKAGES ............................................................................................................................................. 6 DEMAND DETERMINANTS ..................................................................................................................... 7 DOMESTIC AND INTERNATIONAL MARKETS/GLOBALIZATION .............................................................. 7 BASIS OF COMPETITION......................................................................................................................... 9 LIFE CYCLE ......................................................................................................................................... 10
INDUSTRY SEGMENTATION ......................................................................................................... 11 PRODUCT/SERVICE SEGMENTATION.................................................................................................... 11 MAJOR MARKET SEGMENTS ............................................................................................................... 12 INDUSTRY CONCENTRATION ............................................................................................................... 12 GEOGRAPHIC SPREAD ......................................................................................................................... 12
INDUSTRY CONDITIONS................................................................................................................. 14 BARRIERS TO ENTRY........................................................................................................................... 14 INDUSTRY ASSISTANCE....................................................................................................................... 14 TAXATION ........................................................................................................................................... 14 REGULATION/DEREGULATION............................................................................................................. 14 COST STRUCTURE ............................................................................................................................... 15 CAPITAL/LABOR INTENSITY ................................................................................................................ 15 TECHNOLOGY AND SYSTEMS .............................................................................................................. 15 INDUSTRY VOLATILITY ....................................................................................................................... 16
PERFORMANCE................................................................................................................................. 17 HISTORICAL PERFORMANCE................................................................................................................ 17 CURRENT PERFORMANCE.................................................................................................................... 17
INDUSTRY PARTICIPANTS ............................................................................................................ 21 MAJOR PLAYERS ................................................................................................................................. 21 PLAYER PERFORMANCE ...................................................................................................................... 21
KEY FACTORS ................................................................................................................................... 28 KEY SENSITIVITIES.............................................................................................................................. 28 KEY SUCCESS FACTORS ...................................................................................................................... 29
INDUSTRY OUTLOOK...................................................................................................................... 30
Definition Material Handling Equipment Manufacturing in the US (May 2003)
Copyright © 2003, IBISWorld Pty Ltd Page 3
Definition This industry comprises establishments primarily engaged in manufacturing material handling equipment, such as elevators and moving stairs; conveyors and conveying equipment; overhead traveling cranes, hoists, and monorail systems; and industrial trucks, tractors, trailers, and stacker machinery.
Referrals to Other Industries • 33311 - Agricultural Implement Manufacturing in the US - Farm-type trailer
manufacturing • 33312 - Construction Machinery Manufacturing in the US - Construction-type
tractor and crane manufacturing • 33361 - Engine, Turbine and Power Transmission Equipment Manufacturing in the
US - Power transmission pulley manufacturing • 33621 - Motor Vehicle Body and Trailer Manufacturing in the US - Motor vehicle-
type trailer manufacturing
Activities/Product Groups • Automobile lifts (i.e., garage-type, service station) manufacturing • Dumbwaiter manufacturing • Passenger and freight elevator manufacturing • Escalator manufacturing • Moving stairway manufacturing • Moving walkway manufacturing • Belt conveyor systems manufacturing • Elevator and conveyor bucket manufacturing • Carousel conveyor (e.g., luggage) manufacturing • Coal and ore conveyors • Farm-type conveyor manufacturing • Mine conveyor manufacturing • Overhead conveyor manufacturing • Passenger baggage belt loader (except industrial truck) manufacturing • Pneumatic tube conveyors manufacturing • Screw conveyor manufacturing • Aerial work platform manufacturing • Automobile wrecker (i.e., tow truck) hoist manufacturing • Boat lift manufacturing • Chain hoist manufacturing • Overhead traveling crane manufacturing • Davits manufacturing • Hoists (except aircraft loading) manufacturing • Locomotive crane manufacturing • Monorail systems (except passenger-type) manufacturing • Metal pulleys (except power transmission) manufacturing • Ship cranes and derricks manufacturing • Winches manufacturing
Definition Material Handling Equipment Manufacturing in the US (May 2003)
Copyright © 2003, IBISWorld Pty Ltd Page 4
• Wire rope hoist manufacturing • Aircraft engine cradle manufacturing • Aircraft loading hoist manufacturing • Bomb lift manufacturing • Cabs for industrial truck manufacturing • Grocery carts made from purchased wire • Industrial truck crane manufacturing • Dollies manufacturing • Drum cradle manufacturing • Forklift manufacturing • Hand trucks manufacturing • Industrial trucks and tractors manufacturing • Mechanics creepers manufacturing • Mobile straddle carriers manufacturing • Pallet movers manufacturing • Pallet or skid jacks manufacturing • Industrial stackers manufacturing • Mobile straddle carrier manufacturing • Wheelbarrow manufacturing

Key Statistics Material Handling Equipment Manufacturing in the US (May 2003)
Copyright © 2003, IBISWorld Pty Ltd Page 5
Key Statistics
Current Prices 2000 2001 2002 Industry Turnover 19596.3 18115.5 *17882.4 $ Million Industry Gross Product 8536.6 7881.5 *7818.2 $ Million Number of Establishments 1809.0 1800.0 *1796.0 Units Number of Enterprises 1701.0 1692.0 *1688.0 Units Employment 97092.0 95941.0 *96421.0 Units Exports 2637.0 2520.0 1992.6 $ Million Imports 3350.0 2987.0 2865.7 $ Million Total Wages 3921.5 4032.0 *4124.4 $ Million Total Assets N/A N/A N/A Note: '*' represents estimates by IBISWorld.
Constant Prices (2002) 2000 2001 2002 Industry Turnover 20311.2 18347.3 *17882.4 $ Million Industry Gross Product 8848.0 7982.4 *7818.2 $ Million Number of Establishments 1809.0 1800.0 *1796.0 Units Number of Enterprises 1701.0 1692.0 *1688.0 Units Employment 97092.0 95941.0 *96421.0 Units Exports 2733.2 2552.2 1992.6 $ Million Imports 3472.2 3025.2 2865.7 $ Million Total Wages 4064.6 4083.6 *4124.4 $ Million Total Assets N/A N/A N/A Note: '*' represents estimates by IBISWorld.
Real Growth 2000 2001 2002 Industry Turnover +4.6 -9.7 *-2.5 % Industry Gross Product +1.6 -9.8 *-2.1 % Number of Establishments -0.4 -0.5 *-0.2 % Number of Enterprises -0.4 -0.5 *-0.2 % Employment +0.4 -1.2 *+0.5 % Exports +1.1 -6.6 -21.9 % Imports +10.1 -12.9 -5.3 % Total Wages +1.2 +0.5 *+1.0 % Total Assets N/A N/A N/A
Ratio Table 2000 2001 2002 Imports/Domestic Demand 16.49 16.07 15.28 % Exports/Turnover 13.46 13.91 11.14 % Turnover/Employee 209.2 191.2 185.5 $ Thousand Wages & Salaries/Turnover 20.01 22.26 23.06 %
Market Characteristics Material Handling Equipment Manufacturing in the US (May 2003)
Copyright © 2003, IBISWorld Pty Ltd Page 6
Market Characteristics
Market Size • IBISWorld estimates that in 2002, the Material Handling Equipment
Manufacturing industry recorded shipments to the value of $18.6 billion and contributed $8.9 billion to the United States Gross Domestic Product (GDP).
• In the same year, the industry was composed of 1796 establishments, employing 96,421 people who earned a total of $4.1 billion in wages.
• IBISWorld estimates that this industry accounts for 1.4 percent of total manufacturing revenue.
Linkages
Demand Linkages The major industries supplying this industry are estimated to be: • Industry Class 48211 - Rail Transportation in the US - demands conveyors and
lifting equipment for the movement of freight. • Industry Class 48311 - Deep Sea, Coastal and Great Lakes Water Transportation in
the US - demands conveyors and lifting equipment for the movement of freight. • Industry Class 48851 - Freight Transportation Arrangement in the US - demands
conveyors and lifting equipment for the movement of freight. • Industry Class 23322 - Multifamily Housing Construction in the US - demands
industrial trucks and cranes. • Industry Class 23331 - Manufacturing and Industrial Building Construction in the
US - demands industrial trucks and cranes. • Industry Class 23332 - Commercial and Institutional Building Construction in the
US - demands industrial trucks and cranes. • Industry Class 23411 - Highway and Street Construction in the US - demands
industrial trucks and cranes. • Industry Class 23412 - Bridge & Tunnel Construction in the US - demands
industrial trucks and cranes. • Industry Class 23491 - Water, Sewer and Pipeline Construction in the US -
demands industrial trucks and cranes. • Industry Class 23492 - Power and Communication Transmission Line Construction
in the US - demands industrial trucks, cranes and aerial work platforms. • Industry Class 31-33 - Manufacturing in the US - most manufacturing industries in
the US demand material handling equipment to facilitate the movement of goods through the production process.
Supply Linkages The major industries supplied by this industry are: • Industry Class 33152 - Nonferrous Metal Foundries in the US - supply of castings
for the manufacture of industrial trucks and cranes. • Industry Class 33361 - Engine, Turbine and Power Transmission Equipment
Manufacturing in the US - supply of engines for the manufacture of industrial trucks and cranes.
Market Characteristics Material Handling Equipment Manufacturing in the US (May 2003)
Copyright © 2003, IBISWorld Pty Ltd Page 7
• Industry Class 33999 - All Other Miscellaneous Manufacturing in the US - supply of gaskets and fasteners for the manufacture of material handling equipment.
• Industry Class 33111 - Iron and Steel Mills and Ferroalloy Manufacturing in the US - supply of structural steel for the manufacture of material handling equipment.
• Industry Class 32621 - Tire Manufacturing in the US - supply of tires for the manufacture of industrial trucks.
Demand Determinants Demand for Material Handling Equipment manufacturing in the US is determined by: • Changes in general economic conditions that affect construction activity, affect the
demand for the industry's products. Construction activity utilizes industrial trucks and tractors, cranes, and in some cases elevators and escalators. During periods of expansion in construction activity, the industry generally has benefits from increased demand for its products. Conversely, during recessionary periods, the industry is adversely affected by reduced demand for its products.
• Changes in general economic conditions that affect manufacturing activity, affect the demand for the industry's products. Conveyor systems, hoists and forklifts are used in most manufacturing processes to move raw materials along the production line and to store them when they are finished. As firms expand their manufacturing facilities they increase their demand for these products.
• Changes in general economic conditions that affect freight handling, including air, sea and road transport, has the potential to reduce demand for the industry's products. Airports use conveyor belt systems, forklifts and hoists for the movement of baggage, and escalators and elevators for the movement of people. A reduction in air travel reduces the use of this equipment and, consequently, the demand for parts and equipment to service this equipment falls.
Domestic and International Markets/Globalization
Imports
• In 2002, the value of industry imports amounted to $2866 million, 5.3 percent less than imports in 2001 in real terms. Over the past five years, industry imports have grown at an average annualized rate of 2.5 percent. In 2002, imports accounted for 17.3 percent of domestic demand compared to 16.6 percent in 1997.
Table 1: Top five import origins as a percentage of imports: 1997 to 2003(YTD) % % % % 2002 2003 Country 1997 2002 YTD YTD Canada 24.5 24.9 27.6 23.0 Japan 19.9 15.6 18.3 12.9 Germany 12.9 13.0 13.5 11.2 United Kingdom 14.7 8.8 7.7 8.1 Mexico 2.9 6.4 5.2 9.7 Source: International Trade Commission
Market Characteristics Material Handling Equipment Manufacturing in the US (May 2003)
Copyright © 2003, IBISWorld Pty Ltd Page 8
Table 2: Imports by product segment: 2001 Val of % Product segment imports change $M % Elevator and moving stairways 287 9.5 Conveyor equipment 803 -10.9 Overhead crane, hoists and monorails 352 -11.8 Industrial truck, trailer and tractors 1545 -13.6 Total industry 2987 -10.8 Ave Grth rate over the past 4 years Product segment %(p.a) Primary countries of origin Elevator and moving stairways 12.2 Mexico, Canada and Germany Conveyor equipment 5.4 Canada, Germany and Netherlands Overhead crane, hoists and monorails 5.1 Japan, Italy and Germany Industrial truck, trailer and tractors 6.3 Canada, U.K and Republic of Korea Total industry 6.4 Source: International Trade Administration
• Many US manufacturing firms have plants in Mexico and Canada which they use to product replacement parts and components for the products that they manufacture in the US.
Exports
• In 2002, the value of industry exports amounted to $1993 million, 21.9 percent less than the value of exports recorded in 2001 in real terms. Over the past five years, industry exports have declined at an average annualized rate of 2.4 percent. In 2002, exports accounted for 10.7 percent of the total value of industry shipments compared with 15.5 percent in 2001.
Table 3: Top five export destinations as a percentage of exports: 1997 to 2003(YTD) % % % % 2002 2003 Country 1997 2002 YTD YTD Canada 28.6 34.3 31.0 33.6 Mexico 9.2 11.4 11.0 10.3 United Kingdom 7.5 10.8 10.9 8.1 Netherlands 2.8 5.4 10.8 4.5 Australia 4.7 4.4 3.0 5.3 Source: International Trade Commission
Market Characteristics Material Handling Equipment Manufacturing in the US (May 2003)
Copyright © 2003, IBISWorld Pty Ltd Page 9
Table 4: Exports by product segment: 2001 Million Dollars % % Average growth Value rate of % per Product segment exports change annum Elevator and moving stairways 103.6 -7.7 -4.5 Conveyor equipment 615.8 -8.9 -4.1 Overhead crane, hoist and monorails 137.5 -28.3 -9.4 Industrial truck, tractor and trailer 1136 2.7 3.6 Total industry 1993 -4.4 -0.6 Source: International Trade Administration
• Many of the finished products manufactured by this industry consist of components made in Europe.
• Imports accounted for 14.5 percent of industry revenue in 2001 and are increasing. • More European material handling equipment manufacturers are establishing
operations in the US. • All of the industries major players sell their products to overseas customers.
Basis of Competition Competition between firms within material handling equipment manufacturing industry is based upon the following:
Price Original equipment manufacturers (OEMs), who demand material handling equipment, operate in a highly competitive environment and as a consequence seek the lowest cost alternative when expanding or enhancing their production lines.
Reputation for quality Brand loyalty among customers is developed through the provision of quality products over a period of time.
Product diversification In an effort to reduce costs and increase productivity, end-users are increasingly consolidating their suppliers. Firms within this industry that have a diverse range of products on offer benefit from this trend.
Strong after-sales service Prompt and reliable after-sales service helps to retain customers and attract new customers.
Market Characteristics Material Handling Equipment Manufacturing in the US (May 2003)
Copyright © 2003, IBISWorld Pty Ltd Page 10
Technical expertise Downstream manufacturers require a high degree of technical expertise when deciding upon new material handling equipment for their manufacturing facilities.
Life Cycle Life cycle stage is mature • Over the past five years, industry value added has declined at an average
annualized rate of 0.1 percent, well below the average annualized growth rate of GDP over the same period of time. The effects of recession in 2001 and 2002 caused a sharp downturn in IVA. Despite this fluctuation, the industry is still in the mature phase of its lifecycle.
• Industry establishments have been declining at an average rate of 0.5 percent over the past five years, while the average market share of the industry's major players has increased over this period.
• New products are periodically introduced as old products are phased out.
Industry Segmentation Material Handling Equipment Manufacturing in the US (May 2003)
Copyright © 2003, IBISWorld Pty Ltd Page 11
Industry Segmentation
Product/Service Segmentation Unit handling conveyors 18.8 percent Forklifts 16.6 percent Parts for industrial trucks and forklifts 12.5 percent Winches and aerial work platforms 12.3 percent Bulk handling conveyors 9.5 percent Bulk powered material moving equipment 6.2 percent Passenger elevators 3.8 percent Hoists 3.5 percent Overhead cranes and monorail systems 3.5 percent Parts for bulk handling conveyors 3 percent Parts for escalators, moving stairways and walkways 2.6 percent Parts for freight elevators and automobile lifts 2.5 percent Freight elevators and automobile lifts 1.7 percent Parts for handling conveyors 1.6 percent Escalators, moving stairways and walkways 1.5 percent Other work trucks fitted with lifting/handling equipment 0.4 percent
• The goods produced by the material handling equipment manufacturing industry in
the US can be divided into four broad product segments: Industrial Trucks, Conveyors, Hoists and Cranes, and Elevators and Escalators.
• According to the 1997 census, Industrial trucks accounted for 35.7 percent of total industry revenue. This segment includes forklifts, bulk powered material moving equipment (i.e. stacking machines, trailers and hydraulic lift platforms), and parts sold separately. This product segment has exhibited the most growth within the industry in recent years due primarily to increased export demand and new product introductions.
• Conveyors accounted for around 33 percent of total industry revenue. This segment includes both unit handling and bulk handling conveyors as well as parts used to service them. Unit handling conveyor systems are most commonly used in manufacturing production lines, while bulk handling conveyor systems are used for the movement of freight and produce.
• Hoists and cranes accounted for 19.3 percent of total industry revenue. This product segment includes auto wrecker hoists, aerial work platforms, traveling cranes and monorail systems. Mobile hydraulic cranes are primarily used by contractors engaged in industrial, commercial and public works construction.
• Elevators and escalators accounted for around 12 percent of total industry revenue. This product segment includes both freight and passenger elevators, escalators, moving walkways and the associated parts and attachments. Overall this segment has remained relatively stable in recent years. Although as the number of elevators and escalators in service has increased, so has the demand for parts to service them. Escalators, in particular, require constant maintenance.
Industry Segmentation Material Handling Equipment Manufacturing in the US (May 2003)
Copyright © 2003, IBISWorld Pty Ltd Page 12
Major Market Segments Original equipment manufacturers 41.4 percent Construction industries 33.8 percent Freight handlers 24.8 percent
• The material handling equipment manufacturing industry primarily supplies other
downstream manufacturing industries. Conveyor systems, hoists, stacking machines and forklifts are all used intensively by manufacturing industries in their production lines.
• Construction industries use cranes, industrial trucks and trailers, and elevators in residential, commercial and public works construction projects.
• Freight handling industries use conveyor systems, hoists, and forklift equipment to move freight from its origin to its destination.
• IBISWorld estimates that all three market segments will vary only slightly relative to each other in future years.
Industry Concentration Level of industry concentration is low • The industry's four major players are: NACCO Industries Inc (5%), Kone
Corporation (4%), Terex Corporation (4%) and Columbus McKinnon Corporation (3%).
• The combined market share of these firms is 16 percent. • The remainder of the industry is highly fragmented, consisting of a number of
smaller firms who specialize in particular product segments and operate in local areas.
Geographic Spread Table 5: Number of establishments, 2002 Number of Establishments Region Million Dollars Far West 12.4 Great Lakes 28.1 Mid East 13 New England 3.1 Plains 11.4 Rocky Mountains 2.7 South East 21 South West 8.4 Source: US Census Note: '*' represents estimates by IBISWorld.
• Industry activity is concentrated in the Great Lakes and South East regions of the United States. Proximity to downstream manufacturing facilities is a primary determinant of geographic industry concentration.
• The Great Lakes region accounted for 28.1 percent of industry establishments, 36 percent of total industry sales and 34.1 percent of industry employment. Michigan
Industry Segmentation Material Handling Equipment Manufacturing in the US (May 2003)
Copyright © 2003, IBISWorld Pty Ltd Page 13
accounted for 25.7 percent of regional industry establishments and 7.2 percent of national industry establishments. Michigan is one of the largest manufacturing states in the US, being home to both Ford, General Motors and a range of other manufacturing industries reliant upon material handling equipment.
• The South East region accounted for 21 percent of industry establishments, 23 percent of industry sales and 20.7 percent of industry employment.
• The Mid East region accounted for 13 percent of industry establishments, 11.1 percent of industry sales and 13 percent of industry employment. This region contains the state of New York, which accounted for 32 percent of regional industry establishments and 4.2 percent of national industry establishments. New York is home to the largest sea ports in the US, which demand material handling equipment to move freight.
• The Far West region accounted for 12.4 percent of industry establishments, 8.9 percent of industry sales and 9.6 percent of industry employment. The state of California accounted for 66 percent of regional industry establishments and 8.2 percent of national industry establishments. California is home to a large agricultural industry in addition to having some of the largest sea ports on the west coast of North America.
• The Plains region accounted for 11.4 percent of industry establishments, 9.4 percent of industry sales and 12.2 percent of industry employment.
• The South West region accounted for 8.4 percent of industry establishments, 9.2 percent of industry sales and 7.1 percent of industry employment. Texas accounted for 77 percent of regional industry establishments and 6.5 percent of national industry establishments. Texas is home to a diverse range of manufacturing industries that demand material handling equipment for their production lines.
• New England accounted for 3.1 percent of industry establishments, 1 percent of industry sales and 1.2 percent of industry employment.
• The Rocky Mountains accounted for 2.7 percent of industry establishments, 1.4 percent of industry sales and 2.3 percent of industry employment.
Industry Conditions Material Handling Equipment Manufacturing in the US (May 2003)
Copyright © 2003, IBISWorld Pty Ltd Page 14
Industry Conditions
Barriers to Entry Level of barriers to entry is low • There are no licensing requirements, government regulations or resource
constraints that are significant enough to prevent firms from entering the Material Handling Equipment Manufacturing industry.
• The cost of establishing manufacturing facilities and sourcing skilled employees may deter some firms from entering the industry.
Industry Assistance Level of industry assistance is medium
Key Tariffs Description Low Rate High Rate Escalators and moving walkways 35 35 Passenger and freight elevator 35 35 Parts for passenger and freigh 35 35 Belt conveyors 35 35 Transporter and bridge cranes 35 35 Forklifts with electric motors 35 35 Forklifts without electric mot 35 35
• A 35 percent ad valorem tariff applies to the industry product listed which originate from countries that do not have "normal trade relations" (NTR) with the US.
Taxation Not affected by taxation issues There are no taxation issues specific to this industry. Like most other industries, however, the following taxes are applicable: • payroll tax • property tax • excise tax • income tax
Regulation/Deregulation Level of regulation is medium • The material handling equipment manufacturing industry is subject to numerous
laws and regulations designed to protect the environment, particularly with respect to disposal of plant waste.
• Such environmental laws and regulations include the Federal Clean Air Act, the Clean Water Act, the Resource, Conservation and Recovery Act, and the Comprehensive Environmental Response, Compensation and Liability Act.
Industry Conditions Material Handling Equipment Manufacturing in the US (May 2003)
Copyright © 2003, IBISWorld Pty Ltd Page 15
• In addition, some of the industry's products are subject to various industry and governmental standards, particularly with respect to engine emission levels.
Cost Structure Share of Industry Items Turnover Depreciation 5.8 Other 4.6 Purchases 68.6 Returns 1.4 Wages 19.6
• The manufacturing process involves the assembly of products from raw materials. • According to the Bureau of Statistics, on average industry operators expended
around 56 percent of firm revenue on the purchase of materials in 2001. This expenditure item can fluctuate from between 50 to 60 percent of total revenue depending upon raw material prices. In recent times many manufacturers have sought to consolidate their raw materials suppliers in order to reduce sourcing costs.
• Wages, which account for 19.6 percent of total revenue, are the firm's primary flexible cost. When the industry experiences a downturn, this is the first expenditure item which firms seek to reduce; usually through the retrenchment of employees, consolidation and divestitures.
• Other expenses include costs associated with compliance to environmental laws, packaging and transportation.
Capital/Labor Intensity Level of capital labor ratio is medium • The manufacturing process involves a large amount of capital equipment in the
form of plant and equipment. • Production lines utilize automated machinery to complete repetitive tasks, reducing
labor costs. • The design and assembly of some of the industry's products, conveyor systems in
particular, involves a significant amount of human labor. • In addition skilled labor is required to monitor production lines, undertake research
and development and give customers advice about the most suitable material handling equipment for their needs.
Technology and Systems Level of technology change is medium • Technology in this industry centers on research and development which delivers
new and improved products. Manufacturers of material handling equipment also seek to develop total solutions for customers in order to add value to their products.
• A large number of suppliers, distributors and products and parts, raise the importance of fully automated inventory control systems. These systems can
Industry Conditions Material Handling Equipment Manufacturing in the US (May 2003)
Copyright © 2003, IBISWorld Pty Ltd Page 16
record inventories, pick products, determine minimum order quantities, assess customer credit ratings, generate invoices and payment advices.
Industry Volatility Level of volatility is medium
Volatility Reasons
• The material handling equipment manufacturing industry services a number of downstream manufacturing industries in addition to the construction industry.
• These industries are subject to volatility caused by the cyclical nature of the economy to varying degrees.
• The cyclical nature of construction activity exposes this industry to a high level of volatility which is moderated by the fact that this industry also supplies a diverse range of manufacturing industries, which in sum are less volatile.
Performance Material Handling Equipment Manufacturing in the US (May 2003)
Copyright © 2003, IBISWorld Pty Ltd Page 17
Performance
Historical Performance The development of new products and systems, particularly in the conveyor and conveyor systems segment of the industry, and increased awareness of the importance of effective materials handling practices contributed to industry growth towards the end of the 1980s. Over the past two decades, firms have become increasingly aware that effective distribution management, supply, and logistics are means of establishing competitive barriers and enhancing the servicing of customer requirements, in addition to increasing efficiency and productivity and decreasing operating costs. The need for effective materials handling systems has also been increased by changes in technology in downstream industries. Examples of this include the introduction of just-in-time production methods by a number of manufacturers and changes in construction technology (such as more off-site manufacturing, tilt-up methods of precast and increased use of pre-fab modules). There has also been a trend to improve inventory control, and thus efficiency, by combining technology and computerization. Another trend has been a resurgence in containerization, with containers custom designed on an industry or company basis. The introduction of new materials handling techniques and equipment has also been motivated by identification of the increasing cost of traditional labor intensive materials handling methods, both in direct labor cost terms and in occupational health terms. During the late 1970s and early 1980s the industry experienced relatively strong growth, however, the effect of the 1982-83 economic recession and associated contraction in investment in plant and equipment, resulted in major contractions in the domestic market for materials handling equipment, and in the level of local industry sales IBISWorld. Demand and IBISWorld stagnated until 1985-86. By 1991-92 neither demand nor IBISWorld had recovered to pre-1982-83 levels notwithstanding rapid growth in 1988-89. Industry sales revenue grew by 33 percent over the five years from 1992 to 1997, growing at an average rate of 6.3 percent per annum. This strong growth reflected increased private equipment fuelled by income growth, and growth in non-building construction, particularly construction of large shopping complexes, hotels and casinos.
Current Performance Table 6: Performance Table Year Industry Ended Industry Gross Dec Turnover % Growth Product % Growth 1997 18091.1 7867.4 1998 19192.4 +6.1 8208.3 +4.3 1999 19415.8 +1.2 8706.5 +6.1 2000 20311.2 +4.6 8848.0 +1.6 2001 18347.3 -9.7 7982.4 -9.8 2002 *17882.4 -2.5 *7818.2 -2.1 Average Annual Growth -0.2 -0.1
Performance Material Handling Equipment Manufacturing in the US (May 2003)
Copyright © 2003, IBISWorld Pty Ltd Page 18
Note: '*' represents estimates by IBISWorld. Source: US Census
The materials handling industry, is a mature industry, which has historically been cyclical. Fluctuations in the rate of orders reflect the capital investment decisions of customers, which in turn depend upon the general level of economic activity in the various industries served by such customers. The material handling equipment manufacturing industry services many industries including: other downstream manufacturing industries, non-residential construction industries and freight service providers. Industry sales revenue is primarily affected by non-residential construction activity and downstream manufacturing industries. Non-residential construction industries demand cranes, industrial trucks and elevators and moving walkways. As manufacturing industries increase their production volumes their demand for conveyor systems, hoists, monorails and forklifts increases. In addition, as manufacturing output increases, so does the demand for the transportation of this freight, which is mostly outsourced to specialist freight firms who in turn demand hoists and forklifts to handle this freight.
Industry Sales Revenue Over the past five years, the Material Handling Equipment Manufacturing industry has declined by 1.2 percent, declining at an average annualized rate of 0.2 percent, in real terms. In 1997, industry sales revenue grew by 1.9 percent to $17.9 billion, after growing by 1.2 percent in 1996. Unit volume dropped significantly during the first quarter of 1997 due to decreased demand and production rates. However, demand, production rates and, thus, shipments increased steadily during the last three quarters of 1997 to a level comparable with the same period of 1996. From 1998 to 2000, industry sales revenue grew at an average annualized rate of 3.1 percent fueled by robust growth in office construction, which grew at an average annualized rate of 11.9 percent over this period. Similarly the construction of large-scale retail buildings exceeding $1 million in value grew at an average rate of 9.1 percent per annum from 1998 to 2000. Buoyant consumer spending coupled with the preference for large scale shopping complexes or "big box" retail stores (e.g. hardware, variety stores etc.), drove this construction increasing demand for elevators and moving walkways. In 2000, U.S. office building construction starts continued to gradually decline from their 1998 peak, but remained at high levels. In response to tight market conditions and the resulting demand for space, construction order activity remained strong but showed some signs of slowing. National office vacancy rates remained low, but increased slightly as market conditions eased. Industry sales revenue grew by 6.1 percent, 1.2 percent and 5 percent respectively over this period of time. In 2001, industry orders declined at an annual rate of 8.2 percent to close at $18.3 billion. Shipments declined by 5.3 percent to close at $18.7 billion. A steep drop in the lift truck segment of the industry resulted in an 8.7 percent reduction in lift truck shipments. Industry revenues also declined due to lower parts sales resulting from reduced lift truck utilization, which is typical in this stage of a capital goods recession. The decrease in revenues, which was primarily driven by unit volume, was partially
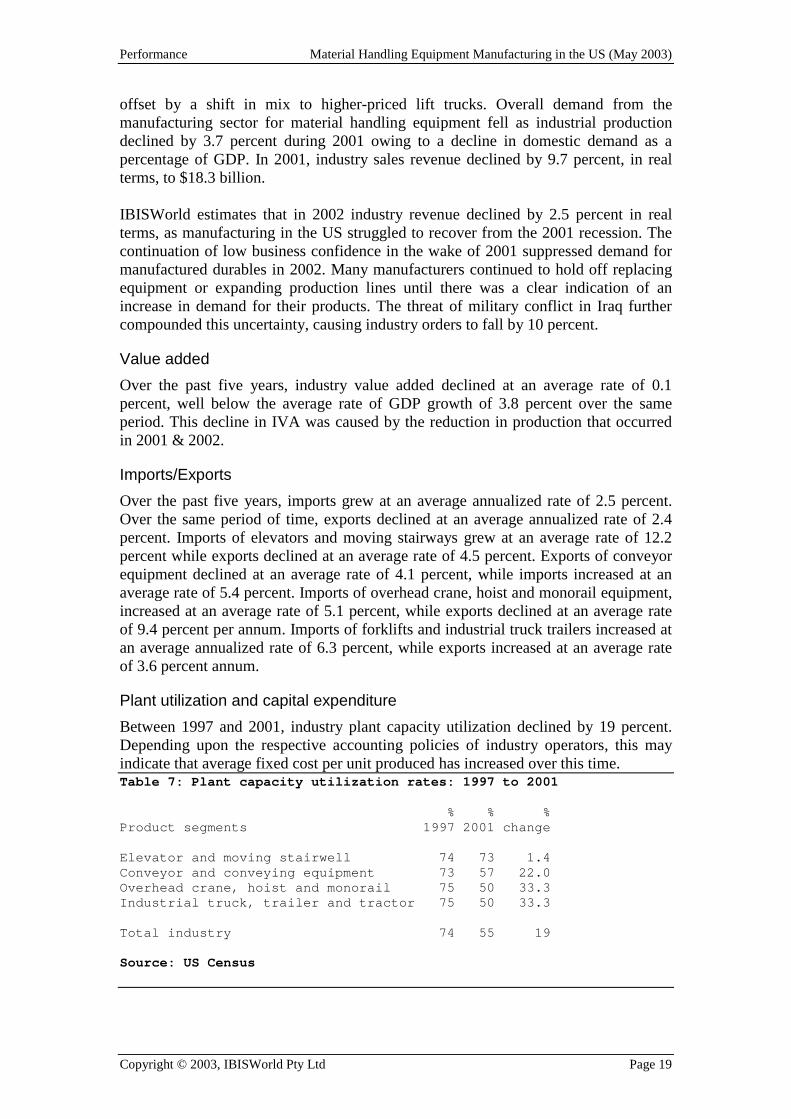
Performance Material Handling Equipment Manufacturing in the US (May 2003)
Copyright © 2003, IBISWorld Pty Ltd Page 19
offset by a shift in mix to higher-priced lift trucks. Overall demand from the manufacturing sector for material handling equipment fell as industrial production declined by 3.7 percent during 2001 owing to a decline in domestic demand as a percentage of GDP. In 2001, industry sales revenue declined by 9.7 percent, in real terms, to $18.3 billion. IBISWorld estimates that in 2002 industry revenue declined by 2.5 percent in real terms, as manufacturing in the US struggled to recover from the 2001 recession. The continuation of low business confidence in the wake of 2001 suppressed demand for manufactured durables in 2002. Many manufacturers continued to hold off replacing equipment or expanding production lines until there was a clear indication of an increase in demand for their products. The threat of military conflict in Iraq further compounded this uncertainty, causing industry orders to fall by 10 percent.
Value added Over the past five years, industry value added declined at an average rate of 0.1 percent, well below the average rate of GDP growth of 3.8 percent over the same period. This decline in IVA was caused by the reduction in production that occurred in 2001 & 2002.
Imports/Exports Over the past five years, imports grew at an average annualized rate of 2.5 percent. Over the same period of time, exports declined at an average annualized rate of 2.4 percent. Imports of elevators and moving stairways grew at an average rate of 12.2 percent while exports declined at an average rate of 4.5 percent. Exports of conveyor equipment declined at an average rate of 4.1 percent, while imports increased at an average rate of 5.4 percent. Imports of overhead crane, hoist and monorail equipment, increased at an average rate of 5.1 percent, while exports declined at an average rate of 9.4 percent per annum. Imports of forklifts and industrial truck trailers increased at an average annualized rate of 6.3 percent, while exports increased at an average rate of 3.6 percent annum.
Plant utilization and capital expenditure Between 1997 and 2001, industry plant capacity utilization declined by 19 percent. Depending upon the respective accounting policies of industry operators, this may indicate that average fixed cost per unit produced has increased over this time. Table 7: Plant capacity utilization rates: 1997 to 2001 % % % Product segments 1997 2001 change Elevator and moving stairwell 74 73 1.4 Conveyor and conveying equipment 73 57 22.0 Overhead crane, hoist and monorail 75 50 33.3 Industrial truck, trailer and tractor 75 50 33.3 Total industry 74 55 19 Source: US Census
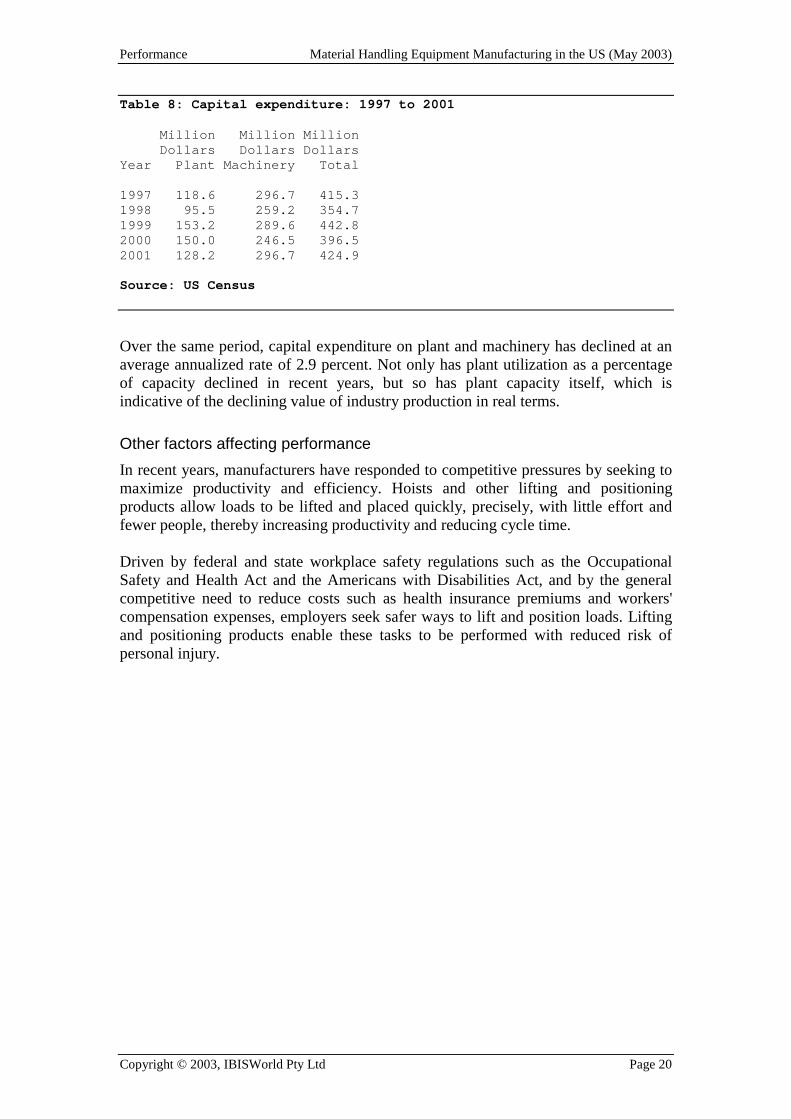
Performance Material Handling Equipment Manufacturing in the US (May 2003)
Copyright © 2003, IBISWorld Pty Ltd Page 20
Table 8: Capital expenditure: 1997 to 2001 Million Million Million Dollars Dollars Dollars Year Plant Machinery Total 1997 118.6 296.7 415.3 1998 95.5 259.2 354.7 1999 153.2 289.6 442.8 2000 150.0 246.5 396.5 2001 128.2 296.7 424.9 Source: US Census
Over the same period, capital expenditure on plant and machinery has declined at an average annualized rate of 2.9 percent. Not only has plant utilization as a percentage of capacity declined in recent years, but so has plant capacity itself, which is indicative of the declining value of industry production in real terms.
Other factors affecting performance In recent years, manufacturers have responded to competitive pressures by seeking to maximize productivity and efficiency. Hoists and other lifting and positioning products allow loads to be lifted and placed quickly, precisely, with little effort and fewer people, thereby increasing productivity and reducing cycle time. Driven by federal and state workplace safety regulations such as the Occupational Safety and Health Act and the Americans with Disabilities Act, and by the general competitive need to reduce costs such as health insurance premiums and workers' compensation expenses, employers seek safer ways to lift and position loads. Lifting and positioning products enable these tasks to be performed with reduced risk of personal injury.
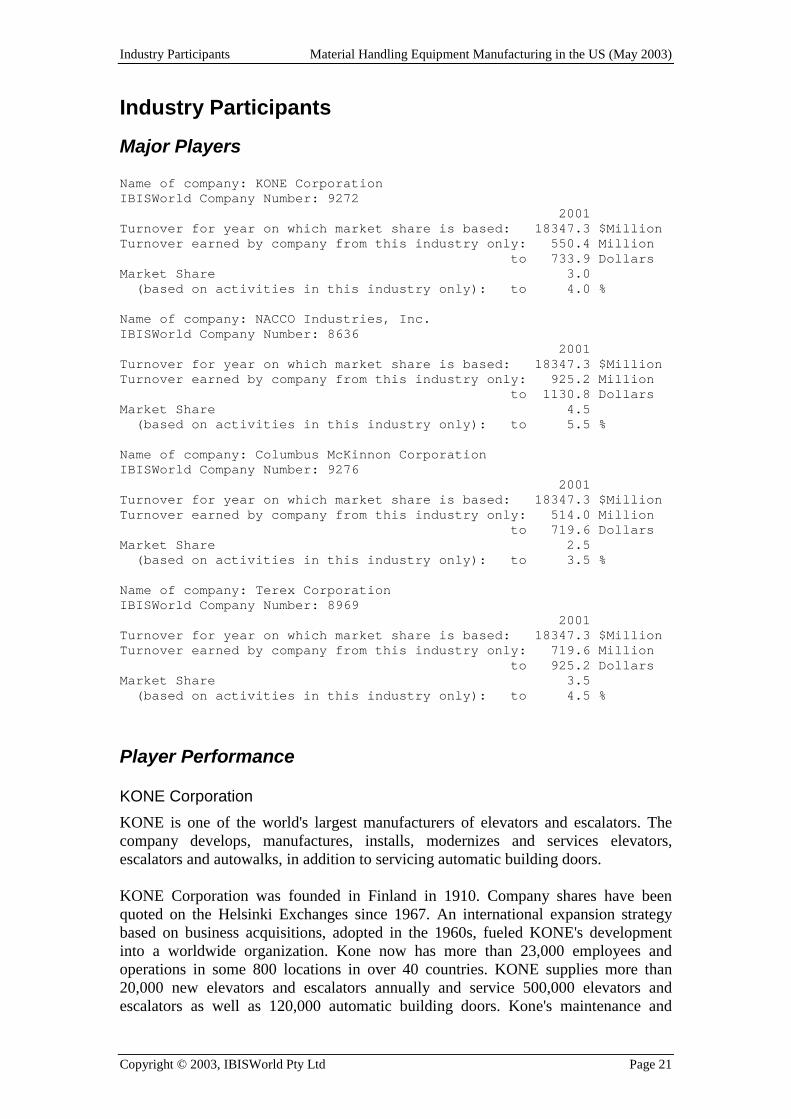
Industry Participants Material Handling Equipment Manufacturing in the US (May 2003)
Copyright © 2003, IBISWorld Pty Ltd Page 21
Industry Participants
Major Players Name of company: KONE Corporation IBISWorld Company Number: 9272 2001 Turnover for year on which market share is based: 18347.3 $Million Turnover earned by company from this industry only: 550.4 Million to 733.9 Dollars Market Share 3.0 (based on activities in this industry only): to 4.0 % Name of company: NACCO Industries, Inc. IBISWorld Company Number: 8636 2001 Turnover for year on which market share is based: 18347.3 $Million Turnover earned by company from this industry only: 925.2 Million to 1130.8 Dollars Market Share 4.5 (based on activities in this industry only): to 5.5 % Name of company: Columbus McKinnon Corporation IBISWorld Company Number: 9276 2001 Turnover for year on which market share is based: 18347.3 $Million Turnover earned by company from this industry only: 514.0 Million to 719.6 Dollars Market Share 2.5 (based on activities in this industry only): to 3.5 % Name of company: Terex Corporation IBISWorld Company Number: 8969 2001 Turnover for year on which market share is based: 18347.3 $Million Turnover earned by company from this industry only: 719.6 Million to 925.2 Dollars Market Share 3.5 (based on activities in this industry only): to 4.5 %
Player Performance
KONE Corporation KONE is one of the world's largest manufacturers of elevators and escalators. The company develops, manufactures, installs, modernizes and services elevators, escalators and autowalks, in addition to servicing automatic building doors. KONE Corporation was founded in Finland in 1910. Company shares have been quoted on the Helsinki Exchanges since 1967. An international expansion strategy based on business acquisitions, adopted in the 1960s, fueled KONE's development into a worldwide organization. Kone now has more than 23,000 employees and operations in some 800 locations in over 40 countries. KONE supplies more than 20,000 new elevators and escalators annually and service 500,000 elevators and escalators as well as 120,000 automatic building doors. Kone's maintenance and
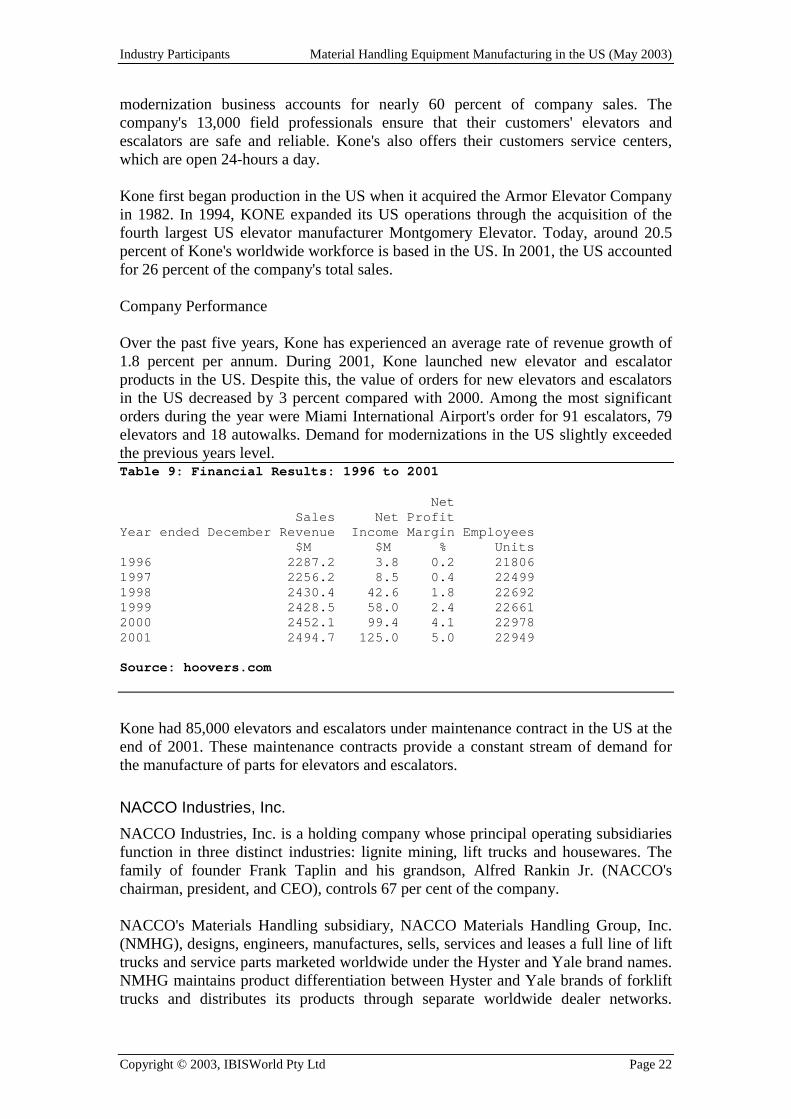
Industry Participants Material Handling Equipment Manufacturing in the US (May 2003)
Copyright © 2003, IBISWorld Pty Ltd Page 22
modernization business accounts for nearly 60 percent of company sales. The company's 13,000 field professionals ensure that their customers' elevators and escalators are safe and reliable. Kone's also offers their customers service centers, which are open 24-hours a day. Kone first began production in the US when it acquired the Armor Elevator Company in 1982. In 1994, KONE expanded its US operations through the acquisition of the fourth largest US elevator manufacturer Montgomery Elevator. Today, around 20.5 percent of Kone's worldwide workforce is based in the US. In 2001, the US accounted for 26 percent of the company's total sales. Company Performance Over the past five years, Kone has experienced an average rate of revenue growth of 1.8 percent per annum. During 2001, Kone launched new elevator and escalator products in the US. Despite this, the value of orders for new elevators and escalators in the US decreased by 3 percent compared with 2000. Among the most significant orders during the year were Miami International Airport's order for 91 escalators, 79 elevators and 18 autowalks. Demand for modernizations in the US slightly exceeded the previous years level. Table 9: Financial Results: 1996 to 2001 Net Sales Net Profit Year ended December Revenue Income Margin Employees $M $M % Units 1996 2287.2 3.8 0.2 21806 1997 2256.2 8.5 0.4 22499 1998 2430.4 42.6 1.8 22692 1999 2428.5 58.0 2.4 22661 2000 2452.1 99.4 4.1 22978 2001 2494.7 125.0 5.0 22949 Source: hoovers.com
Kone had 85,000 elevators and escalators under maintenance contract in the US at the end of 2001. These maintenance contracts provide a constant stream of demand for the manufacture of parts for elevators and escalators.
NACCO Industries, Inc. NACCO Industries, Inc. is a holding company whose principal operating subsidiaries function in three distinct industries: lignite mining, lift trucks and housewares. The family of founder Frank Taplin and his grandson, Alfred Rankin Jr. (NACCO's chairman, president, and CEO), controls 67 per cent of the company. NACCO's Materials Handling subsidiary, NACCO Materials Handling Group, Inc. (NMHG), designs, engineers, manufactures, sells, services and leases a full line of lift trucks and service parts marketed worldwide under the Hyster and Yale brand names. NMHG maintains product differentiation between Hyster and Yale brands of forklift trucks and distributes its products through separate worldwide dealer networks.
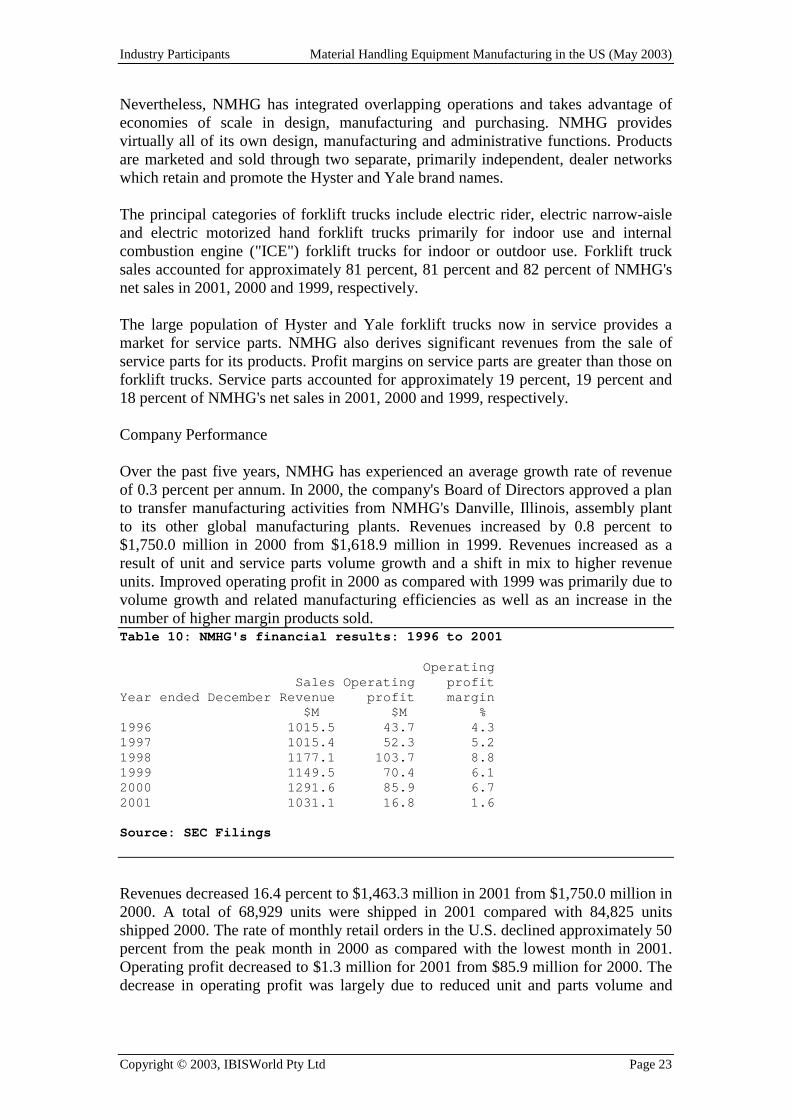
Industry Participants Material Handling Equipment Manufacturing in the US (May 2003)
Copyright © 2003, IBISWorld Pty Ltd Page 23
Nevertheless, NMHG has integrated overlapping operations and takes advantage of economies of scale in design, manufacturing and purchasing. NMHG provides virtually all of its own design, manufacturing and administrative functions. Products are marketed and sold through two separate, primarily independent, dealer networks which retain and promote the Hyster and Yale brand names. The principal categories of forklift trucks include electric rider, electric narrow-aisle and electric motorized hand forklift trucks primarily for indoor use and internal combustion engine ("ICE") forklift trucks for indoor or outdoor use. Forklift truck sales accounted for approximately 81 percent, 81 percent and 82 percent of NMHG's net sales in 2001, 2000 and 1999, respectively. The large population of Hyster and Yale forklift trucks now in service provides a market for service parts. NMHG also derives significant revenues from the sale of service parts for its products. Profit margins on service parts are greater than those on forklift trucks. Service parts accounted for approximately 19 percent, 19 percent and 18 percent of NMHG's net sales in 2001, 2000 and 1999, respectively. Company Performance Over the past five years, NMHG has experienced an average growth rate of revenue of 0.3 percent per annum. In 2000, the company's Board of Directors approved a plan to transfer manufacturing activities from NMHG's Danville, Illinois, assembly plant to its other global manufacturing plants. Revenues increased by 0.8 percent to $1,750.0 million in 2000 from $1,618.9 million in 1999. Revenues increased as a result of unit and service parts volume growth and a shift in mix to higher revenue units. Improved operating profit in 2000 as compared with 1999 was primarily due to volume growth and related manufacturing efficiencies as well as an increase in the number of higher margin products sold. Table 10: NMHG's financial results: 1996 to 2001 Operating Sales Operating profit Year ended December Revenue profit margin $M $M % 1996 1015.5 43.7 4.3 1997 1015.4 52.3 5.2 1998 1177.1 103.7 8.8 1999 1149.5 70.4 6.1 2000 1291.6 85.9 6.7 2001 1031.1 16.8 1.6 Source: SEC Filings
Revenues decreased 16.4 percent to $1,463.3 million in 2001 from $1,750.0 million in 2000. A total of 68,929 units were shipped in 2001 compared with 84,825 units shipped 2000. The rate of monthly retail orders in the U.S. declined approximately 50 percent from the peak month in 2000 as compared with the lowest month in 2001. Operating profit decreased to $1.3 million for 2001 from $85.9 million for 2000. The decrease in operating profit was largely due to reduced unit and parts volume and
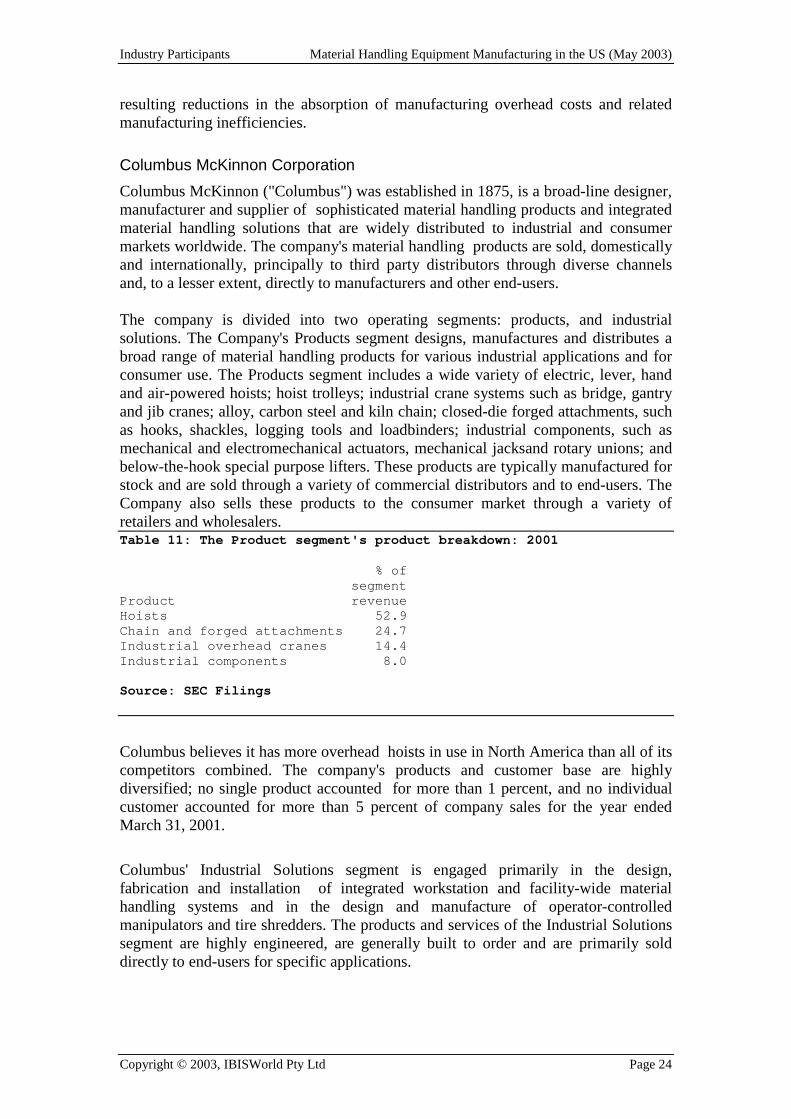
Industry Participants Material Handling Equipment Manufacturing in the US (May 2003)
Copyright © 2003, IBISWorld Pty Ltd Page 24
resulting reductions in the absorption of manufacturing overhead costs and related manufacturing inefficiencies.
Columbus McKinnon Corporation Columbus McKinnon ("Columbus") was established in 1875, is a broad-line designer, manufacturer and supplier of sophisticated material handling products and integrated material handling solutions that are widely distributed to industrial and consumer markets worldwide. The company's material handling products are sold, domestically and internationally, principally to third party distributors through diverse channels and, to a lesser extent, directly to manufacturers and other end-users. The company is divided into two operating segments: products, and industrial solutions. The Company's Products segment designs, manufactures and distributes a broad range of material handling products for various industrial applications and for consumer use. The Products segment includes a wide variety of electric, lever, hand and air-powered hoists; hoist trolleys; industrial crane systems such as bridge, gantry and jib cranes; alloy, carbon steel and kiln chain; closed-die forged attachments, such as hooks, shackles, logging tools and loadbinders; industrial components, such as mechanical and electromechanical actuators, mechanical jacksand rotary unions; and below-the-hook special purpose lifters. These products are typically manufactured for stock and are sold through a variety of commercial distributors and to end-users. The Company also sells these products to the consumer market through a variety of retailers and wholesalers. Table 11: The Product segment's product breakdown: 2001 % of segment Product revenue Hoists 52.9 Chain and forged attachments 24.7 Industrial overhead cranes 14.4 Industrial components 8.0 Source: SEC Filings
Columbus believes it has more overhead hoists in use in North America than all of its competitors combined. The company's products and customer base are highly diversified; no single product accounted for more than 1 percent, and no individual customer accounted for more than 5 percent of company sales for the year ended March 31, 2001.
Columbus' Industrial Solutions segment is engaged primarily in the design, fabrication and installation of integrated workstation and facility-wide material handling systems and in the design and manufacture of operator-controlled manipulators and tire shredders. The products and services of the Industrial Solutions segment are highly engineered, are generally built to order and are primarily sold directly to end-users for specific applications.
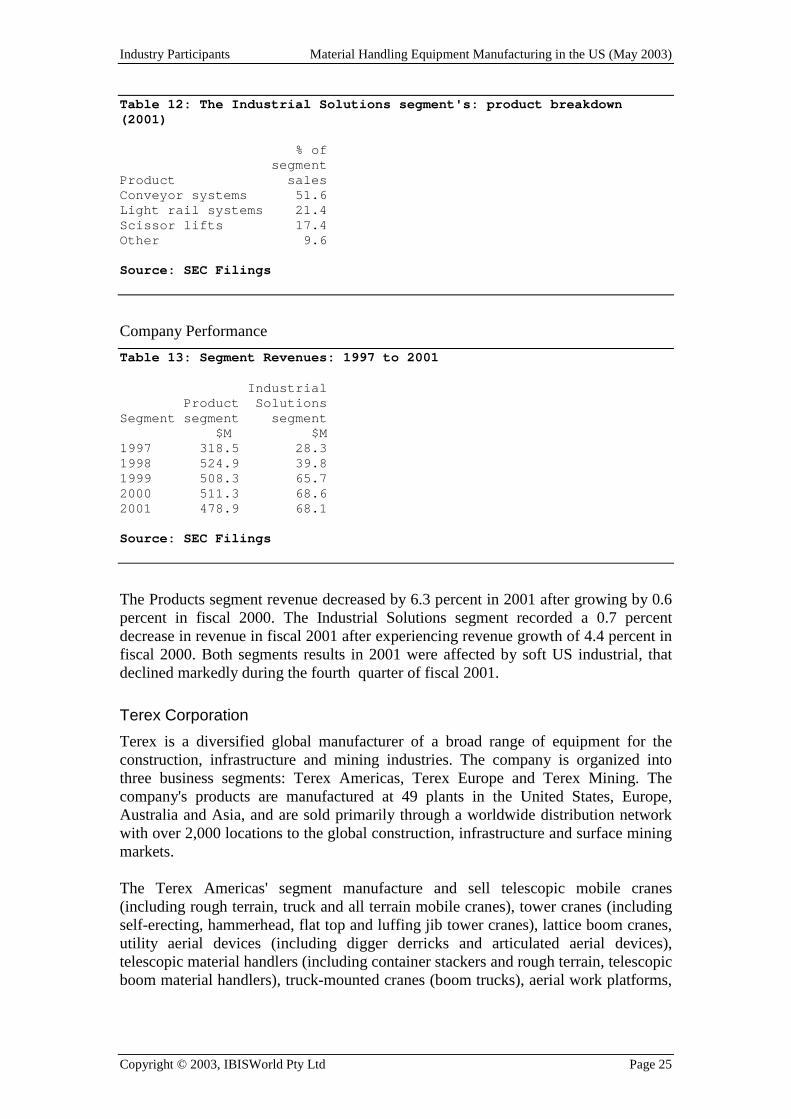
Industry Participants Material Handling Equipment Manufacturing in the US (May 2003)
Copyright © 2003, IBISWorld Pty Ltd Page 25
Table 12: The Industrial Solutions segment's: product breakdown (2001) % of segment Product sales Conveyor systems 51.6 Light rail systems 21.4 Scissor lifts 17.4 Other 9.6 Source: SEC Filings
Company Performance Table 13: Segment Revenues: 1997 to 2001 Industrial Product Solutions Segment segment segment $M $M 1997 318.5 28.3 1998 524.9 39.8 1999 508.3 65.7 2000 511.3 68.6 2001 478.9 68.1 Source: SEC Filings
The Products segment revenue decreased by 6.3 percent in 2001 after growing by 0.6 percent in fiscal 2000. The Industrial Solutions segment recorded a 0.7 percent decrease in revenue in fiscal 2001 after experiencing revenue growth of 4.4 percent in fiscal 2000. Both segments results in 2001 were affected by soft US industrial, that declined markedly during the fourth quarter of fiscal 2001.
Terex Corporation Terex is a diversified global manufacturer of a broad range of equipment for the construction, infrastructure and mining industries. The company is organized into three business segments: Terex Americas, Terex Europe and Terex Mining. The company's products are manufactured at 49 plants in the United States, Europe, Australia and Asia, and are sold primarily through a worldwide distribution network with over 2,000 locations to the global construction, infrastructure and surface mining markets. The Terex Americas' segment manufacture and sell telescopic mobile cranes (including rough terrain, truck and all terrain mobile cranes), tower cranes (including self-erecting, hammerhead, flat top and luffing jib tower cranes), lattice boom cranes, utility aerial devices (including digger derricks and articulated aerial devices), telescopic material handlers (including container stackers and rough terrain, telescopic boom material handlers), truck-mounted cranes (boom trucks), aerial work platforms,
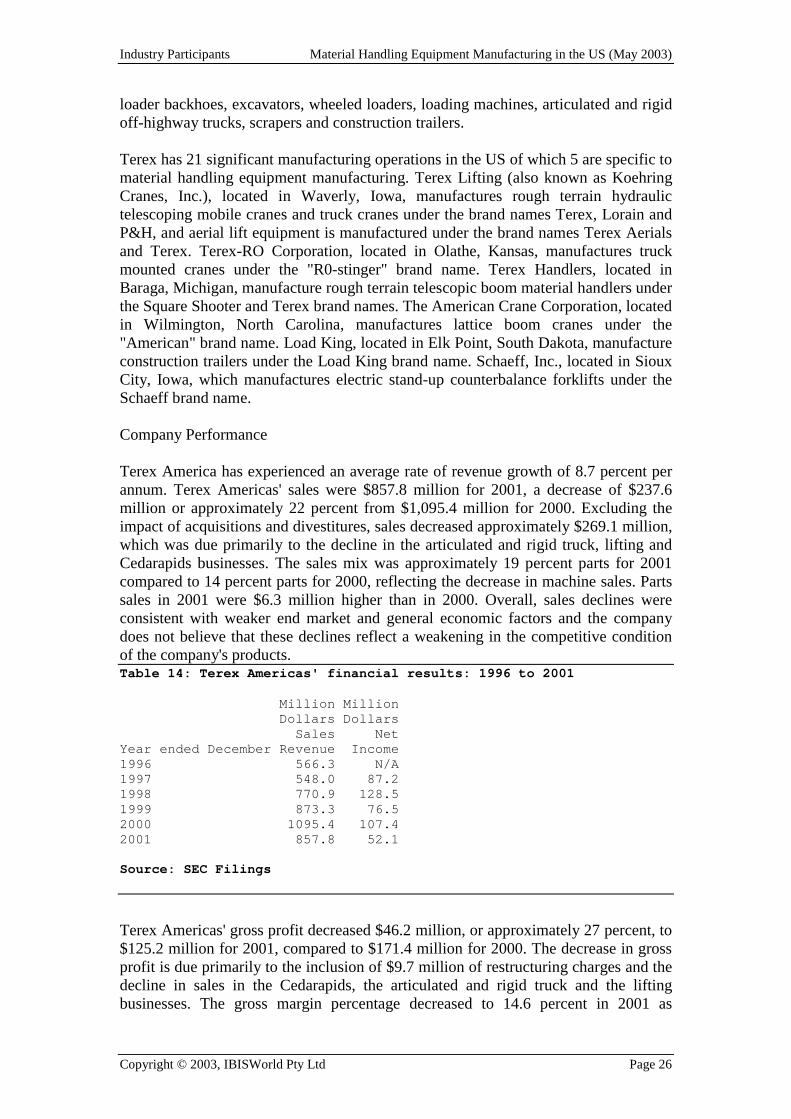
Industry Participants Material Handling Equipment Manufacturing in the US (May 2003)
Copyright © 2003, IBISWorld Pty Ltd Page 26
loader backhoes, excavators, wheeled loaders, loading machines, articulated and rigid off-highway trucks, scrapers and construction trailers. Terex has 21 significant manufacturing operations in the US of which 5 are specific to material handling equipment manufacturing. Terex Lifting (also known as Koehring Cranes, Inc.), located in Waverly, Iowa, manufactures rough terrain hydraulic telescoping mobile cranes and truck cranes under the brand names Terex, Lorain and P&H, and aerial lift equipment is manufactured under the brand names Terex Aerials and Terex. Terex-RO Corporation, located in Olathe, Kansas, manufactures truck mounted cranes under the "R0-stinger" brand name. Terex Handlers, located in Baraga, Michigan, manufacture rough terrain telescopic boom material handlers under the Square Shooter and Terex brand names. The American Crane Corporation, located in Wilmington, North Carolina, manufactures lattice boom cranes under the "American" brand name. Load King, located in Elk Point, South Dakota, manufacture construction trailers under the Load King brand name. Schaeff, Inc., located in Sioux City, Iowa, which manufactures electric stand-up counterbalance forklifts under the Schaeff brand name. Company Performance Terex America has experienced an average rate of revenue growth of 8.7 percent per annum. Terex Americas' sales were $857.8 million for 2001, a decrease of $237.6 million or approximately 22 percent from $1,095.4 million for 2000. Excluding the impact of acquisitions and divestitures, sales decreased approximately $269.1 million, which was due primarily to the decline in the articulated and rigid truck, lifting and Cedarapids businesses. The sales mix was approximately 19 percent parts for 2001 compared to 14 percent parts for 2000, reflecting the decrease in machine sales. Parts sales in 2001 were $6.3 million higher than in 2000. Overall, sales declines were consistent with weaker end market and general economic factors and the company does not believe that these declines reflect a weakening in the competitive condition of the company's products. Table 14: Terex Americas' financial results: 1996 to 2001 Million Million Dollars Dollars Sales Net Year ended December Revenue Income 1996 566.3 N/A 1997 548.0 87.2 1998 770.9 128.5 1999 873.3 76.5 2000 1095.4 107.4 2001 857.8 52.1 Source: SEC Filings
Terex Americas' gross profit decreased $46.2 million, or approximately 27 percent, to $125.2 million for 2001, compared to $171.4 million for 2000. The decrease in gross profit is due primarily to the inclusion of $9.7 million of restructuring charges and the decline in sales in the Cedarapids, the articulated and rigid truck and the lifting businesses. The gross margin percentage decreased to 14.6 percent in 2001 as
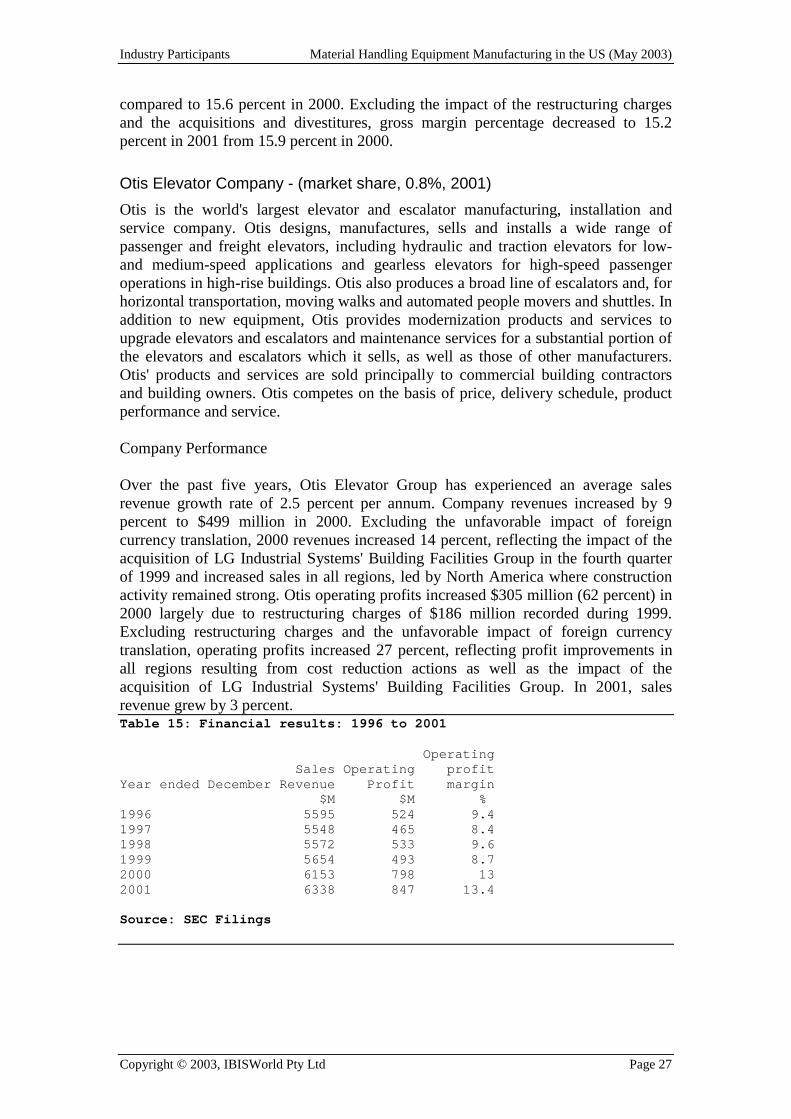
Industry Participants Material Handling Equipment Manufacturing in the US (May 2003)
Copyright © 2003, IBISWorld Pty Ltd Page 27
compared to 15.6 percent in 2000. Excluding the impact of the restructuring charges and the acquisitions and divestitures, gross margin percentage decreased to 15.2 percent in 2001 from 15.9 percent in 2000.
Otis Elevator Company - (market share, 0.8%, 2001) Otis is the world's largest elevator and escalator manufacturing, installation and service company. Otis designs, manufactures, sells and installs a wide range of passenger and freight elevators, including hydraulic and traction elevators for low- and medium-speed applications and gearless elevators for high-speed passenger operations in high-rise buildings. Otis also produces a broad line of escalators and, for horizontal transportation, moving walks and automated people movers and shuttles. In addition to new equipment, Otis provides modernization products and services to upgrade elevators and escalators and maintenance services for a substantial portion of the elevators and escalators which it sells, as well as those of other manufacturers. Otis' products and services are sold principally to commercial building contractors and building owners. Otis competes on the basis of price, delivery schedule, product performance and service. Company Performance Over the past five years, Otis Elevator Group has experienced an average sales revenue growth rate of 2.5 percent per annum. Company revenues increased by 9 percent to $499 million in 2000. Excluding the unfavorable impact of foreign currency translation, 2000 revenues increased 14 percent, reflecting the impact of the acquisition of LG Industrial Systems' Building Facilities Group in the fourth quarter of 1999 and increased sales in all regions, led by North America where construction activity remained strong. Otis operating profits increased $305 million (62 percent) in 2000 largely due to restructuring charges of $186 million recorded during 1999. Excluding restructuring charges and the unfavorable impact of foreign currency translation, operating profits increased 27 percent, reflecting profit improvements in all regions resulting from cost reduction actions as well as the impact of the acquisition of LG Industrial Systems' Building Facilities Group. In 2001, sales revenue grew by 3 percent. Table 15: Financial results: 1996 to 2001 Operating Sales Operating profit Year ended December Revenue Profit margin $M $M % 1996 5595 524 9.4 1997 5548 465 8.4 1998 5572 533 9.6 1999 5654 493 8.7 2000 6153 798 13 2001 6338 847 13.4 Source: SEC Filings
Key Factors Material Handling Equipment Manufacturing in the US (May 2003)
Copyright © 2003, IBISWorld Pty Ltd Page 28
Key Factors
Key Sensitivities
Downstream Demand - Manufacturing The level of activity and technological developments in manufacturing industries affect demand for lifting and material handling equipment. Higher levels of consumption expenditure and private equipment investment generally positively affects manufacturing production and investment.
Downstream Demand - Non-Residential Building Construction Office, retail, industrial, hotel, airport and seaport building activity affects demand for elevators, moving path, conveyer and other material handling equipment.
Downstream Demand - Freight Forwarding (except Road) Conveyor systems, forklifts and hoists are used to load freight for sea, air and rail transportation. An increase in demand for this type of freight increases demand for lifting equipment.
Downstream Demand - Road Freight Transport Forklifts, hoists and conveyor systems are used to load trucks and trailers with freight for road transportation. As road freight transportation companies expand their fleets, demand for lifting equipment increases.
Age of Capital Equipment - Lifting and Materials Handling Equipment The state of existing stocks of lifting and materials handling equipment, as well as the operating and maintenance costs of this equipment, affects demand for replacement equipment. Developments in storage and materials handling technology can affect replacement demand.
Industry Systems & Technology - Lifting & Materials Handling Equipment mfg Developments in storage and materials handling technology can affect replacement demand. Technological advancements that expand the applications of existing equipment or introduce new products to the market that greatly enhance the productive capabilities of downstream users will increase industry revenue. Technological advances that increase existing product durability, however, will decrease the replacement rate of products in service, reducing industry revenue.
Key Factors Material Handling Equipment Manufacturing in the US (May 2003)
Copyright © 2003, IBISWorld Pty Ltd Page 29
Key Success Factors • Access to the latest available and most efficient technology and techniques - access
to internationally competitive technology, through in-house R&D or licensing agreements enables industry operators to obtain an edge over their competitors, increasing their market share.
• Effective quality control - adds value to the firm's brand names by ensuring that products manufactured under those brand names are of a consistent quality.
• Ability to quickly adopt new technology - enables industry operators to quickly take advantage of new technology that puts them ahead of their competitors, increasing brand strength and sales.
• Access to niche markets - gives firms a competitive edge over other industry operators, increasing their sales and profitability through specialization.
• Effective cost controls - increase the firm's profitability.
Industry Outlook Material Handling Equipment Manufacturing in the US (May 2003)
Copyright © 2003, IBISWorld Pty Ltd Page 30
Industry Outlook Table 16: Forecast Table Year Ended Industry Dec Turnover % Growth 2002 *17882.4 2003 *18204.3 +1.8 2004 *19059.9 +4.7 2005 *19460.1 +2.1 2006 *19752.0 +1.5 2007 *19949.6 +1.0 Average Annual Growth +2.2 Note: '*' represents estimates by IBISWorld. Source: US Census
IBISWorld forecasts that over the five years to 2007, industry value added (IVA) will increase at an average annualized real rate of 1.2 percent, around half the average annualized real growth rate of GDP. Real domestic demand is forecast to grow by 11.6 percent, growing at an average annualized rate of 2.2 percent in the 5 years to 2007. Import penetration is forecast to rise over the same period. Forecast low levels of growth in industry exports will detract from overall industry growth.
Domestic Demand Overall, domestic demand for materials handling equipment used in non-construction sectors tends to be partly reflected in movements in economy-wide private equipment investment. Demand for materials handling equipment is also significantly influenced by levels of mining and agricultural production and exports (which affect these sectors' investment in equipment), economy-wide household consumption expenditure (which affects the volume of consumption goods handled), manufacturing activity and economy-wide exports and imports of goods Table 17: Economic indicators that affect demand for the industry's products % % % Chg in Chg in Chg in private industrial housing consumption production Year starts expenditure index 2002 -0.5 2.9 0.0 2003 2.0 2.5 4.6 2004 1.5 3.1 3.8 2005 1.5 3.0 3.5 2006 1.5 2.9 3.3 Source: Bureau of Economic Analysis (USA)
IBISWorld forecasts that economy-wide private consumption expenditure will ease over the outlook period, growing at an average annualized real rate of 2.9 per cent per
Industry Outlook Material Handling Equipment Manufacturing in the US (May 2003)
Copyright © 2003, IBISWorld Pty Ltd Page 31
annum. This compares with average annualized real growth in the 5 years to 2001 of 4 per cent per year.
Most segments of this industry are fragmented with a large number of plants and firms, due partly to the need to locate close to customers to minimize transport costs. However, Census data suggests that economies of scale can be accrued in this industry and this may lead to some rationalization. To succeed, smaller players should have a strong focus in market niches, and should have strong R&D activities or, alternatively, seek to license technology from larger operators in the United States or overseas. The demand for materials handling equipment used to handle internationally traded goods will be influenced by the level of growth in economy-wide exports and imports. Economy-wide export growth will also be negatively affected by slow growth in rural and mining exports. IBISWorld expects that growth in the volume of internationally traded goods will exceed the real growth in the value of international trade due to a decline in real prices of goods traded (due to innovations, falling protection, and stronger levels of international competition). For materials handling equipment used in the building construction sector and in people movement (e.g. elevators), demand will be more sensitive to growth in the level of commercial building construction activity (more particularly office construction, hotels, large shopping complexes, hotels and airport terminals) and, to some extent on high-rise residential developments. IBISWorld forecasts slow overall growth in housing construction activity from the peak reached in 2001 (refer to Table below), due to a slower economy, rising interest rates, lower population growth and a fall in household formation. The pace of growth in non-residential construction activity is also forecast to moderate over the five years to 2007. The principal factors weakening the outlook for non-residential construction activity include the slower pace of general economic and employment growth over the full outlook period, and rising vacancy rates in some property markets early in the outlook period (notably office stock and hotels). Forecast levels of multi-family construction are significantly lower than the previous five years reflecting: fragile investor confidence in the rental property market following the 2001 recession, the easing of demand for new housing as interest rates tighten during the middle of the forecast period and the continued long term trend in the US housing market away from high density multi-family dwellings towards larger single family housing. Demand for conveyor products is significantly influenced by demand from the rural and mining sectors, as well as by downstream handlers and producers. IBISWorld forecasts slow growth in demand from these sectors, which will experience low growth in activity.
Industry Trends Firms within the United States will continue to seek to reduce stock levels through the use of just-in-time stock ordering and supply chain management. This will have the effect of boosting demand for materials handling equipment. US companies are devoting significant resources to improve inventory management in order to improve their competitiveness. This trend will particularly supplement demand for material handling equipment with lower capacity pay loads (due to smaller stock shipments)
Industry Outlook Material Handling Equipment Manufacturing in the US (May 2003)
Copyright © 2003, IBISWorld Pty Ltd Page 32
and which facilitates improvements in supply management. Growth in direct mail and e-commerce will also boost the volume of small shipments. The elevator lift maintenance market is undergoing significant competition, with smaller players seeking to win market share. A focus on the lift maintenance market will assist some players to leverage greater market share in elevator parts as well as in new elevator installations. Other trends in materials management include the use of equipment that facilitates the use of more than one mode of transport (e.g. truck-rail-truck), high growth in air-freight, and the use of computer and communications technologies to track specific goods throughout the delivery chain. These trends will provide niche opportunities for organizations aiming at introducing new innovative materials handling equipment. IBISWorld expects that the trend in outsourcing the logistic function to specialist transport companies will continue, and this will tend to boost capacity utilization of equipment, which may reduce demand for some types of material handling equipment. Materials handling equipment manufacturers could also form joint ventures with materials handling consultants, information technology and logistics management companies to add value to their product range and lock in their customer base.
IBISWORLD BUSINESS ENVIRONMENT REPORT
GOODS AND MATERIALS BUSINESS
ENVIRONMENT OVERVIEW
Published Date: 19 June 2003
Disclaimer
This product has been supplied by IBISWorld Pty Ltd ('IBISWorld') solely for use by its authorised licences strictly in accordance with their licence agreements with IBISWorld. IBISWorld makes no representation to any other person with regard to the completeness or accuracy of the data or information contained herein, and it accepts no responsibility and disclaims all liability (save for liability which cannot be lawfully disclaimed) for loss or damage whatsoever suffered or incurred by any other person resulting from the use of, or reliance upon, the data or information contained herein. Copyright in this publication is owned by IBISWorld Pty Ltd. The publication is sold on the basis that the purchaser agrees not to copy the material contained within it for other than the purchasers own purposes. In the event that the purchaser uses or quotes from the material in this publication - in papers, reports, or opinions prepared for any other person - it is agreed that it will be sourced to:
IBISWorld Pty Ltd.
IBISWorld Business Environment Report Goods and Materials Business Environment Overview (June 2003)
Copyright © 2003, IBISWorld Pty Ltd Page 2
Table of Contents SUMMARY............................................................................ERROR! BOOKMARK NOT DEFINED. THE IMPORTANCE OF GOODS & MATERIALS ..........................................................................5 THE DEPENDENT INDUSTRIES .......................................................................................................6
INPUT-OUTPUT CHAIN...........................................................................................................................6 MOST EXPOSED INDUSTRIES ..................................................................................................................7
SOURCING OF GOODS & MATERIALS..........................................................................................9 IMPORTED GOODS...........................................................................................................................10 PRICES & PRICE INDICATORS......................................................................................................11
SELECTED PRICES................................................................................................................................11 SELECTED INDICATORS........................................................................................................................14
Construction ...................................................................................................................................14 Manufacturing ................................................................................................................................16
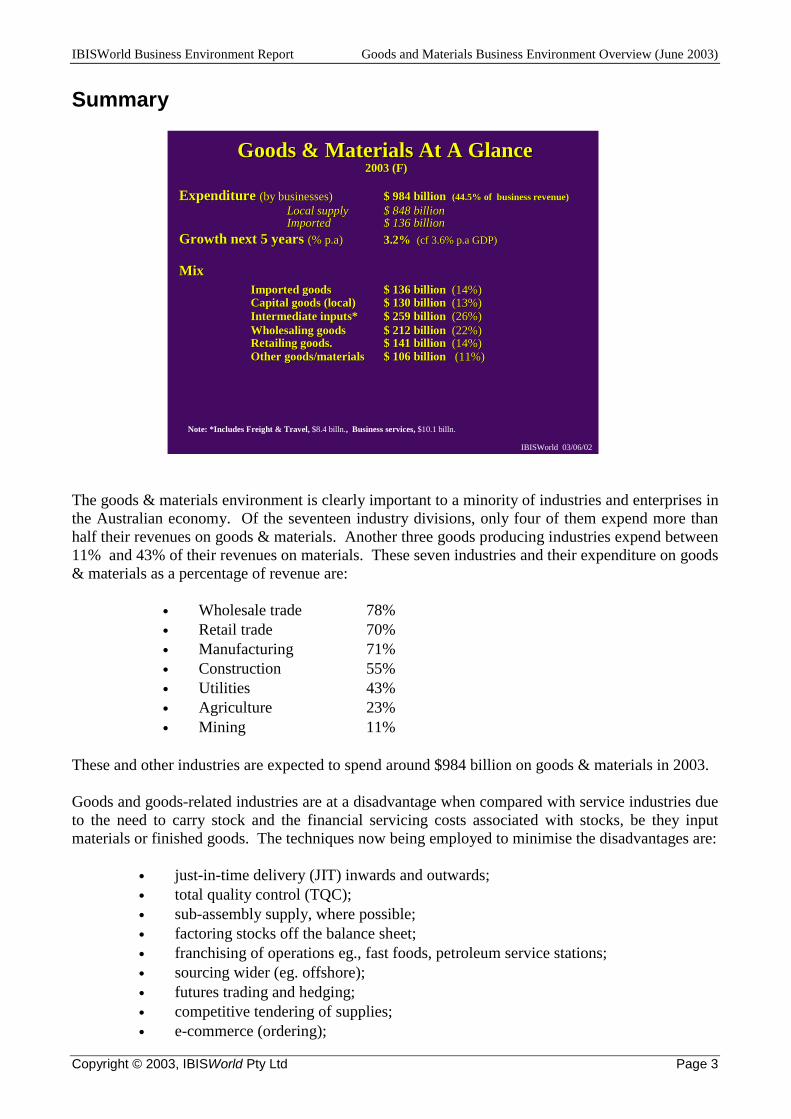
IBISWorld Business Environment Report Goods and Materials Business Environment Overview (June 2003)
Copyright © 2003, IBISWorld Pty Ltd Page 3
Summary
The goods & materials environment is clearly important to a minority of industries and enterprises in the Australian economy. Of the seventeen industry divisions, only four of them expend more than half their revenues on goods & materials. Another three goods producing industries expend between 11% and 43% of their revenues on materials. These seven industries and their expenditure on goods & materials as a percentage of revenue are:
• Wholesale trade 78% • Retail trade 70% • Manufacturing 71% • Construction 55% • Utilities 43% • Agriculture 23% • Mining 11%
These and other industries are expected to spend around $984 billion on goods & materials in 2003. Goods and goods-related industries are at a disadvantage when compared with service industries due to the need to carry stock and the financial servicing costs associated with stocks, be they input materials or finished goods. The techniques now being employed to minimise the disadvantages are:
• just-in-time delivery (JIT) inwards and outwards; • total quality control (TQC); • sub-assembly supply, where possible; • factoring stocks off the balance sheet; • franchising of operations eg., fast foods, petroleum service stations; • sourcing wider (eg. offshore); • futures trading and hedging; • competitive tendering of supplies; • e-commerce (ordering);
Goods & Materials At A GlanceGoods & Materials At A Glance2003 (F)2003 (F)
Expenditure Expenditure (by businesses)(by businesses) $ 984 billion$ 984 billion (44.5% of business revenue)(44.5% of business revenue)Local supplyLocal supply $ 848 billion$ 848 billionImportedImported $ 136 billion$ 136 billion
Growth next 5 years Growth next 5 years (% p.a)(% p.a) 3.2%3.2% ((cf cf 3.6% p.a GDP)3.6% p.a GDP)
MixMixImported goods Imported goods $ 136 billion $ 136 billion (14%)(14%)Capital goods (local)Capital goods (local) $ 130 billion $ 130 billion (13%)(13%)Intermediate inputs*Intermediate inputs* $ 259 billion $ 259 billion (26%)(26%)Wholesaling goodsWholesaling goods $ 212 billion$ 212 billion (22%)(22%)Retailing goods.Retailing goods. $ 141 billion $ 141 billion (14%)(14%)Other goods/materialsOther goods/materials $ 106 billion $ 106 billion (11%)(11%)
IBISWorld 03/06/02
Note: *Includes Freight & Travel, $8.4 billn., Business services, $10.1 billn.
IBISWorld Business Environment Report Goods and Materials Business Environment Overview (June 2003)
Copyright © 2003, IBISWorld Pty Ltd Page 4
When it comes to sourcing goods & materials, Australian enterprises mainly do so locally. Indeed, locally sourced product make up around 87% of total expenditure on goods & materials. The main exception is capital goods (excluding construction), where just 56% is sourced locally. The real cost of input goods & materials into industries is falling over time, reflecting the Boston Learning Curve reality. There are however exceptions, solely due to monopolies and cartels. Oil is the most obvious, controlled by OPEC; but wool is another example, controlled for so long by Australian boards and/or cartels. This overview examines indicative price movements for inputs to Construction and, Manufacturing and Commerce (wholesaling and retailing). The price of inputs to construction have been muted for the past five years; although materials used for house building did rise above the general inflation rate in 2000 due largely to the rush to build homes before the impact of the GST, before easing to a negligible price rise in 2001. The price of inputs to manufacturing rose particularly sharply in 2000 by 16.4% while output prices rose just 7.2%; explaining the difficulties this industry found itself in during 2001. Oil prices and commodity prices (agricultural and mineral) were the prime causes. These are abating rapidly, however, in 2001-02. Commerce has also been under pressure in 2000-01, with input prices of goods rising faster than recoverable selling prices. The weak Australian dollar in the first half of 2001 and high prices for local goods explain this dilemma. Again, these pressures are abating in 2002. As of 2003, the strengthening Australian dollar has caused input prices to fall somewhat.
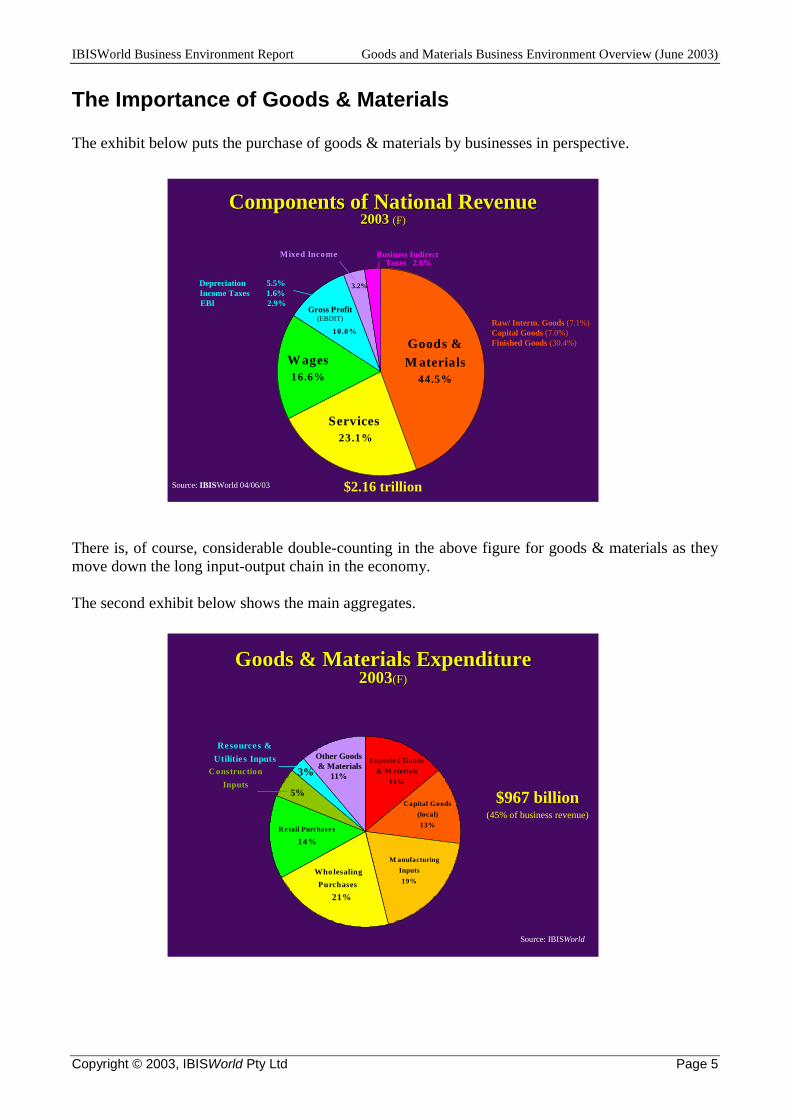
IBISWorld Business Environment Report Goods and Materials Business Environment Overview (June 2003)
Copyright © 2003, IBISWorld Pty Ltd Page 5
The Importance of Goods & Materials The exhibit below puts the purchase of goods & materials by businesses in perspective.
There is, of course, considerable double-counting in the above figure for goods & materials as they move down the long input-output chain in the economy. The second exhibit below shows the main aggregates.
Components of National RevenueComponents of National Revenue2003 2003 (F)(F)
$2.16 trillion
Goods & M aterials
44.5%
10.0%
Services 23.1%
W ages16.6%
Mixed Income
Source: IBISWorld 04/06/03
Gross Profit(EBDIT)
3.2%Depreciation 5.5%Income Taxes 1.6%EBI 2.9%
Business Indirect Taxes 2.6%
Raw/ Interm. Goods (7.1%)Capital Goods (7.0%)Finished Goods (30.4%)
Goods & Materials Expenditure Goods & Materials Expenditure 20032003(F)(F)
$511 billion
Importe d Goods & M aterials
14%
Capital Goods (local)13%
M anufacturing Inputs 19%
Who lesaling Purchases
21%
R e tail Purchase s
14%
Re source s & Utilitie s Inputs
C onstructionInputs
5%
3%Other Goods& Materials
11%
$967 billion(45% of business revenue)
Source: IBISWorld
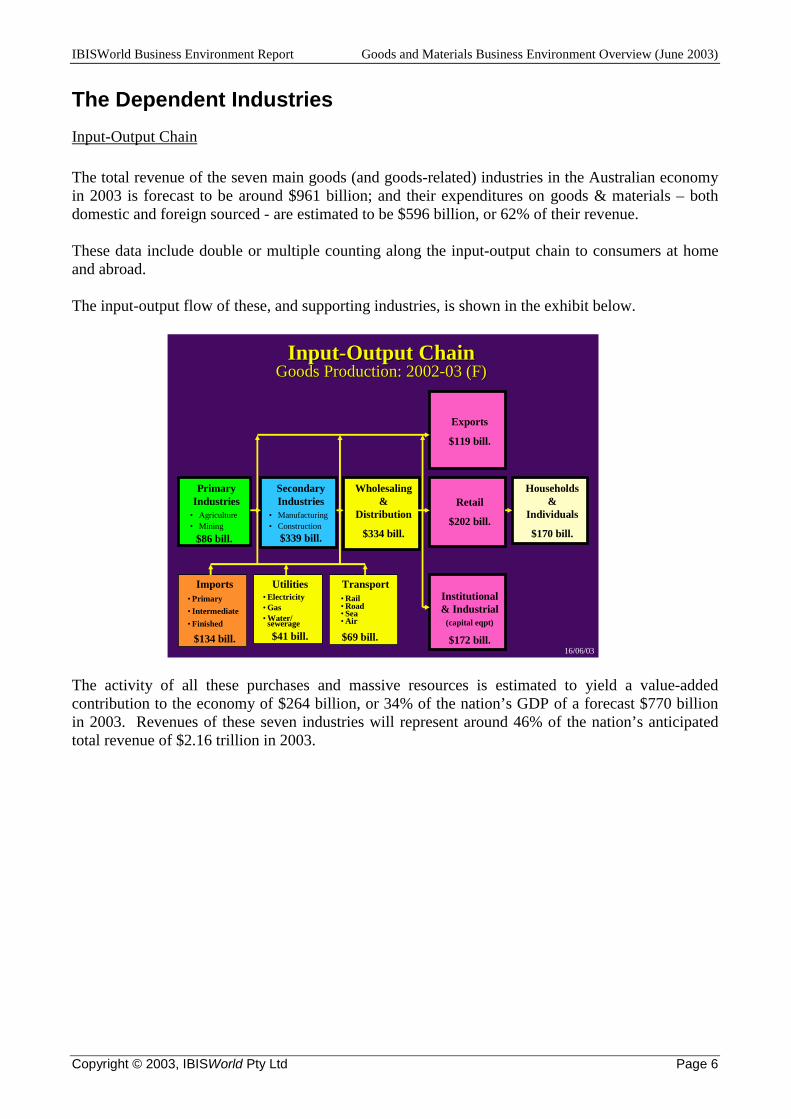
IBISWorld Business Environment Report Goods and Materials Business Environment Overview (June 2003)
Copyright © 2003, IBISWorld Pty Ltd Page 6
The Dependent Industries Input-Output Chain The total revenue of the seven main goods (and goods-related) industries in the Australian economy in 2003 is forecast to be around $961 billion; and their expenditures on goods & materials – both domestic and foreign sourced - are estimated to be $596 billion, or 62% of their revenue. These data include double or multiple counting along the input-output chain to consumers at home and abroad. The input-output flow of these, and supporting industries, is shown in the exhibit below.
The activity of all these purchases and massive resources is estimated to yield a value-added contribution to the economy of $264 billion, or 34% of the nation’s GDP of a forecast $770 billion in 2003. Revenues of these seven industries will represent around 46% of the nation’s anticipated total revenue of $2.16 trillion in 2003.
InputInput--Output ChainOutput ChainGoods Production: 2002Goods Production: 2002--03 (F)03 (F)
16/06/03
Primary Industries
• Agriculture• Mining
$86 bill.
Secondary Industries
$339 bill.
• Manufacturing• Construction
Wholesaling &
Distribution
$334 bill.
Retail
$202 bill.
Households &
Individuals
$170 bill.
Exports
$119 bill.
Institutional & Industrial
(capital eqpt)
$172 bill.
Imports• Primary• Intermediate• Finished
$134 bill.
Utilities• Electricity• Gas• Water/sewerage
$41 bill.
Transport• Rail• Road• Sea• Air
$69 bill.
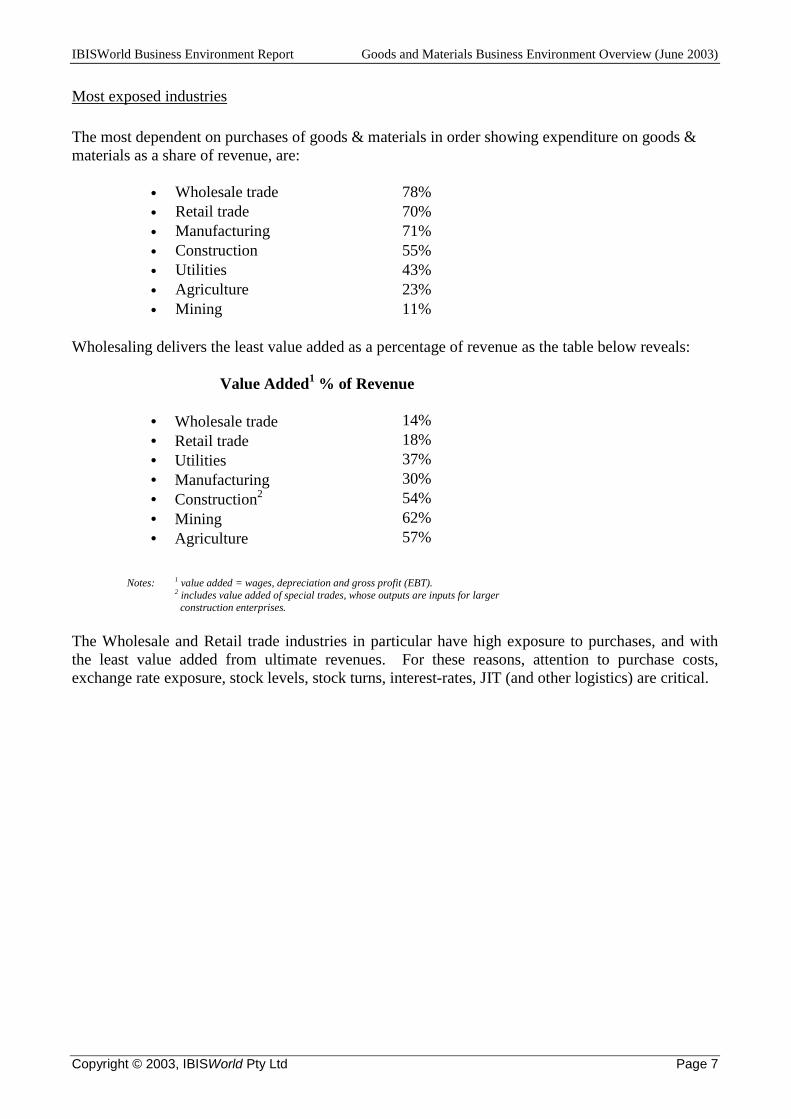
IBISWorld Business Environment Report Goods and Materials Business Environment Overview (June 2003)
Copyright © 2003, IBISWorld Pty Ltd Page 7
Most exposed industries The most dependent on purchases of goods & materials in order showing expenditure on goods & materials as a share of revenue, are:
• Wholesale trade 78% • Retail trade 70% • Manufacturing 71% • Construction 55% • Utilities 43% • Agriculture 23% • Mining 11%
Wholesaling delivers the least value added as a percentage of revenue as the table below reveals:
Value Added1 % of Revenue
• Wholesale trade 14% • Retail trade 18% • Utilities 37% • Manufacturing 30% • Construction2 54% • Mining 62% • Agriculture 57%
Notes:
1 value added = wages, depreciation and gross profit (EBT). 2 includes value added of special trades, whose outputs are inputs for larger construction enterprises.
The Wholesale and Retail trade industries in particular have high exposure to purchases, and with the least value added from ultimate revenues. For these reasons, attention to purchase costs, exchange rate exposure, stock levels, stock turns, interest-rates, JIT (and other logistics) are critical.
IBISWorld Business Environment Report Goods and Materials Business Environment Overview (June 2003)
Copyright © 2003, IBISWorld Pty Ltd Page 8
Goods and materials, as such, are a means to an end for wholesales and retailers; and they are now beginning to emulate arbitraging habits of finance markets wherever possible. Canny enterprises across all the seven most dependent industries appreciate the need to eschew stock via a number of initiatives including:
• just-in-time delivery (JIT) inwards and outwards; • total quality control (TQC); • sub-assembly supply, where possible; • factoring stocks off the balance sheet; • franchising of operations eg., fast foods, petroleum service stations; • sourcing wider (eg. offshore); • futures trading and hedging; • competitive tendering of supplies; • e-commerce (ordering);
The important factor of any enterprise is its value added (wages, profit and depreciation), so possession of stock in the form of raw materials, goods and finished stock is anathema. Stock represents a passive asset with earning value being the same as the cost of financing, i.e. around one and a half times the bond rate. For enterprises seeking a return on shareholders’ funds, or net assets, of four times the bond rate, the challenge is to minimise the negative impact of stock on the balance sheet. Hence the initiatives referred to above. In short, enterprises involved in requiring large quantities of goods and materials to carry on their services have realised they can be at a huge disadvantage compared with service industries that have no such penalty. So, stock is being eschewed.
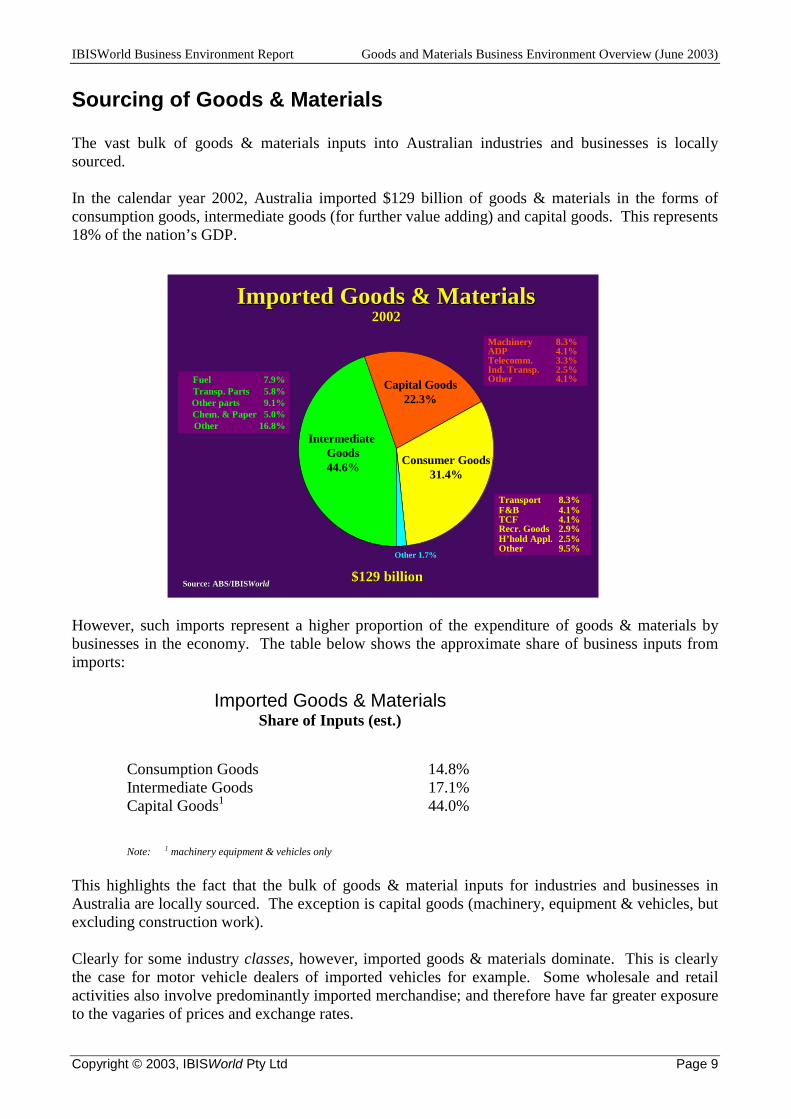
IBISWorld Business Environment Report Goods and Materials Business Environment Overview (June 2003)
Copyright © 2003, IBISWorld Pty Ltd Page 9
Sourcing of Goods & Materials The vast bulk of goods & materials inputs into Australian industries and businesses is locally sourced. In the calendar year 2002, Australia imported $129 billion of goods & materials in the forms of consumption goods, intermediate goods (for further value adding) and capital goods. This represents 18% of the nation’s GDP.
However, such imports represent a higher proportion of the expenditure of goods & materials by businesses in the economy. The table below shows the approximate share of business inputs from imports:
Imported Goods & Materials Share of Inputs (est.)
Consumption Goods 14.8% Intermediate Goods 17.1% Capital Goods1 44.0% Note:
1 machinery equipment & vehicles only
This highlights the fact that the bulk of goods & material inputs for industries and businesses in Australia are locally sourced. The exception is capital goods (machinery, equipment & vehicles, but excluding construction work). Clearly for some industry classes, however, imported goods & materials dominate. This is clearly the case for motor vehicle dealers of imported vehicles for example. Some wholesale and retail activities also involve predominantly imported merchandise; and therefore have far greater exposure to the vagaries of prices and exchange rates.
Imported Goods & MaterialsImported Goods & Materials20022002
Capital Goods22.3%
Consumer Goods31.4%
Intermediate Goods44.6%
Machinery 8.3%ADP 4.1%Telecomm. 3.3%Ind. Transp. 2.5%Other 4.1%Fuel 7.9%
Transp. Parts 5.8%Other parts 9.1%Chem. & Paper 5.0%Other 16.8%
Transport 8.3%F&B 4.1%TCF 4.1%Recr. Goods 2.9%H’hold Appl. 2.5%Other 9.5%
$129 billion$129 billionSource: ABS/IBISSource: ABS/IBISWorldWorld
Other 1.7%
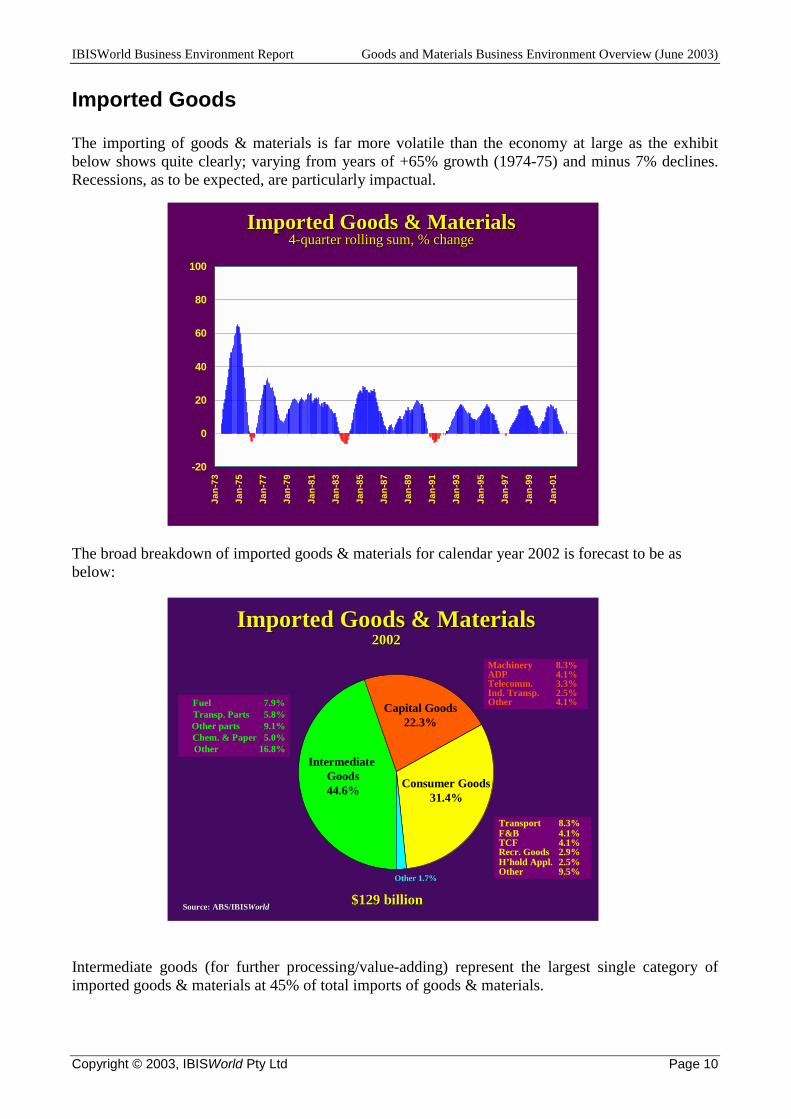
IBISWorld Business Environment Report Goods and Materials Business Environment Overview (June 2003)
Copyright © 2003, IBISWorld Pty Ltd Page 10
Imported Goods The importing of goods & materials is far more volatile than the economy at large as the exhibit below shows quite clearly; varying from years of +65% growth (1974-75) and minus 7% declines. Recessions, as to be expected, are particularly impactual.
The broad breakdown of imported goods & materials for calendar year 2002 is forecast to be as below:
Intermediate goods (for further processing/value-adding) represent the largest single category of imported goods & materials at 45% of total imports of goods & materials.
Imported Goods & MaterialsImported Goods & Materials44--quarter rolling sum, % changequarter rolling sum, % change
-20
0
20
40
60
80
100
Jan-
73
Jan-
75
Jan-
77
Jan-
79
Jan-
81
Jan-
83
Jan-
85
Jan-
87
Jan-
89
Jan-
91
Jan-
93
Jan-
95
Jan-
97
Jan-
99
Jan-
01
Imported Goods & MaterialsImported Goods & Materials20022002
Capital Goods22.3%
Consumer Goods31.4%
Intermediate Goods44.6%
Machinery 8.3%ADP 4.1%Telecomm. 3.3%Ind. Transp. 2.5%Other 4.1%Fuel 7.9%
Transp. Parts 5.8%Other parts 9.1%Chem. & Paper 5.0%Other 16.8%
Transport 8.3%F&B 4.1%TCF 4.1%Recr. Goods 2.9%H’hold Appl. 2.5%Other 9.5%
$129 billion$129 billionSource: ABS/IBISSource: ABS/IBISWorldWorld
Other 1.7%
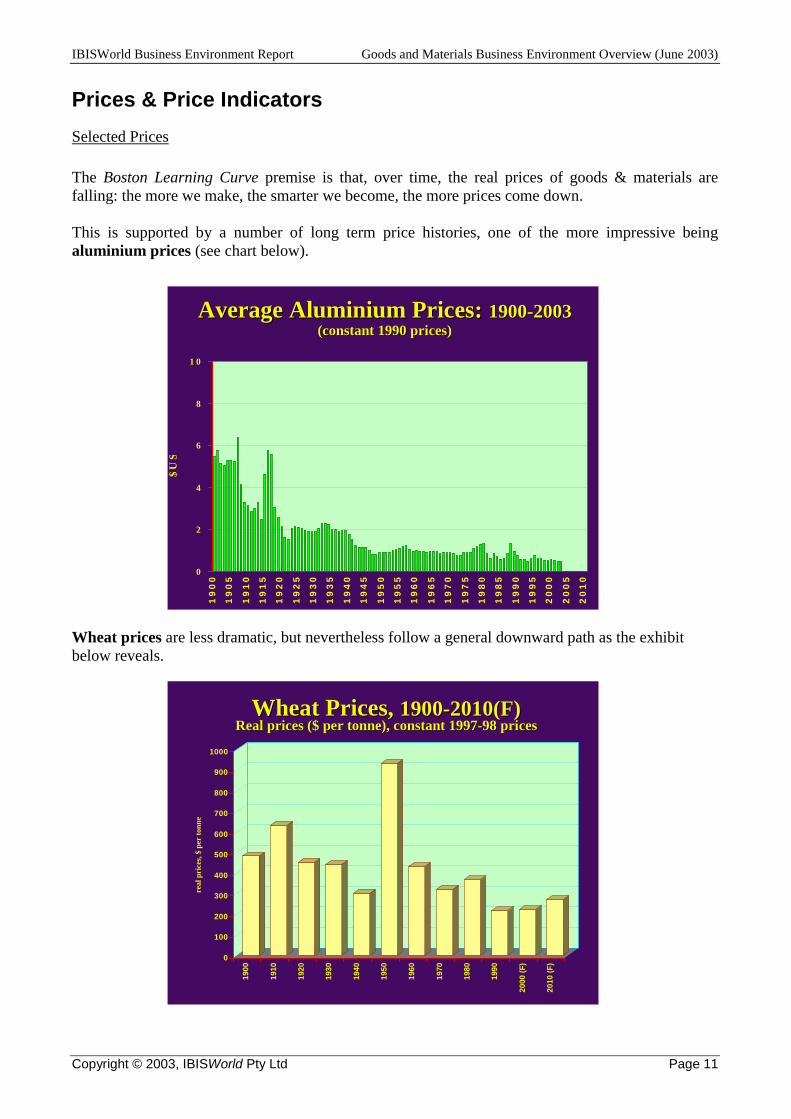
IBISWorld Business Environment Report Goods and Materials Business Environment Overview (June 2003)
Copyright © 2003, IBISWorld Pty Ltd Page 11
Prices & Price Indicators Selected Prices The Boston Learning Curve premise is that, over time, the real prices of goods & materials are falling: the more we make, the smarter we become, the more prices come down. This is supported by a number of long term price histories, one of the more impressive being aluminium prices (see chart below).
Wheat prices are less dramatic, but nevertheless follow a general downward path as the exhibit below reveals.
Average Aluminium Prices: Average Aluminium Prices: 19001900--20032003(constant 1990 prices)(constant 1990 prices)
0
2
4
6
8
1 0
19
00
19
05
19
10
19
15
19
20
19
25
19
30
19
35
19
40
19
45
19
50
19
55
19
60
19
65
19
70
19
75
19
80
19
85
19
90
19
95
20
00
20
05
20
10
$U
S
Wheat Prices, Wheat Prices, 19001900--2010(F)2010(F)Real prices ($ per tonne), constant 1997Real prices ($ per tonne), constant 1997--98 prices98 prices
0
100
200
300
400
500
600
700
800
900
1000
real
pri
ces,
$ pe
r to
nne
1900
1910
1920
1930
1940
1950
1960
1970
1980
1990
2000
(F)
2010
(F)
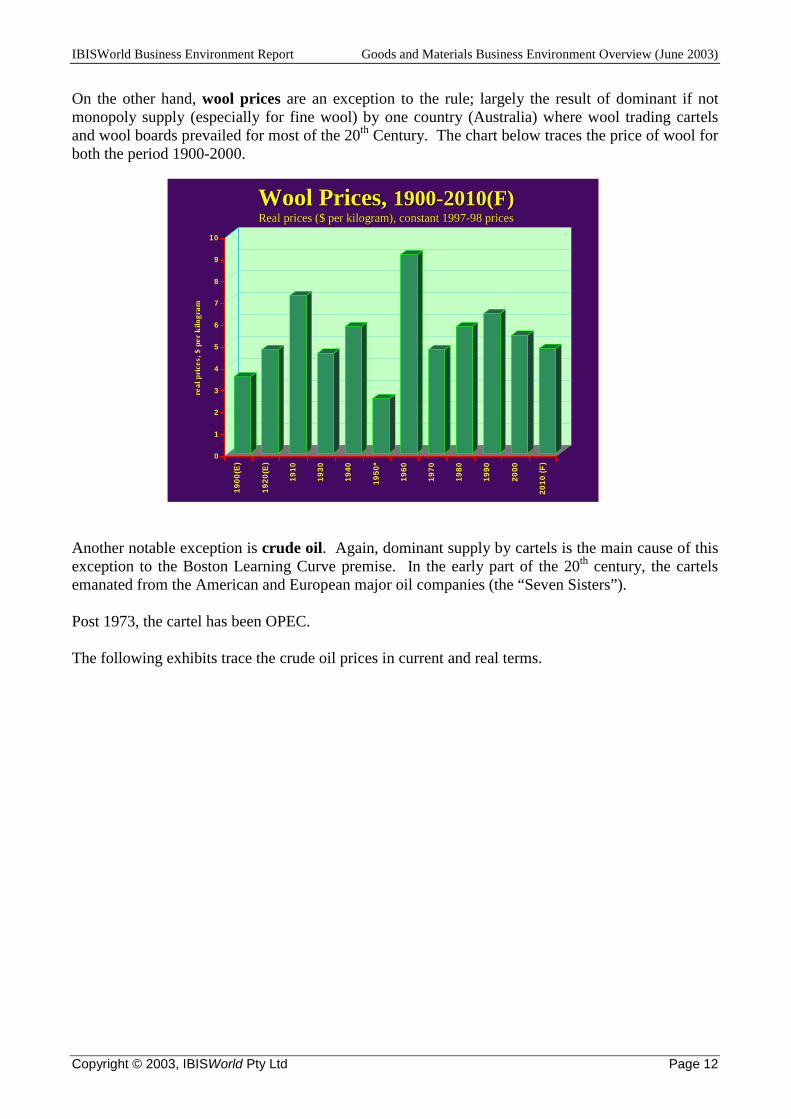
IBISWorld Business Environment Report Goods and Materials Business Environment Overview (June 2003)
Copyright © 2003, IBISWorld Pty Ltd Page 12
On the other hand, wool prices are an exception to the rule; largely the result of dominant if not monopoly supply (especially for fine wool) by one country (Australia) where wool trading cartels and wool boards prevailed for most of the 20th Century. The chart below traces the price of wool for both the period 1900-2000.
Another notable exception is crude oil. Again, dominant supply by cartels is the main cause of this exception to the Boston Learning Curve premise. In the early part of the 20th century, the cartels emanated from the American and European major oil companies (the “Seven Sisters”). Post 1973, the cartel has been OPEC. The following exhibits trace the crude oil prices in current and real terms.
Wool Prices, Wool Prices, 19001900--2010(F)2010(F)Real prices ($ per kilogram), constant 1997Real prices ($ per kilogram), constant 1997--98 prices98 prices
0
1
2
3
4
5
6
7
8
9
10
real
pri
ces,
$ p
er k
ilogr
am
1900
(E)
1920
(E)
1910
1930
1940
1950
*
1960
1970
1980
1990
2000
2010
(F)
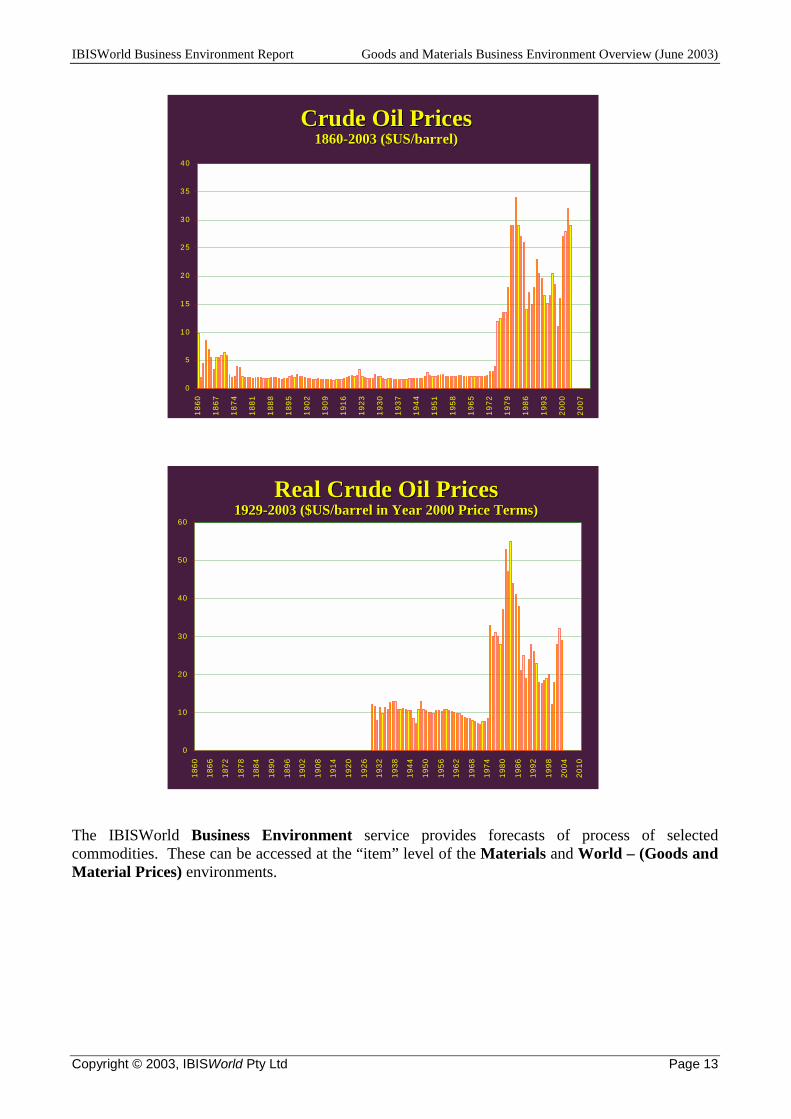
IBISWorld Business Environment Report Goods and Materials Business Environment Overview (June 2003)
Copyright © 2003, IBISWorld Pty Ltd Page 13
The IBISWorld Business Environment service provides forecasts of process of selected commodities. These can be accessed at the “item” level of the Materials and World – (Goods and Material Prices) environments.
Crude Oil PricesCrude Oil Prices18601860--2003 ($US/barrel)2003 ($US/barrel)
0
5
10
15
20
25
30
35
40
1860
1867
1874
1881
1888
1895
1902
1909
1916
1923
1930
1937
1944
1951
1958
1965
1972
1979
1986
1993
2000
2007
Real Crude Oil PricesReal Crude Oil Prices19291929--2003 ($US/barrel in Year 2000 Price Terms)2003 ($US/barrel in Year 2000 Price Terms)
0
10
20
30
40
50
60
1860
1866
1872
1878
1884
1890
1896
1902
1908
1914
1920
1926
1932
1938
1944
1950
1956
1962
1968
1974
1980
1986
1992
1998
2004
2010
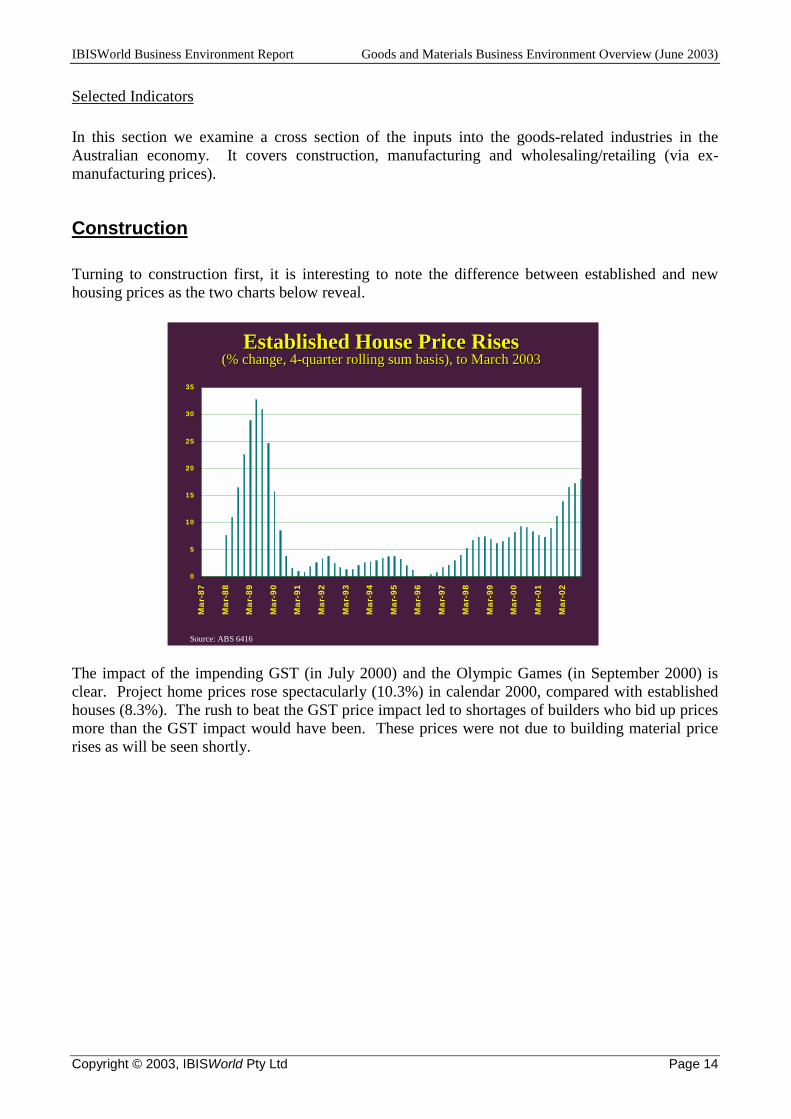
IBISWorld Business Environment Report Goods and Materials Business Environment Overview (June 2003)
Copyright © 2003, IBISWorld Pty Ltd Page 14
Selected Indicators In this section we examine a cross section of the inputs into the goods-related industries in the Australian economy. It covers construction, manufacturing and wholesaling/retailing (via ex-manufacturing prices).
Construction Turning to construction first, it is interesting to note the difference between established and new housing prices as the two charts below reveal.
The impact of the impending GST (in July 2000) and the Olympic Games (in September 2000) is clear. Project home prices rose spectacularly (10.3%) in calendar 2000, compared with established houses (8.3%). The rush to beat the GST price impact led to shortages of builders who bid up prices more than the GST impact would have been. These prices were not due to building material price rises as will be seen shortly.
Established House Price RisesEstablished House Price Rises(% change, 4(% change, 4--quarter rolling sum basis), to March 2003quarter rolling sum basis), to March 2003
0
5
10
15
20
25
30
35
Mar
-87
Mar
-88
Mar
-89
Mar
-90
Mar
-91
Mar
-92
Mar
-93
Mar
-94
Mar
-95
Mar
-96
Mar
-97
Mar
-98
Mar
-99
Mar
-00
Mar
-01
Mar
-02
Source: ABS 6416

IBISWorld Business Environment Report Goods and Materials Business Environment Overview (June 2003)
Copyright © 2003, IBISWorld Pty Ltd Page 15
The current price cycle topped out in the 2000-01 year, with a sharp slowdown in price rises over the latter half of 2001. Falling mortgage interest rates in 2001 and 2002, and the first home buyers grant of $14,000 (March 2001), put a floor under prices of project houses. In contrast to project houses, established house prices grew strongly in the second half of 2001 through to early 2003. As mentioned earlier, input building material prices have not risen in line with finished house prices; and indeed, building materials for other than housing have had very muted price rises over the past several years. This is shown in the following exhibits.
Project House Price RisesProject House Price Rises(% change, 4(% change, 4--quarter rolling sum basis), to March 2003quarter rolling sum basis), to March 2003
-5
0
5
10
15
20
Mar
-87
Mar
-88
Mar
-89
Mar
-90
Mar
-91
Mar
-92
Mar
-93
Mar
-94
Mar
-95
Mar
-96
Mar
-97
Mar
-98
Mar
-99
Mar
-00
Mar
-01
Mar
-02
Mar
-03
Source: ABS6416
House Building Materials Price RisesHouse Building Materials Price Rises(% change, 4(% change, 4--quarter rolling sum basis), to March 2003quarter rolling sum basis), to March 2003
-5
0
5
10
15
20
25
Mar
-68
Mar
-70
Mar
-72
Mar
-74
Mar
-76
Mar
-78
Mar
-80
Mar
-82
Mar
-84
Mar
-86
Mar
-88
Mar
-90
Mar
-92
Mar
-94
Mar
-96
Mar
-98
Mar
-00
Mar
-02
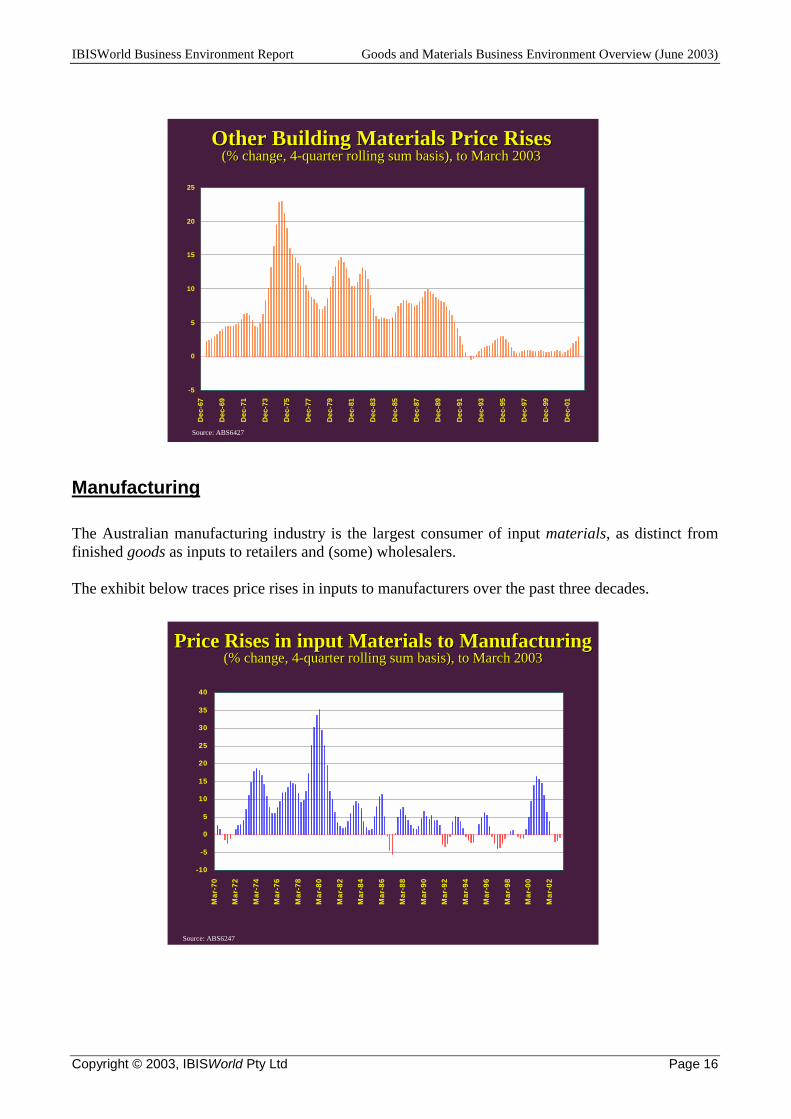
IBISWorld Business Environment Report Goods and Materials Business Environment Overview (June 2003)
Copyright © 2003, IBISWorld Pty Ltd Page 16
Manufacturing The Australian manufacturing industry is the largest consumer of input materials, as distinct from finished goods as inputs to retailers and (some) wholesalers. The exhibit below traces price rises in inputs to manufacturers over the past three decades.
Price Rises in input Materials to ManufacturingPrice Rises in input Materials to Manufacturing(% change, 4(% change, 4--quarter rolling sum basis), to March 2003quarter rolling sum basis), to March 2003
Source: ABS6247
-10
-5
0
5
10
15
20
25
30
35
40
Mar
-70
Mar
-72
Mar
-74
Mar
-76
Mar
-78
Mar
-80
Mar
-82
Mar
-84
Mar
-86
Mar
-88
Mar
-90
Mar
-92
Mar
-94
Mar
-96
Mar
-98
Mar
-00
Mar
-02
Other Building Materials Price RisesOther Building Materials Price Rises(% change, 4(% change, 4--quarter rolling sum basis), to March 2003quarter rolling sum basis), to March 2003
-5
0
5
10
15
20
25
Dec
-67
Dec
-69
Dec
-71
Dec
-73
Dec
-75
Dec
-77
Dec
-79
Dec
-81
Dec
-83
Dec
-85
Dec
-87
Dec
-89
Dec
-91
Dec
-93
Dec
-95
Dec
-97
Dec
-99
Dec
-01
Source: ABS6427
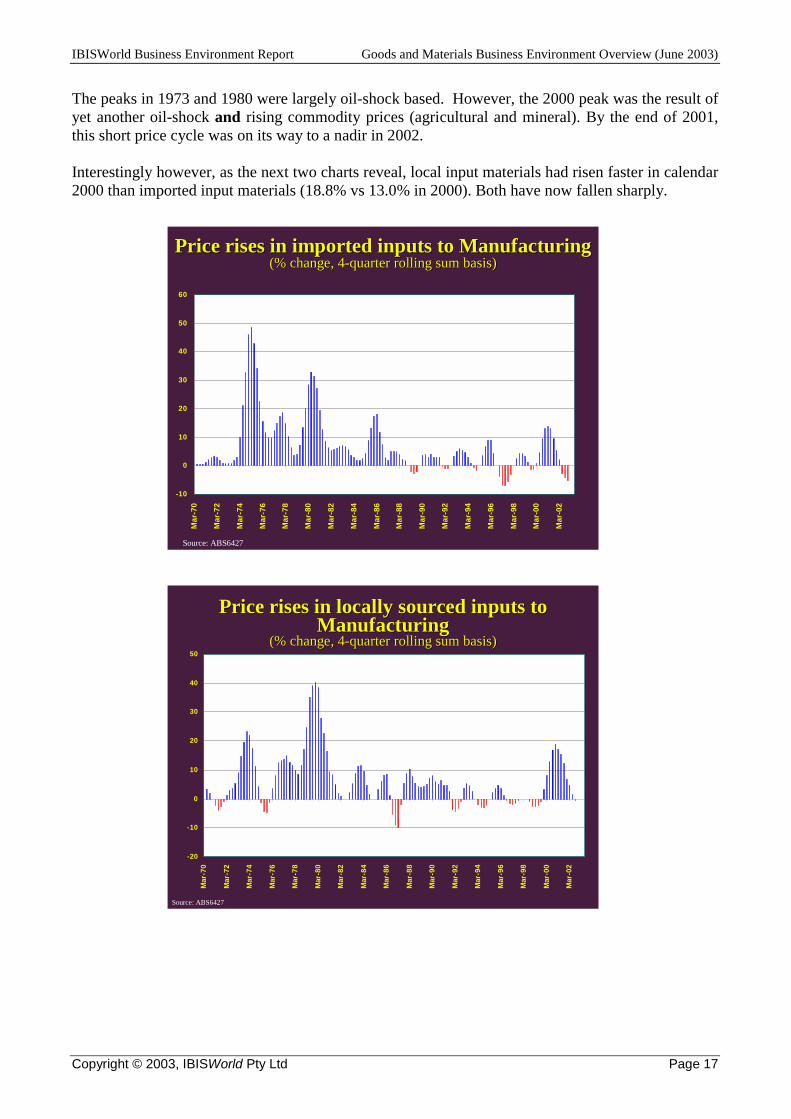
IBISWorld Business Environment Report Goods and Materials Business Environment Overview (June 2003)
Copyright © 2003, IBISWorld Pty Ltd Page 17
The peaks in 1973 and 1980 were largely oil-shock based. However, the 2000 peak was the result of yet another oil-shock and rising commodity prices (agricultural and mineral). By the end of 2001, this short price cycle was on its way to a nadir in 2002. Interestingly however, as the next two charts reveal, local input materials had risen faster in calendar 2000 than imported input materials (18.8% vs 13.0% in 2000). Both have now fallen sharply.
Price rises in imported inputs to ManufacturingPrice rises in imported inputs to Manufacturing(% change, 4(% change, 4--quarter rolling sum basis)quarter rolling sum basis)
Source: ABS6427
-10
0
10
20
30
40
50
60
Mar
-70
Mar
-72
Mar
-74
Mar
-76
Mar
-78
Mar
-80
Mar
-82
Mar
-84
Mar
-86
Mar
-88
Mar
-90
Mar
-92
Mar
-94
Mar
-96
Mar
-98
Mar
-00
Mar
-02
Price rises in locally sourced inputs to Price rises in locally sourced inputs to ManufacturingManufacturing
(% change, 4(% change, 4--quarter rolling sum basis)quarter rolling sum basis)
Source: ABS6427
-20
-10
0
10
20
30
40
50
Mar
-70
Mar
-72
Mar
-74
Mar
-76
Mar
-78
Mar
-80
Mar
-82
Mar
-84
Mar
-86
Mar
-88
Mar
-90
Mar
-92
Mar
-94
Mar
-96
Mar
-98
Mar
-00
Mar
-02
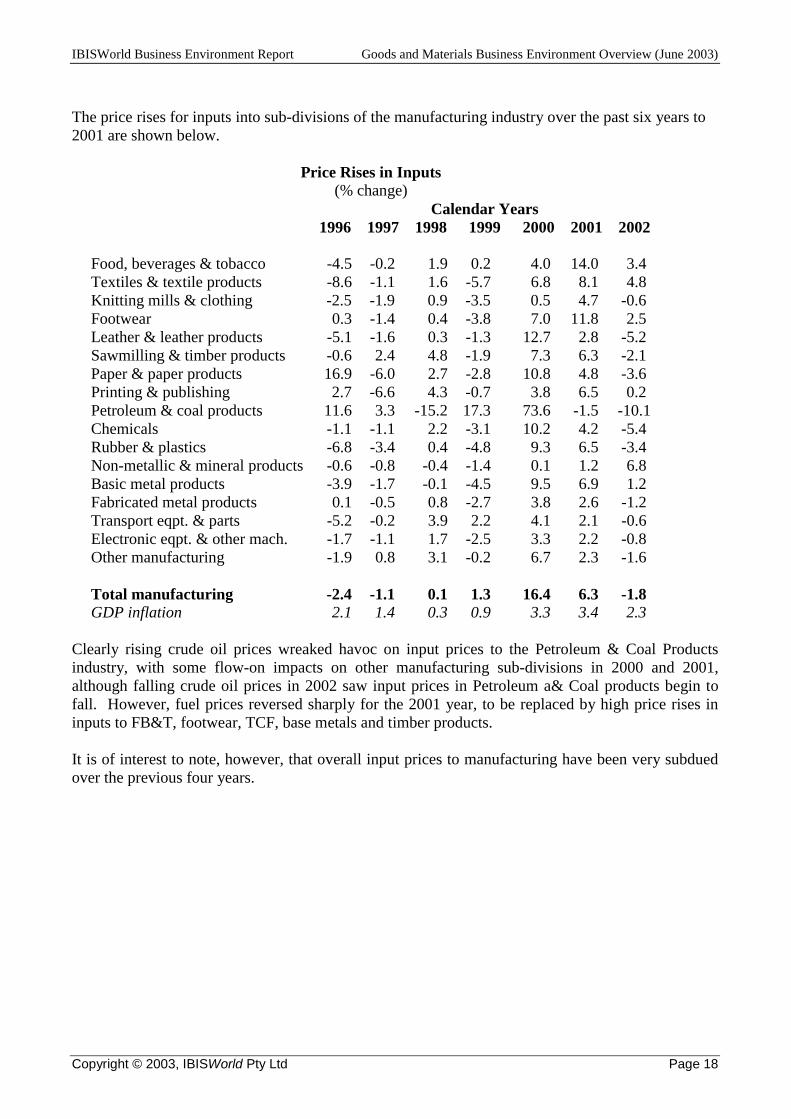
IBISWorld Business Environment Report Goods and Materials Business Environment Overview (June 2003)
Copyright © 2003, IBISWorld Pty Ltd Page 18
The price rises for inputs into sub-divisions of the manufacturing industry over the past six years to 2001 are shown below.
Price Rises in Inputs (% change)
Calendar Years 1996 1997 1998 1999 2000 2001 2002 Food, beverages & tobacco -4.5 -0.2 1.9 0.2 4.0 14.0 3.4 Textiles & textile products -8.6 -1.1 1.6 -5.7 6.8 8.1 4.8 Knitting mills & clothing -2.5 -1.9 0.9 -3.5 0.5 4.7 -0.6 Footwear 0.3 -1.4 0.4 -3.8 7.0 11.8 2.5 Leather & leather products -5.1 -1.6 0.3 -1.3 12.7 2.8 -5.2 Sawmilling & timber products -0.6 2.4 4.8 -1.9 7.3 6.3 -2.1 Paper & paper products 16.9 -6.0 2.7 -2.8 10.8 4.8 -3.6 Printing & publishing 2.7 -6.6 4.3 -0.7 3.8 6.5 0.2 Petroleum & coal products 11.6 3.3 -15.2 17.3 73.6 -1.5 -10.1 Chemicals -1.1 -1.1 2.2 -3.1 10.2 4.2 -5.4 Rubber & plastics -6.8 -3.4 0.4 -4.8 9.3 6.5 -3.4 Non-metallic & mineral products -0.6 -0.8 -0.4 -1.4 0.1 1.2 6.8 Basic metal products -3.9 -1.7 -0.1 -4.5 9.5 6.9 1.2 Fabricated metal products 0.1 -0.5 0.8 -2.7 3.8 2.6 -1.2 Transport eqpt. & parts -5.2 -0.2 3.9 2.2 4.1 2.1 -0.6 Electronic eqpt. & other mach. -1.7 -1.1 1.7 -2.5 3.3 2.2 -0.8 Other manufacturing -1.9 0.8 3.1 -0.2 6.7 2.3 -1.6 Total manufacturing -2.4 -1.1 0.1 1.3 16.4 6.3 -1.8 GDP inflation 2.1 1.4 0.3 0.9 3.3 3.4 2.3
Clearly rising crude oil prices wreaked havoc on input prices to the Petroleum & Coal Products industry, with some flow-on impacts on other manufacturing sub-divisions in 2000 and 2001, although falling crude oil prices in 2002 saw input prices in Petroleum a& Coal products begin to fall. However, fuel prices reversed sharply for the 2001 year, to be replaced by high price rises in inputs to FB&T, footwear, TCF, base metals and timber products. It is of interest to note, however, that overall input prices to manufacturing have been very subdued over the previous four years.
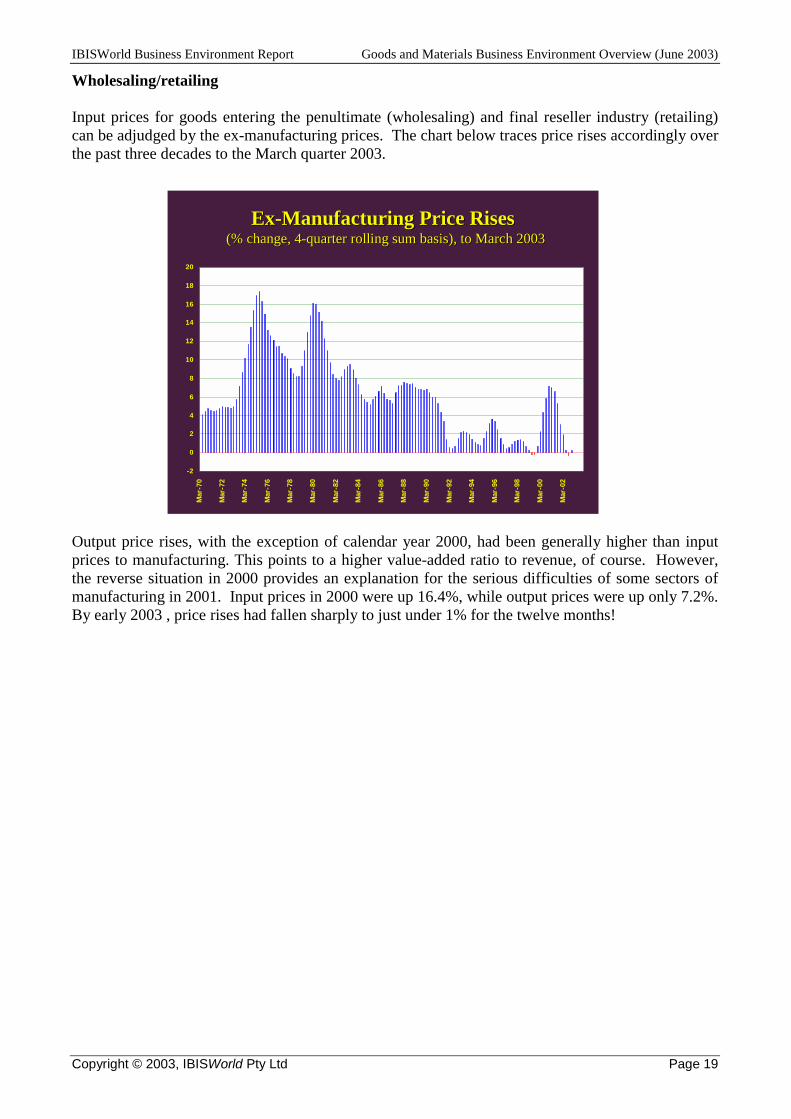
IBISWorld Business Environment Report Goods and Materials Business Environment Overview (June 2003)
Copyright © 2003, IBISWorld Pty Ltd Page 19
Wholesaling/retailing Input prices for goods entering the penultimate (wholesaling) and final reseller industry (retailing) can be adjudged by the ex-manufacturing prices. The chart below traces price rises accordingly over the past three decades to the March quarter 2003.
Output price rises, with the exception of calendar year 2000, had been generally higher than input prices to manufacturing. This points to a higher value-added ratio to revenue, of course. However, the reverse situation in 2000 provides an explanation for the serious difficulties of some sectors of manufacturing in 2001. Input prices in 2000 were up 16.4%, while output prices were up only 7.2%. By early 2003 , price rises had fallen sharply to just under 1% for the twelve months!
ExEx--Manufacturing Price RisesManufacturing Price Rises(% change, 4(% change, 4--quarter rolling sum basis), to March 2003quarter rolling sum basis), to March 2003
-2
0
2
4
6
8
10
12
14
16
18
20
Mar
-70
Mar
-72
Mar
-74
Mar
-76
Mar
-78
Mar
-80
Mar
-82
Mar
-84
Mar
-86
Mar
-88
Mar
-90
Mar
-92
Mar
-94
Mar
-96
Mar
-98
Mar
-00
Mar
-02