Embed Size (px)
Citation preview
GC-MS Head Space and Consumer Preference
Evaluation of Wines with Reduced Ethanol Content
Bithika Saha
B.Sc. (Chemical Engineering)
A thesis submitted in fulfilment of the requirements for the degree
of
Master of Philosophy
Faculty of Science
School of Agricultural and Wine Sciences
August, 2013

1
Table of Contents
Table of Contents .......................................................................................................... 1
List of Tables ................................................................................................................ 4
List of Figures ............................................................................................................... 6
List of Equations ........................................................................................................... 8
Certificate of Authorship............................................................................................... 9
Acknowledgments ...................................................................................................... 10
Ethics .......................................................................................................................... 12
Abstract ...................................................................................................................... 13
Chapter 1 Introduction .............................................................................................. 15
Chapter 2 Literature Review ..................................................................................... 18
2.1 Technologies for ethanol reduction in wine ................................................... 18
2.1.1 Pre-fermentation technologies .............................................................. 18
2.1.2 Fermentation technologies .................................................................... 22
2.1.3 Post-fermentation technologies ............................................................. 25
2.1.4 Membrane separation processes ........................................................... 28
2.2 Chemical composition of reduced ethanol content wine ................................. 40
2.2.1 Wine volatiles and their interactions with other components ................. 40
2.2.2 Change in wine composition after ethanol reduction ............................. 51
2.3 Sensory properties of reduced ethanol wine ................................................... 53
2.3.1 Ethanol and the sensory properties of wine ........................................... 54
2.3.2 Ethanol reduction and the aroma and flavour of wine ........................... 55
2.4 Conclusion .................................................................................................... 56
2.5 Statement of research opportunity ................................................................. 58
Chapter 3 Ethanol Reduction from Three Varieties of Wine by Membrane Separation
Process ..................................................................................................... 59
3.1 Introduction ................................................................................................... 59
3.2 Materials and methods ................................................................................... 62
3.2.1 Materials .............................................................................................. 62
3.2.2 Ethanol adjustment equipment.............................................................. 63
3.2.3 Ethanol content analysis ....................................................................... 64
3.2.4 pH measurement .................................................................................. 64
3.2.5 SO2 content analysis ............................................................................. 64
2
3.2.6 Cleaning ............................................................................................... 64
3.2.7 Storage ................................................................................................. 64
3.2.8 Bottling of product wine ....................................................................... 65
3.3 Experimental design and analysis .................................................................. 65
3.4 Result and discussion .................................................................................... 65
Chapter 4 SPME GC-MS Method Development for Headspace Analysis of Different
Ethanol Content Wine ............................................................................... 72
4.1 Introduction ................................................................................................... 72
4.2 Materials and method .................................................................................... 79
4.2.1 Chemicals and reagents ........................................................................ 79
4.2.2 Method development ............................................................................ 82
4.2.3 Compound identification with SPME fibre ........................................... 82
4.2.4 Optimisation of sample extraction conditions ....................................... 90
4.2.5 Response surface analysis of data ......................................................... 91
4.2.6 Internal standards used for calibration ................................................ 102
4.2.7 Calibration curves for four different ethanol levels ............................. 102
4.2.8 Confirmation of compound identity .................................................... 102
4.3 Results and discussion ................................................................................. 103
Chapter 5 Headspace Composition Analysis of Different Ethanol Content Wine ..... 117
5.1 Introduction ................................................................................................. 117
5.2 Materials and methods ................................................................................. 119
5.2.1 Preparation and preservation of reduced ethanol wine samples ........... 119
5.2.2 Preparation of readjusted wine samples .............................................. 119
5.2.3 Final sample analysis conditions ......................................................... 119
5.2.4 Data analysis for different ethanol content wine ................................. 120
5.3 Experimental plan ....................................................................................... 120
5.4 Results ........................................................................................................ 121
5.5 Discussion ................................................................................................... 139
Chapter 6 Consumer Preference for Reduced Ethanol Wine .................................... 144
6.1 Introduction ................................................................................................. 144
6.2 Materials and methods ................................................................................. 147
6.2.1 Materials ............................................................................................ 147
6.2.2 Research methodology ....................................................................... 147
6.2.3 Research plan ..................................................................................... 148
6.2.4 Consumer recruitment and tasting event ............................................. 149
6.3 Result and discussion .................................................................................. 150
3
6.3.1 Participants’ demographics................................................................. 150
6.3.2 Wine consumption pattern .................................................................. 152
6.3.3 Consumer preferences for reduced ethanol wine ................................. 157
6.4 Summary ..................................................................................................... 163
Chapter 7 Conclusion and recommendations ........................................................... 165
7.1 Summary of the findings ............................................................................. 165
7.2 Conclusion .................................................................................................. 166
7.3 Study limitations ......................................................................................... 167
7.4 Recommendation for further research opportunities ..................................... 167
References ................................................................................................................ 169
Appendix 1 Data sheet for ethanol reduction experiment ........................................... 180
Appendix 2 Questionnaire for consumer preference trial ........................................... 183
4
List of Tables
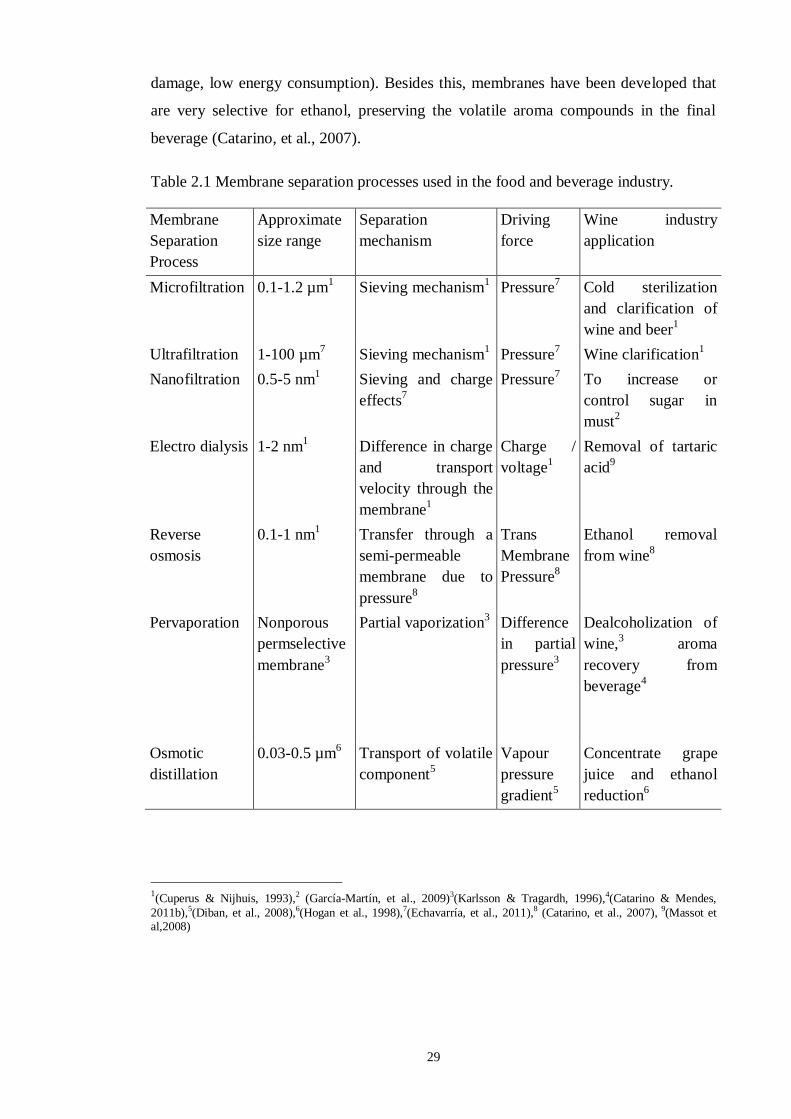
Table 2.1 Membrane separation processes used in the food and beverage industry. ..... 29
Table 2.2 Volatile components of wine and their concentration (adapted from Francis
and Newton, 2005). ..................................................................................................... 42
Table 2.3 Alcohol reduction processes and their effect on wine aroma. ....................... 52
Table 3.1 Production and composition details for the original wines. ........................... 62
Table 3.2 The pH and free SO2 levels of the three wine varieties at three ethanol levels.
................................................................................................................................... 66
Table 3.3 Average time for ethanol reduction for the three wine samples. ................... 67
Table 4.1 Structure and formula of important aroma ester compounds in wine. ........... 76
Table 4.2 Structure and formula of important organic acid aroma compounds in wine. 77
Table 4.3 Structure and formula of important alcohol aroma compounds in wine. ....... 77
Table 4.4 Structure, chemical group and formula of important other aroma compounds
in wine. ....................................................................................................................... 78
Table 4.5 Standards and reagents used for headspace analysis of wine aroma
compounds, and their odour and specific odour threshold. ........................................... 80
Table 4.6 Target compounds identification and calibration parameters for four different
levels of ethanol content of wine. ................................................................................ 84
Table 4.7 Parameter levels used in optimisation trials. ................................................. 90
Table 4.8 Optimised extraction conditions for target aroma compounds for 5 % ethanol
content wine. ............................................................................................................... 94
Table 4.9 Optimised extraction conditions for target aroma compounds for 8 % ethanol
content wine. ............................................................................................................... 96
Table 4.10 Optimised extraction conditions for target aroma compounds for 10 %
ethanol content wine. .................................................................................................. 98
Table 4.11 Optimised extraction conditions for target aroma compounds for 13 %
ethanol content wine. ................................................................................................ 100
Table 4.12 Optimised conditions for different ethanol content model wine bases
containing aroma compounds. ................................................................................... 104
Table 5.1 The effect of ethanol level as a significant source of variation in the head
space concentration of aroma compounds in three varieties of wine. Analysis of
variance performed at a significance level of p<0.05. ................................................ 121
Table 5.2 The headspace concentration of volatile compounds in Chardonnay wine
containing different ethanol concentrations. .............................................................. 123
5
Table 5.3 The headspace concentration of volatile compounds in Shiraz wine containing
different ethanol concentrations. ............................................................................... 125
Table 5.4 The headspace concentration of volatile compounds in Sauvignon Blanc wine
containing different ethanol concentrations. .............................................................. 127
Table 6.1 Details of the grape variety and ethanol level of wine. ............................... 147
Table 6.2 Demographic characteristics of the wine consumers. ................................. 151
Table 6.3 Two way ANOVA showing differences of consumer preference for three
different ethanol content of two varieties wines. ........................................................ 158
Table 6.4 Two way ANOVA showing differences of consumer estimated price for three
different ethanol content of two varieties wines. ........................................................ 159
Table 6.5 One way ANOVA analysis of consumers’ liking and price for Chardonnay
and Shiraz. ................................................................................................................ 161
Table 6.6 One way ANOVA analysis of consumers’ liking and price for 8 % and 5 %
ethanol content wine. ................................................................................................ 161
Table 6.7 Consumer liking pattern of different ethanol content wine. ........................ 162
Table 6.8 Consumer price estimation pattern for ethanol content wine. ..................... 163
6
List of Figures
Figure 2.1 Diagram of the experimental nanofiltration process (García-Martín et al.,
2011). ......................................................................................................................... 20
Figure 2.2 Ethanol production in swirled, non-aerated fermentation of grape juice with
20 % fermentable sugar at 20 °C (Erten & Campbell, 2001). A = Saccharmomyces
cerevisiae NCYC 125; B = Pichia membranaefaciens NCYS 333; C = P. amomala
NCYC 432; D = P. subpelliculosa NCYC 436; E = Williopsis saturnus NCYC 22; The
dotted line represents level of 3 % ethanol by volume. ................................................ 23
Figure 2.3 Schematic diagram of Reverse Osmosis process (Noble & Stern, 1995) ..... 31
Figure 2.4 Comparison of (a) dead end filtration and (b) cross-flow filtration. The
detrimental effect of concentration polarization and fouling is greater in dead end
filtration than in cross flow filtration, which breaks up accumulating retentate. The
diagrams on the right-hand side show that by using backflushing to restore flux, the
cross-flow technique is made even more efficient (Cuperus & Nijhuis, 1993). ............ 33
Figure 2.5 Reverse osmosis unit to produce reduced ethanol wine. .............................. 35
Figure 2.6 The separation technique of pervaporation process, (a) vacuum pervaporation
and (b) sweep gas pervaporation. Modified from (Hogan, et al., 1998; Karlsson &
Tragardh, 1996). ......................................................................................................... 37
Figure 2.7 Mechanism of ethanol removal by evaporative perstraction. Modified from
(Hogan, et al., 1998). ................................................................................................... 39
Figure 3.1 Diagram of ethanol reduction process. ........................................................ 63
Figure 3.2 Change of specific gravity of three varieties with ethanol reduction. Legend:
, Chardonnay: , Sauvignon Blanc: : Shiraz. ....................................................... 66
Figure 3.3 Ethanol content of different wine varieties during the ethanol reduction
operation. Legend: , Chardonnay; , Sauvignon Blanc; ▲, Shiraz. ......................... 68
Figure 3.4 Ethanol reduction rate for different wine varieties. Legend: (solid blue line),
Shiraz; (dashed red line), Chardonnay; (dotted green line), Sauvignon Blanc. ............. 69
Figure 4.1 Response surface models of b-coefficients of SPME extraction conditions for
all aroma compounds with variation of ethanol content. The sequence of compounds is
according to Table 4.5. .............................................................................................. 106
Figure 5.1 Concentrations of volatile compounds at each ethanol percentage and variety
of wine identified by ANOVA with significant source of variation. ........................... 128
Figure 6.1 Graphical representation of frequency of wine consumption by consumer
panel members. ......................................................................................................... 152
Figure 6.2 Graphical representation of the number of glasses of wine consumed per
week by consumer panel members. ........................................................................... 153
7
Figure 6.3 Graphical representation of number of bottles of wine bought by consumer
panel members each week. ........................................................................................ 154
Figure 6.4 Graphical representation of average price paid for a bottle of wine by
consumer panel members. ......................................................................................... 154
Figure 6.5 Graphical representation of the percent alcohol content preferred for drinking
by consumer panel members. .................................................................................... 155
Figure 6.6 Graphical representation of percentage of alcohol considered as low alcohol
wine by consumer panel members. ............................................................................ 156
Figure 6.7 Graphical representation of the number of years consumer panel members
had be drinking wine. ................................................................................................ 157
Figure 6.8 Consumer liking for different ethanol content wines made from two varieties
Significant values regarding liking are shown in Tables 6.5 and 6.6. ......................... 158
Figure 6.9 Average prices consumers willing to pay for different ethanol content wines
made from two varieties. Significant values regarding estimated prices are shown in
Tables 6.5 and 6.6. .................................................................................................... 160
8
List of Equations
Equation 3.1 ................................................................................................................ 70
Equation 3.2 ................................................................................................................ 70
9
Certificate of Authorship
I hereby declare that this submission is my own work and that, to the best of my
knowledge and belief, it contains no material previously published or written by another
person nor material which to a substantial extent has been accepted for the award of any
other degree or diploma at Charles Sturt University or any other educational institution,
except where due acknowledgment is made in the thesis. Any contribution made to the
research by colleagues with whom I have worked at Charles Sturt University or
elsewhere during my candidature is fully acknowledged.
I agree that this thesis be accessible for the purpose of study and research in accordance
with the normal conditions established by the Executive Director, Library Services or
nominee, for the care, loan and reproduction of theses, subject to confidentiality and
provisions as approved by the University.
Name: Bithika Saha
Signature:
Date:
10
Acknowledgments
Thanks to National Wine and Grape Industry Centre (NWGIC), Charles Sturt
University and Australian Government for providing me with the opportunity and
funding for this research.
I would like to thank my supervisors for their encouragement, continuous support and
enormous amount of time they spent on me and my project. To my principal supervisor,
Dr Peter Torley, thank you for choosing me for this research project and providing
effective guidance and support throughout the research. I acknowledge your effort, time
and encouragement to enhance my capability in the field of wine research. My sincere
thanks are also extended to my co-supervisor, Dr Leigh Schmidtke, for his support,
patient guidance and encouragement throughout the research which has lead me to the
successful completion of the chemical analysis of this project. I would like to thank my
co-supervisor, Associate Professor Anthony Saliba, whose advice, effective suggestions
and support were highly essential for the completion of this research and who also
improved my knowledge about sensory science and statistical analysis. It would have
been impossible to complete this project without the guidance, encouragement and
support of such an excellent supervisory team.
I would like to give a special thanks to Mr David Wollan, director of Memstar
Technology Ltd, for providing me with training and lab-scale equipment for ethanol
reduction from wine. I would like to acknowledge the contribution of Mr Andrew
Drumm, wine maker of CSU Winery, who provided different varieties of wine and
other necessary stuffs to conduct the experiment. Thanks to Dr Andrew Clark, senior
lecturer, CSU and Ms Emily Rouse, technical officer of the experimental winery for
their help and support during the experiment. I am grateful to Mr Yann Sarpedon,
visiting student at NWGIC for his assistance to complete the ethanol reduction
experiments and also for preservation of the samples.
Thanks to Mrs Jennifer Bullock for helping me in arranging and conducting the
consumer preference trial. I would like to thank Jazz, Soumi, Linda and others for
helping me during the consumer testing event. Thanks to all consumers for their
participation in the testing event. Special thanks to Dr Johan Bruwer, University of
Adelaide, who helped me a lot to conduct the statistical analysis with the consumer data
and editing the corresponding chapter of the thesis.
11
I would like to thank technical officers of NWGIC Mrs Helen Pan, Mr Ashley Redburn
and other staff for providing all required supports at all stages of this research. Thanks
to PhD candidates Navideh, Paris and Conny for their help and support throughout the
journey. Sincere thanks also to Ms Tigger Wise for improving my thesis with excellent
proofreading.
Thanks to my mother, Mrs Lakshmi Rani Saha. Her inspiration was the backbone
during all stages of my study. I am thankful to my other family members and friends for
supporting me throughout this period.
Finally thanks to my son, Priyam who did not realise how much he sacrificed for his
mother’s study in his little age. I owe deepest gratefulness to my husband Partha for his
continuous mental support, encouragement and sacrifice during the journey of my
research.
Thank you God for giving me the strength and wisdom to complete the work.
12
Ethics
This work was approved by the Human Research Ethics Committee at Charles Sturt
University, Office of Academic Governance, Private Bag 29, Panorama Avenue,
Bathurst, NSW 2795. Protocol number: 2012/175
13
Abstract
Reducing the ethanol content of wine without affecting its flavour is a challenge for
wine makers. Although various processes exist for ethanol reduction, loss of aroma
compounds during processing cannot be completely prevented. In addition, ethanol
concentration has an impact on the profile of volatile compounds present in the
headspace. Thus, a reduction in ethanol may affect the headspace composition.
The objectives of this research were (i) to reduce the ethanol content in three wines
using a commercially available technology, (ii) to assess the effect of ethanol reduction
on wine headspace composition and (iii) to determine the preference of consumers for
both reduced ethanol and the original wine.
Ethanol reduction was performed using a Memstar Micro unit that sequentially uses
reverse osmosis and evaporative perstraction to reduce ethanol content. Trials were
performed on three commercial wines, two white wine varieties (Chardonnay and
Sauvignon Blanc) and one red variety (Shiraz). The original ethanol content of
Chardonnay, Sauvignon Blanc and Shiraz was 12.21 %, 9.91 % and 13.67 %
respectively. Ethanol content was reduced to 8 % and 5 %. Samples of the 5 % ethanol
content wines from the three varieties were adjusted back to original ethanol content
(called readjusted samples) for aroma analysis. Headspace solid phase micro extraction
gas-chromatography and mass spectrometry (HS-SPME/GC-MS) technology was used
to develop a method to analyse 27 important wine aroma compounds. This method was
used to determine the headspace composition of the three original wines, the 5 % and
8 % samples and the readjusted wine samples. Further, a consumer preference trial was
carried out with Chardonnay and Shiraz (the main white and red wine varieties in
Australia) to determine consumers’ liking for reduced ethanol wine and original wine.
ANOVA with multiple comparisons was used to compare the headspace composition of
reduced ethanol and original wine. The analysis indicates that the headspace
concentrations of most of the volatile compounds except some alcohols and acids were
significantly reduced in the 5 % wines compared to the original wines. This pattern was
seen in all three wines studied. The headspace concentrations of most of the volatiles
were not changed significantly in the readjusted wine samples compared to the 5 %
samples. Similarly, analysis of consumer preference data showed that consumers’ liking
14
was also significantly reduced by a reduction in ethanol content, and the wine variety
used for the wine reduction.
15
Chapter 1 Introduction
Wine is a popular beverage in many parts of the world. The alcohol content of wine
varies from 8.5 % to more than 15 % depending on the grape variety, region and wine
style (OIV, 2012a). Consumers are showing increased interest in wines with lower
alcohol contents because they offer health advantages and social benefits (Saliba et al.,
2013a). Lower alcohol wine offers reduced calorie intake, decreases the risk of alcohol
related health problems, lowers the risk of accidents when driving and ensures more
acceptable social behaviour in general (Grønbæk, 2009; Pickering, 2000). The safe level
for wine consumption depends on the ethanol content of the wine and the quantity
consumed. According to the guidelines of the Australian National Health and Medical
Research Council (NHMRC, 2009a), to stay at the safe level, one can consume two
standard drinks per day (i.e. 20 g alcohol). That implies that people can consume a
greater volume of reduced alcohol content wine and still stay within the safe level
compared to standard wine (Saliba, et al., 2013a). Lower alcohol wine is also attractive
to wine makers in some jurisdictions because they can pay less tax for this product
compared to wine containing less than or equal to 5.5 % ethanol (HM Revenue and
Customs, 2013). Consequently, wine producers see the opportunity to sell greater
volumes of wine with increased profitability. Thus, reduction of alcohol from wine is
currently a matter of interest in the wine industry.
Ethanol is the major alcohol present in wine (Pozo-Bayón & Reineccius, 2009) and it
can be removed to produce lower alcohol content wine. Although there are several
processes existing to produce reduced ethanol wine, membrane separation processes
seem to be most suitable for ethanol reduction regarding the quality of the wine
produced. This process is comparatively more sensitive to flavour compounds of wine
and also has low energy consumption (Catarino & Mendes, 2011a). Among membrane
separation processes, reverse osmosis and evaporative perstraction are mostly used for
ethanol reduction from wine. However, these processes also cause loss or alteration of
volatile compounds during ethanol reduction that might affect wine aroma as well as the
overall taste of the wine (Catarino et al., 2007; Diban et al., 2008). Combinations of
these two processes are used to maintain quality as well as ensure the legality of the
product. A process that is a combination of reverse osmosis and evaporative perstraction
is used commercially for ethanol reduction in many Australian wineries.
16
Another important factor is the effect of ethanol reduction on wine aroma composit ion.
Previous research on the interaction between ethanol concentration and the headspace
composition of model wine has reported that the headspace concentration of volatile
compounds are decreased with increased ethanol concentration (Villamor & Ross,
2013). The effect of ethanol concentration also depends on the hydrophobicity of aroma
compounds (Aznar et al., 2004). It has also been found that increasing ethanol
concentration suppresses fruity aromas and enhances herbaceous aroma in wine samples
(Goldner et al., 2009). Thus, reduction of ethanol might affect wine aroma by modifying
the concentrations of aroma compounds in wine headspace.
Numerous research papers are available on different ethanol reduction technology
developments (Pickering, 2000; Schmidtke et al., 2012). Some studies have been carried
out on consumer preference and acceptability of reduced ethanol wine, but the ethanol
content of the reduced ethanol wine samples were not as low as 5 % (Meillon et al.,
2010b; Meillon et al., 2010a). Understanding the sensory characteristics of wine with
ethanol contents around 5 % is important due to changes in regulatory requirements. In
the European Union (EU) countries, the minimum alcohol requirement for wine is not
less than 8.5 % or 9 % depending on wine-growing zone, but by the way of derogation
for certain wine styles, the minimum alcohol requirements for this product will be not
less than 4.5 %. Recently, the minimum alcohol content of wine has also been reduced
from 8 % to 4.5 % under the Australia and New Zealand food standards in order to meet
EU export requirements (ComLaw, 2011). Thus, a larger portion of ethanol than
previously needs to be removed from a full strength wine to get 5 % ethanol content
wine. As ethanol concentration influences wine aroma composition, it is necessary to
determine the headspace composition of wine at reduced ethanol concentrations of
different wine varieties. The aroma composition of the original wine (that is used for
reduction) also needs to be analysed to address the difference between them. Besides
this, it is important to examine consumers’ acceptance of reduced ethanol wine made
from different varieties. This research was developed to evaluate the effect of ethanol
reduction over a range of ethanol concentrations of different varieties from an analytical
chemistry and consumer acceptability perspective.
17
The objectives of this research were to:
Use a commercially accepted membrane based ethanol adjustment process to
reduce ethanol to 8 % and 5 % from Chardonnay, Sauvignon Blanc and Shiraz
wine.
Develop methods for headspace analysis of different ethanol content wines by
Solid Phase Micro-Extraction Gas-Chromatography and Mass-Spectrometry
(SPME GC-MS)
Determine the headspace composition and compare the concentration of aroma
compounds among different ethanol content wines of three varieties
Assess consumer preference for 5 %, 8 % and original ethanol content wines of
Chardonnay and Shiraz.
The thesis contains the following chapters:
Chapter 1 contains an introduction to the research and an outline of thesis
structure.
Chapter 2 contains a literature review covering different ethanol reduction
processes, chemical composition and sensory attributes related to reduction of
wine.
Chapter 3 details the ethanol reduction experiment and associated data analysis.
Chapter 4 describes development of the GC-MS methods for headspace aroma
analysis.
Chapter 5 details the GC-MS determination of headspace composition for the
three wines and three ethanol levels.
Chapter 6 describes the consumer preference trial and its findings.
Chapter 7 gives the overall conclusions of the thesis. Research opportunities
arising from the findings of the research are outlined in this chapter.
18
Chapter 2 Literature Review
This review discusses different ethanol reduction technologies and their advantages and
disadvantages. It also discusses the volatile composition of wines and their interaction
with ethanol and other major wine components. The effects of a difference in ethanol
concentration and the ethanol reduction process on wine aroma are also presented. In
addition, the possibility of changing the sensory characteristics of wine due to ethanol
reduction is reported. This information will assist an understanding of the effect of
ethanol concentration on wine aroma and other sensory characteristics.
2.1 Technologies for ethanol reduction in wine
Different techniques are applied to produce reduced ethanol wine with acceptable
sensory characteristics. Each process has advantages and disadvantages, but all share
the aim of reducing the ethanol content. Ethanol reduction technologies can be
classified based on the stage in wine production when they are used (Schmidtke, et al.,
2012):
1. Pre-fermentation technologies
2. Fermentation technologies
3. Post-fermentation technologies
2.1.1 Pre-fermentation technologies
Various techniques can be used prior to fermentation of the grape juice or must to
reduce ethanol content in wine. The basic principle of such processes is to reduce the
concentration of fermentable sugars in the grape juice. Pre-fermentation technologies
include adjusting the vine leaf area to crop ratio, the use of juice from unripe grapes,
juice dilution, and treating the juice with glucose oxidase (Kontoudakis et al., 2011;
Pickering et al., 1999b, 1999a).
Adjusting the vine leaf area to crop ratio is an interesting technique for altering the
concentration of fermentable sugar in wine grapes. However, due to problems in
detecting an imbalance between carbohydrate accumulation and the maturity of the
sensory constituents of grapes, more research is required to find out the optimum
conditions for this method (Schmidtke, et al., 2012).
19
The use of unripe or immature grapes in wine production is another interesting
technique but has some disadvantages because unripe grapes might not have sufficient
phenolic and aromatic maturity which would result in a bitter and herbaceous wine
(Kontoudakis, et al., 2011).
Another approach is to dilute the juice by adding water or low Brixº grape juice before
fermentation. However, juice dilution prior to fermentation is not permitted for wine
production in many countries (Pickering, 2000).
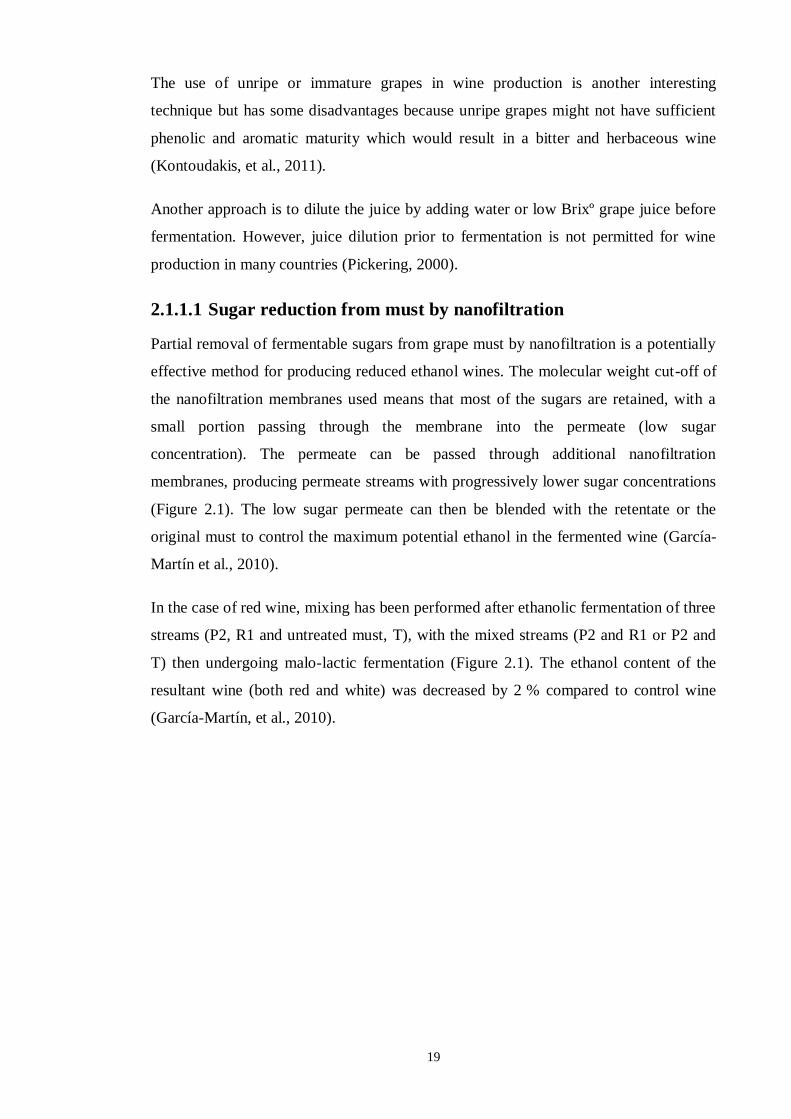
2.1.1.1 Sugar reduction from must by nanofiltration
Partial removal of fermentable sugars from grape must by nanofiltration is a potentially
effective method for producing reduced ethanol wines. The molecular weight cut-off of
the nanofiltration membranes used means that most of the sugars are retained, with a
small portion passing through the membrane into the permeate (low sugar
concentration). The permeate can be passed through additional nanofiltration
membranes, producing permeate streams with progressively lower sugar concentrations
(Figure 2.1). The low sugar permeate can then be blended with the retentate or the
original must to control the maximum potential ethanol in the fermented wine (García-
Martín et al., 2010).
In the case of red wine, mixing has been performed after ethanolic fermentation of three
streams (P2, R1 and untreated must, T), with the mixed streams (P2 and R1 or P2 and
T) then undergoing malo-lactic fermentation (Figure 2.1). The ethanol content of the
resultant wine (both red and white) was decreased by 2 % compared to control wine
(García-Martín, et al., 2010).
20
Figure 2.1 Diagram of the experimental nanofiltration process (García-Martín et al.,
2011).
A significant problem with nanofiltration of fruit juice is the blinding of the membrane
by suspended solids and high molecular weight compounds in the must (e.g. pectins,
proteins, tannin, starch). To improve filtration performance, fruit juices are treated with
enzymatic preparations to hydrolyse mainly soluble polysaccharides responsible for
high viscosity (Echavarría et al., 2011). Grape must naturally contains suspended solids
and high molecular weight compounds that cause membrane fouling, concentration
polarization and gel layer formation (Cassano et al., 2008). To reduce these problems
the grape must is prepared for nanofiltration like other fruit juices, for example by
treating the must with pectinolytic enzymes, filtering through a higher molecular weight
cut-off membrane and minimising the extraction of phenolic compounds (García-
Martín, et al., 2010).
The aim of successive nanofiltration processes is to retain nearly all the high molecular
weight compounds (like polyphenols and anthocyanins) and the low molecular weight
compounds in the final wine while giving a lower ethanol content than a wine made
without nanofiltration of the must (García-Martín et al., 2009). In one case, a 3.3 %
reduction in ethanol content was reported for the wine produced by nanofiltration of the
must compared to the wine made without nanofiltration (García-Martín et al., 2011).
The ethanol reduction depends on careful control of the proportion of the different
fractions that are mixed.
21
A disadvantage of this approach is that the wines made from nanofiltered must had
lower concentrations of phenolic compounds than those in the control wines. This
resulted in a significant reduction in colour intensity in the wine made from nanofiltered
must. In addition, there was a large difference between the volatile profile (fatty acids,
ethyl esters and lactones) of the nanofiltered wine and the control wine. Sensory
assessment also detected differences between wine made from nanofiltered must
compared to the control wine. The aroma of the nanofiltered wine was less intense and
the taste of white wines was more acidic and lighter. Therefore, further research on this
method is needed to improve the sensory quality of the reduced ethanol wine (García-
Martín, et al., 2010 2011).
2.1.1.2 Glucose oxidase (GOX) treatment
The use of enzyme technology is another approach for ethanol reduction in wine.
Glucose oxidase treatment is a pre-fermentation technology that aims to reduce
fermentable sugar with minimum loss of the organoleptic qualities of the grapes to
ensure wine flavour is unaffected.
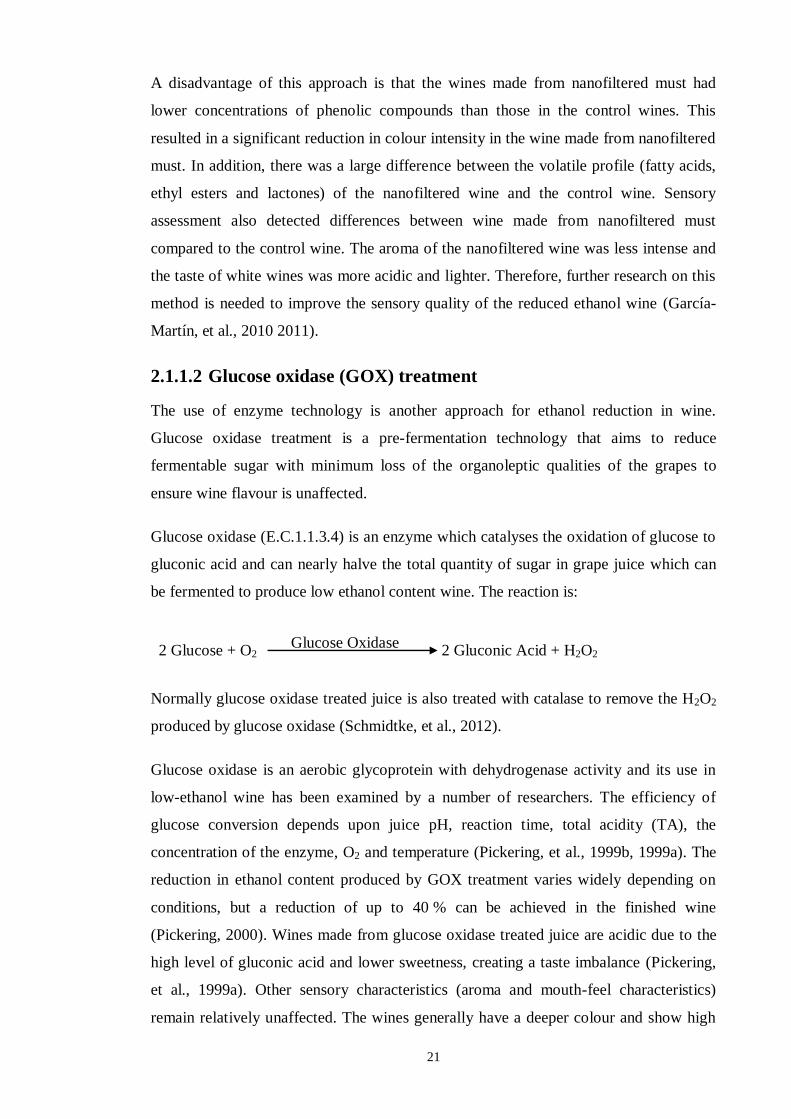
Glucose oxidase (E.C.1.1.3.4) is an enzyme which catalyses the oxidation of glucose to
gluconic acid and can nearly halve the total quantity of sugar in grape juice which can
be fermented to produce low ethanol content wine. The reaction is:
Normally glucose oxidase treated juice is also treated with catalase to remove the H2O2
produced by glucose oxidase (Schmidtke, et al., 2012).
Glucose oxidase is an aerobic glycoprotein with dehydrogenase activity and its use in
low-ethanol wine has been examined by a number of researchers. The efficiency of
glucose conversion depends upon juice pH, reaction time, total acidity (TA), the
concentration of the enzyme, O2 and temperature (Pickering, et al., 1999b, 1999a). The
reduction in ethanol content produced by GOX treatment varies widely depending on
conditions, but a reduction of up to 40 % can be achieved in the finished wine
(Pickering, 2000). Wines made from glucose oxidase treated juice are acidic due to the
high level of gluconic acid and lower sweetness, creating a taste imbalance (Pickering,
et al., 1999a). Other sensory characteristics (aroma and mouth-feel characteristics)
remain relatively unaffected. The wines generally have a deeper colour and show high
2 Glucose + O2 Glucose Oxidase
2 Gluconic Acid + H2O2
22
sulfur dioxide (SO2) binding ability compared to original wines. Research has focussed
on white wine, and further research is required to evaluate its potential in red wines.
Practically the glucose oxidase process appears attractive as it does not require any
expensive equipment, however its actual use is limited as glucose oxidase is not
permitted as a wine additive in many countries (Pickering, 2000).
2.1.2 Fermentation technologies
Ethanol reduction during fermentation can be achieved by taking several different
approaches:
Early arrest of fermentation
Reduction in ethanol production by using a novel yeast strain or genetically
engineered yeasts
Removal of a portion of ethanol from the fermentation must
Early arrest of fermentation is one approach to ethanol reduction, but the resultant wine
contains high levels of sugar and it has to be stabilised by pasteurization and SO2
addition (Mok et al., 2006; Pickering, 2000). However, extended pasteurization times
lead to potential loss or alteration of volatile flavour and aroma compounds of juice and
wine. Furthermore, the amount of SO2 used in wine is controlled by various pieces of
legislation because it has some undesirable effects along with its usefulness (Clarke &
Bakker, 2004; Malletroit et al., 1991; Schmidtke, et al., 2012). Non-thermal processes,
such as ultra-high pressure treatment, have been shown to improve the microbial
stability of fruit juices (Cassano, et al., 2008), and may also improve the microbial
stability of wine with minimal effect on wine quality. High hydrostatic pressure has also
been applied for the pasteurization of low-alcohol wine. It was found that the desirable
reduction of micro-organisms from wine is possible by this process without affecting
the sensory quality (Buzrul, 2012).
2.1.2.1 Yeast selection
Yeasts used for wine production have been selected to efficiently convert sugars into
ethanol, though yeasts form a variety of other compounds during ethanolic
fermentation. To reduce the amount of ethanol produced from a given quantity of sugar,
special strains of Saccharomyces cerevisiae have been developed and non-
23
Saccharomyces yeast strains evaluated that convert less of the sugar into ethanol and
more into other metabolites such as glycerol, gluconic acid and acetaldehyde.
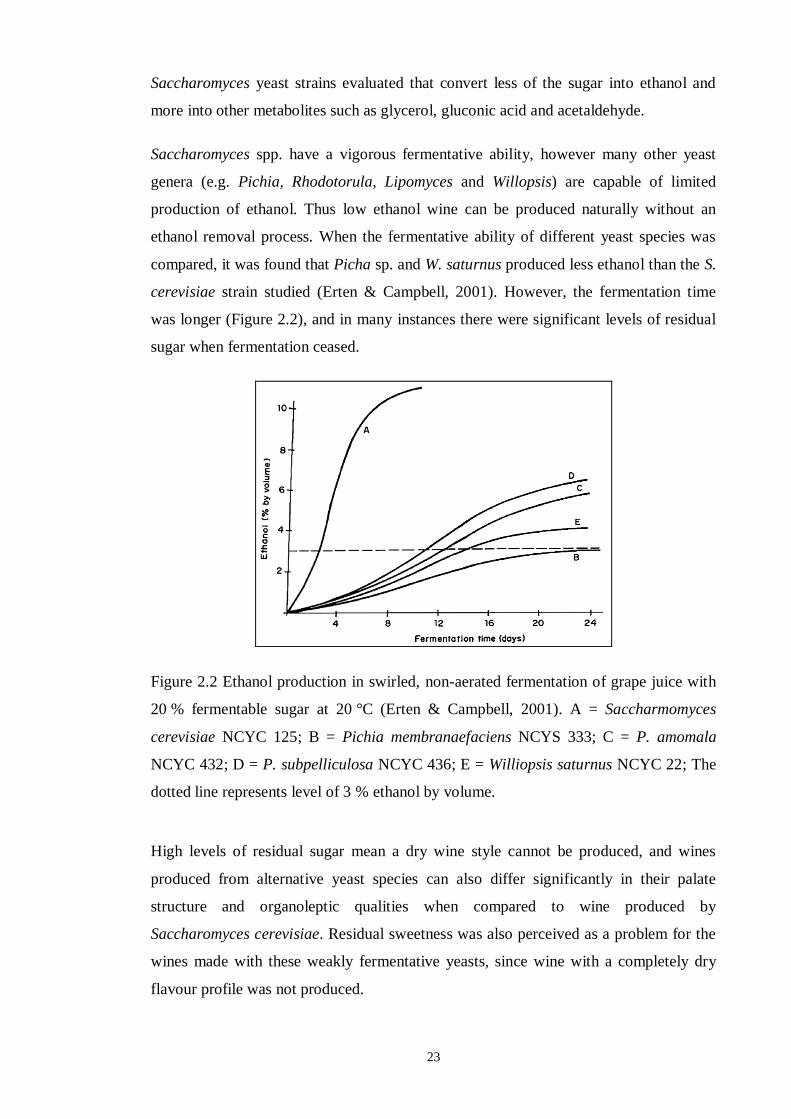
Saccharomyces spp. have a vigorous fermentative ability, however many other yeast
genera (e.g. Pichia, Rhodotorula, Lipomyces and Willopsis) are capable of limited
production of ethanol. Thus low ethanol wine can be produced naturally without an
ethanol removal process. When the fermentative ability of different yeast species was
compared, it was found that Picha sp. and W. saturnus produced less ethanol than the S.
cerevisiae strain studied (Erten & Campbell, 2001). However, the fermentation time
was longer (Figure 2.2), and in many instances there were significant levels of residual
sugar when fermentation ceased.
Figure 2.2 Ethanol production in swirled, non-aerated fermentation of grape juice with
20 % fermentable sugar at 20 °C (Erten & Campbell, 2001). A = Saccharmomyces
cerevisiae NCYC 125; B = Pichia membranaefaciens NCYS 333; C = P. amomala
NCYC 432; D = P. subpelliculosa NCYC 436; E = Williopsis saturnus NCYC 22; The
dotted line represents level of 3 % ethanol by volume.
High levels of residual sugar mean a dry wine style cannot be produced, and wines
produced from alternative yeast species can also differ significantly in their palate
structure and organoleptic qualities when compared to wine produced by
Saccharomyces cerevisiae. Residual sweetness was also perceived as a problem for the
wines made with these weakly fermentative yeasts, since wine with a completely dry
flavour profile was not produced.
24
A number of approaches have been used to genetically modify S. cerevisiae to produce
less ethanol from sugar present in the must. The approaches used include
overproduction of glycerol (Lopes et al., 2000), over production of glucono-δ-lactone
and gluconic acid (Malherbe et al., 2003), reducing the concentration of NADH (Heux
et al., 2006a; Heux et al., 2006b) and increasing production of lactate (Dequin et al.,
1999; Dequin & Barre, 1994). All of these approaches reduced the amount of ethanol
produced during fermentation, with the maximum reduction in ethanol content typically
being in the range 0.5 % and 1.8 % of ethanol content (Lopes, et al., 2000; Malherbe, et
al., 2003). In studies of NADH oxidase, conversion of glucose to ethanol was reduced
by 7 to 15 %, but the reduction in ethanol concentration at the completion of
fermentation was not reported (Heux, et al., 2006a; Heux, et al., 2006b).
There are a number of disadvantages with the use of genetically modified yeast in wine
production. Firstly, changes in S. cerevisiae metabolism had other effects on yeast
metabolism and the wine produced, such as an increase in acetic acid concentration
(Lopes, et al., 2000), antimicrobial activity against acetic and lactic acid bacteria
(Malherbe, et al., 2003), increased fermentation time (Lopes, et al., 2000), higher acidity
and decreased pH (Dequin, et al., 1999), a high level of acetaldehyde accumulation,
decreased balance between growth and fermentation performance and incomplete
fermentation (remaining sugar unconsumed) (Heux, et al., 2006a; Heux, et al., 2006b).
Secondly, the fermentation conditions and substrates used with genetically modified
yeasts are different from the typical must concentration (Schmidtke, et al., 2012). The
execution of these processes is expensive too.
Thirdly, the changed composition means that sensory characteristics may change.
Sensory analysis of wine with glycerol over-production (Lopes, et al., 2000) found that
it was sweeter, but had satisfactory body or mouthfeel. Sensory analysis was not
performed in other studies (Dequin & Barre, 1994; Heux, et al., 2006a; Malherbe, et al.,
2003), however over production of acids may decrease pH and alter sensory
characteristics (Dequin, et al., 1999).
Finally, it is also important that both industry and consumers are satisfied that
alternative yeast genera and genetically modified yeast are both safe and beneficial
before they are used for wine production (Malherbe, et al., 2003; Schmidtke, et al.,
2012).
25
2.1.2.2 Ethanol removal during fermentation
Ethanol can be reduced in the finished wine by removing ethanol from the fermenting
must. Two techniques have been used with the fermenting must - vacuum distillation or
gas stripping (Aguera et al., 2010). When the ferment reached 6 % ethanol (beginning
of stationary phase), 2 % ethanol was removed by either vacuum distillation or stripping
by sparging with CO2. The fermentation rate was not affected by either process,
indicating heating or high gas flow rates do not increase yeast mortality. A negative
effect was that the concentration of some volatile compounds that are important
contributors for wine flavour were lowered by 25 to 45 %, so the reduced ethanol wine
may have less taste and aroma than untreated wine (Aguera, et al., 2010).
Other technologies, such as membrane separation can also be used to remove ethanol
during fermentation to produce low ethanol wine; however there may be problems with
rapid fouling of membranes by yeast and grape solids.
2.1.3 Post-fermentation technologies
Post-fermentation is the most popular stage in the wine making process for ethanol
reduction. Since the operations are carried out either after fermentation or on the
finished wine, the fermentation process will remain unaffected and complete. There are
thermal (distillation, extraction, freeze concentration) and non-thermal (membrane
separation) processes used in the post-fermentation removal of ethanol from wine.
In many cases it is necessary to have multiple stages in the ethanol removal process.
Dealcoholisation processes typically remove a combination of ethanol, water and aroma
compounds from the wine. This increases the concentration of some compounds, while
reducing the concentration of others resulting in a reduced ethanol wine with
undesirable sensory properties. To overcome this problem, multi-stage processes have
been developed to minimise the loss of aroma compounds, and to recover water that can
be added back to the wine. In many countries it is not legal to add water to wine,
however water originally in the wine is generally permitted to be returned to the wine.
Short descriptions of these processes are given below.
2.1.3.1 Thermal distillation
Thermal distillation is the most common method for removing ethanol from wine.
However, thermal distillation of wine at atmospheric pressure will also remove more
volatile compounds resulting in changes to wine composition. To reduce the undesirable
26
effects, vacuum distillation can be performed under vacuum and at low temperature. In
this process, the original boiling pan and distilling vessel can be replaced by vacuum
distillation apparatus and it is possible to reduce ethanol this way at much lower
temperatures (Pickering, 2000). The dealcoholized wine produced by the process
contains low levels of volatile compounds, however the dealcoholized wine can be
blended with a higher ethanol wine to get a reduced ethanol content wine with
acceptable sensory characteristics. It is also possible to recover and concentrate the
aromatic condensed fractions from the distillate (high ethanol) stream by distillation to
eliminate the ethanol, then reincorporate the aroma fraction back into the dealcoholized
product to get low ethanol wine without any modification to the organoleptic
characteristics of the final product (Gómez-Plaza et al., 1999).
There have been several variations on, or modifications of, the distillation and
evaporation principle, most of which are patented. Many of these modifications include
one or more non thermal methods, shorter processing times, lower temperatures and
improved aroma recovery techniques including the addition of blended grape juice or
concentrate to the ethanol reduced wine (Pickering, 2000).
2.1.3.2 Spinning cone column technology
The spinning cone column technique is mainly used as a flavour recovery system to
preserve the freshness or taste of processed food or drinks. The column contains a
rotating vertical central shaft fitted with upward facing cones alternating with sets of
fixed downward conical baffles attached to the casing of the column (Pyle, 1994;
Schmidtke, et al., 2012). The liquid feed enters at the top of the column and flows
down, while the stripping gas (steam or inert gas) is fed into the base of the column and
flows up (Pyle, 1994). The column operates under vacuum so volatile aroma
components will be transferred to gas phase at relatively low temperatures (Schmidtke,
et al., 2012).
Ethanol reduction by the spinning cone column is a two-stage process. In the first stage,
fragile components are stripped at low temperature (~28 °C), and in the second stage
ethanol level is removed under vacuum at a higher temperature (~38 °C). The final
dealcoholized wine is produced by blending the recovered aroma with the wine
produced by the second stage (Pyle, 1994; Schmidtke, et al., 2012). A disadvantage of
spinning cone column technology is that some of the volatile components are removed
with the ethanol affecting the sensory attributes of the final product (Catarino &
27
Mendes, 2011b), though research has shown that spinning cone technology has minimal
effect on wine phenolic compounds (Belisario-S nchez et al., ; Pyle, 1994;
Schmidtke, et al., 2012). Advantages of this technology include low residence time,
high contact area between liquid and vapour, low pressure drop in the column and
moderate temperatures, which reduce the thermal impact on the wine (Catarino &
Mendes, 2011b).
2.1.3.3 Freeze concentration
Freeze concentration is another thermal method to reduce ethanol although it is not
commonly used in low ethanol wine production. During this process, the standard wine
is cooled until part of the water in the wine freezes. The high ethanol liquid fraction is
separated from the low ethanol frozen fraction which is then thawed. The thawed low-
ethanol fraction can be blended with either the starting wine, or the high-ethanol
fraction to produce a wine with reduced ethanol content (Vella, 1984 ). Reportedly the
finished reduced ethanol wine retains almost all the taste and flavour of standard wine
(Vella, 1984 ). However, this process is energy intensive and therefore expensive.
2.1.3.4 Supercritical liquid extraction
In food processing applications, carbon dioxide (CO2) is the most commonly used
supercritical solvent because it can be used at low temperature, causes no thermal
degradation of food products, is non-toxic and inexpensive compared with hydrocarbon
alternatives used as solvents (Medina & Martínez, 1997). CO2-supercritical fluid
extraction can be used to produce low ethanol wine because water, salts, proteins and
carbohydrates are not substantially removed or denatured and it achieves a good
recovery of wine aromas (Fornari et al., 2009; Medina & Martínez, 1997).
Supercritical CO2 ethanol extraction is done using a counter current column. CO2 from
the storage tank passes through an undercooler and enters the column after compression
with a pump to pressure at 250 bar and heating up to an extraction temperature of 40 °C
by a preheater. When the column is at operating pressure and temperature, wine is
injected into the middle or top column and flows to the bottom of the column, while
CO2 enters the column at the bottom and flows to the top of the column. The CO2
soluble substances (ethanol along with volatile aroma compounds) are extracted and
move with the CO2 to the top of the column. At the top of the column a pressure
regulator valve is used to reduce the pressure from the pressure used during separation
(250 bar) to 50-70 bar, resulting in the separation of CO2 and a dissolved mixture of
28
ethanol and other volatile compounds. The separated CO2 is recycled to continue the
extraction operation. The ethanol and the volatile aroma compound mixture are usually
separated in a second supercritical CO2 extraction process or by distillation, allowing
the aroma compounds to be re-incorporated into the wine (Gamse et al., 1999; Medina
& Martínez, 1997).
A strong disadvantage of this process is that the low ethanol wine produced by this
process has unsatisfactory sensory characteristics. Further, the process has required a
high capital cost due to equipment and the inflexibility of plants, which make the
process unattractive to wine makers (Schmidtke, et al., 2012).
2.1.3.5 Membrane separation technologies
There are a number of membrane separation technologies used for ethanol reduction of
wine which can be carried out at low temperatures and which results in minimal loss of
aroma compounds. Among these, the most suitable processes for ethanol removal from
wine are reverse osmosis, pervaporation and osmotic distillation (Catarino & Mendes,
2011a; Pickering, 2000; Schmidtke, et al., 2012). Because these technologies are
important for the purposes of this thesis, they will be discussed in detail in the following
section.
2.1.4 Membrane separation processes
Membrane technology is increasingly used in food processing industries. Membranes
help to separate molecules and micro-organisms, minimise thermal damage of products
and micro-organisms and have moderate energy consumption. In addition, there is no
need to add other chemical substances. Thus, membrane technology has become a
popular choice for the food and beverage industries. There are several membrane
operations which are performed for purification and separation as well as for the
preparation of food and beverages (Table 2.1).
Ultrafiltration and microfiltration involve a separation mechanism using a porous
membrane, while tight, dense membranes are required for reverse osmosis and
pervaporation (Karlsson & Tragardh, 1996). Different membrane processes have been
developed for the dealcoholization of wine, and refining membrane dealcoholisation
technology continues to be an area of active research. While there are some competing
technologies, such as thermal distillation, solvent extraction and spinning cone column
processes, membrane processing has a number of advantages (e.g. minimal thermal
29
damage, low energy consumption). Besides this, membranes have been developed that
are very selective for ethanol, preserving the volatile aroma compounds in the final
beverage (Catarino, et al., 2007).
Table 2.1 Membrane separation processes used in the food and beverage industry.
Membrane
Separation
Process
Approximate
size range
Separation
mechanism
Driving
force
Wine industry
application
Microfiltration 0.1-1.2 µm1 Sieving mechanism
1 Pressure
7 Cold sterilization
and clarification of
wine and beer1
Ultrafiltration 1-100 µm7 Sieving mechanism
1 Pressure
7 Wine clarification
1
Nanofiltration 0.5-5 nm1
Sieving and charge
effects7
Pressure7 To increase or
control sugar in
must2
Electro dialysis 1-2 nm1 Difference in charge
and transport
velocity through the
membrane1
Charge /
voltage1
Removal of tartaric
acid9
Reverse
osmosis
0.1-1 nm1 Transfer through a
semi-permeable
membrane due to
pressure8
Trans
Membrane
Pressure8
Ethanol removal
from wine8
Pervaporation Nonporous
permselective
membrane3
Partial vaporization3 Difference
in partial
pressure3
Dealcoholization of
wine,3 aroma
recovery from
beverage4
Osmotic
distillation
0.03-0.5 µm6 Transport of volatile
component5
Vapour
pressure
gradient5
Concentrate grape
juice and ethanol
reduction6
1(Cuperus & Nijhuis, 1993),2 (García-Martín, et al., 2009)3(Karlsson & Tragardh, 1996),4(Catarino & Mendes,
2011b),5(Diban, et al., 2008),6(Hogan et al., 1998),7(Echavarría, et al., 2011),8 (Catarino, et al., 2007), 9(Massot et al,2008)
30
Disadvantages of membrane technology are the high capital investment required (e.g.
tanks, pumps, membranes, housings) and aroma losses that may occur during the
membrane processes that affect wine sensory properties. In the case of reverse osmosis
there is the added disadvantage of needing to incorporate a second separation process to
separate aroma compounds from ethanol in the reverse osmosis permeate (Massot et al.,
2008; Meier, 1992; Pickering, 2000; Pyle, 1994). A brief discussion of these processes
and their application regarding the production of reduced ethanol wine are given below.
2.1.4.1 Reverse osmosis process
Reverse osmosis is a widely used process for ethanol removal from wine. Lawenbrau,
the German brewer, invented a reverse osmosis process to remove ethanol from
beverages. This company obtained the German patent for dealcoholizing of wine and
beer in 1975 (Meier, 1992).
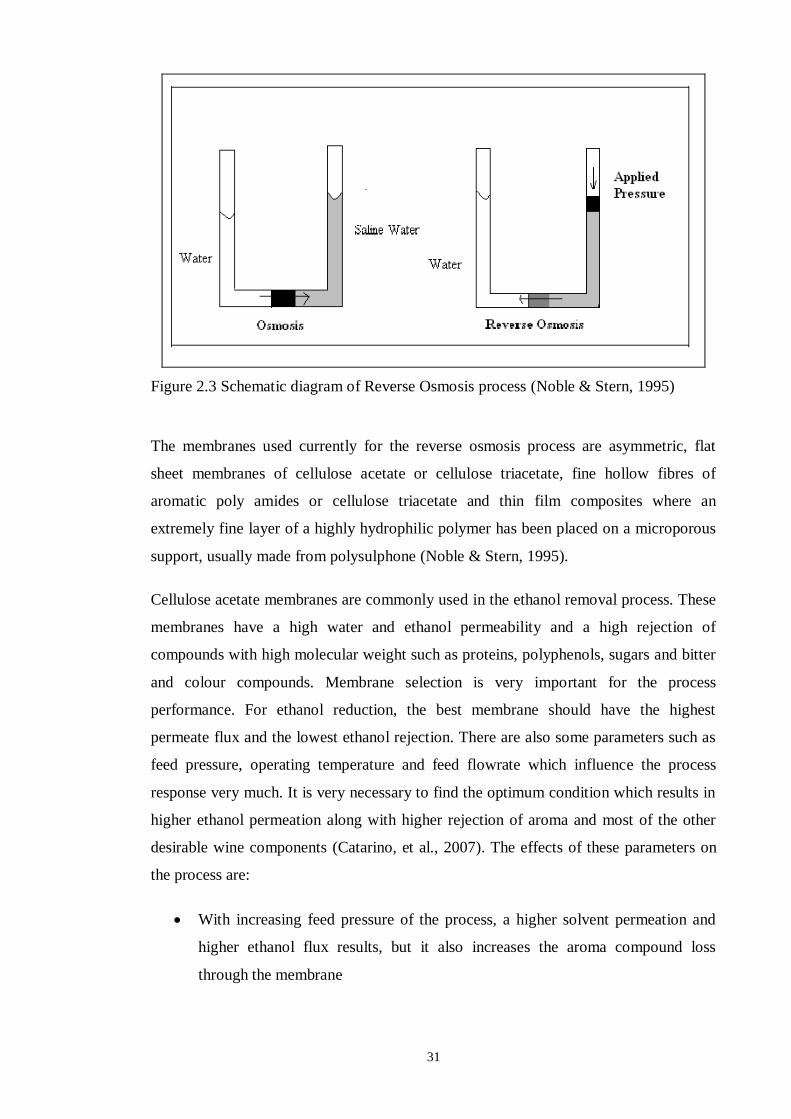
When a pure solvent and a solution containing dissolved molecules and ions are
separated by a semi-permeable membrane, there will be a concentration or pressure
gradient. The pure solute tends to move through the membrane to the solution to make it
more dilute; this tendency is called osmotic pressure. Reverse osmosis occurs when
sufficient pressure is applied on the solution side such that the solvent will move out of
this solution across the membrane to the pure solvent (Figure 2.3) (Meier, 1992;
Schmidtke, et al., 2012). Wine has an osmotic pressure of over 200 psi (14 atm), though
the dealcoholisation of wine by reverse osmosis is performed at pressures of nearly
600 psi (40 atm) or more to get a sufficient permeation rate (Meier, 1992).
31
Figure 2.3 Schematic diagram of Reverse Osmosis process (Noble & Stern, 1995)
The membranes used currently for the reverse osmosis process are asymmetric, flat
sheet membranes of cellulose acetate or cellulose triacetate, fine hollow fibres of
aromatic poly amides or cellulose triacetate and thin film composites where an
extremely fine layer of a highly hydrophilic polymer has been placed on a microporous
support, usually made from polysulphone (Noble & Stern, 1995).
Cellulose acetate membranes are commonly used in the ethanol removal process. These
membranes have a high water and ethanol permeability and a high rejection of
compounds with high molecular weight such as proteins, polyphenols, sugars and bitter
and colour compounds. Membrane selection is very important for the process
performance. For ethanol reduction, the best membrane should have the highest
permeate flux and the lowest ethanol rejection. There are also some parameters such as
feed pressure, operating temperature and feed flowrate which influence the process
response very much. It is very necessary to find the optimum condition which results in
higher ethanol permeation along with higher rejection of aroma and most of the other
desirable wine components (Catarino, et al., 2007). The effects of these parameters on
the process are:
With increasing feed pressure of the process, a higher solvent permeation and
higher ethanol flux results, but it also increases the aroma compound loss
through the membrane
32
Permeate flux and aroma compounds permeation also increases with
temperature. The lowest operating temperature gives the highest aroma
compound rejection (especially for esters), although the permeate flux decreases.
The increment of feed flow rate increases the permeate flux as well as the
ethanol flux, and decreases the aroma rejection very slightly. In this condition,
ethanol flux is increased because of decreasing concentration polarization
(Catarino, et al., 2007).
Concentration polarization is an inevitable phenomenon in the membrane separation
process which causes a reversible and direct decline in flux throughout the membrane.
This phenomenon can be defined as a build-up in the concentration of retained
molecules on the pressure side of the membrane that creates additional resistance to
solvent permeation (Cuperus & Nijhuis, 1993).
Reverse osmosis has advantages over other dealcoholization process. It has low energy
consumption, minimises thermal degradation of aroma compounds and so preserves the
sensory characteristics of wine along with ethanol removal (Catarino, et al., 2007;
Labanda et al., 2009). On the other hand, some researchers argue that the production of
low ethanol beverages by reverse osmosis units is not commercially feasible because the
production cost and energy consumption increases with incremental increases in
osmotic pressure (Pilipovik & Riverol, 2005). In addition, control of reverse osmosis
operating conditions is important because this can cause a great difference in the final
product quality (Catarino et al., 2006). Thus, reverse osmosis must be operated under an
optimal condition to get the desired quality of reduced ethanol wine.
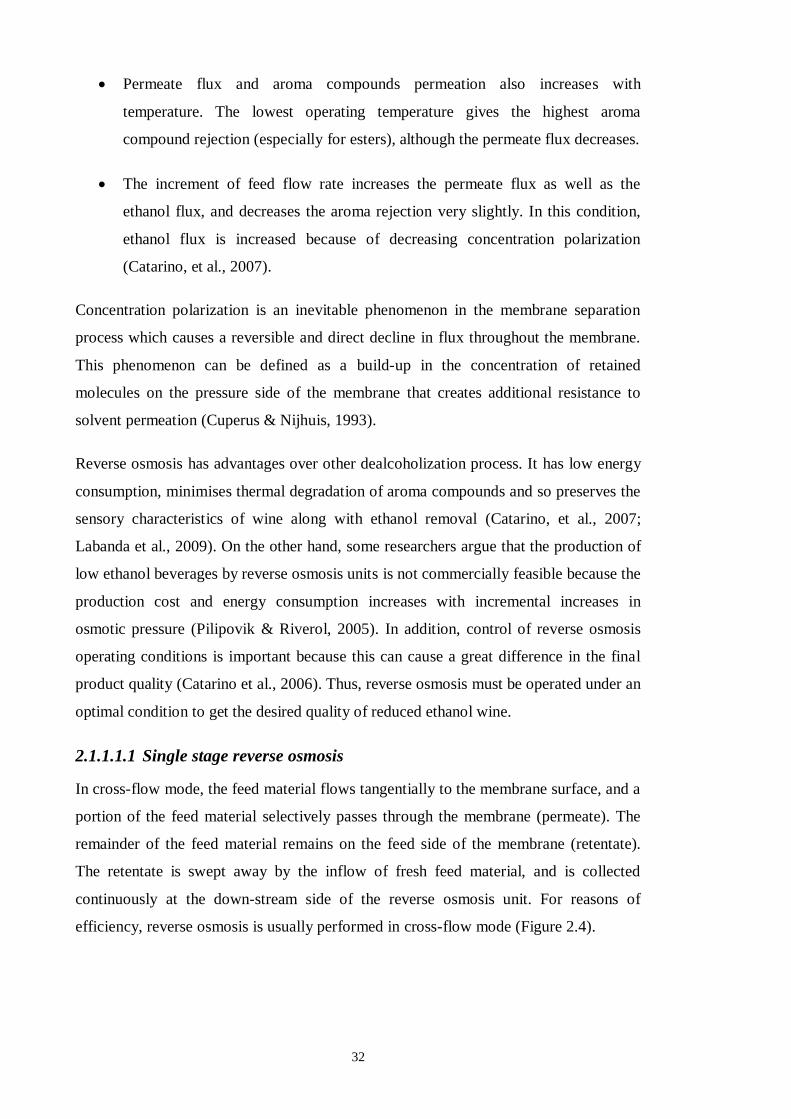
2.1.1.1.1 Single stage reverse osmosis
In cross-flow mode, the feed material flows tangentially to the membrane surface, and a
portion of the feed material selectively passes through the membrane (permeate). The
remainder of the feed material remains on the feed side of the membrane (retentate).
The retentate is swept away by the inflow of fresh feed material, and is collected
continuously at the down-stream side of the reverse osmosis unit. For reasons of
efficiency, reverse osmosis is usually performed in cross-flow mode (Figure 2.4).
33
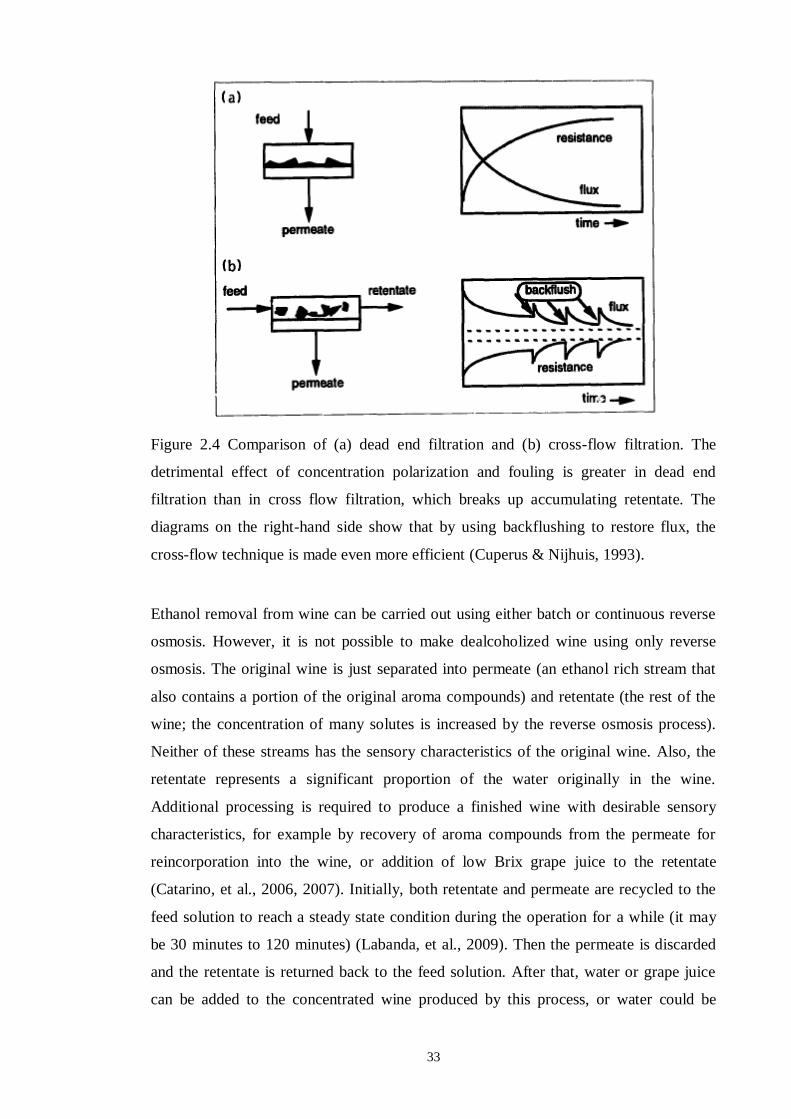
Figure 2.4 Comparison of (a) dead end filtration and (b) cross-flow filtration. The
detrimental effect of concentration polarization and fouling is greater in dead end
filtration than in cross flow filtration, which breaks up accumulating retentate. The
diagrams on the right-hand side show that by using backflushing to restore flux, the
cross-flow technique is made even more efficient (Cuperus & Nijhuis, 1993).
Ethanol removal from wine can be carried out using either batch or continuous reverse
osmosis. However, it is not possible to make dealcoholized wine using only reverse
osmosis. The original wine is just separated into permeate (an ethanol rich stream that
also contains a portion of the original aroma compounds) and retentate (the rest of the
wine; the concentration of many solutes is increased by the reverse osmosis process).
Neither of these streams has the sensory characteristics of the original wine. Also, the
retentate represents a significant proportion of the water originally in the wine.
Additional processing is required to produce a finished wine with desirable sensory
characteristics, for example by recovery of aroma compounds from the permeate for
reincorporation into the wine, or addition of low Brix grape juice to the retentate
(Catarino, et al., 2006, 2007). Initially, both retentate and permeate are recycled to the
feed solution to reach a steady state condition during the operation for a while (it may
be 30 minutes to 120 minutes) (Labanda, et al., 2009). Then the permeate is discarded
and the retentate is returned back to the feed solution. After that, water or grape juice
can be added to the concentrated wine produced by this process, or water could be
34
added to feed wine before use of the reverse osmosis process (López et al., 2002;
Schmidtke, et al., 2012).
Alternatively, this approach can be performed in semi-continuous mode. The difference
lies in the timing of the addition of deionised and deaerated water to the process. In this
case water is added to the wine after a certain time interval to keep the feed volume
constant which increases the permeation rate. It is important to determine when and how
fast water or juice is added to the reverse osmosis operation during the process, because
the concentration of the final product and permeate greatly depend on it (Catarino &
Mendes, 2011a; Meier, 1992).
However, addition of water to wine is strictly forbidden by the European Commission
regulation (Catarino & Mendes, 2011b) and so this approach cannot be used
commercially.
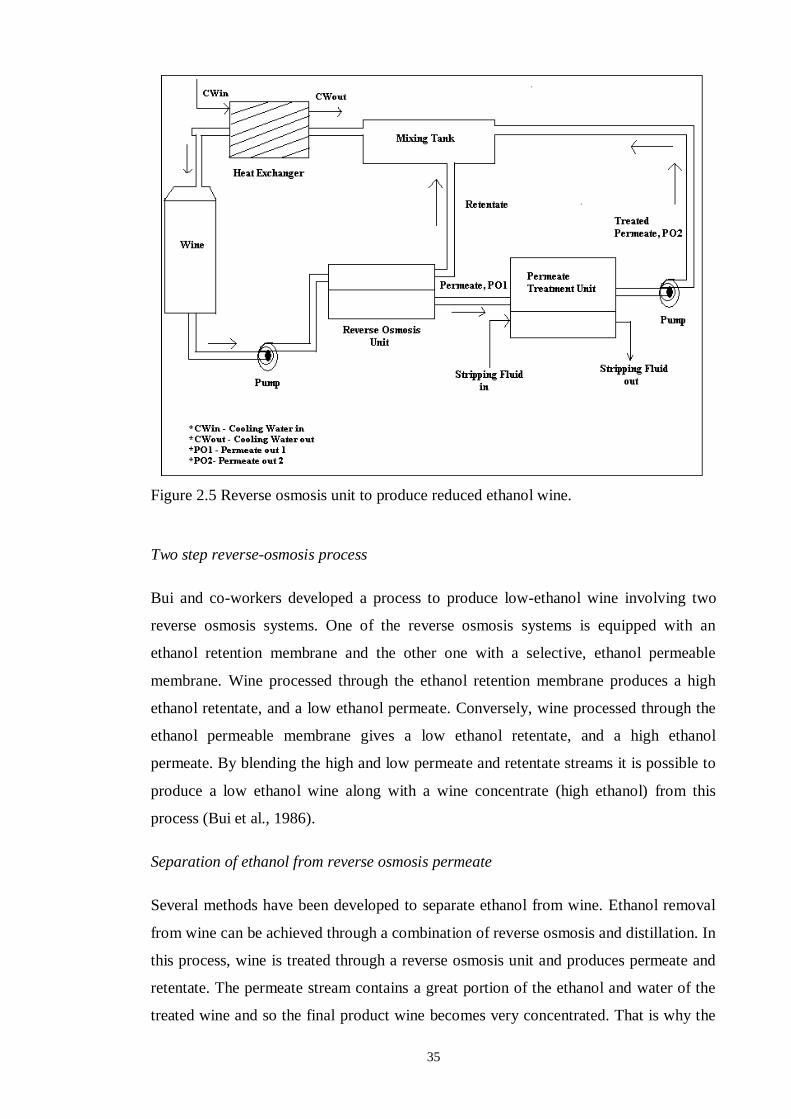
2.1.1.1.2 Combined reverse osmosis processing
Reverse osmosis can be used to separate ethanol from wine, producing a permeate
stream that has a higher ethanol content than the retentate. However, the permeate
stream contains other flavour components and water along with ethanol. That is why the
permeate stream is often further processed to separate the aroma compounds and water
for reincorporation into the retentate (Figure 2.5).
35
Figure 2.5 Reverse osmosis unit to produce reduced ethanol wine.
Two step reverse-osmosis process
Bui and co-workers developed a process to produce low-ethanol wine involving two
reverse osmosis systems. One of the reverse osmosis systems is equipped with an
ethanol retention membrane and the other one with a selective, ethanol permeable
membrane. Wine processed through the ethanol retention membrane produces a high
ethanol retentate, and a low ethanol permeate. Conversely, wine processed through the
ethanol permeable membrane gives a low ethanol retentate, and a high ethanol
permeate. By blending the high and low permeate and retentate streams it is possible to
produce a low ethanol wine along with a wine concentrate (high ethanol) from this
process (Bui et al., 1986).
Separation of ethanol from reverse osmosis permeate
Several methods have been developed to separate ethanol from wine. Ethanol removal
from wine can be achieved through a combination of reverse osmosis and distillation. In
this process, wine is treated through a reverse osmosis unit and produces permeate and
retentate. The permeate stream contains a great portion of the ethanol and water of the
treated wine and so the final product wine becomes very concentrated. That is why the
36
permeate stream is then subjected to a high energy distillation column to remove
ethanol and add it back to the feed wine to get better reduced ethanol wine. It should be
mentioned that the retentate produced from the reverse osmosis process is recycled to
feed wine continuously during the operation to maintain the operation properly
(Schmidtke, et al., 2012; Smith, 1996).
Reverse osmosis with evaporative perstraction
In this system, wine is subjected to reverse osmosis first similar to the other process to
get the permeate and retentate stream. Then the retentate is recycled back to the feed
wine and the permeate is allowed to flow through an evaporative perstraction system for
further treatment. In this part of the process, the permeate stream is circulated through a
hydrophobic hollow fibre membrane contactor, while pure water, used as stripping
liquid, flows along the downstream side of the membrane. Ethanol is transported by
vapour diffusion through the membrane pores and condenses into the water on the other
side of the membrane (Diban, et al., 2008; Hogan, et al., 1998). Thus, the ethanol
content of the reverse osmosis permeate is reduced and the treated reverse osmosis
permeate stream is added back to the feed wine to produce low-ethanol wine. The
system for partial ethanol removal proposed by the Australian company Memstar
involves reverse osmosis followed by a membrane contactor (evaporative perstraction).
Two such plants are installed, one in Chile and one in Australia (Massot, et al., 2008).
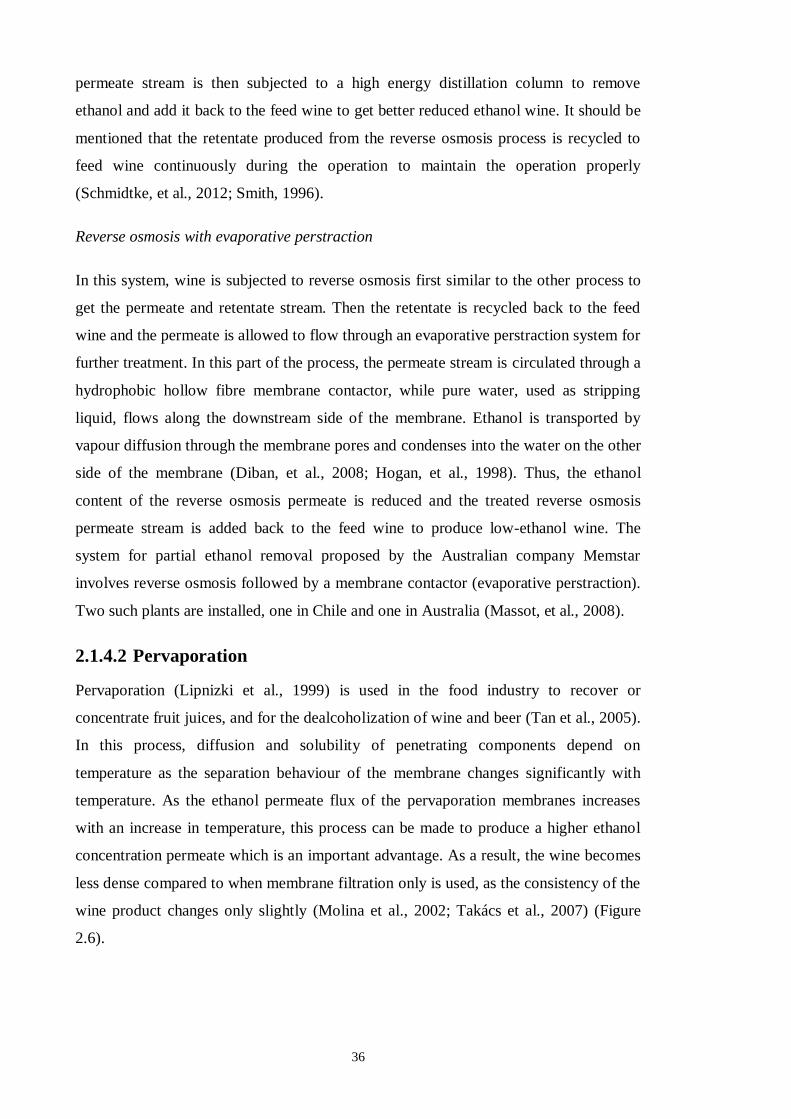
2.1.4.2 Pervaporation
Pervaporation (Lipnizki et al., 1999) is used in the food industry to recover or
concentrate fruit juices, and for the dealcoholization of wine and beer (Tan et al., 2005).
In this process, diffusion and solubility of penetrating components depend on
temperature as the separation behaviour of the membrane changes significantly with
temperature. As the ethanol permeate flux of the pervaporation membranes increases
with an increase in temperature, this process can be made to produce a higher ethanol
concentration permeate which is an important advantage. As a result, the wine becomes
less dense compared to when membrane filtration only is used, as the consistency of the
wine product changes only slightly (Molina et al., 2002; Takács et al., 2007) (Figure
2.6).
37
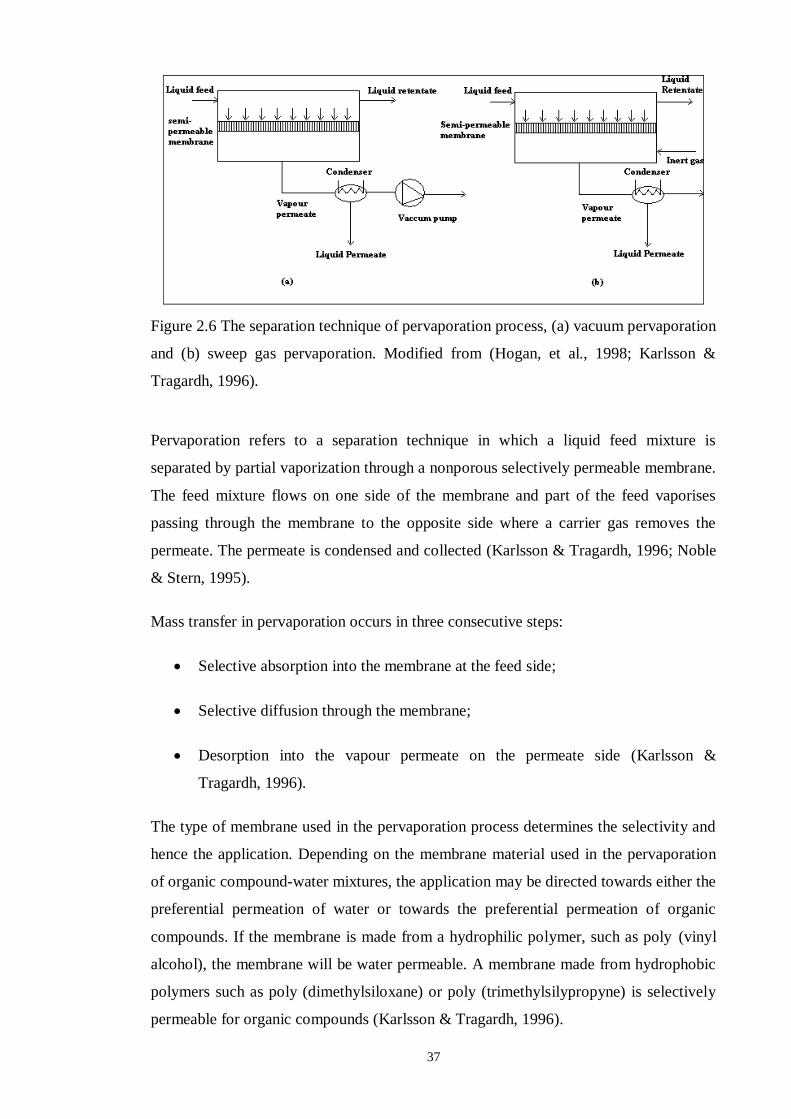
Figure 2.6 The separation technique of pervaporation process, (a) vacuum pervaporation
and (b) sweep gas pervaporation. Modified from (Hogan, et al., 1998; Karlsson &
Tragardh, 1996).
Pervaporation refers to a separation technique in which a liquid feed mixture is
separated by partial vaporization through a nonporous selectively permeable membrane.
The feed mixture flows on one side of the membrane and part of the feed vaporises
passing through the membrane to the opposite side where a carrier gas removes the
permeate. The permeate is condensed and collected (Karlsson & Tragardh, 1996; Noble
& Stern, 1995).
Mass transfer in pervaporation occurs in three consecutive steps:
Selective absorption into the membrane at the feed side;
Selective diffusion through the membrane;
Desorption into the vapour permeate on the permeate side (Karlsson &
Tragardh, 1996).
The type of membrane used in the pervaporation process determines the selectivity and
hence the application. Depending on the membrane material used in the pervaporation
of organic compound-water mixtures, the application may be directed towards either the
preferential permeation of water or towards the preferential permeation of organic
compounds. If the membrane is made from a hydrophilic polymer, such as poly (vinyl
alcohol), the membrane will be water permeable. A membrane made from hydrophobic
polymers such as poly (dimethylsiloxane) or poly (trimethylsilypropyne) is selectively
permeable for organic compounds (Karlsson & Tragardh, 1996).
38
The use of pervaporation for ethanol removal is not as common as reverse osmosis or
osmotic distillation though its potential has been experimentally evaluated (Schmidtke,
et al., 2012). Hydrophobic pervaporation membranes have been successful in separating
ethanol from wine, however, aroma compounds are more hydrophobic than ethanol so
these compounds were also removed resulting in a wine with an inferior flavour
compared to the original wine. The permeability of hydrophilic membranes is highest
for water, intermediate for ethanol and low for aroma compounds. However, if the
sweeping gas contains water vapour, the flux of water through the membrane is
reduced, while ethanol is still passed across the membrane. Consequently a high
proportion of ethanol is passed across the membrane, even though the membrane is
hydrophilic. When this technique was used to remove ethanol from a Chardonnay wine
to a final concentration of 0.5 %, most of the aroma compounds investigated were
retained in the wine at levels >80 % (Karlsson & Tragardh, 1996).
Sometimes pervaporation is used solely for the recovery of the aroma compound of
wine or beer before ethanol reduction using another process such as spinning cone
column. Pervaporation membranes are very selective for classes of compounds typically
found in wine aroma profiles, making pervaporation suitable for aroma recovery
(Catarino & Mendes, 2011b). However, the rate of pervaporation of the major classes of
aroma compounds varies depending on operating conditions (e.g. feed temperature, feed
flow rate and permeate pressure) (Catarino et al., 2009). Thus, optimization of the
parameters is necessary to achieve reduced ethanol wine with desirable aroma.
2.1.4.3 Osmotic distillation
Osmotic distillation (also referred to as isothermal membrane distillation or evaporative
perstraction) can be used to reduce the ethanol content in alcoholic beverages with
minimal effect on the organoleptic properties of the product. The driving force of the
process involves the partial pressure or vapour pressure differences of the volatile solute
in the feed and stripping solutions (Varavuth et al., 2009).
Two streams flow through a hydrophobic hollow fibre membrane contactor, with
volatile compounds moving from the liquid with high vapour pressure into that with
lower vapour pressure (Figure 2.7). Microporous hydrophobic membranes create a
vapour gap between two liquid phases which is free to migrate the volatile component
of the feed solution by either convection or diffusion. The method is used to avoid the
aqueous solution penetrating into the pores (Diban, et al., 2008; Hogan, et al., 1998).
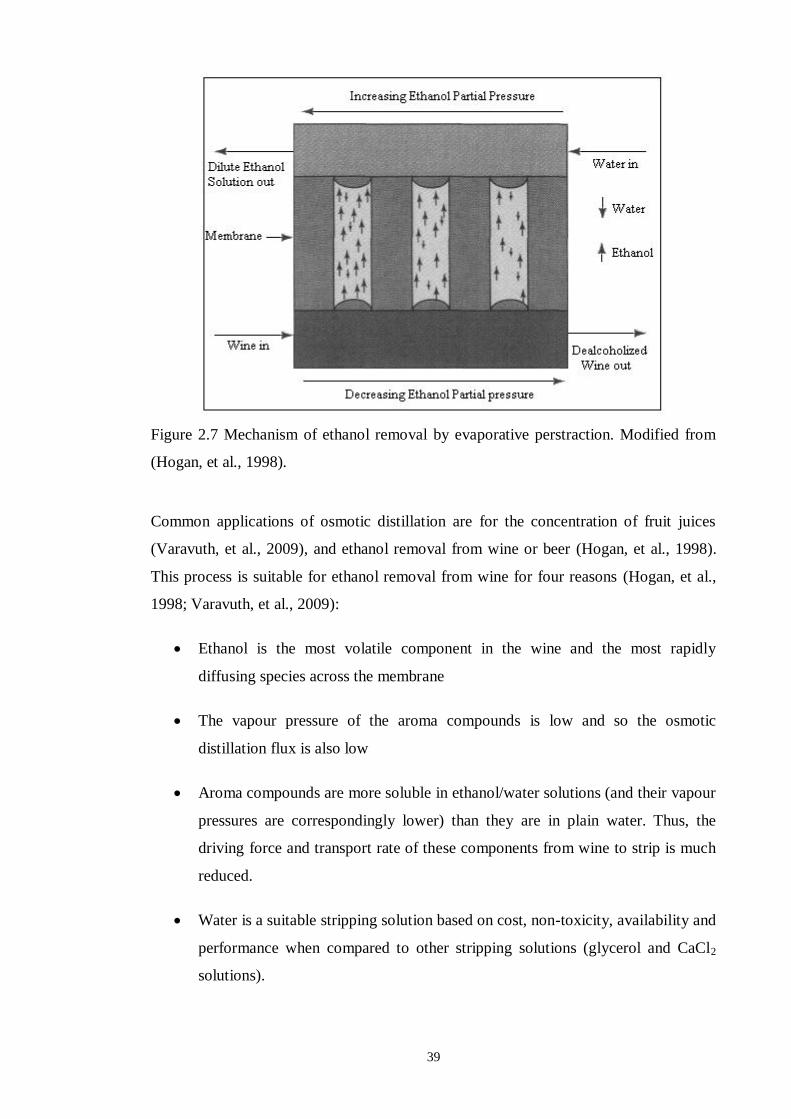
39
Figure 2.7 Mechanism of ethanol removal by evaporative perstraction. Modified from
(Hogan, et al., 1998).
Common applications of osmotic distillation are for the concentration of fruit juices
(Varavuth, et al., 2009), and ethanol removal from wine or beer (Hogan, et al., 1998).
This process is suitable for ethanol removal from wine for four reasons (Hogan, et al.,
1998; Varavuth, et al., 2009):
Ethanol is the most volatile component in the wine and the most rapidly
diffusing species across the membrane
The vapour pressure of the aroma compounds is low and so the osmotic
distillation flux is also low
Aroma compounds are more soluble in ethanol/water solutions (and their vapour
pressures are correspondingly lower) than they are in plain water. Thus, the
driving force and transport rate of these components from wine to strip is much
reduced.
Water is a suitable stripping solution based on cost, non-toxicity, availability and
performance when compared to other stripping solutions (glycerol and CaCl2
solutions).
40
The rate of ethanol removal from the feed stream can be changed by varying the
processing conditions (e.g. feed velocity, stripping solution velocity and temperature),
however, if they are increased, water flux from strip side to feed also increases but it is
still quite low compared to ethanol flux. However, there are some aroma losses that
occur with increasing operating time and temperature. Since the main goal of
dealcoholization is to reduce ethanol without spoiling other components of wine, the
operating temperature should be minimised and the reduction of ethanol flux may be
compensated for by increasing the membrane area (Varavuth, et al., 2009).
A synthetic wine was partially dealcoholized by osmotic distillation using a
hydrophobic hollow fibre membrane contactor (Diban, et al., 2008). The ethanol content
of the synthetic wine was reduced; however, some aroma compound losses occurred.
This may significantly affect sensory properties in wine.
2.2 Chemical composition of reduced ethanol content wine
Wine contains a number of different chemical compounds that influence the sensory
properties of the final product to varying degrees (Jones et al., 2008). Recently, there
has been increased international interest and consumer demand for reduced alcohol
wine as health and social concerns about the risks related to the consumption of alcohol
have increased (NHMRC, 2009b; WHO, 2010). A number of methods have been
developed to reduce the alcohol content of wine, using distillation and membrane
techniques for alcohol removal after fermentation. However, alcohol reduction
processes may cause degradation or removal of some components that result in altering
the flavour or aroma of wine. Thus, it is necessary to identify the volatile compounds of
wine and understand their interaction with other major components of wine that
influence wine aroma after ethanol reduction.
2.2.1 Wine volatiles and their interactions with other components
Wine is composed of a complex mixture of water, phenolic compounds, organic acids,
alcohols and residual sugars responsible for the sensory characteristics of wine. Volatile
compounds of wine exist at a much lower concentration than taste compounds, typically
10-4
-10-12
g/L, and are responsible for the aroma, detected both ortho- and retro- nasally
(i.e. while smelling a glass or tasting a sample). Hundreds of different volatile
compounds are present in a given wine, however only a subset of these compounds is
likely to be actively contributing to flavour and aroma. Recent research has shown that
non-volatile compounds are also responsible for changes of flavour or aroma, either
41
chemically, physically or in a perceptual manner (Francis & Newton, 2005). Three main
sources of aromas are recognised.
Primary aromas - those persisting through from the grape
Secondary aromas - those arising from the vinification process
Tertiary aromas - those arising during subsequent storage of the finished wine,
especially during long-term storage in wooden barrels (Clarke & Bakker, 2004).
The volatile compounds of wine can be classified into chemical groups, namely esters,
alcohols, acids, lactones, carbonyl compounds, acetals, phenols, sulfur-containing
compounds, nitrogen-containing volatiles and miscellaneous substances (Maarse, 1991).
The chemical class, volatile components, odour quality and concentration of a number
of volatile compounds found in young red and white wines are summarised in Table 2.2.
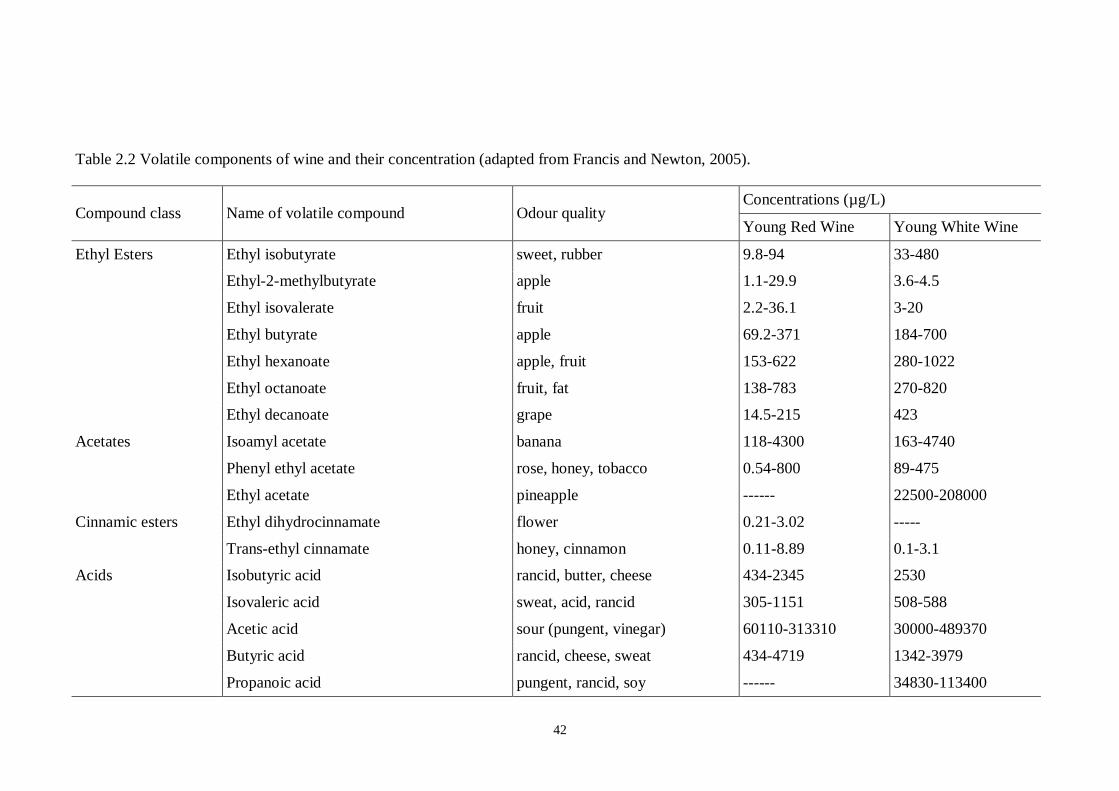
42
Table 2.2 Volatile components of wine and their concentration (adapted from Francis and Newton, 2005).
Compound class Name of volatile compound Odour quality Concentrations (µg/L)
Young Red Wine Young White Wine
Ethyl Esters Ethyl isobutyrate sweet, rubber 9.8-94 33-480
Ethyl-2-methylbutyrate apple 1.1-29.9 3.6-4.5
Ethyl isovalerate fruit 2.2-36.1 3-20
Ethyl butyrate apple 69.2-371 184-700
Ethyl hexanoate apple, fruit 153-622 280-1022
Ethyl octanoate fruit, fat 138-783 270-820
Ethyl decanoate grape 14.5-215 423
Acetates Isoamyl acetate banana 118-4300 163-4740
Phenyl ethyl acetate rose, honey, tobacco 0.54-800 89-475
Ethyl acetate pineapple ------ 22500-208000
Cinnamic esters Ethyl dihydrocinnamate flower 0.21-3.02 -----
Trans-ethyl cinnamate honey, cinnamon 0.11-8.89 0.1-3.1
Acids Isobutyric acid rancid, butter, cheese 434-2345 2530
Isovaleric acid sweat, acid, rancid 305-1151 508-588
Acetic acid sour (pungent, vinegar) 60110-313310 30000-489370
Butyric acid rancid, cheese, sweat 434-4719 1342-3979
Propanoic acid pungent, rancid, soy ------ 34830-113400
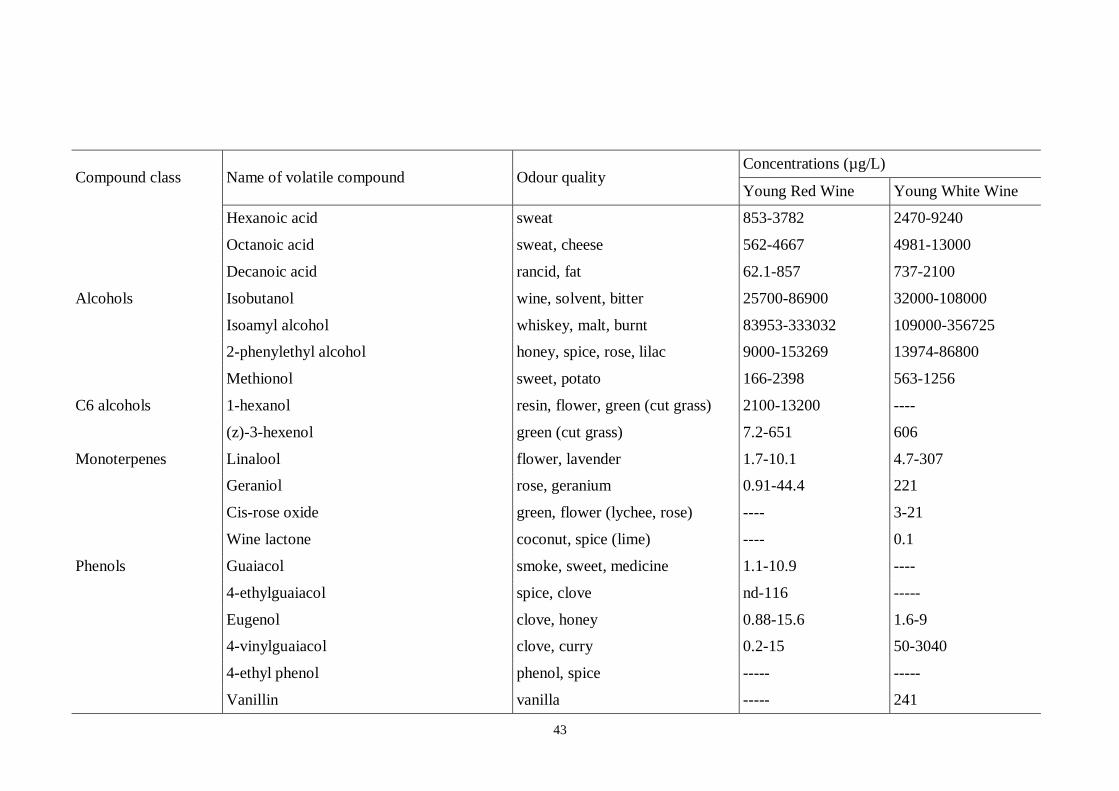
43
Compound class Name of volatile compound Odour quality Concentrations (µg/L)
Young Red Wine Young White Wine
Hexanoic acid sweat 853-3782 2470-9240
Octanoic acid sweat, cheese 562-4667 4981-13000
Decanoic acid rancid, fat 62.1-857 737-2100
Alcohols Isobutanol wine, solvent, bitter 25700-86900 32000-108000
Isoamyl alcohol whiskey, malt, burnt 83953-333032 109000-356725
2-phenylethyl alcohol honey, spice, rose, lilac 9000-153269 13974-86800
Methionol sweet, potato 166-2398 563-1256
C6 alcohols 1-hexanol resin, flower, green (cut grass) 2100-13200 ----
(z)-3-hexenol green (cut grass) 7.2-651 606
Monoterpenes Linalool flower, lavender 1.7-10.1 4.7-307
Geraniol rose, geranium 0.91-44.4 221
Cis-rose oxide green, flower (lychee, rose) ---- 3-21
Wine lactone coconut, spice (lime) ---- 0.1
Phenols Guaiacol smoke, sweet, medicine 1.1-10.9 ----
4-ethylguaiacol spice, clove nd-116 -----
Eugenol clove, honey 0.88-15.6 1.6-9
4-vinylguaiacol clove, curry 0.2-15 50-3040
4-ethyl phenol phenol, spice ----- -----
Vanillin vanilla ----- 241
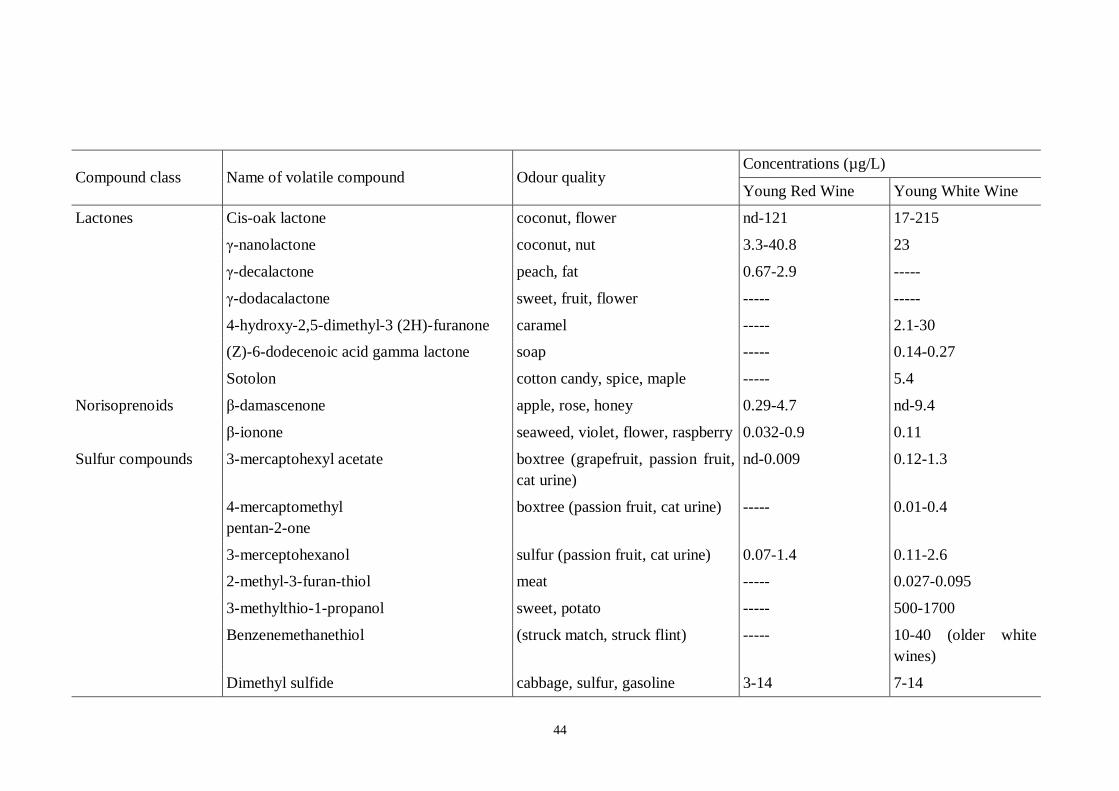
44
Compound class Name of volatile compound Odour quality Concentrations (µg/L)
Young Red Wine Young White Wine
Lactones Cis-oak lactone coconut, flower nd-121 17-215
γ-nanolactone coconut, nut 3.3-40.8 23
γ-decalactone peach, fat 0.67-2.9 -----
γ-dodacalactone sweet, fruit, flower ----- -----
4-hydroxy-2,5-dimethyl-3 (2H)-furanone caramel ----- 2.1-30
(Z)-6-dodecenoic acid gamma lactone soap ----- 0.14-0.27
Sotolon cotton candy, spice, maple ----- 5.4
Norisoprenoids β-damascenone apple, rose, honey 0.29-4.7 nd-9.4
β-ionone seaweed, violet, flower, raspberry 0.032-0.9 0.11
Sulfur compounds 3-mercaptohexyl acetate boxtree (grapefruit, passion fruit,
cat urine)
nd-0.009 0.12-1.3
4-mercaptomethyl
pentan-2-one
boxtree (passion fruit, cat urine) ----- 0.01-0.4
3-merceptohexanol sulfur (passion fruit, cat urine) 0.07-1.4 0.11-2.6
2-methyl-3-furan-thiol meat ----- 0.027-0.095
3-methylthio-1-propanol sweet, potato ----- 500-1700
Benzenemethanethiol (struck match, struck flint) ----- 10-40 (older white
wines)
Dimethyl sulfide cabbage, sulfur, gasoline 3-14 7-14
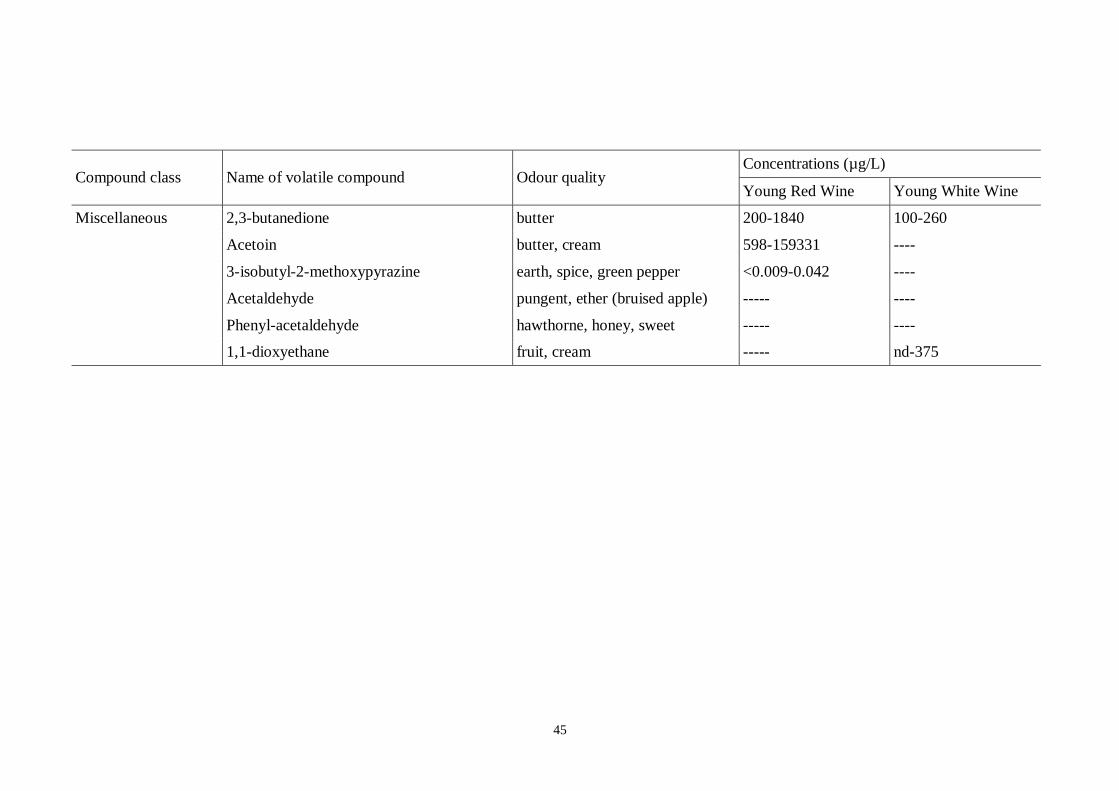
45
Compound class Name of volatile compound Odour quality Concentrations (µg/L)
Young Red Wine Young White Wine
Miscellaneous 2,3-butanedione butter 200-1840 100-260
Acetoin butter, cream 598-159331 ----
3-isobutyl-2-methoxypyrazine earth, spice, green pepper <0.009-0.042 ----
Acetaldehyde pungent, ether (bruised apple) ----- ----
Phenyl-acetaldehyde hawthorne, honey, sweet ----- ----
1,1-dioxyethane fruit, cream ----- nd-375
46
Volatile compounds have an important role in wine taste and aroma, and consequently
on their impact. The volatile compounds responsible for wine aroma depend on the wine
variety. For example, ethyl hexanoate, ethyl butanoate and ethyl 2-methyl butyrate are
the most odour active compounds in Chardonnay and Riesling wines (Chisholm et al.,
1994; Guth, 1997b). Other important compounds in Riesling are 2-phenyl ethanol,
linalool, β-damascenone. From a study on the odorants of two white wine varieties, 36
and 40 aroma-active compounds were found in extracts from Scheurebe and
Gewürztraminer wine by gas chromatography and olfactory analysis (Guth, 1997b). In
another study, it was reported that ethyl octanoate, ethyl hexanoate, 3-methylbutyl
acetate, ethyl isobutyrate, (E)-β-damascenone and 3a,4,5,7-a tetrahydro-3,6-
dimethylbenzofuran (wine lactone) were further important odorants in both varieties on
the basis of odour activity values (Guth, 1997a). Thus, it can be concluded that some
compounds are important for the aroma of particular wine varieties, but in most cases
these compounds are present in all varieties at varied concentration.
In addition, the characterization of aroma compounds of red wine (Escudero et al.,
2007; Gürbüz et al., 2006), the effect of adding sour rotten grapes on aroma
composition (Barata et al., 2011) and the effect of heating on volatiles of white wine
varieties and the changed composition of thermally processed wine (Leino et al., 1993)
have been analysed to evaluate the role of volatile compounds in wine taste and aroma.
A number of studies have also been conducted on identification and quantification of
these compounds in different wines to determine their sensory impact or to sensorially
characterise them. Headspace gas-chromatography coupled with olfactory, FID and
mass spectrometry are usually used for volatile compound analysis. Solid–phase
microextraction (SPME) technique is now mostly used along with GC-MS for volatile
or aroma compounds analysis of wine. SPME makes the sample preparation faster,
easier and it is compatible with a range of analytical instruments (Kataoka et al., 2000).
Headspace solid-phase micro-extraction gas-chromatography mass spectrometry (HS-
SPME-GC-MS) was carried out on two Semillon wines (recent vintage and aged). It
was found that 3-methyl-1-butanol is the most concentrated volatile compound for the
both types of Semillion. This study also identified and measured twenty-one volatile
compounds in the wine headspace and highlighted the quantification procedure of
aroma compounds using this technology (Rebière et al., 2010). In another study, HS-
SPME GC-MS was used to quantify thirty one volatile fermentation derived products
that contribute to the aroma of red and white wine (Siebert et al., 2005). Thus, this
47
technique has achieved enough reliability for researchers to use it for headspace
analysis.
Partitioning of volatile substances between the liquid and gas phases is mainly governed
by aroma compounds’ volatility and solubility. These physiochemical phenomena are
expected to be influenced by some major constituents in the wine (Dufour & Bayonove,
1999a). Consequently, it is very necessary to analyse the interactions between wine
constituents and aroma compounds to understand its influence on wine aroma during
wine consumption. Moreover, such study is also helpful to predict the change in aroma
perception that can occur due to ethanol reduction from wine. A discussion about wine’s
major components and their interaction with volatile compounds follows.
Ethanol is an important component of wine, and has long been known for its stimulant
character. In commercial wines ethanol concentration is normally in the range 8.5 % to
more than 15 % v/v (OIV, 2012a), whilst the maximum possible by fermentation alone
is considered to be about 17.5 % (Clarke & Bakker, 2004). It is produced during the
yeast fermentation reaction of grape sugars. It directly contributes to wine aroma as it
exists substantially above its perception threshold (from 0.1 to 100 ppm). Ethanol also
influences the perceived viscosity of wine (Nurgel & Pickering, 2005). The effect of
ethanol concentration in wine is also related to the headspace concentration of volatile
compounds. The presence of ethanol in wine modifies its solution polarity, which alters
the gas-liquid partition co-efficient. It has been observed that the addition of ethanol
generally increases the solubility of aroma compounds and results in reduction of their
headspace concentration (Voilley et al., 1991). Consequently, it affects the volatility of
the aroma compounds (Pozo-Bayón & Reineccius, 2009). The intensity of the effect
depends on the hydrophobicity of the volatile compounds (Aznar, et al., 2004).
However, some other researchers reported that the effect of ethanol on the partitioning
of volatile compounds exists only when the ethanol concentration is more than 17 %
(Aznar, et al., 2004; Conner et al., 1998). On the other hand, ethanol has shown a
significant enhancing effect on the release of aroma compounds under dynamic
conditions. It has been reported that, increased ethanol concentration in solution helps in
maintaining the headspace concentration of volatile compounds. The behaviour of the
phenomenon varies on the ethanol level of wine as well as the properties of aroma
compounds (Tsachaki et al., 2005, 2009). Thus, the aroma of low alcohol wine depends
on the ethanol content and the nature of the volatile components present in the wine.
48
The acidity of wine contributes to the sensory properties of wine in a number of ways.
Wines with low acidity usually have a flat taste but a high acidity gives sour tasting
wines. Some acids are directly related to the smell, taste or quality of wine. Acidity is
also related to the pH of a wine, which is known to affect numerous aspects of wine
chemistry. The main acids found in wine are tartaric, malic, citric and oxalic acids
originating in the grape, with lactic, pyruvic and succinic acids generated during
fermentation (Clarke & Bakker, 2004).
Polyphenols are major non-volatile components in wine. It has been observed that they
can interact non-covalently with aroma compounds in solution. These interactions may
affect the release of aroma compounds (Aronson & Ebeler, 2004; Dufour & Bayonove,
1999b). Polyphenols are a group of polymeric phenolic compounds that are responsible
for astringency and bitterness in wine. Basically, the flavonoid phenols, including
flavanols and flavonols elicit these organoleptic properties in beverages (Fischer &
Noble, 1994; Lesschaeve & Noble, 2005). The non-flavanoids group consists of
phenolic acids and their conjugates (e.g. esters and glycerides). They have limited
significance in wines due to their low concentration. Flavan-3-ol is an important
flavonoid group, the basic forms of which are flavan molecules, such as catechin. These
compounds are particularly important in their polymeric forms (often referred to as
polycyanidins when including the dimeric form), and are called condensed tannin in the
wine literature (Clarke & Bakker, 2004).
Research carried out by Defour and Baynove (1999b) reported that a weak interaction
exists between catechin and aroma compounds in a model wine system and mutual
hydrophobicity is the driving force for that interaction. They also found that the nature
of the interaction varies depending on the polyphenol type (catechin or tannin) and the
nature of the volatile compounds. However, processes involving polyphenol
aggregation could result in a significant loss of aroma compounds through
intermolecular interactions
Anthocyanidins and their glycoside form anthocyanins are largely responsible for the
colour of red grapes and are affected by temperature, light, pH, oxygen, sulfur dioxide,
aldehydes, ascorbic acids, metals and the degradation products of sugars. They are also
prone to condensation and polymerization with other phenols (Clarke & Bakker, 2004).
Voiley et al. (1991) observed that, anthocyanin at a concentration of 1 % (w/w) can
49
change the behaviour of isoamyl acetate. It was also noted that anthocyanin can form
hydrogen bonds with some aroma compounds at high concentration.
In another study it has been reported that the interaction of malviding glycosides with
aroma active phenolic compounds such as syringaldehyde, methyl vanillate, vanillin,
eugenol, lead to a diminished co-pigmentation at lower ethanol concentrations. They
also reported that increasing the concentration of anthocyanins had no visible effect on
colour, but the increased concentration of anthocyanins might weakly influence the
sensory quality of wine (Dufour & Sauvaitre, 2000). NMR studies have found that some
polyphenols (gallic acid and naurinine) interact with some aroma compounds (e.g. ethyl
hexanoate and 2-methyl pyrazine) through π-π stacking between the gallic acid ring and
aromatic ring of aroma compound (Jung et al., 2000).
Research has been carried out to find out which polyphenols cause the greatest effect on
volatile compounds, and how different volatile compounds are affected by polyphenols.
Aronsen and Ebeler (2004) found that gallic acid decreased the volatility of 2-methyl
pyrazine significantly; but at the same level, nauringin showed little effect. They found
that the volatility of ethyl benzoate decreased slightly with either polyphenol.
Finished wine can contain residual amounts of sugars (saccharides), mainly glucose and
fructose though other sugars (e.g. D-galactose, L-arabinose and D-xylose) are present at
low levels. Sugars primarily contribute to the perceived sweetness and mouthfeel of the
finished wine (Nurgel & Pickering, 2005). The residual sugar content in a finished wine
can vary widely depending on wine style, however even dry wines contain some
residual sugar (Clarke & Bakker, 2004).
Polysaccharides are one of the important groups of wine macro molecules that are
potential partners for aroma- macromolecule interactions. Wine polysaccharides range
in concentration from 500 to 1500 mg/L, and originate from the grape primary cell wall
and autolysis of yeasts during fermentation. These diverse origins result in
polysaccharides of different composition and structure. Two criteria widely used for
polysaccharide discrimination are acidity and protein contents. Neutral pectic
substances (type II arabinogalactans and arabinogalactans-proteins) represent 40 % of
the polysaccharides in wine and acidic pectic polysaccharides, (e.g. homogalacturonans
and rhamnogalacturonans) account for 20 % of them. Besides, the effect of different
polysaccharides isolated from wine, specifically arabinogalactan proteins (AGPs),
monomeric and dimeric rhamnogalacturonans II (mRG-II, dRG-II) and mannoproteins
50
(MPs), on the activity coefficients of some volatile compounds (isoamyl acetate, ethyl
hexanoate, 1-hexanol, diactyl) has been studied. Researchers found different effects
depending on the type of polysaccharide and the nature of the aroma compound. The
volatility of isoamyl acetate and ethyl hexanoate in a model wine system was not
affected due to the addition of wine polysaccharides in the range 5-20 g/L. However, at
higher concentrations, these two esters were decreased by protein rich polysaccharides
MP0 and AGP0 (with a low uronic acid content) and weakly salted out in the presence
of the uronic acid rich fractions AGP4, mRG-II and dRG-II (Dufour & Bayonove,
1999a; Pozo-Bayón & Reineccius, 2009).
Proteins are present in wines at a wide range of very low concentrations (between 30
and 269 mg/L). Their concentration depends on the winemaking technology and grape
type (Pozo-Bayón & Reineccius, 2009). Several authors have given evidence for
interactions between aroma compounds and proteins, probably through hydrophobic
interactions (Lubbers et al., 1994; Voilley et al., 1990), as indicated by a decrease in
volatility when the chain length of aldehydes and methyl ketones increases or
denaturation of the protein occurs (Langourieux & Crouzet, 1997). Other than studies
on the role of proteins released by yeast during autolysis on wine aroma, little work has
been found on the interactions between the other proteins and aroma compounds (Pozo-
Bayón & Reineccius, 2009).
Among other wine components, glycerol is also one of the most abundant components
in wine. In dry wines, its concentration is only exceeded by water and ethanol. Glycerol
concentration in wine ranges from 1.86 to 9.94 g/L (Noble & Bursick, 1984). It is
produced during alcoholic fermentation in grapes infected by Botrytis cinerea (Lubbers
et al., 2001). The production of glycerol is influenced by several factors including yeast
strain, temperature and pH. Glycerol is produced during glycerol-pyruvic fermentation
at the beginning of the alcoholic fermentation (Lubbers, et al., 2001; Ough et al., 1972).
It plays an important role in the organoleptic properties of wine. Its main contribution is
to sweetness. From a previous study on the effect of glycerol-flavour interactions in
white wine, it was found that glycerol at concentrations ranging from 5-50 g/L did not
modify the relative volatility of methyl-3-butanol, methyl-3-propanol, ethyl hexanoate
or methyl-3-butyl acetate. Sensory analysis was also carried out which shows that the
overall flavour of a model wine and white wine was not changed by the addition of
glycerol. It indicates that glycerol is not involved in changes in the aroma intensity of
wines (Lubbers, et al., 2001).
51
In conclusion, it can be said that, the effect of interactions between volatiles and other
major components of wine on wine aroma depends on several factors, namely:
Nature of the volatile compounds
Presence of major wine components (ethanol, polyphenols, polysaccharides etc.)
Driving force for the interaction
The concentration of both (volatiles and other component)
The role of major wine components in wine’s aroma or flavour is a complicated issue.
However, the interaction between major wine components and aroma discussed in this
section might have effects in reduced ethanol wine. When the ethanol content of wine is
reduced, aroma perception may be changed as ethanol directly interacts with wine
volatiles (Table 2.3). Besides this, the process used for ethanol reduction might cause
reduction or change in the concentration of other wine components (Belisario-S nchez,
et al., 2009; García-Martín, et al., 2011; Heux, et al., 2006a) and results changed wine
composition or matrix after ethanol reduction. The changed wine matrix can modify the
interaction of volatiles with other wine components. It may be another important
element for changed headspace concentration of reduced ethanol content wine. Thus,
this knowledge will assist researchers when conducting wine aroma analysis of reduced
alcohol wines.
2.2.2 Change in wine composition after ethanol reduction
Ethanol reduction processes can have complex impacts on the composition and
properties of reduced alcohol wine. It may also cause loss or reduction of volatiles
during the process. The impact of different processes varies depending on the method of
ethanol reduction employed and the class of compound studied. Table 2.3 contains a
summary of some ethanol reduction processes and their effect on wine volatiles.
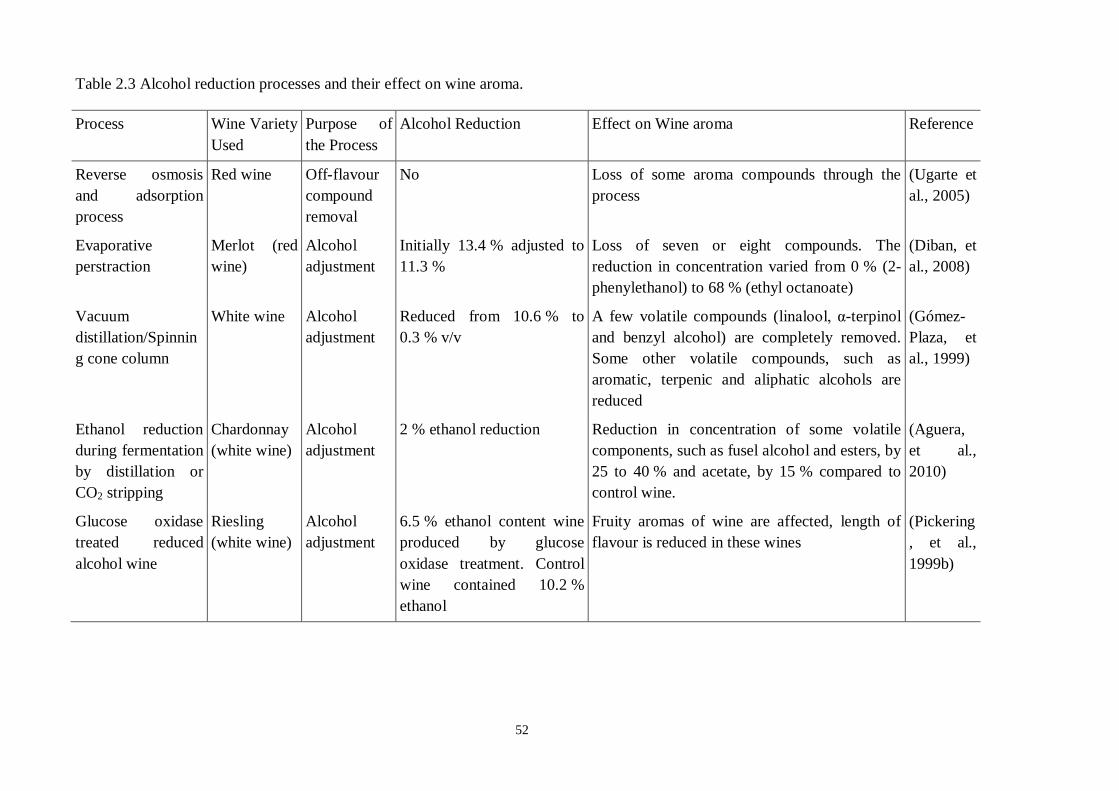
52
Table 2.3 Alcohol reduction processes and their effect on wine aroma.
Process Wine Variety
Used
Purpose of
the Process
Alcohol Reduction Effect on Wine aroma Reference
Reverse osmosis
and adsorption
process
Red wine Off-flavour
compound
removal
No Loss of some aroma compounds through the
process
(Ugarte et
al., 2005)
Evaporative
perstraction
Merlot (red
wine)
Alcohol
adjustment
Initially 13.4 % adjusted to
11.3 %
Loss of seven or eight compounds. The
reduction in concentration varied from 0 % (2-
phenylethanol) to 68 % (ethyl octanoate)
(Diban, et
al., 2008)
Vacuum
distillation/Spinnin
g cone column
White wine Alcohol
adjustment
Reduced from 10.6 % to
0.3 % v/v
A few volatile compounds (linalool, α-terpinol
and benzyl alcohol) are completely removed.
Some other volatile compounds, such as
aromatic, terpenic and aliphatic alcohols are
reduced
(Gómez-
Plaza, et
al., 1999)
Ethanol reduction
during fermentation
by distillation or
CO2 stripping
Chardonnay
(white wine)
Alcohol
adjustment
2 % ethanol reduction Reduction in concentration of some volatile
components, such as fusel alcohol and esters, by
25 to 40 % and acetate, by 15 % compared to
control wine.
(Aguera,
et al.,
2010)
Glucose oxidase
treated reduced
alcohol wine
Riesling
(white wine)
Alcohol
adjustment
6.5 % ethanol content wine
produced by glucose
oxidase treatment. Control
wine contained 10.2 %
ethanol
Fruity aromas of wine are affected, length of
flavour is reduced in these wines
(Pickering
, et al.,
1999b)
53
The intensity of loss of volatile compounds depends on the nature of the process and the
volatility of the aroma compounds. Volatile compounds are affected in different
processes in different ways. When membrane separation processes are used for ethanol
reduction, the loss of volatile compounds occurs for the following reasons:
Type of membrane used
High hydrophobic character of volatiles
Significant volatility of aroma compounds
Fouling of membrane
Fouling significantly impacts on membrane performance and varies the removal pattern
of the organic compounds (Agenson & Urase, 2007). It is important that the type of
membrane selected for ethanol reduction makes aroma losses negligible. Other
processes can also be optimised to prevent aroma loss during the reduction.
In summary, ethanol reduction processes cause changes in volatile compounds of wine,
however the nature and extent of the changes depend on the processing system
employed. If the composition of a reduced ethanol wine can be kept as close to that of
the original wine as possible, it may result in a reduced alcohol wine with a better taste
or less flavour difference.
2.3 Sensory properties of reduced ethanol wine
Wine is a popular drink all over the world, and wine with lower ethanol content offers
advantages regarding health and social issues. Recently, the demand for reduced ethanol
beverages has increased, as a result of health and social concerns about the risks related
to the consumption of ethanol (NHMRC, 2009b; Saliba, et al., 2013a; WHO, 2010). The
sensory properties of wine are denoted as ‘wine flavour’ which usually indicates the
combination of smell and taste. Taste can be described as sweet, sour, salty and bitter;
and aromas include floral, fruity and woody smells (Clarke & Bakker, 2004). There are
other sensory properties, such as mouthfeel (Langstaff et al., 1991), perceived density
and hotness (Gawel et al., 2007), astringency (Fontoin et al., 2008), umami (Desportes
et al., 2001), and temperature and bubbles (Clarke & Bakker, 2004), which are very
important for assessing the taste of wine. However wine flavour is affected by the
processes used to reduce the ethanol content (Villamor & Ross, 2013). In addition to the
54
changes in aroma compound concentration, the change in the ethanol concentration is
itself responsible for changes in wine sensory characteristics.
2.3.1 Ethanol and the sensory properties of wine
Ethanol is an effective gustatory, olfactory and trigeminal stimulus. The taste perception
of ethanol to human can be described as a combination of sweet and bitter tastes, odour,
oral irritation (e.g. burning sensation) and all of them vary with the concentration
(Bachmanov et al., 2003; Bartoshuk et al., 1993; Green, 1987; Mattes & DiMeglio,
2001). Increasing the ethanol concentration of white wine from 8 % to 14 % has been
found to cause a large increase in bitterness at all pH and catechin levels, but sourness
decreased slightly with the increased level of ethanol (Fischer & Noble, 1994).
However, unlike bitterness, astringency was found to linearly decrease as the level of
ethanol increased. This may be because the presence of ethanol limits the protein-tannin
association, which reduces the perceived astringency of wine (Fontoin, et al., 2008). In
addition, Martin and Pangborn (1970) found that in model solutions ethanol enhanced
the sweetness of sucrose and depressed the sourness of citric acid and the saltiness of
sodium chloride. Moreover, ethanol had a complex interaction with wine volatiles, that
is very significant for wine aroma (Escudero, et al., 2007). A brief description of wine
volatile compounds has already presented in Table 2.2. The effect of ethanol
concentration on wine aroma composition was discussed in Section 2.2.1. Research on
the interactions between ethanol and wine aroma compounds reported that increasing
ethanol concentration significantly reduced the headspace concentration of volatile
aroma compounds (Athès et al., 2004; Robinson et al., 2009). This helps explain the
recent sensory observation that ethanol can suppress the fruity aroma attributes in wine
(Goldner, et al., 2009; Robinson, et al., 2009).
Although it was thought that ethanol content is related to the perceived viscosity,
density and fullness of wine, research on this issue has reported complex and slightly
contradictory results. While ethanol concentration was found to be strongly correlated
with maximum perceived intensity and physical measurements of viscosity and density,
maximum perceived viscosity and density do not differ significantly in response to a
change in ethanol concentration. Intensity maxima for viscosity and density were found
at 10 % and 12 % v/v ethanol concentration respectively, but wines of 7 % to 14 %
ethanol content were not statistically differentiated for either attribute (Meillon, et al.,
2010b; Nurgel & Pickering, 2005; Pickering et al., 1998). In addition, it was identified
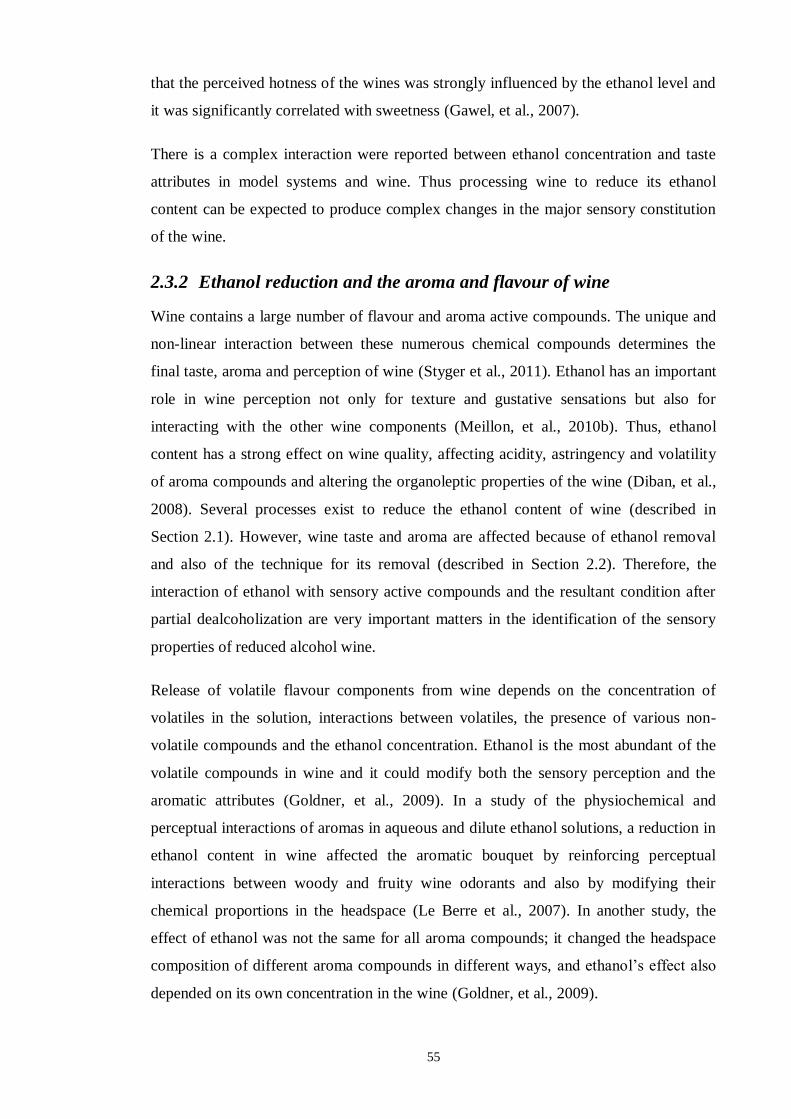
55
that the perceived hotness of the wines was strongly influenced by the ethanol level and
it was significantly correlated with sweetness (Gawel, et al., 2007).
There is a complex interaction were reported between ethanol concentration and taste
attributes in model systems and wine. Thus processing wine to reduce its ethanol
content can be expected to produce complex changes in the major sensory constitution
of the wine.
2.3.2 Ethanol reduction and the aroma and flavour of wine
Wine contains a large number of flavour and aroma active compounds. The unique and
non-linear interaction between these numerous chemical compounds determines the
final taste, aroma and perception of wine (Styger et al., 2011). Ethanol has an important
role in wine perception not only for texture and gustative sensations but also for
interacting with the other wine components (Meillon, et al., 2010b). Thus, ethanol
content has a strong effect on wine quality, affecting acidity, astringency and volatility
of aroma compounds and altering the organoleptic properties of the wine (Diban, et al.,
2008). Several processes exist to reduce the ethanol content of wine (described in
Section 2.1). However, wine taste and aroma are affected because of ethanol removal
and also of the technique for its removal (described in Section 2.2). Therefore, the
interaction of ethanol with sensory active compounds and the resultant condition after
partial dealcoholization are very important matters in the identification of the sensory
properties of reduced alcohol wine.
Release of volatile flavour components from wine depends on the concentration of
volatiles in the solution, interactions between volatiles, the presence of various non-
volatile compounds and the ethanol concentration. Ethanol is the most abundant of the
volatile compounds in wine and it could modify both the sensory perception and the
aromatic attributes (Goldner, et al., 2009). In a study of the physiochemical and
perceptual interactions of aromas in aqueous and dilute ethanol solutions, a reduction in
ethanol content in wine affected the aromatic bouquet by reinforcing perceptual
interactions between woody and fruity wine odorants and also by modifying their
chemical proportions in the headspace (Le Berre et al., 2007). In another study, the
effect of ethanol was not the same for all aroma compounds; it changed the headspace
composition of different aroma compounds in different ways, and ethanol’s effect also
depended on its own concentration in the wine (Goldner, et al., 2009).
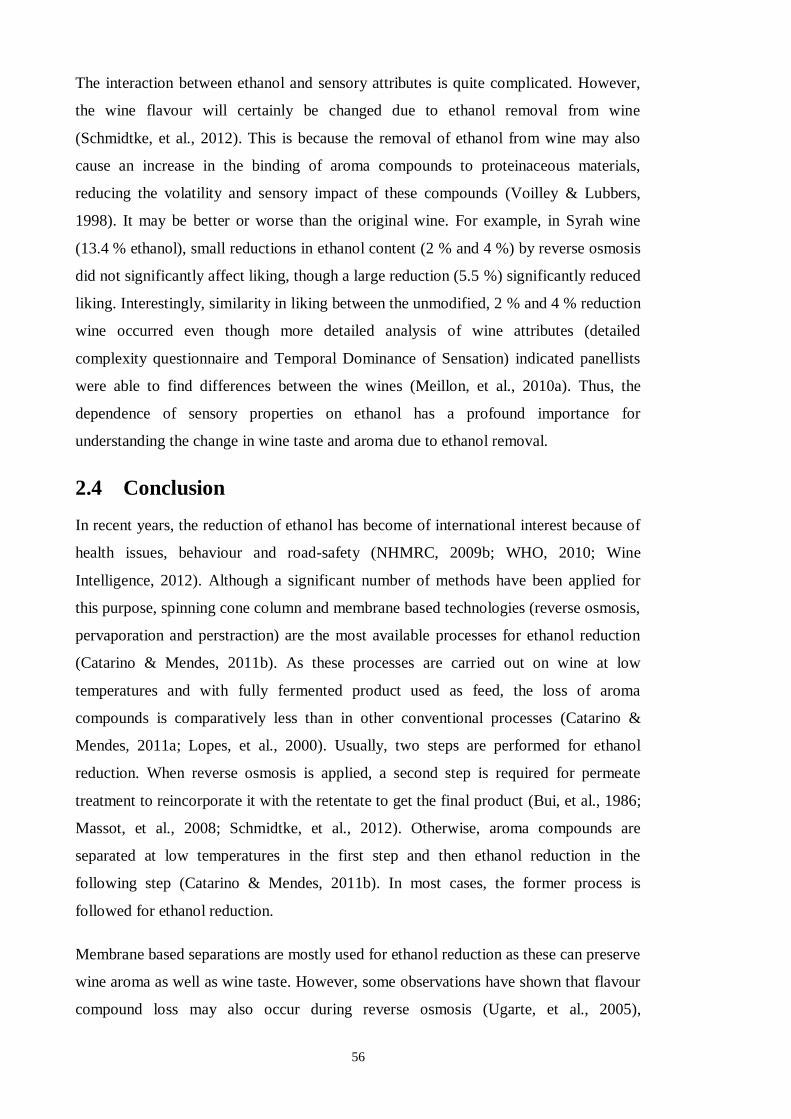
56
The interaction between ethanol and sensory attributes is quite complicated. However,
the wine flavour will certainly be changed due to ethanol removal from wine
(Schmidtke, et al., 2012). This is because the removal of ethanol from wine may also
cause an increase in the binding of aroma compounds to proteinaceous materials,
reducing the volatility and sensory impact of these compounds (Voilley & Lubbers,
1998). It may be better or worse than the original wine. For example, in Syrah wine
(13.4 % ethanol), small reductions in ethanol content (2 % and 4 %) by reverse osmosis
did not significantly affect liking, though a large reduction (5.5 %) significantly reduced
liking. Interestingly, similarity in liking between the unmodified, 2 % and 4 % reduction
wine occurred even though more detailed analysis of wine attributes (detailed
complexity questionnaire and Temporal Dominance of Sensation) indicated panellists
were able to find differences between the wines (Meillon, et al., 2010a). Thus, the
dependence of sensory properties on ethanol has a profound importance for
understanding the change in wine taste and aroma due to ethanol removal.
2.4 Conclusion
In recent years, the reduction of ethanol has become of international interest because of
health issues, behaviour and road-safety (NHMRC, 2009b; WHO, 2010; Wine
Intelligence, 2012). Although a significant number of methods have been applied for
this purpose, spinning cone column and membrane based technologies (reverse osmosis,
pervaporation and perstraction) are the most available processes for ethanol reduction
(Catarino & Mendes, 2011b). As these processes are carried out on wine at low
temperatures and with fully fermented product used as feed, the loss of aroma
compounds is comparatively less than in other conventional processes (Catarino &
Mendes, 2011a; Lopes, et al., 2000). Usually, two steps are performed for ethanol
reduction. When reverse osmosis is applied, a second step is required for permeate
treatment to reincorporate it with the retentate to get the final product (Bui, et al., 1986;
Massot, et al., 2008; Schmidtke, et al., 2012). Otherwise, aroma compounds are
separated at low temperatures in the first step and then ethanol reduction in the
following step (Catarino & Mendes, 2011b). In most cases, the former process is
followed for ethanol reduction.
Membrane based separations are mostly used for ethanol reduction as these can preserve
wine aroma as well as wine taste. However, some observations have shown that flavour
compound loss may also occur during reverse osmosis (Ugarte, et al., 2005),
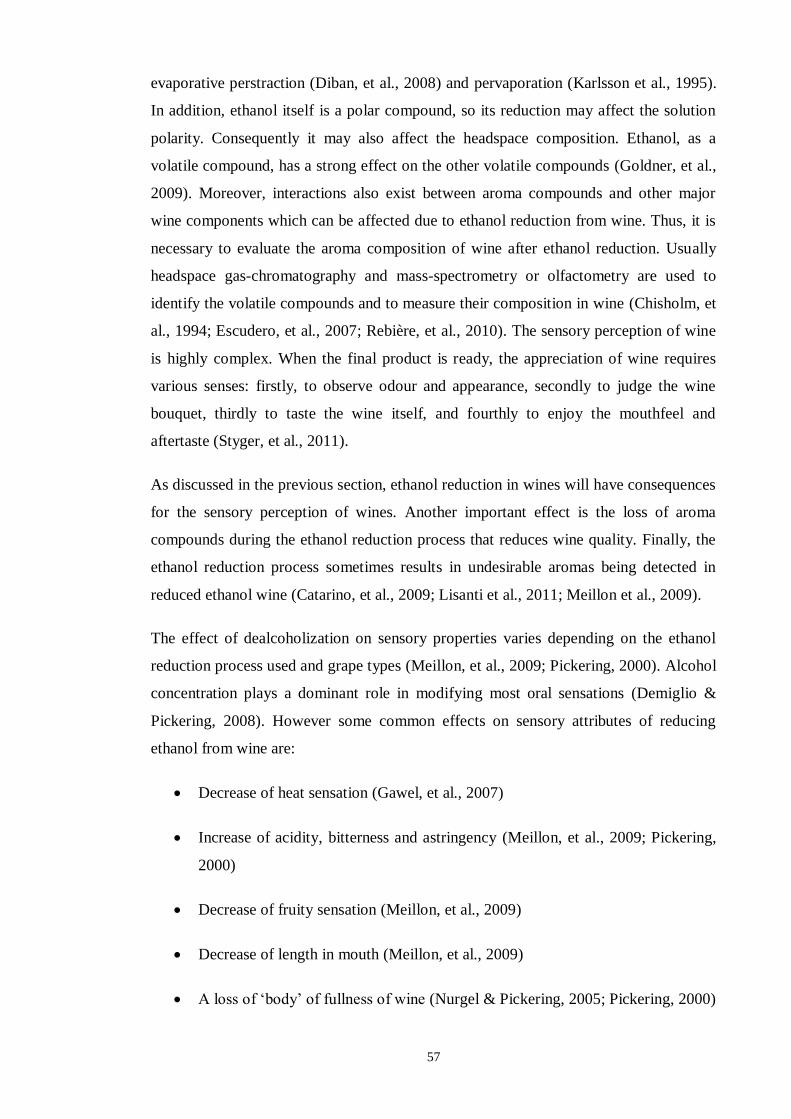
57
evaporative perstraction (Diban, et al., 2008) and pervaporation (Karlsson et al., 1995).
In addition, ethanol itself is a polar compound, so its reduction may affect the solution
polarity. Consequently it may also affect the headspace composition. Ethanol, as a
volatile compound, has a strong effect on the other volatile compounds (Goldner, et al.,
2009). Moreover, interactions also exist between aroma compounds and other major
wine components which can be affected due to ethanol reduction from wine. Thus, it is
necessary to evaluate the aroma composition of wine after ethanol reduction. Usually
headspace gas-chromatography and mass-spectrometry or olfactometry are used to
identify the volatile compounds and to measure their composition in wine (Chisholm, et
al., 1994; Escudero, et al., 2007; Rebière, et al., 2010). The sensory perception of wine
is highly complex. When the final product is ready, the appreciation of wine requires
various senses: firstly, to observe odour and appearance, secondly to judge the wine
bouquet, thirdly to taste the wine itself, and fourthly to enjoy the mouthfeel and
aftertaste (Styger, et al., 2011).
As discussed in the previous section, ethanol reduction in wines will have consequences
for the sensory perception of wines. Another important effect is the loss of aroma
compounds during the ethanol reduction process that reduces wine quality. Finally, the
ethanol reduction process sometimes results in undesirable aromas being detected in
reduced ethanol wine (Catarino, et al., 2009; Lisanti et al., 2011; Meillon et al., 2009).
The effect of dealcoholization on sensory properties varies depending on the ethanol
reduction process used and grape types (Meillon, et al., 2009; Pickering, 2000). Alcohol
concentration plays a dominant role in modifying most oral sensations (Demiglio &
Pickering, 2008). However some common effects on sensory attributes of reducing
ethanol from wine are:
Decrease of heat sensation (Gawel, et al., 2007)
Increase of acidity, bitterness and astringency (Meillon, et al., 2009; Pickering,
2000)
Decrease of fruity sensation (Meillon, et al., 2009)
Decrease of length in mouth (Meillon, et al., 2009)
A loss of ‘body’ of fullness of wine (Nurgel & Pickering, 2005; Pickering, 2000)
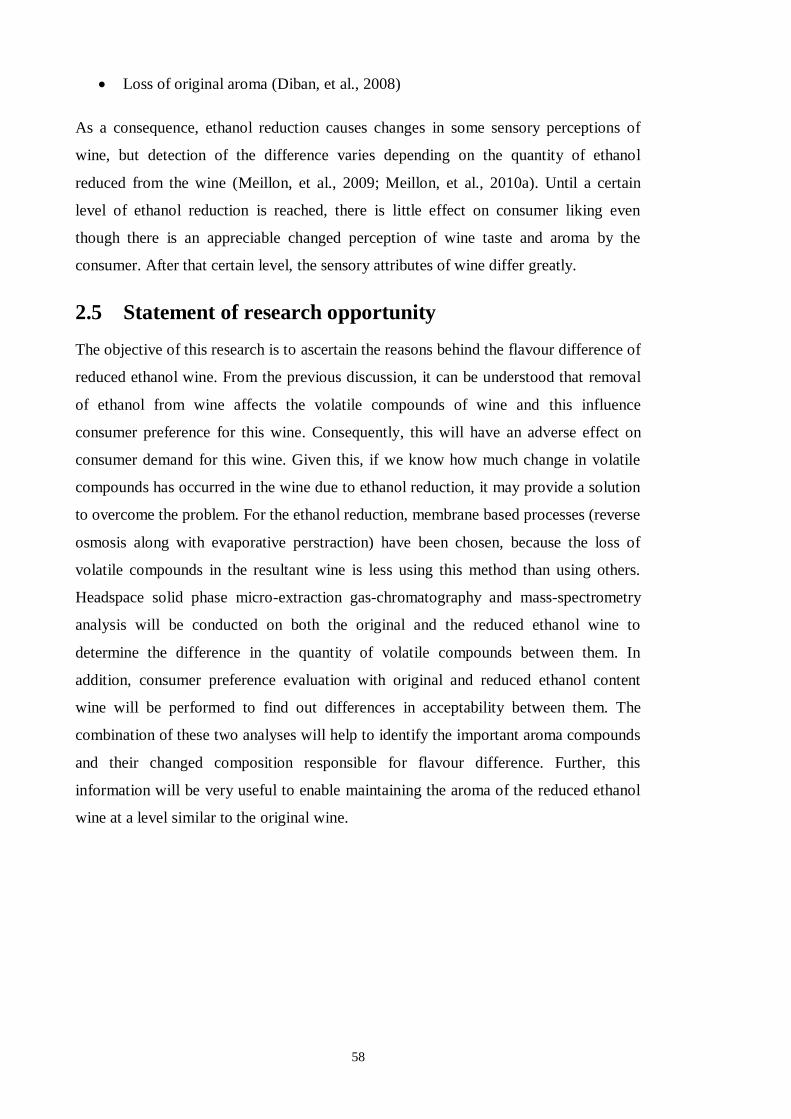
58
Loss of original aroma (Diban, et al., 2008)
As a consequence, ethanol reduction causes changes in some sensory perceptions of
wine, but detection of the difference varies depending on the quantity of ethanol
reduced from the wine (Meillon, et al., 2009; Meillon, et al., 2010a). Until a certain
level of ethanol reduction is reached, there is little effect on consumer liking even
though there is an appreciable changed perception of wine taste and aroma by the
consumer. After that certain level, the sensory attributes of wine differ greatly.
2.5 Statement of research opportunity
The objective of this research is to ascertain the reasons behind the flavour difference of
reduced ethanol wine. From the previous discussion, it can be understood that removal
of ethanol from wine affects the volatile compounds of wine and this influence
consumer preference for this wine. Consequently, this will have an adverse effect on
consumer demand for this wine. Given this, if we know how much change in volatile
compounds has occurred in the wine due to ethanol reduction, it may provide a solution
to overcome the problem. For the ethanol reduction, membrane based processes (reverse
osmosis along with evaporative perstraction) have been chosen, because the loss of
volatile compounds in the resultant wine is less using this method than using others.
Headspace solid phase micro-extraction gas-chromatography and mass-spectrometry
analysis will be conducted on both the original and the reduced ethanol wine to
determine the difference in the quantity of volatile compounds between them. In
addition, consumer preference evaluation with original and reduced ethanol content
wine will be performed to find out differences in acceptability between them. The
combination of these two analyses will help to identify the important aroma compounds
and their changed composition responsible for flavour difference. Further, this
information will be very useful to enable maintaining the aroma of the reduced ethanol
wine at a level similar to the original wine.
59
Chapter 3 Ethanol Reduction from Three Varieties
of Wine by Membrane Separation Process
3.1 Introduction
The market demand for reduced ethanol content wine is increasing for a number of
reasons including health consciousness of consumers, safe driving issues and lower
alcohol beverages attracting lower tax rates (HM Revenue and Customs, 2013; Howley
& Young, 1992; NHMRC, 2009b; Saliba, et al., 2013a; WHO, 2010; Wine Intelligence,
2012). At the same time, wine must meet regulatory requirements. For example,
according to the International Organisation of Vine and Wine, the alcohol content of
wine shall not be less than 8.5 % v/v (OIV, 2012a), and any wine product with an
alcohol content between 0.5 to 8.5 % will be defined as ‘partially dealcoholised’ (OIV,
2012b). However some regulatory changes are taking place that are increasing the
ability of wine producers to produce wines with lower ethanol contents. Recently Food
Standards Australia New Zealand reduced the minimum alcohol content of wine in
Australia from 8 % to 4.5 % (ComLaw, 2011). All these facts lead to wine makers
becoming interested in the production of lower ethanol content wine and exploring new
technologies available for ethanol reduction from wine.
Several pre-fermentation technologies exist for ethanol adjustment of wine (Pickering,
2000). The approach can be performed by using unripe grapes, by sugar reduction from
must or by using special enzymes to reduce the sugar of grape juice. During
fermentation naturally occurring or genetically engineered yeast can be used that
converts less sugar into ethanol. The wine maker can also stop fermentation at a stage
when sugar still remains which also reduces wine ethanol content (Lopes, et al., 2000).
However these processes can adversely affect the organoleptic qualities of wine
(García-Martín, et al., 2010, 2011; Kontoudakis, et al., 2011; Pickering, et al., 1999b),
and this may result in reduced consumer acceptance of the product. There are also some
post-fermentation processes that reduce ethanol from wine, such as thermal distillation,
freeze concentration, supercritical liquid extraction, spinning cone column and
membrane separation technology. However, heat based processes cause loss of volatile
compounds (Gómez-Plaza, et al., 1999). Freeze concentration and supercritical liquid
extraction processes are expensive to use on a large scale for ethanol reduction from
wine (Pickering, 2000). Among other processes, spinning cone column and membrane
60
separation techniques are both widely used for this purpose though membrane
separation technologies are more suitable for ethanol reduction due to minimal thermal
damage, low temperature and low energy consumption (Catarino & Mendes, 2011a).
Different types of membrane separation techniques are used for ethanol reduction in
wine; the most common being reverse osmosis, pervaporation and evaporative
perstraction (Schmidtke, et al., 2012). Sometimes it becomes necessary to use the
combination of two processes to preserve the legality of the wine product as dilution of
wine is not permitted in Australia and most other countries (Pickering, 2000). One such
approach combines reverse osmosis and evaporative perstraction (Wollan, 2010). This
technique is now commercially used in wineries for alcohol adjustment of wine
(Massot, et al., 2008; Memstar, 2013).
Most of the reduction processes cause more or less loss of volatile compounds along
with ethanol during the process. This affects the headspace composition as well as the
wine aroma (Diban, et al., 2008; Pickering, et al., 1999a; Ugarte, et al., 2005). Besides
this, ethanol itself is a volatile compound which directly contributes to wine aroma. The
interaction of ethanol and other volatile compounds also needs to be considered as the
concentration difference of ethanol influences the headspace concentration of other
wine volatiles (Goldner, et al., 2009; Villamor & Ross, 2013).
There are many published papers on different processes of alcohol reduction and the
sensory properties of partially or completely dealcoholised wine, but no particular study
is available that describes the headspace composition of wines containing different
ethanol contents combined with consumer acceptance of these products. The headspace
composition of volatile compounds accounts for wine flavour which is an important
characteristic for a particular wine style (Capone et al., 2013). So, a change in the
headspace concentration might cause alteration of wine flavour which could affect
consumers’ preference for that wine. In addition, the minimum ethanol content allowed
in wine to be marketed as wine has been decreased from 8 to 4.5 % and this creates an
opportunity for the wine maker to produce a lower ethanol content wine for consumers.
Previous research has shown that reduction of a small amount of ethanol from wine
does not impact much on the consumer (Meillon, et al., 2010b) but a larger quantity of
ethanol reduction might affect wine flavour. So currently, it is important to determine
whether there will be any difference in the headspace composition as well as wine
flavour when wine contains close to 4.5 % ethanol.
61
In the future, the minimum ethanol content of wine may be lowered further if the
consumer is satisfied with taste and aroma at that ethanol level (Saliba et al., 2013b). As
4.5 % is the lowest limit according to the updated rule and 8 % is a common level of
ethanol in wine, in this research it is planned to reduce the ethanol content of the
original wine to 8 % and 5 %.
Wines can be classified in various ways, such as colour, grape variety, flavour etc.
However, wines are primarily differentiated by their colour and can be divided into
three categories: white, red and rose (Clarke & Bakker, 2004), with red and white wines
dominating the wine market in Australia. Among the white varieties, Chardonnay is one
of the most popular wines in the world. The production of Chardonnay is the highest
among all white wine varieties and constitutes nearly half the white wine production in
Australia (Austraian Bureau of Statistics, 2012). Australian Chardonnays have ripe
melon flavours if they are grown in warmer regions whereas colder regions produce
popular peach and citrus characteristics. Sauvignon Blanc is another white variety that
is grown in relatively colder climates and is generally consumed soon after vintage. Its
production is the second highest of whites in Australia (Austraian Bureau of Statistics,
2012; Wine Larder, 2006). Shiraz is one of the most famous Australian red wine
varieties. Similar to Chardonnay, its production constitutes almost half of total
Australian red wine production. Shiraz is well known for its deep plum colour and
peppery flavour (Austraian Bureau of Statistics, 2012; Wine Larder, 2006). Based on
their popularity and availability, Chardonnay, Sauvignon Blanc and Shiraz were
selected for the ethanol reduction experiment.
From the point of view of its suitability and availability, the combined technique of
reverse osmosis and evaporative perstraction was selected to reduce ethanol from
conventional wine in this research project.
In this trial, the three wines were prepared at three ethanol levels. The ethanol levels
were: original (as supplied by the winery), and two reduced ethanol versions (8 % and
5 %). The wines were subsequently analysed using headspace analysis (Chardonnay,
Sauvignon Blanc, Shiraz) and consumer preference was determined (Chardonnay and
Shiraz).
In this project, ethanol was reduced from these three popular varieties of wine to 8 %
and 5 % by applying a combined ethanol reduction technique of reverse osmosis and
evaporative perstraction process. Then the headspace composition of both the reduced
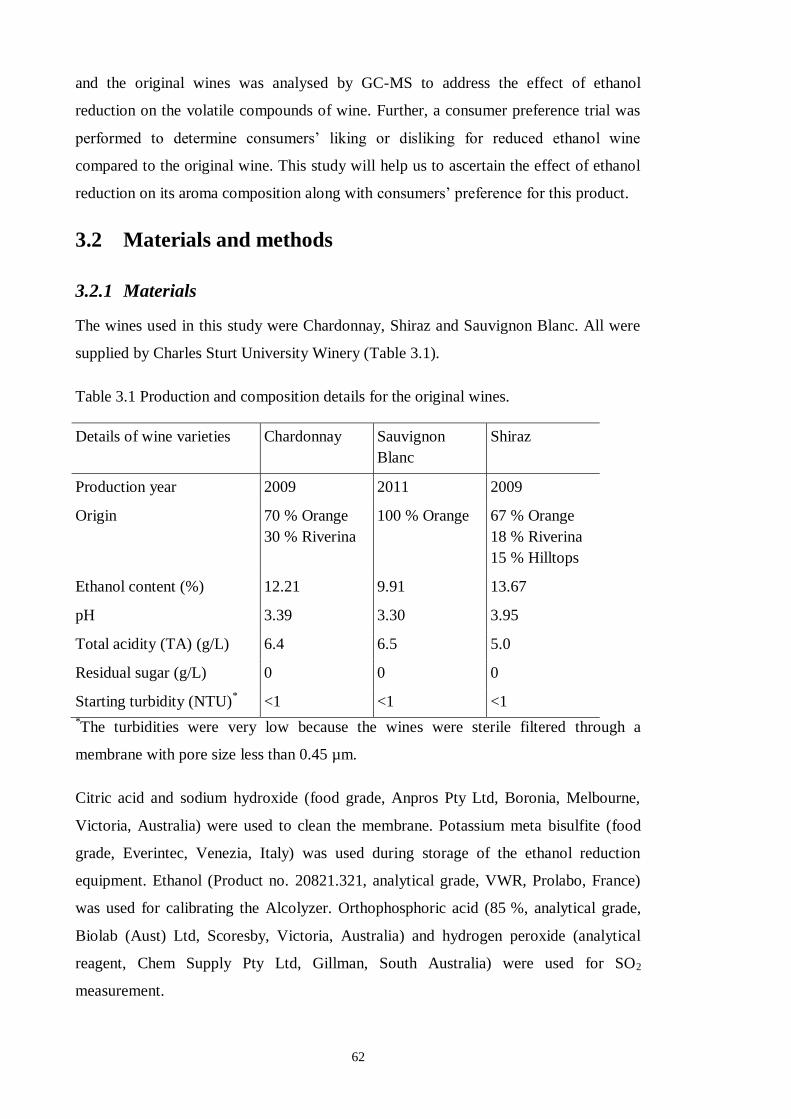
62
and the original wines was analysed by GC-MS to address the effect of ethanol
reduction on the volatile compounds of wine. Further, a consumer preference trial was
performed to determine consumers’ liking or disliking for reduced ethanol wine
compared to the original wine. This study will help us to ascertain the effect of ethanol
reduction on its aroma composition along with consumers’ preference for this product.
3.2 Materials and methods
3.2.1 Materials
The wines used in this study were Chardonnay, Shiraz and Sauvignon Blanc. All were
supplied by Charles Sturt University Winery (Table 3.1).
Table 3.1 Production and composition details for the original wines.
Details of wine varieties Chardonnay Sauvignon
Blanc
Shiraz
Production year 2009 2011 2009
Origin 70 % Orange
30 % Riverina
100 % Orange 67 % Orange
18 % Riverina
15 % Hilltops
Ethanol content (%) 12.21 9.91 13.67
pH 3.39 3.30 3.95
Total acidity (TA) (g/L) 6.4 6.5 5.0
Residual sugar (g/L) 0 0 0
Starting turbidity (NTU)* <1 <1 <1
*The turbidities were very low because the wines were sterile filtered through a
membrane with pore size less than 0.45 µm.
Citric acid and sodium hydroxide (food grade, Anpros Pty Ltd, Boronia, Melbourne,
Victoria, Australia) were used to clean the membrane. Potassium meta bisulfite (food
grade, Everintec, Venezia, Italy) was used during storage of the ethanol reduction
equipment. Ethanol (Product no. 20821.321, analytical grade, VWR, Prolabo, France)
was used for calibrating the Alcolyzer. Orthophosphoric acid (85 %, analytical grade,
Biolab (Aust) Ltd, Scoresby, Victoria, Australia) and hydrogen peroxide (analytical
reagent, Chem Supply Pty Ltd, Gillman, South Australia) were used for SO2
measurement.
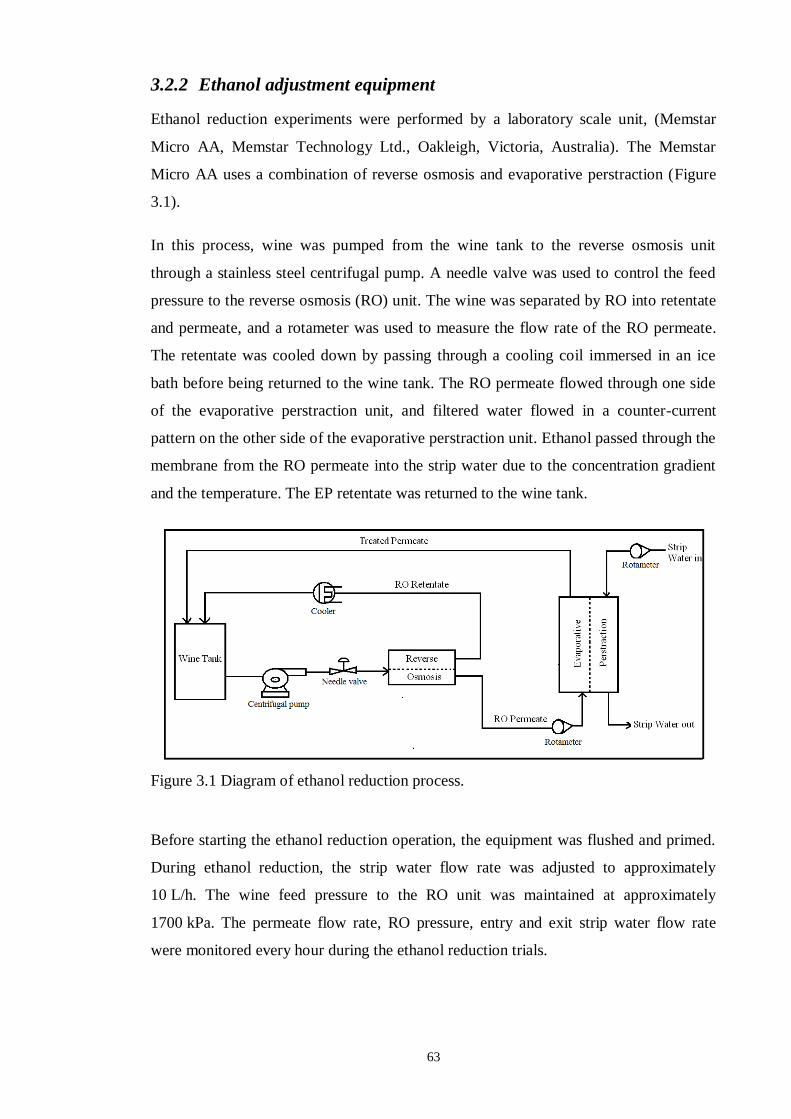
63
3.2.2 Ethanol adjustment equipment
Ethanol reduction experiments were performed by a laboratory scale unit, (Memstar
Micro AA, Memstar Technology Ltd., Oakleigh, Victoria, Australia). The Memstar
Micro AA uses a combination of reverse osmosis and evaporative perstraction (Figure
3.1).
In this process, wine was pumped from the wine tank to the reverse osmosis unit
through a stainless steel centrifugal pump. A needle valve was used to control the feed
pressure to the reverse osmosis (RO) unit. The wine was separated by RO into retentate
and permeate, and a rotameter was used to measure the flow rate of the RO permeate.
The retentate was cooled down by passing through a cooling coil immersed in an ice
bath before being returned to the wine tank. The RO permeate flowed through one side
of the evaporative perstraction unit, and filtered water flowed in a counter-current
pattern on the other side of the evaporative perstraction unit. Ethanol passed through the
membrane from the RO permeate into the strip water due to the concentration gradient
and the temperature. The EP retentate was returned to the wine tank.
Figure 3.1 Diagram of ethanol reduction process.
Before starting the ethanol reduction operation, the equipment was flushed and primed.
During ethanol reduction, the strip water flow rate was adjusted to approximately
10 L/h. The wine feed pressure to the RO unit was maintained at approximately
1700 kPa. The permeate flow rate, RO pressure, entry and exit strip water flow rate
were monitored every hour during the ethanol reduction trials.
64
The ethanol content was measured on the unmodified wine, and then measured every
hour until the wine reached the target ethanol concentration. The ethanol content of the
ethanol reduced wine was measured prior to bottling.
3.2.3 Ethanol content analysis
Wine ethanol content and density were determined with an Alcolyzer (Anton Paar,
Ashland, Virginia, United States) coupled with a density meter (DMA 4500, Anton
Paar).
3.2.4 pH measurement
The pH of the wine was measured with a Cyber Scan 510 pH meter (Eutech Instruments
Pte Ltd, Singapore). Wine pH was measured on the unmodified wine and on the ethanol
reduced wine prior to bottling.
3.2.5 SO2 content analysis
Free SO2 content of the original wine and the ethanol reduced wine was determined by
the aspiration-oxidation method (Iland et al., 2004).
3.2.6 Cleaning
After each ethanol reduction trial, the RO membrane and evaporative perstractor
membrane were cleaned according to the manufacturers recommended procedure
(Memstar, 2011). Briefly, this process involved flushing with water, circulating a 40 %
sodium hydroxide solution at 45 °C through the system for 10 minutes. The water flush
and sodium hydroxide cleaning steps were repeated until the cleaning solution did not
change colour. Filtered water was circulated through the system and a citric acid
solution (approximately 200 g/L) added until the water was between pH 2.9 and 3.0.
Once the pH had been adjusted the water was circulated for a further 15 minutes.
Finally, the process was rinsed with filtered water without recycling. The ethanol
adjustment unit was cleaned after every trial.
3.2.7 Storage
When the equipment was stored for more than 24 hours, potassium meta bisulfide
(PMS) solution (4 g/L) was circulated through the unit for 10 minutes. During the PMS
solution circulation, citric acid (200 g/L) was added to adjust the pH to between 2.9 and
3.0. Once the pH had been adjusted the unit was stored containing the PMS solution.
65
3.2.8 Bottling of product wine
All the bottles and caps used for preserving the reduced ethanol wine were obtained
from the Charles Sturt University winery. The bottle washing solution contained
potassium meta bisulfite (2 g/L) and tartaric acid (0.5 g/L) made up in deionised water.
Prior to use, bottles were washed by the solution and dried on a bottle drainer. When the
bottles were clean and dry, first pure CO2 was injected into them to reduce the level of
oxygen within the bottle. Then the bottles were filled with reduced ethanol wine and a
small amount of CO2 was injected to disperse O2 from the top of the wine. Finally, the
bottles were sealed with ROPP-T closures using a capping machine (Roll on Pilfer
Proof Aluminium screw capper, Tenco, New South Wales, Australia).
3.3 Experimental design and analysis
The experiments had two variables: wine variety (Chardonnay, Sauvignon Blanc and
Shiraz) and level of ethanol (original, wine reduced to 8 % and 5 % ethanol content).
The experiment was performed in triplicate. That is, in total, 27 ethanol reduction trials
were performed. All the samples after the trials were preserved in the cold room at
16 °C for GC-MS analysis and the consumer preference trial.
3.4 Result and discussion
The ethanol content of the processed wine, treatment time, pH, SO2 content and specific
gravity before and after reduction were recorded for the three varieties of wine during
the ethanol reduction operation.
Table 3.2 contains information about pH and free SO2 for the original, 8 % ethanol and
5 % ethanol wines. From analysis of variance it was found that pH and free SO2 content
both differed significantly between the wine varieties (p<0.05) and differed significantly
depending on the ethanol level (p<0.001). The variety and ethanol level interaction was
significant for the free SO2 content (p<0.0001), but did not significantly affect the pH
(p>0.05). In Table 3.2 it is shown that the free SO2 content decreased for all varieties
during the process, but the magnitude of the pH change was very small for all three
wines. Since the free SO2 level of product wine was reduced through the ethanol
reduction process, the SO2 content of wines were adjusted to prevent undesirable
microbial growth and oxidative reactions.
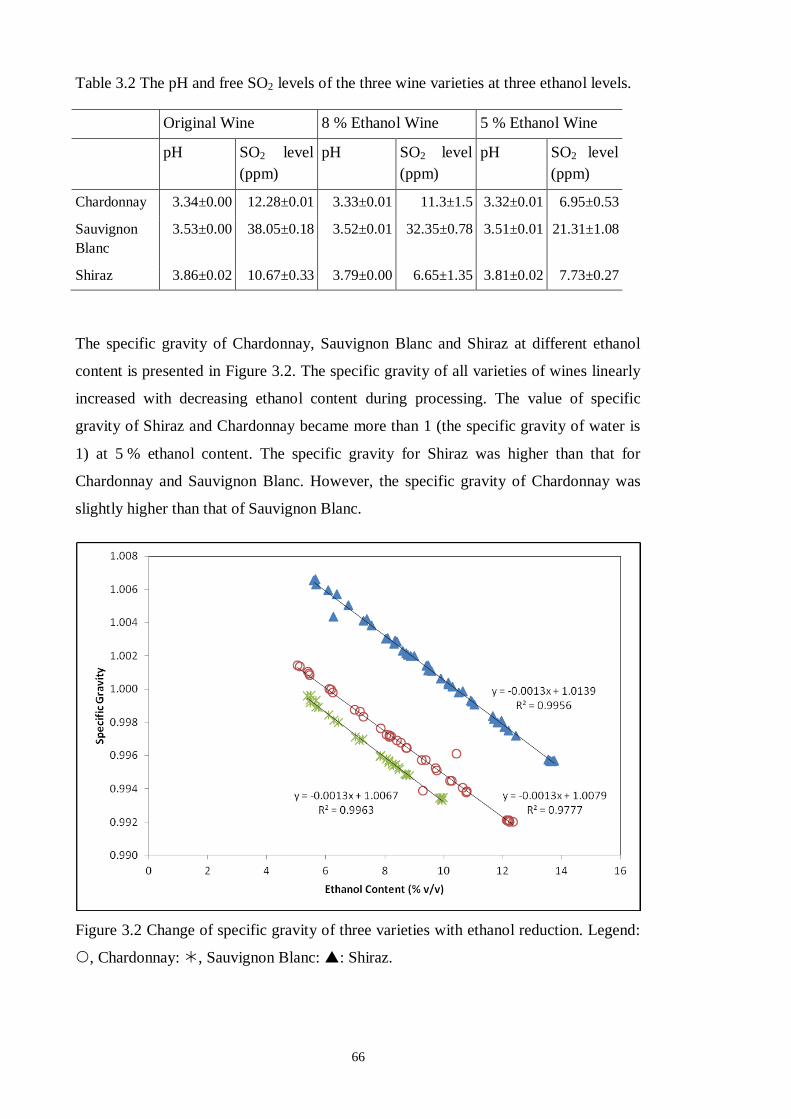
66
Table 3.2 The pH and free SO2 levels of the three wine varieties at three ethanol levels.
Original Wine 8 % Ethanol Wine 5 % Ethanol Wine
pH SO2 level
(ppm)
pH SO2 level
(ppm)
pH SO2 level
(ppm)
Chardonnay 3.34±0.00 12.28±0.01 3.33±0.01 11.3±1.5 3.32±0.01 6.95±0.53
Sauvignon
Blanc
3.53±0.00 38.05±0.18 3.52±0.01 32.35±0.78 3.51±0.01 21.31±1.08
Shiraz 3.86±0.02 10.67±0.33 3.79±0.00 6.65±1.35 3.81±0.02 7.73±0.27
The specific gravity of Chardonnay, Sauvignon Blanc and Shiraz at different ethanol
content is presented in Figure 3.2. The specific gravity of all varieties of wines linearly
increased with decreasing ethanol content during processing. The value of specific
gravity of Shiraz and Chardonnay became more than 1 (the specific gravity of water is
1) at 5 % ethanol content. The specific gravity for Shiraz was higher than that for
Chardonnay and Sauvignon Blanc. However, the specific gravity of Chardonnay was
slightly higher than that of Sauvignon Blanc.
Figure 3.2 Change of specific gravity of three varieties with ethanol reduction. Legend:
, Chardonnay: , Sauvignon Blanc: : Shiraz.
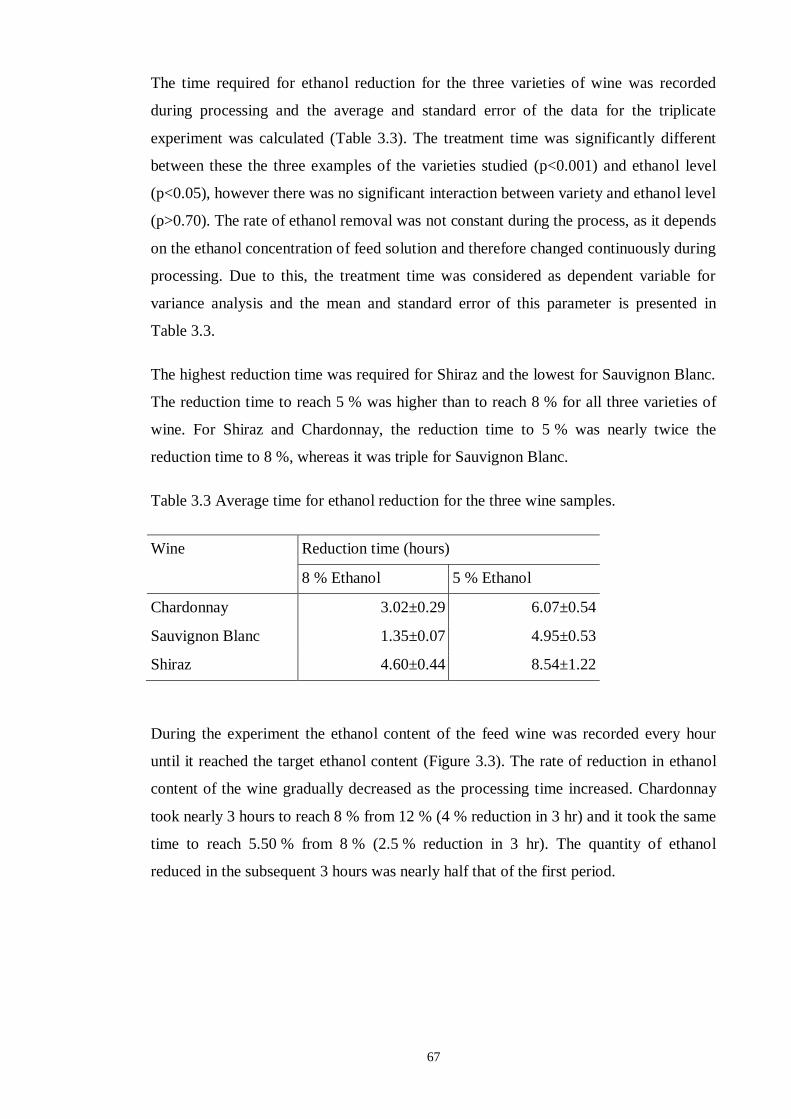
67
The time required for ethanol reduction for the three varieties of wine was recorded
during processing and the average and standard error of the data for the triplicate
experiment was calculated (Table 3.3). The treatment time was significantly different
between these the three examples of the varieties studied (p<0.001) and ethanol level
(p<0.05), however there was no significant interaction between variety and ethanol level
(p>0.70). The rate of ethanol removal was not constant during the process, as it depends
on the ethanol concentration of feed solution and therefore changed continuously during
processing. Due to this, the treatment time was considered as dependent variable for
variance analysis and the mean and standard error of this parameter is presented in
Table 3.3.
The highest reduction time was required for Shiraz and the lowest for Sauvignon Blanc.
The reduction time to reach 5 % was higher than to reach 8 % for all three varieties of
wine. For Shiraz and Chardonnay, the reduction time to 5 % was nearly twice the
reduction time to 8 %, whereas it was triple for Sauvignon Blanc.
Table 3.3 Average time for ethanol reduction for the three wine samples.
Wine Reduction time (hours)
8 % Ethanol 5 % Ethanol
Chardonnay 3.02±0.29 6.07±0.54
Sauvignon Blanc 1.35±0.07 4.95±0.53
Shiraz 4.60±0.44 8.54±1.22
During the experiment the ethanol content of the feed wine was recorded every hour
until it reached the target ethanol content (Figure 3.3). The rate of reduction in ethanol
content of the wine gradually decreased as the processing time increased. Chardonnay
took nearly 3 hours to reach 8 % from 12 % (4 % reduction in 3 hr) and it took the same
time to reach 5.50 % from 8 % (2.5 % reduction in 3 hr). The quantity of ethanol
reduced in the subsequent 3 hours was nearly half that of the first period.
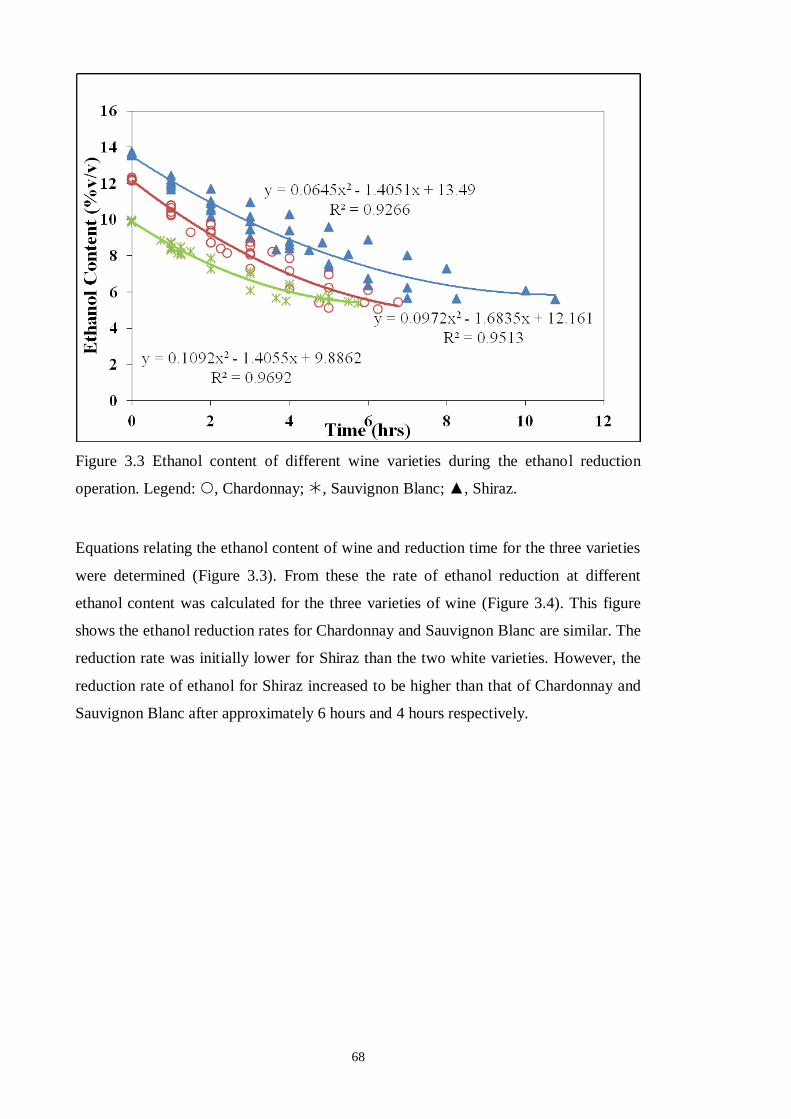
68
Figure 3.3 Ethanol content of different wine varieties during the ethanol reduction
operation. Legend: , Chardonnay; , Sauvignon Blanc; ▲, Shiraz.
Equations relating the ethanol content of wine and reduction time for the three varieties
were determined (Figure 3.3). From these the rate of ethanol reduction at different
ethanol content was calculated for the three varieties of wine (Figure 3.4). This figure
shows the ethanol reduction rates for Chardonnay and Sauvignon Blanc are similar. The
reduction rate was initially lower for Shiraz than the two white varieties. However, the
reduction rate of ethanol for Shiraz increased to be higher than that of Chardonnay and
Sauvignon Blanc after approximately 6 hours and 4 hours respectively.
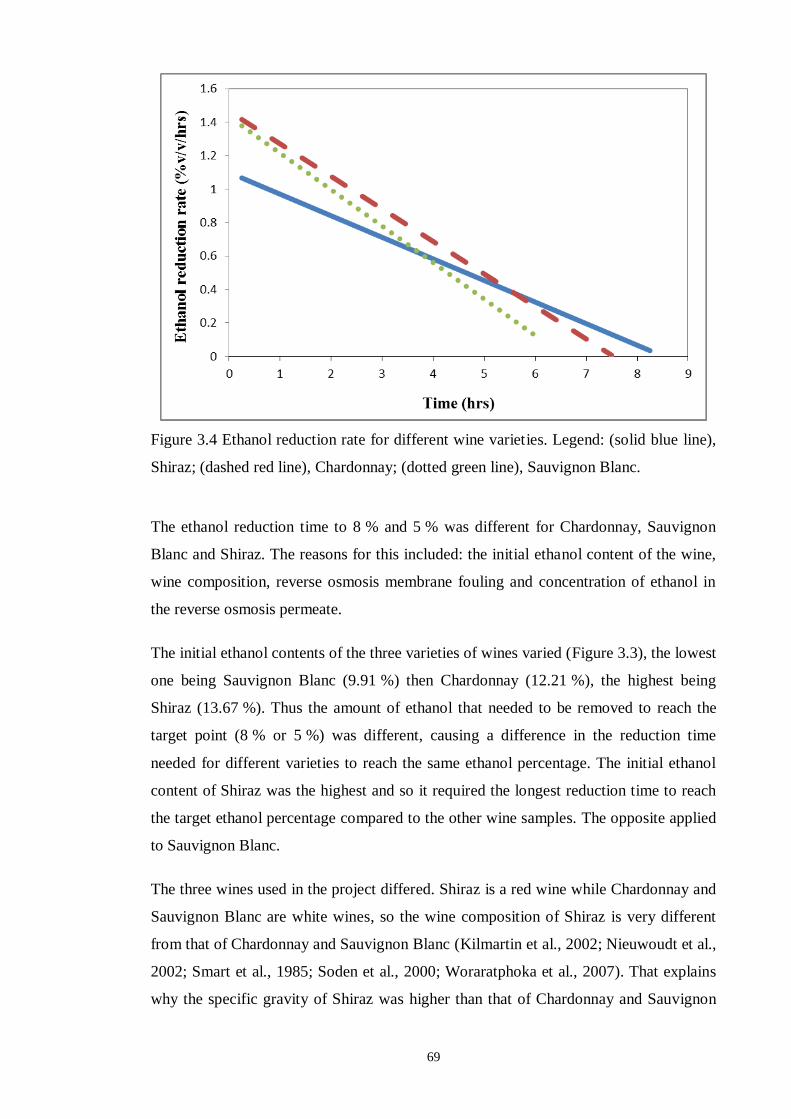
69
Figure 3.4 Ethanol reduction rate for different wine varieties. Legend: (solid blue line),
Shiraz; (dashed red line), Chardonnay; (dotted green line), Sauvignon Blanc.
The ethanol reduction time to 8 % and 5 % was different for Chardonnay, Sauvignon
Blanc and Shiraz. The reasons for this included: the initial ethanol content of the wine,
wine composition, reverse osmosis membrane fouling and concentration of ethanol in
the reverse osmosis permeate.
The initial ethanol contents of the three varieties of wines varied (Figure 3.3), the lowest
one being Sauvignon Blanc (9.91 %) then Chardonnay (12.21 %), the highest being
Shiraz (13.67 %). Thus the amount of ethanol that needed to be removed to reach the
target point (8 % or 5 %) was different, causing a difference in the reduction time
needed for different varieties to reach the same ethanol percentage. The initial ethanol
content of Shiraz was the highest and so it required the longest reduction time to reach
the target ethanol percentage compared to the other wine samples. The opposite applied
to Sauvignon Blanc.
The three wines used in the project differed. Shiraz is a red wine while Chardonnay and
Sauvignon Blanc are white wines, so the wine composition of Shiraz is very different
from that of Chardonnay and Sauvignon Blanc (Kilmartin et al., 2002; Nieuwoudt et al.,
2002; Smart et al., 1985; Soden et al., 2000; Woraratphoka et al., 2007). That explains
why the specific gravity of Shiraz was higher than that of Chardonnay and Sauvignon
70
Blanc (Figure 3.2), while there is not much difference in the specific gravity of
Chardonnay and Sauvignon Blanc.
In the reverse osmosis process, the permeate flux (N) is directly proportional to the
difference between the transmembrane hydrostatic (ΔP) and the osmotic pressure
difference (ΔΠ) (Equation 3.1).
N = Kp (ΔP – ΔΠ) Equation 3.1
Where, Kp is the permeability coefficient of the membrane.
The osmotic pressure (Π) varies linearly with the concentration of the solution (c)
(Equation 3.2).
Π = cRT/M Equation 3.2
Where, R is the gas constant, T is absolute temperature and M is molecular weight
(Singh & Heldman, 2008).
During the trials, the transmembrane pressure was kept almost constant, so the
permeation rate depends on the osmotic pressure which may differ between wines or
over the course of the reduction process as the composition of the wine entering the
reverse osmosis unit changed. In addition, membrane fouling during reverse osmosis
might cause the process to be slower by decreasing the driving force of the process
(Cuperus & Nijhuis, 1993).
In the previous section, it was mentioned that the reduction technique involves two
processes, i.e. reverse osmosis and evaporative perstraction. The latter process is
intended only for ethanol separation from the reverse osmosis permeate and for
recycling the treated permeate to the wine feed tank. This process involves the
migration of ethanol across hydrophobic membranes driven by vapour pressure
difference across the membranes as a result of difference of ethanol concentration
between the two sides of the membrane (Wollan, 2010). Thus, the existing ethanol
concentration of the processed wine affects the overall reduction process. As the
operation was performed to reduce ethanol, it resulted in the lowering of the ethanol
concentration in the processed wine as well as in the reverse osmosis permeate with
time. Consequently, the difference in ethanol concentration between the two sides of the
membrane was decreasing which made the separation process slower over time (Figure
71
3.3). That is why the ethanol reduction to 5 % required much more time than to 8 % for
all varieties. This fact also helped to understand the result observed in Figure 3.4. From
Figure 3.3, the ethanol reduction unit seems to have a practical limit of approximately
5 %. Chardonnay and Sauvignon Blanc reached that limit faster than Shiraz because
initially ethanol was removed more rapidly from Chardonnay and Sauvignon Blanc than
Shiraz. As the ethanol content of Chardonnay and Sauvignon Blanc approached the
practical limit of 5 % ethanol, the higher ethanol content still in Shiraz meant it had a
higher ethanol reduction rate after 3.75 hr (Sauvignon Blanc) and 5.5 hr (Chardonnay)
(Figure 3.4).The difference in slope between Chardonnay and Sauvignon Blanc was
small, indicating that the ethanol reduction rate for Chardonnay and Sauvignon Blanc
was similar.
In summary, reducing the ethanol content of wine can be influenced by these factors
and can result in significant differences in reduction time for different ethanol levels as
well as for wine variety. The change in pH and free SO2 content was statistically
significant. In a wine manufacturing context, the pH difference was insignificant
whereas the free SO2 level clearly reduced in the wines during the reverse osmosis and
evaporative perstraction process. Consequently, the concentration of SO2 must be
corrected to ensure wines are microbially stable and to limit oxidation.
72
Chapter 4 SPME GC-MS Method Development for
Headspace Analysis of Different Ethanol
Content Wine
4.1 Introduction
Gas chromatography/mass spectrometry (GC-MS) has an important role in the flavour
and fragrance analysis of food. The headspace composition of volatile compounds of
food or beverages indicates the availability of volatiles for the aroma or flavour of that
particular product. Analytical measurement of flavour volatility in the presence or
absence of various food components has been used to provide important information on
interactions between flavour compounds and food matrices (Jung & Ebeler, 2002).
Flavour chemists and scientists are conducting research on the headspace composition
of different products not only to understand their interactions but also to determine
which important volatile components contribute the most to the flavour of the product.
Commercial use of this information will help to increase consumers’ acceptance of the
product.
Gas chromatography (GC) was introduced in 1951 and it has been used for headspace
analysis for over 60 years (James & Martin, 1952; Snow & Slack, 2002). To analyse
volatile compounds, it is necessary to use a detector coupled with GC. GC coupled with
a mass spectrometry (MS) detector, allows the tentative identification of eluting volatile
compounds, by matching the fragmentation pattern and molecular ion obtained by MS
with specialist computerised reference libraries of such information. The peak area can
be determined by comparison with a peak of known amounts of a pure compound in the
sample. Thus, a substantial number of volatile compounds can be detected and
measured by analysing the peaks produced by GC-MS (Capone, et al., 2013; Gürbüz, et
al., 2006; Hayasaka et al., 2005; Jung & Ebeler, 2002; Rebière, et al., 2010).
Headspace analysis can be defined as vapour phase extraction, involving separation of
the analytes between the non-volatile liquid or solid phase and the vapour phase above
the liquid or solid phase. It is expected that the vapour phase contains the required
flavour compounds and that mixture is transferred to GC-MS for analysis. A sample
preparation technique is necessary to isolate the compounds of interest from the sample
matrix, as well as to purify and concentrate the analytes. There are a number of
73
techniques for sampling headspace vapours, including Static Headspace Extraction
(SHE), Dynamic Headspace Extraction (purge and trap), Liquid Liquid Extraction
(LLE), Solid Phase Extraction (SPE) and Solid Phase Microextraction (SPME). These
can be combined with a specific volume of GC injection for enhanced sensitivity (Mitra,
2004; Rebière, et al., 2010). Among these techniques, SPME is used as a solvent free
sample preparation and concentration step prior to analysis. LLE and SPE require multi-
steps and are time–consuming and often cause loss of analytes during the process.
SPME has overcome some of these disadvantages and offers a simplified sample
preparation technique for quantification. This technique was first introduced by Arthur
and Pawliszyn in 1990 and is now widely used for volatile compound analysis in food,
drug and environmental studies (de Fátima Alpendurada, 2000; Snow & Slack, 2002;
Zhang et al., 1994).
The SPME technique has rapidly grown in popularity for various applications. The
method is sufficiently sensitive to absorb small amounts of volatile compounds and the
wide range of fibre allows analysis of a diverse array of compounds (Rebière, et al.,
2010). SPME is very sensitive to experimental conditions compared to other sample
preparation techniques. This technique consists of two steps: partitioning of analytes
between the coating and the sample and the desorption of concentrated analytes into an
analytical instrument (Zhang, et al., 1994). Any change in experimental parameters that
affects the distribution coefficient and the sorption rate will also influence the quantity
absorbed on the SPME fibre and the corresponding sensitivity and reproducibility. The
partition of volatile compounds between the headspace sample and the SPME coating
depends on the exposure time, temperature, sample volume, concentration, type and
uniformity of the matrix (Rocha et al., 2001). In wine-aroma research it was found that,
the headspace composition of wine was influenced by other major volatile or non-
volatile components present in wine (Villamor & Ross, 2013). It was also reported that
change of ethanol concentration in wine altered the partition-coefficient of volatiles and
consequently caused change in headspace composition of wine (Voilley, et al., 1991).
As the study was carried out to evaluate the effect of ethanol concentration change on
wine headspace composition, SPME is the most appropriate sample preparation
technique comparing other existing techniques to analyse the interaction between aroma
compounds and ethanol concentration in wine. Important SPME parameters, such as
extraction time, extraction temperature and sample volume were also investigated to
optimise the method for headspace composition analysis of wine.
74
SPME combined with GC-MS can be a significant tool for wine aroma research and its
quality control analysis (Whiton & Zoecklein, 2000). As the volatile compounds
contributing to wine aroma are very important to wine flavour as well as to its entire
quality, many studies on the analysis of wine volatiles (Ferreira et al., 2000; Guth,
1997b; Rebière, et al., 2010) and their interaction with the other compounds (Aronson &
Ebeler, 2004; Dufour & Bayonove, 1999a; Dufour & Sauvaitre, 2000) in the wine
matrix have been performed and are also continuing.
Wine flavour is the result of an extreme multi-mix of numerous volatile compounds
belonging to different chemical classes. Subtle differences in the relative amount of
these compounds often characterise wine flavour and create the differences found
among the vast number of wine styles (Capone, et al., 2013). The headspace
concentration of aroma compounds in wine depends on the volatility and solubility of
these compounds. This phenomenon is often influenced by the other wine constituents
present in the wine matrix (Pozo-Bayón & Reineccius, 2009). Ethanol, one of the major
components in wine, significantly influences the headspace composition as well as wine
aroma (Goldner, et al., 2009). Ethanol causes change in solution polarity which affects
the volatility of flavour compounds in wine. Moreover, any process employed to reduce
ethanol from wine affects wine volatiles and other compounds which results in
degradation of wine flavour and taste (Aguera, et al., 2010; Diban, et al., 2008;
Pickering, et al., 1999a; Ugarte, et al., 2005). The intensity of the effect depends on the
nature of the applied process (Schmidtke et al., 2011). In a previous study it was
reported that the addition of ethanol in wine decreases the volatility of aroma
compounds (Voilley, et al., 1991). However, other studies showed that the presence of a
higher ethanol concentration in the solution helps to maintain headspace concentration
of volatiles (Tsachaki, et al., 2005). Thus the nature of the interaction between ethanol
content and the volatility of aroma compounds is a matter of interest for producing
wines containing different amounts of ethanol.
Wine flavour is a key parameter of wine quality and it is a challenging issue to maintain
the flavour or aroma of the reduced ethanol wine compared to the original. To meet the
challenge, it is essential to determine the changes occurred in the headspace
composition of key aroma compounds of wine due to ethanol reduction. This will
provide important information to the wine industry regarding the effect of ethanol
reduction on wine aroma from a chemical perspective. Numerous papers are available
on different ethanol reduction processes (Aguera, et al., 2010; Catarino & Mendes,
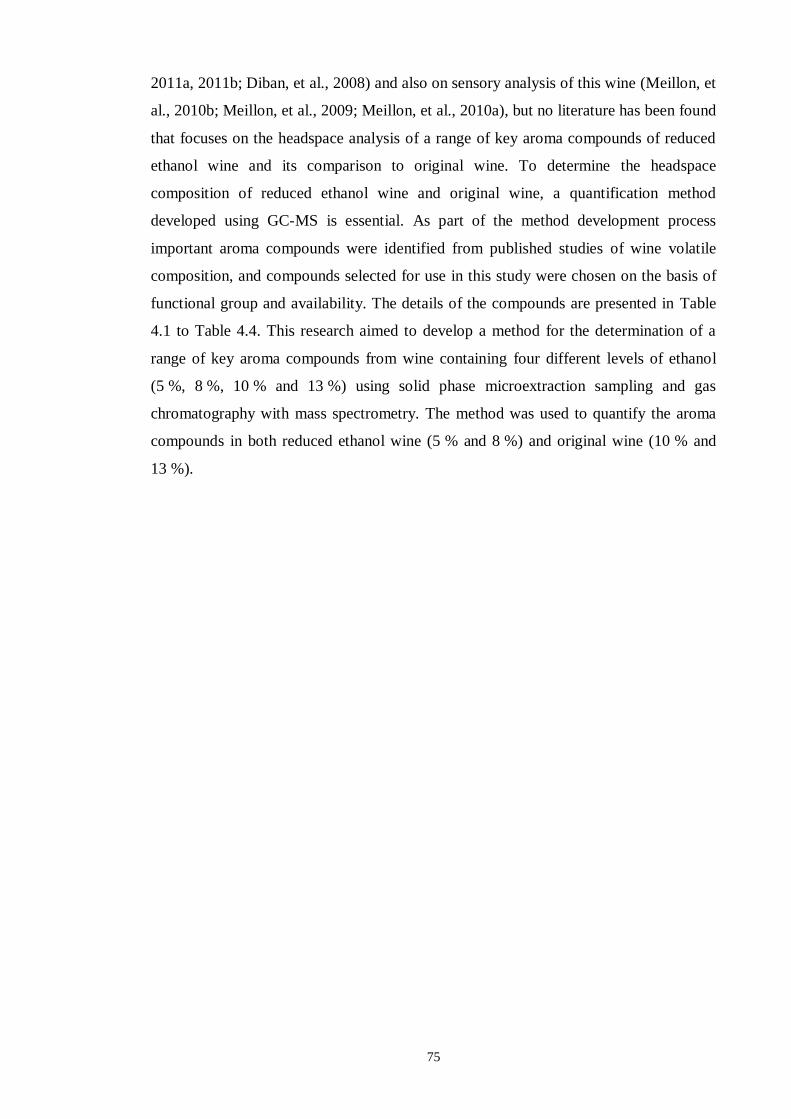
75
2011a, 2011b; Diban, et al., 2008) and also on sensory analysis of this wine (Meillon, et
al., 2010b; Meillon, et al., 2009; Meillon, et al., 2010a), but no literature has been found
that focuses on the headspace analysis of a range of key aroma compounds of reduced
ethanol wine and its comparison to original wine. To determine the headspace
composition of reduced ethanol wine and original wine, a quantification method
developed using GC-MS is essential. As part of the method development process
important aroma compounds were identified from published studies of wine volatile
composition, and compounds selected for use in this study were chosen on the basis of
functional group and availability. The details of the compounds are presented in Table
4.1 to Table 4.4. This research aimed to develop a method for the determination of a
range of key aroma compounds from wine containing four different levels of ethanol
(5 %, 8 %, 10 % and 13 %) using solid phase microextraction sampling and gas
chromatography with mass spectrometry. The method was used to quantify the aroma
compounds in both reduced ethanol wine (5 % and 8 %) and original wine (10 % and
13 %).
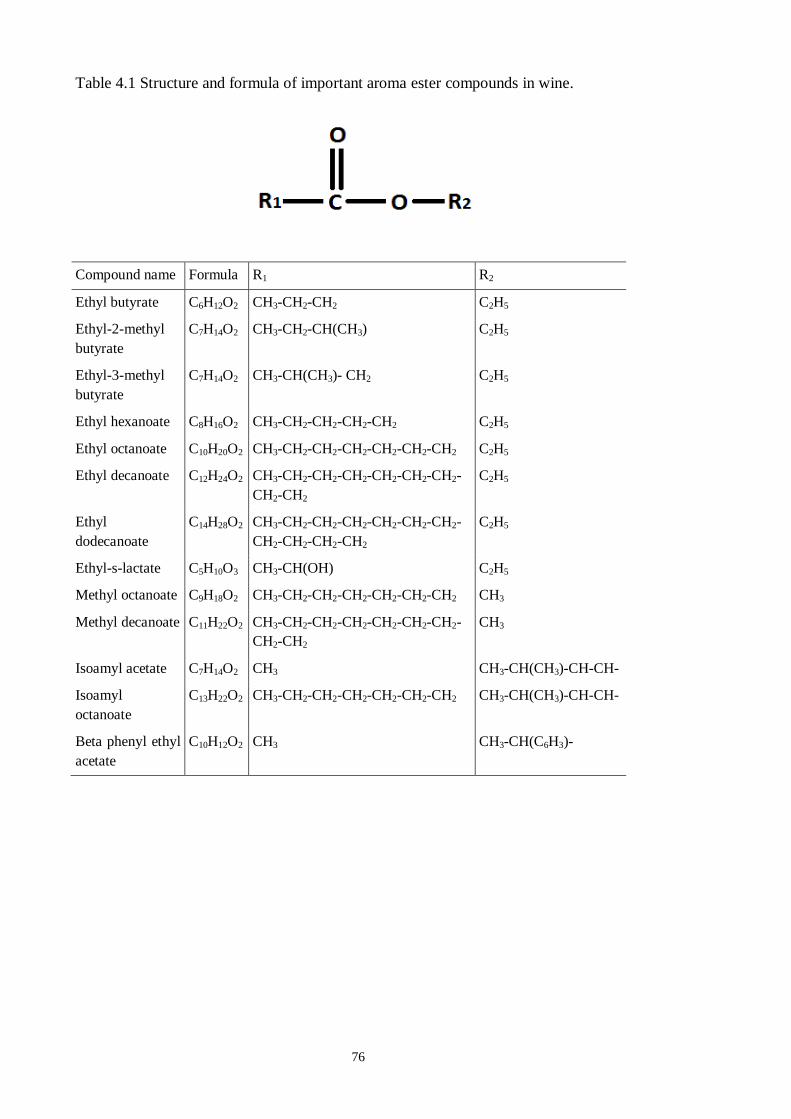
76
Table 4.1 Structure and formula of important aroma ester compounds in wine.
Compound name Formula R1 R2
Ethyl butyrate C6H12O2 CH3-CH2-CH2 C2H5
Ethyl-2-methyl
butyrate
C7H14O2 CH3-CH2-CH(CH3) C2H5
Ethyl-3-methyl
butyrate
C7H14O2 CH3-CH(CH3)- CH2 C2H5
Ethyl hexanoate C8H16O2 CH3-CH2-CH2-CH2-CH2 C2H5
Ethyl octanoate C10H20O2 CH3-CH2-CH2-CH2-CH2-CH2-CH2 C2H5
Ethyl decanoate C12H24O2 CH3-CH2-CH2-CH2-CH2-CH2-CH2-
CH2-CH2
C2H5
Ethyl
dodecanoate
C14H28O2 CH3-CH2-CH2-CH2-CH2-CH2-CH2-
CH2-CH2-CH2-CH2
C2H5
Ethyl-s-lactate C5H10O3 CH3-CH(OH) C2H5
Methyl octanoate C9H18O2 CH3-CH2-CH2-CH2-CH2-CH2-CH2 CH3
Methyl decanoate C11H22O2 CH3-CH2-CH2-CH2-CH2-CH2-CH2-
CH2-CH2
CH3
Isoamyl acetate C7H14O2 CH3 CH3-CH(CH3)-CH-CH-
Isoamyl
octanoate
C13H22O2 CH3-CH2-CH2-CH2-CH2-CH2-CH2 CH3-CH(CH3)-CH-CH-
Beta phenyl ethyl
acetate
C10H12O2 CH3 CH3-CH(C6H3)-
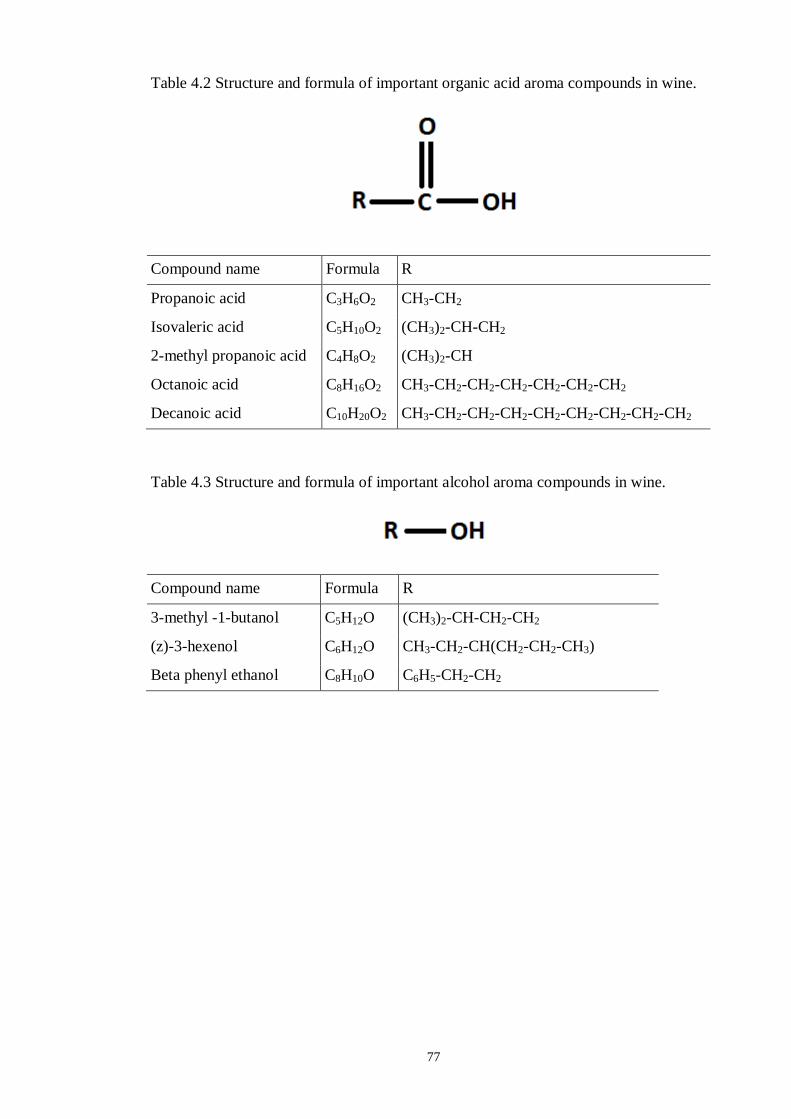
77
Table 4.2 Structure and formula of important organic acid aroma compounds in wine.
Compound name Formula R
Propanoic acid C3H6O2 CH3-CH2
Isovaleric acid C5H10O2 (CH3)2-CH-CH2
2-methyl propanoic acid C4H8O2 (CH3)2-CH
Octanoic acid C8H16O2 CH3-CH2-CH2-CH2-CH2-CH2-CH2
Decanoic acid C10H20O2 CH3-CH2-CH2-CH2-CH2-CH2-CH2-CH2-CH2
Table 4.3 Structure and formula of important alcohol aroma compounds in wine.
Compound name Formula R
3-methyl -1-butanol C5H12O (CH3)2-CH-CH2-CH2
(z)-3-hexenol C6H12O CH3-CH2-CH(CH2-CH2-CH3)
Beta phenyl ethanol C8H10O C6H5-CH2-CH2
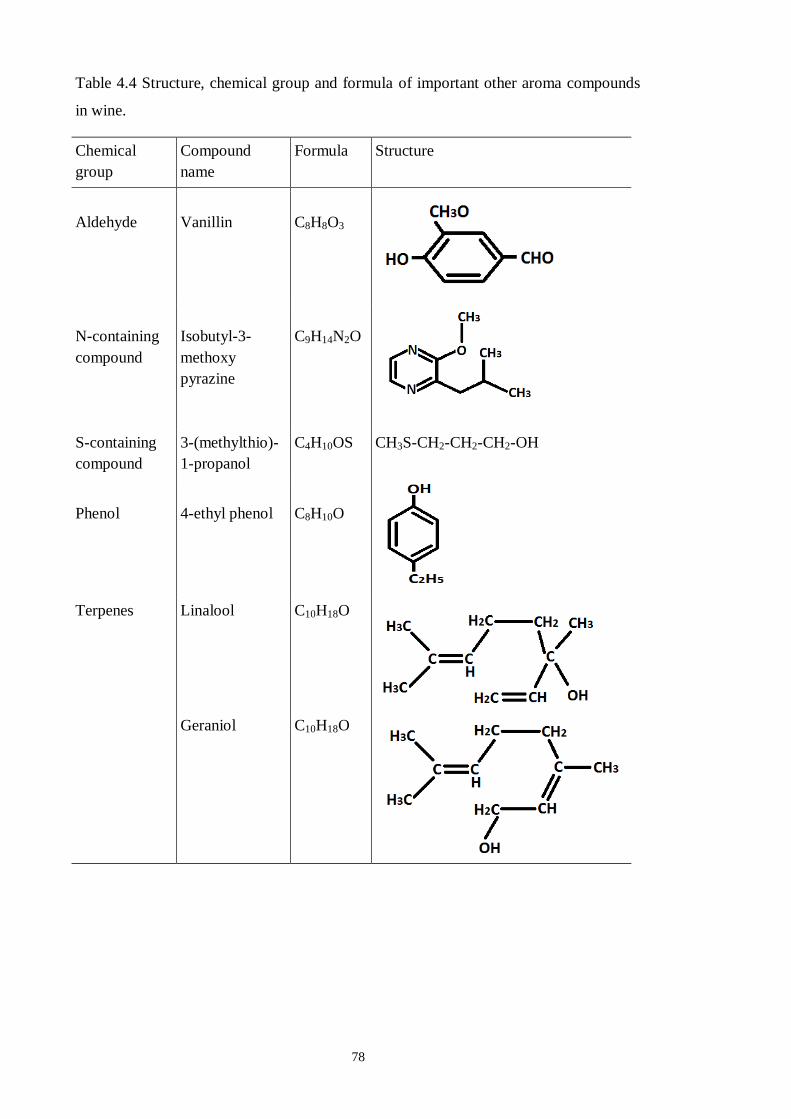
78
Table 4.4 Structure, chemical group and formula of important other aroma compounds
in wine.
Chemical
group
Compound
name
Formula Structure
Aldehyde
Vanillin
C8H8O3
N-containing
compound
Isobutyl-3-
methoxy
pyrazine
C9H14N2O
S-containing
compound
3-(methylthio)-
1-propanol
C4H10OS CH3S-CH2-CH2-CH2-OH
Phenol
4-ethyl phenol
C8H10O
Terpenes Linalool C10H18O
Geraniol C10H18O
79
4.2 Materials and method
4.2.1 Chemicals and reagents
Chemicals and reagents for the preparation of standard solutions for GC-MS analysis
were used without further purification. Information on the suppliers of the reagents and
internal standard compounds, their chemical and odour properties are presented in Table
4.5. Ethanol (product no. 20821.321, analytical grade, VWR, Prolabo, France), L-(+)
tartaric acid (Reidel de-Haën, 99.5 %), and potassium hydrogen tartrate (BDH, 99.5 %)
were used for preparation of model wine base solutions. Deionised water was obtained
from a mixed bed resin system (200 kΩ-cm, 25 °C).
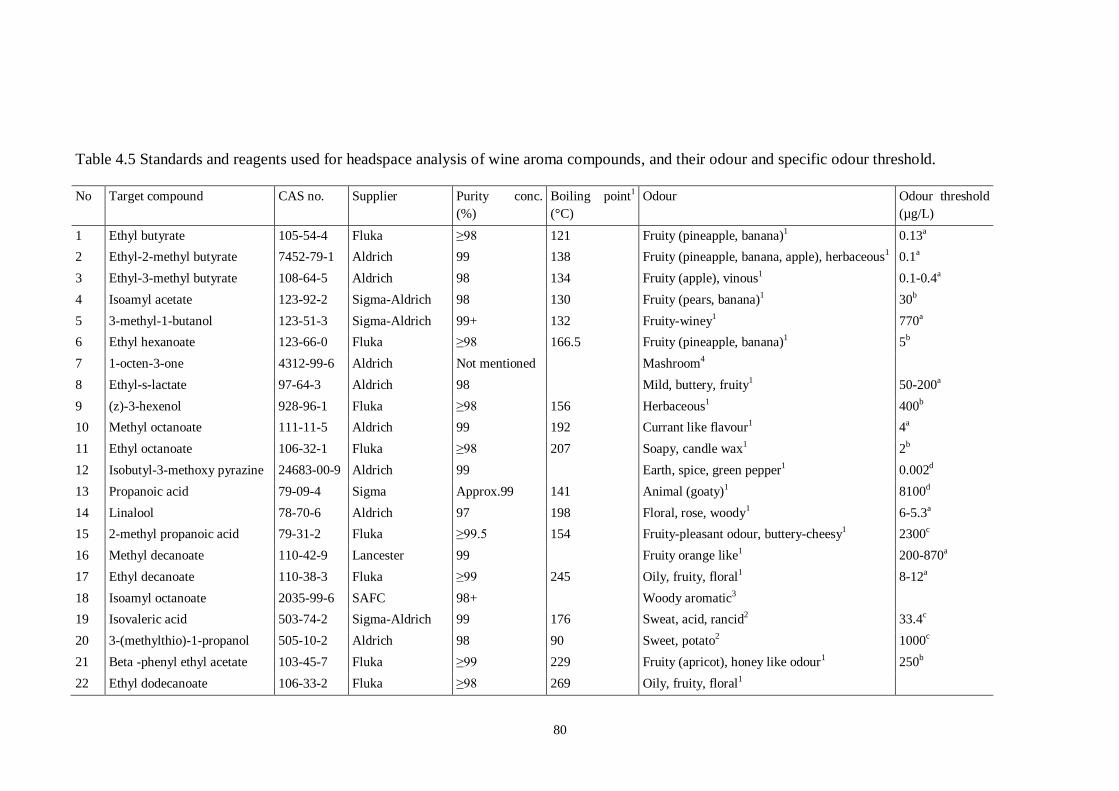
80
Table 4.5 Standards and reagents used for headspace analysis of wine aroma compounds, and their odour and specific odour threshold.
No Target compound CAS no. Supplier Purity conc.
(%)
Boiling point1
(°C)
Odour Odour threshold
(µg/L)
1 Ethyl butyrate 105-54-4 Fluka ≥ 8 121 Fruity (pineapple, banana)1 0.13a
2 Ethyl-2-methyl butyrate 7452-79-1 Aldrich 99 138 Fruity (pineapple, banana, apple), herbaceous1 0.1a
3 Ethyl-3-methyl butyrate 108-64-5 Aldrich 98 134 Fruity (apple), vinous1 0.1-0.4a
4 Isoamyl acetate 123-92-2 Sigma-Aldrich 98 130 Fruity (pears, banana)1 30b
5 3-methyl-1-butanol 123-51-3 Sigma-Aldrich 99+ 132 Fruity-winey1 770a
6 Ethyl hexanoate 123-66-0 Fluka ≥ 8 166.5 Fruity (pineapple, banana)1 5b
7 1-octen-3-one 4312-99-6 Aldrich Not mentioned Mashroom4
8 Ethyl-s-lactate 97-64-3 Aldrich 98 Mild, buttery, fruity1 50-200a
9 (z)-3-hexenol 928-96-1 Fluka ≥ 8 156 Herbaceous1 400b
10 Methyl octanoate 111-11-5 Aldrich 99 192 Currant like flavour1 4a
11 Ethyl octanoate 106-32-1 Fluka ≥ 8 207 Soapy, candle wax1 2b
12 Isobutyl-3-methoxy pyrazine 24683-00-9 Aldrich 99 Earth, spice, green pepper1 0.002d
13 Propanoic acid 79-09-4 Sigma Approx.99 141 Animal (goaty)1 8100d
14 Linalool 78-70-6 Aldrich 97 198 Floral, rose, woody1 6-5.3
a
15 2-methyl propanoic acid 79-31-2 Fluka ≥ .5 154 Fruity-pleasant odour, buttery-cheesy1 2300c
16 Methyl decanoate 110-42-9 Lancester 99 Fruity orange like1 200-870a
17 Ethyl decanoate 110-38-3 Fluka ≥ 245 Oily, fruity, floral1 8-12a
18 Isoamyl octanoate 2035-99-6 SAFC 98+ Woody aromatic3
19 Isovaleric acid 503-74-2 Sigma-Aldrich 99 176 Sweat, acid, rancid2 33.4c
20 3-(methylthio)-1-propanol 505-10-2 Aldrich 98 90 Sweet, potato2 1000c
21 Beta -phenyl ethyl acetate 103-45-7 Fluka ≥ 229 Fruity (apricot), honey like odour1 250b
22 Ethyl dodecanoate 106-33-2 Fluka ≥ 8 269 Oily, fruity, floral1
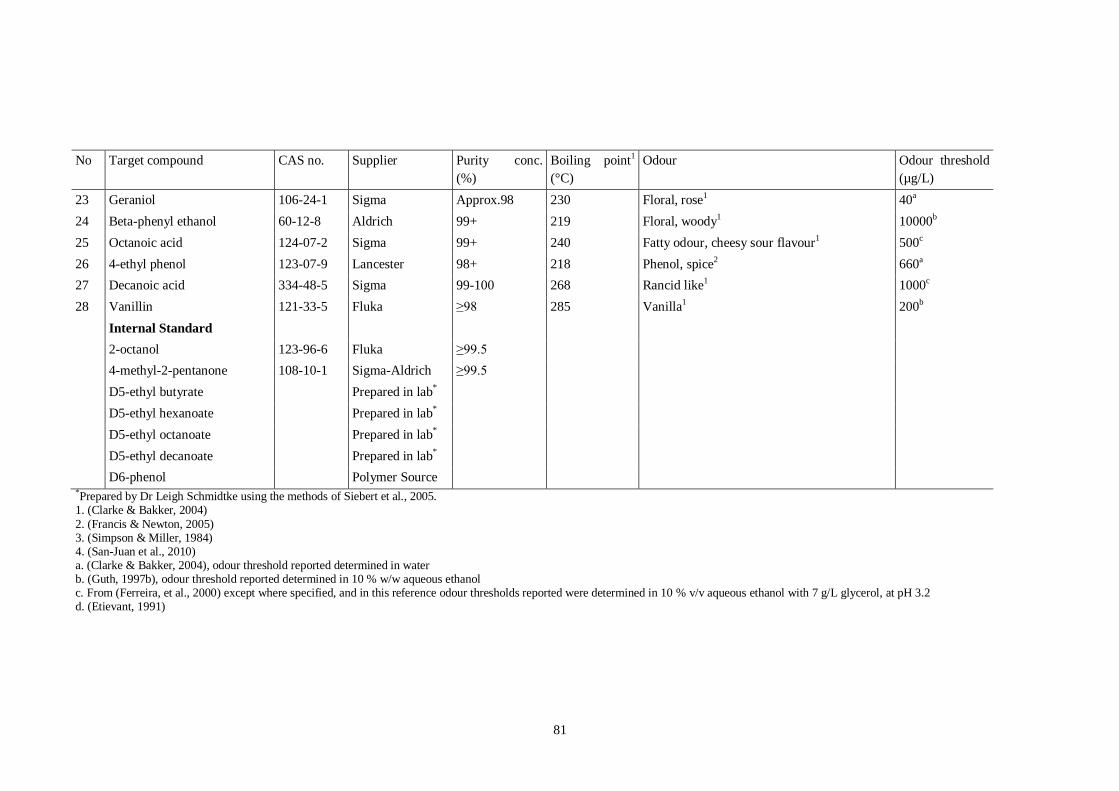
81
No Target compound CAS no. Supplier Purity conc.
(%)
Boiling point1
(°C)
Odour Odour threshold
(µg/L)
23 Geraniol 106-24-1 Sigma Approx.98 230 Floral, rose1 40a
24 Beta-phenyl ethanol 60-12-8 Aldrich 99+ 219 Floral, woody1 10000b
25 Octanoic acid 124-07-2 Sigma 99+ 240 Fatty odour, cheesy sour flavour1 500c
26 4-ethyl phenol 123-07-9 Lancester 98+ 218 Phenol, spice2 660a
27 Decanoic acid 334-48-5 Sigma 99-100 268 Rancid like1 1000c
28 Vanillin 121-33-5 Fluka ≥ 8 285 Vanilla1 200b
Internal Standard
2-octanol 123-96-6 Fluka ≥ .5
4-methyl-2-pentanone 108-10-1 Sigma-Aldrich ≥ .5
D5-ethyl butyrate Prepared in lab*
D5-ethyl hexanoate Prepared in lab*
D5-ethyl octanoate Prepared in lab*
D5-ethyl decanoate Prepared in lab*
D6-phenol Polymer Source *Prepared by Dr Leigh Schmidtke using the methods of Siebert et al., 2005. 1. (Clarke & Bakker, 2004)
2. (Francis & Newton, 2005) 3. (Simpson & Miller, 1984) 4. (San-Juan et al., 2010) a. (Clarke & Bakker, 2004), odour threshold reported determined in water b. (Guth, 1997b), odour threshold reported determined in 10 % w/w aqueous ethanol c. From (Ferreira, et al., 2000) except where specified, and in this reference odour thresholds reported were determined in 10 % v/v aqueous ethanol with 7 g/L glycerol, at pH 3.2 d. (Etievant, 1991)
82
4.2.2 Method development
An Agilent 7890A gas chromatograph, equipped with Gerstel multipurpose sampler
with automated solid phase microextraction capability, Peltier cooled sample tray,
interfaced to an Aglient 5975C triple axis mass detector was used for confirmation of
compound identity, method development and also for final sample analysis. MSD
chemstation (E.02.00.493, Agilent Technologies Ltd.) was used for data interrogation
and peak area integration. Mass spectra were compared against the NIST 2008 Mass
Spectral Library for compound identity confirmation. Samples prepared for injection
were placed in the Peltier cooled sample tray set at 8 °C. A fused silica capillary column
(DB-Waxtr, 60 m × 0.25 mm id 0.25 µm film thickness) was used for compound
separation in the gas-chromatograph. The injector was held at 260 °C in splitless mode
with a 2 mm ID Borosilicate liner (Agilent). The 50/30 µm
divinylbenzene/caeboxen/polydimethylsiloxane (DVB/CAR/PDMS) fibre was obtained
from Supelco (Bellafonte, USA) for SPME injection of the prepared samples. Samples
were desorbed from the fibre for 1 minute and the fibre cleansed by insertion into a
second injector at 270 °C for 5 minutes. The oven temperature program was: hold at
40 °C for 5 minutes and then increase to 230 °C at a rate of 6 °C per minute, and hold at
230 °C for 8.33 minutes. The total run time was 45 minutes. The flow rate of ultra pure
helium gas was constant at 1 mL per minute. The MS source, quadrapole and transfer
line temperatures were set to 230 °C, 150 °C and 275 °C respectively and compounds
were detected by selective ion monitoring method (Table 4.6).
4.2.3 Compound identification with SPME fibre
The solutions of all listed compounds (Table 4.5) were prepared with model wine base
at 5 % ethanol content for identification of these compounds with SPME fibre in the
GC-MS instrument. Tartaric acid (0.008 M) and potassium hydrogen tartrate (0.011 M)
were used to make up the model wine base solution. The fibre was preconditioned
according to the manufacturers’ instructions before use (at 270 °C for 60 minutes) and
two blank analytical desorptions were performed before the actual sample test. Samples
(10 mL) were placed in a 20 mL clear round vial, closed with magnetic PTFE/silicone
screw caps and were placed into the Peltier cooler tray for analysis. Sample vials were
held in an incubator, set to 50 °C, equilibrated for 20 minutes before the insertion of the
SPME fibre in the sample vial headspace for 20 minutes with agitation. The agitator
speed was 250 rpm. The target compounds were identified by using the fragment ion
pattern of each compound and comparing this to the NIST MS search Library. Then the
83
target ions and retention time of all compounds were determined for all target
compounds for quantification. This data is summarised in Table 4.6.
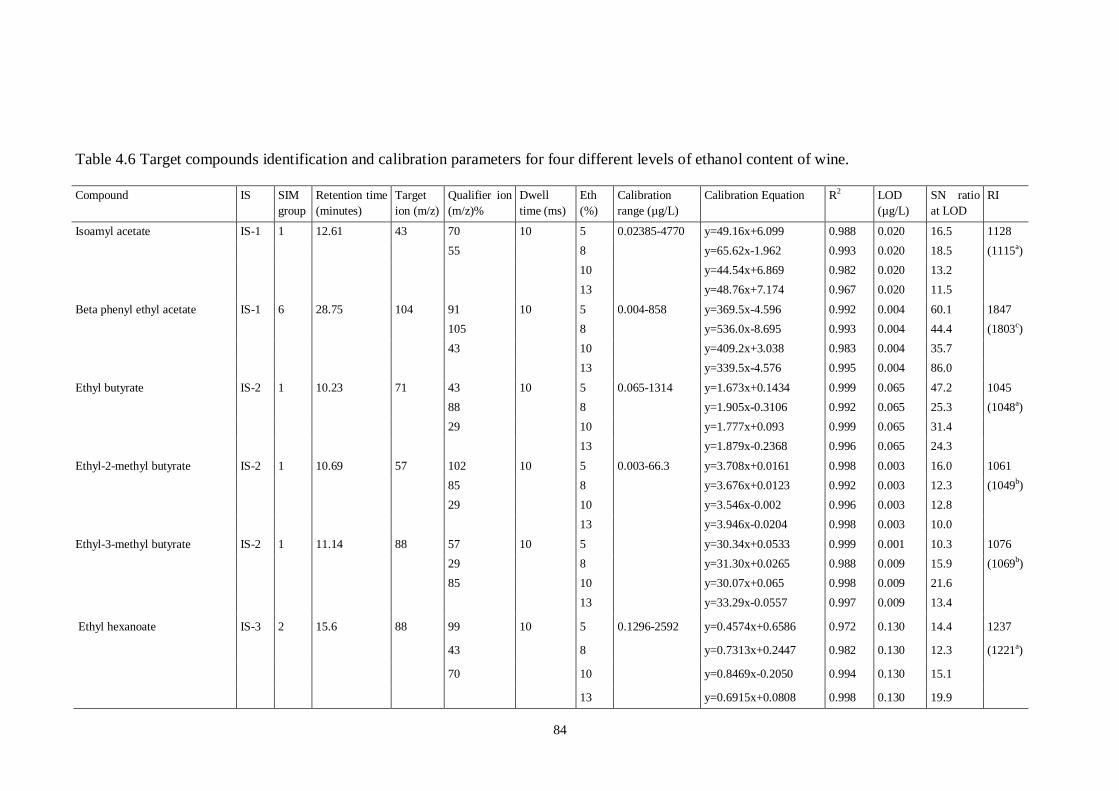
84
Table 4.6 Target compounds identification and calibration parameters for four different levels of ethanol content of wine.
Compound IS SIM
group
Retention time
(minutes)
Target
ion (m/z)
Qualifier ion
(m/z)%
Dwell
time (ms)
Eth
(%)
Calibration
range (µg/L)
Calibration Equation R2 LOD
(µg/L)
SN ratio
at LOD
RI
Isoamyl acetate IS-1 1 12.61 43 70 10 5 0.02385-4770 y=49.16x+6.099 0.988 0.020 16.5 1128
55 8 y=65.62x-1.962 0.993 0.020 18.5 (1115a)
10 y=44.54x+6.869 0.982 0.020 13.2
13 y=48.76x+7.174 0.967 0.020 11.5
Beta phenyl ethyl acetate IS-1 6 28.75 104 91 10 5 0.004-858 y=369.5x-4.596 0.992 0.004 60.1 1847
105 8 y=536.0x-8.695 0.993 0.004 44.4 (1803c)
43 10 y=409.2x+3.038 0.983 0.004 35.7
13 y=339.5x-4.576 0.995 0.004 86.0
Ethyl butyrate IS-2 1 10.23 71 43 10 5 0.065-1314 y=1.673x+0.1434 0.999 0.065 47.2 1045
88 8 y=1.905x-0.3106 0.992 0.065 25.3 (1048a)
29 10 y=1.777x+0.093 0.999 0.065 31.4
13 y=1.879x-0.2368 0.996 0.065 24.3
Ethyl-2-methyl butyrate IS-2 1 10.69 57 102 10 5 0.003-66.3 y=3.708x+0.0161 0.998 0.003 16.0 1061
85 8 y=3.676x+0.0123 0.992 0.003 12.3 (1049b)
29 10 y=3.546x-0.002 0.996 0.003 12.8
13 y=3.946x-0.0204 0.998 0.003 10.0
Ethyl-3-methyl butyrate IS-2 1 11.14 88 57 10 5 y=30.34x+0.0533 0.999 0.001 10.3 1076
29 8 y=31.30x+0.0265 0.988 0.009 15.9 (1069b)
85 10 y=30.07x+0.065 0.998 0.009 21.6
13 y=33.29x-0.0557 0.997 0.009 13.4
Ethyl hexanoate IS-3 2 15.6 88 99 10 5 0.1296-2592 y=0.4574x+0.6586 0.972 0.130 14.4 1237
43
8 y=0.7313x+0.2447 0.982 0.130 12.3 (1221a)
70
10 y=0.8469x-0.2050 0.994 0.130 15.1
13 y=0.6915x+0.0808 0.998 0.130 19.9
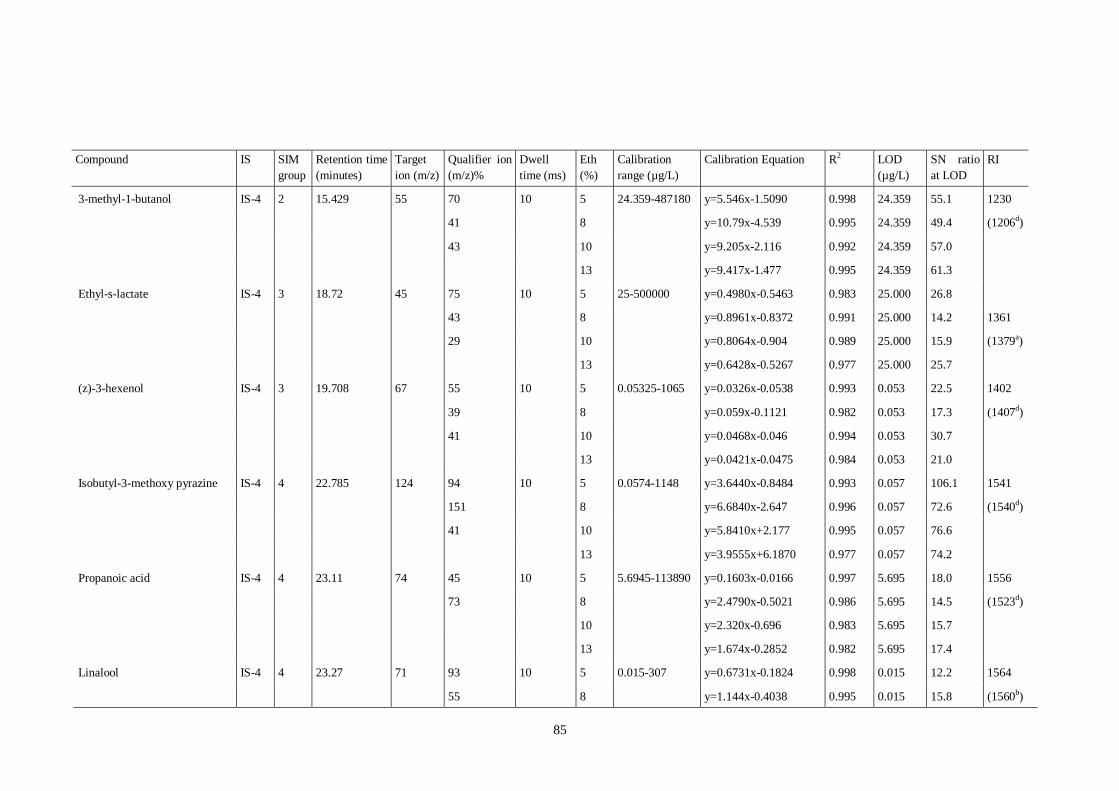
85
Compound IS SIM
group
Retention time
(minutes)
Target
ion (m/z)
Qualifier ion
(m/z)%
Dwell
time (ms)
Eth
(%)
Calibration
range (µg/L)
Calibration Equation R2 LOD
(µg/L)
SN ratio
at LOD
RI
3-methyl-1-butanol IS-4 2 15.429 55 70 10 5 24.359-487180 y=5.546x-1.5090 0.998 24.359 55.1 1230
41
8 y=10.79x-4.539 0.995 24.359 49.4 (1206d)
43
10 y=9.205x-2.116 0.992 24.359 57.0
13 y=9.417x-1.477 0.995 24.359 61.3
Ethyl-s-lactate IS-4 3 18.72 45 75 10 5 25-500000 y=0.4980x-0.5463 0.983 25.000 26.8
43
8 y=0.8961x-0.8372 0.991 25.000 14.2 1361
29
10 y=0.8064x-0.904 0.989 25.000 15.9 (1379a)
13 y=0.6428x-0.5267 0.977 25.000 25.7
(z)-3-hexenol IS-4 3 19.708 67 55 10 5 0.05325-1065 y=0.0326x-0.0538 0.993 0.053 22.5 1402
39
8 y=0.059x-0.1121 0.982 0.053 17.3 (1407d)
41
10 y=0.0468x-0.046 0.994 0.053 30.7
13 y=0.0421x-0.0475 0.984 0.053 21.0
Isobutyl-3-methoxy pyrazine IS-4 4 22.785 124 94 10 5 0.0574-1148 y=3.6440x-0.8484 0.993 0.057 106.1 1541
151
8 y=6.6840x-2.647 0.996 0.057 72.6 (1540d)
41
10 y=5.8410x+2.177 0.995 0.057 76.6
13 y=3.9555x+6.1870 0.977 0.057 74.2
Propanoic acid IS-4 4 23.11 74 45 10 5 5.6945-113890 y=0.1603x-0.0166 0.997 5.695 18.0 1556
73
8 y=2.4790x-0.5021 0.986 5.695 14.5 (1523d)
10 y=2.320x-0.696 0.983 5.695 15.7
13 y=1.674x-0.2852 0.982 5.695 17.4
Linalool IS-4 4 23.27 71 93 10 5 0.015-307 y=0.6731x-0.1824 0.998 0.015 12.2 1564
55
8 y=1.144x-0.4038 0.995 0.015 15.8 (1560b)
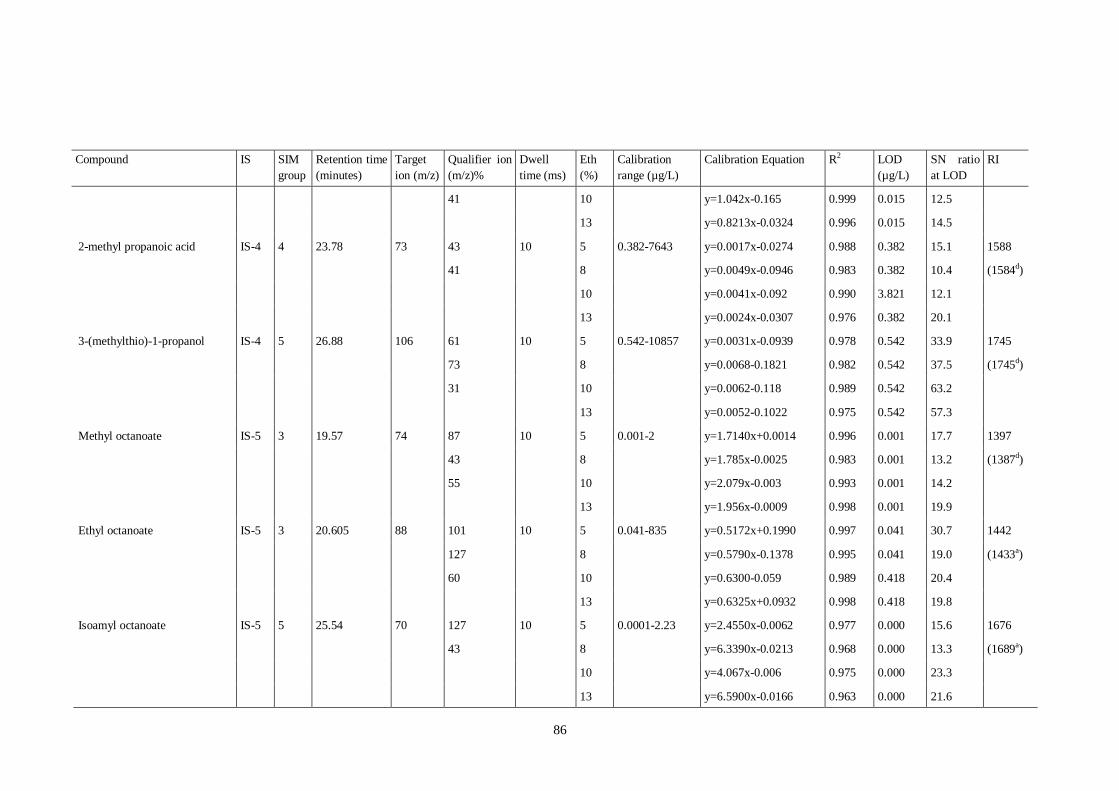
86
Compound IS SIM
group
Retention time
(minutes)
Target
ion (m/z)
Qualifier ion
(m/z)%
Dwell
time (ms)
Eth
(%)
Calibration
range (µg/L)
Calibration Equation R2 LOD
(µg/L)
SN ratio
at LOD
RI
41
10 y=1.042x-0.165 0.999 0.015 12.5
13 y=0.8213x-0.0324 0.996 0.015 14.5
2-methyl propanoic acid IS-4 4 23.78 73 43 10 5 0.382-7643 y=0.0017x-0.0274 0.988 0.382 15.1 1588
41
8 y=0.0049x-0.0946 0.983 0.382 10.4 (1584d)
10 y=0.0041x-0.092 0.990 3.821 12.1
13 y=0.0024x-0.0307 0.976 0.382 20.1
3-(methylthio)-1-propanol IS-4 5 26.88 106 61 10 5 0.542-10857 y=0.0031x-0.0939 0.978 0.542 33.9 1745
73
8 y=0.0068-0.1821 0.982 0.542 37.5 (1745d)
31
10 y=0.0062-0.118 0.989 0.542 63.2
13 y=0.0052-0.1022 0.975 0.542 57.3
Methyl octanoate IS-5 3 19.57 74 87 10 5 0.001-2 y=1.7140x+0.0014 0.996 0.001 17.7 1397
43
8 y=1.785x-0.0025 0.983 0.001 13.2 (1387d)
55
10 y=2.079x-0.003 0.993 0.001 14.2
13 y=1.956x-0.0009 0.998 0.001 19.9
Ethyl octanoate IS-5 3 20.605 88 101 10 5 0.041-835 y=0.5172x+0.1990 0.997 0.041 30.7 1442
127
8 y=0.5790x-0.1378 0.995 0.041 19.0 (1433a)
60
10 y=0.6300-0.059 0.989 0.418 20.4
13 y=0.6325x+0.0932 0.998 0.418 19.8
Isoamyl octanoate IS-5 5 25.54 70 127 10 5 0.0001-2.23 y=2.4550x-0.0062 0.977 0.000 15.6 1676
43
8 y=6.3390x-0.0213 0.968 0.000 13.3 (1689a)
10 y=4.067x-0.006 0.975 0.000 23.3
13 y=6.5900x-0.0166 0.963 0.000 21.6
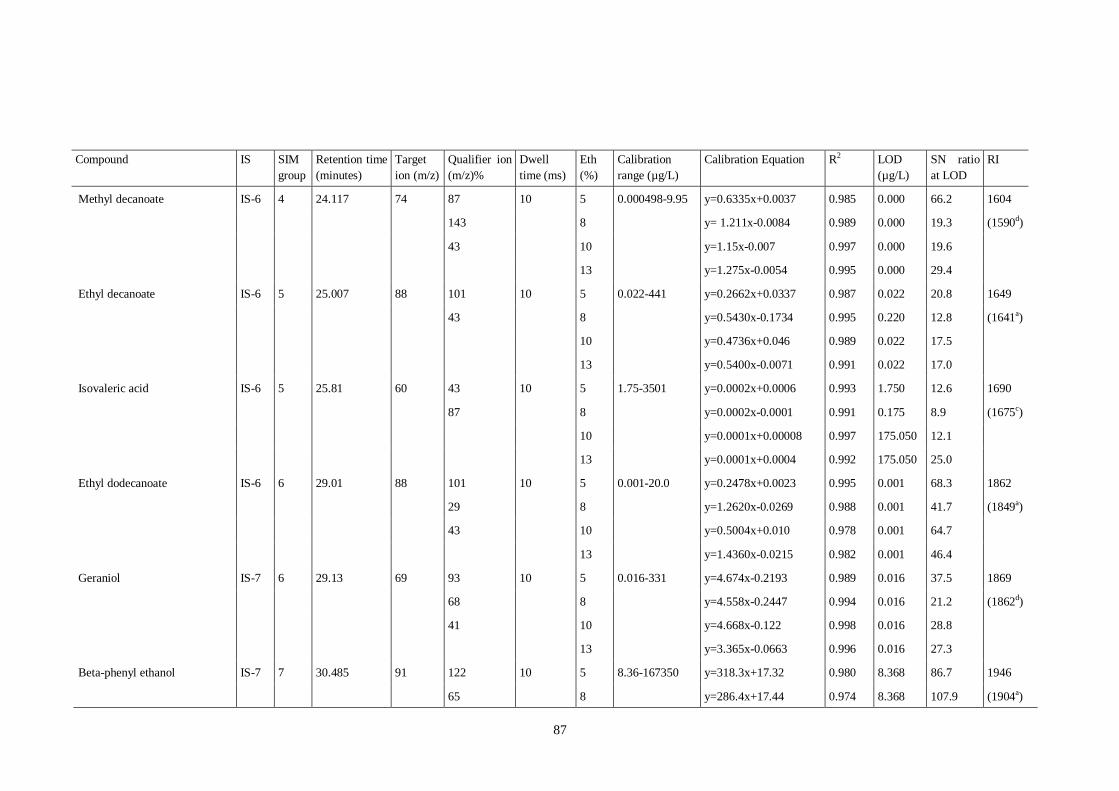
87
Compound IS SIM
group
Retention time
(minutes)
Target
ion (m/z)
Qualifier ion
(m/z)%
Dwell
time (ms)
Eth
(%)
Calibration
range (µg/L)
Calibration Equation R2 LOD
(µg/L)
SN ratio
at LOD
RI
Methyl decanoate IS-6 4 24.117 74 87 10 5 0.000498-9.95 y=0.6335x+0.0037 0.985 0.000 66.2 1604
143
8 y= 1.211x-0.0084 0.989 0.000 19.3 (1590d)
43
10 y=1.15x-0.007 0.997 0.000 19.6
13 y=1.275x-0.0054 0.995 0.000 29.4
Ethyl decanoate IS-6 5 25.007 88 101 10 5 0.022-441 y=0.2662x+0.0337 0.987 0.022 20.8 1649
43
8 y=0.5430x-0.1734 0.995 0.220 12.8 (1641a)
10 y=0.4736x+0.046 0.989 0.022 17.5
13 y=0.5400x-0.0071 0.991 0.022 17.0
Isovaleric acid IS-6 5 25.81 60 43 10 5 1.75-3501 y=0.0002x+0.0006 0.993 1.750 12.6 1690
87
8 y=0.0002x-0.0001 0.991 0.175 8.9 (1675c)
10 y=0.0001x+0.00008 0.997 175.050 12.1
13 y=0.0001x+0.0004 0.992 175.050 25.0
Ethyl dodecanoate IS-6 6 29.01 88 101 10 5 0.001-20.0 y=0.2478x+0.0023 0.995 0.001 68.3 1862
29
8 y=1.2620x-0.0269 0.988 0.001 41.7 (1849a)
43
10 y=0.5004x+0.010 0.978 0.001 64.7
13 y=1.4360x-0.0215 0.982 0.001 46.4
Geraniol IS-7 6 29.13 69 93 10 5 0.016-331 y=4.674x-0.2193 0.989 0.016 37.5 1869
68
8 y=4.558x-0.2447 0.994 0.016 21.2 (1862d)
41
10 y=4.668x-0.122 0.998 0.016 28.8
13 y=3.365x-0.0663 0.996 0.016 27.3
Beta-phenyl ethanol IS-7 7 30.485 91 122 10 5 8.36-167350 y=318.3x+17.32 0.980 8.368 86.7 1946
65
8 y=286.4x+17.44 0.974 8.368 107.9 (1904a)
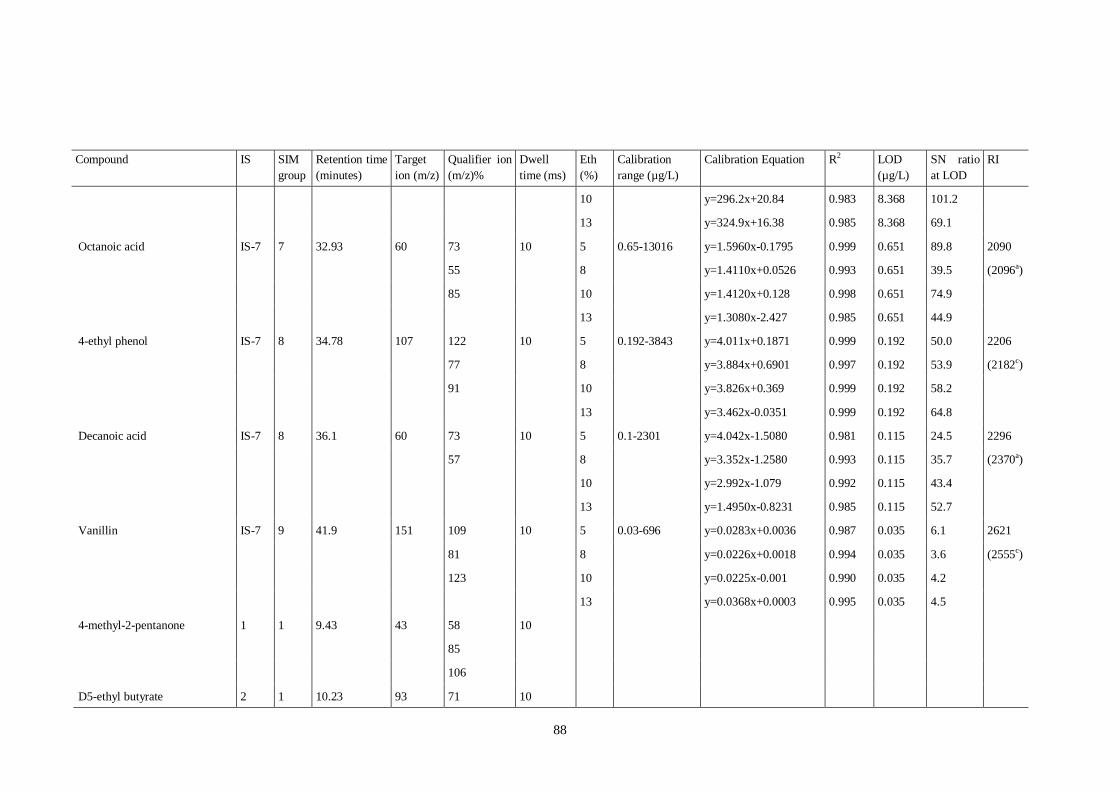
88
Compound IS SIM
group
Retention time
(minutes)
Target
ion (m/z)
Qualifier ion
(m/z)%
Dwell
time (ms)
Eth
(%)
Calibration
range (µg/L)
Calibration Equation R2 LOD
(µg/L)
SN ratio
at LOD
RI
10 y=296.2x+20.84 0.983 8.368 101.2
13 y=324.9x+16.38 0.985 8.368 69.1
Octanoic acid IS-7 7 32.93 60 73 10 5 0.65-13016 y=1.5960x-0.1795 0.999 0.651 89.8 2090
55
8 y=1.4110x+0.0526 0.993 0.651 39.5 (2096a)
85
10 y=1.4120x+0.128 0.998 0.651 74.9
13 y=1.3080x-2.427 0.985 0.651 44.9
4-ethyl phenol IS-7 8 34.78 107 122 10 5 0.192-3843 y=4.011x+0.1871 0.999 0.192 50.0 2206
77
8 y=3.884x+0.6901 0.997 0.192 53.9 (2182c)
91
10 y=3.826x+0.369 0.999 0.192 58.2
13 y=3.462x-0.0351 0.999 0.192 64.8
Decanoic acid IS-7 8 36.1 60 73 10 5 0.1-2301 y=4.042x-1.5080 0.981 0.115 24.5 2296
57
8 y=3.352x-1.2580 0.993 0.115 35.7 (2370a)
10 y=2.992x-1.079 0.992 0.115 43.4
13 y=1.4950x-0.8231 0.985 0.115 52.7
Vanillin IS-7 9 41.9 151 109 10 5 0.03-696 y=0.0283x+0.0036 0.987 0.035 6.1 2621
81
8 y=0.0226x+0.0018 0.994 0.035 3.6 (2555c)
123
10 y=0.0225x-0.001 0.990 0.035 4.2
13 y=0.0368x+0.0003 0.995 0.035 4.5
4-methyl-2-pentanone 1 1 9.43 43 58 10
85
106
D5-ethyl butyrate 2 1 10.23 93 71 10
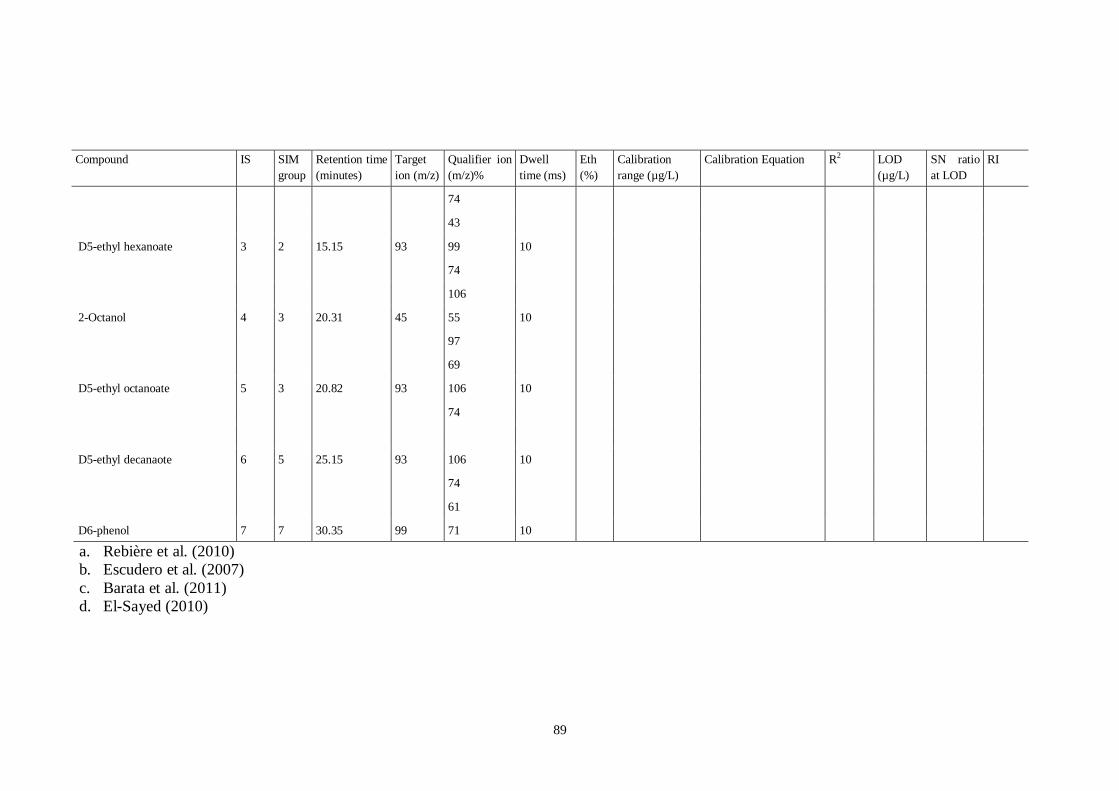
89
Compound IS SIM
group
Retention time
(minutes)
Target
ion (m/z)
Qualifier ion
(m/z)%
Dwell
time (ms)
Eth
(%)
Calibration
range (µg/L)
Calibration Equation R2 LOD
(µg/L)
SN ratio
at LOD
RI
74
43
D5-ethyl hexanoate 3 2 15.15 93 99 10
74
106
2-Octanol 4 3 20.31 45 55 10
97
69
D5-ethyl octanoate 5 3 20.82 93 106 10
74
D5-ethyl decanaote 6 5 25.15 93 106 10
74
61
D6-phenol 7 7 30.35 99 71 10
a. Rebière et al. (2010)
b. Escudero et al. (2007)
c. Barata et al. (2011)
d. El-Sayed (2010)
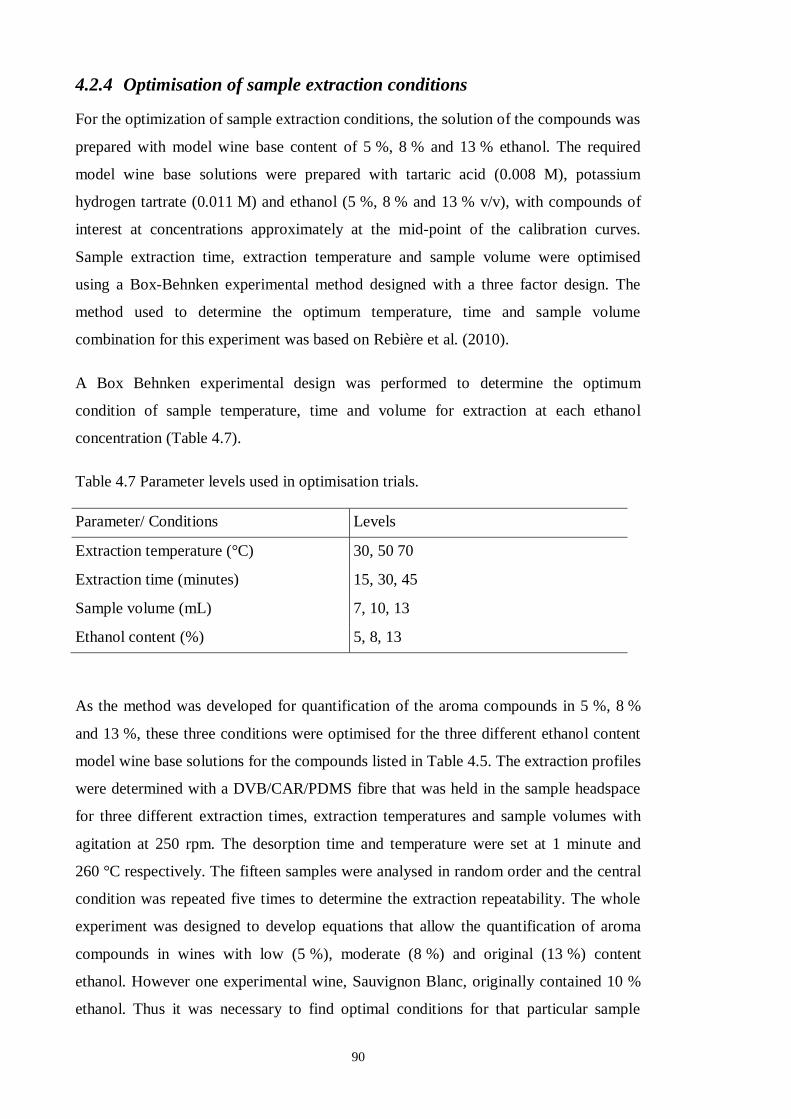
90
4.2.4 Optimisation of sample extraction conditions
For the optimization of sample extraction conditions, the solution of the compounds was
prepared with model wine base content of 5 %, 8 % and 13 % ethanol. The required
model wine base solutions were prepared with tartaric acid (0.008 M), potassium
hydrogen tartrate (0.011 M) and ethanol (5 %, 8 % and 13 % v/v), with compounds of
interest at concentrations approximately at the mid-point of the calibration curves.
Sample extraction time, extraction temperature and sample volume were optimised
using a Box-Behnken experimental method designed with a three factor design. The
method used to determine the optimum temperature, time and sample volume
combination for this experiment was based on Rebière et al. (2010).
A Box Behnken experimental design was performed to determine the optimum
condition of sample temperature, time and volume for extraction at each ethanol
concentration (Table 4.7).
Table 4.7 Parameter levels used in optimisation trials.
Parameter/ Conditions Levels
Extraction temperature (°C) 30, 50 70
Extraction time (minutes) 15, 30, 45
Sample volume (mL) 7, 10, 13
Ethanol content (%) 5, 8, 13
As the method was developed for quantification of the aroma compounds in 5 %, 8 %
and 13 %, these three conditions were optimised for the three different ethanol content
model wine base solutions for the compounds listed in Table 4.5. The extraction profiles
were determined with a DVB/CAR/PDMS fibre that was held in the sample headspace
for three different extraction times, extraction temperatures and sample volumes with
agitation at 250 rpm. The desorption time and temperature were set at 1 minute and
260 °C respectively. The fifteen samples were analysed in random order and the central
condition was repeated five times to determine the extraction repeatability. The whole
experiment was designed to develop equations that allow the quantification of aroma
compounds in wines with low (5 %), moderate (8 %) and original (13 %) content
ethanol. However one experimental wine, Sauvignon Blanc, originally contained 10 %
ethanol. Thus it was necessary to find optimal conditions for that particular sample
91
injection. As it was in between 8 % and 13 %, the maximum responses of the
compounds in 10 % ethanol content were determined from the responses of the
compounds obtained from 5 %, 8 % and 13 %. The calculation of optimal extraction
time, extraction temperature and sample volume for different ethanol concentrations
was performed by Matlab R2007a. Compound quant ion results were exported to that
software for the calculation and the extraction conditions for the three different ethanol
content solutions were modelled by central composite design (full quadratic model).
4.2.5 Response surface analysis of data
A response surface model was fitted with the data to determine the set of optimum
conditions for SPME injection and also to evaluate the significance of b- coefficients.
To analyse experimental data, it is necessary to know whether a specific factor is
significant or important. When experimental results are influenced by several factors, it
is necessary to determine which factors and interactions between factors are significant.
In this study, the response surface model was developed considering four variables,
namely:
1. Ethanol concentration (x1)
2. Extraction temperature (x2)
3. Extraction time (x3)
4. Sample volume (x4)
A typical response surface equation for four factors will take the form of:
y = b0 + b1x1 + b2x2 + b3x3 + b4x4 + b12x1x2 + b13x1x3 + b14x1x4 + b23x2x3 + b24x2x4 +
b34x3x4 + b11x12 + b22x2
2 + b33x3
2 + b44x4
2
Where:
y = (Response)
b0 + (An intercept or average)
b1x1 + b2x2 + b3x3 + b4x4 + (Linear terms depending on the each of the four
factors)
92
b12x1x2 + b13x1x3 + b14x1x4 + b23x2x3 + b24x2x4 + b34x3x4 +
(Interaction terms between the factors)
b11x12 + b22x2
2 + b33x3
2 + b44x4
2
(Quadratic terms depending on the each of the
three factors)
The justification for these terms is follows,
The intercept is an important term because the average response is not normally
achieved when the factors are at their average values
The linear terms show the direct relationship between the response and the given
factor
The interaction terms represent the mutual interactions of two factors on the
response. These arise because the influence of the two factors on the response is
rarely independent.
The quadratic terms are also often important as this allows curvature, and is one
way to get the maximum or minimum (Brereton, 2003).
To evaluate the extraction temperature, extraction time and volume on a specific
percentage of ethanol content model wine base solution, the method was designed for
5 %, 8 % and 13 % separately considering three variables:
1. Extraction temperature (x1)
2. Extraction time (x2)
3. Sample volume (x3)
The full quadratic equation for the three factors might be
y= b0 + b1x1 + b2x2 + b3x3 +b12x1x2 + b13x1x3 + b23x2x3 + b11x12 + b22x2
2 + b33x3
2
It is important to determine of the b-coefficients in a full quadratic equation in order to
elucidate the effect of variables and their interaction on the final response of the
experiment. Once all the coefficients in the quadratic equation can be determined, it is
easier to identify the more important variables and the interactions between them which
93
influence the overall experimental result. It is a common misconception that the larger
the parameter the more important it is. Actually, it is not the size of the parameter, but
the size of the coefficients in the coded designed matrix regarding the variable which
indicates the significance (Brereton, 2003; Leardi, 2009). A common approach is to set
up a mathematical model linking the response to coefficients of the various factors.
Then different statistical analyses (ANOVA, t-test) were performed to determine the
significance of the factors or terms in the model (Brereton, 2007). This approach helps
to optimise the experimental conditions to get better results from the experiment
(Leardi, 2009).Target quant ions of each analyte (Table 4.5) were integrated across the
peak area and modelled with surface response methodology using a full quadratic
equation to account for constant, linear, interaction and squared terms (Figure 4.1) to get
the response for each compound at optimum condition. A global optimum temperature,
extraction time and sample volume combination was determined to minimise loss of
analytical sensitivity for compounds that exhibit relatively low response signals within
the analytical range. Therefore, an inverse peak size for all target compounds relative to
the largest maximum modelled quant ion was calculated and a weighted mean optimum
extraction time, extraction temperature and sample volume combination was determined
for the four different ethanol content (5 %, 8 %, 10 % and 13 %) model wine base
solutions (Schmidtke, 2011) and presented in Tables 4.8, 4.9, 4.10 and 4.11
respectively.
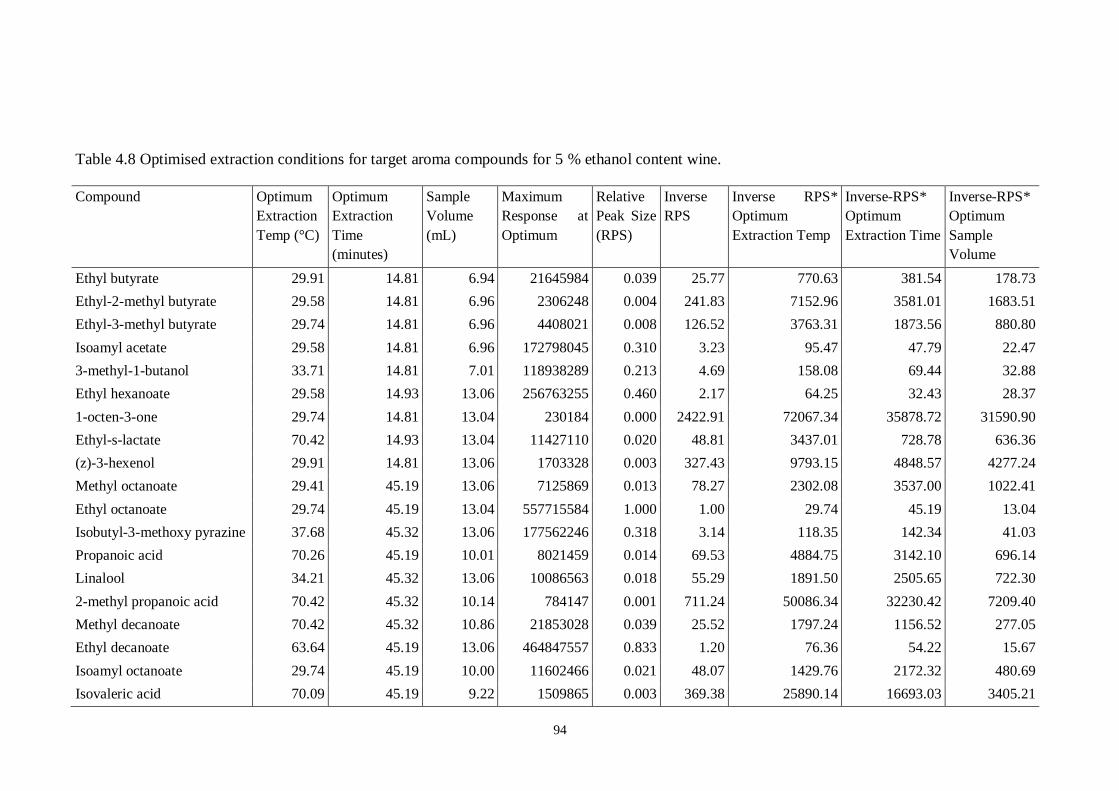
94
Table 4.8 Optimised extraction conditions for target aroma compounds for 5 % ethanol content wine.
Compound Optimum
Extraction
Temp (°C)
Optimum
Extraction
Time
(minutes)
Sample
Volume
(mL)
Maximum
Response at
Optimum
Relative
Peak Size
(RPS)
Inverse
RPS
Inverse RPS*
Optimum
Extraction Temp
Inverse-RPS*
Optimum
Extraction Time
Inverse-RPS*
Optimum
Sample
Volume
Ethyl butyrate 29.91 14.81 6.94 21645984 0.039 25.77 770.63 381.54 178.73
Ethyl-2-methyl butyrate 29.58 14.81 6.96 2306248 0.004 241.83 7152.96 3581.01 1683.51
Ethyl-3-methyl butyrate 29.74 14.81 6.96 4408021 0.008 126.52 3763.31 1873.56 880.80
Isoamyl acetate 29.58 14.81 6.96 172798045 0.310 3.23 95.47 47.79 22.47
3-methyl-1-butanol 33.71 14.81 7.01 118938289 0.213 4.69 158.08 69.44 32.88
Ethyl hexanoate 29.58 14.93 13.06 256763255 0.460 2.17 64.25 32.43 28.37
1-octen-3-one 29.74 14.81 13.04 230184 0.000 2422.91 72067.34 35878.72 31590.90
Ethyl-s-lactate 70.42 14.93 13.04 11427110 0.020 48.81 3437.01 728.78 636.36
(z)-3-hexenol 29.91 14.81 13.06 1703328 0.003 327.43 9793.15 4848.57 4277.24
Methyl octanoate 29.41 45.19 13.06 7125869 0.013 78.27 2302.08 3537.00 1022.41
Ethyl octanoate 29.74 45.19 13.04 557715584 1.000 1.00 29.74 45.19 13.04
Isobutyl-3-methoxy pyrazine 37.68 45.32 13.06 177562246 0.318 3.14 118.35 142.34 41.03
Propanoic acid 70.26 45.19 10.01 8021459 0.014 69.53 4884.75 3142.10 696.14
Linalool 34.21 45.32 13.06 10086563 0.018 55.29 1891.50 2505.65 722.30
2-methyl propanoic acid 70.42 45.32 10.14 784147 0.001 711.24 50086.34 32230.42 7209.40
Methyl decanoate 70.42 45.32 10.86 21853028 0.039 25.52 1797.24 1156.52 277.05
Ethyl decanoate 63.64 45.19 13.06 464847557 0.833 1.20 76.36 54.22 15.67
Isoamyl octanoate 29.74 45.19 10.00 11602466 0.021 48.07 1429.76 2172.32 480.69
Isovaleric acid 70.09 45.19 9.22 1509865 0.003 369.38 25890.14 16693.03 3405.21
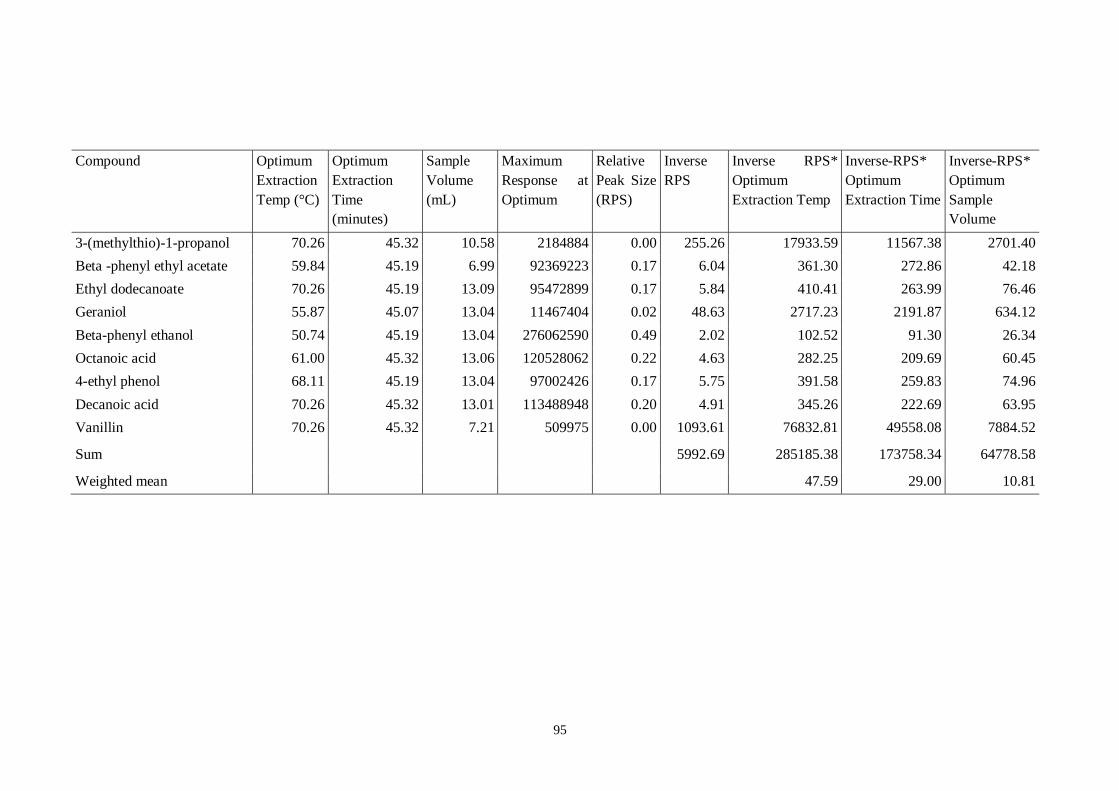
95
Compound Optimum
Extraction
Temp (°C)
Optimum
Extraction
Time
(minutes)
Sample
Volume
(mL)
Maximum
Response at
Optimum
Relative
Peak Size
(RPS)
Inverse
RPS
Inverse RPS*
Optimum
Extraction Temp
Inverse-RPS*
Optimum
Extraction Time
Inverse-RPS*
Optimum
Sample
Volume
3-(methylthio)-1-propanol 70.26 45.32 10.58 2184884 0.00 255.26 17933.59 11567.38 2701.40
Beta -phenyl ethyl acetate 59.84 45.19 6.99 92369223 0.17 6.04 361.30 272.86 42.18
Ethyl dodecanoate 70.26 45.19 13.09 95472899 0.17 5.84 410.41 263.99 76.46
Geraniol 55.87 45.07 13.04 11467404 0.02 48.63 2717.23 2191.87 634.12
Beta-phenyl ethanol 50.74 45.19 13.04 276062590 0.49 2.02 102.52 91.30 26.34
Octanoic acid 61.00 45.32 13.06 120528062 0.22 4.63 282.25 209.69 60.45
4-ethyl phenol 68.11 45.19 13.04 97002426 0.17 5.75 391.58 259.83 74.96
Decanoic acid 70.26 45.32 13.01 113488948 0.20 4.91 345.26 222.69 63.95
Vanillin 70.26 45.32 7.21 509975 0.00 1093.61 76832.81 49558.08 7884.52
Sum 5992.69 285185.38 173758.34 64778.58
Weighted mean 47.59 29.00 10.81
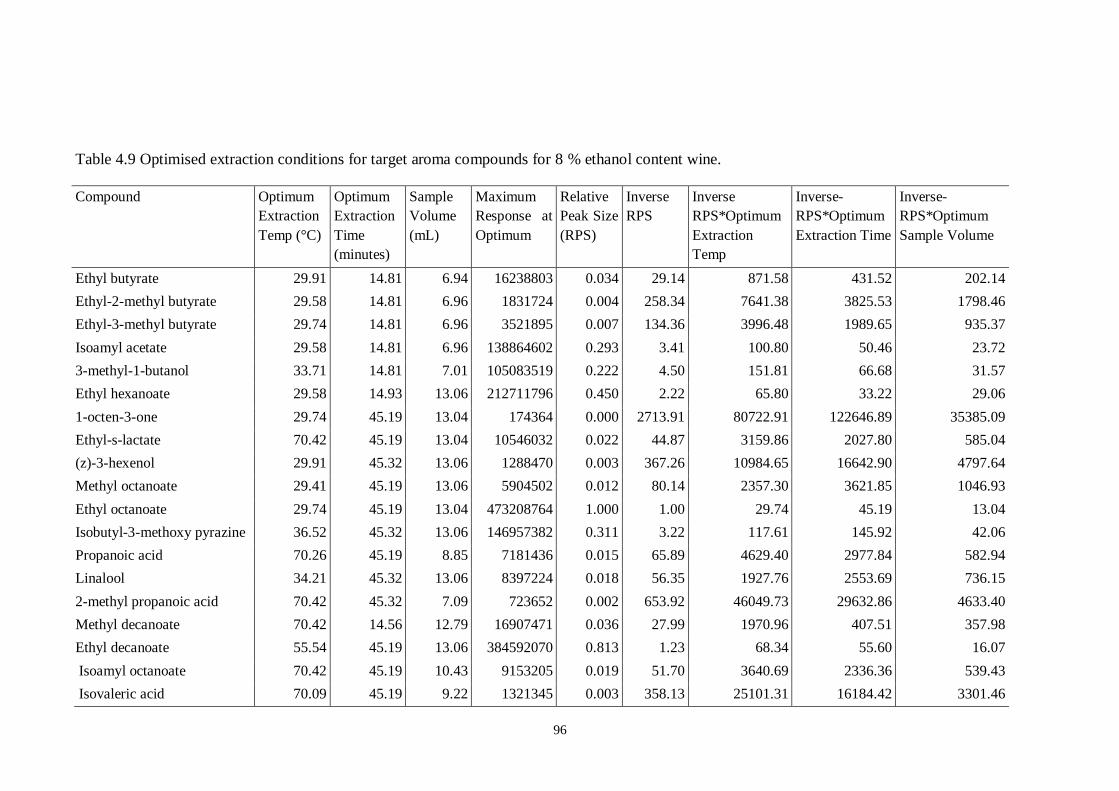
96
Table 4.9 Optimised extraction conditions for target aroma compounds for 8 % ethanol content wine.
Compound Optimum
Extraction
Temp (°C)
Optimum
Extraction
Time
(minutes)
Sample
Volume
(mL)
Maximum
Response at
Optimum
Relative
Peak Size
(RPS)
Inverse
RPS
Inverse
RPS*Optimum
Extraction
Temp
Inverse-
RPS*Optimum
Extraction Time
Inverse-
RPS*Optimum
Sample Volume
Ethyl butyrate 29.91 14.81 6.94 16238803 0.034 29.14 871.58 431.52 202.14
Ethyl-2-methyl butyrate 29.58 14.81 6.96 1831724 0.004 258.34 7641.38 3825.53 1798.46
Ethyl-3-methyl butyrate 29.74 14.81 6.96 3521895 0.007 134.36 3996.48 1989.65 935.37
Isoamyl acetate 29.58 14.81 6.96 138864602 0.293 3.41 100.80 50.46 23.72
3-methyl-1-butanol 33.71 14.81 7.01 105083519 0.222 4.50 151.81 66.68 31.57
Ethyl hexanoate 29.58 14.93 13.06 212711796 0.450 2.22 65.80 33.22 29.06
1-octen-3-one 29.74 45.19 13.04 174364 0.000 2713.91 80722.91 122646.89 35385.09
Ethyl-s-lactate 70.42 45.19 13.04 10546032 0.022 44.87 3159.86 2027.80 585.04
(z)-3-hexenol 29.91 45.32 13.06 1288470 0.003 367.26 10984.65 16642.90 4797.64
Methyl octanoate 29.41 45.19 13.06 5904502 0.012 80.14 2357.30 3621.85 1046.93
Ethyl octanoate 29.74 45.19 13.04 473208764 1.000 1.00 29.74 45.19 13.04
Isobutyl-3-methoxy pyrazine 36.52 45.32 13.06 146957382 0.311 3.22 117.61 145.92 42.06
Propanoic acid 70.26 45.19 8.85 7181436 0.015 65.89 4629.40 2977.84 582.94
Linalool 34.21 45.32 13.06 8397224 0.018 56.35 1927.76 2553.69 736.15
2-methyl propanoic acid 70.42 45.32 7.09 723652 0.002 653.92 46049.73 29632.86 4633.40
Methyl decanoate 70.42 14.56 12.79 16907471 0.036 27.99 1970.96 407.51 357.98
Ethyl decanoate 55.54 45.19 13.06 384592070 0.813 1.23 68.34 55.60 16.07
Isoamyl octanoate 70.42 45.19 10.43 9153205 0.019 51.70 3640.69 2336.36 539.43
Isovaleric acid 70.09 45.19 9.22 1321345 0.003 358.13 25101.31 16184.42 3301.46
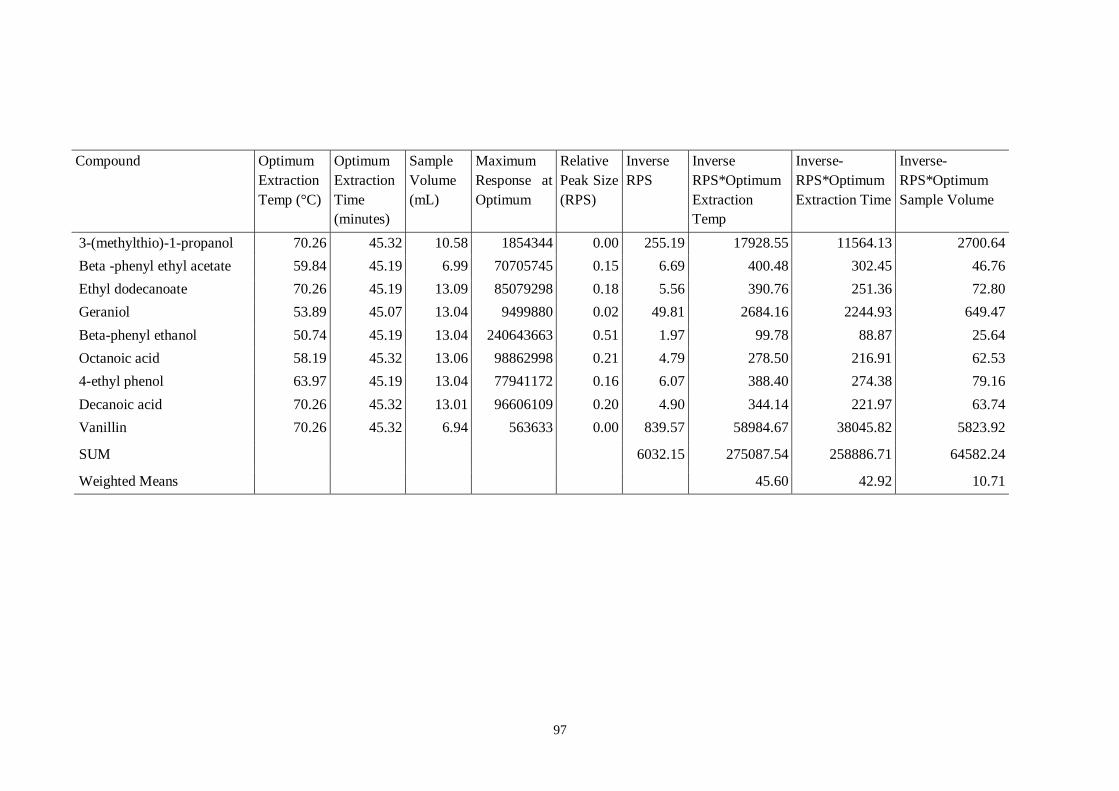
97
Compound Optimum
Extraction
Temp (°C)
Optimum
Extraction
Time
(minutes)
Sample
Volume
(mL)
Maximum
Response at
Optimum
Relative
Peak Size
(RPS)
Inverse
RPS
Inverse
RPS*Optimum
Extraction
Temp
Inverse-
RPS*Optimum
Extraction Time
Inverse-
RPS*Optimum
Sample Volume
3-(methylthio)-1-propanol 70.26 45.32 10.58 1854344 0.00 255.19 17928.55 11564.13 2700.64
Beta -phenyl ethyl acetate 59.84 45.19 6.99 70705745 0.15 6.69 400.48 302.45 46.76
Ethyl dodecanoate 70.26 45.19 13.09 85079298 0.18 5.56 390.76 251.36 72.80
Geraniol 53.89 45.07 13.04 9499880 0.02 49.81 2684.16 2244.93 649.47
Beta-phenyl ethanol 50.74 45.19 13.04 240643663 0.51 1.97 99.78 88.87 25.64
Octanoic acid 58.19 45.32 13.06 98862998 0.21 4.79 278.50 216.91 62.53
4-ethyl phenol 63.97 45.19 13.04 77941172 0.16 6.07 388.40 274.38 79.16
Decanoic acid 70.26 45.32 13.01 96606109 0.20 4.90 344.14 221.97 63.74
Vanillin 70.26 45.32 6.94 563633 0.00 839.57 58984.67 38045.82 5823.92
SUM 6032.15 275087.54 258886.71 64582.24
Weighted Means 45.60 42.92 10.71

98
Table 4.10 Optimised extraction conditions for target aroma compounds for 10 % ethanol content wine.
Compound Optimum
Extraction
Temp (°C)
Optimum
Extraction
Time
(minutes)
Sample
Volume
(mL)
Maximum
Response at
Optimum
Relative
Peak Size
(RPS)
Inverse
RPS
Inverse
RPS*Optimum
Extraction
Temp
Inverse-
RPS*Optimum
Extraction Time
Inverse-
RPS*Optimum
Sample
Volume
Ethyl butyrate 29.91 14.81 6.94 13701954 0.032 31.31 936.60 463.71 217.22
Ethyl-2-methyl butyrate 29.58 14.81 6.96 2589960 0.006 165.67 4900.22 2453.22 1153.31
Ethyl-3-methyl butyrate 29.74 14.81 6.96 3072342 0.007 139.66 4153.95 2068.04 972.23
Isoamyl acetate 29.58 14.81 6.96 123238386 0.287 3.48 102.98 51.56 24.24
3-methyl-1-butanol 33.71 14.81 7.01 96504230 0.225 4.45 149.89 65.84 31.17
Ethyl hexanoate 29.58 14.93 13.06 189437593 0.442 2.26 67.00 33.82 29.59
1-octen-3-one 29.74 45.19 13.04 151862 0.000 2825.41 84039.14 127685.43 36838.76
Ethyl-s-lactate 70.42 45.19 13.04 10037916 0.023 42.75 3010.17 1931.73 557.33
(z)-3-hexenol 29.91 45.32 13.06 1122492 0.003 382.25 11432.84 17321.97 4993.40
Methyl octanoate 29.41 45.19 13.06 5284504 0.012 81.19 2388.20 3669.33 1060.66
Ethyl octanoate 29.74 45.19 13.04 429071690 1.000 1.00 29.74 45.19 13.04
Isobutyl-3-methoxy pyrazine 36.52 45.32 13.06 133187891 0.310 3.22 117.66 145.99 42.08
Propanoic acid 70.26 45.19 8.85 7102412 0.017 60.41 4244.31 2730.14 534.45
Linalool 31.07 45.32 13.06 7676236 0.018 55.90 1736.52 2532.98 730.18
2-methyl propanoic acid 70.42 45.32 7.09 718577 0.002 597.11 42049.48 27058.71 4230.90
Methyl decanoate 70.42 14.56 12.79 16153172 0.038 26.56 1870.58 386.75 339.75
Ethyl decanoate 50.74 45.19 13.06 351186957 0.818 1.22 62.00 55.21 15.96
Isoamyl octanoate 70.42 45.19 10.43 8463703 0.020 50.70 3570.04 2291.03 528.96
Isovaleric acid 70.09 45.19 9.22 1269741 0.003 337.92 23685.06 15271.28 3115.19
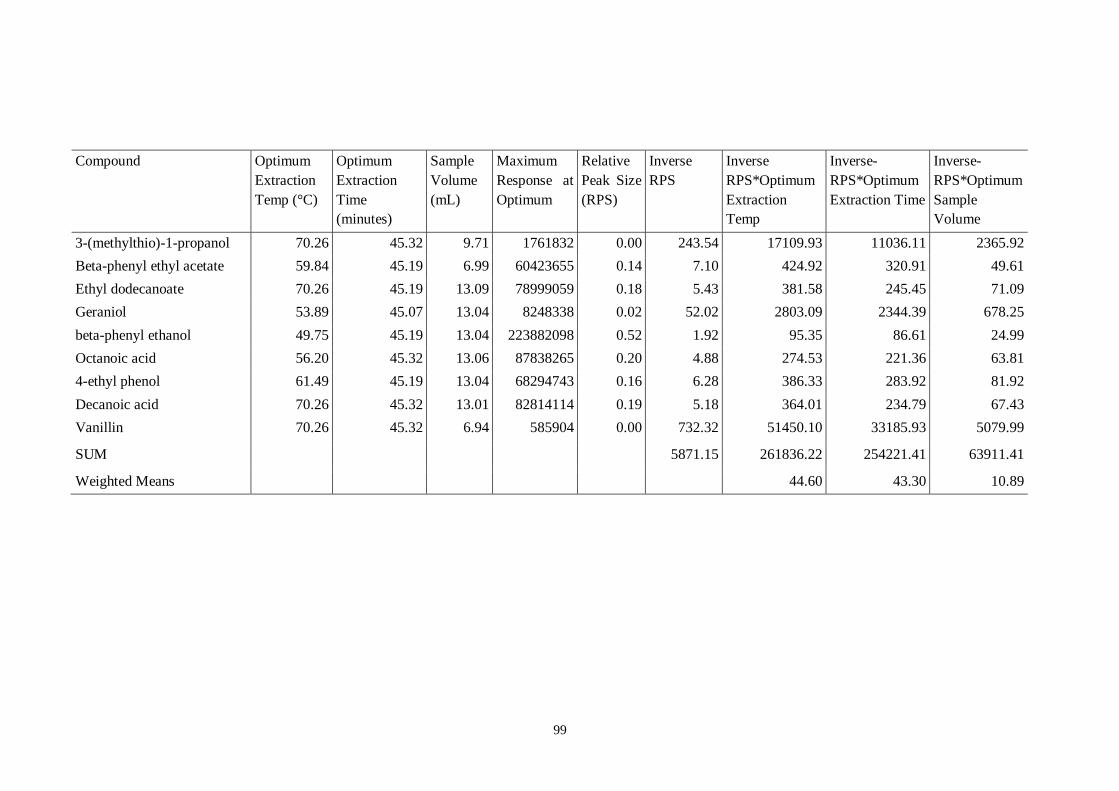
99
Compound Optimum
Extraction
Temp (°C)
Optimum
Extraction
Time
(minutes)
Sample
Volume
(mL)
Maximum
Response at
Optimum
Relative
Peak Size
(RPS)
Inverse
RPS
Inverse
RPS*Optimum
Extraction
Temp
Inverse-
RPS*Optimum
Extraction Time
Inverse-
RPS*Optimum
Sample
Volume
3-(methylthio)-1-propanol 70.26 45.32 9.71 1761832 0.00 243.54 17109.93 11036.11 2365.92
Beta-phenyl ethyl acetate 59.84 45.19 6.99 60423655 0.14 7.10 424.92 320.91 49.61
Ethyl dodecanoate 70.26 45.19 13.09 78999059 0.18 5.43 381.58 245.45 71.09
Geraniol 53.89 45.07 13.04 8248338 0.02 52.02 2803.09 2344.39 678.25
beta-phenyl ethanol 49.75 45.19 13.04 223882098 0.52 1.92 95.35 86.61 24.99
Octanoic acid 56.20 45.32 13.06 87838265 0.20 4.88 274.53 221.36 63.81
4-ethyl phenol 61.49 45.19 13.04 68294743 0.16 6.28 386.33 283.92 81.92
Decanoic acid 70.26 45.32 13.01 82814114 0.19 5.18 364.01 234.79 67.43
Vanillin 70.26 45.32 6.94 585904 0.00 732.32 51450.10 33185.93 5079.99
SUM 5871.15 261836.22 254221.41 63911.41
Weighted Means 44.60 43.30 10.89
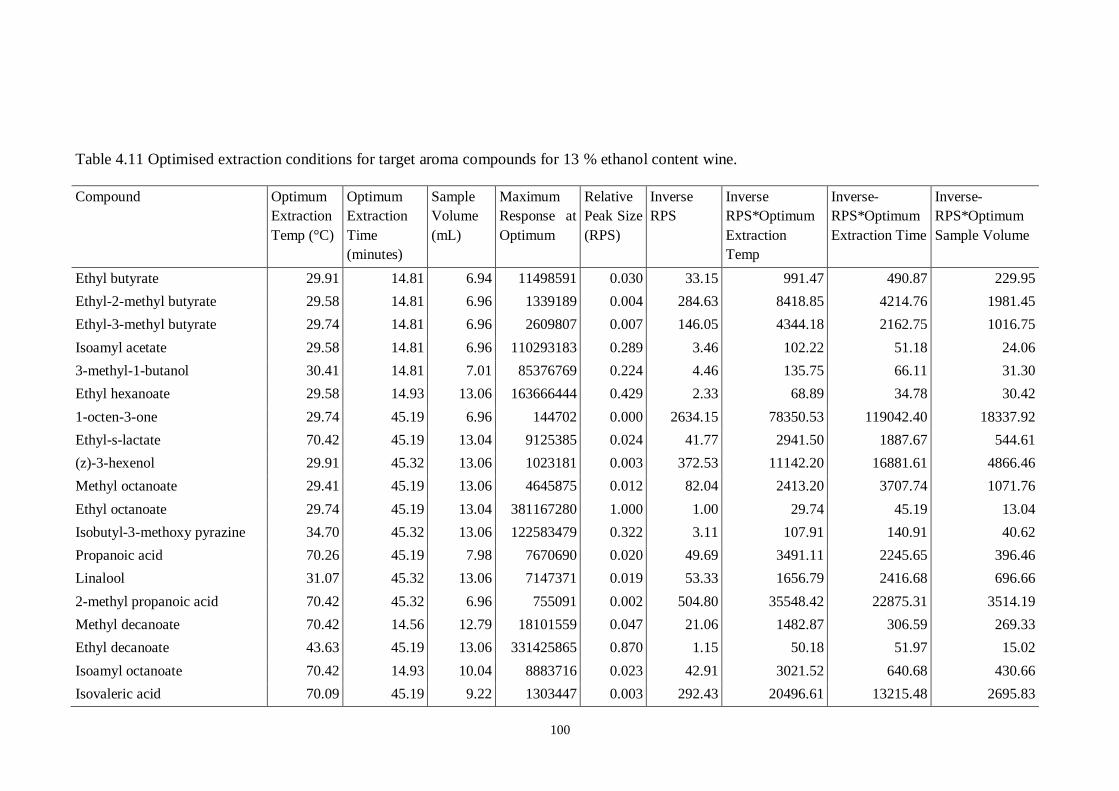
100
Table 4.11 Optimised extraction conditions for target aroma compounds for 13 % ethanol content wine.
Compound Optimum
Extraction
Temp (°C)
Optimum
Extraction
Time
(minutes)
Sample
Volume
(mL)
Maximum
Response at
Optimum
Relative
Peak Size
(RPS)
Inverse
RPS
Inverse
RPS*Optimum
Extraction
Temp
Inverse-
RPS*Optimum
Extraction Time
Inverse-
RPS*Optimum
Sample Volume
Ethyl butyrate 29.91 14.81 6.94 11498591 0.030 33.15 991.47 490.87 229.95
Ethyl-2-methyl butyrate 29.58 14.81 6.96 1339189 0.004 284.63 8418.85 4214.76 1981.45
Ethyl-3-methyl butyrate 29.74 14.81 6.96 2609807 0.007 146.05 4344.18 2162.75 1016.75
Isoamyl acetate 29.58 14.81 6.96 110293183 0.289 3.46 102.22 51.18 24.06
3-methyl-1-butanol 30.41 14.81 7.01 85376769 0.224 4.46 135.75 66.11 31.30
Ethyl hexanoate 29.58 14.93 13.06 163666444 0.429 2.33 68.89 34.78 30.42
1-octen-3-one 29.74 45.19 6.96 144702 0.000 2634.15 78350.53 119042.40 18337.92
Ethyl-s-lactate 70.42 45.19 13.04 9125385 0.024 41.77 2941.50 1887.67 544.61
(z)-3-hexenol 29.91 45.32 13.06 1023181 0.003 372.53 11142.20 16881.61 4866.46
Methyl octanoate 29.41 45.19 13.06 4645875 0.012 82.04 2413.20 3707.74 1071.76
Ethyl octanoate 29.74 45.19 13.04 381167280 1.000 1.00 29.74 45.19 13.04
Isobutyl-3-methoxy pyrazine 34.70 45.32 13.06 122583479 0.322 3.11 107.91 140.91 40.62
Propanoic acid 70.26 45.19 7.98 7670690 0.020 49.69 3491.11 2245.65 396.46
Linalool 31.07 45.32 13.06 7147371 0.019 53.33 1656.79 2416.68 696.66
2-methyl propanoic acid 70.42 45.32 6.96 755091 0.002 504.80 35548.42 22875.31 3514.19
Methyl decanoate 70.42 14.56 12.79 18101559 0.047 21.06 1482.87 306.59 269.33
Ethyl decanoate 43.63 45.19 13.06 331425865 0.870 1.15 50.18 51.97 15.02
Isoamyl octanoate 70.42 14.93 10.04 8883716 0.023 42.91 3021.52 640.68 430.66
Isovaleric acid 70.09 45.19 9.22 1303447 0.003 292.43 20496.61 13215.48 2695.83
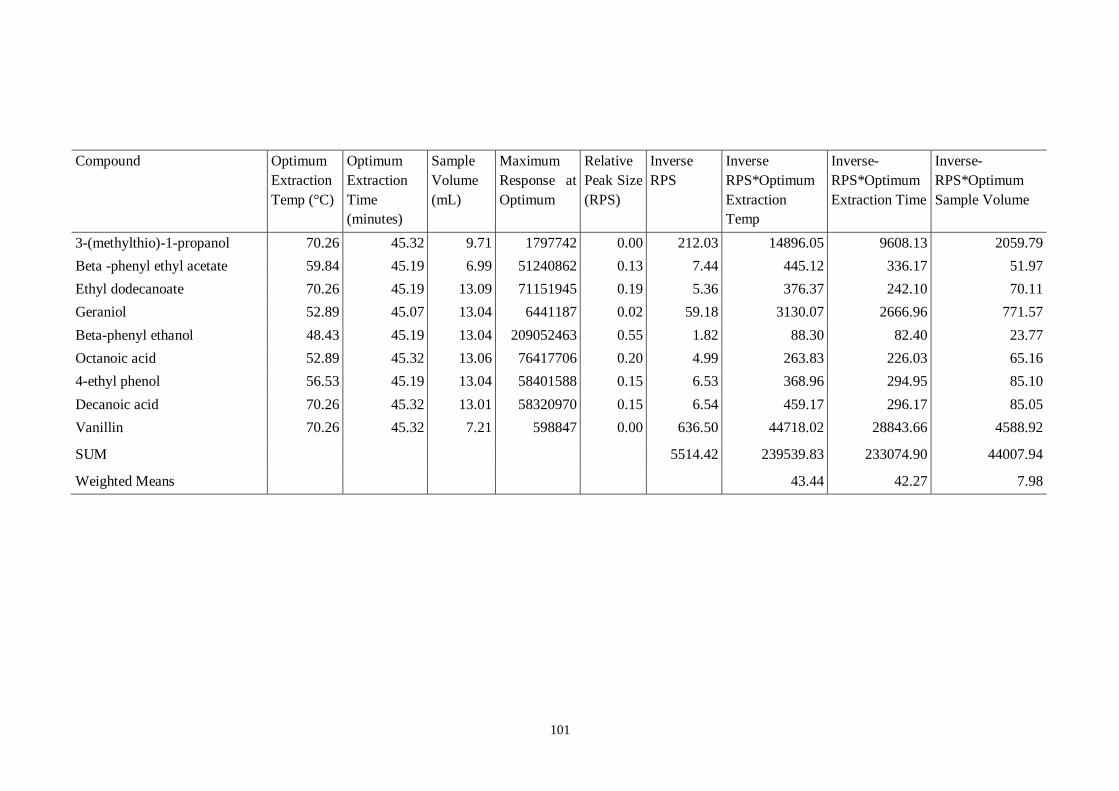
101
Compound Optimum
Extraction
Temp (°C)
Optimum
Extraction
Time
(minutes)
Sample
Volume
(mL)
Maximum
Response at
Optimum
Relative
Peak Size
(RPS)
Inverse
RPS
Inverse
RPS*Optimum
Extraction
Temp
Inverse-
RPS*Optimum
Extraction Time
Inverse-
RPS*Optimum
Sample Volume
3-(methylthio)-1-propanol 70.26 45.32 9.71 1797742 0.00 212.03 14896.05 9608.13 2059.79
Beta -phenyl ethyl acetate 59.84 45.19 6.99 51240862 0.13 7.44 445.12 336.17 51.97
Ethyl dodecanoate 70.26 45.19 13.09 71151945 0.19 5.36 376.37 242.10 70.11
Geraniol 52.89 45.07 13.04 6441187 0.02 59.18 3130.07 2666.96 771.57
Beta-phenyl ethanol 48.43 45.19 13.04 209052463 0.55 1.82 88.30 82.40 23.77
Octanoic acid 52.89 45.32 13.06 76417706 0.20 4.99 263.83 226.03 65.16
4-ethyl phenol 56.53 45.19 13.04 58401588 0.15 6.53 368.96 294.95 85.10
Decanoic acid 70.26 45.32 13.01 58320970 0.15 6.54 459.17 296.17 85.05
Vanillin 70.26 45.32 7.21 598847 0.00 636.50 44718.02 28843.66 4588.92
SUM 5514.42 239539.83 233074.90 44007.94
Weighted Means 43.44 42.27 7.98
102
4.2.6 Internal standards used for calibration
Octanol, 4-methyl-2-pentanone, and deuterated isotopes of ethyl butyrate, ethyl
hexanoate, ethyl octanoate, ethyl decanoate and phenol were used for the calibration of
the twenty-seven aroma compounds. Deuterated ethyl esters were prepared in
accordance with methods by Siebert et al. (2005) and supplied by Dr Leigh Schmidtke.
Deuterated phenols were supplied from Polymer Source, Dorval. All the internal
standards were preserved in -82 °C (Pollnitz et al., 2004). 5 mL solutions of internal
standard mixture were prepared before the calibration run for each ethanol percentage,
containing approximately the following compounds and concentrations; 2-octanol
1.9 µg/mL, 4-methyl-2-pentanone 99 µg/mL, D5-Ethyl butyrate 8.08 µg/mL, D5-ethyl
hexanoate 9.12 µg/mL, D5-ethyl octanoate 3.78 µg/mL, D5-ethyl decanoate 3.74 µg/L,
D6- phenol 20.257 µg/mL.
4.2.7 Calibration curves for four different ethanol levels
To prepare calibration curves for the wine aroma compounds, solutions were prepared
in a model wine base diluting the highest concentration mixture of pure compounds to
eight concentrations over the analytical range described in Table 4.6. The experiments
were conducted to produce calibration equations for the aroma compounds of interest in
four different ethanol concentrations. Thus, calibration samples of different
concentration were prepared for 5 %, 8 %, 10 % and 13 % ethanol content model wine
base respectively and the samples were injected into a GC-MS according to the
optimised extraction time, extraction temperature and sample volume for the four
different ethanol content solutions. The calibration curves for the compounds of interest
at four different ethanol concentrations were prepared using Chemstation software
(Agilent). The information regarding the target ions, retention time, dwell time, the
concentration of all compounds and internal standard were inserted into the software
before the calibration sample run. The linear regression equation for each compound
was determined from the calibration curve of (volatile compound/internal standard)
peak area ratio versus compound concentrations in solution. The Limit of Detection
(LOD) was determined from the signal to noise ratio for all compounds. Details of the
results of the calibration experiment are presented in Table 4.6.
4.2.8 Confirmation of compound identity
Identification of the aroma compounds was achieved on the basis of mass spectral
information derived from prepared samples of known compounds matched with the
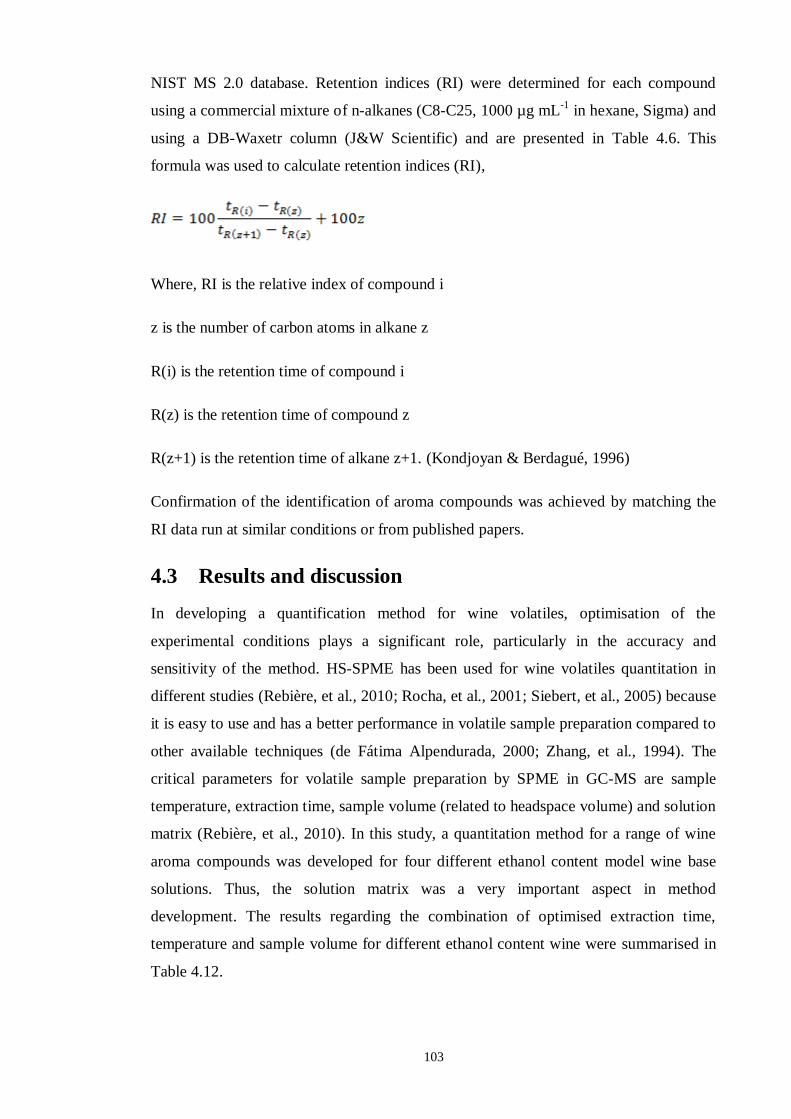
103
NIST MS 2.0 database. Retention indices (RI) were determined for each compound
using a commercial mixture of n-alkanes (C8-C25, 1000 µg mL-1
in hexane, Sigma) and
using a DB-Waxetr column (J&W Scientific) and are presented in Table 4.6. This
formula was used to calculate retention indices (RI),
Where, RI is the relative index of compound i
z is the number of carbon atoms in alkane z
R(i) is the retention time of compound i
R(z) is the retention time of compound z
R(z+1) is the retention time of alkane z+1. (Kondjoyan & Berdagué, 1996)
Confirmation of the identification of aroma compounds was achieved by matching the
RI data run at similar conditions or from published papers.
4.3 Results and discussion
In developing a quantification method for wine volatiles, optimisation of the
experimental conditions plays a significant role, particularly in the accuracy and
sensitivity of the method. HS-SPME has been used for wine volatiles quantitation in
different studies (Rebière, et al., 2010; Rocha, et al., 2001; Siebert, et al., 2005) because
it is easy to use and has a better performance in volatile sample preparation compared to
other available techniques (de Fátima Alpendurada, 2000; Zhang, et al., 1994). The
critical parameters for volatile sample preparation by SPME in GC-MS are sample
temperature, extraction time, sample volume (related to headspace volume) and solution
matrix (Rebière, et al., 2010). In this study, a quantitation method for a range of wine
aroma compounds was developed for four different ethanol content model wine base
solutions. Thus, the solution matrix was a very important aspect in method
development. The results regarding the combination of optimised extraction time,
temperature and sample volume for different ethanol content wine were summarised in
Table 4.12.
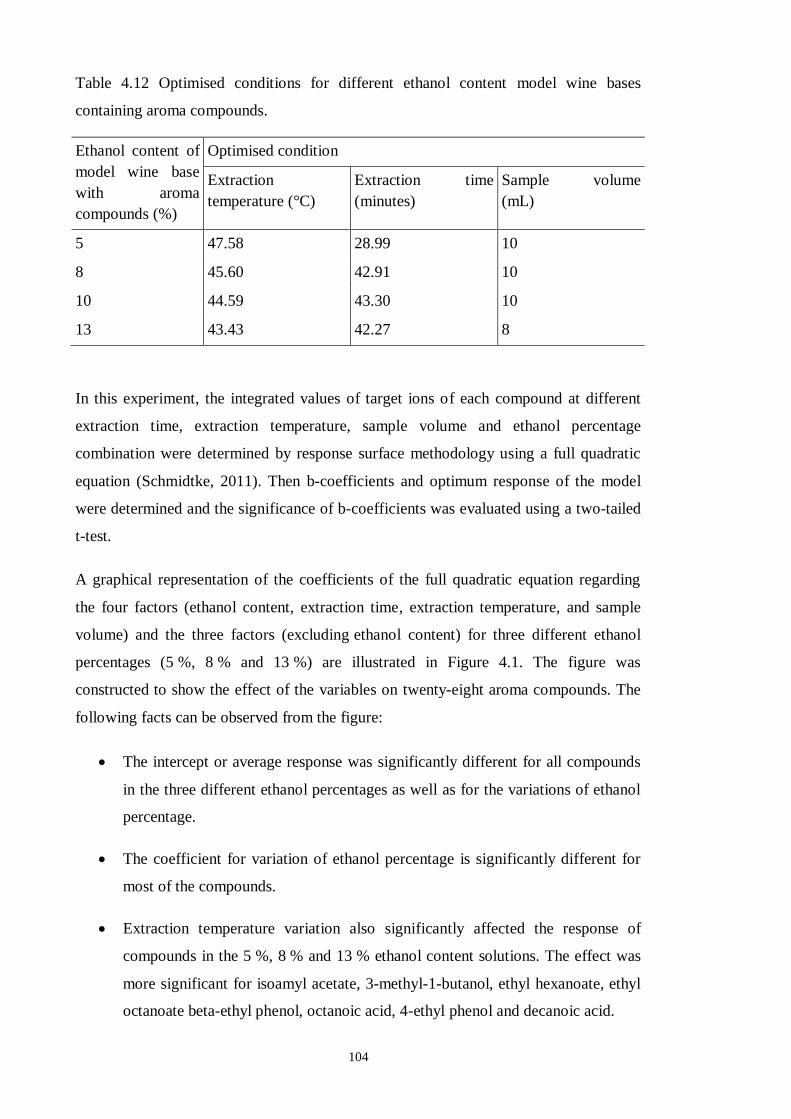
104
Table 4.12 Optimised conditions for different ethanol content model wine bases
containing aroma compounds.
Ethanol content of
model wine base
with aroma
compounds (%)
Optimised condition
Extraction
temperature (°C)
Extraction time
(minutes)
Sample volume
(mL)
5 47.58 28.99 10
8 45.60 42.91 10
10 44.59 43.30 10
13 43.43 42.27 8
In this experiment, the integrated values of target ions of each compound at different
extraction time, extraction temperature, sample volume and ethanol percentage
combination were determined by response surface methodology using a full quadratic
equation (Schmidtke, 2011). Then b-coefficients and optimum response of the model
were determined and the significance of b-coefficients was evaluated using a two-tailed
t-test.
A graphical representation of the coefficients of the full quadratic equation regarding
the four factors (ethanol content, extraction time, extraction temperature, and sample
volume) and the three factors (excluding ethanol content) for three different ethanol
percentages (5 %, 8 % and 13 %) are illustrated in Figure 4.1. The figure was
constructed to show the effect of the variables on twenty-eight aroma compounds. The
following facts can be observed from the figure:
The intercept or average response was significantly different for all compounds
in the three different ethanol percentages as well as for the variations of ethanol
percentage.
The coefficient for variation of ethanol percentage is significantly different for
most of the compounds.
Extraction temperature variation also significantly affected the response of
compounds in the 5 %, 8 % and 13 % ethanol content solutions. The effect was
more significant for isoamyl acetate, 3-methyl-1-butanol, ethyl hexanoate, ethyl
octanoate beta-ethyl phenol, octanoic acid, 4-ethyl phenol and decanoic acid.
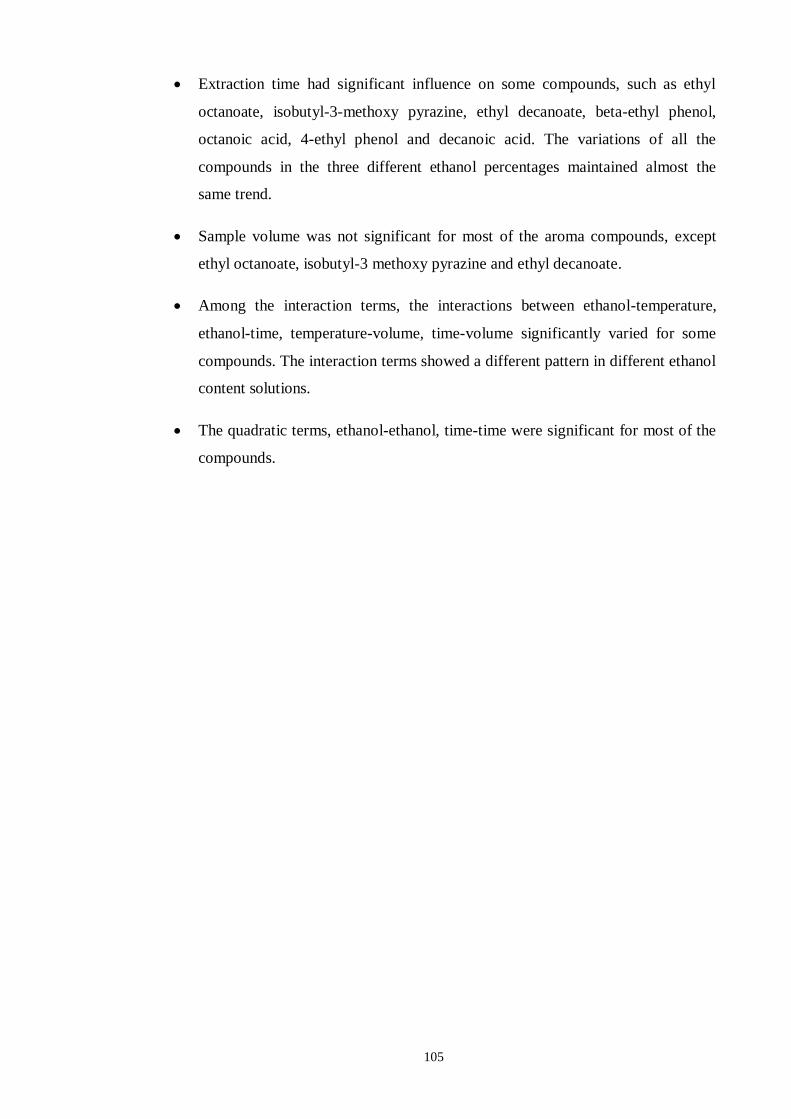
105
Extraction time had significant influence on some compounds, such as ethyl
octanoate, isobutyl-3-methoxy pyrazine, ethyl decanoate, beta-ethyl phenol,
octanoic acid, 4-ethyl phenol and decanoic acid. The variations of all the
compounds in the three different ethanol percentages maintained almost the
same trend.
Sample volume was not significant for most of the aroma compounds, except
ethyl octanoate, isobutyl-3 methoxy pyrazine and ethyl decanoate.
Among the interaction terms, the interactions between ethanol-temperature,
ethanol-time, temperature-volume, time-volume significantly varied for some
compounds. The interaction terms showed a different pattern in different ethanol
content solutions.
The quadratic terms, ethanol-ethanol, time-time were significant for most of the
compounds.
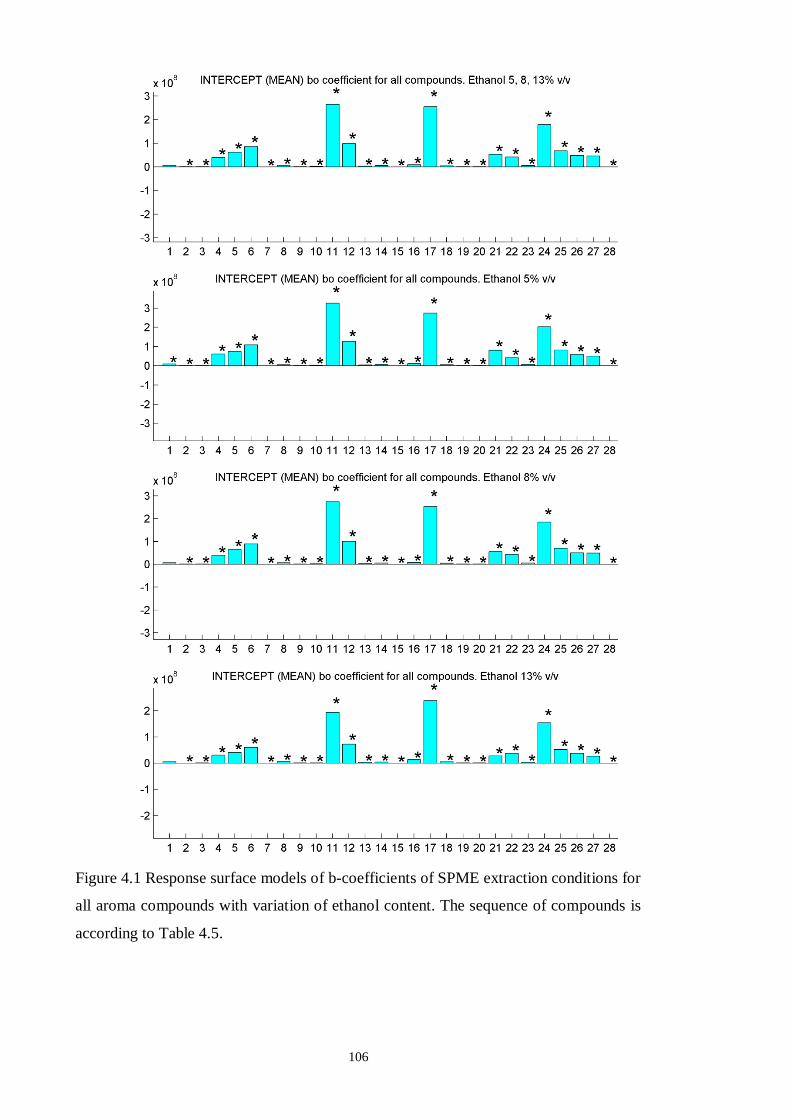
106
Figure 4.1 Response surface models of b-coefficients of SPME extraction conditions for
all aroma compounds with variation of ethanol content. The sequence of compounds is
according to Table 4.5.
107
Figure 4.1 (contd.) Response surface models of b-coefficients of SPME extraction
conditions for all aroma compounds with variation of ethanol content. The sequence of
compounds is according to Table 4.5.
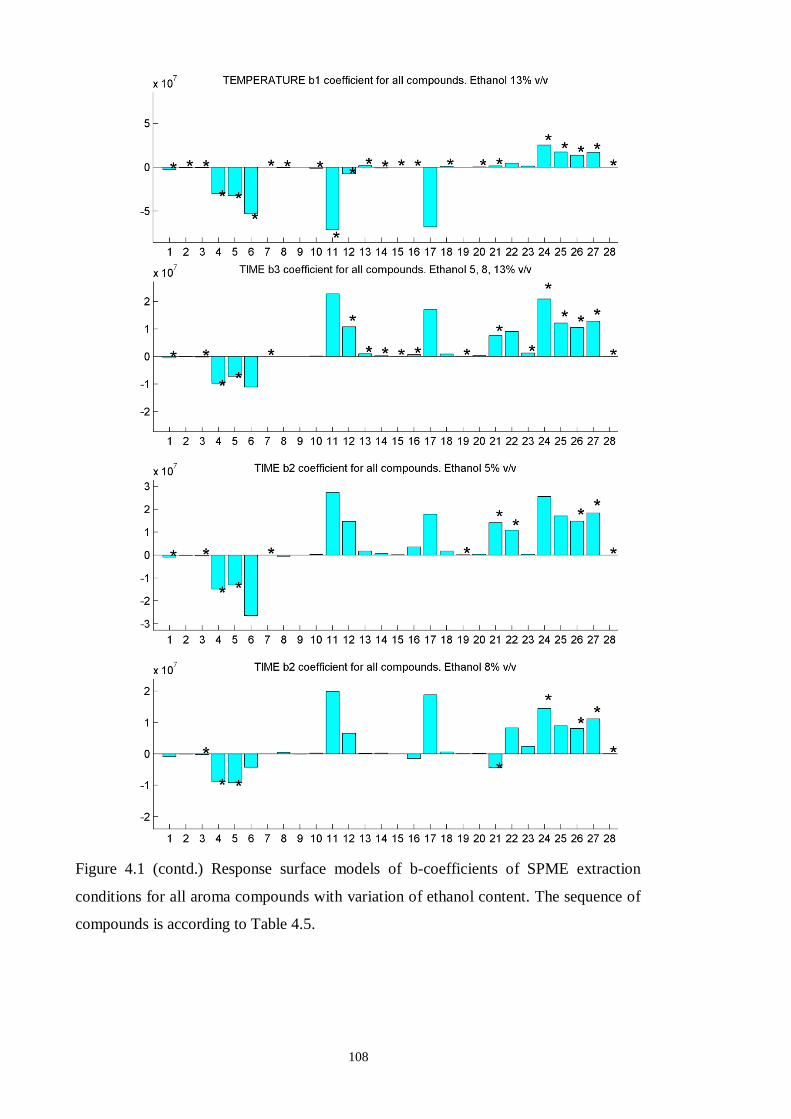
108
Figure 4.1 (contd.) Response surface models of b-coefficients of SPME extraction
conditions for all aroma compounds with variation of ethanol content. The sequence of
compounds is according to Table 4.5.
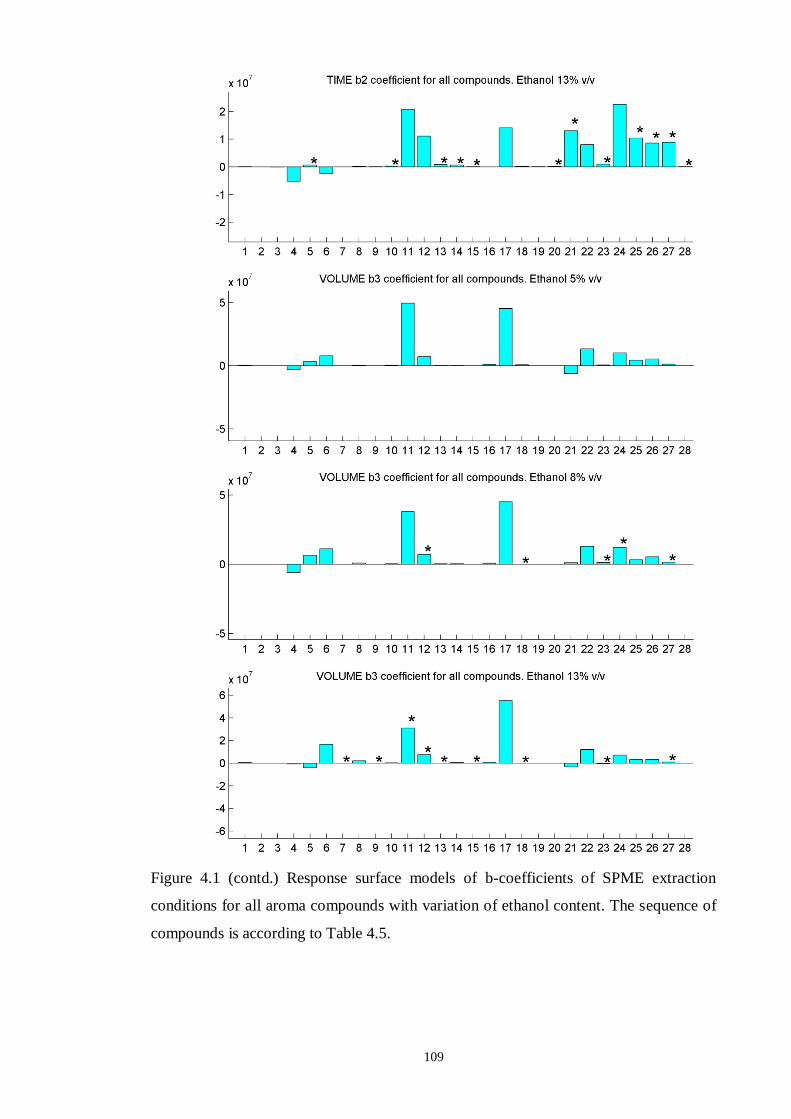
109
Figure 4.1 (contd.) Response surface models of b-coefficients of SPME extraction
conditions for all aroma compounds with variation of ethanol content. The sequence of
compounds is according to Table 4.5.
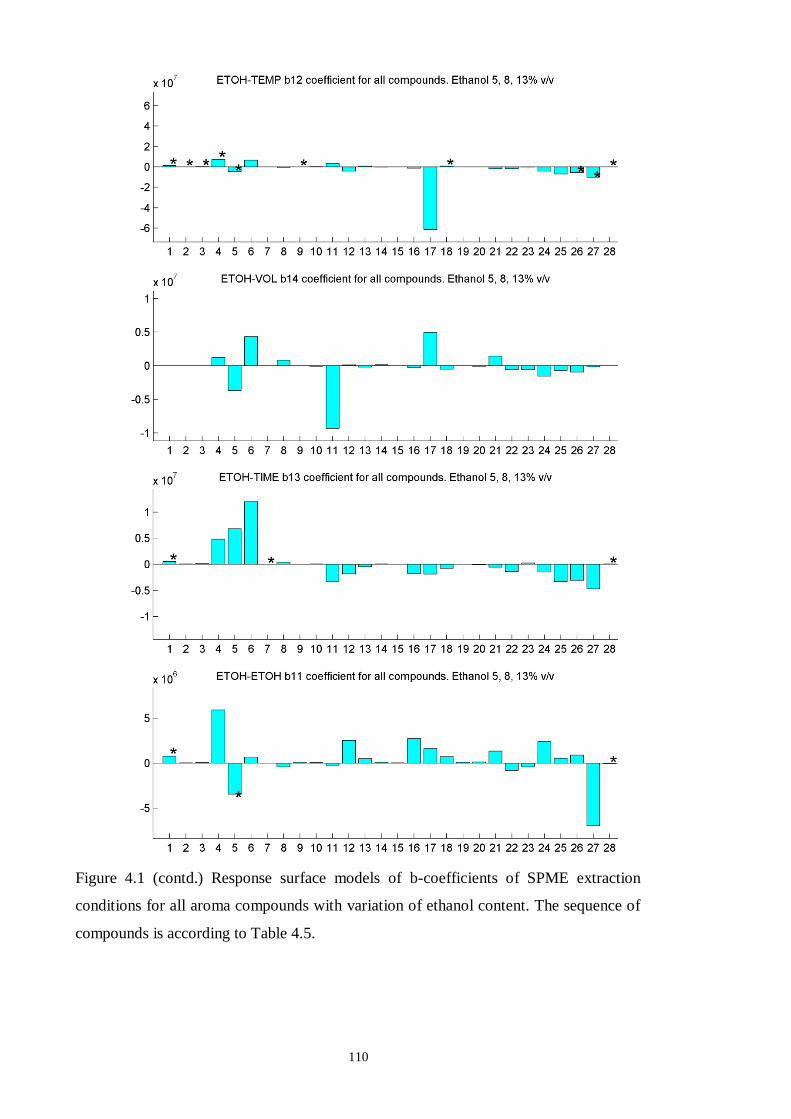
110
Figure 4.1 (contd.) Response surface models of b-coefficients of SPME extraction
conditions for all aroma compounds with variation of ethanol content. The sequence of
compounds is according to Table 4.5.
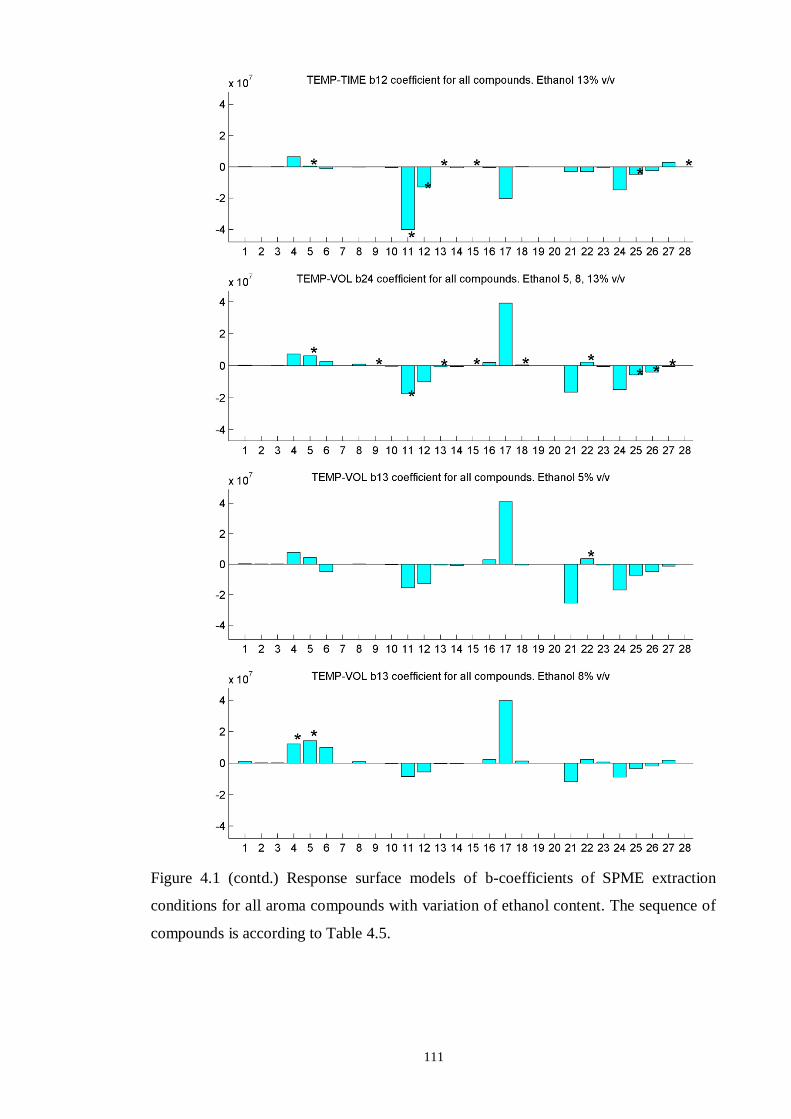
111
Figure 4.1 (contd.) Response surface models of b-coefficients of SPME extraction
conditions for all aroma compounds with variation of ethanol content. The sequence of
compounds is according to Table 4.5.
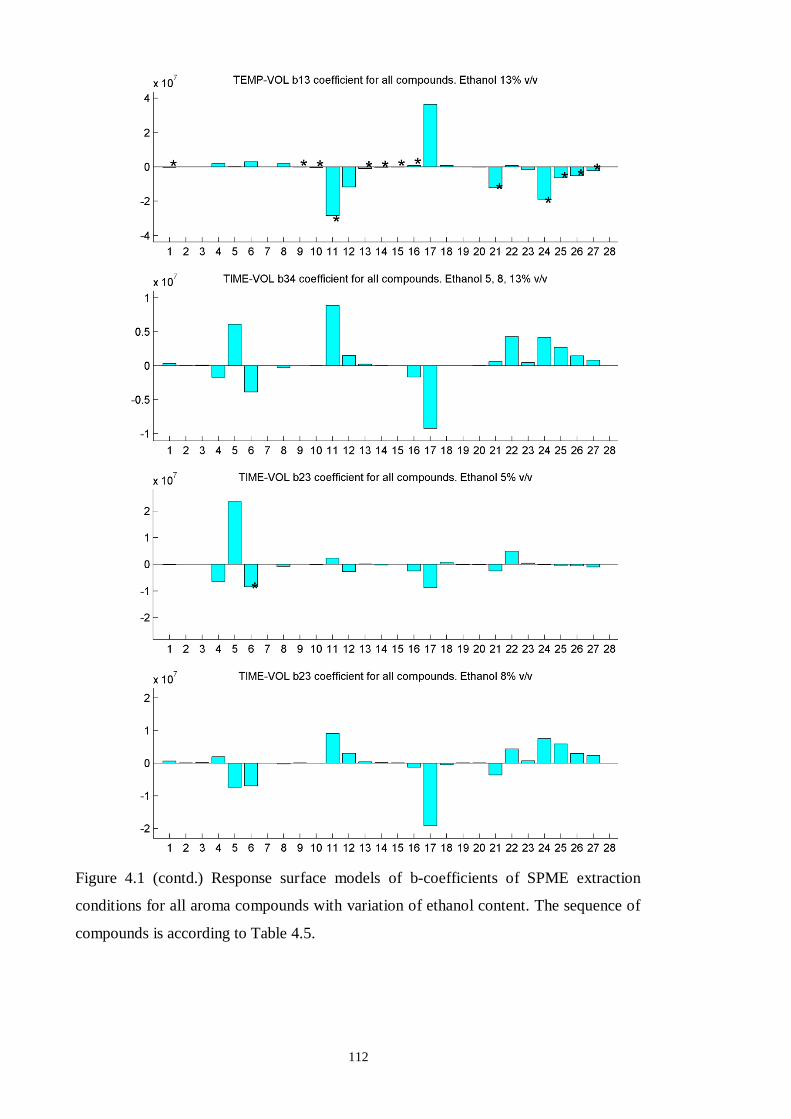
112
Figure 4.1 (contd.) Response surface models of b-coefficients of SPME extraction
conditions for all aroma compounds with variation of ethanol content. The sequence of
compounds is according to Table 4.5.
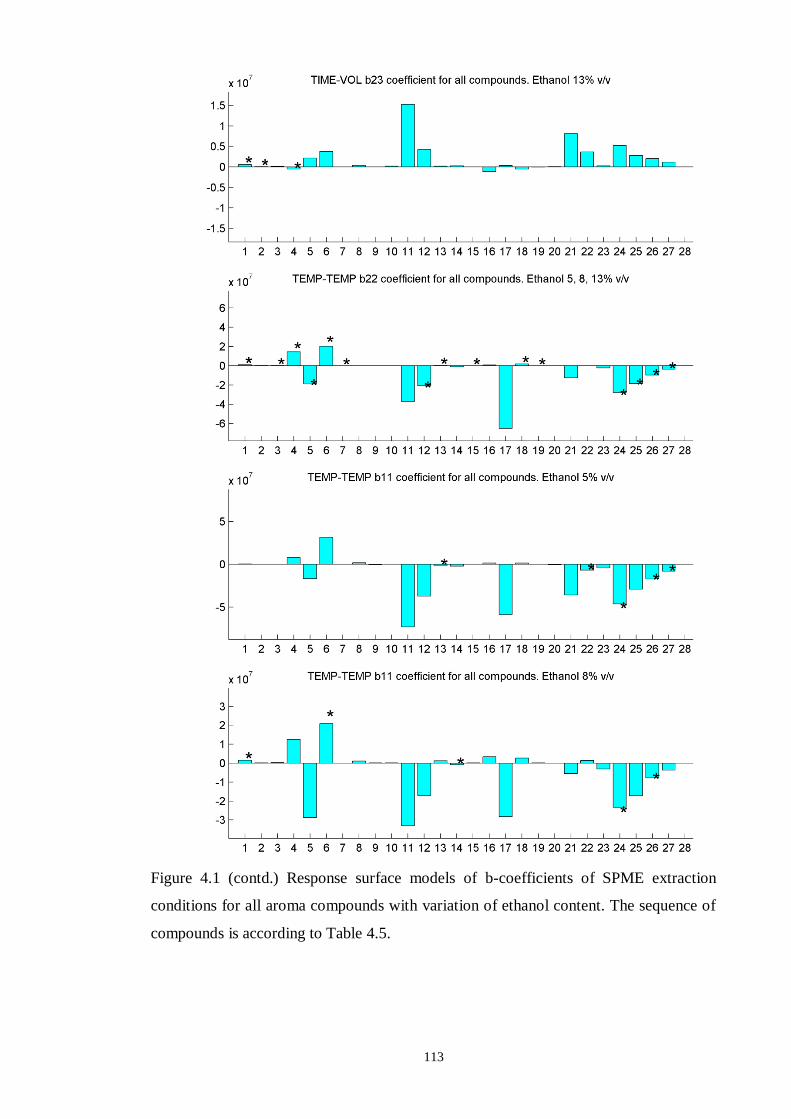
113
Figure 4.1 (contd.) Response surface models of b-coefficients of SPME extraction
conditions for all aroma compounds with variation of ethanol content. The sequence of
compounds is according to Table 4.5.
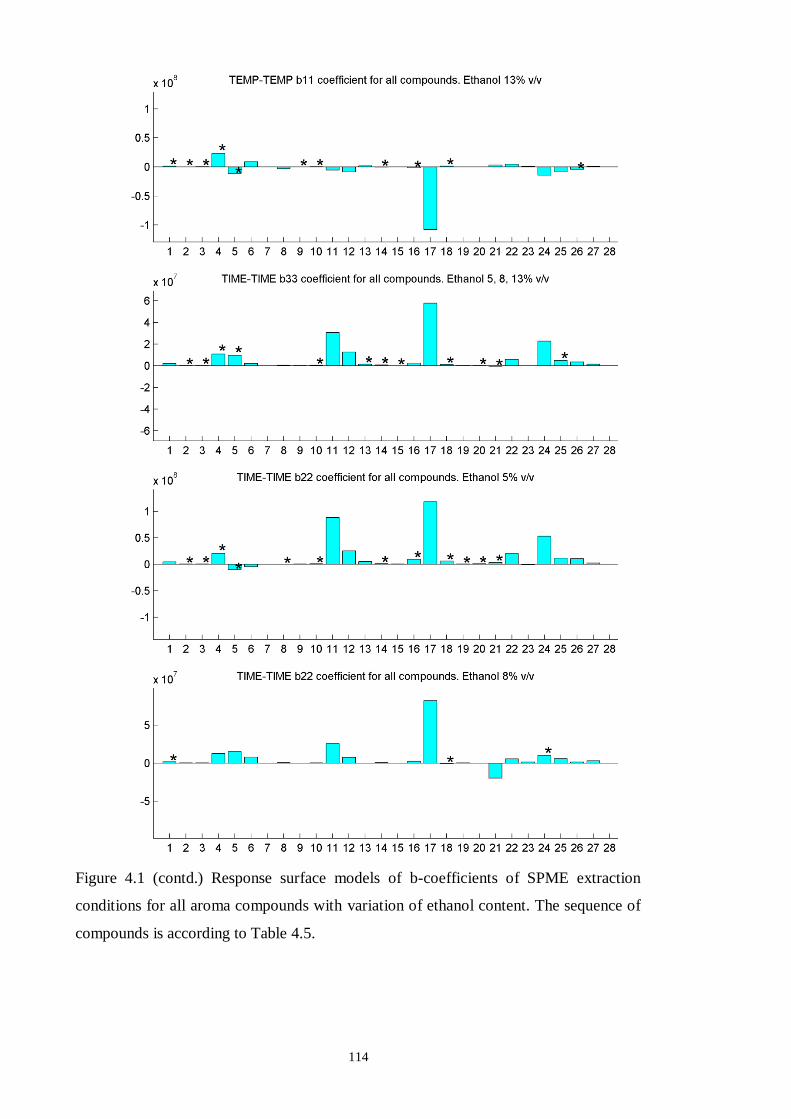
114
Figure 4.1 (contd.) Response surface models of b-coefficients of SPME extraction
conditions for all aroma compounds with variation of ethanol content. The sequence of
compounds is according to Table 4.5.
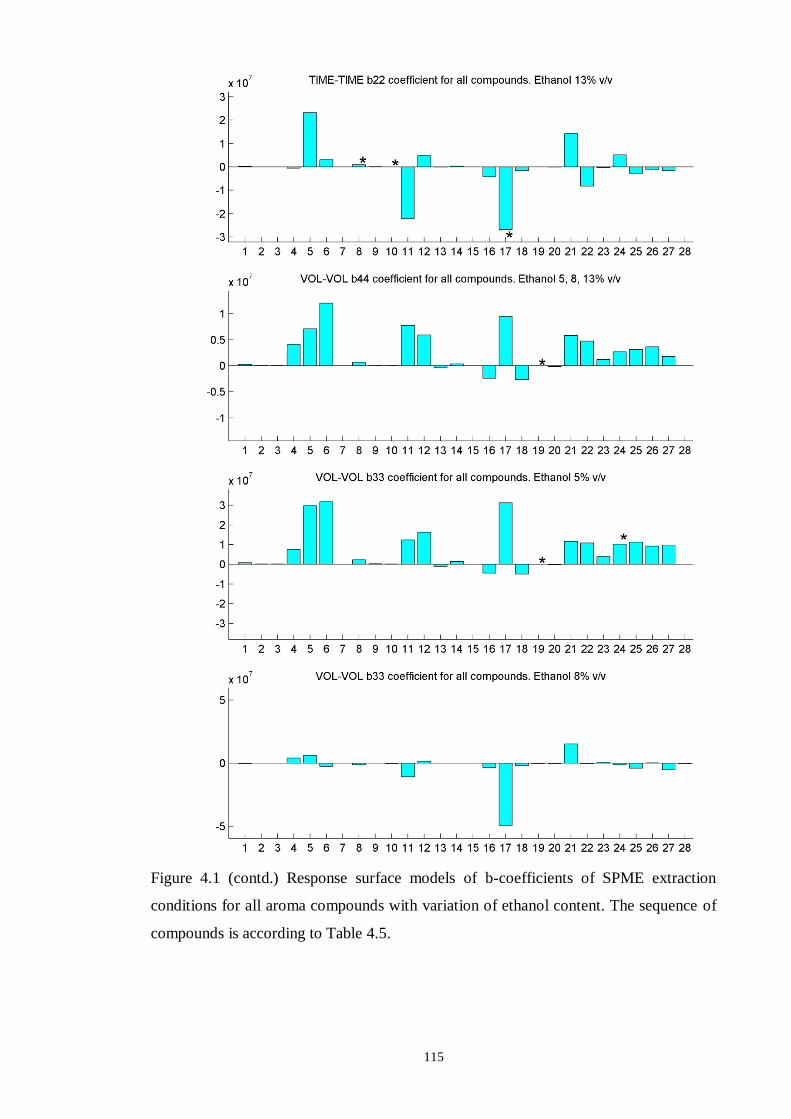
115
Figure 4.1 (contd.) Response surface models of b-coefficients of SPME extraction
conditions for all aroma compounds with variation of ethanol content. The sequence of
compounds is according to Table 4.5.
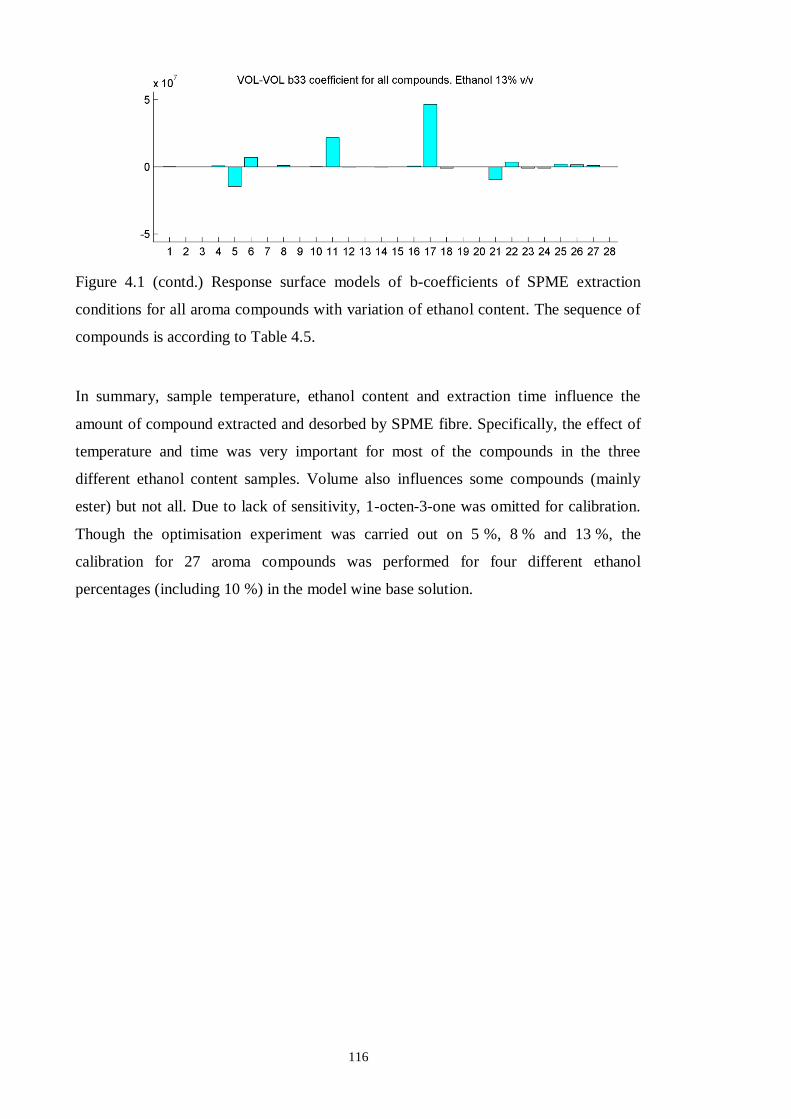
116
Figure 4.1 (contd.) Response surface models of b-coefficients of SPME extraction
conditions for all aroma compounds with variation of ethanol content. The sequence of
compounds is according to Table 4.5.
In summary, sample temperature, ethanol content and extraction time influence the
amount of compound extracted and desorbed by SPME fibre. Specifically, the effect of
temperature and time was very important for most of the compounds in the three
different ethanol content samples. Volume also influences some compounds (mainly
ester) but not all. Due to lack of sensitivity, 1-octen-3-one was omitted for calibration.
Though the optimisation experiment was carried out on 5 %, 8 % and 13 %, the
calibration for 27 aroma compounds was performed for four different ethanol
percentages (including 10 %) in the model wine base solution.
117
Chapter 5 Headspace Composition Analysis of
Different Ethanol Content Wine
5.1 Introduction
Wine aroma is one of the most important physical characteristics for maintaining the
quality of the product as perceived by consumers (Charters & Pettigrew, 2007; Verdú
Jover et al., 2004). This attribute also plays a significant role in the constitution of the
subtle differences between the vast number of wine styles and varieties which in turn
influence consumers’ preference for any particular style or variety of wine (Capone, et
al., 2013; Maitre et al., 2010). The aroma of a wine results from a complex interaction
between numerous volatile chemical compounds and these interactions occur in various
ways to achieve the final aroma (Styger, et al., 2011). The large numbers of volatile and
non-volatile compounds in wine also interact with each other to influence the volatility
of aroma compounds as well as the headspace concentration of these compounds
(Villamor & Ross, 2013). As the headspace concentrations directly represent the
availability of the aroma compounds (Jung & Ebeler, 2002), any change of headspace
concentration of wine may affect its aroma perception. There have been many studies
undertaken by wine flavour scientists to explore and quantify the most important aroma
compounds in varieties of wine (Chisholm, et al., 1994; Escudero, et al., 2007; Guth,
1997b) and to determine the effect of the interaction between aroma compounds and
other components in the wine matrix on wine aroma (Aznar, et al., 2004; Dufour &
Bayonove, 1999a, 1999b). Usually, analytical instruments such as gas chromatography
(GC) coupled with mass spectrometry (MS), olfactometry (O) or a flame ionisation
detector, are used to analyse the wine headspace for the identification and quantification
of aroma compounds in wine (Rebière, et al., 2010).
Ethanol is one of the major compounds in wine that has a physiochemical and
perceptual effect on other wine volatiles. Previous studies on static headspace analysis
have shown that ethanol content in a solution influences the partition coefficient of the
volatile compounds as well as their headspace concentration (Athès, et al., 2004;
Conner, et al., 1998; Villamor et al., 2013; Voilley, et al., 1991; Whiton & Zoecklein,
2000). The partition coefficient of a volatile compound is mainly governed by aroma
compound volatility and solubility. Previous researchers have found that an increase of
ethanol concentration causes reduction of the partition coefficient of volatile compounds
118
that results in a decrease of the volatility of aroma compounds. Consequently the
headspace concentration of volatile compounds is reduced at equilibrium condition with
increased ethanol concentration and vice versa. This will affect the aroma perception of
wine (Pozo-Bayón & Reineccius, 2009; Villamor & Ross, 2013; Whiton & Zoecklein,
2000). It has been observed that lowering ethanol to a certain percentage increases the
intensities of fruity, flowery and acid aromas, but a small percentage reduction of
ethanol (nearly 1 %) has no effect on wine aroma (Grosch, 2001). However, dynamic
volatile headspace studies have indicated a different scenario. It was evaluated that
ethanol content in a solution helps in maintaining volatile compounds delivery into
headspace and results in higher headspace concentration of volatile compounds
(Tsachaki, et al., 2005). Thus it is a quite interesting issue to wine researchers to explore
the nature of the interaction between ethanol concentration and headspace composition
of volatiles and to determine the aroma composition of reduced ethanol content wine.
Although a number of studies have been conducted using GC-MS or GC-O analysis of
varieties of wine to determine their wine aroma composition (Barata, et al., 2011;
Bonino et al., 2003; Campo et al., 2008; Capone, et al., 2013; Rebière, et al., 2010),
there are few reports on the headspace composition of reduced ethanol wine.
The main purpose of this research project was to develop a GC-MS method to identify
and quantify the most important wine aroma compounds in different ethanol content
wines. Popular wine varieties, Chardonnay (white wine), Sauvignon Blanc (white wine)
and Shiraz (red wine) were selected to reduce ethanol to 8 % and 5 % by a combined
process of reverse osmosis and evaporative perstraction. The aroma composition of
reduced ethanol content and original wine was analysed with the developed GC method
(described in Chapter 4) and the differences of aroma composition between reduced
ethanol content and original wine were examined. In addition, the 5 % ethanol content
of all varieties was returned back to the original ethanol percentage and analysed to find
out whether the aroma composition of the 5 % ethanol wine adjusted back to its original
ethanol content (hereafter referred to as readjusted wine) was similar to the original
wine or not. The resultant aroma compositions of the reduced ethanol content wine and
the findings regarding the differences of aroma composition are reported in this chapter.
119
5.2 Materials and methods
5.2.1 Preparation and preservation of reduced ethanol wine samples
Chardonnay, Shiraz and Sauvignon Blanc wine were supplied from Charles Sturt
University Winery for ethanol reduction. The original ethanol content of Chardonnay,
Shiraz and Sauvignon Blanc was 12.21 %, 13.67 % and 9.91 % respectively. Alcohol
adjustment equipment from Memstar Technology Ltd was used to reduce the ethanol of
these wine varieties to 8 % and 5 % in a triplicate experiment. After the ethanol
reduction process, the wine samples were preserved in 750 mL wine bottles and pure
carbon dioxide was injected prior to sealing with screw caps. All the reduced wine and
original wine samples were stored in a cold room at 16 °C before GC-MS analysis. The
full details of the reduced wine sample preparation and preservation were described in
Chapter 3.
5.2.2 Preparation of readjusted wine samples
During the ethanol reduction process, ethanol was removed from the original wines to
get 5 % and 8 % ethanol content wines. To prepare the readjusted wine samples (wines
adjusted back to their original ethanol content), samples of the 5 % ethanol content wine
was mixed with ethanol (analytical grade, Prolabo, 98.6 % v/v). The volume of ethanol
added to readjust Chardonnay from 5 % ethanol to 12.21 % ethanol was 7.675 mL per
100 mL of 5 % ethanol wine. Similarly, 8.875 mL and 4.82 mL of ethanol was added
per 100 mL of 5 % ethanol wine for Shiraz and Sauvignon Blanc respectively. The
readjusted wine samples were stored at 1.8 °C. After 24 hours and 14 days storage the
readjusted wine samples were analysed using the solid-phase microextraction (SPME)
GC-MS method described in Section 5.2.3.
5.2.3 Final sample analysis conditions
The optimised conditions and calibration parameters for the four different ethanol
content samples (5 %, 8 %, 10 %, 13 %) using the solid-phase microextraction GC-MS
method were determined to conduct aroma analysis of Chardonnay, Shiraz and
Sauvignon Blanc that had different ethanol contents. Details of the method development
were given in Chapter 4. Samples (10 mL) of 5 %, 8 % and 10 % (original Sauvignon
Blanc) ethanol content wine and 8 mL samples of 13 % (original Chardonnay and
Shiraz) were placed into a 20 mL headspace vial. The internal standard mix (100 µL)
was added to each vial and screw caps were applied. Sample vials were stored at 8 °C
120
until analysis, at which time they were transferred to the heater block set to 45 °C and
allowed to equilibrate for 20 minutes while shaken (250 rpm). The incubation
temperatures of 5 %, 8 % 10 % and 13 % ethanol content samples were 48 °C, 46 °C,
45 °C and 44 °C respectively. A DVB/CAR/PDMS SPME fibre was inserted into the
headspace of the sample vial to extract volatile compounds from the wine samples. The
extraction times for 5 %, 8 %, 10 % and 13 % ethanol content wine samples were 29
minutes, 43 minutes, 43minutes and 42 minutes respectively. The extraction of the wine
samples was performed with vial shaking and the extracted sample was inserted into the
injector of GC-MS at 260 °C in splitless mode for 1 minute. The readjusted wine
samples (10 % and 13 % ethanol content) were injected following the same procedure
as the equivalent original wine samples. All other conditions were as described in the
previous chapter.
5.2.4 Data analysis for different ethanol content wine
The mean and standard error concentrations of volatile compounds in 5 %, 8 %, original
and readjusted samples of Chardonnay, Shiraz and Sauvignon Blanc are shown in
Tables 5.1, 5.2 and 5.3 respectively. To determine the effect of ethanol reduction of the
three varieties of wine, a one way ANOVA was performed with the dependent variables
(volatile compounds) modelled at the five different ethanol percentages found in the
wine samples.
5.3 Experimental plan
The GC-MS analyses of the wine samples were performed in the following
experimental plan. The experiment was designed as,
Three wine varieties - Chardonnay, Sauvignon Blanc, Shiraz
Five levels of ethanol concentration - original, 8 %, 5 %, readjusted wine after
24 hours and readjusted wine after 14 days
Three replicates
In total, 45 wine samples were analysed by SPME and GC-MS to determine the
headspace composition of different ethanol content wines.
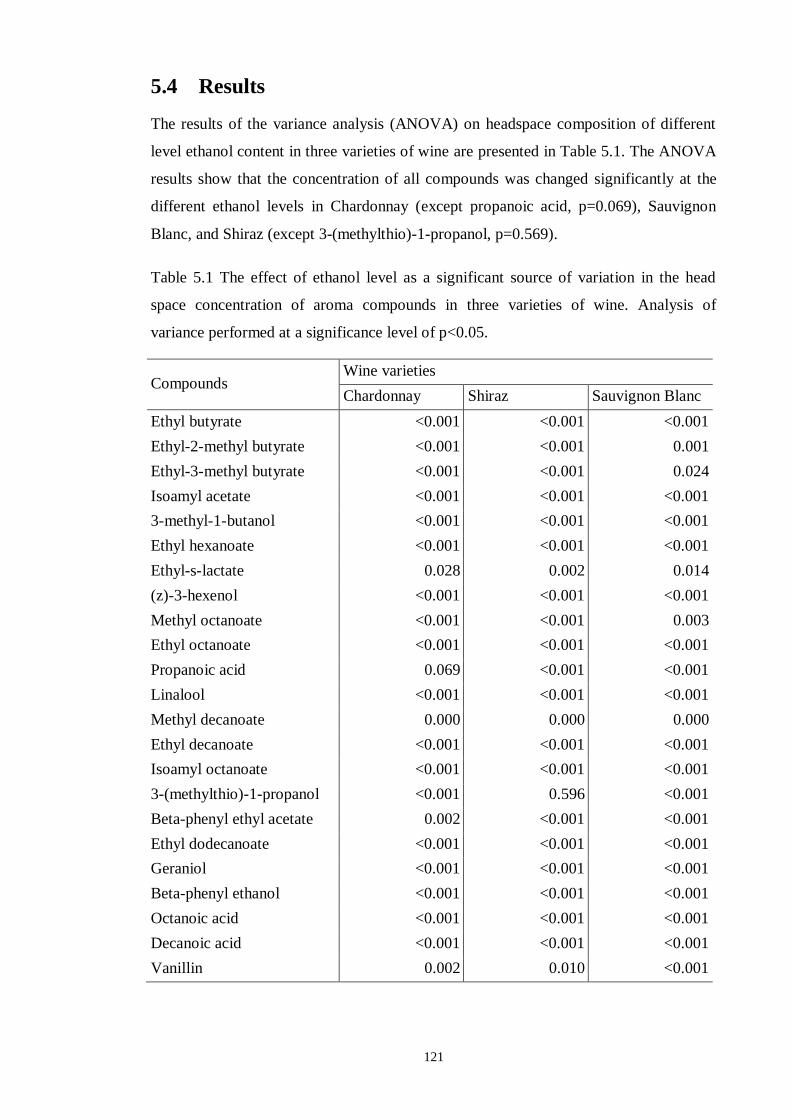
121
5.4 Results
The results of the variance analysis (ANOVA) on headspace composition of different
level ethanol content in three varieties of wine are presented in Table 5.1. The ANOVA
results show that the concentration of all compounds was changed significantly at the
different ethanol levels in Chardonnay (except propanoic acid, p=0.069), Sauvignon
Blanc, and Shiraz (except 3-(methylthio)-1-propanol, p=0.569).
Table 5.1 The effect of ethanol level as a significant source of variation in the head
space concentration of aroma compounds in three varieties of wine. Analysis of
variance performed at a significance level of p<0.05.
Compounds Wine varieties
Chardonnay Shiraz Sauvignon Blanc
Ethyl butyrate <0.001 <0.001 <0.001
Ethyl-2-methyl butyrate <0.001 <0.001 0.001
Ethyl-3-methyl butyrate <0.001 <0.001 0.024
Isoamyl acetate <0.001 <0.001 <0.001
3-methyl-1-butanol <0.001 <0.001 <0.001
Ethyl hexanoate <0.001 <0.001 <0.001
Ethyl-s-lactate 0.028 0.002 0.014
(z)-3-hexenol <0.001 <0.001 <0.001
Methyl octanoate <0.001 <0.001 0.003
Ethyl octanoate <0.001 <0.001 <0.001
Propanoic acid 0.069 <0.001 <0.001
Linalool <0.001 <0.001 <0.001
Methyl decanoate 0.000 0.000 0.000
Ethyl decanoate <0.001 <0.001 <0.001
Isoamyl octanoate <0.001 <0.001 <0.001
3-(methylthio)-1-propanol <0.001 0.596 <0.001
Beta-phenyl ethyl acetate 0.002 <0.001 <0.001
Ethyl dodecanoate <0.001 <0.001 <0.001
Geraniol <0.001 <0.001 <0.001
Beta-phenyl ethanol <0.001 <0.001 <0.001
Octanoic acid <0.001 <0.001 <0.001
Decanoic acid <0.001 <0.001 <0.001
Vanillin 0.002 0.010 <0.001
122
The mean and standard error of the volatile compounds at different ethanol contents of
Chardonnay, Shiraz and Sauvignon Blanc are presented in Table 5.2, Table 5.3 and
Table 5.4 respectively.
The boxplots in Figure 5.1 contain a graphical representation of the significant
differences in the headspace concentration of 23 volatile compounds at different ethanol
contents in samples of Chardonnay, Sauvignon Blanc and Shiraz. These box plots
simplify the comparison of the effect of variety and ethanol concentration on the
concentration of individual compounds.
For Chardonnay (Table 5.2), the concentration of nearly all compounds decreased
significantly from the original wine (13 % ethanol) to the 5 % ethanol content wine
except ethyl-s-lactate, propanoic acid, linalool, beta-phenyl ethanol and vanillin. Ethyl-
s-lactate, propanoic acid and vanillin at 5 % ethanol did not significantly vary from the
original, but beta-phenyl ethanol and linalool significantly increased. Except for isoamyl
acetate and beta-phenyl acetate, all ester compounds in 8 % ethanol reduced
significantly from the original wine (nearly 13 %). However, most of the compounds
belonging to aldehyde and acid classes were not changed significantly by the reduction
of the ethanol content from the original level (13 %) to 8 %. Among alcohol
compounds, beta-phenyl ethanol increased but (z)-3-hexenol decreased significantly.
With a decrease from 8 % to 5 % ethanol, the concentration of most esters and terpenes
showed a similar change to that seen in the reduction from the original ethanol level to
the 8 % level, but the concentration of most of the alcohols, acid and aldehydes were not
significantly different.
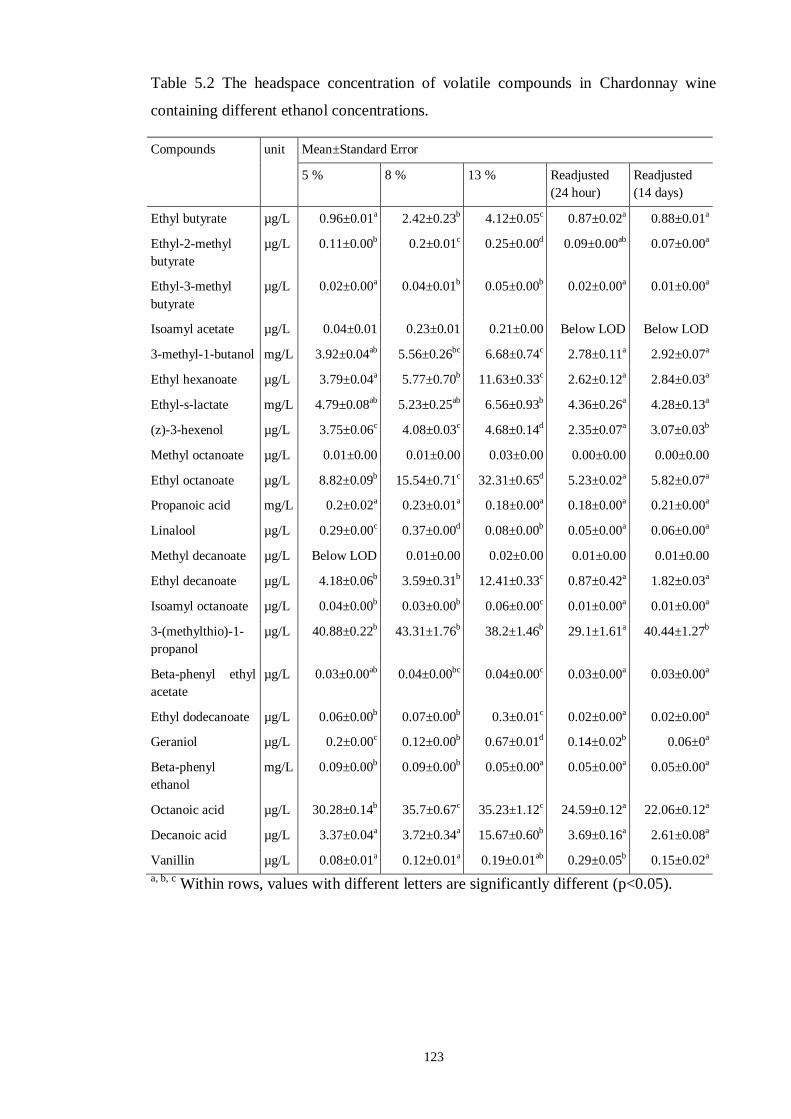
123
Table 5.2 The headspace concentration of volatile compounds in Chardonnay wine
containing different ethanol concentrations.
Compounds unit Mean±Standard Error
5 % 8 % 13 % Readjusted
(24 hour)
Readjusted
(14 days)
Ethyl butyrate µg/L 0.96±0.01a 2.42±0.23b 4.12±0.05c 0.87±0.02a 0.88±0.01a
Ethyl-2-methyl
butyrate
µg/L 0.11±0.00b 0.2±0.01c 0.25±0.00d 0.09±0.00ab 0.07±0.00a
Ethyl-3-methyl
butyrate
µg/L 0.02±0.00a 0.04±0.01b 0.05±0.00b 0.02±0.00a 0.01±0.00a
Isoamyl acetate µg/L 0.04±0.01 0.23±0.01 0.21±0.00 Below LOD Below LOD
3-methyl-1-butanol mg/L 3.92±0.04ab 5.56±0.26bc 6.68±0.74c 2.78±0.11a 2.92±0.07a
Ethyl hexanoate µg/L 3.79±0.04a 5.77±0.70b 11.63±0.33c 2.62±0.12a 2.84±0.03a
Ethyl-s-lactate mg/L 4.79±0.08ab 5.23±0.25ab 6.56±0.93b 4.36±0.26a 4.28±0.13a
(z)-3-hexenol µg/L 3.75±0.06c 4.08±0.03c 4.68±0.14d 2.35±0.07a 3.07±0.03b
Methyl octanoate µg/L 0.01±0.00 0.01±0.00 0.03±0.00 0.00±0.00 0.00±0.00
Ethyl octanoate µg/L 8.82±0.09b 15.54±0.71c 32.31±0.65d 5.23±0.02a 5.82±0.07a
Propanoic acid mg/L 0.2±0.02a 0.23±0.01a 0.18±0.00a 0.18±0.00a 0.21±0.00a
Linalool µg/L 0.29±0.00c 0.37±0.00d 0.08±0.00b 0.05±0.00a 0.06±0.00a
Methyl decanoate µg/L Below LOD 0.01±0.00 0.02±0.00 0.01±0.00 0.01±0.00
Ethyl decanoate µg/L 4.18±0.06b 3.59±0.31b 12.41±0.33c 0.87±0.42a 1.82±0.03a
Isoamyl octanoate µg/L 0.04±0.00b 0.03±0.00b 0.06±0.00c 0.01±0.00a 0.01±0.00a
3-(methylthio)-1-
propanol
µg/L 40.88±0.22b 43.31±1.76b 38.2±1.46b 29.1±1.61a 40.44±1.27b
Beta-phenyl ethyl
acetate
µg/L 0.03±0.00ab 0.04±0.00bc 0.04±0.00c 0.03±0.00a 0.03±0.00a
Ethyl dodecanoate µg/L 0.06±0.00b 0.07±0.00b 0.3±0.01c 0.02±0.00a 0.02±0.00a
Geraniol µg/L 0.2±0.00c 0.12±0.00b 0.67±0.01d 0.14±0.02b 0.06±0a
Beta-phenyl
ethanol
mg/L 0.09±0.00b 0.09±0.00
b 0.05±0.00
a 0.05±0.00
a 0.05±0.00
a
Octanoic acid µg/L 30.28±0.14b 35.7±0.67c 35.23±1.12c 24.59±0.12a 22.06±0.12a
Decanoic acid µg/L 3.37±0.04a 3.72±0.34a 15.67±0.60b 3.69±0.16a 2.61±0.08a
Vanillin µg/L 0.08±0.01a 0.12±0.01a 0.19±0.01ab 0.29±0.05b 0.15±0.02a
a, b, c Within rows, values with different letters are significantly different (p<0.05).
124
In Shiraz wine (Table 5.3), it was observed that the concentration of most of the esters
were reduced significantly with the reduction of ethanol from the original level (13 %)
to 5 % and nearly half of them had their concentration significantly reduced with a
reduction from 13 % to 8 % ethanol, and from 8 % to 5 % ethanol. The concentration of
beta-phenyl ethanol increased with the reduction of ethanol from the original level
(13 %) to 8 % and 5 %. The concentration of other alcohols were significantly reduced
in the 5 % ethanol content sample compared to the original sample (13 %) but no
significant difference was found between the 5 % and 8 % ethanol content samples. The
only compounds that showed an increase in concentration was propanoic acid. All other
acids showed a decrease in concentration with ethanol reduction. Terpenes
concentrations were reduced significantly from 13 % to 8 %, but the change was
insignificant with a reduction from 8 % to 5 %.

125
Table 5.3 The headspace concentration of volatile compounds in Shiraz wine containing
different ethanol concentrations.
Compounds unit Mean±Standard Error
5 % 8 % 13 % Readjusted
(24 hour)
Readjusted
(14 days)
Ethyl butyrate µg/L 0.9±0.01a 1.72±0.08b 2.69±0.06c 0.75±0.01a 0.76±0.02a
Ethyl-2-methyl
butyrate
µg/L 0.33±0.00b 0.46±0.03c 0.47±0.01c 0.23±0.01a 0.17±0.00a
Ethyl-3-methyl
butyrate
µg/L 0.05±0.00b 0.08±0.01c 0.08±0.00c 0.04±0.00ab 0.03±0.00a
Isoamyl acetate µg/L 0.21±0.01b 0.43±0.03c 0.51±0.03c 0.08±0.01a 0.08±0.01a
3-methyl-1-butanol mg/L 6.18±0.06ab 6.64±0.41b 9.05±0.24c 5.62±0.17ab 5.38±0.13a
Ethyl hexanoate µg/L 1.72±0.02a 2.34±0.23a 5.41±0.88b 1.38±0.11a 1.51±0.05a
Ethyl-s-lactate mg/L 33.47±0.72a 32.32±2.6a 47.3±3.06b 41.86±1.87ab 33.89±1.56a
(z)-3-hexenol µg/L 5.32±0.10c 5.42±0.04c 6.83±0.05d 3.61±0.14a 4.49±0.08b
Methyl octanoate µg/L 0.01±0.00b 0.01±0.00b 0.02±0.00b 0.00±0.00a 0.00±0.00a
Ethyl octanoate µg/L 3.17±0.01b 4.90±0.15c 7.32±0.15d 2.31±0.02a 2.17±0.05a
Propanoic acid mg/L 0.60±0.02c 0.25±0.01ab 0.22±0.00a 0.24±0.00a 0.29±0.01b
Linalool µg/L 0.53±0b 0.59±0.01b 0.25±0.06a 0.27±0.01a 0.27±0.00a
Methyl decanoate µg/L Below LOD 0.01±0.00 0.01±0.00 0.01±0.00 0.01±0.00
Ethyl decanoate µg/L 1.66±0.02bc 1.39±0.10b 2.64±0.46c 0.19±0.13a 0.74±0.09ab
Isoamyl octanoate µg/L 0.02±0.00b 0.02±0.00b 0.02±0.00b 0.01±0.00a 0.01±0.00a
3-(methylthio)-1-
propanol
µg/L 103.04±0.42a 100.66±0.87a 102.68±12.04a 92.15±3.44a 90.67±9.40a
Beta-phenyl ethyl
acetate
µg/L 0.03±0.00a 0.04±0.00a 0.05±0.00b 0.02±0.00a 0.03±0.00a
Ethyl dodecanoate µg/L 0.04±0.00a 0.03±0.00a 0.12±0.01b 0.02±0.00a 0.02±0.00a
Geraniol µg/L 0.09±0.00a 0.09±0.00a 0.25±0.03b 0.06±0.00a 0.06±0.00a
Beta-phenyl
ethanol
mg/L 0.28±0.00d 0.32±0.00
e 0.24±0.00
c 0.23±0.00
b 0.2±0.00
a
Octanoic acid µg/L 8±0.12c 7.10±0.19b 9.01±0.3d 6.58±0.08b 5.36±0.10a
Decanoic acid µg/L 0.94±0.01a 0.90±0.02a 2.16±0.22b 1.16±0.05a 0.96±0.05a
Vanillin µg/L 0.80±0.06a 1.16±0.1ab 1.13±0.09ab 2.01±0.40b 0.92±0.08a
a, b, c, d Within rows, values with different letters are significantly different (p<0.05).
126
Sauvignon Blanc (Table 5.4) aroma composition at different ethanol content levels
showed a similar pattern of changes to the other two varieties. The concentration of
ester compounds reduced the most with a decrease in ethanol content from 10 % to 5 %,
but did not change much with a reduction from 8 % to 5 %. The concentration of
alcohol compounds, except beta-phenyl ethanol, decreased significantly with a
reduction from 10 % to 8 % ethanol, but their concentrations were not much different
between 8 % and 5 % ethanol. Vanillin, a phenolic aldehyde, also changed in the similar
pattern. The concentration of propanoic acid increased with the reduction of ethanol
level, but other acids did not. The concentration of terpene compounds also decreased
significantly with a reduction in ethanol content from 10 % to 8 %, but were not much
changed with a further reduction from 8 % and 5 % ethanol.
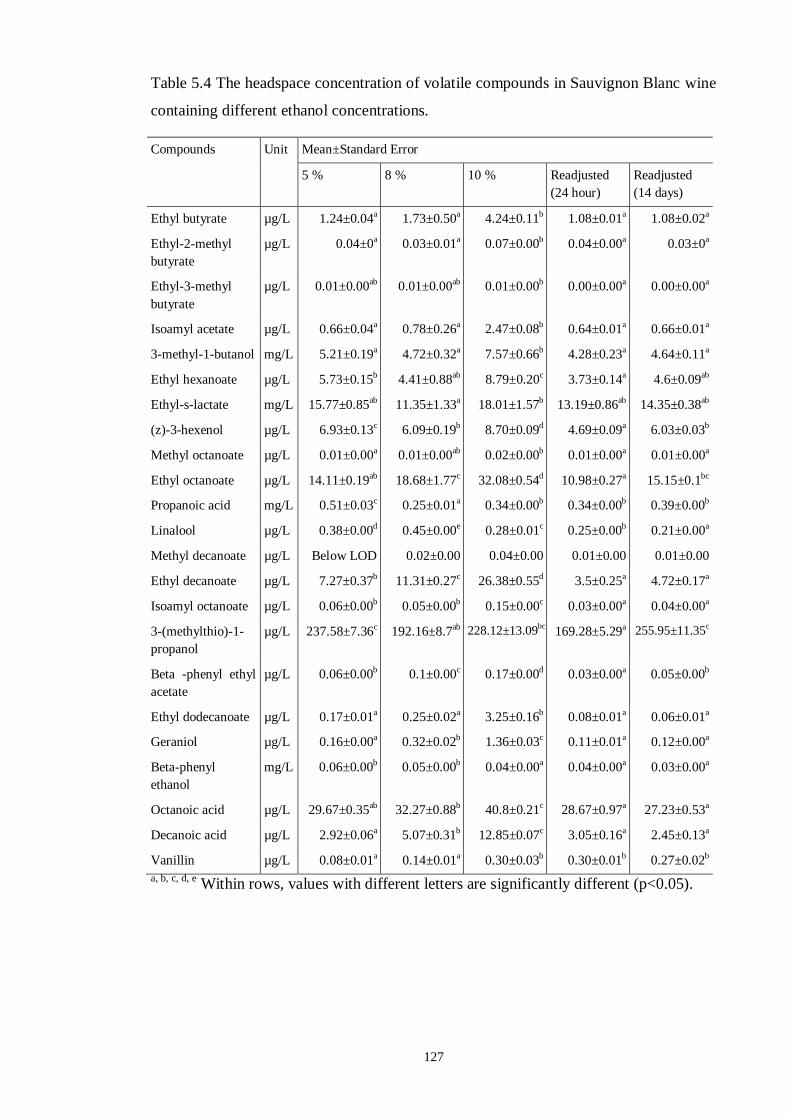
127
Table 5.4 The headspace concentration of volatile compounds in Sauvignon Blanc wine
containing different ethanol concentrations.
Compounds Unit Mean±Standard Error
5 % 8 % 10 % Readjusted
(24 hour)
Readjusted
(14 days)
Ethyl butyrate µg/L 1.24±0.04a 1.73±0.50a 4.24±0.11b 1.08±0.01a 1.08±0.02a
Ethyl-2-methyl
butyrate
µg/L 0.04±0a 0.03±0.01a 0.07±0.00b 0.04±0.00a 0.03±0a
Ethyl-3-methyl
butyrate
µg/L 0.01±0.00ab 0.01±0.00ab 0.01±0.00b 0.00±0.00a 0.00±0.00a
Isoamyl acetate µg/L 0.66±0.04a 0.78±0.26a 2.47±0.08b 0.64±0.01a 0.66±0.01a
3-methyl-1-butanol mg/L 5.21±0.19a 4.72±0.32a 7.57±0.66b 4.28±0.23a 4.64±0.11a
Ethyl hexanoate µg/L 5.73±0.15b 4.41±0.88ab 8.79±0.20c 3.73±0.14a 4.6±0.09ab
Ethyl-s-lactate mg/L 15.77±0.85ab 11.35±1.33a 18.01±1.57b 13.19±0.86ab 14.35±0.38ab
(z)-3-hexenol µg/L 6.93±0.13c 6.09±0.19b 8.70±0.09d 4.69±0.09a 6.03±0.03b
Methyl octanoate µg/L 0.01±0.00a 0.01±0.00ab 0.02±0.00b 0.01±0.00a 0.01±0.00a
Ethyl octanoate µg/L 14.11±0.19ab 18.68±1.77c 32.08±0.54d 10.98±0.27a 15.15±0.1bc
Propanoic acid mg/L 0.51±0.03c 0.25±0.01a 0.34±0.00b 0.34±0.00b 0.39±0.00b
Linalool µg/L 0.38±0.00d 0.45±0.00e 0.28±0.01c 0.25±0.00b 0.21±0.00a
Methyl decanoate µg/L Below LOD 0.02±0.00 0.04±0.00 0.01±0.00 0.01±0.00
Ethyl decanoate µg/L 7.27±0.37b 11.31±0.27c 26.38±0.55d 3.5±0.25a 4.72±0.17a
Isoamyl octanoate µg/L 0.06±0.00b 0.05±0.00b 0.15±0.00c 0.03±0.00a 0.04±0.00a
3-(methylthio)-1-
propanol
µg/L 237.58±7.36c 192.16±8.7ab 228.12±13.09bc
169.28±5.29a 255.95±11.35c
Beta -phenyl ethyl
acetate
µg/L 0.06±0.00b 0.1±0.00c 0.17±0.00d 0.03±0.00a 0.05±0.00b
Ethyl dodecanoate µg/L 0.17±0.01a 0.25±0.02a 3.25±0.16b 0.08±0.01a 0.06±0.01a
Geraniol µg/L 0.16±0.00a 0.32±0.02b 1.36±0.03c 0.11±0.01a 0.12±0.00a
Beta-phenyl
ethanol
mg/L 0.06±0.00b 0.05±0.00
b 0.04±0.00
a 0.04±0.00
a 0.03±0.00
a
Octanoic acid µg/L 29.67±0.35ab 32.27±0.88b 40.8±0.21c 28.67±0.97a 27.23±0.53a
Decanoic acid µg/L 2.92±0.06a 5.07±0.31b 12.85±0.07c 3.05±0.16a 2.45±0.13a
Vanillin µg/L 0.08±0.01a 0.14±0.01a 0.30±0.03b 0.30±0.01b 0.27±0.02b
a, b, c, d, e Within rows, values with different letters are significantly different (p<0.05).
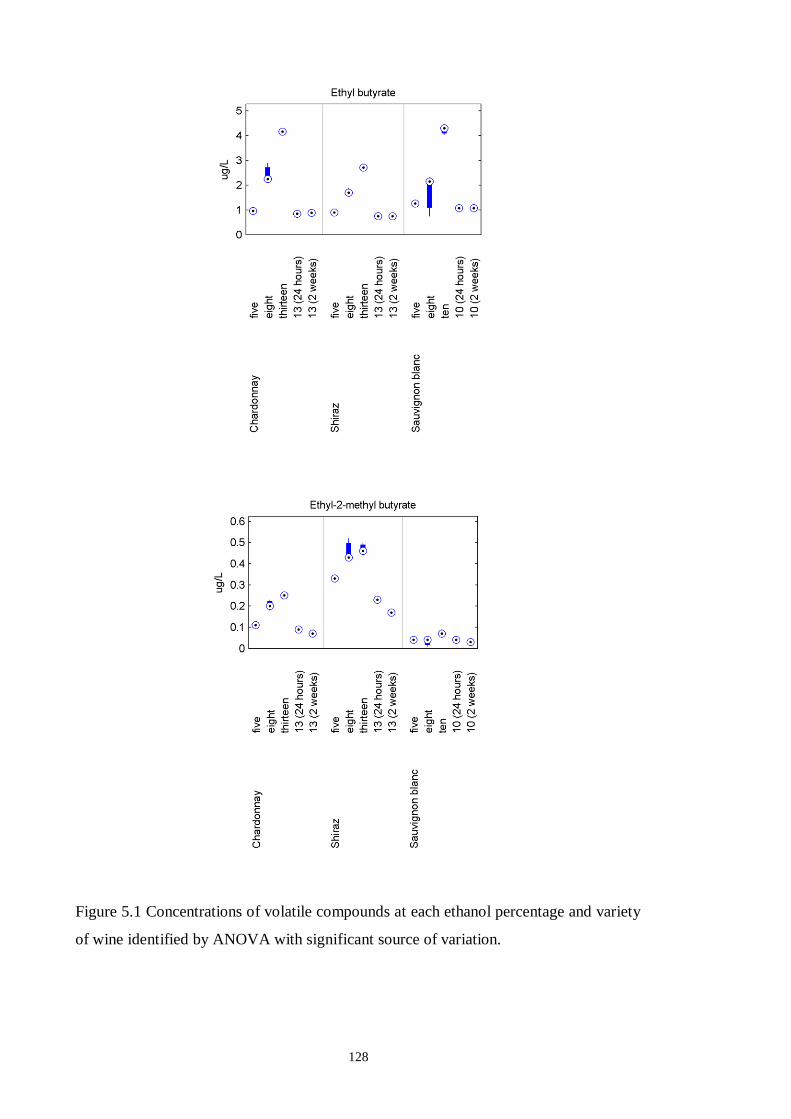
128
Figure 5.1 Concentrations of volatile compounds at each ethanol percentage and variety
of wine identified by ANOVA with significant source of variation.
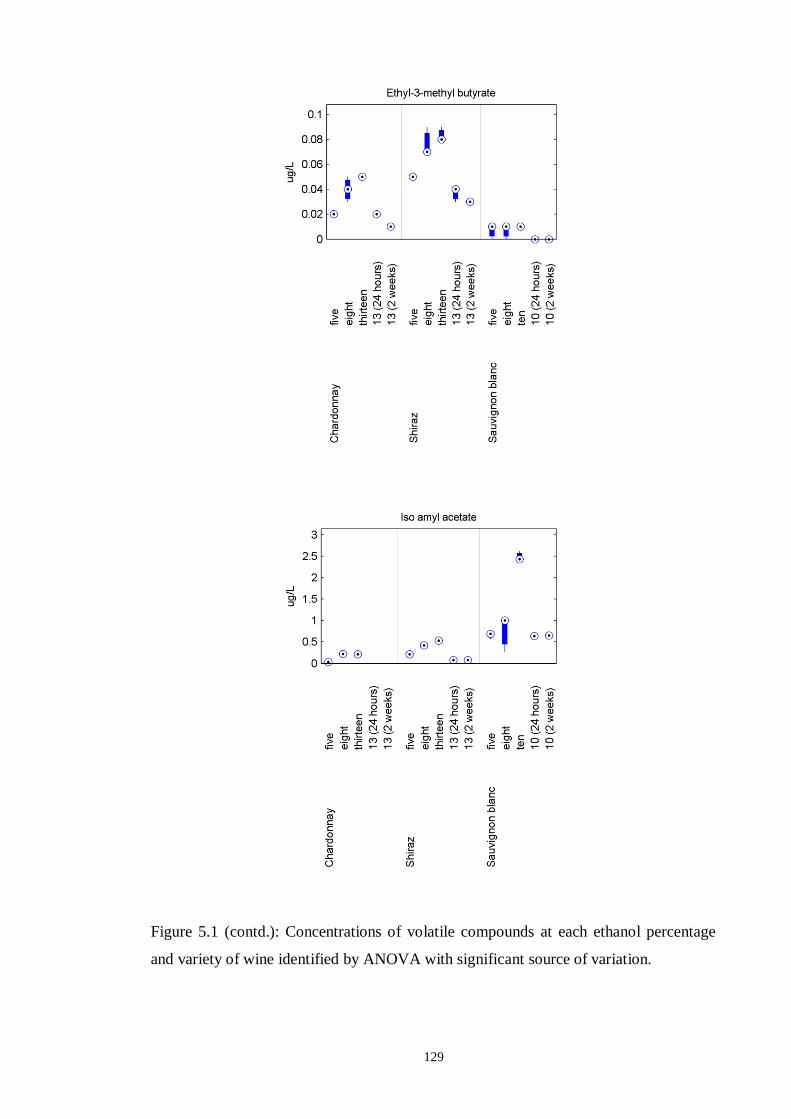
129
Figure 5.1 (contd.): Concentrations of volatile compounds at each ethanol percentage
and variety of wine identified by ANOVA with significant source of variation.
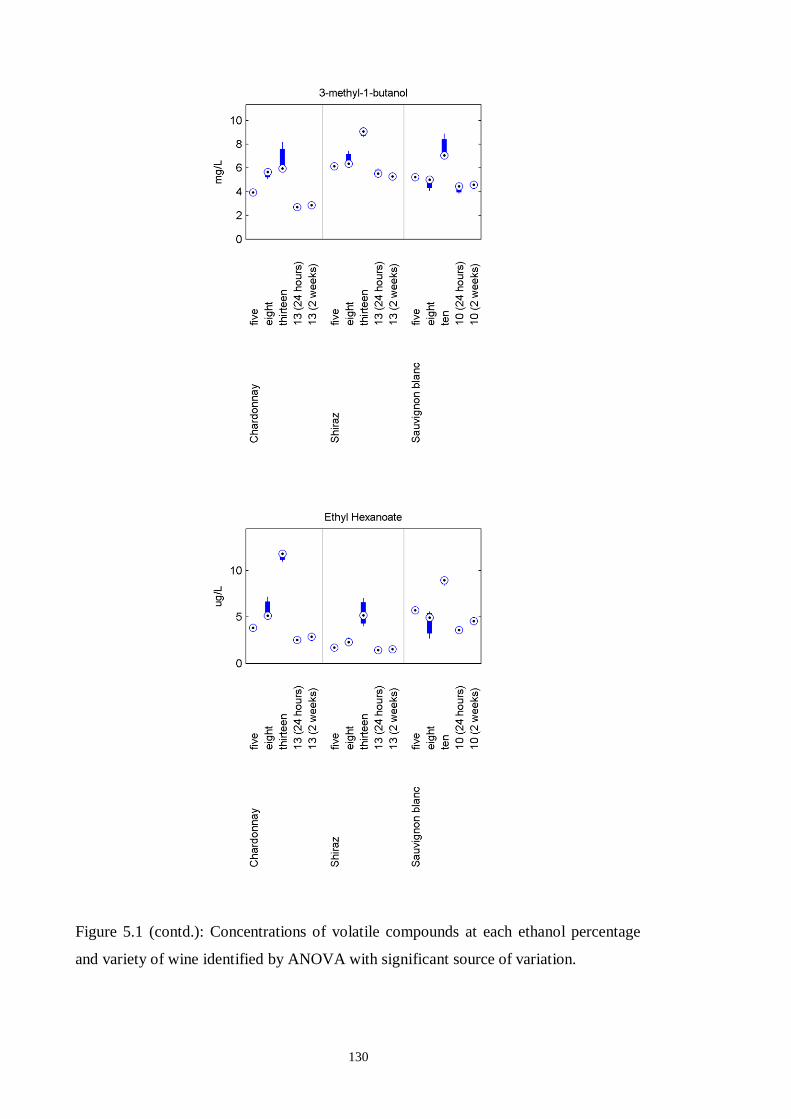
130
Figure 5.1 (contd.): Concentrations of volatile compounds at each ethanol percentage
and variety of wine identified by ANOVA with significant source of variation.
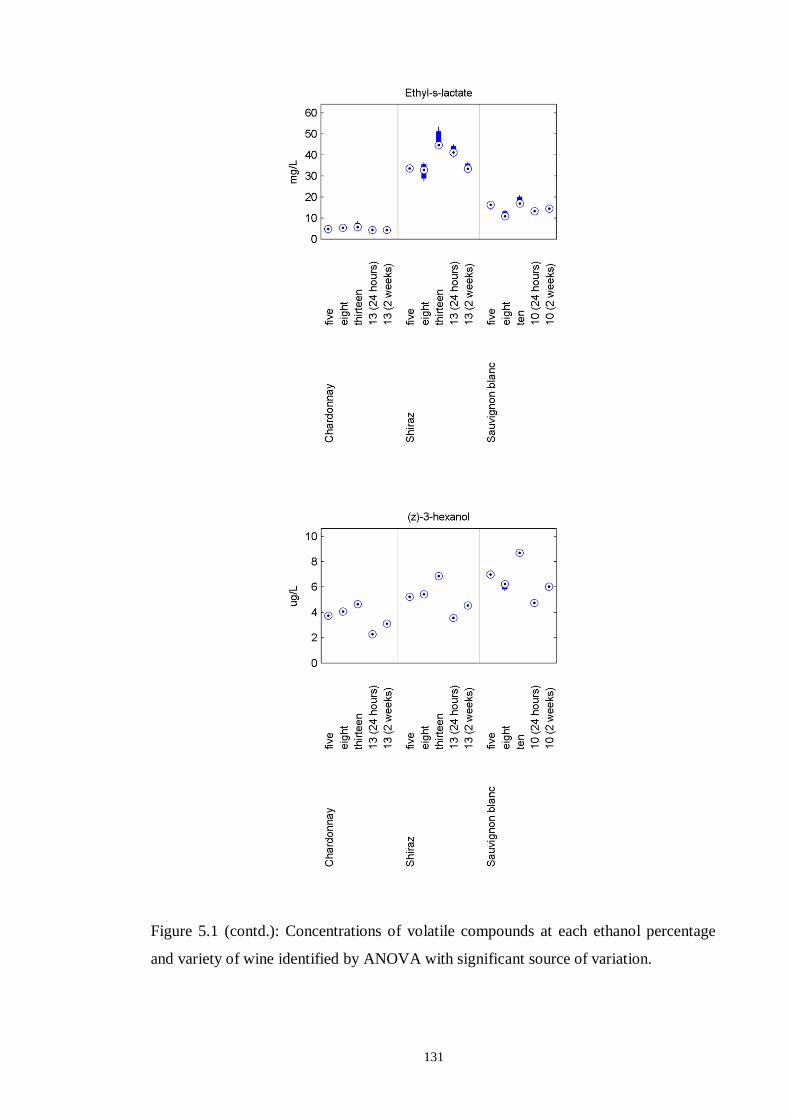
131
Figure 5.1 (contd.): Concentrations of volatile compounds at each ethanol percentage
and variety of wine identified by ANOVA with significant source of variation.
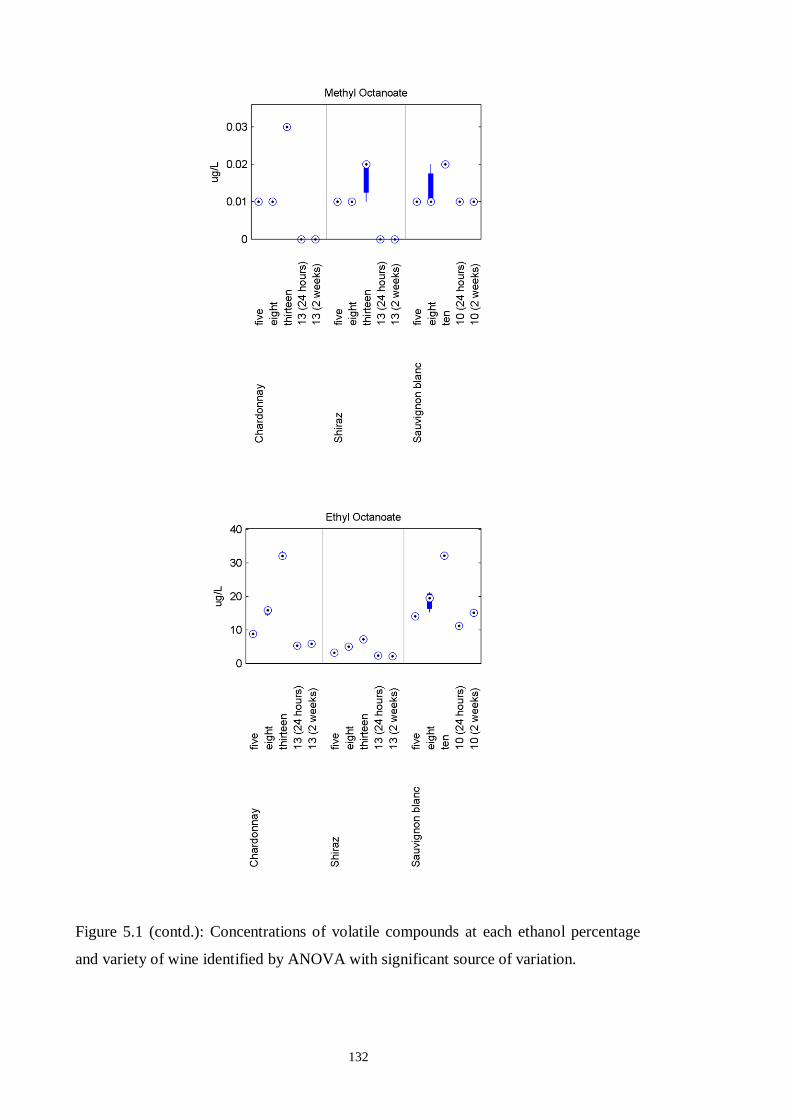
132
Figure 5.1 (contd.): Concentrations of volatile compounds at each ethanol percentage
and variety of wine identified by ANOVA with significant source of variation.
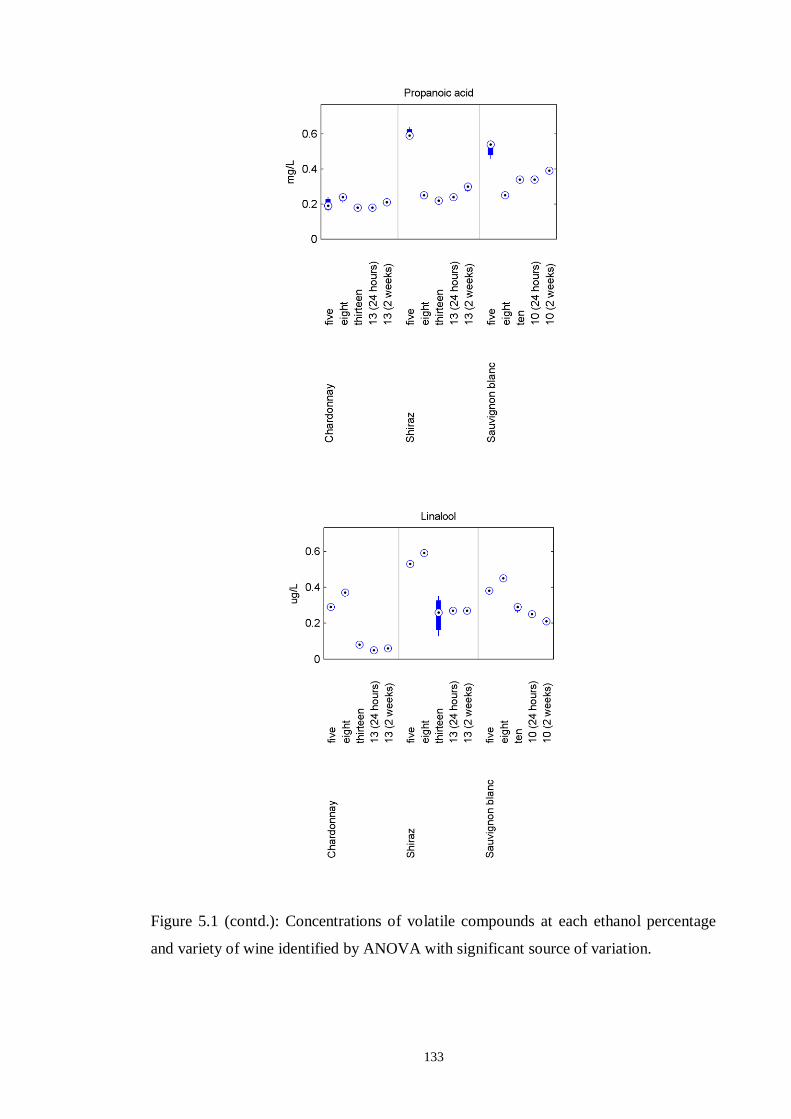
133
Figure 5.1 (contd.): Concentrations of volatile compounds at each ethanol percentage
and variety of wine identified by ANOVA with significant source of variation.
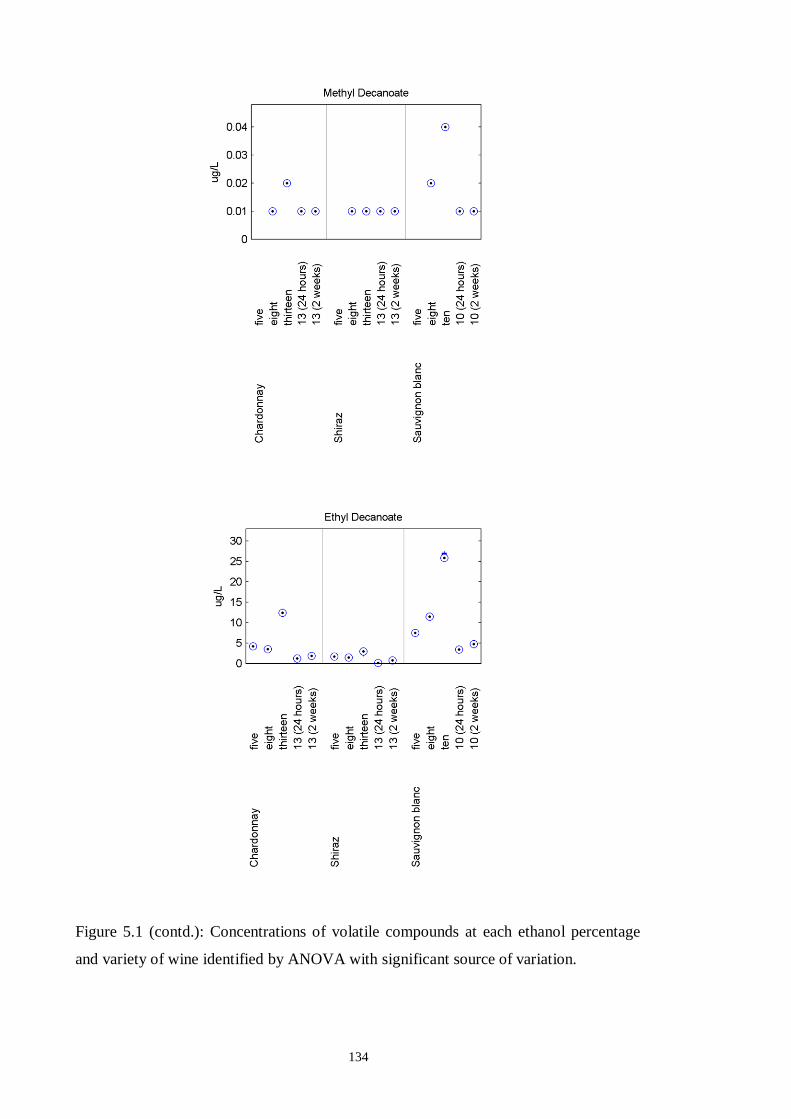
134
Figure 5.1 (contd.): Concentrations of volatile compounds at each ethanol percentage
and variety of wine identified by ANOVA with significant source of variation.
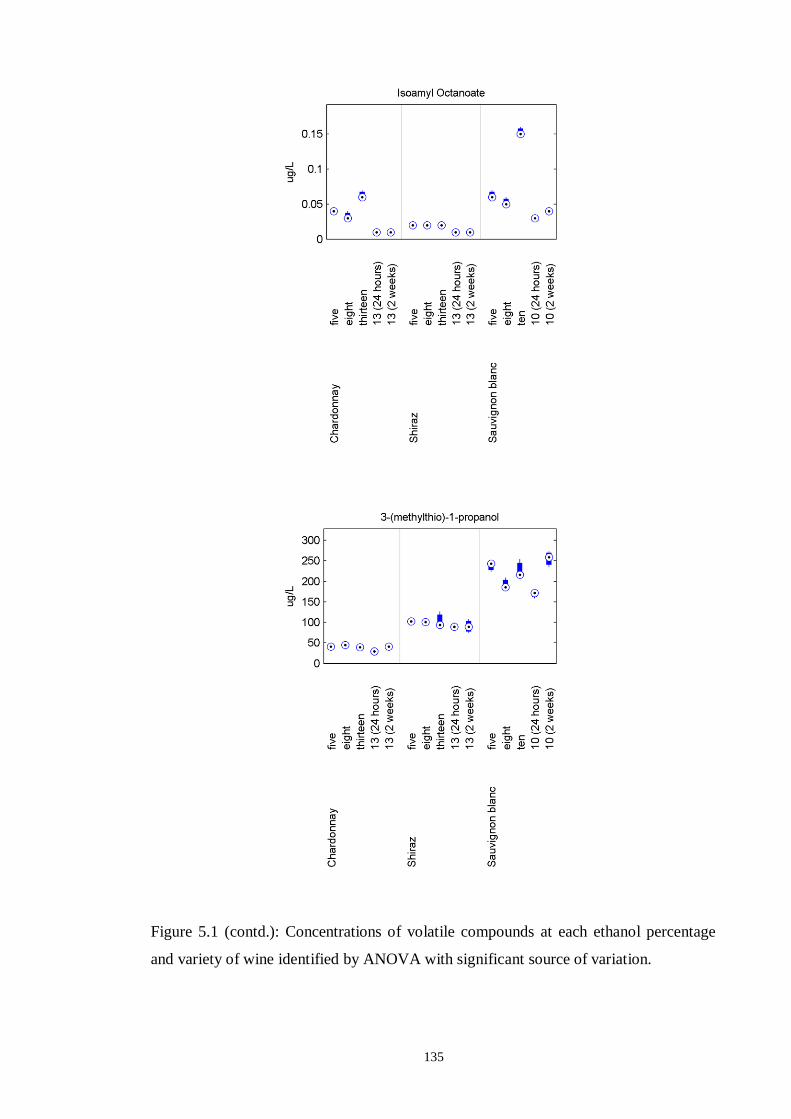
135
Figure 5.1 (contd.): Concentrations of volatile compounds at each ethanol percentage
and variety of wine identified by ANOVA with significant source of variation.
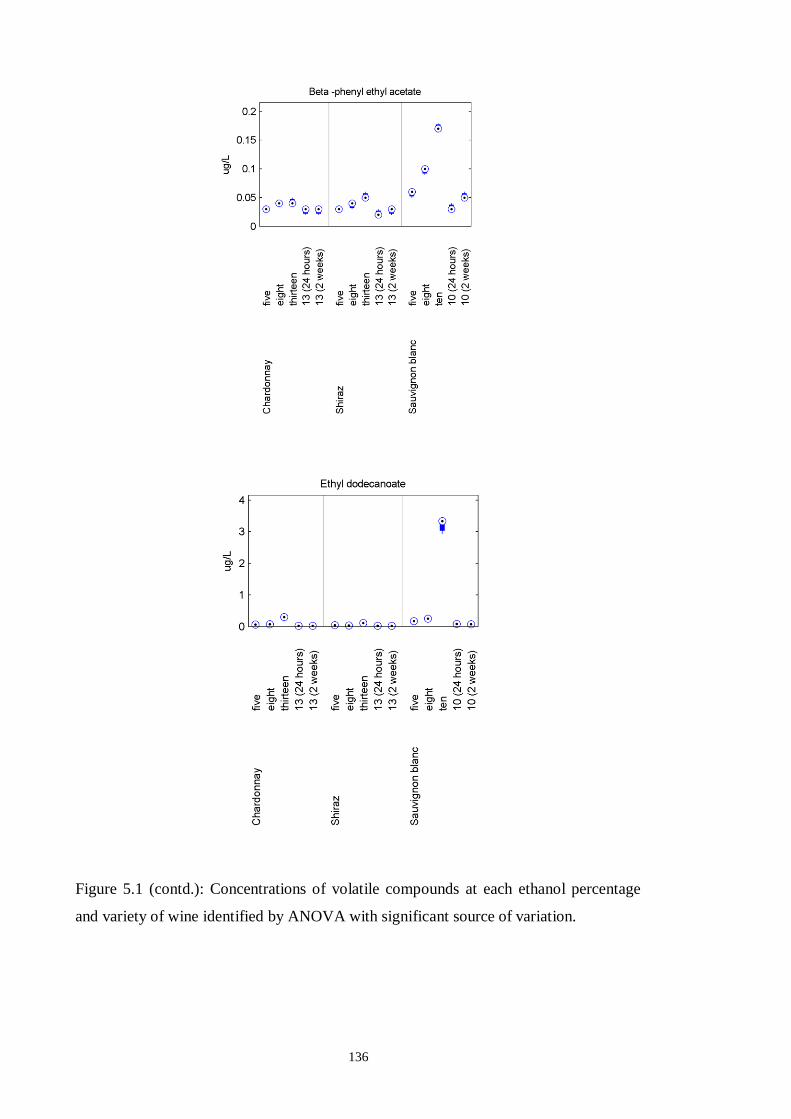
136
Figure 5.1 (contd.): Concentrations of volatile compounds at each ethanol percentage
and variety of wine identified by ANOVA with significant source of variation.
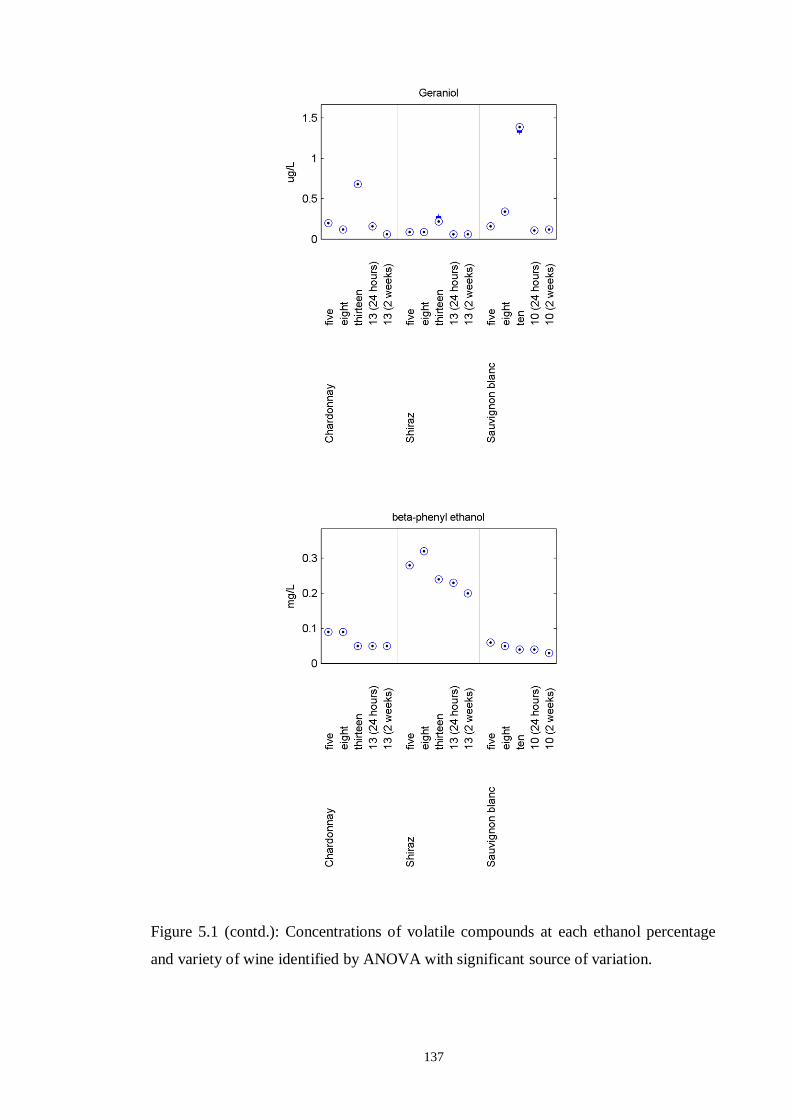
137
Figure 5.1 (contd.): Concentrations of volatile compounds at each ethanol percentage
and variety of wine identified by ANOVA with significant source of variation.
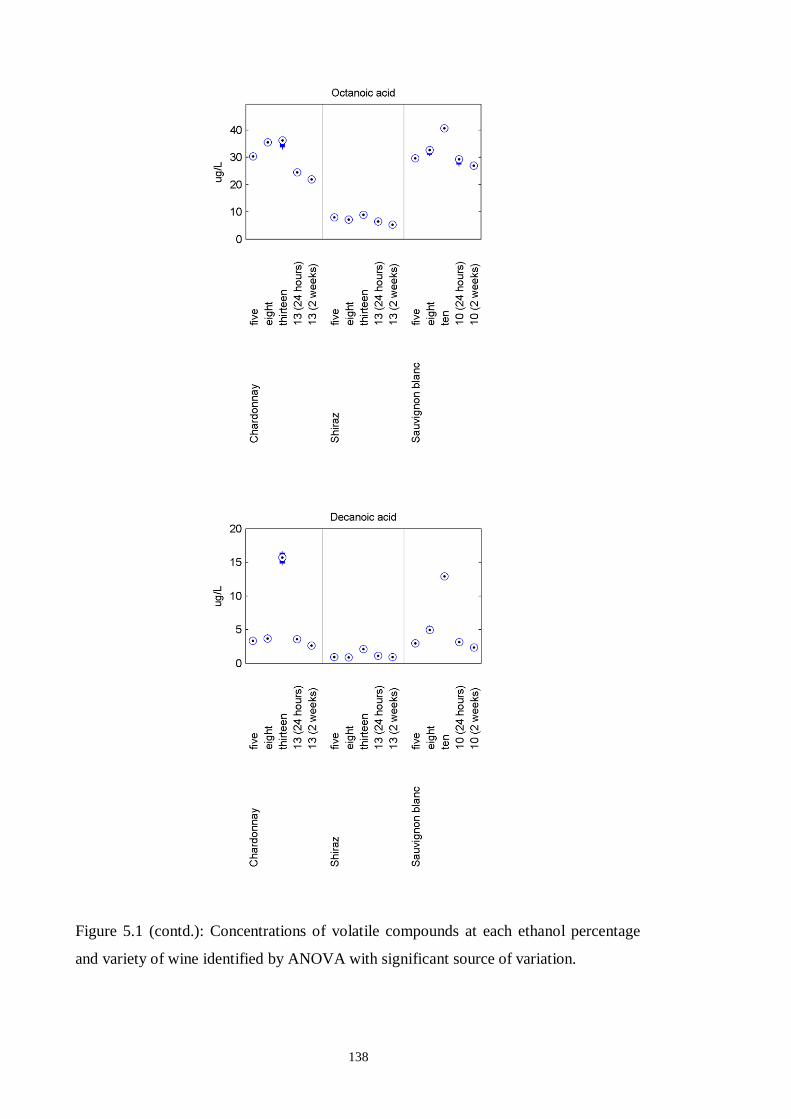
138
Figure 5.1 (contd.): Concentrations of volatile compounds at each ethanol percentage
and variety of wine identified by ANOVA with significant source of variation.
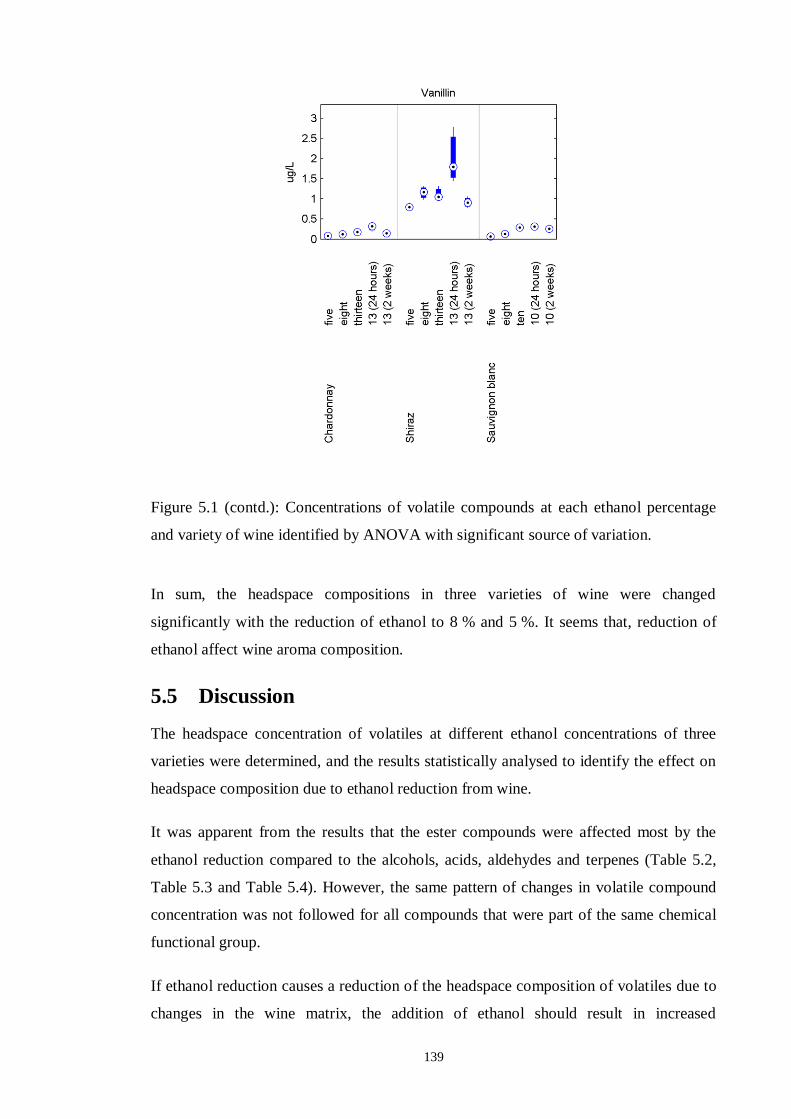
139
Figure 5.1 (contd.): Concentrations of volatile compounds at each ethanol percentage
and variety of wine identified by ANOVA with significant source of variation.
In sum, the headspace compositions in three varieties of wine were changed
significantly with the reduction of ethanol to 8 % and 5 %. It seems that, reduction of
ethanol affect wine aroma composition.
5.5 Discussion
The headspace concentration of volatiles at different ethanol concentrations of three
varieties were determined, and the results statistically analysed to identify the effect on
headspace composition due to ethanol reduction from wine.
It was apparent from the results that the ester compounds were affected most by the
ethanol reduction compared to the alcohols, acids, aldehydes and terpenes (Table 5.2,
Table 5.3 and Table 5.4). However, the same pattern of changes in volatile compound
concentration was not followed for all compounds that were part of the same chemical
functional group.
If ethanol reduction causes a reduction of the headspace composition of volatiles due to
changes in the wine matrix, the addition of ethanol should result in increased
140
concentration of volatiles in that wine. Thus, samples of the 5 % ethanol wines were
readjusted to their original ethanol concentration to examine the fact. The results of the
headspace analysis of the readjusted samples were very different from expectations. The
concentration of volatiles did not change significantly compared to the 5 % ethanol
content and the concentration of most of the alcohol and acid compounds in the
headspace decreased significantly compared to 5% ethanol content sample in all three
wine varieties. This result indicates that the reduction of ethanol significantly affects the
headspace composition of wine, but the nature of the change for different compounds is
not specific. The important factors behind the result are the effect of ethanol on different
classes of volatile compounds and the loss of compounds during the process.
During the reduction process, wine was passed through a reverse osmosis membrane
followed by an evaporative perstraction membrane. It is evident from the previous
studies that loss of flavour compounds occurred during membrane separation processes
like reverse osmosis, nanofiltration and microfiltration (Jiao et al., 2004; Ugarte, et al.,
2005). Operating conditions such as membrane type, feed pressure and temperature also
influence the aroma composition of the final product. Higher feed pressure increases the
rate of ethanol permeation during reverse osmosis process (Catarino, et al., 2007). Thus
maximum feed pressure (that membrane can support) and optimal temperature are
chosen for the reduction of ethanol by the reverse osmosis process. But compared to
aroma compounds with different functional groups, retention of ester compounds
decreases with an increase of feed pressure (Catarino, et al., 2007). Besides this, the
retention of the molecules by the membrane depends on the solute size and bunching of
the functional groups (Agenson et al., 2003). Several experimental studies of
dealcoholization by the osmotic distillation process (evaporative perstraction) reported
significant losses of aroma compounds during the process (Diban et al., 2013; Fedrizzi
et al., 2013; Varavuth, et al., 2009). It is evident that aroma compounds with high water
solubility are favoured for transport across the membrane, while low volatility reduces
transport across the membrane. Thus, the hydrophobicity and volatility of the aroma
compounds also have an important role in the transfer process and the resultant
concentration of volatiles from the processes is dependent on the intensity of these
properties.
Several researchers have conducted analytical studies on the measurement of the
activity and the partition coefficient of volatile compounds in a model wine solution to
evaluate the effect of decreasing or increasing ethanol concentration on the headspace
141
composition of volatiles. They have reported that the partition coefficient of volatile
compounds decreases with an increase of the ethanol content of solution that decreases
the headspace concentration of these compounds (Pozo-Bayón & Reineccius, 2009;
Villamor & Ross, 2013). Another study investigated the relationship between activity
coefficients of esters and ethanol concentrations and determined activity coefficients of
ethyl esters in 0.5 to 80 % ethanol (v/v) in Milli-Q-water (Conner, et al., 1998). They
found that the activity coefficients of esters did not change at ethanol concentrations
lower than 17 %. They did further analysis with the data found from 17 % to 80 %
ethanol (v/v) and observed that the solubility of esters increased and the volatility
decreased at ethanol concentrations higher than 17 % (Conner, et al., 1998). Besides
this, the polarity and hydrophobicity of different chemical groups of volatile compounds
also have a relation to the effect of ethanol concentration on their headspace
concentrations. Aznar et al. (2004) studied the relative decrease in the headspace
concentration of volatiles above either a 12 % ethanol solution or water as a function of
the volatile compound’s hydrophobicity (log P values). Polar compounds (log P >3)
were decreased linearly with increase of ethanol. However, for non-polar compounds
(log P >3), a decrease in the headspace concentration was not observed compared with
polar compounds.
The resultant headspace composition of the three wines at 5 %, 8 % and original (10 %
to 13 %) ethanol content showed that ester compounds decreased significantly with a
reduction in ethanol content. The ethanol reduction trials (Chapter 3) were performed at
high pressure (nearly 1700 kPa) to improve the efficiency ethanol removal from wine
(Memstar, 2011). This is consistent with previous studies that also found higher feed
pressure during feed causes lower retention of ester compounds in the feed material
compared to aroma compounds with other functional groups (Catarino, et al., 2007).
Besides this, the headspace composition of samples that were readjusted back to their
original ethanol concentration of 10 or nearly 13 % showed that the concentration of
ester compounds in the headspace did not decrease significantly with the addition of
ethanol, unlike the alcohol and acid compounds. This result reflects similarity with the
results from Conner (1998) who found the headspace concentration of esters was
affected when the ethanol concentration was higher than 17 % (v/v). In addition, ester
compounds are less polar than acids and alcohols (Virtual Chembook, 2003a),
consequently their headspace concentration will not increase much with a reduction in
ethanol content. The result also links with the findings of previous studies about the
142
effect of ethanol concentration on volatiles (Aznar, et al., 2004). The result indicates
that the change in headspace concentration of esters that occurred due to ethanol
reduction from wine was less than the loss of esters that happened during the membrane
separation process. These two different and opposite factors are also responsible for the
significantly different concentration of other volatiles with reducing ethanol
concentration from wine.
The intensity of the effect of different ethanol concentrations was comparatively higher
for alcohols and acid compared to esters, but the hydrophobicity as well as the polarity
differs within the same group of compounds with the increase of the carbon chain
(Virtual Chembook, 2003b). The concentration of propanoic acid was observed to
increase significantly with the reduction of ethanol, but octanoic and decanoic acid did
not. Sometimes these compounds decreased significantly with a reduction in ethanol
content from either 8 % to 5 % or from original to 8 % in the three varieties. Again,
among alcohols, the headspace concentration of 3-methyl butanol reduced significantly
from the original samples to 8 % ethanol samples, but did not change significantly with
a reduction from 8 % to 5 % ethanol. Whiton and Zoecklein (2000) observed that unlike
other aroma compounds, the concentration of 3-methyl butanol increased with the
increase of ethanol. Thus, the effect of the loss of this compound dominates the final
concentration of it in the headspace of reduced ethanol wine, not the ethanol
concentration. However, other alcohols have been found to increase sometimes with the
reduction of ethanol. Vanillin, an aldehyde, did not change significantly with the
reduction in ethanol content. Linalool, a terpene, increased significantly with the
reduction of ethanol, but geraniol did not. Linalool is a polar compound and a reduction
in ethanol level increases its concentration. The effect of an ethanol concentration
change for this compound was more than the loss during the process and increased
concentration was achieved in the headspace of reduced ethanol wine. But the opposite
happened for geraniol; its concentration decreased.
Overall, it can be said that the headspace concentration of most volatiles increases with
a reduction of ethanol (Conner, et al., 1998; Villamor & Ross, 2013; Whiton &
Zoecklein, 2000) but were found to decrease during the reduction process (Table 5.2,
Table 5.3, Table 5.4). The combination of these two opposing mechanism determines
the headspace composition of reduced ethanol wine as well as wine aroma. The
retention patterns for compounds with different functional groups depend on the process
parameters (feed pressure during reverse osmosis, stripping solution and its flow rate)
143
used during the membrane separation process. The effect of changing the ethanol
concentration also varied with the hydrophobicity and polarity of different groups of
volatile compounds. The combined effect of these factors influences the headspace
composition of all aroma compounds with a reduction of ethanol content causing
changes in aroma composition compared to the original wine. This changed aroma
composition might alter the taste of wine as well as consumer demand for reduced
ethanol wine.

144
Chapter 6 Consumer Preference for Reduced
Ethanol Wine
6.1 Introduction
A trend amongst consumers to drink comparatively lower alcohol content wine has been
developing for twenty-five years. The attraction of this product to consumers is reduced
calorie intake after consumption and the lesser effect of ethanol compared to
conventional wine (NHMRC, 2009b; Saliba, et al., 2013a). It seems consumers taste
and preferences for wine are changing to align with a healthier life style. Already, some
consumers enjoy the taste of this product and prefer to buy lower ethanol content wine
due its lower price than standard wine (Wine Intelligence, 2012). Furthermore, reduced
or low ethanol wine production has expended in recent years as the government’s
interest in reduced alcohol intake increases and is reflected in the tax rates that apply to
this product (Howley & Young, 1992; Saliba, et al., 2013a). In some countries, tax on
wine products increases with the ethanol content of the wine. In Australia, taxes on wine
are levied based on the selling price of this product (ComLaw, 2013). In the European
Union the tax on wines containing above 5.5 % ethanol content wine is almost double
that of the tax for less than 5.5 % ethanol content wine (HM Revenue and Customs,
2013). Consequently, this acts as one of the driving forces to increase the production of
reduced ethanol content wine and to increase the pace of the development of its market
position in the wine industry. Winemakers are interested in making this product as
popular among wine consumers as conventional wine, and so they are looking for a
suitable technology for the production of a high quality reduced ethanol product.
However, it is a big challenge to select the appropriate technology for alcohol reduction
from wine and to find out how much it affects wine flavour from the sensory
perspective. Similarly, it is also a challenge for wine marketers to make the product
more familiar to, and popular with, consumers as an alternative to conventional wine
products.
Ethanol is the major portion of alcohol content wine (Pozo-Bayón & Reineccius, 2009),
so reduction of ethanol from must or wine is the main target of alcohol reduction
processes. Ethanol concentration differences strongly influence the sensory attributes of
wine. Previous studies about the effect of ethanol concentration on different sensory
attributes have shown that ethanol increases sweetness (Martin & Pangborn, 1970),
145
perceived hotness and viscosity (Gawel, et al., 2007) and mouth feel (Meillon, et al.,
2009) and decreases astringency (Fontoin, et al., 2008) and sourness (Martin &
Pangborn, 1970) during wine consumption. Thus, reducing the ethanol content of wine
might affect the balance of different sensory attributes and cause alteration of wine
taste. The aroma of a wine is also an important characteristic that differs with various
styles and grape varieties (Capone, et al., 2013).
Wine contains a large number of aroma-active compounds such as esters, terpenes,
alcohols, acid, pyrazines and aldehydes etc. These aroma active compounds impart
distinct aroma and flavour such as fruity, floral, peppery and woody to the wine (Styger,
et al., 2011). Changes in ethanol concentration will also affect the headspace
composition of wine volatiles (Pozo-Bayón & Reineccius, 2009), which in turn
influences the sensorial perception of wine. It has been reported that aroma intensity
decreases when the ethanol level is increased, except for the herby attribute (Goldner, et
al., 2009).
Another known fact is the effect of the ethanol reduction process on the taste of lower
ethanol content wine. There are several processes existing to reduce the ethanol content
of wine, such as thermal distillation, freeze concentration, spinning cone column and
membrane technology etc. However, these processes cause loss or alteration of aroma
compounds during the reduction processing (Catarino, et al., 2007; Schmidtke, et al.,
2012). Membrane separation processes are the most suitable to use for ethanol reduction
as this process is very sensitive to flavour compounds and minimises loss of flavour
compounds (Catarino & Mendes, 2011a). Memstar Technology developed a
combination of reverse osmosis and evaporative perstraction process for ethanol
reduction from wine (Wollan, 2010). This process is commercially used for ethanol
reduction in the wine industry. In this study, the process had also been used for ethanol
reduction from wine and the headspace composition of different ethanol content wines
were analysed by GC-MS instrument. Details of the procedure and results had been
described in previous chapters (Chapters 3, 4 and 5). It was found from the analysis that
the headspace composition of wine changed significantly with the reduction of ethanol
and it causes alteration of wine aroma. In addition, it might badly affect the perception
of the product to consumers. Thus it is important to determine whether the reduction in
ethanol content significantly influences consumers’ preference for the product or not.
146
Consumers are interested in low ethanol wine for its advantages, but the main concern is
the taste or flavour of that compared to standard wine as well as the quality of the
product (Wine Intelligence, 2012). A study on Australian consumers reported that a
moderate portion of the Australian domestic market demands low alcohol wine now,
and it will increase if the taste can be maintained (Saliba, et al., 2013a). Meillon et al.
(2010b), conducted research on preferences for red and white wines containing three
different levels of ethanol (14 % to 10 %). They found that experienced wine consumers
and wine professionals did not like the reduced ethanol wine, whereas less experienced
consumers liked it. To sum up, it is apparent that the taste of reduced ethanol wine
changes due to ethanol concentration difference and reduction processing, but its
acceptability varies depending on consumers’ choice and experience as well as product
quality.
In this study, the commercially available membrane separation process (Memstar, 2013)
was used to reduce ethanol to 8 % and 5 % in wine. As ethanol reduction causes
changes in aroma composition as well as in its overall taste, it is also necessary to
investigate consumer preference for 5 % and 8 % ethanol content wine compared to the
original wine. Thus, a consumer preference trial was conducted with red (Shiraz) and
white (Chardonnay) at the original ethanol content and also wines with reduced ethanol
contents (5 % and 8 %). A 9-point hedonic scale was used to measure consumer
preference.
Two hypotheses were formulated in line with the research objectives:
Consumers’ preference for three different ethanol content wines (approximately
13 %, 8 % and 5 %) of two varieties (Chardonnay and Shiraz) will not be
different.
Consumers’ estimated prices for three different ethanol content wines of two
varieties will not be different.
The following sections also examine some additional hypotheses:
Consumers’ liking and estimated prices for reduced ethanol content (8 % and
5 %) of Chardonnay and Shiraz will not be different compared to its original
ethanol content wine.
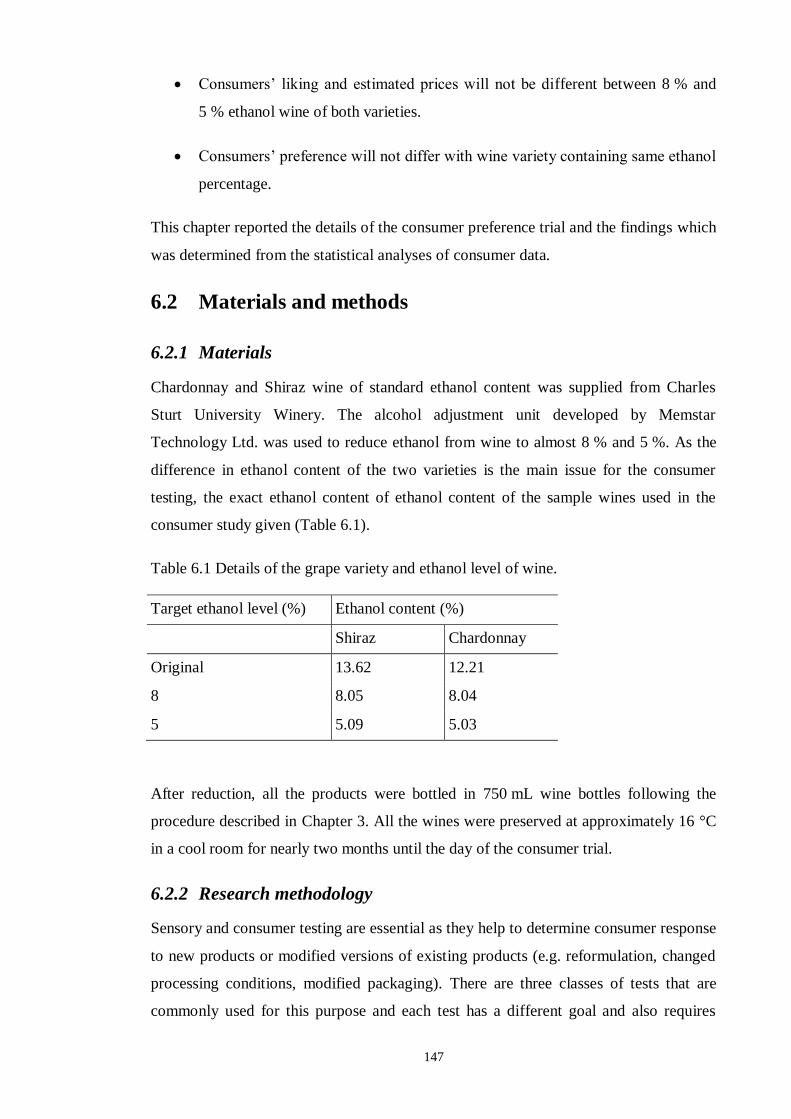
147
Consumers’ liking and estimated prices will not be different between 8 % and
5 % ethanol wine of both varieties.
Consumers’ preference will not differ with wine variety containing same ethanol
percentage.
This chapter reported the details of the consumer preference trial and the findings which
was determined from the statistical analyses of consumer data.
6.2 Materials and methods
6.2.1 Materials
Chardonnay and Shiraz wine of standard ethanol content was supplied from Charles
Sturt University Winery. The alcohol adjustment unit developed by Memstar
Technology Ltd. was used to reduce ethanol from wine to almost 8 % and 5 %. As the
difference in ethanol content of the two varieties is the main issue for the consumer
testing, the exact ethanol content of ethanol content of the sample wines used in the
consumer study given (Table 6.1).
Table 6.1 Details of the grape variety and ethanol level of wine.
Target ethanol level (%) Ethanol content (%)
Shiraz Chardonnay
Original 13.62 12.21
8 8.05 8.04
5 5.09 5.03
After reduction, all the products were bottled in 750 mL wine bottles following the
procedure described in Chapter 3. All the wines were preserved at approximately 16 °C
in a cool room for nearly two months until the day of the consumer trial.
6.2.2 Research methodology
Sensory and consumer testing are essential as they help to determine consumer response
to new products or modified versions of existing products (e.g. reformulation, changed
processing conditions, modified packaging). There are three classes of tests that are
commonly used for this purpose and each test has a different goal and also requires
148
different criteria for participants. They are: discrimination, descriptive and hedonic or
affective tests. Discrimination tests simply attempt to find out whether any difference at
all exists between two types of product. Descriptive tests quantify the perceived
intensities of the sensory characteristics of a product. Hedonic tests are the sensory tests
applied to quantify the degree of consumers’ liking and disliking of a product. The
hedonic test is one of the most used methods to quantify consumers’ acceptance using a
9-point hedonic scale. Consumers who participate in this test are representatives of the
product user in the real world and there is no requirement of training them for the test.
The method provides a balanced 9-point scale for liking, with a central neutral category
and the scale points, labelled with an adverb, represent psychologically equal steps or
changes in hedonic tone (Lawless & Heymann, 1999; Yeh et al., 1998). As the aim of
the current research was to find out whether differences existed in consumers’ liking for
different ethanol contents of two different varieties, the hedonic test was the right
method for this study. Thus, this method was used to determine consumers’ preference
during the research.
6.2.3 Research plan
The consumer preference trial was planned to be performed in a large hall near a public
gathering event, the monthly Wagga Wagga farmers’ market. All necessary
arrangements for wine tasting were prepared to make that hall room equivalent to a
sensory lab. The test was designed as following,
3 ethanol levels of wine
2 wine varieties of wine
Maximum 70 participants
The trial was planned as a one day event. A questionnaire was prepared for the trial
which was used as the data collection instrument. Six wine samples consisting of wines
made from two different varieties and at three different alcohol concentrations were
served to consumers for tasting during the trial. Each sample was assigned a random
number. The consumers tasted and rated the samples against the numbers. The
consumers were informed that the wines were of different alcohol contents, but they did
not know the alcohol content of the six wine samples served for tasting. The ethics
regarding the trial were approved by the Charles Sturt University Human Ethics
Committee and the trial was performed on the 10th November, 2012.
149
The questionnaire had a total of 17 questions of which 11 questions were close-ended,
and 6 questions were open ended (Appendix 2). Only two questions were related to the
marking of the hedonic scale for the given wine sample. Consumers’ response was
measured using a 90 mm scale where one end was labelled ‘extremely like’ and the
opposite end was labelled as ‘extremely dislike’. Two questions were about the price of
the wine sample they tasted. They were asked how much they were willing to pay for
each wine sample within the range $0 to $20. Additional questions were on their
demographics, their wine drinking pattern and their view of reduced alcohol wine
products. These questions were incorporated to get information about the consumers
and to help to conduct further studies in this field.
6.2.4 Consumer recruitment and tasting event
The consumer preference trial was conducted in the Senior Citizens hall near the
Farmers’ Market in Wagga Wagga. Before the trial date, the tasting event was
advertised on Charles Sturt University Electronic Notice board in “What’s New”. The
consumers were recruited while attending the farmers’ market using passive
recruitment. Interested consumers who were 18 years or older and had not taken alcohol
within the previous 12 hours were allowed to take part in wine tasting during the trial.
However, pregnant women (or suspected to be pregnant) were recommended not to
participate in the tasting event. The participants were informed about the research and
invited to participate. No compulsion or coercion was applied for the participant
recruitment. However, the researcher was allowed to describe the purpose of the study
by the word of mouth to people in the Farmers’ Market and invite the potential
participants to take part in the tasting event. Consumers who were willing to participate
were given written information about the study which they could take away. They were
asked to fill in an informed consent form as required by the Charles Sturt University
Human Ethics Committee. The consent form informed the participant that they were
volunteering for the research and could withdraw from the event at any time without
providing any explanation.
During the trial, the wine samples were served in ISO standard wine tasting glasses in
25 mL aliquots. It required 10 minutes to taste six wine samples. Participants took
nearly 10 minutes to complete the questionnaire. Assistants were available to help the
participants during the test. At the end of testing the wine samples, movie tickets were
given to every participant as a reward.
150
6.3 Result and discussion
6.3.1 Participants’ demographics
The demographic characteristics of participants are essential to know in order to
understand the background of the consumers and to serve as a basis for further analysis.
It also helps us to identify which group of consumers’ opinion the hypothesis test results
reflect.
There were slightly more females (57.1 %) than males (42.9 %) among the consumers
who took part in the tasting event. All the participants were aged 18 years or more. In
the age group distribution, 21-30 years olds were the largest (34.3 %) and the age group
31-40 was the second largest. It was found from the data that 60 % of the participants
were less than 40 years old. The least represented age group was 41-50 and 61-70.
Household income and education level are also important factors to characterise the
consumers. Approximately 53 % of participants’ household incomes were within the
range of $75,000-$200,000. The most common highest level of education were people
holding bachelor’s degrees (40 %). Overall, 81.4 % of participants held some form of
post-secondary qualification (TAFE certificate or diploma, bachelor’s, master’s or
doctoral degree). Household income is related to the education level of the participants
as well as their occupation. Unemployed persons formed the smallest group among the
participants and the highest numbers of consumers were those employed as
professionals or managers. This information can be linked to the report of the Australian
Bureau of Statistics regarding occupation and income. Their statistical analysis reported
that the proportion of people with a bachelor degree or above is increasing and it is now
25 % in 2012 (Austraian Bureau of Statistics, 2013b). It was also reported that manager
is one of the major occupation groups and has the highest average weekly income
(Austraian Bureau of Statistics, 2013a).
Detailed information of the demographic characteristics (number of participants, n = 70)
are given (prepared by SPSS software) in Table 6.2.
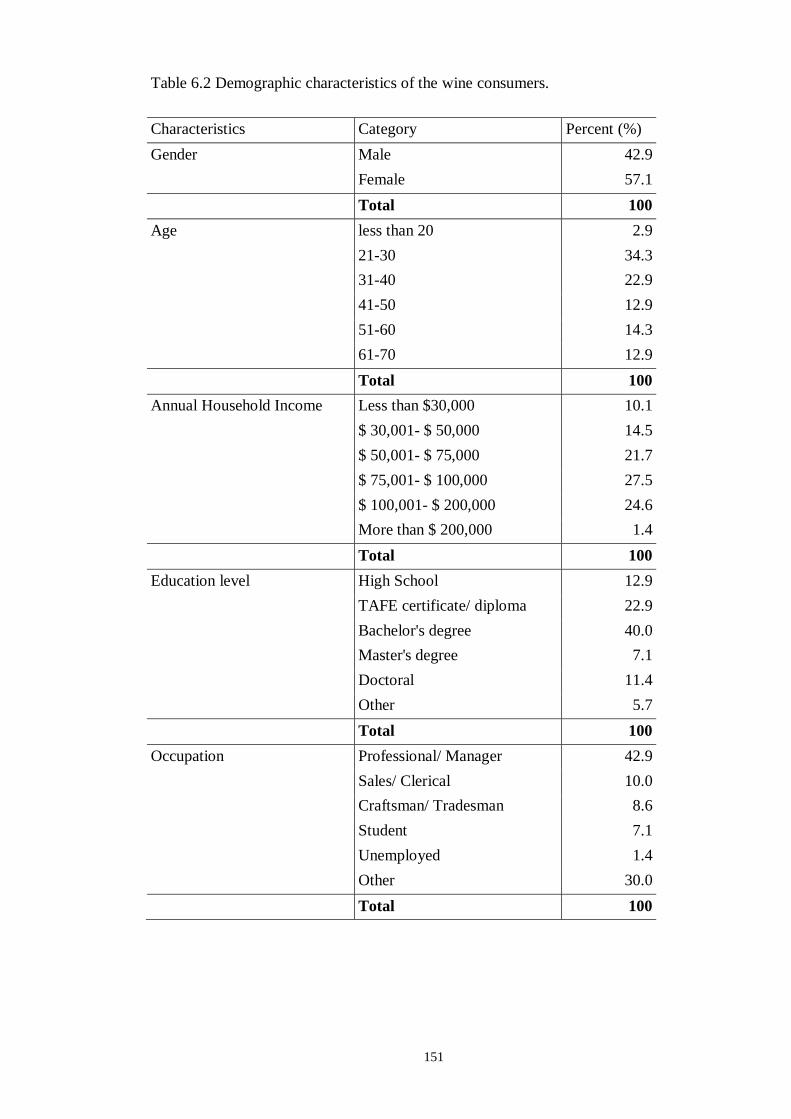
151
Table 6.2 Demographic characteristics of the wine consumers.
Characteristics Category Percent (%)
Gender Male 42.9
Female 57.1
Total 100
Age less than 20 2.9
21-30 34.3
31-40 22.9
41-50 12.9
51-60 14.3
61-70 12.9
Total 100
Annual Household Income Less than $30,000 10.1
$ 30,001- $ 50,000 14.5
$ 50,001- $ 75,000 21.7
$ 75,001- $ 100,000 27.5
$ 100,001- $ 200,000 24.6
More than $ 200,000 1.4
Total 100
Education level High School 12.9
TAFE certificate/ diploma 22.9
Bachelor's degree 40.0
Master's degree 7.1
Doctoral 11.4
Other 5.7
Total 100
Occupation Professional/ Manager 42.9
Sales/ Clerical 10.0
Craftsman/ Tradesman 8.6
Student 7.1
Unemployed 1.4
Other 30.0
Total 100
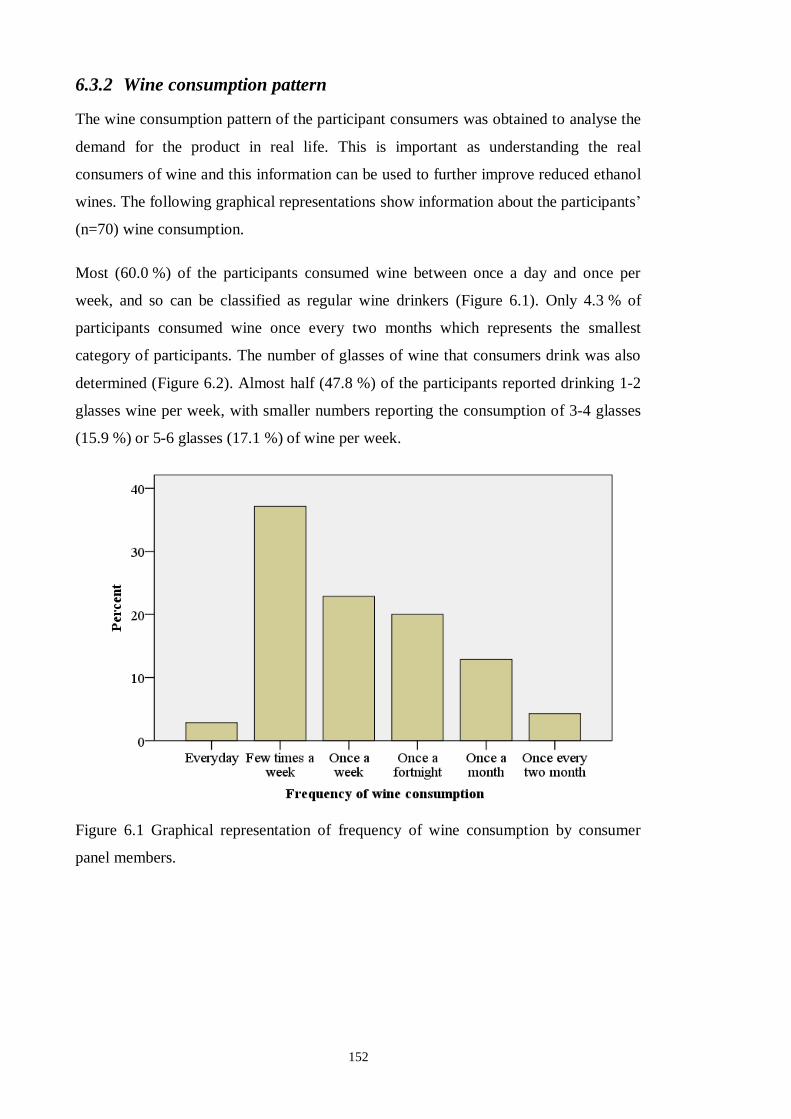
152
6.3.2 Wine consumption pattern
The wine consumption pattern of the participant consumers was obtained to analyse the
demand for the product in real life. This is important as understanding the real
consumers of wine and this information can be used to further improve reduced ethanol
wines. The following graphical representations show information about the participants’
(n=70) wine consumption.
Most (60.0 %) of the participants consumed wine between once a day and once per
week, and so can be classified as regular wine drinkers (Figure 6.1). Only 4.3 % of
participants consumed wine once every two months which represents the smallest
category of participants. The number of glasses of wine that consumers drink was also
determined (Figure 6.2). Almost half (47.8 %) of the participants reported drinking 1-2
glasses wine per week, with smaller numbers reporting the consumption of 3-4 glasses
(15.9 %) or 5-6 glasses (17.1 %) of wine per week.
Figure 6.1 Graphical representation of frequency of wine consumption by consumer
panel members.
153
Figure 6.2 Graphical representation of the number of glasses of wine consumed per
week by consumer panel members.
There is a close relation between consumers’ wine consumption and their wine
purchasing habits. The great majority of participants reported purchasing two or three
bottles of wine per week, with 50 % of the participants reporting the purchase of two
bottles of wine and 30 % of respondents reporting the purchase of three bottles of wine
per week (Figure 6.3). The smallest number (1.5 %) of people reported purchasing 7 or
8 bottles of wine per week. The purchase price paid for each bottle of wine was also
examined. Almost 80 % of people in the sample paid $11 to $20 per bottle of wine
(Figure 6.4). The median price was $15 per bottle.
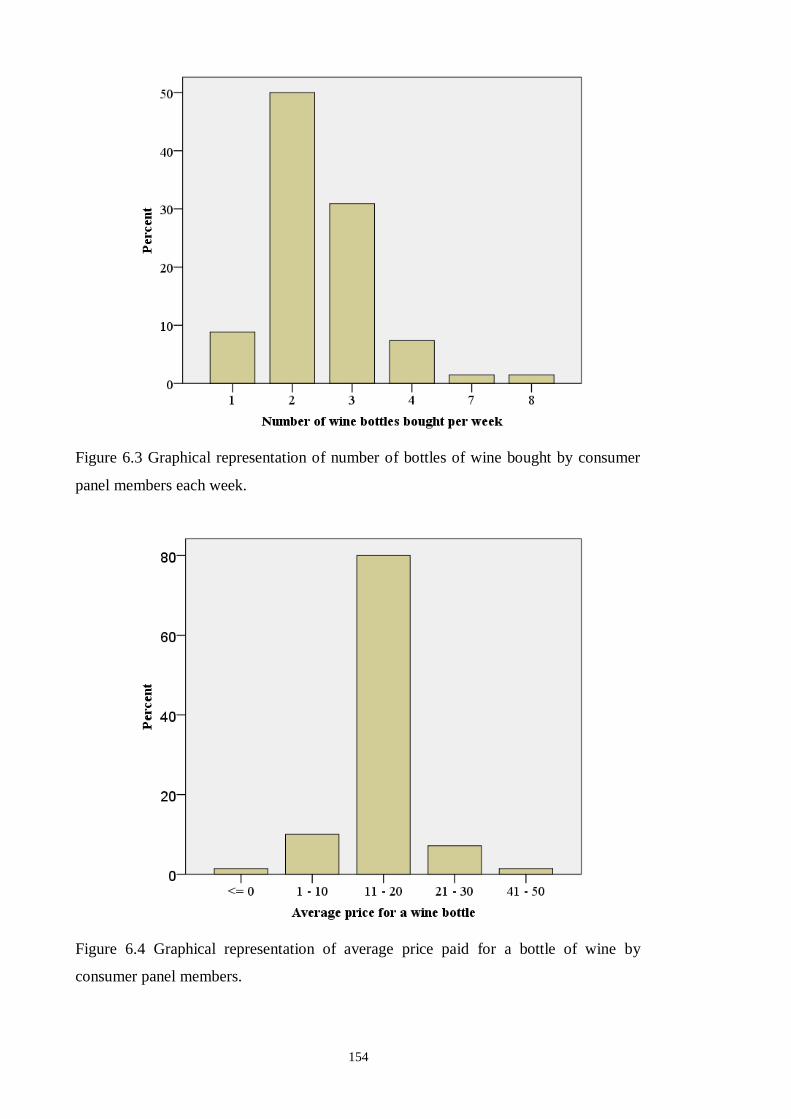
154
Figure 6.3 Graphical representation of number of bottles of wine bought by consumer
panel members each week.
Figure 6.4 Graphical representation of average price paid for a bottle of wine by
consumer panel members.
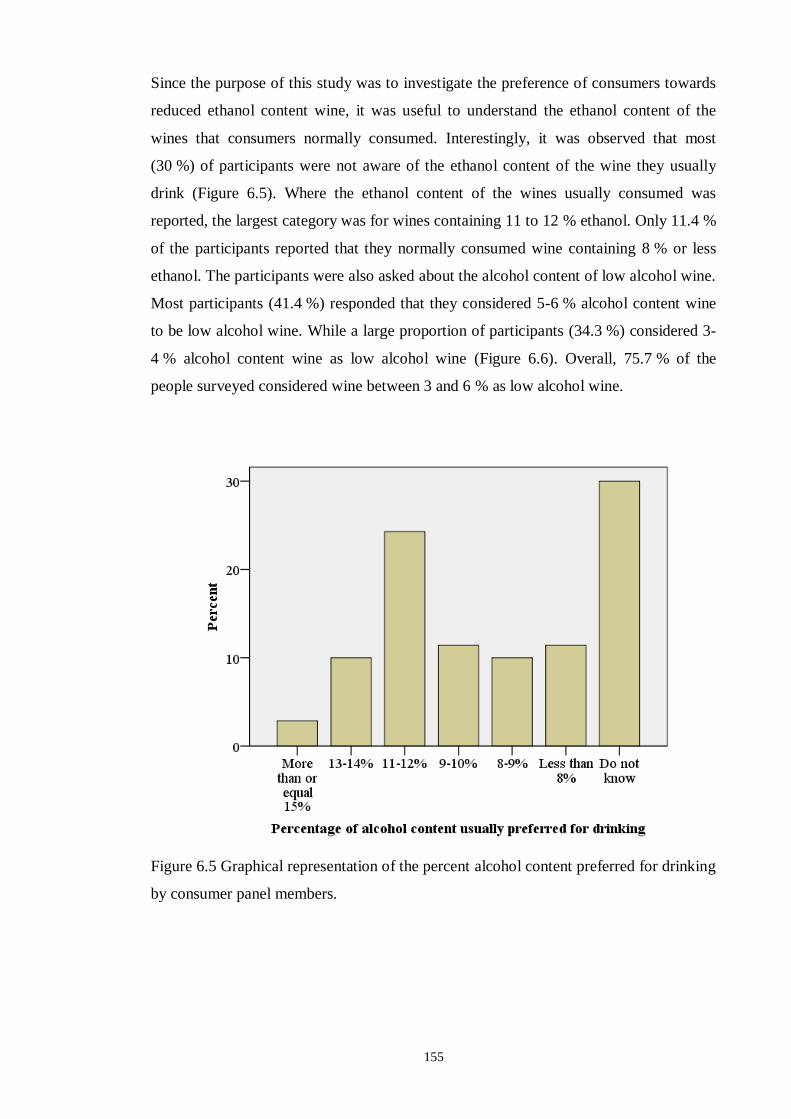
155
Since the purpose of this study was to investigate the preference of consumers towards
reduced ethanol content wine, it was useful to understand the ethanol content of the
wines that consumers normally consumed. Interestingly, it was observed that most
(30 %) of participants were not aware of the ethanol content of the wine they usually
drink (Figure 6.5). Where the ethanol content of the wines usually consumed was
reported, the largest category was for wines containing 11 to 12 % ethanol. Only 11.4 %
of the participants reported that they normally consumed wine containing 8 % or less
ethanol. The participants were also asked about the alcohol content of low alcohol wine.
Most participants (41.4 %) responded that they considered 5-6 % alcohol content wine
to be low alcohol wine. While a large proportion of participants (34.3 %) considered 3-
4 % alcohol content wine as low alcohol wine (Figure 6.6). Overall, 75.7 % of the
people surveyed considered wine between 3 and 6 % as low alcohol wine.
Figure 6.5 Graphical representation of the percent alcohol content preferred for drinking
by consumer panel members.
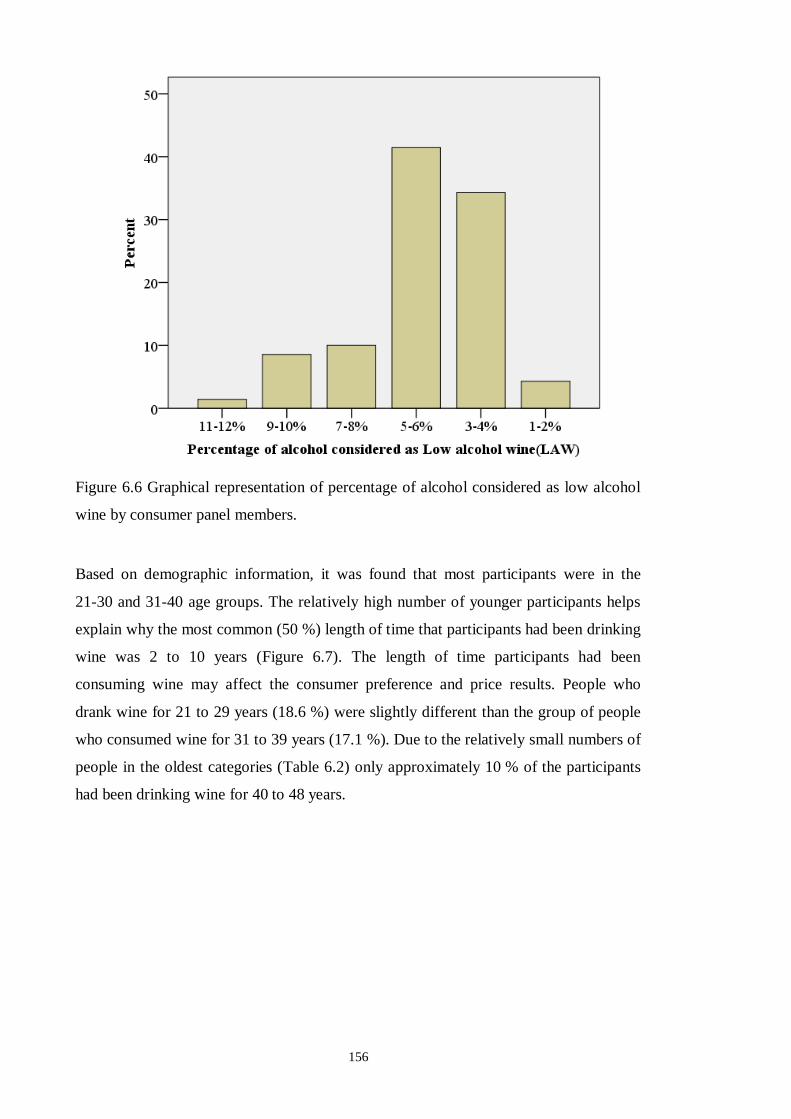
156
Figure 6.6 Graphical representation of percentage of alcohol considered as low alcohol
wine by consumer panel members.
Based on demographic information, it was found that most participants were in the
21-30 and 31-40 age groups. The relatively high number of younger participants helps
explain why the most common (50 %) length of time that participants had been drinking
wine was 2 to 10 years (Figure 6.7). The length of time participants had been
consuming wine may affect the consumer preference and price results. People who
drank wine for 21 to 29 years (18.6 %) were slightly different than the group of people
who consumed wine for 31 to 39 years (17.1 %). Due to the relatively small numbers of
people in the oldest categories (Table 6.2) only approximately 10 % of the participants
had been drinking wine for 40 to 48 years.
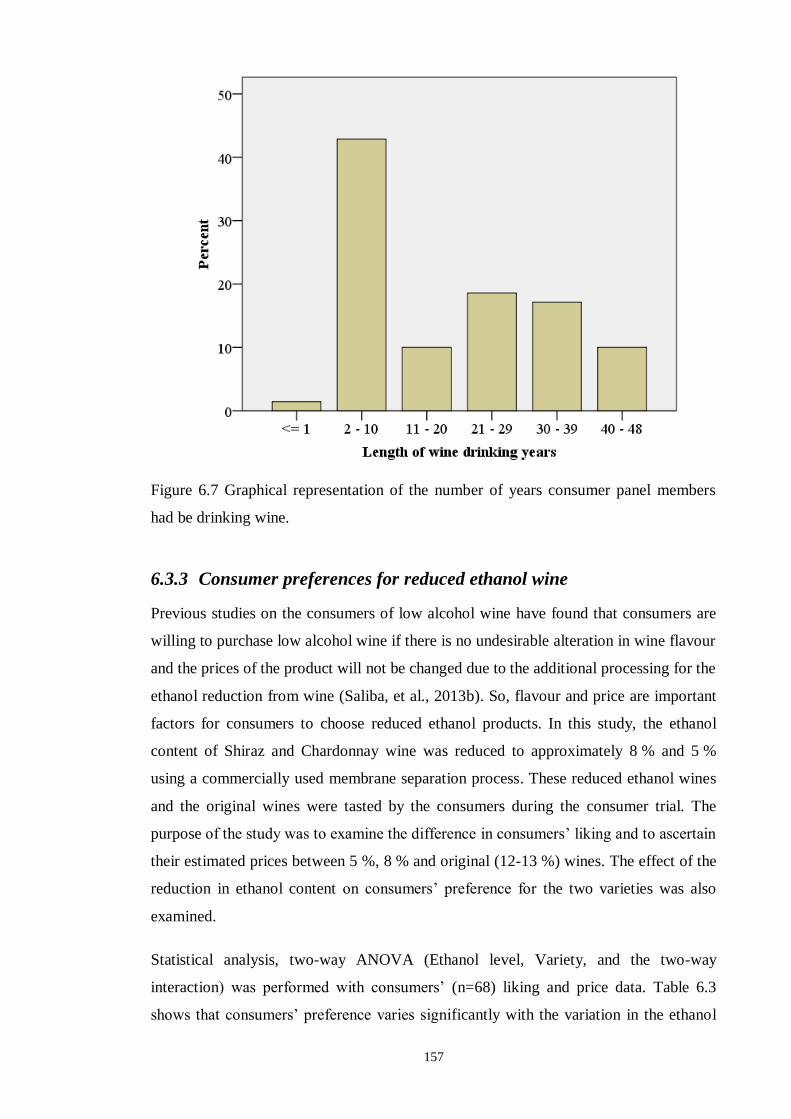
157
Figure 6.7 Graphical representation of the number of years consumer panel members
had be drinking wine.
6.3.3 Consumer preferences for reduced ethanol wine
Previous studies on the consumers of low alcohol wine have found that consumers are
willing to purchase low alcohol wine if there is no undesirable alteration in wine flavour
and the prices of the product will not be changed due to the additional processing for the
ethanol reduction from wine (Saliba, et al., 2013b). So, flavour and price are important
factors for consumers to choose reduced ethanol products. In this study, the ethanol
content of Shiraz and Chardonnay wine was reduced to approximately 8 % and 5 %
using a commercially used membrane separation process. These reduced ethanol wines
and the original wines were tasted by the consumers during the consumer trial. The
purpose of the study was to examine the difference in consumers’ liking and to ascertain
their estimated prices between 5 %, 8 % and original (12-13 %) wines. The effect of the
reduction in ethanol content on consumers’ preference for the two varieties was also
examined.
Statistical analysis, two-way ANOVA (Ethanol level, Variety, and the two-way
interaction) was performed with consumers’ (n=68) liking and price data. Table 6.3
shows that consumers’ preference varies significantly with the variation in the ethanol
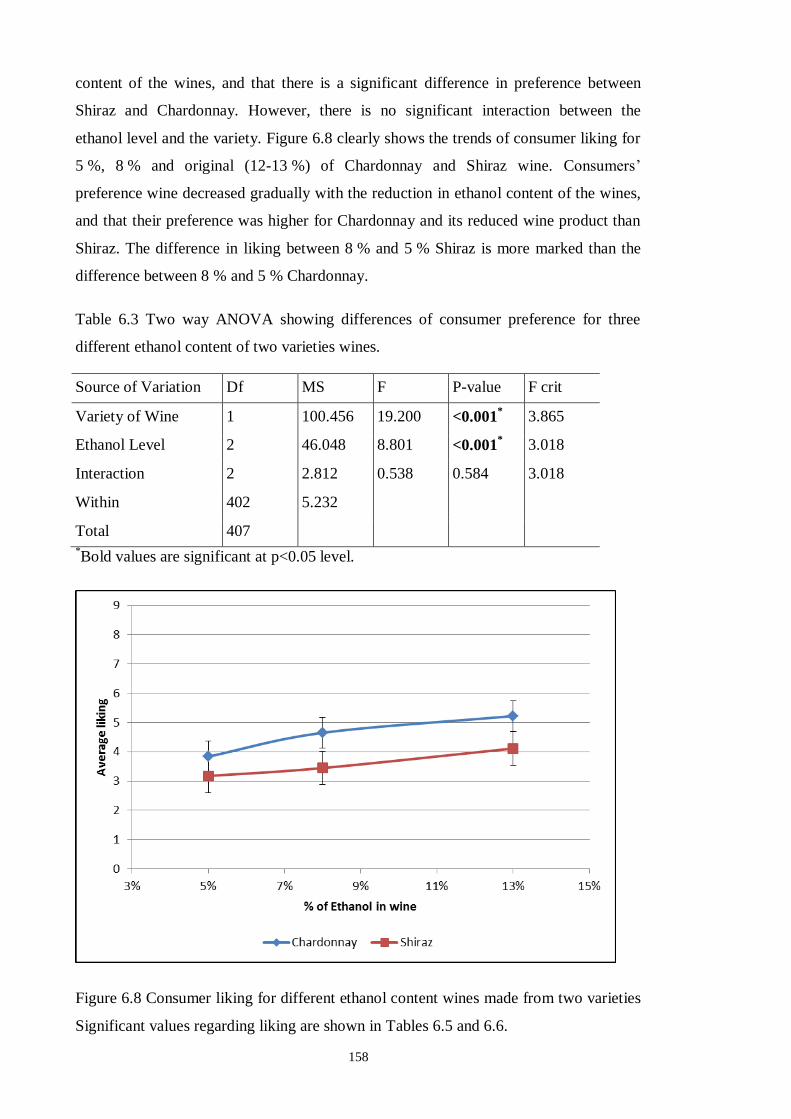
158
content of the wines, and that there is a significant difference in preference between
Shiraz and Chardonnay. However, there is no significant interaction between the
ethanol level and the variety. Figure 6.8 clearly shows the trends of consumer liking for
5 %, 8 % and original (12-13 %) of Chardonnay and Shiraz wine. Consumers’
preference wine decreased gradually with the reduction in ethanol content of the wines,
and that their preference was higher for Chardonnay and its reduced wine product than
Shiraz. The difference in liking between 8 % and 5 % Shiraz is more marked than the
difference between 8 % and 5 % Chardonnay.
Table 6.3 Two way ANOVA showing differences of consumer preference for three
different ethanol content of two varieties wines.
Source of Variation Df MS F P-value F crit
Variety of Wine 1 100.456 19.200 <0.001* 3.865
Ethanol Level 2 46.048 8.801 <0.001* 3.018
Interaction 2 2.812 0.538 0.584 3.018
Within 402 5.232
Total 407
*Bold values are significant at p<0.05 level.
Figure 6.8 Consumer liking for different ethanol content wines made from two varieties
Significant values regarding liking are shown in Tables 6.5 and 6.6.
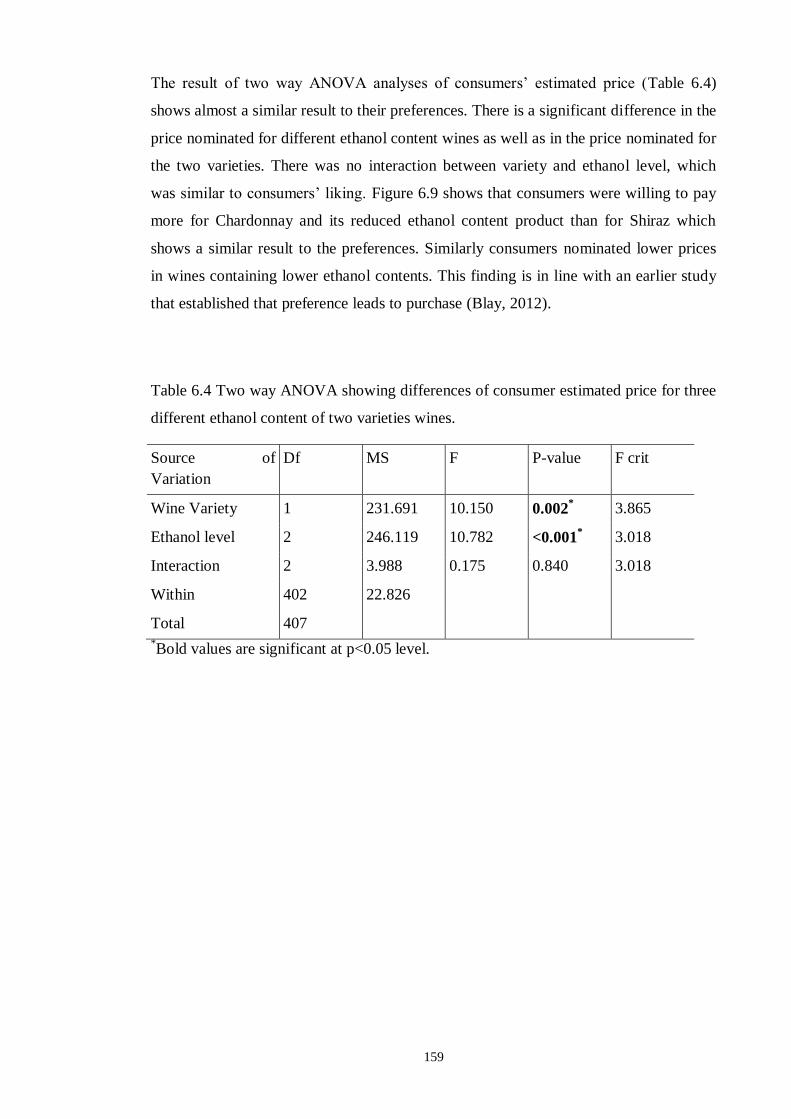
159
The result of two way ANOVA analyses of consumers’ estimated price (Table 6.4)
shows almost a similar result to their preferences. There is a significant difference in the
price nominated for different ethanol content wines as well as in the price nominated for
the two varieties. There was no interaction between variety and ethanol level, which
was similar to consumers’ liking. Figure 6.9 shows that consumers were willing to pay
more for Chardonnay and its reduced ethanol content product than for Shiraz which
shows a similar result to the preferences. Similarly consumers nominated lower prices
in wines containing lower ethanol contents. This finding is in line with an earlier study
that established that preference leads to purchase (Blay, 2012).
Table 6.4 Two way ANOVA showing differences of consumer estimated price for three
different ethanol content of two varieties wines.
Source of
Variation
Df MS F P-value F crit
Wine Variety 1 231.691 10.150 0.002* 3.865
Ethanol level 2 246.119 10.782 <0.001* 3.018
Interaction 2 3.988 0.175 0.840 3.018
Within 402 22.826
Total 407
*Bold values are significant at p<0.05 level.
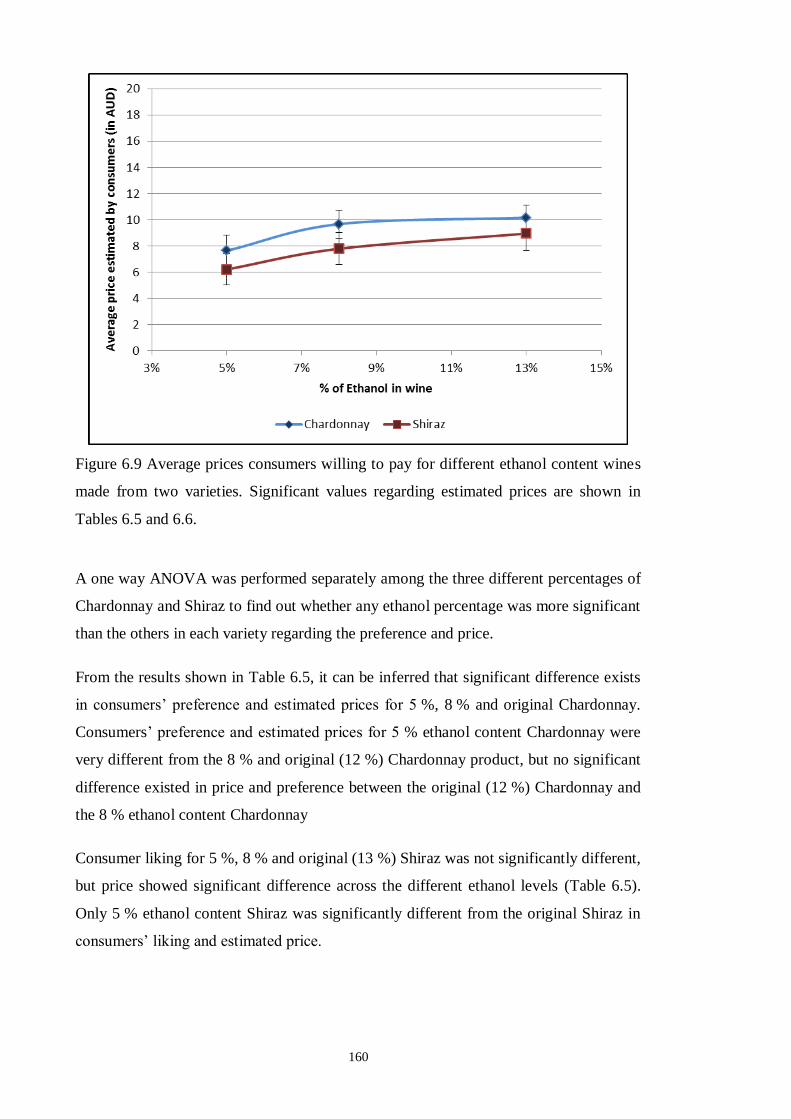
160
Figure 6.9 Average prices consumers willing to pay for different ethanol content wines
made from two varieties. Significant values regarding estimated prices are shown in
Tables 6.5 and 6.6.
A one way ANOVA was performed separately among the three different percentages of
Chardonnay and Shiraz to find out whether any ethanol percentage was more significant
than the others in each variety regarding the preference and price.
From the results shown in Table 6.5, it can be inferred that significant difference exists
in consumers’ preference and estimated prices for 5 %, 8 % and original Chardonnay.
Consumers’ preference and estimated prices for 5 % ethanol content Chardonnay were
very different from the 8 % and original (12 %) Chardonnay product, but no significant
difference existed in price and preference between the original (12 %) Chardonnay and
the 8 % ethanol content Chardonnay
Consumer liking for 5 %, 8 % and original (13 %) Shiraz was not significantly different,
but price showed significant difference across the different ethanol levels (Table 6.5).
Only 5 % ethanol content Shiraz was significantly different from the original Shiraz in
consumers’ liking and estimated price.
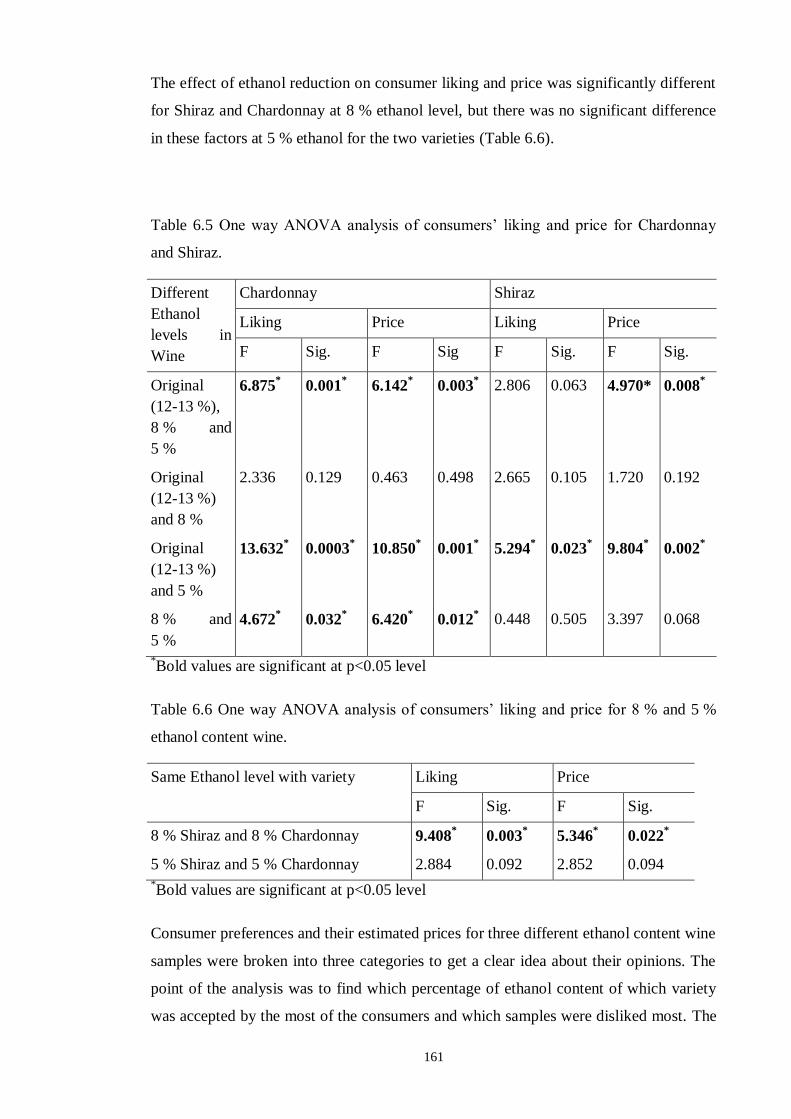
161
The effect of ethanol reduction on consumer liking and price was significantly different
for Shiraz and Chardonnay at 8 % ethanol level, but there was no significant difference
in these factors at 5 % ethanol for the two varieties (Table 6.6).
Table 6.5 One way ANOVA analysis of consumers’ liking and price for Chardonnay
and Shiraz.
Different
Ethanol
levels in
Wine
Chardonnay Shiraz
Liking Price Liking Price
F Sig. F Sig F Sig. F Sig.
Original
(12-13 %),
8 % and
5 %
6.875* 0.001
* 6.142
* 0.003
* 2.806 0.063 4.970* 0.008
*
Original
(12-13 %)
and 8 %
2.336 0.129 0.463 0.498 2.665 0.105 1.720 0.192
Original
(12-13 %)
and 5 %
13.632* 0.0003
* 10.850
* 0.001
* 5.294
* 0.023
* 9.804
* 0.002
*
8 % and
5 %
4.672* 0.032
* 6.420
* 0.012
* 0.448 0.505 3.397 0.068
*Bold values are significant at p<0.05 level
Table 6.6 One way ANOVA analysis of consumers’ liking and price for 8 % and 5 %
ethanol content wine.
Same Ethanol level with variety Liking Price
F Sig. F Sig.
8 % Shiraz and 8 % Chardonnay 9.408* 0.003
* 5.346
* 0.022
*
5 % Shiraz and 5 % Chardonnay 2.884 0.092 2.852 0.094
*Bold values are significant at p<0.05 level
Consumer preferences and their estimated prices for three different ethanol content wine
samples were broken into three categories to get a clear idea about their opinions. The
point of the analysis was to find which percentage of ethanol content of which variety
was accepted by the most of the consumers and which samples were disliked most. The
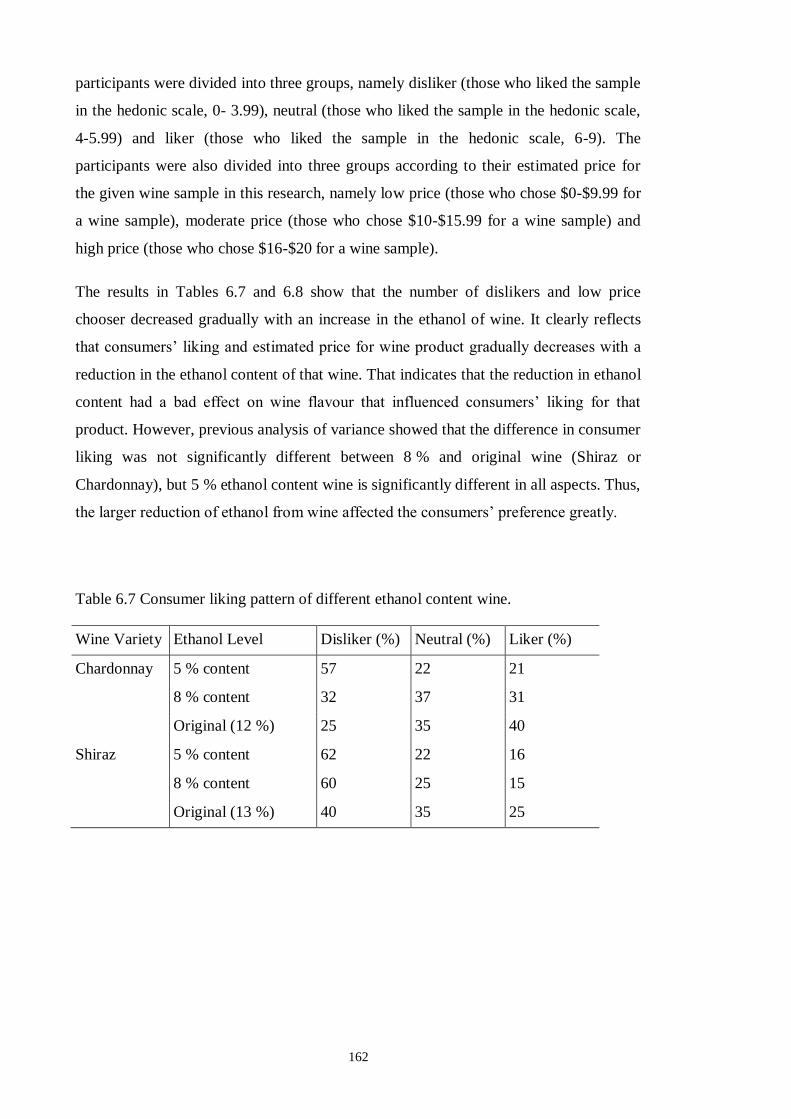
162
participants were divided into three groups, namely disliker (those who liked the sample
in the hedonic scale, 0- 3.99), neutral (those who liked the sample in the hedonic scale,
4-5.99) and liker (those who liked the sample in the hedonic scale, 6-9). The
participants were also divided into three groups according to their estimated price for
the given wine sample in this research, namely low price (those who chose $0-$9.99 for
a wine sample), moderate price (those who chose $10-$15.99 for a wine sample) and
high price (those who chose $16-$20 for a wine sample).
The results in Tables 6.7 and 6.8 show that the number of dislikers and low price
chooser decreased gradually with an increase in the ethanol of wine. It clearly reflects
that consumers’ liking and estimated price for wine product gradually decreases with a
reduction in the ethanol content of that wine. That indicates that the reduction in ethanol
content had a bad effect on wine flavour that influenced consumers’ liking for that
product. However, previous analysis of variance showed that the difference in consumer
liking was not significantly different between 8 % and original wine (Shiraz or
Chardonnay), but 5 % ethanol content wine is significantly different in all aspects. Thus,
the larger reduction of ethanol from wine affected the consumers’ preference greatly.
Table 6.7 Consumer liking pattern of different ethanol content wine.
Wine Variety Ethanol Level Disliker (%) Neutral (%) Liker (%)
Chardonnay 5 % content 57 22 21
8 % content 32 37 31
Original (12 %) 25 35 40
Shiraz 5 % content 62 22 16
8 % content 60 25 15
Original (13 %) 40 35 25
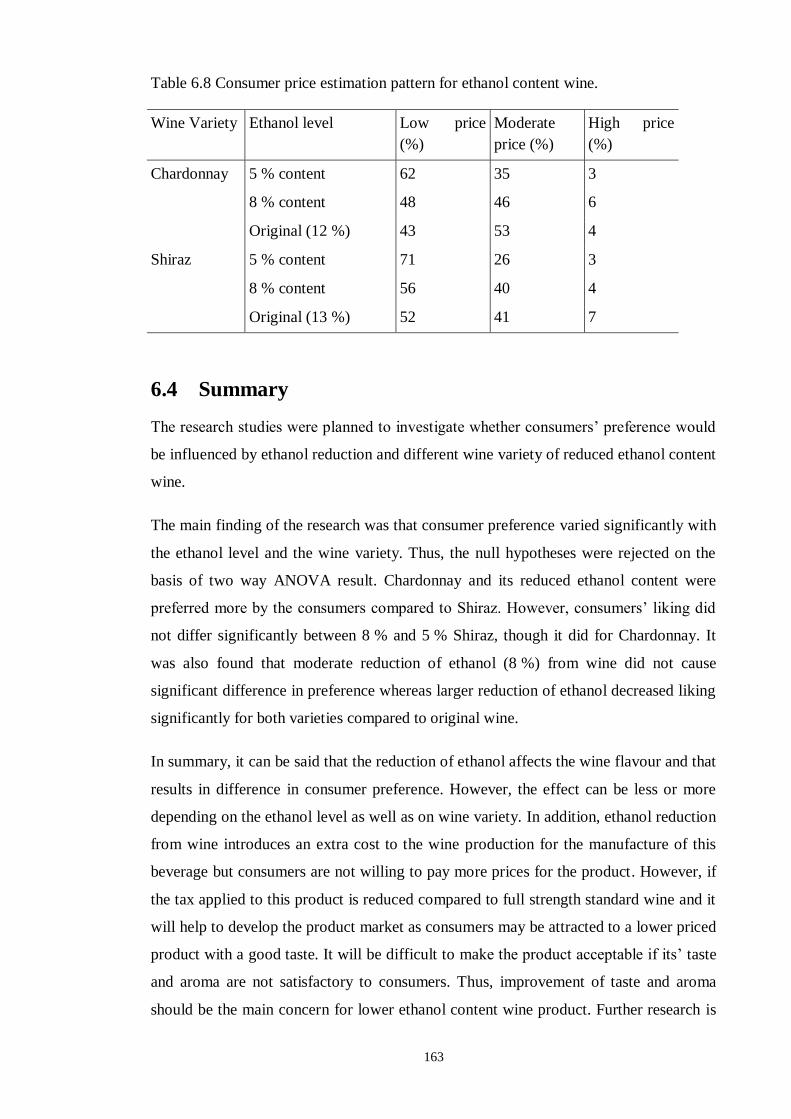
163
Table 6.8 Consumer price estimation pattern for ethanol content wine.
Wine Variety Ethanol level Low price
(%)
Moderate
price (%)
High price
(%)
Chardonnay 5 % content 62 35 3
8 % content 48 46 6
Original (12 %) 43 53 4
Shiraz 5 % content 71 26 3
8 % content 56 40 4
Original (13 %) 52 41 7
6.4 Summary
The research studies were planned to investigate whether consumers’ preference would
be influenced by ethanol reduction and different wine variety of reduced ethanol content
wine.
The main finding of the research was that consumer preference varied significantly with
the ethanol level and the wine variety. Thus, the null hypotheses were rejected on the
basis of two way ANOVA result. Chardonnay and its reduced ethanol content were
preferred more by the consumers compared to Shiraz. However, consumers’ liking did
not differ significantly between 8 % and 5 % Shiraz, though it did for Chardonnay. It
was also found that moderate reduction of ethanol (8 %) from wine did not cause
significant difference in preference whereas larger reduction of ethanol decreased liking
significantly for both varieties compared to original wine.
In summary, it can be said that the reduction of ethanol affects the wine flavour and that
results in difference in consumer preference. However, the effect can be less or more
depending on the ethanol level as well as on wine variety. In addition, ethanol reduction
from wine introduces an extra cost to the wine production for the manufacture of this
beverage but consumers are not willing to pay more prices for the product. However, if
the tax applied to this product is reduced compared to full strength standard wine and it
will help to develop the product market as consumers may be attracted to a lower priced
product with a good taste. It will be difficult to make the product acceptable if its’ taste
and aroma are not satisfactory to consumers. Thus, improvement of taste and aroma
should be the main concern for lower ethanol content wine product. Further research is
164
required on the improvement of ethanol reduction processing to maintain the taste
quality of this product as like as standard wine. Moreover, studies regarding consumer
trial on different wine varieties with lower ethanol content will help to find out the
varieties suitable for ethanol reduction.
165
Chapter 7 Conclusion and recommendations
7.1 Summary of the findings
The ethanol content of three wines (Chardonnay, Shiraz and Sauvignon Blanc) was
reduced to 8 % and 5 % ethanol using a membrane separation process. The headspace
compositions of both original and reduced ethanol wine were analysed to address the
effect of ethanol reduction in wine aroma. The impact of ethanol reduction on
consumers’ acceptability was also investigated for Chardonnay and Shiraz wine.
The ethanol reduction time varied with the reduction of ethanol level (final
concentration was 8 % and 5 %) as well as wine variety. The variation depends mainly
on the initial ethanol concentration, the different wine composition of different varieties
and also the ethanol concentration in the reverse osmosis permeate.
The headspace composition of wines with 5 %, 8 % and original ethanol content was
analysed using a GC-MS. The headspace concentrations of most of the volatiles
decreased significantly in 5 % ethanol content wine compared to the original wine.
However, some volatiles increased significantly with the reduction of ethanol. It was
found that the headspace composition of wines changed significantly with three
different ethanol levels and that this might affect the wine aroma. To understand the
effect of ethanol content on the volatility of compounds in the wine matrix, 5 % wine
samples were readjusted to their original ethanol content and analysed to address the
effect of ethanol addition. The headspace concentrations of volatiles in the readjusted
wines were significantly different from the original wine, and the headspace
concentrations of most volatiles in the readjusted wine did not change significantly
compared to 5 %, though a few volatiles decreased significantly due to ethanol addition.
The findings from the consumer preference survey showed that consumer liking and
estimated price decreased gradually with reduction of ethanol from wine. This is similar
to the headspace composition result. However, a moderate reduction of ethanol (8 %)
did not significantly affect consumers’ preference compared to the original wine of both
varieties. This indicates that a larger reduction of ethanol strongly affects wine volatiles
and also affects overall taste. This might result in a decrease in consumers’ preference
for reduced ethanol wine compared to the original wine.
166
7.2 Conclusion
The headspace concentrations of all volatiles did not change in the same pattern with
reduction of ethanol. The headspace concentrations of nearly all volatiles were
significantly different in 5 %, 8 % and original wine of three varieties. The difference in
headspace concentration depends on two factors, (i) the effect of the process on the
volatile compound and (ii) the effect of the ethanol concentration difference on the
volatile compound. Investigation of the latter effect is very important for conducting
ethanol reduction of wine. This effect depends on the hydrophobicity and polarity of the
compound and also on the ethanol concentration of the wine. Increased ethanol
concentration decreases the headspace concentration of volatiles (Villamor & Ross,
2013), but it differs with the nature of the compound.
The effect of the process on volatile composition is also an important issue to consider,
because loss of volatiles occurs during the reduction process. This effect was apparent
in the resultant headspace concentration of a volatile compound when the concentration
of that compound was not much increased due to ethanol reduction. The ester
compounds are mostly responsible for the fruity smell (Francis & Newton, 2005), but
most esters significantly decreased in reduced ethanol wine due to loss of these
compounds during the process. However, acids and alcohols were not affected as much
as ester compounds.
Consumer preference evaluation showed similar result to headspace analysis. It seems
that reduction of ethanol significantly affected consumer preference for both varieties.
Preference also differed with wine variety. However, there was no significant
interaction effect on liking within ethanol levels of a variety. Consumers’ preference
was always higher for Chardonnay and its reduced ethanol content wine compared to
Shiraz. However, preference for 8 % Shiraz did not vary significantly compared to its
5 % and original wine. This suggests that the change in sensory properties in three
different ethanol levels of Shiraz was not as different as it was with Chardonnay.
Nevertheless, consumers’ liking for 5 % ethanol content of both varieties was
significantly reduced compared to original wine. Thus, it can be stated that a larger
reduction of ethanol certainly affects the sensory properties of wine and decreases
consumers’ acceptability for this product compared to original wine. In sum, a larger
reduction of ethanol affected the headspace composition of wine as well as consumer
preference.
167
7.3 Study limitations
Some limitations were encountered while the research was carried out with the
combination GC-MS analysis and consumer preference trial. The limitations could not
be avoided due to project constraints. The limitations are given below:
The ethanol reductions were carried out with only three wine varieties; i.e. Chardonnay,
Sauvignon Blanc and Shiraz. If samples of the same variety but differing in the ethanol
content, then the effect of variety factor can be determined more clearly. To use
different samples of the same variety would have been impractical given the time
required for ethanol reduction processing and the time required for GC-MS analysis.
Moreover, given the volume of wine required for each sample (54 L) it was not possible
to purchase them commercially.
Consumer preference with original and reduced alcohol wine were carried out with 70
participants. The sample size was not big enough for a detailed study regarding
consumers’ behaviour for this product. As recruiting more consumers is expensive, the
trial was carried out at a one day event with 70 participants.
This study has reported that the headspace composition of reduced ethanol wines has
changed. Detailed descriptive sensory analysis of aroma attributes in the wines would
assist to determine how the magnitude of wine aroma changes at varying ethanol
reduction levels.
7.4 Recommendation for further research opportunities
The outcome of the research indicated that the headspace composition of reduced
ethanol wine differs compared to original wine. The research also indicated there is a
difference in consumer preference for reduced ethanol wine. The reason behind the
result was explained and the limitations of the study also mentioned. Now, some
avenues for research that might be helpful in improving the quality of reduced ethanol
wine product were identified. Those research opportunities are:
The ethanol reduction experiments can be designed with different ethanol
percentages of same variety or different wine samples of same variety to
examine the importance of variety properly for the specific reduction process.
The liquid composition of the volatiles in reduced ethanol wine could not be
determined due to limited time in the current research. Determination of this
168
would help to understand more clearly the effect on volatiles of ethanol
reduction from wine.
In addition, the headspace concentration difference of volatiles was found to be
not the same for all chemical groups. It was noticed that loss of ester compounds
during the reduction process was due to applying higher pressure. The operating
conditions of the ethanol reduction process (used in this project) could be
modified to minimise the loss. Further research on optimisation of the operating
parameters of this process will help to find out which has the least effect on
volatiles during the process – higher pressure or longer processing time.
Although consumers preferred Chardonnay and its reduced ethanol content more
than Shiraz, their liking was not significantly different between the three ethanol
levels of Shiraz. It seems that preference for Shiraz was not as strongly affected
as the preference for the white variety, Chardonnay. Future studies on consumer
preference for a number of Shiraz or red wine varieties with reduced ethanol
content could be conducted to find out which variety would be more suitable for
ethanol reduction.
Reduction of ethanol from wine modifies the headspace concentration wine
volatiles. Further research regarding aroma attributes of reduced ethanol wine to
find out whether the changed headspace composition cause change in aroma
profile and what changes are happened in wine flavour (taste and aroma) due to
ethanol reduction that results decrease of consumer preference for the product.
169
References
Agenson, K. O., Oh, J.-I., & Urase, T. (2003). Retention of a Wide Variety of Organic
Pollutants by Different Nanofiltration/Reverse Osmosis Membranes: Controlling
Parameters of Process. Journal of Membrane Science, 225(1–2), 91-103. doi:
10.1016/j.memsci.2003.08.006
Agenson, K. O., & Urase, T. (2007). Change in Membrane Performance Due to Organic
Fouling in Nanofiltration (NF)/Reverse Osmosis (RO) Applications. Separation
and Purification Technology, 55(2), 147-156. doi: 10.1016/j.seppur.2006.11.010
Aguera, E., Bes, M., Roy, A., Camarasa, C., & Sablayrolles, J.-M. (2010). Partial
Removal of Ethanol During Fermentation to Obtain Reduced-Alcohol Wines.
American Journal of Enology and Viticulture, 61(1), 53-60.
Aronson, J., & Ebeler, S. E. (2004). Effect of Polyphenol Compounds on the Headspace
Volatility of Flavors. American Journal of Enology and Viticulture, 55(1), 13-
21.
Athès, V., Peña y Lillo, M., Bernard, C., Pérez-Correa, R., & Souchon, I. (2004).
Comparison of Experimental Methods for Measuring Infinite Dilution
Volatilities of Aroma Compounds in Water/Ethanol Mixtures. Journal of
Agricultural and Food Chemistry, 52(7), 2021-2027.
Austraian Bureau of Statistics. (2012). Vineyards, Australia, 2011-12, Cat No
1329.0.55.002 Retrieved 15th May, 2013, from
http://www.abs.gov.au/ausstats/[email protected]/Latestproducts/1329.0.55.002Main%2
0Features12011-
12?opendocument&tabname=Summary&prodno=1329.0.55.002&issue=2011-
12&num=&view=
Austraian Bureau of Statistics. (2013a). Employee Earnings and Hours, Australia, May
2012, Cat No. 6306.0 Retrieved 25th June, 2013, from
http://www.abs.gov.au/ausstats/[email protected]/mf/6306.0/
Austraian Bureau of Statistics. (2013b). Education and Work, Australia, May 2012, Cat
No. 6227.0 Retrieved 25th June, 2013, from
http://www.abs.gov.au/ausstats/[email protected]/Products/6227.0~May+2012~Main+Fe
atures~Attainment?OpenDocument
Aznar, M., Tsachaki, M., Linforth, R. S. T., Ferreira, V., & Taylor, A. J. (2004).
Headspace Analysis of Volatile Organic Compounds from Ethanolic Systems by
Direct Apci-Ms. International Journal of Mass Spectrometry, 239(1), 17-25.
doi: 10.1016/j.ijms.2004.09.001
Bachmanov, A. A., Kiefer, S. W., Molina, J. C., Tordoff, M. G., Duffy, V. B.,
Bartoshuk, L. M., & Mennella, J. A. (2003). Chemosensory Factors Influencing
Alcohol Perception, Preferences, and Consumption. Alcoholism: Clinical and
Experimental Research, 27(2), 220-231. doi:
10.1097/01.alc.0000051021.99641.19
Barata, A., Campo, E., Malfeito-Ferreira, M., Loureiro, V. l., Cacho, J., & Ferreira, V.
(2011). Analytical and Sensorial Characterization of the Aroma of Wines
Produced with Sour Rotten Grapes Using GC-O and GC-MS: Identification of
Key Aroma Compounds. Journal of Agricultural and Food Chemistry, 59(6),
2543-2553. doi: 10.1021/jf104141f
Bartoshuk, L., Conner, E., Grubin, D., Karrer, T., Kochenbach, K., Palcso, M., . . .
Danowski, S. (1993). Prop Supertasters and the Perception of Ethyl Alcohol.
Chemical Senses, 18, 526-527.
Belisario-S nchez, . ., Taboada-Rodr guez, A., Mar n-Iniesta, F., pez- mez,
A. (2009). Dealcoholized Wines by Spinning Cone Column Distillation:
170
Phenolic Compounds and Antioxidant Activity Measured by the 1,1-Diphenyl-
2-Picrylhydrazyl Method. Journal of Agricultural and Food Chemistry, 57(15),
6770-6778. doi: 10.1021/jf900387g
Blay, M. Y. (2012). Consumer Preference Mapping Using Wine Show Derived Data.
PhD, Charles Sturt University, Wagga Wagga, NSW, Australia.
Bonino, M., Schellino, R., Rizzi, C., Aigotti, R., Delfini, C., & Baiocchi, C. (2003).
Aroma Compounds of an Italian Wine (Ruché) by HS–SPME Analysis Coupled
with GC–ITMS. Food Chemistry, 80(1), 125-133. doi: 10.1016/S0308-
8146(02)00340-0
Brereton, R. G. (2003). Chemometrics: Data Analysis for the Laboratory and Chemical
Plant: John Wiley and Sons, Ltd.
Brereton, R. G. (2007). Applied Chemometrics for Scientists: John Wiley & Sons, Ltd.
Bui, K., Dick, R., Moulin, G., & Galzy, P. (1986). A Reverse Osmosis for the
Production of Low Ethanol Content Wine. American Journal of Enology and
Viticulture, 37(4), 297-300.
Buzrul, S. (2012). High Hydrostatic Pressure Treatment of Beer and Wine: A Review.
Innovative Food Science & Emerging Technologies, 13(0), 1-12. doi:
10.1016/j.ifset.2011.10.001
Campo, E., Cacho, J., & Ferreira, V. (2008). The Chemical Characterization of the
Aroma of Dessert and Sparkling White Wines (Pedro Ximénez, Fino, Sauternes,
and Cava) by as Chromatography−Olfactometry and Chemical Quantitative
Analysis. Journal of Agricultural and Food Chemistry, 56(7), 2477-2484. doi:
10.1021/jf072968l
Capone, S., Tufariello, M., Francioso, L., Montagna, G., Casino, F., Leone, A., &
Siciliano, P. (2013). Aroma Analysis by GC/MS and Electronic Nose Dedicated
to Negroamaro and Primitivo Typical Italian Apulian Wines. Sensors and
Actuators B: Chemical, 179(0), 259-269. doi: 10.1016/j.snb.2012.10.142
Cassano, A., Mecchia, A., & Drioli, E. (2008). Analyses of Hydrodynamic Resistances
and Operating Parameters in the Ultrafiltration of Grape Must. Journal of Food
Engineering, 89(2), 171-177. doi: 10.1016/j.jfoodeng.2008.04.015
Catarino, M., Mendes, A., Madeira, L., & Ferreira, A. (2006). Beer Dealcoholization by
Reverse Osmosis. Desalination, 200(1–3), 397-399. doi:
10.1016/j.desal.2006.03.346
Catarino, M., Mendes, A., Madeira, L., & Ferreira, A. (2007). Alcohol Removal from
Beer by Reverse Osmosis. Separation Science & Technology, 42(13), 3011-
3027. doi: 10.1080/01496390701560223
Catarino, M., Ferreira, A., & Mendes, A. (2009). Study and Optimization of Aroma
Recovery from Beer by Pervaporation. Journal of Membrane Science, 341(1–2),
51-59. doi: 10.1016/j.memsci.2009.05.038
Catarino, M., & Mendes, A. (2011a). Dealcoholizing Wine by Membrane Separation
Processes. Innovative Food Science & Emerging Technologies, 12(3), 330-337.
doi: 10.1016/j.ifset.2011.03.006
Catarino, M., & Mendes, A. (2011b). Non-Alcoholic Beer—a New Industrial Process.
Separation and Purification Technology, 79(3), 342-351. doi:
10.1016/j.seppur.2011.03.020
Charters, S., & Pettigrew, S. (2007). The Dimensions of Wine Quality. Food Quality
and Preference, 18(7), 997-1007. doi: 10.1016/j.foodqual.2007.04.003
Chisholm, M. G., Guiher, L. A., Vonah, T. M., & Beaumont, J. L. (1994). Comparison
of Some French-American Hybrid Wines with White Riesling Using Gas
Chromatography-Olfactometry. American Journal of Enology and Viticulture,
45(2), 201-212.
171
Clarke, R. J., & Bakker, J. (2004). Wine Flavour Chemistry: Blackwell Publishing Ltd,
Oxford, UK.
ComLaw. (2011). Food Standards (Application A1026 - Minimum Alcohol Content for
Wine) Variation - F2011l02066 Retrieved 4th June, 2013, from
http://www.comlaw.gov.au/Details/F2011L02066
ComLaw. (2013). A New Tax System (Wine Equalisation Tax) Act 1999 -
C2013c00232 Retrieved 7th Dec, 2013, from
http://www.comlaw.gov.au/Details/C2013C00232/Html/Text#_Toc357611299
Conner, J. M., Birkmyre, L., Paterson, A., & Piggott, J. R. (1998). Headspace
Concentrations of Ethyl Esters at Different Alcoholic Strengths. Journal of the
Science of Food and Agriculture, 77(1), 121-126. doi: 10.1002/(sici)1097-
0010(199805)77:1<121::aid-jsfa14>3.0.co;2-v
Cuperus, F. P., & Nijhuis, H. H. (1993). Applications of Membrane Technology to Food
Processing. Trends in Food Science & Technology, 4(9), 277-282. doi:
10.1016/0924-2244(93)90070-q
de Fátima Alpendurada, M. (2000). Solid-Phase Microextraction: A Promising
Technique for Sample Preparation in Environmental Analysis. Journal of
Chromatography A, 889(1–2), 3-14. doi: 10.1016/S0021-9673(00)00453-2
Demiglio, P., & Pickering, G. J. (2008). The Influence of Ethanol and pH on the Taste
and Mouthfeel Sensations Elicited by Red Wine Jounal of Food,Agriculture and
Environment, 6 (3&4), 143-150.
Dequin, S., & Barre, P. (1994). Mixed Lactic Acid-Alcoholic Fermentation by
Saccharomyes Cerevisiae Expressing the Lactobacillus Casei L(+)-LDH. Nature
Biotechnology, 12(2), 173-177. doi: 10.1038/nbt0294-173
Dequin, S., Baptista, E., & Barre, P. (1999). Acidification of Grape Musts by
Saccharomyces Cerevisiae Wine Yeast Strains Genetically Engineered to
Produce Lactic Acid. American Journal of Enology and Viticulture, 50(1), 45-
50.
Desportes, C., Charpentier, M., Duteurtre, B., Maujean, A., & Duchiron, F. (2001).
Isolation, Identification, and Organoleptic Characterization of Low-Molecular-
Weight Peptides from White Wine. American Journal of Enology and
Viticulture, 52(4), 376-380.
Diban, N., Athes, V., Bes, M., & Souchon, I. (2008). Ethanol and Aroma Compounds
Transfer Study for Partial Dealcoholization of Wine Using Membrane
Contactor. Journal of Membrane Science, 311(1-2), 136-146. doi:
10.1016/j.memsci.2007.12.004
Diban, N., Arruti, A., Barceló, A., Puxeu, M., Urtiaga, A., & Ortiz, I. (2013). Membrane
Dealcoholization of Different Wine Varieties Reducing Aroma Losses.
Modelling and Experimental Validation. Innovative Food Science & Emerging
Technologies.
Dufour, C., & Bayonove, C. L. (1999a). Influence of Wine Structurally Different
Polysaccharides on the Volatility of Aroma Substances in a Model System.
Journal of Agricultural and Food Chemistry, 47(2), 671-677. doi:
10.1021/jf9801062
Dufour, C., & Bayonove, C. L. (1999b). Interactions between Wine Polyphenols and
Aroma Substances. An Insight at the Molecular Level. Journal of Agricultural
and Food Chemistry, 47(2), 678-684. doi: 10.1021/jf980314u
Dufour, C., & Sauvaitre, I. (2000). Interactions between Anthocyanins and Aroma
Substances in a Model System. Effect on the Flavor of Grape-Derived
Beverages. Journal of Agricultural and Food Chemistry, 48(5), 1784-1788. doi:
10.1021/jf990877l
172
Echavarría, A., Torras, C., Pagán, J., & Ibarz, A. (2011). Fruit Juice Processing and
Membrane Technology Application. Food Engineering Reviews, 3(3), 136-158.
doi: 10.1007/s12393-011-9042-8
El-Sayed, A. M. (2010). The Pherobase: Database of Insect Pheromones and
Semiochemicals. Http://Www.Pherobase.Com.
Erten, H., & Campbell, I. (2001). The Production of Low-Alcohol Wines by Aerobic
Yeasts. Journal of the Institute of Brewing, 107(4), 207-216
Escudero, A., Campo, E., Fariña, L., Cacho, J., & Ferreira, V. (2007). Analytical
Characterization of the Aroma of Five Premium Red Wines. Insights into the
Role of Odor Families and the Concept of Fruitiness of Wines. Journal of
Agricultural and Food Chemistry, 55(11), 4501-4510. doi: 10.1021/jf0636418
Etievant, P. (1991). Wine. In H. Maarse (Ed.), Volatile Compounds in Foods and
Beverages (pp. 483-533): Marcel Dekker Inc., New York, USA.
Fedrizzi, B., Nicolis, E., Camin, F., Bocca, E., Carbognin, C., Scholz, M., . . . Ferrarini,
R. (2013). Stable Isotope Ratios and Aroma Profile Changes Induced Due to
Innovative Wine Dealcoholisation Approaches. Food and Bioprocess
Technology, 1-9. doi: 10.1007/s11947-013-1068-x
Ferreira, V., López, R., & Cacho, J. F. (2000). Quantitative Determination of the
Odorants of Young Red Wines from Different Grape Varieties. Journal of the
Science of Food and Agriculture, 80(11), 1659-1667. doi: 10.1002/1097-
0010(20000901)80:11<1659::aid-jsfa693>3.0.co;2-6
Fischer, U., & Noble, A. C. (1994). The Effect of Ethanol, Catechin Concentration, and
pH on Sourness and Bitterness of Wine. American Journal of Enology and
Viticulture, 45(1), 6-10.
Fontoin, H., Saucier, C., Teissedre, P.-L., & Glories, Y. (2008). Effect of pH, Ethanol
and Acidity on Astringency and Bitterness of Grape Seed Tannin Oligomers in
Model Wine Solution. Food Quality and Preference, 19(3), 286-291. doi:
10.1016/j.foodqual.2007.08.004
Fornari, T., Hernández, E. J., Ruiz-Rodriguez, A., Javier Señorans, F., & Reglero, G.
(2009). Phase Equilibria for the Removal of Ethanol from Alcoholic Beverages
Using Supercritical Carbon Dioxide. The Journal of Supercritical Fluids, 50(2),
91-96.
Francis, I. L., & Newton, J. L. (2005). Determining Wine Aroma from Compositional
Data. Australian Journal of Grape and Wine Research, 11(2), 114-126. doi:
10.1111/j.1755-0238.2005.tb00283.x
Gamse, T., Rogler, I., & Marr, R. (1999). Supercritical CO2 Extraction for Utilisation of
Excess Wine of Poor Quality. The Journal of Supercritical Fluids, 14(2), 123-
128. doi: 10.1016/s0896-8446(98)00114-4
García-Martín, N., Palacio, L., Prádanos, P., Hernández, A., Ortega-Heras, M., Pérez-
Magariño, S., & González-Huerta, D. C. (2009). Evaluation of Several Ultra-
and Nanofiltration Membranes for Sugar Control in Winemaking. Desalination,
245(1–3), 554-558. doi: 10.1016/j.desal.2009.02.020
García-Martín, N., Perez-Magariño, S., Ortega-Heras, M., González-Huerta, C.,
Mihnea, M., González-Sanjosé, M. L., . . . Hernández, A. (2010). Sugar
Reduction in Musts with Nanofiltration Membranes to Obtain Low Alcohol-
Content Wines. Separation and Purification Technology, 76(2), 158-170. doi:
10.1016/j.seppur.2010.10.002
García-Martín, N., Perez-Magariño, S., Ortega-Heras, M., González-Huerta, C.,
Mihnea, M., González-Sanjosé, M. L., . . . Hernández, A. (2011). Sugar
Reduction in White and Red Musts with Nanofiltration Membranes.
Desalination and Water Treatment, 27(1-3). doi: 10.5004/dwt.2011.2039
173
Gawel, R., Sluyter, S. V., & Waters, E. J. (2007). The Effects of Ethanol and Glycerol
on the Body and Other Sensory Characteristics of Riesling Wines. Australian
Journal of Grape and Wine Research, 13(1), 38-45. doi: 10.1111/j.1755-
0238.2007.tb00070.x
Goldner, M. C., Zamora, M. C., Di Leo Lira, P., Gianninoto, H., & Bandoni, A. (2009).
Effect of Ethanol Level in the Perception of Aroma Attributes and the Detection
of Volatile Compounds in Red Wine Journal of Sensory Studies, 24(2), 243-257.
doi: 10.1111/j.1745-459X.2009.00208.x
mez-Plaza, ., pez-Nicol s, . M., pez-Roca, . M., Mart nez-Cutillas, A.
(1999). Dealcoholization of Wine. Behaviour of the Aroma Components During
the Process. LWT - Food Science and Technology, 32(6), 384-386. doi:
10.1006/fstl.1999.0565
Green, B. G. (1987). The Sensitivity of the Tongue to Ethanol. Annals of the New York
Academy of Sciences, 510(1), 315-317.
Grønbæk, M. (2009). The Positive and Negative Health Effects of Alcohol- and the
Public Health Implications. Journal of Internal Medicine, 265(4), 407-420. doi:
10.1111/j.1365-2796.2009.02082.x
Grosch, W. (2001). Evaluation of the Key Odorants of Foods by Dilution Experiments,
Aroma Models and Omission. Chemical Senses, 26(5), 533-545. doi:
10.1093/chemse/26.5.533
Gürbüz, O., Rouseff, J. M., & Rouseff, R. L. (2006). Comparison of Aroma Volatiles in
Commercial Merlot and Cabernet Sauvignon Wines Using Gas
Chromatography−Olfactometry and as Chromatography−Mass Spectrometry.
Journal of Agricultural and Food Chemistry, 54(11), 3990-3996. doi:
10.1021/jf053278p
Guth, H. (1997a). Quantitation and Sensory Studies of Character Impact Odorants of
Different White Wine Varieties. Journal of Agricultural and Food Chemistry,
45(8), 3027-3032. doi: 10.1021/jf970280a
Guth, H. (1997b). Identification of Character Impact Odorants of Different White Wine
Varieties. Journal of Agricultural and Food Chemistry, 45(8), 3022-3026. doi:
10.1021/jf9608433
Hayasaka, Y., Baldock, G. A., & Pollnitz, A. P. (2005). Contributions of Mass
Spectrometry in the Australian Wine Research Institute to Advances in
Knowledge of Grape and Wine Constituents. Australian Journal of Grape and
Wine Research, 11(2), 188-204. doi: 10.1111/j.1755-0238.2005.tb00287.x
Heux, S., Cachon, R., & Dequin, S. (2006a). Cofactor Engineering in Saccharomyces
Cerevisiae: Expression of a H2O-Forming NADH Oxidase and Impact on Redox
Metabolism. Metabolic Engineering, 8(4), 303-314. doi:
10.1016/j.ymben.2005.12.003
Heux, S., Sablayrolles, J.-M., Cachon, R., & Dequin, S. (2006b). Engineering a
Saccharomyces Cerevisiae Wine Yeast That Exhibits Reduced Ethanol
Production During Fermentation under Controlled Microoxygenation Conditions
Applied and Environmental Microbiology, 72(9), p.5822-5828.
HM Revenue and Customs. (2013). Alcohol Duty Retrieved 1st June, 2013, from
http://www.hmrc.gov.uk/rates/alcohol-duty.htm
Hogan, P. A., Canning, R. P., Peterson, P. A., Johnson, R. A., & Michaels, A. S. (1998).
A New Option: Osmotic Distillation. Chemical Engineering Progress, 94(7),
49-49.
Howley, M., & Young, N. (1992). Low-Alcohol Wines: The Consumer's Choice?
International Journal of Wine Marketing, 4(3), 45-56.
Iland, P., Bruer, N., & Wilkes, E. (2004). Chemical Analysis of Grapes and Wine:
Techniques and Concepts: Patrick Iland Wine Promotions, Adelaide, Australia
174
James, A. T., & Martin, A. J. P. (1952). Gas-Liquid Partition Chromatography; the
Separation and Micro-Estimation of Volatile Fatty Acids from Formic Acid to
Dodecanoic Acid. Biochem. J., 50(5), 679-690.
Jiao, B., Cassano, A., & Drioli, E. (2004). Recent Advances on Membrane Processes for
the Concentration of Fruit Juices: A Review. Journal of Food Engineering,
63(3), 303-324. doi: 10.1016/j.jfoodeng.2003.08.003
Jones, P. R., Gawel, R., Francis, I. L., & Waters, E. J. (2008). The Influence of
Interactions between Major White Wine Components on the Aroma, Flavour
and Texture of Model White Wine. Food Quality and Preference, 19(6), 596-
607. doi: 10.1016/j.foodqual.2008.03.005
Jung, D.-M., de Ropp, J. S., & Ebeler, S. E. (2000). Study of Interactions between Food
Phenolics and Aromatic Flavors Using One-and Two-Dimensional 1H NMR
Spectroscopy. Journal of Agricultural and Food Chemistry, 48(2), 407-412.
Jung, D.-M., & Ebeler, S. E. (2002). Headspace Solid-Phase Microextraction Method
for the Study of the Volatility of Selected Flavor Compounds. Journal of
Agricultural and Food Chemistry, 51(1), 200-205. doi: 10.1021/jf020651+
Karlsson, H. O. E., Loureiro, S., & Trägårdh, G. (1995). Aroma Compound Recovery
with Pervaporation — Temperature Effects During Pervaporation of a Muscat
Wine. Journal of Food Engineering, 26(2), 177-191. doi: 10.1016/0260-
8774(94)00050-j
Karlsson, H. O. E., & Tragardh, G. (1996). Applications of Pervaporation in Food
Processing. Trends in Food Science & Technology, 7(3), 78-83. doi:
10.1016/0924-2244(96)81301-x
Kataoka, H., Lord, H. L., & Pawliszyn, J. (2000). Applications of Solid-Phase
Microextraction in Food Analysis. Journal of Chromatography A, 880(1–2), 35-
62. doi: 10.1016/S0021-9673(00)00309-5
Kilmartin, P. A., Zou, H., & Waterhouse, A. L. (2002). Correlation of Wine Phenolic
Composition Versus Cyclic Voltammetry Response. American Journal of
Enology and Viticulture, 53(4), 294-302.
Kondjoyan, N., & Berdagué, J.-L. (1996). A Compilation of Relative Retention Indices
for the Analysis of Aromatic Compounds: Ed. du Laboratoire Flaveur.
Kontoudakis, N., Esteruelas, M., Fort, F., Canals, J. M., & Zamora, F. (2011). Use of
Unripe Grapes Harvested During Cluster Thinning as a Method for Reducing
Alcohol Content and pH of Wine. Australian Journal of Grape and Wine
Research, 17(2), 230-238. doi: 10.1111/j.1755-0238.2011.00142.x
Labanda, J., Vichi, S., Llorens, J., & López-Tamames, E. (2009). Membrane Separation
Technology for the Reduction of Alcoholic Degree of a White Model Wine.
LWT - Food Science and Technology, 42(8), 1390-1395. doi:
10.1016/j.lwt.2009.03.008
Langourieux, S., & Crouzet, J. C. (1997). Study of Interactions between Aroma
Compounds and Glycopeptides by a Model System. Journal of Agricultural and
Food Chemistry, 45(5), 1873-1877. doi: 10.1021/jf960559b
Langstaff, S. A., Guinard, J.-X., & Lewis, M. J. (1991). Instrumental Evaluation of the
Mouthfeel of Beer and Correlation with Sensory Evaluation. Journal of Institute
of Brewing, 97, 427-433.
Lawless , H. T., & Heymann, H. (1999). Sensory Evaluation of Food: Principles and
Practices: Kluwer Academic/Plenum Publishers, New York in 1999
Le Berre, E., Atanasova, B., Langlois, D., Etiévant, P., & Thomas-Danguin, T. (2007).
Impact of Ethanol on the Perception of Wine Odorant Mixtures. Food Quality
and Preference, 18(6), 901-908. doi: 10.1016/j.foodqual.2007.02.004
Leardi, R. (2009). Experimental Design in Chemistry : A Tutorial. Analytica Chimica
Acta, 652, 161-172.
175
Leino, M., Francis, I. L., Kallio, H., & Williams, P. J. (1993). Gas Chromatographic
Headspace Analysis of Chardonnay and Semillon Wines after Thermal
Processing. Zeitschrift für Lebensmitteluntersuchung und -Forschung A, 197(1),
29-33. doi: 10.1007/bf01202696
Lesschaeve, I., & Noble, A. C. (2005). Polyphenols: Factors Influencing Their Sensory
Properties and Their Effects on Food and Beverage Preferences. The American
journal of clinical nutrition, 81(1), 330S-335S.
Lipnizki, F., Field, R. W., & Ten, P.-K. (1999). Pervaporation-Based Hybrid Process: A
Review of Process Design, Applications and Economics. Journal of Membrane
Science, 153(2), 183-210. doi: 10.1016/s0376-7388(98)00253-1
Lisanti, M. T., Gambuti, A., Piombino, P., Pessina, R., & Moio, L. (2011). Sensory
Study on Partial Dealcoholization of Wine by Osmotic Distillation Process.
Bulletin de l'OIV-Organisation Internationale de la Vigne et du Vin, 84(959),
95.
Lopes, M. d. B., Rehman, A.-u., Gockowiak, H., Heinrich, A. J., Langridge, P., &
Henschke, P. A. (2000). Fermentation Properties of a Wine Yeast over-
Expressing the Saccharomyces Cerevisiae Glycerol 3-Phosphate Dehydrogenase
Gene (GPD2). Australian Journal of Grape and Wine Research, 6(3), 208-215.
doi: 10.1111/j.1755-0238.2000.tb00181.x
López, M., Alvarez, S., Riera, F. A., & Alvarez, R. (2002). Production of Low Alcohol
Content Apple Cider by Reverse Osmosis. Industrial & Engineering Chemistry
Research, 41(25), 6600-6606. doi: 10.1021/ie020155a
Lubbers, S., Charpentier, C., Feuillat, M., & Voilley, A. (1994). Influence of Yeast
Walls on the Behavior of Aroma Compounds in a Model Wine. American
Journal of Enology and Viticulture, 45(1), 29-33.
Lubbers, S., Verret, C., & Voilley, A. (2001). The Effect of Glycerol on the Perceived
Aroma of a Model Wine and a White Wine. LWT - Food Science and
Technology, 34(4), 262-265. doi: 10.1006/fstl.2001.0766
Maarse, H. (Ed.). (1991). Volatile Compounds in Foods and Beverages.
Maitre, I., Symoneaux, R., Jourjon, F., & Mehinagic, E. (2010). Sensory Typicality of
Wines: How Scientists Have Recently Dealt with This Subject. Food Quality
and Preference, 21(7), 726-731. doi: 10.1016/j.foodqual.2010.06.003
Malherbe, D. F., du Toit, M., Cordero Otero, R. R., van Rensburg, P., & Pretorius, I. S.
(2003). Expression of the Aspergillus Niger Glucose Oxidase Gene in
Saccharomyces Cerevisiae and Its Potential Applications in Wine Production.
Applied Microbiology and Biotechnology, 61(5), 502-511. doi: 10.1007/s00253-
002-1208-0
Malletroit, V., Guinard, J.-X., Kunkee, R. E., & Lewis, M. J. (1991). Effect of
Pasteurization on Microbiological and Sensory Quality of White Grape Juice
and Wine Journal of Food Processing and Preservation, 15(1), 19-29. doi:
10.1111/j.1745-4549.1991.tb00151.x
Martin, S., & Pangborn, R. M. (1970). Taste Interaction of Ethyl Alcohol with Sweet,
Salty, Sour and Bitter Compounds. Journal of the Science of Food and
Agriculture, 21(12), 653-655. doi: 10.1002/jsfa.2740211213
Massot, A., Mietton-Peuchot, M., Peuchot, C., & Milisic, V. (2008). Nanofiltration and
Reverse Osmosis in Winemaking. Desalination, 231(1-3), 283-289. doi:
10.1016/j.desal.2007.10.032
Mattes, R. D., & DiMeglio, D. (2001). Ethanol Perception and Ingestion. Physiology &
Behavior, 72(1–2), 217-229. doi: 10.1016/s0031-9384(00)00397-8
Medina, I., & Martínez, J. L. (1997). Dealcoholisation of Cider by Supercritical
Extraction with Carbon Dioxide. Journal of Chemical Technology &
176
Biotechnology, 68(1), 14-18. doi: 10.1002/(sici)1097-
4660(199701)68:1<14::aid-jctb589>3.0.co;2-e
Meier, P. M. (1992). The Reverse Osmosis Process for Wine Dealcoholization. The
Australian and New Zealand Grapegrower and Winemaker, 348, 9-10.
Meillon, S., Urbano, C., & Schlich, P. (2009). Contribution of the Temporal Dominance
of Sensations (TDS) Method to the Sensory Description of Subtle Differences in
Partially Dealcoholized Red Wines. Food Quality and Preference, 20(7), 490-
499. doi: 10.1016/j.foodqual.2009.04.006
Meillon, S., Viala, D., Medel, M., Urbano, C., Guillot, G., & Schlich, P. (2010a).
Impact of Partial Alcohol Reduction in Syrah Wine on Perceived Complexity
and Temporality of Sensations and Link with Preference. Food Quality and
Preference, 21(7), 732-740. doi: 10.1016/j.foodqual.2010.06.005
Meillon, S., Dugas, V., Urbano, C., & Schlich, P. (2010b). Preference and Acceptability
of Partially Dealcoholized White and Red Wines by Consumers and
Professionals. American Journal of Enology and Viticulture, 61(1), 42-52.
Memstar. (2011). Memstar Micro Alcohol Adjustment Operators Manual: Memstar Pty
Ltd. Melbourne, Victoria, Australia.
Memstar. (2013). Alcohol Adjustment Retrieved 21th June, 2013, from
http://www.memstar.com.au/modules/mastop_publish/?tac=Alcohol_Adjustmen
t
Mitra, S. (2004). Sample Preparation Techniques in Analytical Chemistry (Vol. 237):
John Wiley & Sons, Inc., Hoboken, New Jersey, USA.
Mok, C., Song, K. T., Park, Y. S., Lim, S., Ruan, R., & Chen, P. (2006). High
Hydrostatic Pressure Pasteurization of Red Wine. Journal of Food Science,
71(8). doi: 10.1111/j.1750-3841.2006.00145.x
Molina, J. M., Vatai, G., & Bekassy-Molnar, E. (2002). Comparison of Pervaporation of
Different Alcohols from Water on CMG-OM-010 and 1060-SULZER
Membranes. Desalination, 149(1–3), 89-94. doi: 10.1016/s0011-
9164(02)00737-3
NHMRC. (2009a). New Alcohol Guidelines Say Reuduce Drinking to Reduce Risk
Retrieved 21st June, 2013, from
http://www.nhmrc.gov.au/media/releases/2009/new-alcohol-guidelines-say-
reduce-drinking-reduce-risk
NHMRC. (2009b). Australian Guidelines to Reduce Health Risks from Drinking
Alcohol Retrieved 23rd October, 2010, from
http://www.nhmrc.gov.au/_files_nhmrc/publications/attachments/ds10-
alcohol.pdf
Nieuwoudt, H. H., Prior, B. A., Pretorius, I. S., & Bauer, F. F. (2002). Glycerol in South
African Table Wines: An Assessment of Its Relationship to Wine Quality. South
African Journal of Enology and Viticulture, 23(1), 22-30.
Noble, A. C., & Bursick, G. F. (1984). The Contribution of Glycerol to Perceived
Viscosity and Sweetness in White Wine. American Journal of Enology and
Viticulture, 35(2), 110-112.
Noble, R. D., & Stern, S. A. (1995). Membrane Seperations Technology: Principles and
Applications: Elsveier Science B.V, Amsterdam, The Netherlands.
Nurgel, C., & Pickering, G. (2005). Contribution of Glycerol,Ethanol and Sugar to the
Perception of Viscosity and Density Elicited by Model White Wines. Journal of
Texture Studies, 36(3), 303-323. doi: 10.1111/j.1745-4603.2005.00018.x
OIV. (2012a). Products Definition Retrieved 4th June, 2013, from
http://www.oiv.int/oiv/info/endefinitionproduit
OIV. (2012b). Dealcoholisation of Wines: New Definitions and Procedures Adopted by
the OIV: International Organization of Vine and Wine, Paris, France.
177
Ough, C. S., Fong, D., & Amerine, M. A. (1972). Glycerol in Wine: Determination and
Some Factors Affecting. American Journal of Enology and Viticulture, 23(1), 1-
5.
Pickering, G. J., Heatherbell, D. A., Vanhanen, L. P., & Barnes, M. F. (1998). The
Effect of Ethanol Concentration on the Temporal Perception of Viscosity and
Density in White Wine. American Journal of Enology and Viticulture, 49(3),
306-318.
Pickering, G. J., Heatherbell, D. A., & Barnes, M. F. (1999a). The Production of
Reduced-Alcohol Wine Using Glucose Oxidase Treated Juice. Part I.
Composition. American Journal of Enology and Viticulture, 50(3), 291-298.
Pickering, G. J., Heatherbell, D. A., & Barnes, M. F. (1999b). The Production of
Reduced-Alcohol Wine Using Glucose Oxidase-Treated Juice. Part III. Sensory.
American Journal of Enology and Viticulture, 50(3), 307-316.
Pickering, G. J. (2000). Low- and Reduced-Alcohol Wine: A Review. [Article]. Journal
of Wine Research, 11(2), 129-144. doi: Doi:10.1080/09571260020001575
Pilipovik, M. V., & Riverol, C. (2005). Assessing Dealcoholization Systems Based on
Reverse Osmosis. Journal of Food Engineering, 69(4), 437-441. doi:
10.1016/j.jfoodeng.2004.08.035
Pollnitz, A., Pardon, K., Sykes, M., & Sefton, M. (2004). The Effects of Sample
Preparation and Gas Chromatograph Injection Techniques on the Accuracy of
Measuring Guaiacol, 4-Methylguaiacol and Other Volatile Oak Compounds in
Oak Extracts by Table Isotope Dilution Analyses. Journal of Agricultural and
Food Chemistry, 52(11), 3244-3252.
Pozo-Bayón, M., & Reineccius, G. (2009). Interactions between Wine Matrix Macro-
Components and Aroma Compounds. In M. V. Moreno-Arribas & M. C. Polo
(Eds.), Wine Chemistry and Biochemistry (pp. 417-435): Springer New York.
Pyle, L. (1994). Processed Foods with Natural Flavour: The Use of Novel Recovery
Technology. Nutrition & Food Science, 94(1), 12-14.
Rebière, L., Clark, A. C., Schmidtke, L. M., Prenzler, P. D., & Scollary, G. R. (2010). A
Robust Method for Quantification of Volatile Compounds within and between
Vintages Using Headspace-Solid-Phase Micro-Extraction Coupled with GC–MS
– Application on Semillon Wines. Analytica Chimica Acta, 660(1–2), 149-157.
doi: 10.1016/j.aca.2009.10.029
Robinson, A. L., Ebeler, S. E., Heymann, H., Boss, P. K., Solomon, P. S., & Trengove,
R. D. (2009). Interactions between Wine Volatile Compounds and Grape and
Wine Matrix Components Influence Aroma Compound Headspace Partitioning.
Journal of Agricultural and Food Chemistry, 57(21), 10313-10322.
Rocha, S., Ramalheira, V., Barros, A., Delgadillo, I., & Coimbra, M. A. (2001).
Headspace Solid Phase Microextraction (Spme) Analysis of Flavor Compounds
in Wines. Effect of the Matrix Volatile Composition in the Relative Response
Factors in a Wine Model. Journal of Agricultural and Food Chemistry, 49(11),
5142-5151. doi: 10.1021/jf010566m
Saliba, A. J., Ovington, L. A., & Moran, C. C. (2013a). Consumer Demand for Low-
Alcohol Wine in an Australian Sample. International Journal of Wine Research,
2013(5), 1-8. doi: 10.2147/IJWR.S41448
Saliba, A. J., Ovington, L., Moran, C. C., & Bruwer, J. (2013b). Consumer Attitudes to
Low Alcohol Wine: An Australian Sample. Wine & Viticulture Journal, 28(2),
58-61.
San- uan, F., Pet’ka, ., Cacho, J., Ferreira, V., & Escudero, A. (2010). Producing
Headspace Extracts for the Gas Chromatography–Olfactometric Evaluation of
Wine Aroma. Food Chemistry, 123(1), 188-195. doi:
10.1016/j.foodchem.2010.03.129
178
Schmidtke, L. M. (2011). Effects of Micro-Oxigenation on Shiraz Wine. PhD, Charles
Sturt University, Wagga Wagga.
Schmidtke, L. M., Blackman, J. W., & Agboola, S. O. (2012). Production Technologies
for Reduced Alcoholic Wines. Journal of Food Science, 77(1). doi:
10.1111/j.1750-3841.2011.02448.x.
Siebert, T., Smyth, H., Capone, D., Neuwöhner, C., Pardon, K., Skouroumounis, G., . . .
Pollnitz, A. (2005). Stable Isotope Dilution Analysis of Wine Fermentation
Products by HS-SPME-GC-MS. Analytical and Bioanalytical Chemistry,
381(4), 937-947. doi: 10.1007/s00216-004-2992-4
Simpson, R. F., & Miller, G. C. (1984). Aroma Composition of Chardonnay Wine.
Vitis, 23, 143-158.
Singh, R. P., & Heldman, D. R. (2008). Introduction to Food Engineering: Academic
Press, California, USA.
Smart, R., Robinson, J., Due, G., & Brien, C. (1985). Canopy Microclimate
Modification for the Cultivar Shiraz. Ii. Effects on Must and Wine Composition.
Vitis, 24(2), 119-128.
Smith, C. R. (1996). US Patent No 5480665. Washington, DC: U.S. Patent and
Trademark Office.
Snow, N. H., & Slack, G. C. (2002). Head-Space Analysis in Modern Gas
Chromatography. TrAC Trends in Analytical Chemistry, 21(9-10), 608-617. doi:
10.1016/s0165-9936(02)00802-6
Soden, A., Francis, I., Oakey, H., & Henschke, P. (2000). Effects of Co‐Fermentation
with Candida Stellata and Saccharomyces Cerevisiae on the Aroma and
Composition of Chardonnay Wine. Australian Journal of Grape and Wine
Research, 6(1), 21-30.
Styger, G., Prior, B., & Bauer, F. (2011). Wine Flavor and Aroma. Journal of Industrial
Microbiology & Biotechnology, 38(9), 1145-1159. doi: 10.1007/s10295-011-
1018-4
Takács, L., Vatai, G., & Korány, K. (2007). Production of Alcohol Free Wine by
Pervaporation. Journal of Food Engineering, 78(1), 118-125. doi:
10.1016/j.jfoodeng.2005.09.005
Tan, S., Li, L., Xiao, Z., Wu, Y., & Zhang, Z. (2005). Pervaporation of Alcoholic
Beverages—the Coupling Effects between Ethanol and Aroma Compounds.
Journal of Membrane Science, 264(1-2), 129-136. doi:
10.1016/j.memsci.2005.04.028
Tsachaki, M., Linforth, R. S. T., & Taylor, A. J. (2005). Dynamic Headspace Analysis
of the Release of Volatile Organic Compounds from Ethanolic Systems by
Direct APCI-MS. Journal of Agricultural and Food Chemistry, 53(21), 8328-
8333. doi: 10.1021/jf051202n
Tsachaki, M., Linforth, R. S. T., & Taylor, A. J. (2009). Aroma Release from Wines
under Dynamic Conditions. Journal of Agricultural and Food Chemistry,
57(15), 6976-6981. doi: 10.1021/jf901174y
Ugarte, P., Agosin, E., Bordeu, E., & Villalobos, J. I. (2005). Reduction of 4-
Ethylphenol and 4-Ethylguaiacol Concentration in Red Wines Using Reverse
Osmosis and Adsorption. American Journal of Enology and Viticulture, 56(1),
30-36.
Varavuth, S., Jiraratananon, R., & Atchariyawut, S. (2009). Experimental Study on
Dealcoholization of Wine by Osmotic Distillation Process. Separation and
Purification Technology, 66(2), 313-321. doi: 10.1016/j.seppur.2008.12.011
Vella, P. J. (1984 ). US Patent No 4468407. Washington, DC: U.S. Patent and
Trademark Office.
179
Verdú Jover, A. J., Lloréns Montes, F. J., & Fuentes Fuentes, M. a. d. M. (2004).
Measuring Perceptions of Quality in Food Products: The Case of Red Wine.
Food Quality and Preference, 15(5), 453-469. doi:
10.1016/j.foodqual.2003.08.002
Villamor, R. R., & Ross, C. F. (2013). Wine Matrix Compounds Affect Perception of
Wine Aromas. Annual Review of Food Science and Technology, 4(1), 1-20. doi:
doi:10.1146/annurev-food-030212-182707
Villamor, R. R., Evans, M. A., Mattinson, D. S., & Ross, C. F. (2013). Effects of
Ethanol, Tannin and Fructose on the Headspace Concentration and Potential
Sensory Significance of Odorants in a Model Wine. Food Research
International, 50(1), 38-45. doi: 10.1016/j.foodres.2012.09.037
Virtual Chembook. (2003a). Molecular Polarity- Organic Functional Groups Retrieved
17th June, 2013, from
http://www.elmhurst.edu/~chm/vchembook/213organicfcgp.html
Virtual Chembook. (2003b). Molecular Polarity- Organic Chain Length Retrieved 17th
June, 2013, from
http://www.elmhurst.edu/~chm/vchembook/214organicchain.html
Voilley, A., Lamer, C., Dubois, P., & Feuillat, M. (1990). Influence of Macromolecules
and Treatments on the Behavior of Aroma Compounds in a Model Wine.
Journal of Agricultural and Food Chemistry, 38(1), 248-251. doi:
10.1021/jf00091a054
Voilley, A., Beghin, V., Charpentier, C., & Peyron, D. (1991). Interactions between
Aroma Substances and Macromolecules in a Model Wine (Vol. 24). Kidlington,
ROYAUME-UNI: Elsevier.
Voilley, A., & Lubbers, S. (1998). Flavor-Matrix Interactions in Wine Chemistry of
Wine Flavor (Vol. 714, pp. 217-229): American Chemical Society.
Whiton, R. S., & Zoecklein, B. W. (2000). Optimization of Headspace Solid-Phase
Microextraction for Analysis of Wine Aroma Compounds. American Journal of
Enology and Viticulture, 51(4), 379-382.
WHO. (2010). Global Strategy to Reduce the Harmful Use of Alcohol: World Health
Organization Press, Geneva, Switzerland.
Wine Intelligence. (2012). Lower Alcohol Wines, Consumer Insights from the Uk
Market: Wine Inteligence, London, UK.
Wine Larder. (2006). Australian Grapes and Wines Retrieved 10th March, 2013, from
http://www.winelarder.com.au/100283.php
Wollan, D. (2010). Technological Options for Dealing with High Alcohol Wines Paper
presented at the Intervitis Interfructa 2010, Stuttgurt, Germany.
Woraratphoka, J., Intarapichet, K.-O., & Indrapichate, K. (2007). Phenolic Compounds
and Antioxidative Properties of Selected Wines from the Northeast of Thailand.
Food Chemistry, 104(4), 1485-1490.
Yeh, L. L., Kim, K. O., Chompreeda, P., Rimkeeree, H., Yau, N. J. N., & Lundahl, D.
S. (1998). Comparison in Use of the 9-Point Hedonic Scale between Americans,
Chinese, Koreans, and Thai. Food Quality and Preference, 9(6), 413-419. doi:
10.1016/S0950-3293(98)00028-7
Zhang, Z., Yang, M. J., & Pawliszyn, J. (1994). Solid-Phase Microextraction. A
Solvent-Free Alternative for Sample Preparation. Analytical Chemistry, 66(17),
844A-853A. doi: 10.1021/ac00089a001
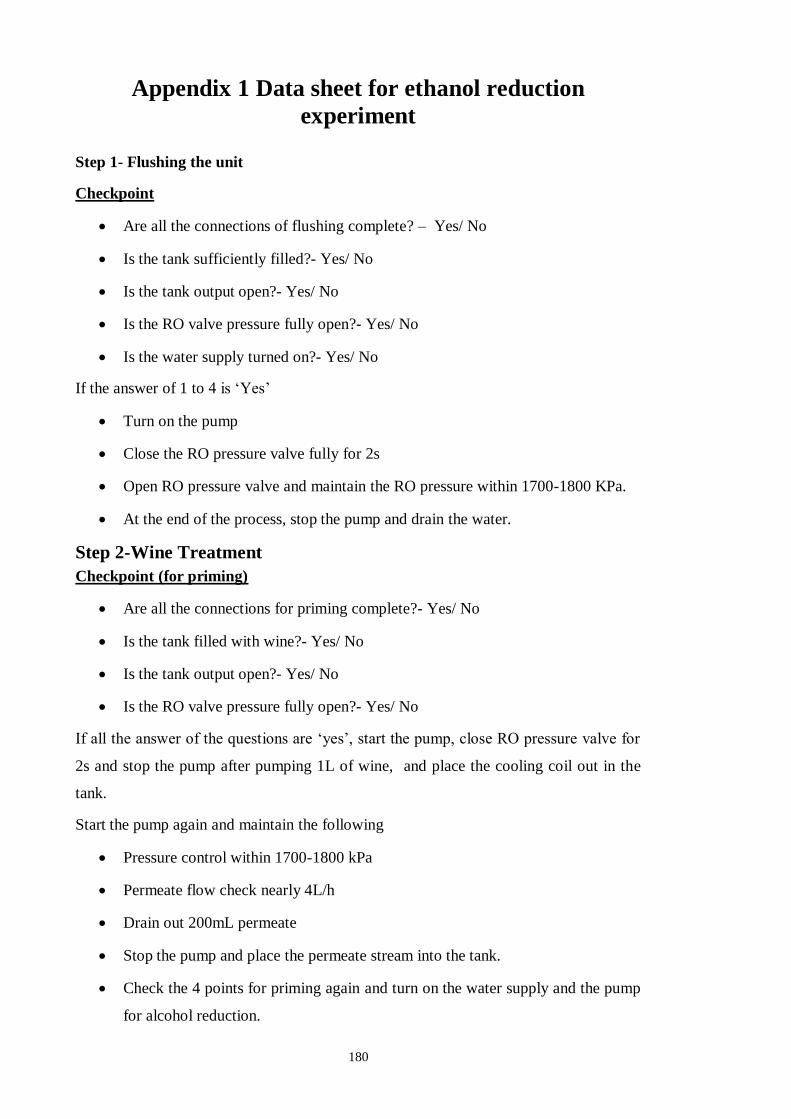
180
Appendix 1 Data sheet for ethanol reduction
experiment
Step 1- Flushing the unit
Checkpoint
Are all the connections of flushing complete? – Yes/ No
Is the tank sufficiently filled?- Yes/ No
Is the tank output open?- Yes/ No
Is the RO valve pressure fully open?- Yes/ No
Is the water supply turned on?- Yes/ No
If the answer of 1 to 4 is ‘ es’
Turn on the pump
Close the RO pressure valve fully for 2s
Open RO pressure valve and maintain the RO pressure within 1700-1800 KPa.
At the end of the process, stop the pump and drain the water.
Step 2-Wine Treatment
Checkpoint (for priming)
Are all the connections for priming complete?- Yes/ No
Is the tank filled with wine?- Yes/ No
Is the tank output open?- Yes/ No
Is the RO valve pressure fully open?- Yes/ No
If all the answer of the questions are ‘yes’, start the pump, close RO pressure valve for
2s and stop the pump after pumping 1L of wine, and place the cooling coil out in the
tank.
Start the pump again and maintain the following
Pressure control within 1700-1800 kPa
Permeate flow check nearly 4L/h
Drain out 200mL permeate
Stop the pump and place the permeate stream into the tank.
Check the 4 points for priming again and turn on the water supply and the pump
for alcohol reduction.
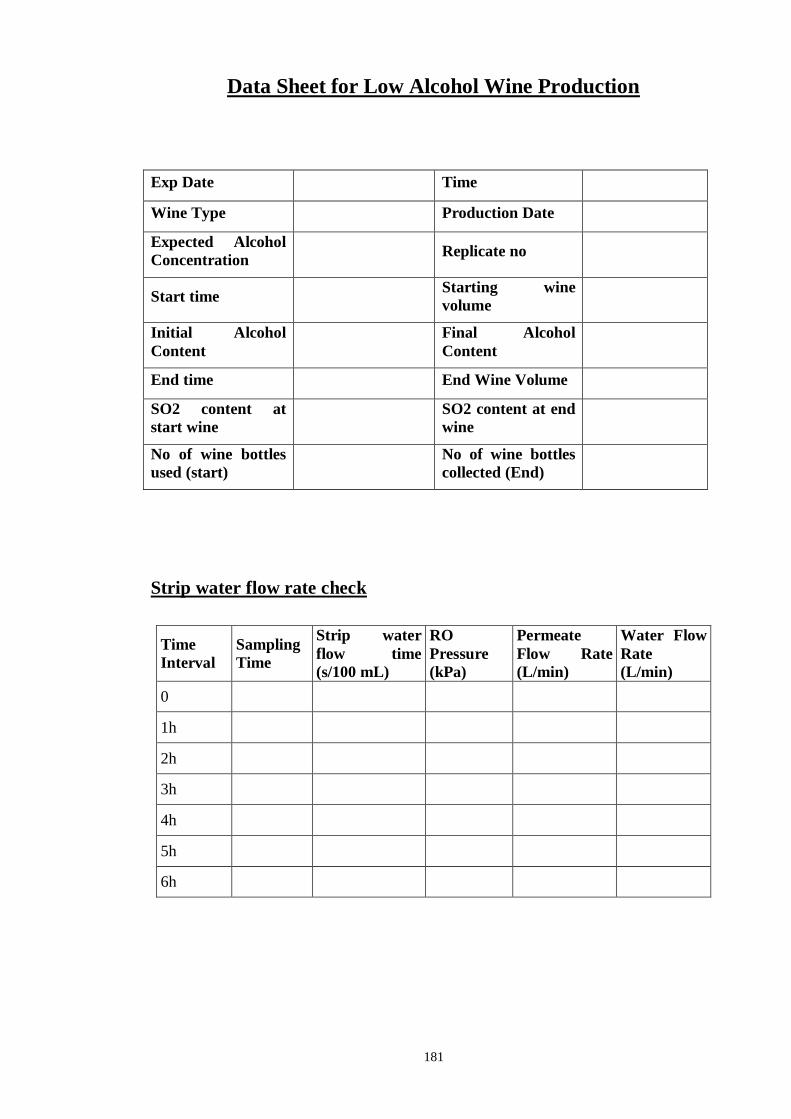
181
Data Sheet for Low Alcohol Wine Production
Exp Date Time
Wine Type Production Date
Expected Alcohol
Concentration Replicate no
Start time Starting wine
volume
Initial Alcohol
Content
Final Alcohol
Content
End time End Wine Volume
SO2 content at
start wine
SO2 content at end
wine
No of wine bottles
used (start)
No of wine bottles
collected (End)
Strip water flow rate check
Time
Interval
Sampling
Time
Strip water
flow time
(s/100 mL)
RO
Pressure
(kPa)
Permeate
Flow Rate
(L/min)
Water Flow
Rate
(L/min)
0
1h
2h
3h
4h
5h
6h
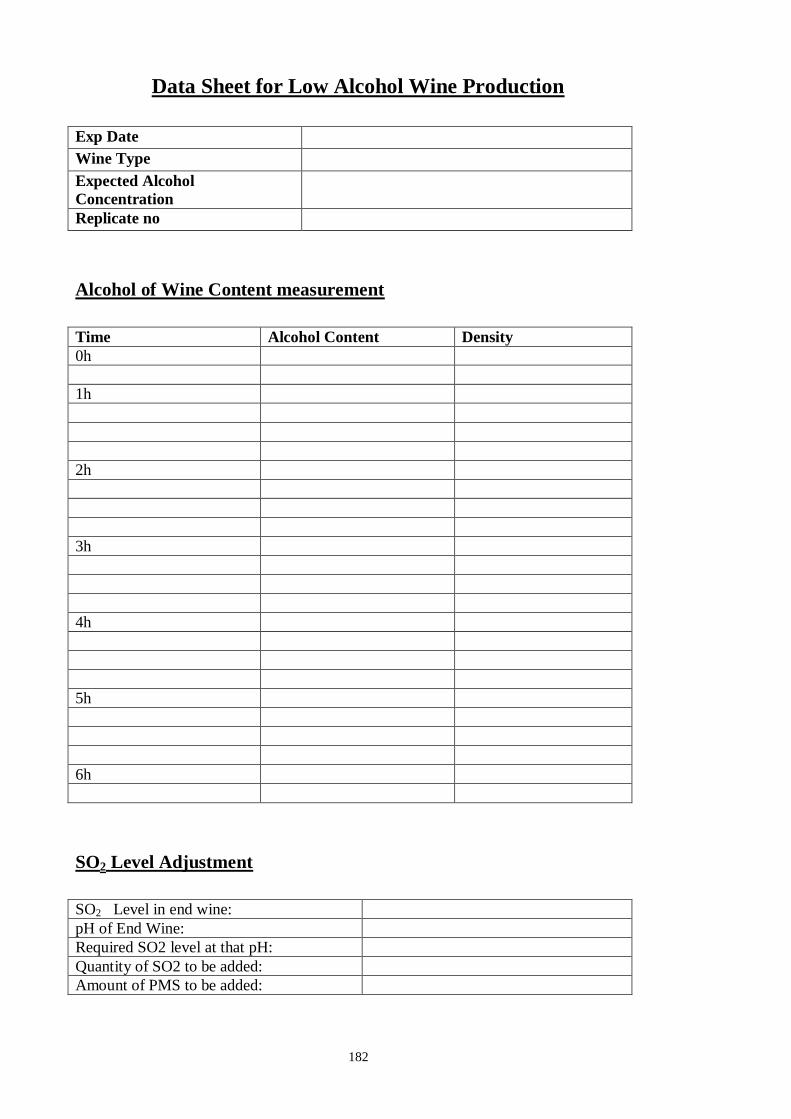
182
Data Sheet for Low Alcohol Wine Production
Exp Date Wine Type Expected Alcohol
Concentration
Replicate no
Alcohol of Wine Content measurement
Time Alcohol Content Density
0h
1h
2h
3h
4h
5h
6h
SO2 Level Adjustment
SO2 Level in end wine:
pH of End Wine:
Required SO2 level at that pH:
Quantity of SO2 to be added:
Amount of PMS to be added:
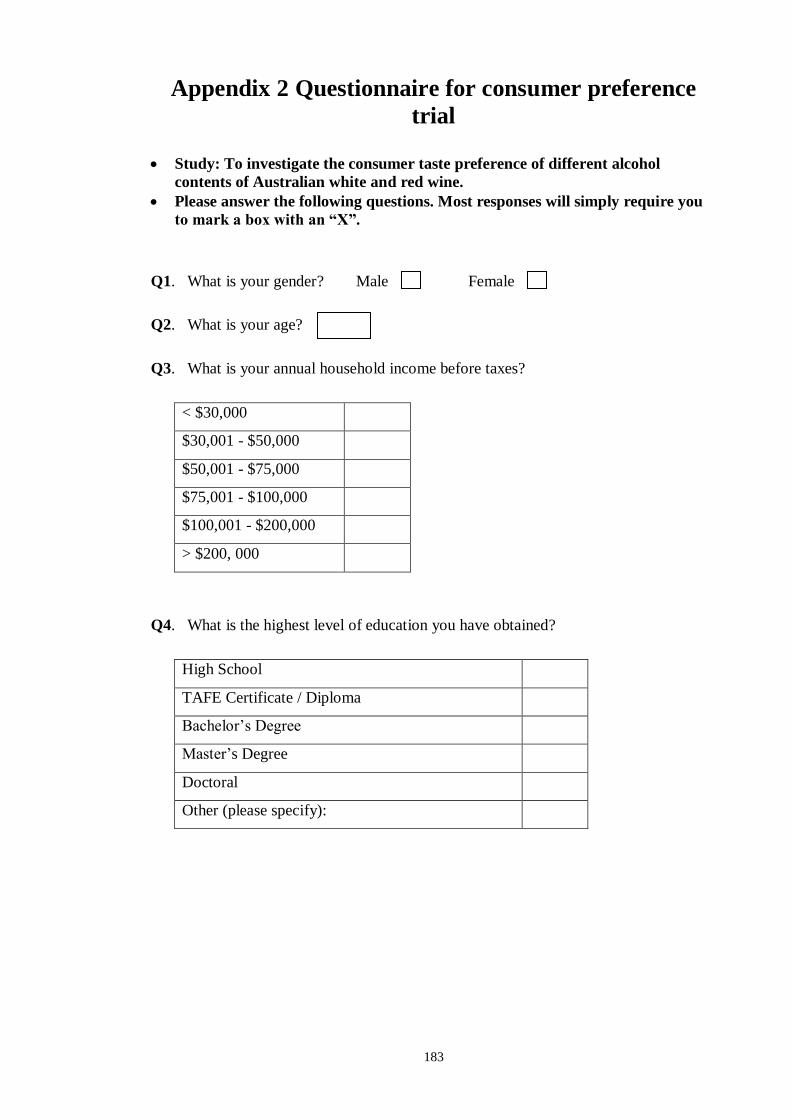
183
Appendix 2 Questionnaire for consumer preference
trial
Study: To investigate the consumer taste preference of different alcohol
contents of Australian white and red wine.
Please answer the following questions. Most responses will simply require you
to mark a box with an “X”.
Q1. What is your gender? Male Female
Q2. What is your age?
Q3. What is your annual household income before taxes?
< $30,000
$30,001 - $50,000
$50,001 - $75,000
$75,001 - $100,000
$100,001 - $200,000
> $200, 000
Q4. What is the highest level of education you have obtained?
High School
TAFE Certificate / Diploma
Bachelor’s Degree
Master’s Degree
Doctoral
Other (please specify):
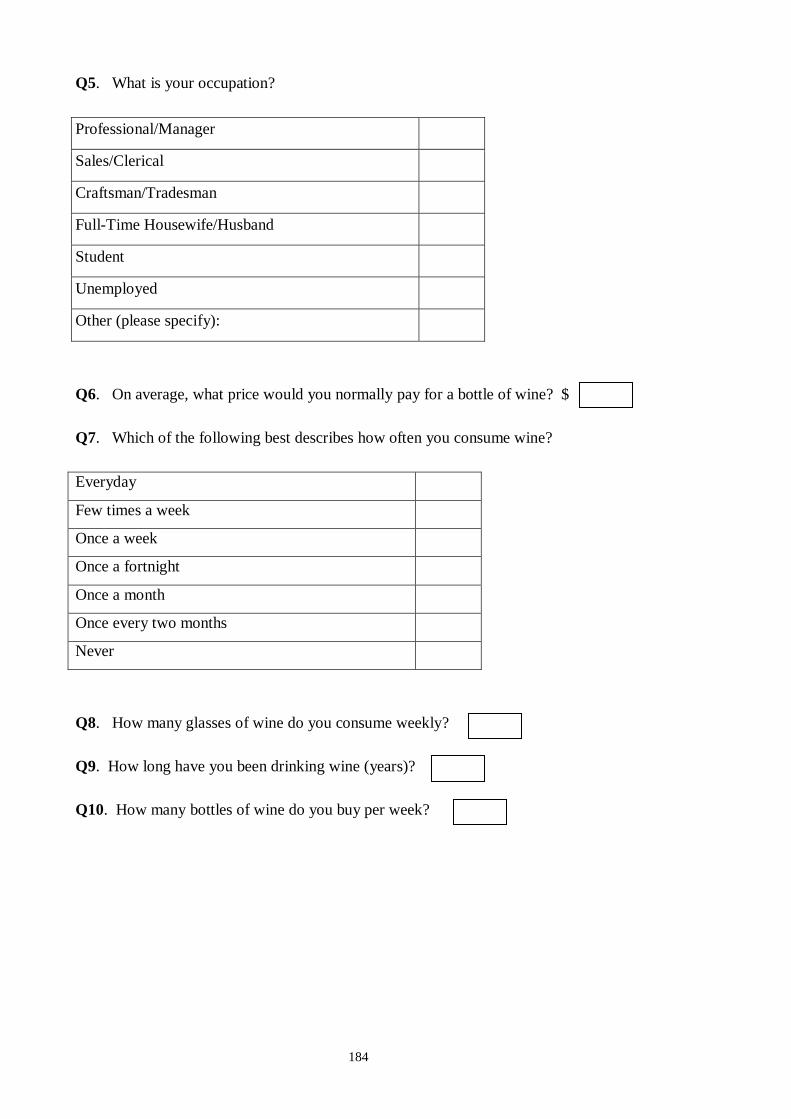
184
Q5. What is your occupation?
Professional/Manager
Sales/Clerical
Craftsman/Tradesman
Full-Time Housewife/Husband
Student
Unemployed
Other (please specify):
Q6. On average, what price would you normally pay for a bottle of wine? $
Q7. Which of the following best describes how often you consume wine?
Everyday
Few times a week
Once a week
Once a fortnight
Once a month
Once every two months
Never
Q8. How many glasses of wine do you consume weekly?
Q9. How long have you been drinking wine (years)?
Q10. How many bottles of wine do you buy per week?
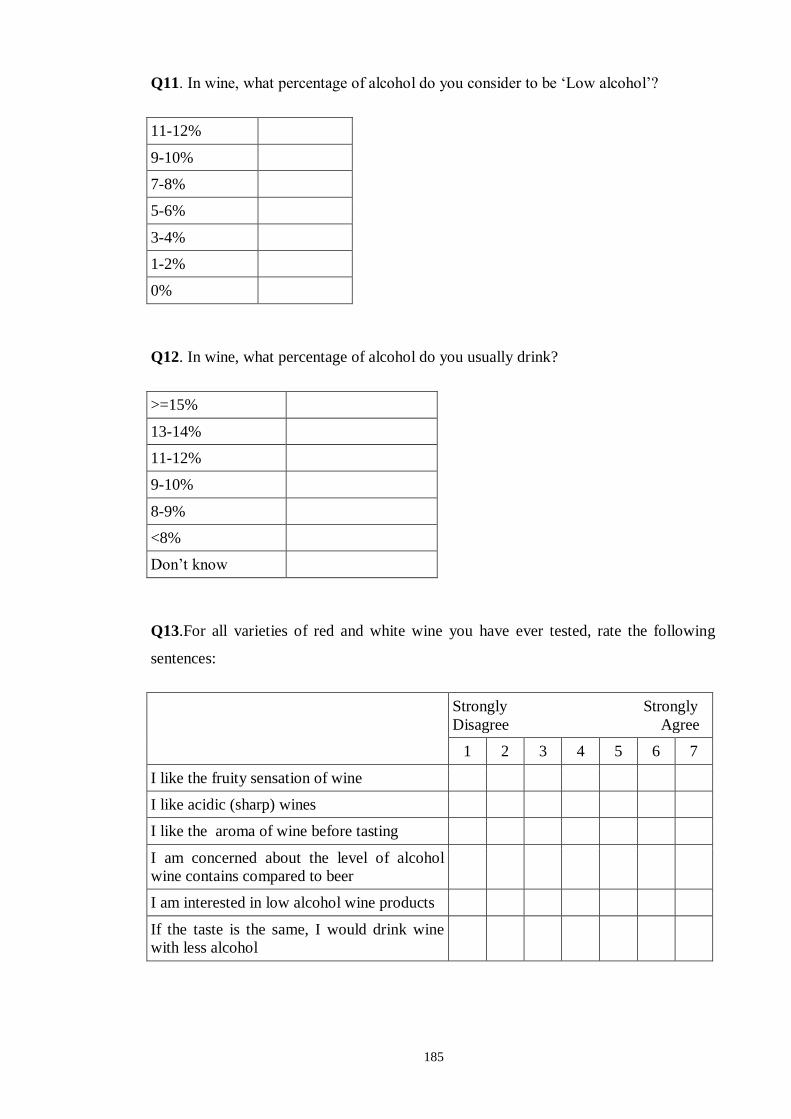
185
Q11. In wine, what percentage of alcohol do you consider to be ‘ ow alcohol’?
11-12%
9-10%
7-8%
5-6%
3-4%
1-2%
0%
Q12. In wine, what percentage of alcohol do you usually drink?
>=15%
13-14%
11-12%
9-10%
8-9%
<8%
Don’t know
Q13.For all varieties of red and white wine you have ever tested, rate the following
sentences:
Strongly Strongly
Disagree Agree
1 2 3 4 5 6 7
I like the fruity sensation of wine
I like acidic (sharp) wines
I like the aroma of wine before tasting
I am concerned about the level of alcohol
wine contains compared to beer
I am interested in low alcohol wine products
If the taste is the same, I would drink wine
with less alcohol
186
CSU Research Project – Consumer Taste Preference of different alcohol contents
of Australian White and Red Wines.
For White Wine-
Please rate each wine using the scales below (place an X on each line). Remember to
wait for approximately 30 seconds between tasting each wine.
Wine Extremely Extremely
no. Like Dislike
630
584
421
The next time you purchase wine, how much would you pay for each of the wines you
have just tasted, if they were available in stores?
$0 $20
630
584
421
187
For Red Wine-
Please rate each wine using the scales below (place an X on each line). Remember to
wait for approximately 30 seconds between tasting each wine.
Wine Extremely Extremely
no. Like Dislike
735
422
706
The next time you purchase wine, how much would you pay for each of the wines you
have just tasted, if they were available in stores?
$0 $20
735
422
706