Embed Size (px)
Citation preview

AQA 8300 Subject content with learning outcomes for Programme of Study Page 1 The Fernwood School
GCSE Mathematics AQA
8300
Programme of Study
Learning Outcomes
(Updated April 2017)
AQA 8300 Subject content with learning outcomes for Programme of Study Page 2 The Fernwood School
GCSE MATHEMATICS SUBJECT CONTENT FOR AQA 8300 AND
FULL LEARNING OUTCOMES FOR PROGRAMME OF LEARNING
Subject content from Specification (May 2014) Basic foundation Additional foundation Higher Only
TOPIC: 1.1 THE NUMBER SYSTEM
N1 order positive and negative integers, decimals and fractions N1 use the symbols =, ≠, <, >, ≤, ≥ Notes: including the use of a number line. See also A22 N2 apply the four operations, including formal written methods, to integers, decimals and simple fractions (proper and improper), and mixed numbers – all positive and negative N2 understand and use place value (eg when working with very large or very small numbers, and when calculating with decimals) Notes: including questions set in context. Knowledge and understanding of terms used in household finance, for example profit, loss, cost price, selling price, debit, credit, balance, income tax, VAT and interest rate. See also R9 N3 recognise and use relationships between operations, including inverse operation (eg cancellation to simplify calculations and expressions) N3 use conventional notation for priority of operations, including brackets, powers, roots and reciprocals
I can read and write numbers given in figures.
I can read and write numbers given in words.
I can recognise positive and negative numbers.
I can recognise odd and even numbers.
I know the place values for whole numbers.
I can recall the multiplication tables for numbers up to 12 X 12
I can add and subtract large numbers.
I can multiply and divide large numbers.
I know the place value for decimal numbers.
I can order decimal numbers.
I can add and subtract negative numbers using a number line.
I can use BODMAS for calculations.
I know how to apply inverse operations to reverse a calculation
I can use and know how to interpret a calculator correctly
I can add and subtract decimal numbers
I can multiply and divide decimals by 10, 100 and 1000.
I know the rules for negative numbers when adding, subtracting, dividing and multiplying.
I can add, subtract, multiply and divide negative numbers such as (-3) – (-4) or -3 x (-4)
I can multiply decimals such as 2.4 x 3.6

AQA 8300 Subject content with learning outcomes for Programme of Study Page 3 The Fernwood School
Subject content from Specification (May 2014) Basic foundation Additional foundation Higher Only
TOPIC: 1.2 ROUNDING, APPROXIMATING AND ESTIMATIONS
N14 estimate answers check calculations using approximation and estimation, including answers obtained using technology Notes: including evaluation of results obtained. See also N15 N15 Round numbers and measures to an appropriate degree of accuracy (eg to a specified number of decimal places or significant figures) use inequality notation to specify simple error intervals due to truncating or rounding Notes: including appropriate rounding for questions set in context. Students should know not to round values during intermediate steps of a calculation. See also N14 N16 apply and interpret limits of accuracy including upper and lower bounds
I can round numbers to the nearest integer – knowing that this means to the nearest unit or nearest whole number.
I can round numbers to the nearest 10, 100 or 1000.
I can find estimates for square roots by using a list of square numbers.
I can round numbers to 1 decimal place.
I can round numbers to any number of decimal places.
I can round numbers to 1 significant figure.
I know that when finding an estimate this means that the exact answer is not needed.
I can estimate answers to calculations such as (22.6 x 18.7) ÷ 5.2 by rounding each part to 1 significant figure.
I know what happens to numbers when they are divided by decimal numbers less than 1.
I know what happens to numbers when they are multiplied by decimal numbers less than 1.
I can estimate answers to calculations such as (22.6 x 18.7) ÷ 0.52.
I can make decisions on which numbers to round to any number of significant figures for complex problems.
I can find minimum and maximum values for numbers which have been rounded.
I can represent these minimum and maximum values as an error interval using inequality notation.
I can find the upper and lower bounds of simple calculations involving quantities to a particular degree of accuracy.
I can find the upper and lower bounds of more difficult calculations involving decisions of when to use the maximum or minimum values as part of the calculations.

AQA 8300 Subject content with learning outcomes for Programme of Study Page 4 The Fernwood School
Subject content from Specification (May 2014) Basic foundation Additional foundation Higher Only
TOPIC: 1.3 NUMBER PROPERTIES
N4 use the concepts and vocabulary of prime numbers, factors (divisors), multiples, common factors, common multiples, highest common factor, lowest common multiple, prime factorisation including using product notation and the unique factorisation theorem Notes: prime factor decomposition including product of prime factors written in index form. N5 apply systematic listing strategies Including use of the product rule for counting Notes: including using lists, tables and diagrams. N6 use positive integer powers and associated real roots (square, cube and higher), recognise powers of 2, 3, 4, 5 estimate powers and roots of any given positive number Notes: including square numbers up to 15 x 15. Students should now that 1000 = 103 and 1 million = 106
N7 calculate with roots, and with integer indices
I can find the factors of a number.
I can calculate squares and square roots of numbers both with and without the use of a calculator.
I can write down the multiples of numbers.
I can write down common factors and multiples for two or more numbers.
I can calculate cubes and cube roots of numbers both with and without the use of a calculator.
I can use index notation for squares and cubes.
I can use the power, square root and cube root keys on my calculator.
I can recall the squares from 2 x 2 up to 15 x 15.
I can recall the cubes of 2, 3, 4, 5 and 10.
I understand that numbers can have a positive and negative square root.
I can estimate powers and roots of any given positive number
I can complete calculations that involve roots and powers without using a calculator.
I can recognise and recall prime numbers.
I can find the reciprocal of any number.
I can write any number as a product of its prime factors.
I can use the prime products to work out the highest common factor and lowest common multiple of two or more numbers.

AQA 8300 Subject content with learning outcomes for Programme of Study Page 5 The Fernwood School
Subject content from Specification (May 2014) Basic foundation Additional foundation Higher Only
TOPIC: 1.4 FRACTIONS AND FRACTION ARITHMETIC
N2 apply the four operations, including formal written methods, to integers, decimals and simple fractions (proper and improper), and mixed numbers – all positive and negative N8 Calculate exactly with fractions Notes: see also G17 and G18 R3 Express one quantity as a fraction of another, where the fraction is less than 1 or greater than 1 N10 Work interchangeably with terminating decimals and their corresponding fractions
(such as 3.5 and 7
2 or 0.375 and
3
8 )
Change recurring decimals into their corresponding fractions and vice versa Notes: including ordering
I can recognise and find half, quarter or three-quarters of an amount given as a diagram or quantity.
I can name the parts of a fraction using the terms numerator and denominator.
I can arrange fractions with different denominators in order of size when 1 is the numerator.
I can simplify simple fractions such as 24/36
I can convert between mixed numbers and improper fractions.
I can convert fractions into equivalent ones.
I can order fractions with other numerators and different denominators.
I can convert fractions into decimals.
I can covert fractions into percentages.
I can order a set of numbers containing a mixture of fractions, decimals and percentages.
I can find one number as a fraction of another numbers.
I can work out fractions of quantities.
I can add and subtract fractions.
I can convert decimals into fractions.
I can do calculations with simple fractions involving division and multiplication
I know that ‘of’ means to multiply eg 2
5 𝑜𝑓 30 𝑚𝑒𝑎𝑛𝑠
2
5 𝑥 30
I can do calculations with mixed numbers.
I can identify recurring and terminating decimals.
I can convert recurring decimals to fractions and fractions to recurring decimals

AQA 8300 Subject content with learning outcomes for Programme of Study Page 6 The Fernwood School
Subject content from Specification (May 2014) Basic foundation Additional foundation Higher Only
TOPIC: 1.5 PERCENTAGES AND WORKING WITH PERCENTAGES
N12 Interpret fractions and percentages as operators Notes: including interpreting percentage problems using a multiplier. See also R9. R9 Define percentage as ‘number of parts per hundred’ Interpret percentages and percentage changes as a fraction or a decimal, and interpret these multiplicatively Express one quantity as a percentage of another Compare two quantities using percentages Work with percentages greater that 100% Solve problems involving percentage change including percentage increase/decrease problems, and simple interest including in financial mathematics Notes: see also N2 and N12
I can recognise the percentage notation - %
I know that percentage means ‘out of 100’.
I can write down the shaded region of a shape as a percentage.
I can change a percentage into a fraction or decimal and vice versa.
I can express one quantity as a percentage of another number.
I can find 10%, 1%, 50% and 20% of a quantity without using a calculator.
I can recognise the multiplier when trying to find a percentage of an amount.
I can find any percentage of a quantity using a calculator.
I can increase or decrease a quantity by a given percentage.
I can recognise the multiplier when increasing or decreasing a quantity by a percentage.
I can calculate simple interest using the same percentage each time on the original amount.
I can calculate compound interest when using percentage increase repeatedly on successive amounts.
I can work out a percentage change. For example ‘percentage loss or percentage profit’
I can represent percentage change as a decimal or fraction e.g.
12% 𝑖𝑛𝑐𝑟𝑒𝑎𝑠𝑒 ≡ 𝑚𝑢𝑙𝑡𝑖𝑝𝑙𝑦𝑖𝑛𝑔 𝑏𝑦 1.12 ≡ 𝑚𝑢𝑙𝑡𝑖𝑝𝑙𝑦𝑖𝑛𝑔 𝑏𝑦 112
100
I can work out reverse percentage problems.

AQA 8300 Subject content with learning outcomes for Programme of Study Page 7 The Fernwood School
Subject content from Specification (May 2014) Basic foundation Additional foundation Higher Only
TOPIC: 2.1 Algebra Notation and Rules for Indices
A1 Use and interpret algebraic notation, including:
ab in place of a x b
3y in place of y + y + y and 3 x y
a2 in place of a x a, a3 in place of a x a x a, a2b in place of a x a x b
𝑎
𝑏 in place of a ÷ b
Coefficients written as fractions rather than as decimals
Brackets
Notes: it is expected that answers will be given in their simplest form without an explicit instruction to do so. A3 Understand and use the concepts and vocabulary of expressions, equations, formulae, inequalities, terms and factors. to include identities Notes: this will be implicitly and explicitly assessed.
I can use symbols to represent numbers in expressions
I can tell the difference between expressions, identities, formulas, equations and inequalities.
I can recognise and use the symbols =, ≠, <, >, ≤, ≥,
I know what the abbreviations mean when interpreting or using algebraic expressions.
I know that when I am simplifying or writing expressions in a
different form that I should use the identity, , symbol.
I can use very simple formulas given in words and symbols.
I can use simple flow charts representing formulas
I can use the rules for indices when expressions are being multiplied.
I can use the rules for indices when expressions are being divided.
I can use the rules for indices when expressions contain more than one letter.

AQA 8300 Subject content with learning outcomes for Programme of Study Page 8 The Fernwood School
Subject content from Specification (May 2014) Basic foundation Additional foundation Higher Only
TOPIC: 2.2 Manipulating Expressions
A4 Simplify and manipulate algebraic expressions by:
collecting like terms
multiplying a single term over a bracket
taking out common factors
simplifying expressions involving sums, products and powers, including the laws of indices
A4 Simplify and manipulate algebraic expressions (including those involving surds) by: expanding products of two binomials
I can simplify expressions that contain the same letter.
I can simplify expressions that contain more than one letter.
I can simplify expressions that contain letters given in index form.
I can multiply out expressions like 3(x + 2)
I can factorise expressions like 6a + 8
I can factorise expressions like x2 – 3x
I can expand and simplify expressions like x(x2 -5) and 3(x + 2) – 5(2x -1)
I can expand and simplify expressions like (x + 4)(x – 2), (2x + y)(3x – 2y) and (x + 2)2
I can expand and simplify expressions like
(√𝑥 + 4)(√𝑥 − 3)
Subject content from Specification (May 2014) Basic foundation Additional foundation Higher Only
TOPIC: 2.3 FORMULAE AND SUBSTITUTION
A2 Substitute numerical values into formulae and expressions, including scientific formulae Notes: unfamiliar formulae will be given in the question. See the appendix for a full list of the prescribed formulae. See also A5. A5 Understand and use standard mathematical formulae Notes: including use of formulae from other subjects in words and using symbols
I know that a formula can contain more than one letter and that these can represent variables.
I know what the dependent and independent variables are in a formula.
I can use a simple formula written in words such as Cost = 20 x distance
I can put numbers into a formula and know that this is what substitution means.
I can use simple formula written using symbols such as T = 10d Or C = a + b to find values by substitution remembering to apply the correct order of operations.
I can use formulae such as P = 2L + 2W and find values by substitution of positive numbers only.
I can find values for formulae by substituting positive and negative numbers
I can read a problem and work out the expression for it. For example ‘5 more than x’ will have the expression 5 + x
I can substitute numbers into more complex formulae such as
𝐶 = (𝐴 + 1)𝐷
9
I can substitute numbers into formulae that contain powers and roots such as;
𝑣 = 𝑢 + 𝑎𝑡 𝑠 = 𝑢𝑡 +1
2𝑎𝑡2 𝑣2 = 𝑢2 + 2𝑎𝑠

AQA 8300 Subject content with learning outcomes for Programme of Study Page 9 The Fernwood School
Subject content from Specification (May 2014) Basic foundation Additional foundation Higher Only
TOPIC: 2.4 LINEAR EQUATIONS AND INEQUALTIES
A17 Solve linear equations in one unknown algebraically Find appropriate solutions using a graph Including those with the unknown on both sides of the equation Notes: including the use of brackets A21 Translate simple situations or procedures into algebraic expressions or formulae Derive an equations (or two simultaneous equations), solve the equation(s) and interpret the solution Notes: including the solution of geometrical problems and problems set in context. A22 Solve linear inequalities in one variable Represent the solution set on a number line. Notes: students should know the conventions of an open circle on a number line for a strict inequality and a closed circle for an included boundary.
I can complete a question when I see the word ‘solve’ or the words ‘find the solution’.
I can solve simple linear expressions that contain only one operation, such as 3x = 12 or x + 5 = 9.
I can solve simple linear expressions that contain division, such
as 𝑥
2= 7.
I can solve equations that involve more than one operation such as 3x -1 = 9.
I am able to find solutions that are positive or negative.
I am able to find solutions that are fractions or decimals.
I can solve equations that contain brackets such as 2(5x +1) = 28.
I can solve equations where the unknown occurs on both sides of the equal sign such as 3x - 4 = 5 + x
I can solve equations that contain brackets and the unknown occurring on both sides of the equal sign such as 3x - 12 = 2(x - 5).
I can solve harder equations that contain more than one
operation such as 7−𝑥
3= 3
I can form an equation for a situation.
I can solve an equation that I have formed.
I can solve equations that require fraction arithmetic such as 2𝑥
3−
𝑥
4= 5.
I can recognise and use the symbols for inequalities
<, >, ,
I know that solving inequalities means that the solution is a set of numbers
I can represent the solution set of an inequality on a number line including using open and closed circles.
I can solve simple inequalities such as 3x < 9
I can solve inequalities such as 12 3n 20
I can solve inequalities such as 4x – 3 < 10 and 4x < 2x + 7
I can solve inequalities such as x + 3 > 5x – 3
I know how to represent the solution set of an inequality using set notation e.g. -3 ≤ x ≤ 2 is given by 𝑥 ∈ {−3,−2,−1, 0, 0, 1, 2}

AQA 8300 Subject content with learning outcomes for Programme of Study Page 10 The Fernwood School
Subject content from Specification (May 2014) Basic foundation Additional foundation Higher Only
TOPIC: 3.1 Collecting Data
S1 Infer properties of populations or distributions from a sample, whilst knowing the limitations of sampling Notes: students should know and understand the terms: primary data, secondary data, discrete data and continuous data.
I can collect information and record it using a tally chart
I can collect information and record it into a frequency table
I can tell whether a data set is a discrete set of information
I can tell whether a data set is from a continuous set of numbers
I know and understand the difference between quantitative and qualitative data
I know and understand the difference between primary and secondary
I can design and use a two-way table
I can use a variety of sampling methods
I know and understand the limitations of sampling methods
I can tell whether bias is affecting a data collection exercise
NB. This is an exceptionally small part of the New GCSE, time allocated to teaching this should be minimal.
Subject content from Draft Specification (May 2014) Basic foundation Additional foundation Higher Only
TOPIC: 3.2 Statistical Measures
S4 Interpret, analyse and compare the distributions of data sets from univariate empirical distributions through:
appropriate measures of central tendency (median, men, mode and modal class) and spread (range, including consideration of outliers)
Notes: students should know and understand the terms: primary data, secondary data, discrete data and continuous data. S5 Apply statistics to describe a population
I can find the mode and median for a small set of numbers.
I can work out the range for a set of numbers
I can work out the mode and range from a graph
I can calculate the mean for a small set of numbers.
I can complete a frequency table for grouped data
I can work out the ‘fx’ column for a frequency table and use this to calculate the mean.
I can make a comment about two sets of data by comparing an average and the range.
I can work out the effect of very large or very small values on each type of averages and the range of a data set.
I can work out the modal class from a grouped frequency table.
I can calculate a mean estimate for data given in a grouped frequency table
NB. The vast majority of students should not need to be retaught this, the main focus should be frequency tables and problem solving with averages and range.

AQA 8300 Subject content with learning outcomes for Programme of Study Page 11 The Fernwood School
Subject content from Specification (May 2014) Basic foundation Additional foundation Higher Only
TOPIC: 3.3 Presenting Data 1
S2 Interpret and construct tables, charts and diagrams, including frequency tables bar charts pie charts and pictograms for categorical data, vertical line charts for ungrouped discrete numerical data and know their appropriate use Including tables and line graphs for time series data Notes including choosing suitable statistical diagrams S4 Interpret, analyse and compare the distributions of data sets from univariate empirical distributions through:
appropriate graphical representation involving discrete, continuous and grouped data
Notes: students should know and understand the terms: primary data, secondary data, discrete data and continuous data.
I can construct and interpret a pictogram
I can construct and interpret a bar chart
I can obtain information from a vertical line graph
I can construct and interpret a dual bar chart
I can construct a frequency diagram for data given in a grouped frequency table.
I understand which diagrams are suitable for certain types of data.
I know and understand how to complete a table of results for a time series
I know how to work out the moving average for time series data.
I know how to produce a graph for time series data.
I can comment on different data sets by comparing their graphs or charts.
NB. The vast majority of students should not need to be retaught this, the main focus should be on moving averages.
AQA 8300 Subject content with learning outcomes for Programme of Study Page 12 The Fernwood School
Subject content from Specification (May 2014) Basic foundation Additional foundation Higher Only
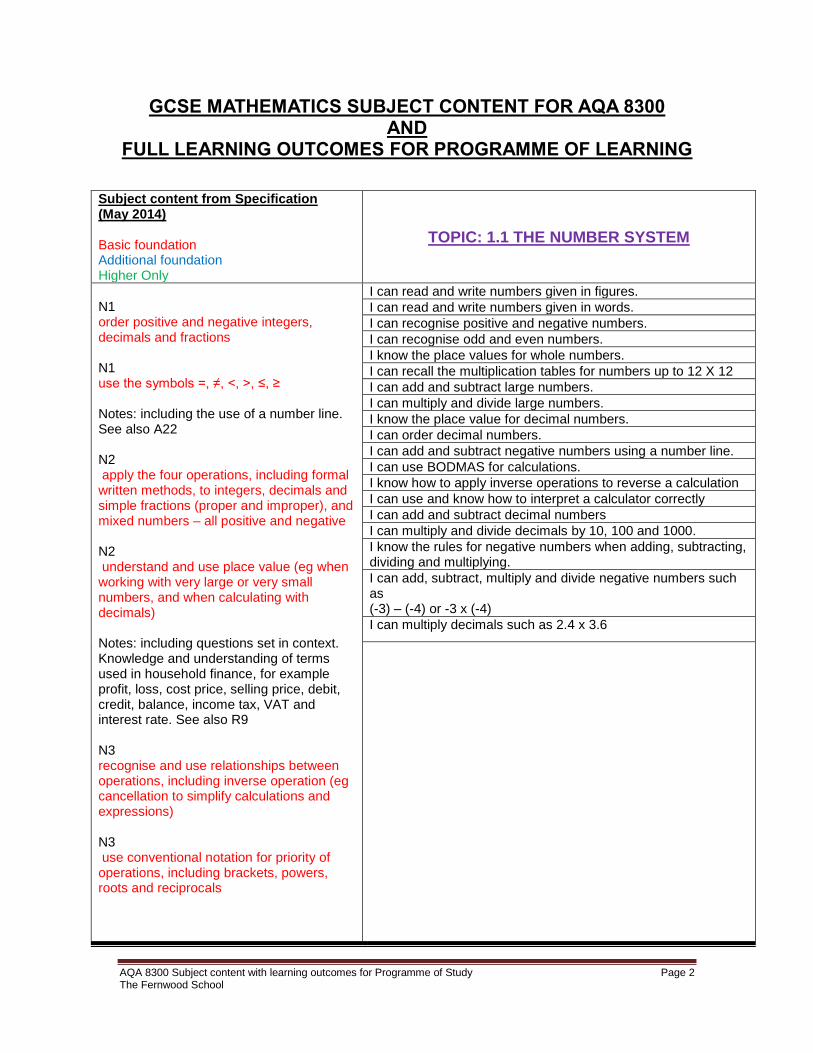
TOPIC: 3.4 Probability and Outcomes
P1 Record, describe and analyse the frequency of outcomes probability experiments using tables and frequency trees Notes: probabilities should be written as fractions, decimals or percentages. P2 Apply ideas of randomness, fairness and equally likely events to calculate expected outcomes of multiple future experiments P3 Relate relative expected frequencies to theoretical probability, using appropriate language and the 0 to 1 probability scale P4 Apply the property that the probabilities of an exhaustive set of outcomes sum to 1 Apply the property that the probabilities of an exhaustive set of mutually exclusive events sum to 1 P5 Understand that empirical unbiased samples tend towards theoretical probability distributions, with increasing sample size P7 Construct theoretical possibility spaces for single and combined experiments with equally likely outcomes and use these to calculate theoretical probabilities
I can work out the different outcomes that can take place during an event.
I can work out the frequency of different outcomes in the form of a frequency tree.
I can describe a probability using words.
I can work out probabilities as fractions, decimals or percentages.
I can use a probability scale.
I can tell the difference between experimental and theoretical probability.
I can work out the probability of something happening.
I can work out the probability of something not happening.
I can use the fact ‘the total of the probabilities of all the outcomes of an event is 1’.
I can work out tables of outcomes, including two-way tables, for one or combined events.
I can calculate probabilities of outcomes from any type of presentation including tables and frequency diagrams.
I can estimate probabilities using a frequency table.
I know what ‘relative frequency’ means.
I can work out relative frequency for outcomes given in a frequency table.
I know that if an experiment is repeated many times or the size of the sample is very large then the relative frequency will be very close to the theoretical frequency.
I can use relative frequency to work out the expected number of times an outcome could occur.

AQA 8300 Subject content with learning outcomes for Programme of Study Page 13 The Fernwood School
Subject content from Specification (May 2014) Basic foundation Additional foundation Higher Only
TOPIC: 4.1 MEASURES
N13 Use standard units of mass, length, time money and other measures (including standard compound measures) using decimal quantities where appropriate Notes: know and use metric conversion factors for length, area, volume and capacity. Imperial/metric conversion will be given in the question. NB Students will be given the conversions in the question (The RASCAL method should be a particular focus). N16 apply and interpret limits of accuracy including upper and lower bounds R1 Change freely between related standard units (eg time, length, area, volume/capacity, mass) and compound units (eg speed, rates of pay, prices) in numerical contexts Compound units (eg density, pressure) In numerical and algebraic contexts R2 Use scale factors, scale diagrams and maps Notes; including geometrical problems R11 Use compound units such as a speed, rates of pay, unit pricing Use compound units such as density and pressure Notes: including making comparisons G14 Use standard units of measure and related concepts (length, area, volume/capacity, mass, time, money etc.)
I can tell the time and solve problems involving time.
I can work with money and solve problems involving money.
I can interpret a calculator display when solving problems involving time.
I can interpret a calculator display with solving problems involving money.
I can measure and draw lines using a ruler
I can use maps and can interpret grid references
I can recognize whether units are metric or imperial.
I can convert between metric units.
I know the rough equivalents between metric and imperial units.
I can convert between imperial and metric units.
I can decide which metric unit to use for everyday measurements.
I can make sensible estimates of a range of measures in everyday settings.
I can solve a range of problems involving measures
I can read and use map scales to find or estimate distances.
I can solve simple speed problems.
I can change between area measures, such as m2 to cm2.
I can change between area measures, such as m3 to cm3 or cm3 to litres.
I can recognise the accuracy in measurements given to the nearest whole unit.
I can work out the upper and lower bounds for combinations of lengths.
I can solve more difficult speed problems
I can understand and use compound measures such as speed, density and pressure.
I can work out the upper and lower bounds for speed, density, pressure and any other given formula.
I can distinguish between formulae for perimeter, area and volume by considering dimensions.

AQA 8300 Subject content with learning outcomes for Programme of Study Page 14 The Fernwood School
Subject content from Specification (May 2014) Basic foundation Additional foundation Higher Only
TOPIC: 4.2 2D Shapes and their Properties
G1 Use conventional terms and notations: points, lines, vertices, edges, planes, parallel lines, perpendicular lines, right angles, polygons regular polygons and polygons with reflection and /or rotation symmetries Use the standard conventions for labelling and referring to the sides and angles of triangles Draw diagrams for written description G4 Derive and apply the properties and definitions of: special types of quadrilaterals, including square, rectangle, parallelogram, trapezium, kite and rhombus And triangles and other plane figures using appropriate language Notes: including knowing names and properties of isosceles, equilateral, scalene, right-angled, acute-angled, obtuse-angled triangles. Including knowing names and using the polygons: pentagon, hexagon, octagon and decagon
I can name and label the parts of a shape using the words: vertex, edge, face, plane, perpendicular and parallel.
I can draw the lines of symmetry on 2D shapes
I can recognize and use the word ‘congruent’
I can recognize and name shapes such as parallelogram, rhombus, trapezium and hexagon.
I can name the different types of triangles and recognise their angle and side properties.
I can work out the order of rotation for shapes.
I know what a quadrilateral is.
I can name the different types of quadrilaterals by using their properties.
I can classify quadrilaterals into groups using their geometrical properties.
I can recognise and name other 2D shape such as pentagon, hexagon, octagon and decagon.
I can find the volume of prisms and cylinders.
Subject content from Specification (May 2014) Basic foundation Additional foundation Higher Only
TOPIC: 4.3 Perimeter, Area and Volume
G16 Know and apply formulae to calculate: area of triangles, parallelograms, trapezia; Volume of cuboids and other right prisms (including cylinders)
I can find the area of shapes by counting the number of squares.
I can estimate the area of irregular shapes by counting squares and part-squares.
I can find the volume of solids by counting the number of cubes.
I can find the perimeter of rectangles.
I can find the area of rectangles.
I can find the area of triangles.
I can find the volume of cuboids by using the formula
I can find the area of parallelograms, kites and trapezium.
I can find the perimeter and area of shapes made up of 2D shapes.
I can find surface area of prisms and cylinders.

AQA 8300 Subject content with learning outcomes for Programme of Study Page 15 The Fernwood School
Subject content from Specification (May 2014) Basic foundation Additional foundation Higher Only
TOPIC: 4.4 THE CIRCLE
N8
Calculate exactly with multiples of Notes: see also G17 and G18 G9 Identify and apply circle definitions and properties including: centre, radius, chord, diameter, circumference Including: tangent, arc, sector and segment G17 Know the formulae: circumference of a
circle = 2r = d
Area of a circle = r2 Calculate perimeters of 2D shapes, including circles Areas of circles and composite shapes
Notes: Solutions in terms of may be asked for. See also N8, G18 G18 Calculate arc lengths, angles and areas of sectors of circles Notes: see also N8, G17
I can draw a circle using a pair of compasses when I know the radius or diameter.
I can identify and name parts of a circle using the words: centre, radius, diameter, circumference, chord, tangent.
I know that represents the ratio between the circumference and diameter of any circle.
I can write down and use the formula to find the circumference of any circle.
I can write down and use the formula to find the area of any circle.
I can work out the perimeter of a semi-circle.
I can work out the area of a semi-circle.
I can work out the perimeter of a shape made up of circles or part circles with other known shapes.
I can work out the area of a shape made up of circles or part circles with other known shapes.
I can identify on any circle the arc, sector and segment.
I can find the length of an arc of a circle.
I can find the area of a sector of a circle.
I can find the area of a segment of a circle.
I know what to do when an answer needs to be given in terms of
.
I know how to manipulate expressions such as 9 + 3
4𝜋
NB arcs and sectors will be revisited in year 11 (Unit 12.2) Sets 1 &2 should do it in year 9 Set 3,4 & 5 can do it in year 11.

AQA 8300 Subject content with learning outcomes for Programme of Study Page 16 The Fernwood School
Subject content from Specification (May 2014) Basic foundation Additional foundation Higher Only
TOPIC: 5.1 ANGLES AND ANGLE PROPERTIES OF LINES AND SHAPES
G3 Apply the properties of angles at a point, angles at a point on a straight line, vertically opposite angles Understand and use alternate and corresponding angles on parallel lines Derive and use the sum of angles in a triangle (eg to deduce and use the angle sum in any polygon, and to derive properties of regular polygons) Notes: colloquial terms such as Z angles are not acceptable and should not be used. G6 Apply angle facts, triangle congruence, similarity and properties of quadrilaterals to conjecture and derive results about angles and sides, including Pythagoras’ theorem and the fact that the base angles of an isosceles triangle are equal, and use known results to obtain simple proofs G15 Measure line segments and angles in geometric figures, including interpreting maps and scale drawings
I can recognise and name acute, obtuse, reflex and right angles.
I know that angles that form a straight line add up to 1800.
I know that angles that form a full turn add up to 3600.
I can recognise and name isosceles, equilateral, scalene and right-angled triangles.
I can recognise when a shape is a regular polygon.
I can recognise and use the terms perpendicular and parallel.
I can draw and measure angles using an angle measurer.
I can show that the angles of a triangle add up to 1800 and use this to find angles.
I can recall the angle properties of isosceles, equilateral and right-angled triangles and use these to find angles.
I can show that the angles of a quadrilateral add up to 3600.
I can distinguish between the interior and exterior angles of any polygon.
I can show that the exterior angle of a triangle is equal to the sum of the interior opposite angles.
I can calculate the interior and exterior angles of a regular polygon.
I can recognise corresponding and alternate angles in diagrams that contain parallel lines.
I know that when straight lines cross the angles formed are equal and are called vertically opposite.
I know that the exterior angles of any polygon add up to 3600.
I know how to work out the sum of the interior angles of any polygon.
AQA 8300 Subject content with learning outcomes for Programme of Study Page 17 The Fernwood School
Subject content from Specification (May 2014) Basic foundation Additional foundation Higher Only
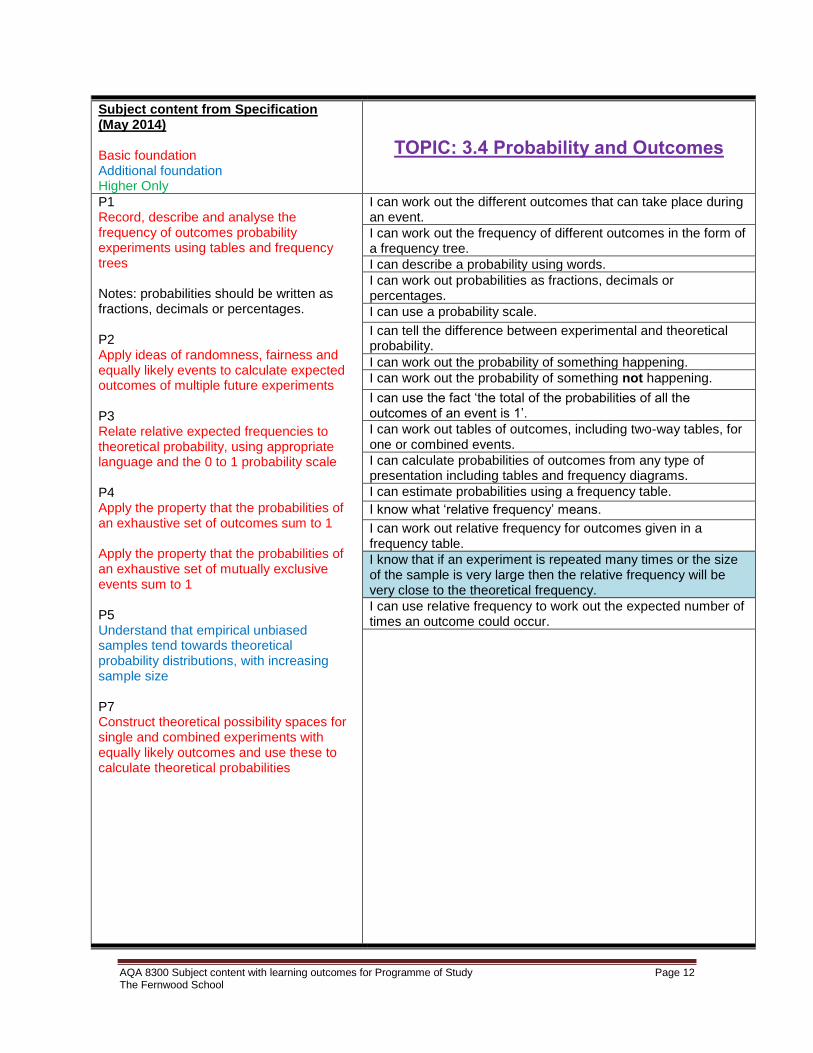
TOPIC: 5.2 RATIOS
N11 Identify and work with fractions in ratio problems Notes: See also R8 R4 Use ratio notation, including reduction to simplest form R5 Divide a given quantity into two parts in a given part : part or part : whole ratio Express the division of a quantity into two parts as a ratio Apply ratio to real contexts and problems (such as those involving conversion, comparison, scaling, mixing, concentrations) Notes: including better value or best-buy problems R6 Express a multiplicative relationship between two quantities as a ratio or a fraction R7 Understand and use proportion as equality of ratios R8 Relate ratios to fractions and to linear functions Notes: see also N11, R14
I can write quantities using the ratio notation. For example 3 boys and 4 girls are in the ratio 3:4
I can re-write ratios in their simplest form.
I can make the link between ratios and fractions.
I can divide a quantity in a given ratio.
I can work out missing values of a ratio when only part of the information is known.
I can recognise what it means by the unitary method. For example 1 : n or n : 1.
I can use the unitary method to solve problems that involve ‘best value’
I can interpret a statement such as ‘A is three times as big as B’ and write it as a ratio A:B is 3:1

AQA 8300 Subject content with learning outcomes for Programme of Study Page 18 The Fernwood School
Subject content from Specification (May 2014) Basic foundation Additional foundation Higher Only
TOPIC: 5.3 Sequences
A23 Generate terms of a sequence from either a term-to-term or a position-to-term rule. Notes: including from patterns and diagrams A24 Recognise and use sequences of triangular, square and cube numbers and simple arithmetic progressions Including Fibonacci-type sequences, quadratic sequences, and simple geometric progressions (rn where n is an integer and r is a rational number >0) Including other sequences including where r is a surd Notes: other recursive sequences will be defined in the question A25 Deduce expressions to calculate the nth term of linear sequences Including quadratic sequences
I can recognize a pattern when given a sequence of diagrams.
I can recognize a pattern when given a sequence of numbers.
I can continue a sequence of diagrams or numbers.
I can write the terms of a simple sequence when given the starting point and rule.
I can find a particular term in a sequence involving positive numbers when I am given the rule.
I can recognise sequences that contain triangular, square and cube numbers and work out any missing numbers.
I can write the term-to-term rule in a sequence involving positive numbers.
I can find a particular term in a sequence involving negative or fractional numbers when I am given the rule.
I can write the term-to-term rule in a sequence involving negative or fractional numbers.
I understand the position-to-term rule of a linear sequence and know that this is the nth term.
I can work out any term of a linear sequence or a series of diagrams by using the nth term.
I can work out the nth term of a linear sequence or a series of diagrams.
I know what the Fibonacci sequence is and how to work out missing numbers.
I can recognise when a sequence involves powers and how to work out missing numbers.
I understand the position-to-term rule of a quadratic sequence and know that this is the nth term.
I can work out any term of a quadratic sequence or a series of diagrams by using the nth term.
I can work out the nth term of a quadratic sequence or a series of diagrams.
I can recognise any sequence, including ones that contain the square root symbol.

AQA 8300 Subject content with learning outcomes for Programme of Study Page 19 The Fernwood School
Subject content from Specification (May 2014) Basic foundation Additional foundation Higher Only
TOPIC 5.4 REASONS AND PROOF
A6 Know the difference between an equation and an identity Argue mathematically to show algebraic expressions are equivalent, and use algebra to support and construct arguments
To include proofs
I can tell by reading a simple statement whether it is true or false such as ‘All prime numbers are odd’.
I can describe with a reason why a simple statement is true or false.
I know what to do when I see the words ‘show that’ or ‘prove’
and what to do when I see the identity, , symbol between expressions.
I can decide whether a harder statement is true or false such as ‘2x + 1 will always give an even answer’.
I can give a reason why harder statements like ‘2x + 1 will always give an even answer’ is true or false.
I can find a counter example if a statement is false or not always true.
I can give a demonstration to show why a statement is true or false.
I can give a proof to justify a statement.
I can give step-by-step deductions when I am writing a basic algebraic explanation.
I can show step-by-step deductions that contains more detail and a full mathematical explanation.
I can derive simple algebraic proofs using reasoning.
I can derive harder algebraic proofs using reasoning and logic.

AQA 8300 Subject content with learning outcomes for Programme of Study Page 20 The Fernwood School
Subject content from Specification (May 2014) Basic foundation Additional foundation Higher Only
TOPIC: 6.1 CO-ORDINATES AND GRAPHS
A7 Where appropriate, interpret simple expressions as functions with inputs and outputs A8 Work with coordinates in all four quadrants A9 Plot graphs of equations that correspond to straight-line graphs in the coordinate plane Use the form y = mx + c to identify parallel lines Find the equation of the line through two given points, or through one point with a given gradient Use the form y = mx + c to identify perpendicular lines A10 Identify and interpret gradients and intercepts of linear functions graphically and algebraically A12 Recognise, sketch and interpret graphs of linear functions Notes: see also G21 A17 Solve linear equations in one unknown algebraically Find appropriate solutions using a graph R14 Interpret the gradient of a straight-line graphs as a rate of change G11 Solve geometrical problems on coordinate axes
I can write down the coordinate of a point plotted with positive numbers.
I can plot points where the coordinates are both positive.
I can plot and interpret coordinates where numbers are positive and negative.
I can recognise and draw the graphs for equations such as y = 3 and x = 5
I can work out the coordinates for graphs where the equations are like y = x + 2 and y = 2x + 3 by completing a table.
I can plot graphs for equations such as y = 2x + 3
I can plot coordinates and then work out the missing points to complete shapes such as squares and rectangles.
I can solve problems involving graphs such as finding where the line y = x + 1 crosses the line y = 1.
I can decide which points to plot without using a table of values to draw graphs for equations such as y = 2x + 3
I can recognise the general equation for a straight line graph as y = mx + c.
I can work out from an equation which part represents the gradient and which part represents the y-intercept.
I can find the gradient of straight line graphs and use this to determine the equation of the line.
I know when the gradient of a straight-line graph is positive or negative.
I can interpret gradient as a rate of change.
I can work out the mid-point of a line which is part of a straight-line graph.
I can recognise that when straight lines graphs are parallel then their gradients will be equal.
I can work out the equation of a line that is parallel to another line whose gradient is known.
I can work out the gradient of a straight line that joins up two coordinates.
I can work out the equation of a straight line that joins up two coordinates.
I know and understand how the gradients of perpendicular lines are connected to each other.
I can work out the gradient of a line that is perpendicular to another line whose gradient is known.
I can solve a set of inequalities that contain two variables and represent the solution as a region on a coordinate grid.
I know when to use a dashed line or a solid line when representing inequalities on a coordinate grid.
I know how to represent the solution set of an inequality using set notation e.g. -3 ≤ x ≤ 2 is given by 𝑥 ∈ {−3,−2,−1, 0, 0, 1, 2}

AQA 8300 Subject content with learning outcomes for Programme of Study Page 21 The Fernwood School
Subject content from Specification (May 2014) Basic foundation Additional foundation Higher Only
TOPIC: 6.2 GRAPHS FOR REAL SITUATIONS
A14 Plot and interpret graphs, and graphs of non-standard functions in real contexts, to find approximate solutions to problems such as simple kinematic problems involving distance speed and acceleration Notes: including problems requiring a graphical solution. See also A15 A15 Calculate or estimate gradients of graphs and areas under graphs (including quadratic and other non-linear graphs), and interpret results in cases such as distance-time graphs, velocity-time graphs and graphs in financial contexts Notes: see also A14, R14 and R15
I can recognise a conversion graph. For example one that converts euros to pounds.
I can read off positive values from a conversion graph.
I can work out and plot the points for a conversion graph.
I can use information from a conversion graph to solve other related problems.
I can read off negative values from a conversion graph.
I can recognise a graph that represents distance and time.
I can read of values from a distance time graph.
I can work out speed by using a simple distance time graph which has just one part.
I can work out average speeds from a distance time graph which is made up of more than one part.
I can recognise a velocity-time graph.
I can interpret a velocity-time graph.
I can use values from a velocity-time graph to work out related problems such as finding acceleration and distance.
I can calculate the area under a velocity time graph by using the area of trapezia, triangles and rectangles.
I can discuss and interpret non-linear graphs that model real situations.
Subject content from Specification (May 2014) Basic foundation Additional foundation Higher Only
TOPIC: 6.3 PRESENTING DATA 2 – PIE CHARTS
S2 Interpret and construct tables, charts and diagrams, including frequency tables bar charts pie charts and pictograms for categorical data, vertical line charts for ungrouped discrete numerical data and know their appropriate use
I can recognise a pie chart as representing a set of data.
I know that the complete pie chart represents the total number of values in a data set.
I can work out what values parts of a pie chart represent when they are divided into halves, quarters or thirds.
I can work out what values parts of a pie chart represent when the sections are divided using angles.
I can work out what values parts of a pie chart represent when the sections are divided using percentages.
I can work out how big using angles each part of a pie chart needs to be by using a frequency table.
I can work out how big using percentages each part of a pie chart needs to be by using a frequency table.
I can construct a pie chart using angles.
I can construct a pie chart using percentages.
I can solve harder problems by using information from a pie chart such as fractions of quantities, probabilities and averages.
I can compare more than one pie chart and understand how they can be misinterpreted if they are not the same size.

AQA 8300 Subject content with learning outcomes for Programme of Study Page 22 The Fernwood School
Subject content from Specification (May 2014) Basic foundation Additional foundation Higher Only
TOPIC: 7.1 PROPORTIONS AND PROPORTIONAL CHANGE
R9 Solve problems involving percentage change including percentage increase/decrease problems, and simple interest including in financial mathematics Notes: see also N2 and N12 R10 Solve problems involving direct and inverse proportion including graphical and algebraic representations R13 Understand that X Is inversely proportional
to Y is equivalent to X is proportional to 1
𝑦
Interpret equations that describe direct and inverse proportion Construct and interpret equations that describe direct and inverse proportion R14 Interpret the gradient of a straight-line graphs as a rate of change Recognise and interpret graphs that illustrate direct and inverse proportion Notes see also A15, R8 R16 Set up, solve and interpret the answers in growth and decay problems, including compound interest And work with general iterative processes
I can calculate a percentage of an amount.
I can calculate a percentage increase or decrease using a multiplier.
I can work out how to calculate successive percentage increase or decrease.
I can work out the original values for reverse percentage calculations.
I can work out how to use successive percentages for problems involving repeated proportional change.
I can use iteration to work out approximate solutions to problems that involve successive percentage calculations.
I can work out compound interest.
I can recognise when a situation involves direct or indirect proportion from a table of values.
I can recognise the graphs that represent direct or indirect proportion
I can recognise and construct the graph for a reciprocal function such as y = 1/x or y = k/x where k is a positive integer.
I can write expressions using the symbol for ‘proportional to’
I can work out the formula that connects variables that are directly or indirectly proportional to each other.
I can apply the formula to work out values of a variable.
I can work out the formula for variables that are directly or indirectly proportional to each other involving powers or roots.
I can use the information from a problem or table of values to work out the expression that shows the connection between two variables which are either directly or indirectly proportional to each other.

AQA 8300 Subject content with learning outcomes for Programme of Study Page 23 The Fernwood School
Subject content from Specification (May 2014) Basic foundation Additional foundation Higher Only
TOPIC: 7.2 SCATTER DIAGRAMS AND CORRELATION
S6 Use and interpret scatter graphs of bivariate data Recognise correlation Know that it does not indicate causation Draw estimated lines of best fit Make predictions Interpolate and extrapolate apparent trends whilst knowing the dangers of so doing Notes: students should know and understand the terms: positive correlation, negative correlation, no correlation, weak correlation and strong correlation.
I can draw a scatter diagram by plotting points on a graph.
I can interpret a scatter diagram and work out a relationship between two sets of data.
I can identify any ‘rogue values’ or ‘outliers’ from a scatter diagram.
I can draw a line of best fit on a scatter diagram.
I understand the word correlation
I can recognise when correlation is weak or strong, positive or negative.
I understand that the line of best fit should not go beyond the range of data that has been plotted.
I am able to recognise what the line of best fit represents
I can use the line of best fit to make estimates for the variables represented by the axis.
I understand the assumptions that I make when interpolating or extrapolating a line of best fit to find the possible values for variables that are beyond the main set of points that are given.

AQA 8300 Subject content with learning outcomes for Programme of Study Page 24 The Fernwood School
Subject content from Specification (May 2014) Basic foundation Additional foundation Higher Only
TOPIC: 7.3 TRIAL AND IMPROVEMENT AND
ITERATION
A20 Find approximate solutions to equations numerically using iteration Notes: including the use of suffix notation in recursive formulae
I understand what trial and improvement means.
I can substitute values into an equation and decide on whether the solution is too big or too small.
I can decide on which values to substitute so that I can improve my solution
I can fill in the relevant information in a table to show my trials and decisions.
I can recognise when I have reached a solution with the correct number of decimal places.
I can solve more complete equations such as x3 + x = 12 Using trial and improvement.
I can make decisions as to which values give the closest solutions to an equation.
I know that iteration is way of solving equations such as x2 = 2x + 1.
I can manipulate an equation so that the unknown appears on its own on one side of the equation
Eg 𝑥2 = 2𝑥 + 1 becomes 𝑥 = 2 + 1
𝑥
I understand how to use suffix notation
Eg 𝑥 = 2 + 1
𝑥 becomes 𝑥𝑛+1 = 2 +
1
𝑥𝑛
I know how to substitute values for xn to generate the value for xn+1
I understand that a solution is found when the difference between consecutive values is very small

AQA 8300 Subject content with learning outcomes for Programme of Study Page 25 The Fernwood School
Subject content from Specification (May 2014) Basic foundation Additional foundation Higher Only
TOPIC: 8.1 TRANSFORMATIONS
R12 Compare lengths, areas and volumes using ratio notation Scale factors Notes: see also G19, G20 G7 Identify, describe and construct congruent and similar shapes, including on coordinate axes by considering rotation reflection translation and enlargement G8 Describe the changes and invariance achieved by combinations of rotations, reflections and translations Notes: including using column vector notation for translations. See also G24 G24 Describe translations as 2D vectors Notes: see also G8
I understand that the word transformation refers to reflection, rotation, translation and enlargement.
I can reflect any 2D shape in a mirror line.
I can work out where the line of reflection is for two shapes.
I can reflect shapes in the axes of a graph.
I can reflect shapes in lines parallel to the axes such as x = 2 and y = -1.
I can describe reflections using the equations for lines on a coordinate grid.
I can reflect shapes in the lines such as y = x and y = - x
I can rotate shapes about the origin for a given amount of turn.
I can describe how a shape has been rotated about the origin.
I can rotate shapes about any point.
I can describe how a shape has been rotated about any point and by how many degrees and in which direction.
I can find the centre of rotation when a shape is rotated and describe a rotation fully.
I can work out the scale factor of an enlarged shape.
I can enlarge a shape by a positive scale factor.
I can find the measurements of the dimensions of an enlarged shape.
I can compare the area of an enlarged shape with the original shape.
I can enlarge a shape by a positive scale factor from a given centre of enlargement.
I can construct enlargements of shapes using fractional scale factors.
I can work out the scale factor and the centre of enlargement for two similar shapes.
I can translate a shape using a description such as 4 unit right and 3 units down.
I can translate a shape by using a column vector.
I can work out the column vector for shapes that have been translated.
I can transform shapes by a combination of translation, rotation and reflection.
I know the properties of shapes that remain unchanged when shapes are transformed by a combination of translation, rotation and reflection.
I can describe how the properties of shapes are changed when shapes are transformed by a combination of translation, rotation and reflection.

AQA 8300 Subject content with learning outcomes for Programme of Study Page 26 The Fernwood School
Subject content from Specification (May 2014) Basic foundation Additional foundation Higher Only
TOPIC: 8.2 PYTHAGORAS’ THEOREM AND 2D PROBLEMS
G6 Apply angle facts, triangle congruence, similarity and properties of quadrilaterals to conjecture and derive results about angles and sides, including Pythagoras’ theorem and the fact that the base angles of an isosceles triangle are equal, and use known results to obtain simple proofs G20 Know the formulae for Pythagoras’ theorem
I can use my calculator to find the squares and square roots of numbers.
I can identify the hypotenuse of any right-angled triangle.
I can write down Pythagoras’ theorem.
I can correctly label the sides of any right-angled triangle using the letters used in Pythagoras’ theorem.
I can calculate the length of the hypotenuse using the theorem.
I can calculate the length of either of the shorter sides using the theorem.
I know that any isosceles triangle can be split into two congruent right-angled triangles.
I can calculate the height of an isosceles triangle using Pythagoras’ theorem.
I can use the theorem in practical contexts by identifying the right-angled triangle and calculating unknown lengths.
I can calculate the distance between two points from their coordinates using Pythagoras’ theorem.
I can identify right-angled triangles within 3D objects.
I can use Pythagoras’ theorem to find unknown lengths within 3D objects.
AQA 8300 Subject content with learning outcomes for Programme of Study Page 27 The Fernwood School
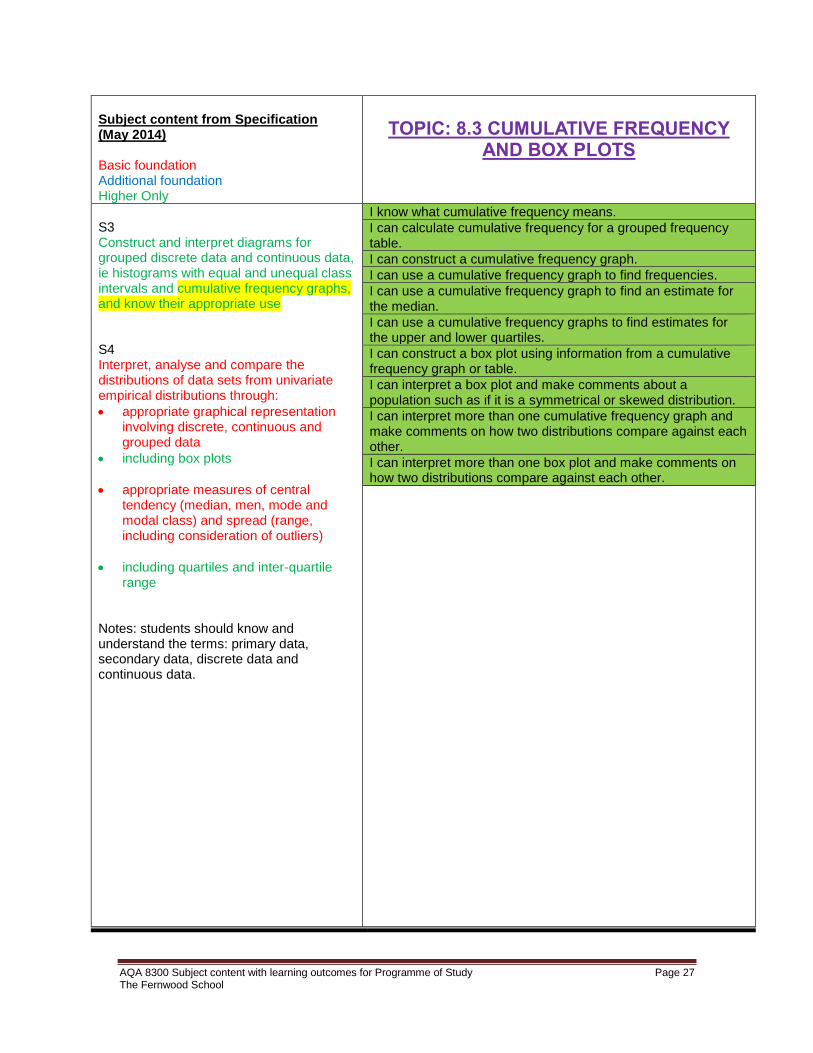
Subject content from Specification (May 2014) Basic foundation Additional foundation Higher Only
TOPIC: 8.3 CUMULATIVE FREQUENCY AND BOX PLOTS
S3 Construct and interpret diagrams for grouped discrete data and continuous data, ie histograms with equal and unequal class intervals and cumulative frequency graphs, and know their appropriate use S4 Interpret, analyse and compare the distributions of data sets from univariate empirical distributions through:
appropriate graphical representation involving discrete, continuous and grouped data
including box plots
appropriate measures of central tendency (median, men, mode and modal class) and spread (range, including consideration of outliers)
including quartiles and inter-quartile range
Notes: students should know and understand the terms: primary data, secondary data, discrete data and continuous data.
I know what cumulative frequency means.
I can calculate cumulative frequency for a grouped frequency table.
I can construct a cumulative frequency graph.
I can use a cumulative frequency graph to find frequencies.
I can use a cumulative frequency graph to find an estimate for the median.
I can use a cumulative frequency graphs to find estimates for the upper and lower quartiles.
I can construct a box plot using information from a cumulative frequency graph or table.
I can interpret a box plot and make comments about a population such as if it is a symmetrical or skewed distribution.
I can interpret more than one cumulative frequency graph and make comments on how two distributions compare against each other.
I can interpret more than one box plot and make comments on how two distributions compare against each other.
AQA 8300 Subject content with learning outcomes for Programme of Study Page 28 The Fernwood School
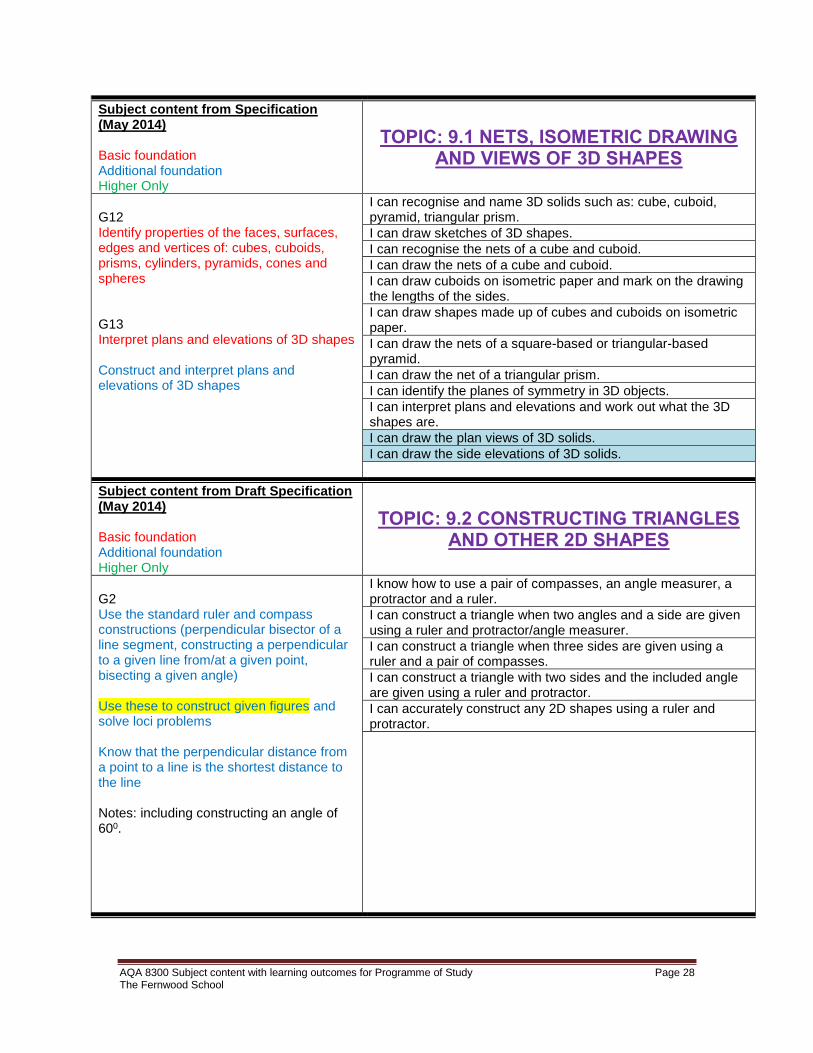
Subject content from Specification (May 2014) Basic foundation Additional foundation Higher Only
TOPIC: 9.1 NETS, ISOMETRIC DRAWING AND VIEWS OF 3D SHAPES
G12 Identify properties of the faces, surfaces, edges and vertices of: cubes, cuboids, prisms, cylinders, pyramids, cones and spheres G13 Interpret plans and elevations of 3D shapes Construct and interpret plans and elevations of 3D shapes
I can recognise and name 3D solids such as: cube, cuboid, pyramid, triangular prism.
I can draw sketches of 3D shapes.
I can recognise the nets of a cube and cuboid.
I can draw the nets of a cube and cuboid.
I can draw cuboids on isometric paper and mark on the drawing the lengths of the sides.
I can draw shapes made up of cubes and cuboids on isometric paper.
I can draw the nets of a square-based or triangular-based pyramid.
I can draw the net of a triangular prism.
I can identify the planes of symmetry in 3D objects.
I can interpret plans and elevations and work out what the 3D shapes are.
I can draw the plan views of 3D solids.
I can draw the side elevations of 3D solids.
Subject content from Draft Specification (May 2014) Basic foundation Additional foundation Higher Only
TOPIC: 9.2 CONSTRUCTING TRIANGLES AND OTHER 2D SHAPES
G2 Use the standard ruler and compass constructions (perpendicular bisector of a line segment, constructing a perpendicular to a given line from/at a given point, bisecting a given angle) Use these to construct given figures and solve loci problems Know that the perpendicular distance from a point to a line is the shortest distance to the line Notes: including constructing an angle of 600.
I know how to use a pair of compasses, an angle measurer, a protractor and a ruler.
I can construct a triangle when two angles and a side are given using a ruler and protractor/angle measurer.
I can construct a triangle when three sides are given using a ruler and a pair of compasses.
I can construct a triangle with two sides and the included angle are given using a ruler and protractor.
I can accurately construct any 2D shapes using a ruler and protractor.

AQA 8300 Subject content with learning outcomes for Programme of Study Page 29 The Fernwood School
Subject content from Specification (May 2014) Basic foundation Additional foundation Higher Only
TOPIC: 9.3 CONSTRUCTIONS AND LOCI
G2 Use the standard ruler and compass constructions (perpendicular bisector of a line segment, constructing a perpendicular to a given line from/at a given point, bisecting a given angle) Use these to construct given figures and solve loci problems Know that the perpendicular distance from a point to a line is the shortest distance to the line Notes: including constructing an angle of 600.
I understand what the words perpendicular and bisect mean.
I can construct the perpendicular bisector of a line.
I can construct the perpendicular bisector of an angle.
I can construct the perpendicular from a point to a line.
I can construct the perpendicular at a point on a line.
I can construct an angle of 600.
I know that locus means the path of a moving object and that loci is the plural of locus.
I can construct the locus of an object which is equidistant from a fixed point.
I can construct the locus of an object which is equidistant from two fixed points.
I can construct the locus of an object which is equidistant from two lines which form an angle.
I can construct the locus of an object which is equidistant from a straight line.
I can solve loci problems, such as identifying points or regions which are restricted by given conditions. Such as: points less than a certain distance from a point; or regions which are closer to one point or line than another point or line.
Subject content from Draft Specification (May 2014) Basic foundation Additional foundation Higher Only
TOPIC: 9.4 COMPASS DIRECTIONS AND BEARINGS
G15 Measure line segments and angles in geometric figures, including interpreting maps and scale drawings and use of bearings Notes: including the eight compass point bearings and three-figure bearings.
I know the compass directions North, East, South and West.
I can use compass directions to identify positions on a map.
I can use compass directions such as North-East etc.
I can use compass directions and distances to identify and plot the locations of objects on a map or grid.
I know that bearings are measured from North in the clockwise direction and are given as three-figures.
I can use an angle measurer to measure and draw a bearing from a point.
I can use bearings and distances to identify the position of an object from one point.
I can use bearings and distances to identify the position of an object from two points.
I can apply Pythagoras’ Theorem for problems involving compass directions or bearings

AQA 8300 Subject content with learning outcomes for Programme of Study Page 30 The Fernwood School
Subject content from Specification (May 2014) Basic foundation Additional foundation Higher Only
TOPIC: 10.1 QUADRATIC GRAPHS
A11 Identify and interpret roots intercepts and turning points of quadratic functions graphically Deduce roots algebraically Notes: including the symmetrical property of a quadratic. See also A18 A12 Recognise, sketch and interpret graphs of linear functions and quadratic functions including cubic functions Notes: see also G21 A18 Solve quadratic equations algebraically by factorising Find approximate solutions using a graph Notes see also A11
I can plot coordinates in all four quadrants on a grid.
I can recognise that functions such as y = 3x2 are called quadratic functions and will give graphs that have a U-shape.
I can substitute a range of values for x into a function and be able to complete a table using these values.
I can work out which coordinates to plot from a table of values for a function.
I can recognise and name the main features of a quadratic graph including the roots, vertex and y-intercept.
I can draw the graphs for functions such as y = 3x2 and y = x2 + 4
I can draw graphs for harder quadratic functions such as y = x2 – 2x + 1.
I can find the points of intersection of quadratic graphs with lines.
I can use a quadratic graph to find the approximate value of y for a given value of x or the approximate values of x for a given value of y.
I can use a quadratic graph and a straight line graph to find solutions for equations such as x2 - 2x + 4 = 3
I can use quadratic graphs to find approximate solutions of quadratic equations by interpreting where the graphs cross the x-axis.
I know that if I want to graphically solve an equation such as 3x2 + 2x -3 = 2x + 1 I need the quadratic graph of y = 3x2 + 2x -3 and the linear graph of y = 2x + 1
I know that if I am given the graph for y = 3x2 + 5x + 2 but need to solve the equation 3x2 + 2x -3 = 0 then I must first manipulate this to extract the expression for the given graph and then go on to identify the expression for the straight line graph to be drawn.
I can recognise and construct the graph for a cubic function such as y = x3.

AQA 8300 Subject content with learning outcomes for Programme of Study Page 31 The Fernwood School
Subject content from Specification (May 2014) Basic foundation Additional foundation Higher Only
TOPIC: 10.2 SOLVING QUADRATIC EQUATIONS AND INEQUALTIES
A4 Simplify and manipulate algebraic expressions (including those involving surds) by:
expanding products of two binomials
factorising quadratic expressions of the form x2 + bx + c, including the difference of two squares
simplify and manipulate algebraic expression (including those involving surds and algebraic fractions) by:
expanding products of two or more binomials
factorising quadratic expressions of the form ax2 + bx + c
A11 Identify and interpret roots intercepts and turning points of quadratic functions graphically Deduce roots algebraically Deduce turning points by completing the square Notes: including the symmetrical property of a quadratic. See also A18 A18 Solve quadratic equations algebraically by factorising Find approximate solutions using a graph Including those that require rearrangement Including completing the square and using the quadratic formula Notes see also A11 A22 Solve quadratic inequalities in one variable Represent the solution set on a graph
I know that factorising an expression leads to another expression containing brackets.
I can factorise quadratic expressions such as 4x2 + 6xy
I can factorise quadratic expressions such as x2 – 8x -16
I know that when I solve a quadratic equation such as x2 - 8x + 15 = 0, this gives me the values of x when the graph crosses the x-axis.
I can solve quadratic equation such as x2 - 8x + 15 = 0 by factorisation
I know that the roots of a quadratic graph can be found from the factorised form of a quadratic expression.
I understand what ‘the difference of two squares’ means.
I can recognise when an expression is the difference of two squares and factorise it.
I can use the difference of squares to re-write more complex expressions such as 18𝑥2 − 32𝑦2 ≡ 2(9𝑥2 − 16𝑦2) ≡ 2(3𝑥 − 4𝑦)(3𝑥 + 4𝑦) I can factorise harder quadratic expressions such as 5x2 + 3x – 6.
I can re-write a quadratic expression in the completed square form (x + p)2 + q
I can solve quadratic equations that have been written in the completed square form.
I can make the connection between the completed square form of a quadratic function and the coordinate of the vertex of a quadratic graph as a minimum or maximum point
I can solve an equation such as 5x2 + 3x – 6 = 2x + 1
I know that the solutions to 𝑎𝑥2 + 𝑏𝑥 + 𝑐 = 0 give me the points
of intersection of the quadratic graph 𝑦 = 𝑎𝑥2 + 𝑏𝑥 + 𝑐 with the x-axis i.e. when y = 0 and that these are called the roots.
I can recall and use the quadratic formula
𝑥 = −𝑏 ± √𝑏2 − 4𝑎𝑐
2𝑎
to solve equations in the form 𝑎𝑥2 + 𝑏𝑥 + 𝑐 = 0
I know that the discriminant of a quadratic formula is 𝒃𝟐 − 𝟒𝒂𝒄
I know that if 𝒃𝟐 − 𝟒𝒂𝒄 = 𝟎 then the quadratic graph will only have one real root.
I know that if 𝒃𝟐 − 𝟒𝒂𝒄 > 𝟎 then the quadratic graph will have two real roots.
I know that if 𝒃𝟐 − 𝟒𝒂𝒄 < 𝟎 then the quadratic graph will have no real roots i.e. the graph does not cross the x-axis.
I know how to solve a quadratic inequality such as 2x2 + 5x ≤ 3 and x2 < 9
I can represent the solution set for a quadratic inequality on a graph.

AQA 8300 Subject content with learning outcomes for Programme of Study Page 32 The Fernwood School
Subject content from Specification (May 2014) Basic foundation Additional foundation Higher Only
TOPIC: 11.1 STANDARD INDEX FORM
N9 Calculate with and interpret standard form A x 10n, where 1 ≤ A < 10 and n is an integer Notes: with and without a calculator. Interpret calculator displays.
Recall the rule of indices when numbers are being multiplied in index form and with the same base.
Recall the rule of indices when numbers are being divided in index form and with the same base.
I know that a number with a power of zero is equal to 1.
I can recognise numbers that are written in standard index form.
I know that for a number to be in standard index form such as a x 10n that 1 ≤ a < 10 I know that for numbers that are greater than or equal to one, 10 will have a positive power. I know that for numbers that are less than one, 10 will have a negative power. I can convert any ordinary number into standard index form. I can convert any number that is in standard index form to an ordinary number. I know how to input numbers that are in standard index form into my calculator. I can interpret my calculator display when answers are given in standard index form. I can solve problems involving numbers in standard index form without using a calculator. I can solve problems involving numbers in standard index form using a calculator.

AQA 8300 Subject content with learning outcomes for Programme of Study Page 33 The Fernwood School
Subject content from Specification (May 2014) Basic foundation Additional foundation Higher Only
TOPIC: 11.2 SIMILARITY AND ENLARGEMENT
G5 Use the basic congruence criteria for triangles (SSS, SAS, ASA, RHS) G7 Identify, describe and construct congruent and similar shapes, including on coordinate axes by considering rotation reflection translation and enlargement Including fractional scale factors Including negative scale factors G19 Apply the concepts of congruence and similarity, including the relationships between lengths in similar figures Including the relationships between lengths, areas and volumes in similar figures Notes: see also R12
I can recall and use scale factors and centres of enlargement.
I can recall that when shapes are enlarged the size of any angles remain the same.
I can match the sides of similar triangles from diagrams and work out the scale factors and any missing sides.
I can enlarge any shapes using negative scale factors.
I can recall and use the fact that when shapes are enlarged using a linear scale factor = k then the area scale factor = k2.
I can recall and use the fact that when shapes are enlarged using a linear scale factor = k then the volume scale factor = k3.
I can use area and volume scale factors to find the corresponding linear scale factors and any missing lengths.
I can manipulate the orientation of triangles to determine matching sides and angles.
I can prove that two triangles are congruent by determining whether matching sides and angles meet the SSS, SAS, ASA or RHS criteria.

AQA 8300 Subject content with learning outcomes for Programme of Study Page 34 The Fernwood School
Subject content from Draft Specification (May 2014) Basic foundation Additional foundation Higher Only
TOPIC: 11.3 TRIGONOMETRY AND PYTHAGORAS’ THEOREM FOR SOLVING
3D PROBLEMS
R12 Make links to similarity (including trigonometric ratios) Notes: see also G19, G20 G20 Know the formulae for the trigonometric ratios,
𝑠𝑖𝑛𝜃 = 𝑜𝑝𝑝𝑜𝑠𝑖𝑡𝑒
ℎ𝑦𝑝𝑜𝑡𝑒𝑛𝑢𝑠𝑒
𝑐𝑜𝑠𝜃 = 𝑎𝑑𝑗𝑎𝑐𝑒𝑛𝑡
ℎ𝑦𝑝𝑜𝑡𝑒𝑛𝑢𝑠𝑒
𝑡𝑎𝑛𝜃 = 𝑜𝑝𝑝𝑜𝑠𝑖𝑡𝑒
𝑎𝑑𝑗𝑎𝑐𝑒𝑛𝑡
Apply them to find angles and lengths in right-angles triangles in two dimensional figures and three dimensional figures Notes: see also R12 G21
Know the exact values of sin and cos for
= 00, 300, 450, 600 and 900
Know the exact value of tan for = 00, 300, 450, 600 Notes: see also A12
I can identify and label the sides of any right-angled triangle using the words ‘hypotenuse’, ‘adjacent’ and ‘opposite’
I know that for similar triangles the interior angles remain unchanged.
I know the relationships between the trigonometric ratios for Sine, Cosine and Tangent and the sides of a right-angled triangle.
I can select the appropriate trig ratio that can be used for solving problems.
I know how to use the trig function keys on my calculator to find lengths.
I know how to use the inverse-trig function keys on my calculator to find angles.
I can calculate lengths by using the appropriate trig ratio.
I can calculate the angle by using the appropriate trig ratio.
I can use trigonometry to solve problems involving bearings.
I can use trigonometry to solve problems involving angles of elevation and depression.
I can solve problems involving trigonometry without using a calculator.
I know how to deduce the exact values of sin and cos for = 00, 300, 450, 600 and 900.
I know how to deduce the exact values of tan for = 00, 300, 450and 600.
I can identify right-angled triangles within 3D objects.
I can use Trigonometry to find sides and angles within 3D objects.
Subject content from Specification (May 2014) Basic foundation Additional foundation Higher Only
TOPIC: 11.4 CHANGING THE SUBJECT OF A FORMULA
A5 Understand and use standard mathematical formulae Rearrange formulae to change the subject Notes: including use of formulae from other subjects in words and using symbols See the Appendix for a full list of the prescribed formulae. See also A2.
I know that a formula can contain more than one variable.
I can use reverse operations correctly and in the correct order.
I can rearrange a formula such as p = 3q + 5
I can manipulate formulae that contain brackets, fractions and square roots.
I can rearrange formulae that contain brackets, fractions and square roots.
I can change the subject of formulas such as:
𝑣 = 𝑢 + 𝑎𝑡 𝑠 = 𝑢𝑡 +1
2𝑎𝑡2 𝑣2 = 𝑢2 + 2𝑎𝑠
I can manipulate and rearrange formulae where the variable appears twice.
I know that if the variable appears twice I have to use factorisation.

AQA 8300 Subject content with learning outcomes for Programme of Study Page 35 The Fernwood School
Subject content from Specification (May 2014) Basic foundation Additional foundation Higher Only
TOPIC: 12.1 VOLUME OF SPHERES, CONES, PYRAMIDS AND COMPOUND
SHAPES
G17 Surface area and volume of spheres, pyramids, cones and composite solids Notes: including frustums
Solutions in terms of may be asked for. N8
Calculate exactly with multiples of Notes: see also G17 and G18 G18 Calculate arc lengths, angles and areas of sectors of circles Notes: see also N8, G17
I can recognise a sphere, cone and pyramid.
I can use the formulae to calculate the surface area of a sphere, cone or pyramid
I can manipulate the formulae for surface area to find any unknown dimensions when the surface area is known.
I can use the formulae to calculate the volume of a sphere, cone or pyramid.
I can manipulate the formulae for volume to find any unknown dimensions when the volume is known.
I can recognise a truncated cone or pyramid.
I can work out missing dimensions for the top cone or the frustum of a truncated cone.
I can work out the volume for the top cone or the frustum of a truncated cone.
I can identify on any circle the arc, sector and segment.
I can find the length of an arc of a circle.
I can find the area of a sector of a circle.
I can find the area of a segment of a circle.
I know what to do when an answer needs to be given in terms of
.
I know how to manipulate expressions such as 9 + 3
4𝜋

AQA 8300 Subject content with learning outcomes for Programme of Study Page 36 The Fernwood School
Subject content from Specification (May 2014) Basic foundation Additional foundation Higher Only
TOPIC: 12.2 SOLVING SIMULTANEOUS EQUATIONS
A16 Recognise and use the equation of a circle with centre at the origin Find the equation of a tangent to a circle at a given point A19 Solve two simultaneous equations in two variables (linear/linear) algebraically Find approximate solutions using a graph Including linear/quadratic A21 Translate simple situations or procedures into algebraic expressions or formulae Derive an equations (or two simultaneous equations), solve the equation(s) and interpret the solution Notes: including the solution of geometrical problems and problems set in context.
I can solve a linear equation.
I understand what solving simultaneous equations means.
I can represent linear equations graphically.
I can use the graphs of linear equations to find simultaneous solutions by interpreting the point of intersection.
I can manipulate any equation in order to change the coefficients. e.g. 2x + y = 5 becomes 4x + 2y = 10 when each term of the original equation has been multiplied by 2.
I can manipulate pairs of linear equations in order to solve them algebraically to find simultaneous solutions such as 2x + y = 5 and 3x -2y =4.
I can solve a pair of simultaneous equations where one is linear and one is non- linear, such as y = 3x – 2 and y = x2 by using the method of substitution.
I can solve a pair of simultaneous equations where one is linear and one is non- linear, such as y = 3x – 2 and y = x2 by using their graphs.
I can see that to graphically solve an equation such as x2 - 2x - 4 = 2x + 1 I will need to find the points of intersection of the graphs y = x2 - 2x – 4 and y = 2x + 1.
I can recognise that the equation x2 + y2 = r2 gives a circle whose centre is at (0,0) and has a radius = r.
I can use graphs to solve simultaneous equations where one is linear such as y = x – 1 and one which gives a circle such as x2 + y2 = 16.
I can algebraically solve simultaneous equations where one is linear such as x + 5y = 13 and one which gives a circle such as x2 + y2 = 13 using the method of substitution and knowing that I will need to solve quadratic equations and possibly giving answers in surd form.
I know that at the point where there is a tangent to a circle, the tangent will be perpendicular to the radius.
I can deduce the equation of a tangent to a circle at a given point.
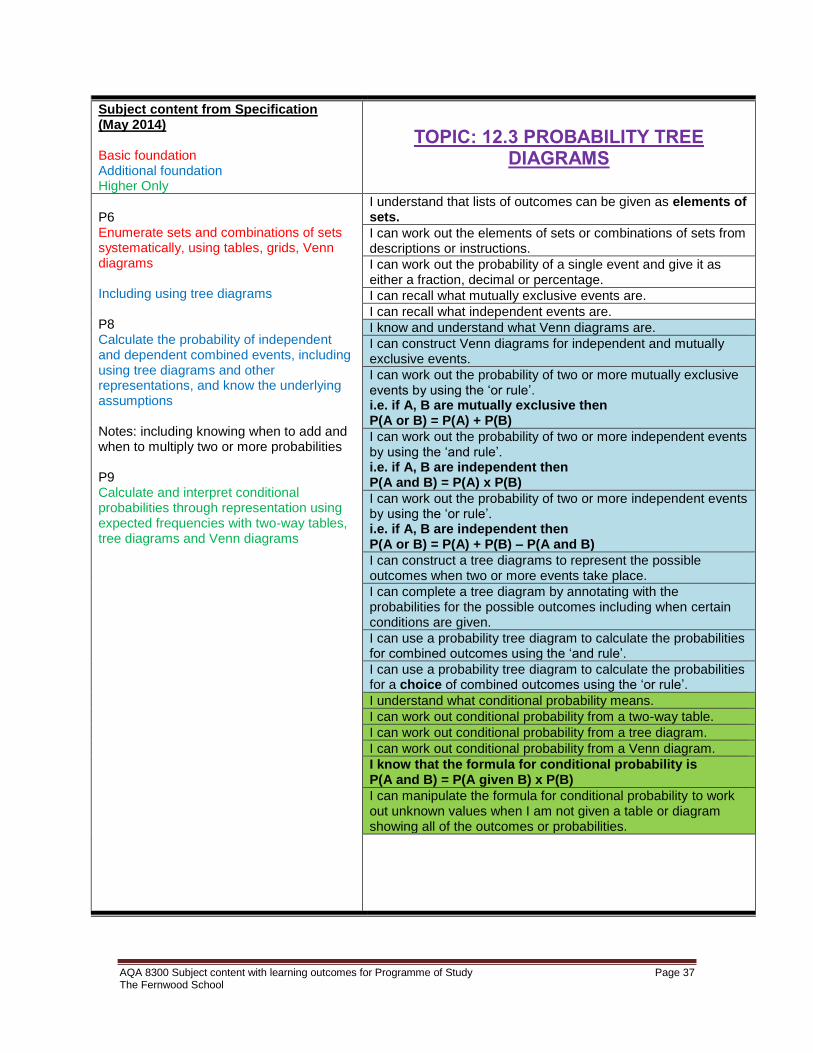
AQA 8300 Subject content with learning outcomes for Programme of Study Page 37 The Fernwood School
Subject content from Specification (May 2014) Basic foundation Additional foundation Higher Only
TOPIC: 12.3 PROBABILITY TREE DIAGRAMS
P6 Enumerate sets and combinations of sets systematically, using tables, grids, Venn diagrams Including using tree diagrams P8 Calculate the probability of independent and dependent combined events, including using tree diagrams and other representations, and know the underlying assumptions Notes: including knowing when to add and when to multiply two or more probabilities P9 Calculate and interpret conditional probabilities through representation using expected frequencies with two-way tables, tree diagrams and Venn diagrams
I understand that lists of outcomes can be given as elements of sets.
I can work out the elements of sets or combinations of sets from descriptions or instructions.
I can work out the probability of a single event and give it as either a fraction, decimal or percentage.
I can recall what mutually exclusive events are.
I can recall what independent events are.
I know and understand what Venn diagrams are.
I can construct Venn diagrams for independent and mutually exclusive events.
I can work out the probability of two or more mutually exclusive events by using the ‘or rule’. i.e. if A, B are mutually exclusive then P(A or B) = P(A) + P(B)
I can work out the probability of two or more independent events by using the ‘and rule’. i.e. if A, B are independent then P(A and B) = P(A) x P(B)
I can work out the probability of two or more independent events by using the ‘or rule’. i.e. if A, B are independent then P(A or B) = P(A) + P(B) – P(A and B)
I can construct a tree diagrams to represent the possible outcomes when two or more events take place.
I can complete a tree diagram by annotating with the probabilities for the possible outcomes including when certain conditions are given.
I can use a probability tree diagram to calculate the probabilities for combined outcomes using the ‘and rule’.
I can use a probability tree diagram to calculate the probabilities for a choice of combined outcomes using the ‘or rule’.
I understand what conditional probability means.
I can work out conditional probability from a two-way table.
I can work out conditional probability from a tree diagram.
I can work out conditional probability from a Venn diagram.
I know that the formula for conditional probability is P(A and B) = P(A given B) x P(B)
I can manipulate the formula for conditional probability to work out unknown values when I am not given a table or diagram showing all of the outcomes or probabilities.

AQA 8300 Subject content with learning outcomes for Programme of Study Page 38 The Fernwood School
Subject content from Specification (May 2014) Basic foundation Additional foundation Higher Only
TOPIC: 12.4 VECTOR NOTATION AND VECTOR GEOMETRY
G25 Apply addition and subtraction of vectors, multiplication of vectors by a scalar, and diagrammatic and column representations of vectors Use vectors to construct geometric arguments and proofs
I know that a scalar quantity has magnitude only such as mass or temperature.
I know that a vector quantity has both magnitude and direction, such as velocity or force. I can recall what a column vector is and that it describes a translation. I can relate vector notation using bold letters and arrows above the vertices of the start and end points e.g.
𝐴𝐵⃗⃗⃗⃗ ⃗ is the same as a (translation from A to B) and that
–a represents 𝐵𝐴⃗⃗⃗⃗ ⃗ (translation from B to A) I can calculate and represent graphically the sum and difference of two vectors. I can calculate and represent graphically the scalar multiple of a vector. I know that a resultant vector is formed when two or more vectors are applied. I can calculate the resultant of two or more vectors.
I can calculate the magnitude of a vector by applying Pythagoras’ theorem. I can use algebraic manipulation with vectors given in bold letter form. I can prove that lines are parallel by comparing and interpreting vectors and show that they have the same direction. I can prove that vectors form a straight line by showing that they are collinear.

AQA 8300 Subject content with learning outcomes for Programme of Study Page 39 The Fernwood School
Subject content from Specification (May 2014) Basic foundation Additional foundation Higher Only
TOPIC: 13.1 MORE RULES OF INDICES
N7 Calculate with fractional indices
I can use the rule of indices when numbers in index form and with the same base are being multiplied.
I can use the rule of indices when numbers in index form and with the same base are being divided.
I know that a number with a power of zero is equal to 1.
I can write the reciprocal of a number.
I know that if a number has a power of -1 then it is the same as finding the reciprocal of the number.
I know that if a number has any negative power then it is the same as writing the reciprocal of the number with the positive power. For example:
4−3 ≡ 13
43 ≡ 1
43
I know that if a number has a power that is a unit fraction then it is the same as finding the root of the number, where the denominator represents the root. For example:
151/3 = 315
I know that if a number has a power that is any fractions then the denominator represents the root and the numerator represents the power of the number. For example:
562/3 = 3562
I can apply all the rules of indices for any number that is written in index form where the power is positive, negative or a fraction.

AQA 8300 Subject content with learning outcomes for Programme of Study Page 40 The Fernwood School
Subject content from Specification (May 2014) Basic foundation Additional foundation Higher Only
TOPIC: 13.2 SURDS AND MANIPULATING EXPRESSIONS CONTAINING SURDS
N8 Calculate exactly with surds Simplify surd expressions involving squares (eg
√12 = √4 × 3 = √4 × √3 = 2√3 ) and rationalise denominators Notes: see also G17 and G18 A4 simplify and manipulate algebraic expression (including those involving surds and algebraic fractions) by:
expanding products of two or more binomials
factorising quadratic expressions in the form of ax2 +bx + c
I can recognise rational and irrational numbers.
I know that some numbers have square roots that are irrational numbers and that when these are left with the root sign they are called surds.
I can give the exact answer of a calculation by leaving it in surd form.
I can rationalise a surd by multiplying it by itself.
e.g. 3 x 3 = 3
I can manipulate surds e.g. 18 = (9 x 2) = 9 x 2 = 32 and
2 = 2/3
3
I can rationalise the denominator of an algebraic fraction that contains surds. e.g. 2
5 Can be rationalised by multiplying the numerator and the
denominator by 5 i.e.
2 x 5 = 25
5 5 5
I can simplify irrational expressions such as
2(5 + 1)2
(5 + 1)
I can simplify harder irrational expressions such as
(2 -3 )
(5 – 4)
I can simplify surds, such as (3 - 5)2 in the form a + b5
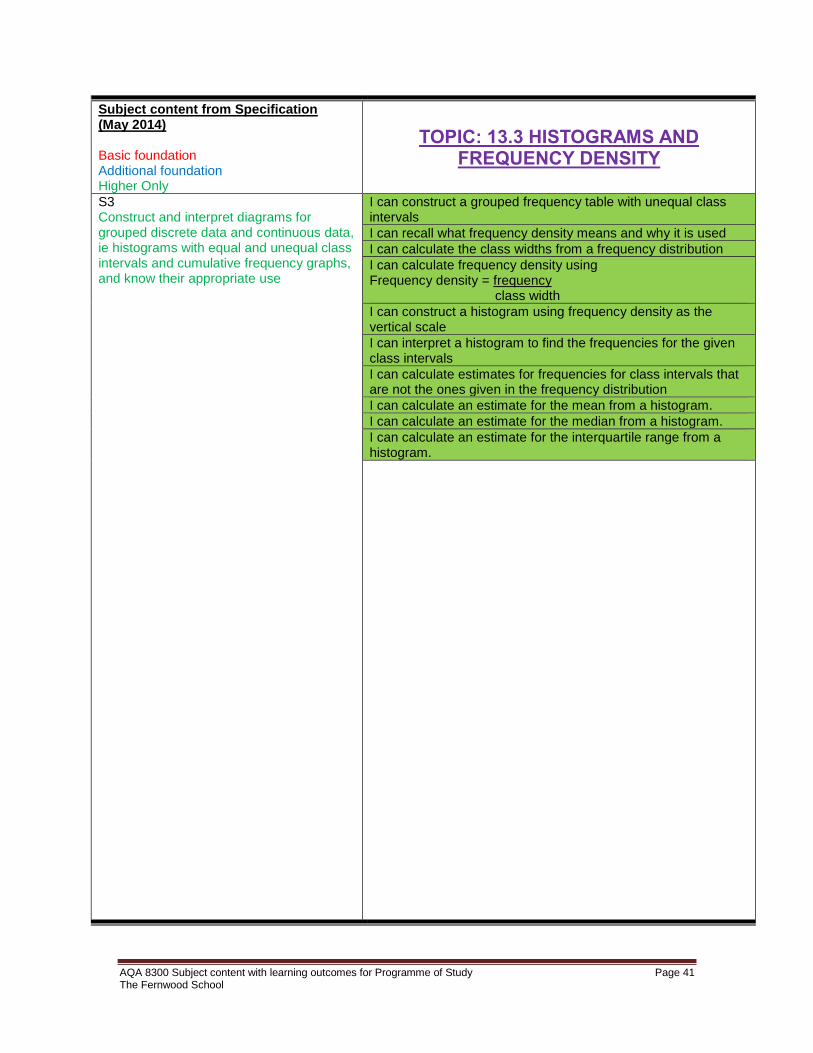
AQA 8300 Subject content with learning outcomes for Programme of Study Page 41 The Fernwood School
Subject content from Specification (May 2014) Basic foundation Additional foundation Higher Only
TOPIC: 13.3 HISTOGRAMS AND FREQUENCY DENSITY
S3 Construct and interpret diagrams for grouped discrete data and continuous data, ie histograms with equal and unequal class intervals and cumulative frequency graphs, and know their appropriate use
I can construct a grouped frequency table with unequal class intervals
I can recall what frequency density means and why it is used
I can calculate the class widths from a frequency distribution
I can calculate frequency density using Frequency density = frequency class width
I can construct a histogram using frequency density as the vertical scale
I can interpret a histogram to find the frequencies for the given class intervals
I can calculate estimates for frequencies for class intervals that are not the ones given in the frequency distribution
I can calculate an estimate for the mean from a histogram.
I can calculate an estimate for the median from a histogram.
I can calculate an estimate for the interquartile range from a histogram.

AQA 8300 Subject content with learning outcomes for Programme of Study Page 42 The Fernwood School
Subject content from Specification (May 2014) Basic foundation Additional foundation Higher Only
TOPIC: 13.4 CIRCLE THEOREMS
G10 Apply and probe the standard circle theorems concerning angles, radii, tangents and chords, and use them to prove related results Notes: including angles subtended by an arc the centre is equal to twice the angle subtended at any point on the circumference, angle subtended at the circumference by a semicircle is 900, angles in the same segment are equal, opposite angles in a cyclic quadrilateral sum to 1800, tangent at any point on a circle is perpendicular to the radius at that point, tangents from an external point are equal in length, the perpendicular from the centre to a chord bisects the chord, alternate segment theorem.
I can name the parts of a circle including radius, diameter, tangent, chord segment and sector.
I can recall and use the fact that angles formed by the ends of the diameter to the circumference are always 900.
I can recall and use the fact that the angle formed between the radius and the point at which a tangent touches a circle is always 900.
I can recall that tangents from an external point to a circle are equal in length.
I can recall and use the fact that a cyclic quadrilateral has each of its vertices at the circumference of a circle and it is completely enclosed in the circle.
I can recall and use the fact that the opposite angles in cyclic quadrilaterals add up to 1800.
I can recall and use the fact that when two tangents to a circle meet at a point outside the circle then two right-angled, congruent triangles are formed.
I can recall and use the fact that the perpendicular from the centre of the circle to a chord will always bisect the chord.
I can recall and use the fact that from the ends of a chord the angle formed at the centre is always twice the angle formed at the circumference.
I can recall and use the fact that from the ends of a chord the angles formed at the circumference in the same segment are always equal.
I can recall and use the fact that when a chord and a tangent meet and the angle is formed from the end of the chord to the circumference then the angle between the chord and tangent is equal to the angle formed in the alternate segment.
I can recall any of the above facts and any others to do with shapes and lines to solve any angle problems involving circles.
I can recall any angle facts and use these to justify and prove the solutions to any angle problems involving circles.

AQA 8300 Subject content with learning outcomes for Programme of Study Page 43 The Fernwood School
Subject content from Specification (May 2014) Basic foundation Additional foundation Higher Only
TOPIC: 14.1 TRIGONOMETRY FOR NON-RIGHT ANGLED TRIANGLES
G22 Know and apply the sine rule,
𝑎
𝑠𝑖𝑛 𝐴=
𝑏
sin𝐵=
𝑐
sin 𝐶
And cosine rule,
𝑎2 = 𝑏2 + 𝑐2 − 2𝑏𝑐𝐶𝑜𝑠𝐴 To find unknown lengths and angles G23 Know and apply
𝐴𝑟𝑒𝑎 = 1
2𝑎𝑏𝑆𝑖𝑛 𝐶
To calculate the area, sides or angles of any triangle
I know the formula to find the area of a triangle is
𝑨𝒓𝒆𝒂 = 𝟏
𝟐𝒂𝒃𝑺𝒊𝒏 𝑪
I can recognise when and how to use the formula to find the area of a triangle.
I know the formula for the Sine rule is 𝑎
𝑠𝑖𝑛 𝐴=
𝑏
sin 𝐵=
𝑐
sin 𝐶
I can recognise when and how to use the Sine rule to find missing angles or sides of a non-right angled triangle.
I know the formula for the Cosine rule is 𝑎2 = 𝑏2 + 𝑐2 − 2𝑏𝑐𝐶𝑜𝑠𝐴
I can recognise when and how to use the Cosine rule to find missing angles or sides of a non-right angled triangle.
I can decide how to apply any of these rules when solving multi-step problems involving non-right-angled triangles.
I can apply any of these rules and work with values given in surd form.
I can use any of these rules to solve problems that involve bearings.
I can use any of these rules to solve problems involving 3D shapes.
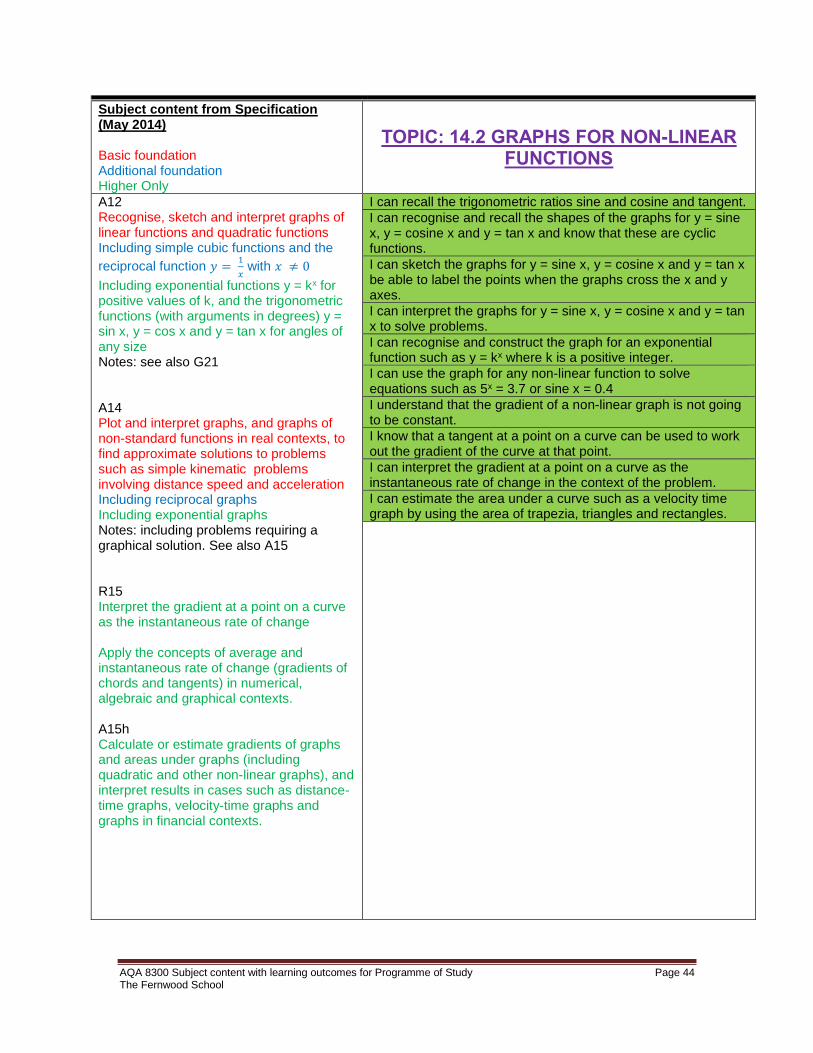
AQA 8300 Subject content with learning outcomes for Programme of Study Page 44 The Fernwood School
Subject content from Specification (May 2014) Basic foundation Additional foundation Higher Only
TOPIC: 14.2 GRAPHS FOR NON-LINEAR FUNCTIONS
A12 Recognise, sketch and interpret graphs of linear functions and quadratic functions Including simple cubic functions and the
reciprocal function 𝑦 = 1
𝑥 with 𝑥 ≠ 0
Including exponential functions y = kx for positive values of k, and the trigonometric functions (with arguments in degrees) y = sin x, y = cos x and y = tan x for angles of any size Notes: see also G21 A14 Plot and interpret graphs, and graphs of non-standard functions in real contexts, to find approximate solutions to problems such as simple kinematic problems involving distance speed and acceleration Including reciprocal graphs Including exponential graphs Notes: including problems requiring a graphical solution. See also A15 R15 Interpret the gradient at a point on a curve as the instantaneous rate of change Apply the concepts of average and instantaneous rate of change (gradients of chords and tangents) in numerical, algebraic and graphical contexts. A15h Calculate or estimate gradients of graphs and areas under graphs (including quadratic and other non-linear graphs), and interpret results in cases such as distance-time graphs, velocity-time graphs and graphs in financial contexts.
I can recall the trigonometric ratios sine and cosine and tangent.
I can recognise and recall the shapes of the graphs for y = sine x, y = cosine x and y = tan x and know that these are cyclic functions.
I can sketch the graphs for y = sine x, y = cosine x and y = tan x be able to label the points when the graphs cross the x and y axes.
I can interpret the graphs for y = sine x, y = cosine x and y = tan x to solve problems.
I can recognise and construct the graph for an exponential function such as y = kx where k is a positive integer.
I can use the graph for any non-linear function to solve equations such as 5x = 3.7 or sine x = 0.4
I understand that the gradient of a non-linear graph is not going to be constant.
I know that a tangent at a point on a curve can be used to work out the gradient of the curve at that point.
I can interpret the gradient at a point on a curve as the instantaneous rate of change in the context of the problem.
I can estimate the area under a curve such as a velocity time graph by using the area of trapezia, triangles and rectangles.

AQA 8300 Subject content with learning outcomes for Programme of Study Page 45 The Fernwood School
Subject content from Specification (May 2014) Basic foundation Additional foundation Higher Only
TOPIC: 14.3 TRANSFORMATIONS OF FUNCTIONS AND THEIR GRAPHS
A7 Interpret the reverse process as the ‘inverse function’ Interpret the succession of two functions as a ‘composite function’ Notes understanding and use of f(x), fg(x) and f-1(x) notation is expected at Higher tier A13 Sketch translations and reflections of a given function
I understand function notation 𝑓(𝑥)and that it means a function
in terms of the variable 𝑥.
I know that if a function is 𝑓(𝑥) = 3𝑥2
Then the inverse function is
𝑓−1(𝑥) = √𝑥
3
I know that when two functions are applied one after the other then a composite function can be formed.
I understand the notation for a composition function is 𝒇𝒈(𝒙) and that this means first apply function 𝑔(𝑥) then apply function 𝑓(𝑥). I know that y = f(x) means a graphical function in terms of x and can work out values for y for given values of x to construct the graph.
I can sketch or construct the graph for any linear or non-linear function.
I can work out what happens to the graph for y = f(x) when it goes through the transformation y = f(x) + a where a is a constant and be able to sketch the new graph.
I can work out what happens to the graph for y = f(x) when it goes through the transformation y = f(x + a) where a is a constant and be able to sketch the new graph.
I can work out what happens to the graph for y = f(x) when it goes through the transformation y = af(x) where a is a constant and be able to sketch the new graph.
I can work out what happens to the graph for y = f(x) when it goes through the transformation y = f(ax) where a is a constant and be able to sketch the new graph.