Embed Size (px)
Citation preview
CRANFIELD UNIVERSITY
Simon O’Reilly
FW-12 Civil Transport Airliner
Structural Design of the Forward Mid-wing Section
School of Engineering
MSc Aerospace Vehicle Design
MSc Thesis
Academic Year: 2012 - 2013
Supervisor: Dr. S. Guo
September 2012
i
CRANFIELD UNIVERSITY
College of Aeronautics
Aerospace Vehicle Design
MSc
Academic Year 2012 - 2013
Simon O’Reilly
Structural Design of Forward Section of FW-12 Aircraft Midwing
Supervisor: Dr. S. Guo
September 2012
This thesis is submitted in partial fulfilment of the requirements for
the degree of Master of Science
© Cranfield University 2012. All rights reserved. No part of this
publication may be reproduced without the written permission of the
copyright owner.
ii
Thesis health warning
This thesis covers the part of the assessment concerned with the Group
Design Project. Readers must be aware that the work contained within is not
necessarily 100% correct and caution should be exercised if the thesis or the
data it contains is being used for future work. If in doubt, please refer to the
supervisor named in the thesis, or the Department of Aerospace Technology.
iii

Abstract
This thesis describes the procedure followed in order to design the structure of the forward mid-wing section of the FW-12 aircraft which was the subject of the Group Design Project by the March Intake of the 2012 Aerospace Vehicle Design course at Cranfield University. The task was to design as light a structure as possible which could safely support the loads applied during the various flight conditions which the aircraft would experience and to conform to the airworthiness requirements as specified in EASA CS-25.
The structure is comprised of the upper and lower skin/stringer panels, 3 spars and 7 ribs. The cargo bay for the FW-12 is located within the forward mid-wing section and therefore the structure has been designed to support the loads due to the pressurisation of this area. As the wings of the FW-12 encompass the entire aircraft the structure has also been designed to support the loads that wings are typically subjected to.
Both metallic alloys and composite materials were used in order to design the structure the final mass of which is estimated at 2682.9kg. It was necessary to make numerous assumptions and approximations to design the structure due to the time constraints of the project so there is still some work to be done in order to improve the design. However the design presented in this thesis should serve as a good first iteration for the finalised design of a structure which could be manufactured and put into service on the aircraft.
iv
Acknowledgements
There are numerous people who I would to thank for their various contributions to this thesis. I would like to thank the
v

TABLE OF CONTENTS
LIST OF FIGURES............................................................................................. ixLIST OF TABLES...............................................................................................xiLIST OF EQUATIONS.......................................................................................xiiLIST OF ABBREVIATIONS...............................................................................xiv1 Introduction.......................................................................................................1
1.1 Overview....................................................................................................11.2 Project Specification..................................................................................21.3 Project Group Organisation.......................................................................31.4 Design Process Overview..........................................................................4
2 Loading Actions................................................................................................52.1 Introduction................................................................................................52.2 Aerodynamic Background Theory..............................................................52.3 Loading Analysis Theory............................................................................62.4 Elevator Load Calculations........................................................................7
2.4.1 Assumptions........................................................................................92.4.2 Steady Level Flight..............................................................................92.4.3 Steady Rotary Motion........................................................................122.4.4 Pitch Acceleration Cases..................................................................132.4.5 Loading Analysis Results..................................................................14
2.5 Further Calculations.................................................................................152.6 Critical Cases...........................................................................................162.7 Results and Discussion............................................................................19
3 Initial Structural Design..................................................................................213.1 Introduction..............................................................................................213.2 Spars and Ribs........................................................................................213.3 Forward Mid-wing Structure.....................................................................233.4 Light Frames............................................................................................263.5 Challenges resulting from pressurisation of structure.....Error! Bookmark not defined.
4 Material Selection...........................................................................................284.1 Introduction..............................................................................................284.2 Composite Materials................................................................................29
4.2.1 Introduction.......................................................................................294.2.2 Components Designed Using Composites and Materials Chosen....30
4.3 Aluminium Alloys.....................................................................................324.3.1 Introduction.......................................................................................32
vi
4.3.2 Components Designed Using Aluminium Alloy and Materials Chosen...................................................................................................................32
4.4 Use of Titanium Alloys.............................................................................345 Initial Sizing....................................................................................................36
5.1 Introduction..............................................................................................365.2 Leading Edge Thickness..........................................................................365.3 Skin Stringer Panels................................................................................375.4 Spar Sizing..............................................................................................405.5 Bulkhead Sizing.......................................................................................425.6 Rib Sizing.................................................................................................425.7 Light Frames............................................................................................43
6 Detail Design..................................................................................................456.1 Introduction..............................................................................................456.2 Skin Stringer Panel Design......................................................................45
6.2.1 Introduction.......................................................................................456.2.2 Buckling Analysis using TW Panels..................................................466.2.3 Maintenance Considerations.............................................................486.2.4 Composite Layups Chosen...............................................................506.2.5 Lightning Strike Considerations...........Error! Bookmark not defined.
6.3 Detailed Spar Design...............................................................................526.4 Bulkhead Design........................................Error! Bookmark not defined.6.5 Spar Caps................................................................................................566.6 Manufacturing Considerations.................................................................766.7 Rib Design...............................................................................................58
6.7.1 Introduction.......................................................................................586.7.2 Rib flange design..............................................................................596.7.3 Rib Webs...........................................................................................646.7.4 Rib Design Requirements.................................................................686.7.5 Cargo Bay Cutouts..............................Error! Bookmark not defined.
6.8 Heavy Rib Analysis..................................................................................706.9 Maintenance Considerations...................................................................726.10 Discussion.............................................................................................80
7 Finite Element Analysis..................................................................................837.1 Introduction..............................................................................................837.2 Skin/Stringer Panel Analysis....................................................................847.3 Pressurisation Analysis............................................................................867.4 Panel Buckling Analysis...........................................................................877.5 Full Section Model Analysis.....................................................................88
7.5.1 Meshing.............................................................................................897.5.2 Boundary Conditions and Applied Loads..........................................90
7.6 Results and Discussion............................................................................91
vii
8 Fatigue and Damage Tolerance.....................................................................978.1 Introduction..............................................................................................978.2 Component Analysed for Fatigue and Damage Tolerance......................978.3 Loading Spectrum..................................................................................1018.4 AFGROW Analysis................................................................................1038.5 Inspection Intervals................................................................................1068.6 Results and Discussion..........................................................................106
9 Aeroelasticity................................................................................................1089.1 Introduction............................................................................................108
9.1.1 Static Aeroelastic Phenomena........................................................1089.2 Torsional Divergence.............................................................................1099.3 Discussion.............................................................................................110
10 Project Management & Interface Issues Control........................................11111 Mass Estimation.........................................................................................11512 Results............................................................Error! Bookmark not defined.13 Discussion......................................................Error! Bookmark not defined.14 Conclusion..................................................................................................11915 Airworthiness Requirements Section:.........................................................11816 Bibliography................................................................................................12617 Appendices.................................................................................................129
Appendix A Loading Actions........................................................................129Appendix B - Initial Sizing Appendix............................................................134Appendix C Rib Analysis using Strand7......................................................137Appendix D CoALA Results.........................................................................140Appendix E Detail Stressing........................................................................144
viii
LIST OF FIGURES
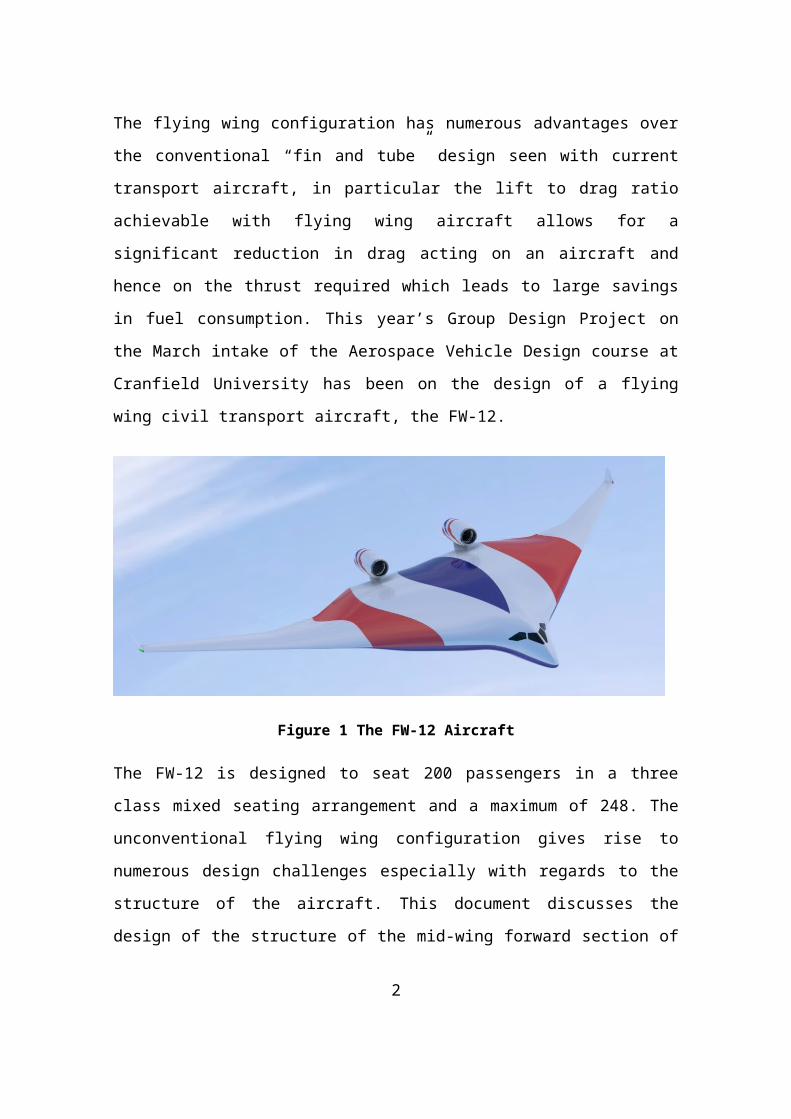
Figure 1 The FW-12 Aircraft................................................................................2
Figure 2 Control Devices on FW-12....................................................................8
Figure 3 Moment Balance on Aircraft in Trim (1).................................................9
Figure 4 Shear Force Envelope (7)...................................................................17
Figure 5 Bending Moment Envelope (7)............................................................18
Figure 6 Torque Envelope (7)...........................................................................18
Figure 7 Changes made to FW-12 Planform. Left - Conceptual Design Stage. Right - Final Design....................................................................................23
Figure 8 Plan view of FW-12 aircraft showing boundaries of the forward mid-wing section...............................................................................................24
Figure 9 Finalised Upper Panel Sizing Data from TW Panels...........................47
Figure 10 Third Spar Geometry...........................Error! Bookmark not defined.
Figure 11 Pressurised Skin Section and Equivalent Cylinder............................60
Figure 12 Rib/Skin Connection Geometry.........................................................63
Figure 13 Light Rib Chordwise Shear Force Distribution..................................67
Figure 14 Light Rib Chordwise Bending Moment Distribution...........................67
Figure 15 Loads applied to heavy rib Strand7 model........................................71
Figure 16 Lower Skin Panel Showing Maintenance Hatch Holes......................73
Figure 17 Skin/Stringer Panel Modelled in PATRAN/NASTRAN.......................85
Figure 18 Stringer Cross Section Applied to FEA Panel Model.........................86
Figure 19 Simulation of pressure loading on skin/stringer panel.......................87
Figure 20 CATIA Model used in FEA Analysis..................................................89
Figure 21 Boundary Conditions applied to FEA Model......................................91
Figure 22 FEA Pressurisation Analysis Results................................................92
Figure 23 Deflection of full section FEA model..................................................94
Figure 24 Stress Tensor Field of entire section FEA model..............................95
ix
Figure 25 Loading of lug modelled using AFGROW.......................................100
Figure 26: Lug Dimensions for AFGROW Simulation.....................................104
Figure 27 Relationship between divergence speed and sweep angle (28).....109
Figure 28 Project Management Team Hierarchy.............................................111
Figure 29 Planform of the FW-12 before (left) and after (right) the redesign of the trailing edge........................................................................................112
Figure 30: Forward Mid-Wing Mass Breakdown.............................................116
Figure 31 Variation of Leading Edge Thickness due to bird-strike requirement.................................................................................................................135
Figure 32 Geometry of Light Rib Model in Strand 7........................................138
Figure 33 Loads and Boundary Conditions on Strand7 Model........................138
Figure 34 Shear Force Distribution..................................................................139
Figure 35 Bending Moment Distribution..........................................................139
x
LIST OF TABLES
Table 1 Aerodynamic Coefficients for Outer Elevators......................................11
Table 2 Aerodynamic Coefficients for Inner Elevators......................................11
Table 3 Results for most critical aircraft loading cases.....................................14
Table 4 Most critical elevator load case............................................................15
Table 5 CFRP Material Properties (9)...............................................................31
Table 6 Al 2099 T-83 Material Properties (11)..................................................34
Table 7 Ply Layups for Skin/Stringer Panels.....................................................51
Table 8 1g Flight Cases Considered for Fatigue Loading.................................98
Table 9 Divergence Velocity Results...............................................................110
Table 10 Variation of Aerodynamic Centre Location with Mach number.....Error! Bookmark not defined.
xi
LIST OF EQUATIONS
Mtrim=Mlift−Mengine−M 0−MdragEquation 1................................................10
ηSLF=ZT 12 ρ0VEAS 2SCLηEquation 2..............................................................11
R1=12a1−mθcky 2Equation 3...........................................................................12
J 1=2Ma1cHmρSky2−R1212Equation 4...........................................................12
ηss=4m 2cHmn−1 gρSkyV 02δ Equation 5...................................12
δ=−a2 μ2(cky )2lηc−mθμ1Equation 6...............................................................12
ηss=−2mHmn−1 ga2 ρSV 02 lηc−mθμ 1 Equation 7....................................12
LηSS=−mHmcn−1 glη−cmθμ1 Equation 8..................................13
ZTα=MSTSn−1ga1Ta1−δϵδα1−H 0−hcl ' T+a12 μ Equation 9..................13
ZTo=−MHmcn−1g Σ Hm−a1T 2 μSTSH 0−hl ' THo−hcl ' T−1 Equation 10...............................................................................................................13
ZT=ZTo+ZTα Equation 11........................................................................13
t=0 .02 .VM .m 13 . fMaterial .cos 2/3θ exp (1230 r 2+30 r+1000) Equation 12...............................................................................................................36
P=Mh Equation 13...................................................................................38
σb=AFbPWL Equation 14.........................................................................38
te=Mwhσb Equation 15.............................................................................38
tb=0 .65Mwhσb Equation 16......................................................................38
tq=T 2∗A∗σs Equation 17.........................................................................39
tθ=mθ 4∗G 00 .7bPrA2dl Equation 18.......................................................40
Vi=Vhi21 jhj2 Equation 19.........................................................................41
σs=QVi+QTti Equation 20........................................................................42
F=BMulthavg Equation 21...............................................................47
Apanel=Askin+Astringers , σavg=FApanelEquation 22.......................................48
VDIV=1 .3142∗mθρ∗e∗c2∗a1∗s Equation 23..................................109
xii

xiii
LIST OF ABBREVIATIONS
a1
a2
c
g
H 0
Lift curve slope due to incidence
Lift curve slope due to control deflection
Mean chord of lifting surface
Acceleration due to gravity
Location of Aerodynamic Centre as a fraction of mean chord from
LE
xiv
1 Introduction
1.1 Overview
Over the past century or so innovations in aircraft design have brought
consistent improvements to the performance of aircraft in terms of their velocity,
fuel consumption, noise, cost, passenger comfort and environmental impact to
name but a few areas. However, broadly speaking the trend in the design of
civil transport aircraft has led to a configuration consisting of a tubular fuselage
with a wing approximately halfway along the length of this tube and a tail-plane
towards the back of the aircraft for stabilising the vehicle. This design has been
incrementally enhanced and these developments have all resulted in a gradual
improvement in the performance. Now however the design has been refined to
the point that the returns on the cost of developing, testing and implementing
these improvements are diminishing. To exacerbate the situation, new targets
have been set by the International Civil Aircraft Organisation (ICAO) for the
years 2020 and 2050 which demand further significant improvements in the
performance of these aircraft with respect to their greenhouse gas and noise
emissions as well as their fuel consumption. For these reasons, amongst
others, there has been renewed interest in the development of flying wing civil
transport aircraft.
The flying wing configuration has numerous advantages over the conventional
“fin and tube” design seen with current transport aircraft, in particular the lift to
drag ratio achievable with flying wing aircraft allows for a significant reduction in
drag acting on an aircraft and hence on the thrust required which leads to large
savings in fuel consumption. This year’s Group Design Project on the March
intake of the Aerospace Vehicle Design course at Cranfield University has been
on the design of a flying wing civil transport aircraft, the FW-12.
1
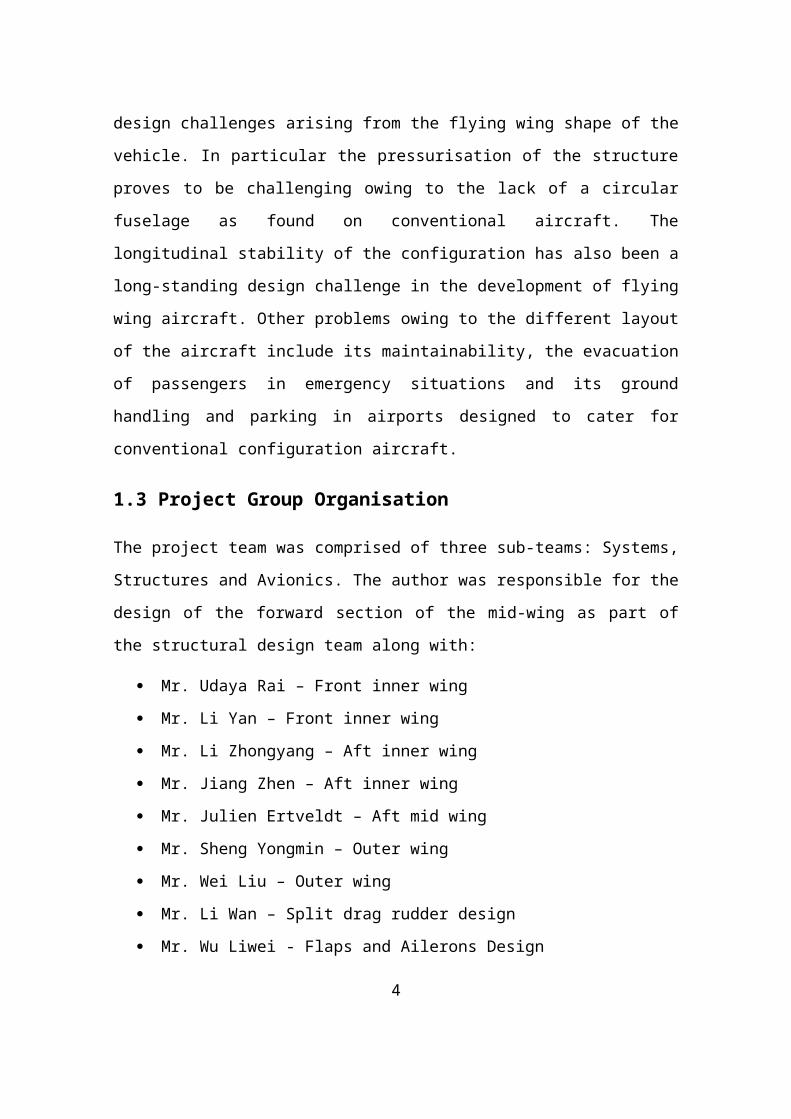
Figure 1 The FW-12 Aircraft
The FW-12 is designed to seat 200 passengers in a three class mixed seating
arrangement and a maximum of 248. The unconventional flying wing
configuration gives rise to numerous design challenges especially with regards
to the structure of the aircraft. This document discusses the design of the
structure of the mid-wing forward section of the aircraft and covers the work
done by the author throughout the course of the project. The thesis discusses
the loading analysis carried out, the structural layout decided upon by the
structures sub-team, the initial and detailed sizing of the various structural
components in the section, the finite element analysis conducted as part of the
study and the fatigue analysis carried out as well as the work done as part of
the secondary task of interface issues control management.
1.2 Project Specification
The project built upon the conceptual design work done the previous year by a
group of students supervised by Prof. Howard Smith (1). This provided the
mission and payload requirements for the aircraft, which are summarised below:
A capacity of 200 passengers in a three class configuration up to a
maximum capacity of 248 passengers in an all economy configuration
A mission range of 7500nm at a cruise velocity of Mach 0.82
A maximum takeoff weight (MTOW) of 176,469kg
2
A design life of 10000 flights or 80000 flight hours
While there are some very appealing advantages to flying wing aircraft the
concept is not without its drawbacks. In terms of the structure of the aircraft
there are numerous design challenges arising from the flying wing shape of the
vehicle. In particular the pressurisation of the structure proves to be challenging
owing to the lack of a circular fuselage as found on conventional aircraft. The
longitudinal stability of the configuration has also been a long-standing design
challenge in the development of flying wing aircraft. Other problems owing to
the different layout of the aircraft include its maintainability, the evacuation of
passengers in emergency situations and its ground handling and parking in
airports designed to cater for conventional configuration aircraft.
1.3 Project Group Organisation
The project team was comprised of three sub-teams: Systems, Structures and
Avionics. The author was responsible for the design of the forward section of
the mid-wing as part of the structural design team along with:
Mr. Udaya Rai – Front inner wing
Mr. Li Yan – Front inner wing
Mr. Li Zhongyang – Aft inner wing
Mr. Jiang Zhen – Aft inner wing
Mr. Julien Ertveldt – Aft mid wing
Mr. Sheng Yongmin – Outer wing
Mr. Wei Liu – Outer wing
Mr. Li Wan – Split drag rudder design
Mr. Wu Liwei - Flaps and Ailerons Design
Mr Yang Kun – Slats design
Mr. Gokhan Soylen – Elevator Design
Mr Liu Yi – Fin design
1.4 Design Process Overview
3
To being the process of designing the structure of the FW-12 the loads which
would be applied to the aircraft needed to be calculated. To determine these
loads the structures team was divided into numerous sub-groups, each one
responsible for determining the forces applied to the aircraft in a particular
scenario as specified in the airworthiness requirements detailed in CS-25 (2).
The structure was then designed to meet these requirements under these
applied loads while aiming to keep its mass as low as possible. In order to do
this, materials were carefully selected based on the desired mechanical
properties while consideration was given to their cost and then the lowest
possible thicknesses which would support the loads were used for the design.
Finite element analysis was then carried out on models representing the
components in order to compare the results with those calculated both by hand
and using computational tools such as Microsoft Excel. 3D models of the
components were also developed using CATIA which allowed for visualisation
of the aircraft. The design process involved constant liaising with the other
designers on the GDP team to ensure that all the systems and structures of the
aircraft would function together as effectively as possible.
4

2 Loading Actions
2.1 Introduction
The first step in the design of the aircraft’s structure was to determine the loads
which it would be expected to support. Accomplishing this task required a great
deal of work and the structures team was divided into various sub-teams, each
of which was responsible for calculating certain required data. The author was
placed in the Symmetrical Loading Team and given the task of determining the
loads encountered during Elevator Pitch Cases (3). This included the forces
required from either set of elevators in order to trim the aircraft in steady level
flight as well as those required to perform the pitching manoeuvres that are
specified in CS-25 requirements.
2.2 Aerodynamic Background Theory
The task of keeping a flying wing aircraft longitudinally stable has been one of
the main obstructions to their introduction into use as civil transport aircraft. The
tailless configuration of this class of aircraft usually gives them an inherent
instability and the movement of the vehicle’s centre of gravity can have a more
serious effect than in conventional aircraft. The longitudinal stability of the FW-
12 is provided for using the two sets of elevator control devices on the trailing
edge of the aircraft. As is the case for conventional aircraft, the need for
longitudinal stability control surfaces arises from the imbalance of moments
acting on the aircraft. The elevators are control devices whose primary purpose
is to provide a suitable force to balance these moments and hence keep the
aircraft stable.
The motion of an aerofoil body through a fluid causes an uneven pressure
distribution to form across the aerofoil’s surface. The pressure differences from
this result in a net force acting on the body. The lift force is the term given to the
component of this aerodynamic force that acts perpendicular to the aerofoil’s
motion. The lift is taken to act through the aerodynamic centre of the aerofoil
5
along with a pitching moment acting on the body. The centre of gravity of the
aerofoil does not usually lie on the line of action of this force and therefore, a
moment is produced. The component of the aerodynamic force which acts
along the direction of the aerofoil’s motion is referred to as the drag force and
similarly the centre of gravity will not necessarily lie on this force’s line of action
and thus resulting in a moment. Finally, if the thrust force provided by the
engines does not act through the centre of gravity, a moment will result. The
sum of these moments will have the effect of causing the aircraft to rotate as it
passes through the air. To prevent this from occurring, a force is applied to the
aircraft by the elevator which causes the net moment on the aircraft to be zero,
hence keeping it in stable flight. The purpose of the author’s work during the
loading actions phase of the GDP was to determine the forces required from the
elevator to balance the moments acting on the aircraft under various different
phases of flight as well as the force required for non-steady level flight where
the elevator is used to impart a net moment on the vehicle and thus rotate it as
desired (4).
2.3 Loading Analysis Theory
The analysis of the loading on the aircraft elevators initially proved difficult due
to its unusual layout. As so few flying wing aircraft have been designed there
was a distinct lack of reference literature when compared to that available for
performing similar calculations for a conventional aircraft. The typical equations
used are often simplified based on assumptions which, while valid for a typical
aircraft, may not be valid for a tailless vehicle. So using both the lecture notes
provided by Prof. Howard Smith (5) and the theory outlined in “Aircraft Loading
and Structural Layout” by Denis Howe (6) the equations governing the
longitudinal stability of aircraft were re-examined and any assumptions were
checked to confirm whether or not the equations were applicable to the FW-12
and its flying wing configuration.
6
There were three distinct flight scenarios which needed to be examined to
determine the worst possible loading case the elevators could encounter in
service. These were; steady level flight, steady rotary motion and pitching
acceleration cases. However within each of these cases a number of flight
parameters can be varied such as the altitude the aircraft is flying at, the mass
of the aircraft during flight or the velocity at which it is flying and so an infinite
number of possible loading scenarios exist. The author, along with the other
team members assigned to calculate the data concerning the elevator pitch
cases; Mr. Gökhan Söylen, Mr. Udaya Rai and Mr. Julien Ertveldt, collectively
decided that it would be useful to construct the Microsoft Excel program used to
calculate the loads in such a way that each variable could be adjusted
parametrically and thus the load applied to the elevators could be calculated for
any loading case. Once the programme was constructed the results
corresponding to some datum altitudes and velocities were tabulated so that the
loads on the elevators could be easily interpreted.
The specific load cases were taken from the CS-25 requirements (2) related to
the longitudinal stabilisation of aircraft, namely those listed in CS 25.321 “Flight
Loads” and 25.331 Symmetric Manoeuvring Conditions”. The goal of performing
these calculations was to use the results in the next phase of the detailed
structural design of the aircraft.
2.4 Elevator Load Calculations
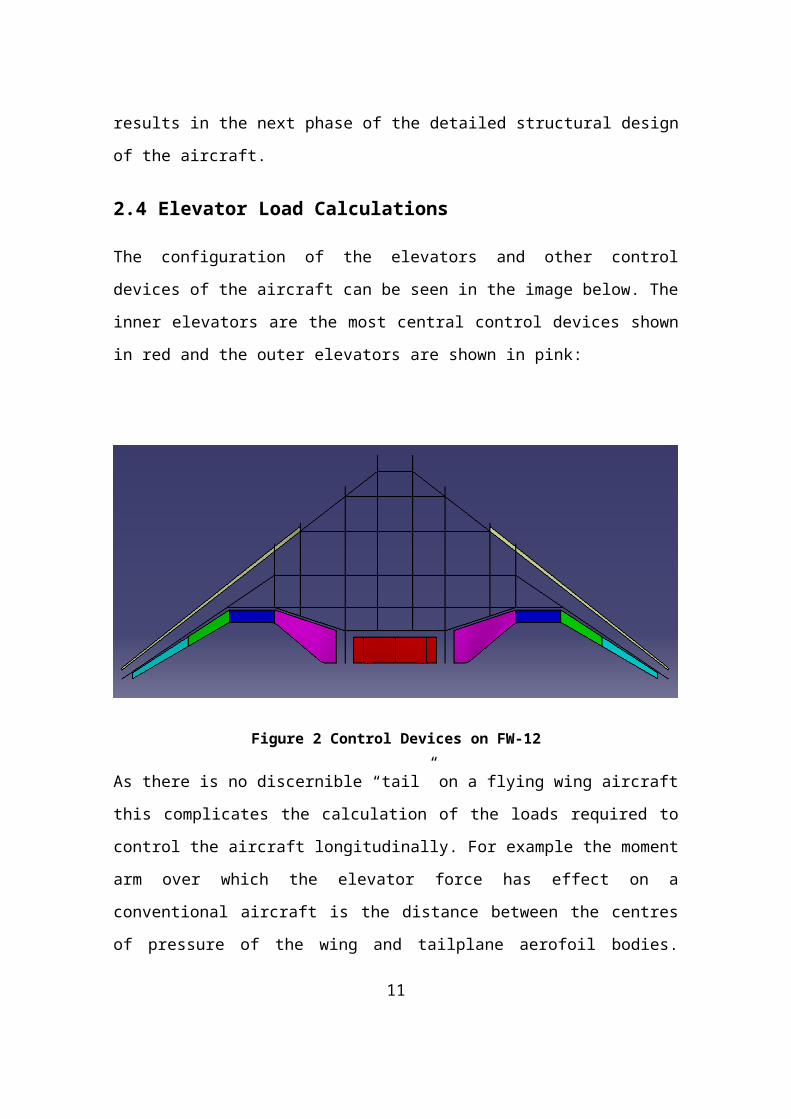
The configuration of the elevators and other control devices of the aircraft can
be seen in the image below. The inner elevators are the most central control
devices shown in red and the outer elevators are shown in pink:
7

Figure 2 Control Devices on FW-12
As there is no discernible “tail” on a flying wing aircraft this complicates the
calculation of the loads required to control the aircraft longitudinally. For
example the moment arm over which the elevator force has effect on a
conventional aircraft is the distance between the centres of pressure of the wing
and tailplane aerofoil bodies. However, with a flying wing configuration the
effect of deploying the elevator is more akin to moving the overall centre of
pressure of the entire aircraft body from its chordwise position at zero elevator
deflection. As a result of physical differences such as this, a number of
equations used for various pitching conditions, many of which are semi-
empirical and derived from tests performed using tailed aircraft, were not
applicable to the FW-12. This had implications when calculating the unchecked
pitching manoeuvres and prevented the calculation of the loads experienced
during checked manoeuvres. In Prof. Howe’s book it is stated that the equations
outlined for calculation of checked pitch manoeuvres are “not applicable to a
tailless aircraft configuration since the semi-empirical relationships were derived
for conventional aircraft. A simulator investigation is really required for this class
of aircraft”. Due to time constraints, constructing such a simulation was not
possible and it was decided that only the unchecked pitch manoeuvres would
be considered. This decision was presented at a weekly GDP meeting and
agreed upon by the staff and team members in attendance. In the following
8
sections the calculations performed to determine the forces encountered when
the aircraft performs symmetric manoeuvres are discussed and a worked
example of the calculations can be found in Appendix A.
2.4.1 Assumptions
The following assumptions were made during the loading analysis:
The airframe is a rigid body and the velocities are constant
The aircraft is not accelerating along its longitudinal axis
For initial calculation trim is assumed to be horizontal
In gust cases the aircraft’s velocity as well as its altitude remain constant
and no action is taken by the pilot via the controls
2.4.2 Steady Level Flight
The load required from the elevator in steady level flight was determined by
considering the loads acting on the aircraft in this state. These are shown
graphically below:
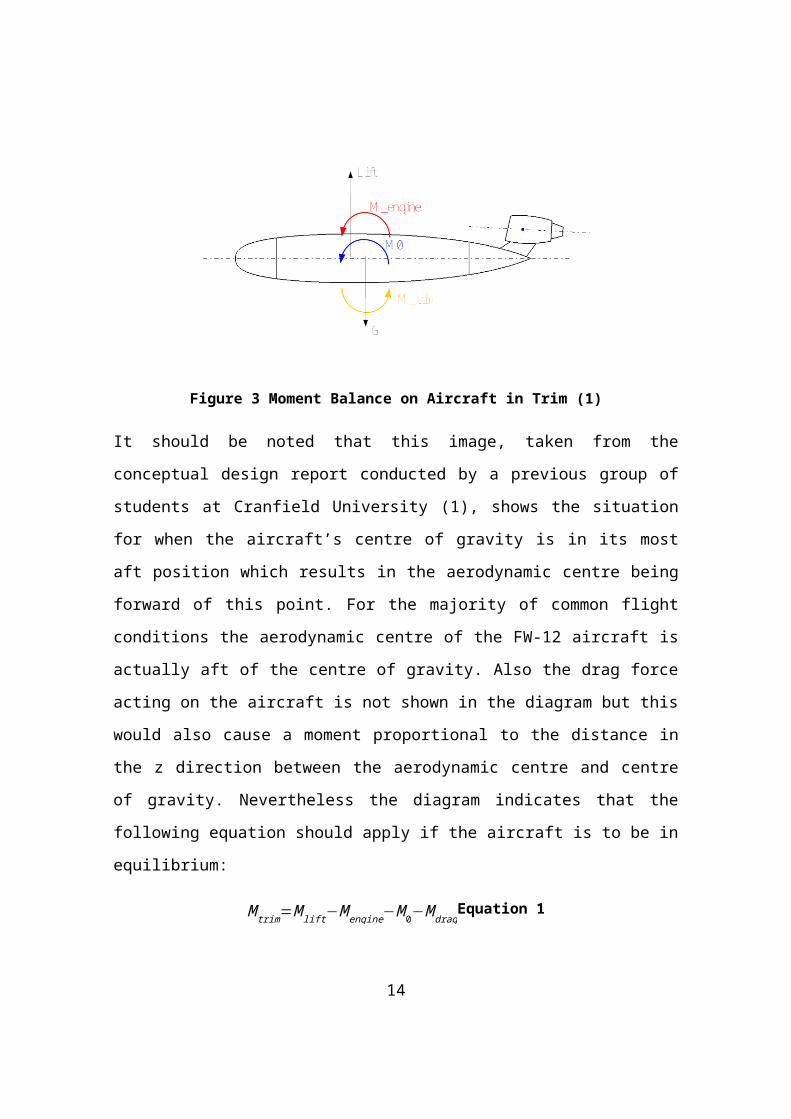
Figure 3 Moment Balance on Aircraft in Trim (1)
9
It should be noted that this image, taken from the conceptual design report
conducted by a previous group of students at Cranfield University (1), shows
the situation for when the aircraft’s centre of gravity is in its most aft position
which results in the aerodynamic centre being forward of this point. For the
majority of common flight conditions the aerodynamic centre of the FW-12
aircraft is actually aft of the centre of gravity. Also the drag force acting on the
aircraft is not shown in the diagram but this would also cause a moment
proportional to the distance in the z direction between the aerodynamic centre
and centre of gravity. Nevertheless the diagram indicates that the following
equation should apply if the aircraft is to be in equilibrium:
M trim=M lift−M engine−M 0−M dragEquation 1
Where M lift is the moment due to the lift force and equal to the magnitude of the
lift force multiplied by the distance between the aerodynamic centre and the
centre of gravity and M dragis the moment due to the drag force and the distance
from its line of action to the centre of gravity.
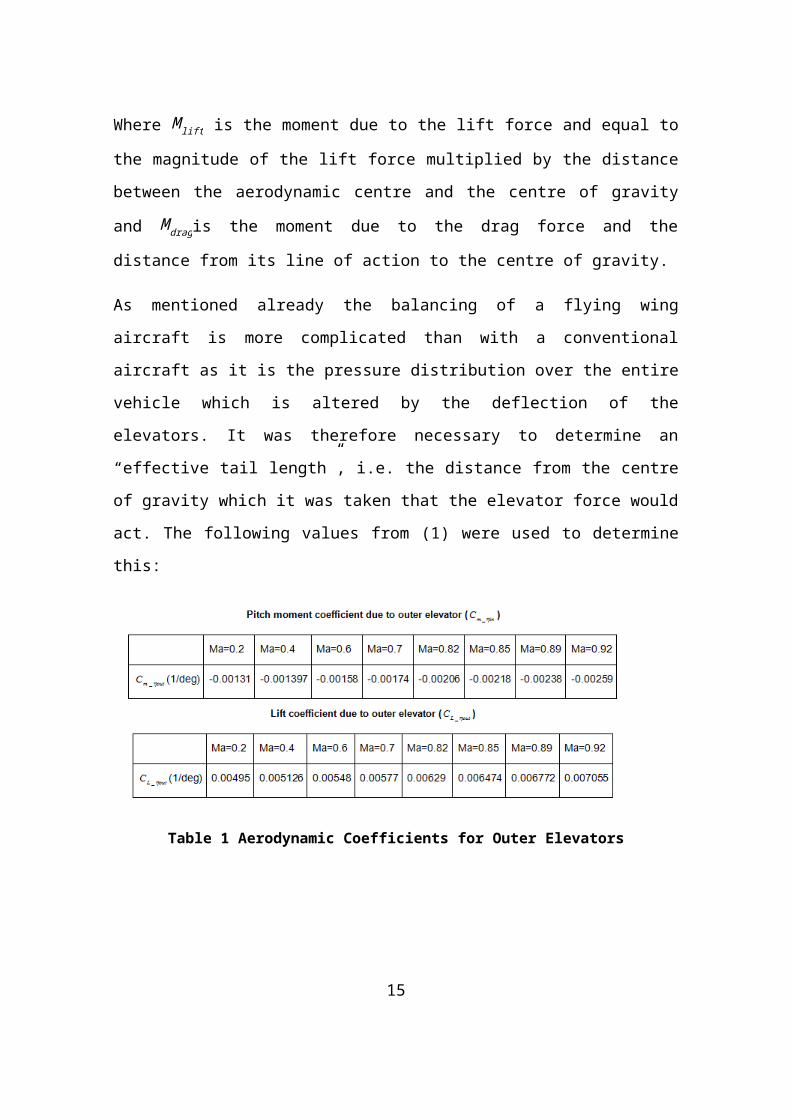
As mentioned already the balancing of a flying wing aircraft is more complicated
than with a conventional aircraft as it is the pressure distribution over the entire
vehicle which is altered by the deflection of the elevators. It was therefore
necessary to determine an “effective tail length”, i.e. the distance from the
centre of gravity which it was taken that the elevator force would act. The
following values from (1) were used to determine this:
10

Table 1 Aerodynamic Coefficients for Outer Elevators
Table 2 Aerodynamic Coefficients for Inner Elevators
By dividing the pitch moment coefficient by the lift moment coefficient the
effective tail arm could be determined at a given Mach number. Once this value
was determined, the force required from the elevator in order to apply the
required moment to the aircraft could be determined. Once the force provided
by the elevator had been calculated, the deflection angle required to produce
this force could be found using the following formula:
ηSLF=ZT
12ρ0V EAS
2 SCL¿ ηEquation 2
11
Where CL¿η is the value of the elevator lift-curve slope for a particular Mach
number as shown in Tables 1 and 2 above.
Determining the moment required to trim the aircraft was the most complicated
part of these calculations; the method for doing so is demonstrated in Appendix
B.1.
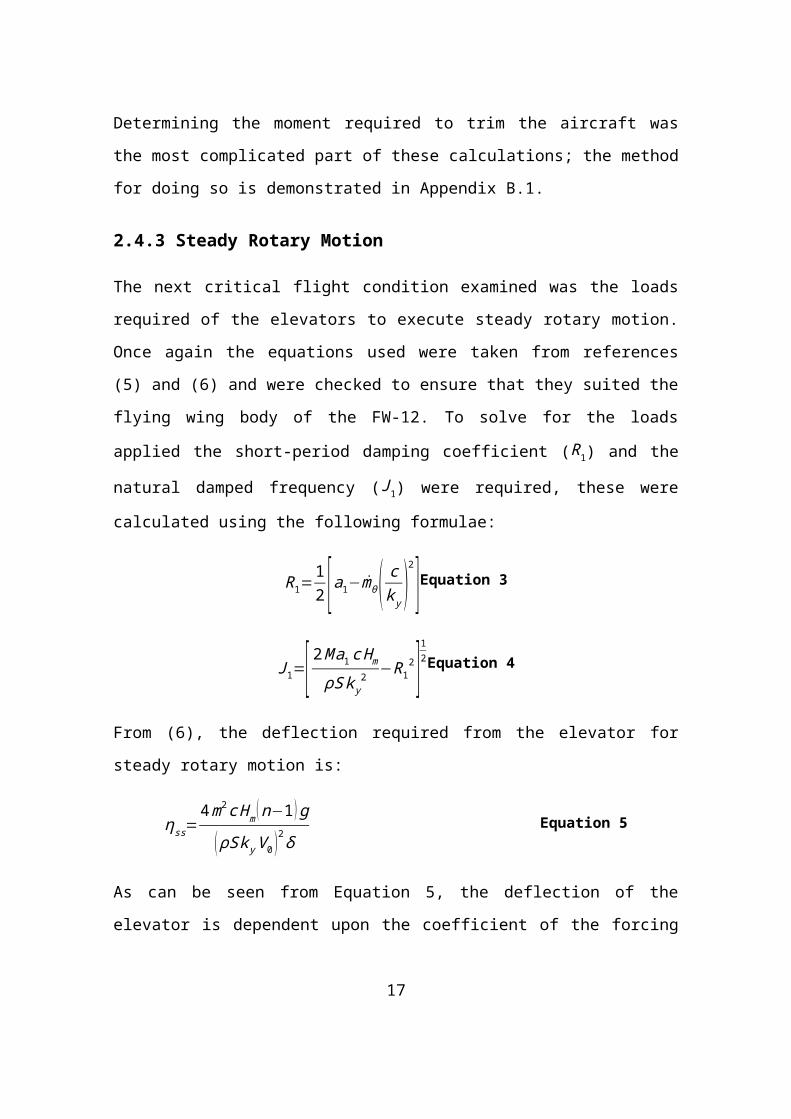
2.4.3 Steady Rotary Motion
The next critical flight condition examined was the loads required of the
elevators to execute steady rotary motion. Once again the equations used were
taken from references (5) and (6) and were checked to ensure that they suited
the flying wing body of the FW-12. To solve for the loads applied the short-
period damping coefficient (R1) and the natural damped frequency (J1) were
required, these were calculated using the following formulae:
R1=12 [a1−mθ( c
k y)2]Equation 3
J1=[ 2M a1c Hm
ρS k y2 −R1
2]12Equation 4
From (6), the deflection required from the elevator for steady rotary motion is:
ηss=4m2 c Hm (n−1 )g
( ρS k yV 0 )2δ Equation 5
As can be seen from Equation 5, the deflection of the elevator is dependent
upon the coefficient of the forcing function (δ). For a tailless configuration such
as the FW-12, this function is given as:
δ=−a2μ2(ck y
)2[( lηc )−mθ
μ1 ]Equation 6
From this it follows that ηss can be calculated as follows:
12
ηss=−2mHm (n−1 )g
a2ρSV 02( lηc −
mθ
μ1 ) Equation 7
This equation was solved using Excel and the increment in the elevator due to
the control deflection was calculated according to the following formula:
LηSS=−mHmc (n−1 )g
l η−cmθ
μ1
Equation 8
2.4.4 Pitch Acceleration Cases
The final set of loading actions analysed was when the aircraft’s angular
velocity about its centre of gravity was changed. This form of motion involves
additional forces owing to the inertia of the aircraft structure. There are two
types of control which can be applied in pitch acceleration cases, checked and
unchecked control. As explained above, it is expressly stated in (6) that the
equations given for checked control acceleration cases are not valid for tailless
aircraft as they are semi-empirical and the values used have been gathered
from experiments using conventional configuration aircraft. As a result, only the
unchecked calculations are presented here.
A step control input is investigated for the pitch acceleration case as per
CS25.334, the tailplane incidence load corresponding to such an input is given
by:
ZTα=MST
S(n−1 ) g
a1Ta [ (1− δϵ
δα )1−(H 0−h ) c
l 'T
+a12μ ] Equation 9
Z¿=−MH mc (n−1 )g Σ [Hm−
a1T2μ
ST
S(H 0−h )]
l 'T [(H o−h ) cl ' T
−1] Equation 10
13
Therefore the total tail load to perform the manoeuvre is:
ZT=Z¿+ZTα Equation 11
Some of the equations used by Howe in the derivation of the above expressions
are empirical in nature and based on data obtained from tests using
conventional aircraft. As such, the results may not be completely valid for the
FW-12 however they are accurate enough for the purposes of the GDP loading
calculations. In industry, more often than not, all of the loading calculations
discussed in this section would be based on more accurate data from more
advanced methods of determining the loads applied to the aircraft. These may
include wind-tunnel tests, finite element simulations and the use of
computational fluid dynamics.
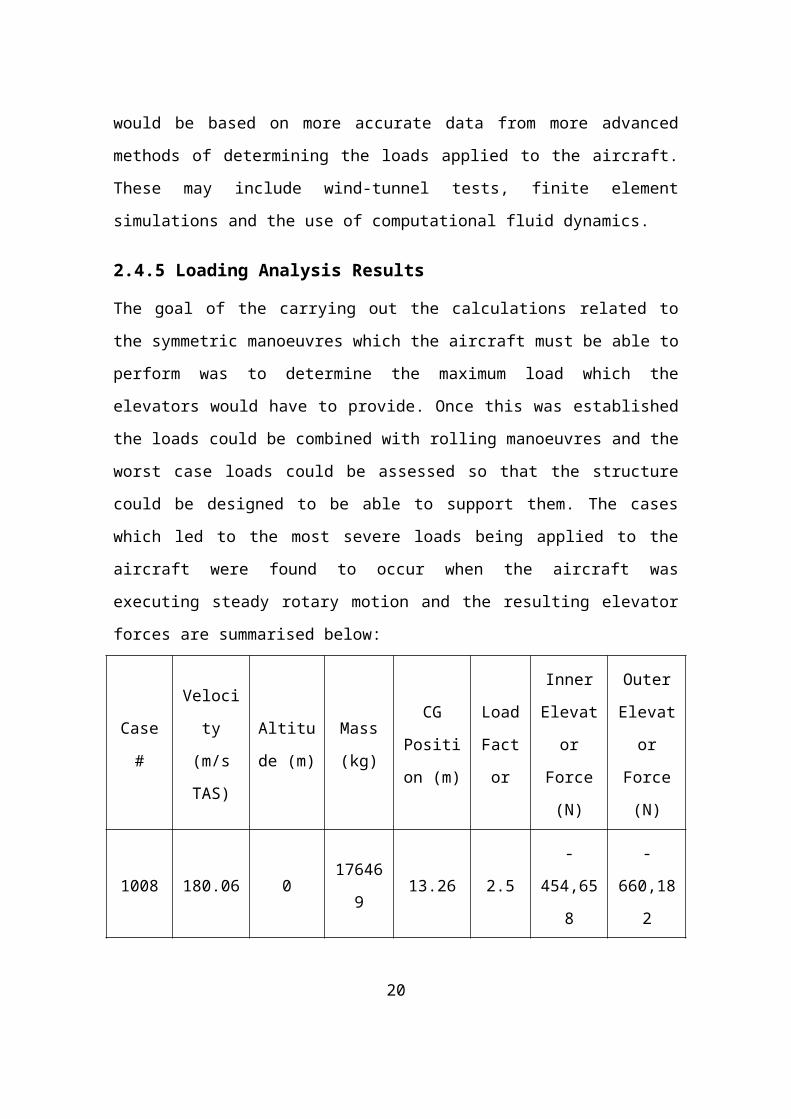
2.4.5 Loading Analysis Results
The goal of the carrying out the calculations related to the symmetric
manoeuvres which the aircraft must be able to perform was to determine the
maximum load which the elevators would have to provide. Once this was
established the loads could be combined with rolling manoeuvres and the worst
case loads could be assessed so that the structure could be designed to be
able to support them. The cases which led to the most severe loads being
applied to the aircraft were found to occur when the aircraft was executing
steady rotary motion and the resulting elevator forces are summarised below:
Case #
Velocity
(m/s
TAS)
Altitude
(m)
Mass
(kg)
CG
Position
(m)
Load
Factor
Inner
Elevator
Force
(N)
Outer
Elevator
Force
(N)
1008 180.06 0 176469 13.26 2.5 -454,658 -660,182
1007 144.06 0 176469 13.26 2.5 -499,907 -727,549
1016 278.94 10668 176469 13.26 2.5 -568.925 -838,455
14
Table 3 Results for most critical aircraft loading cases
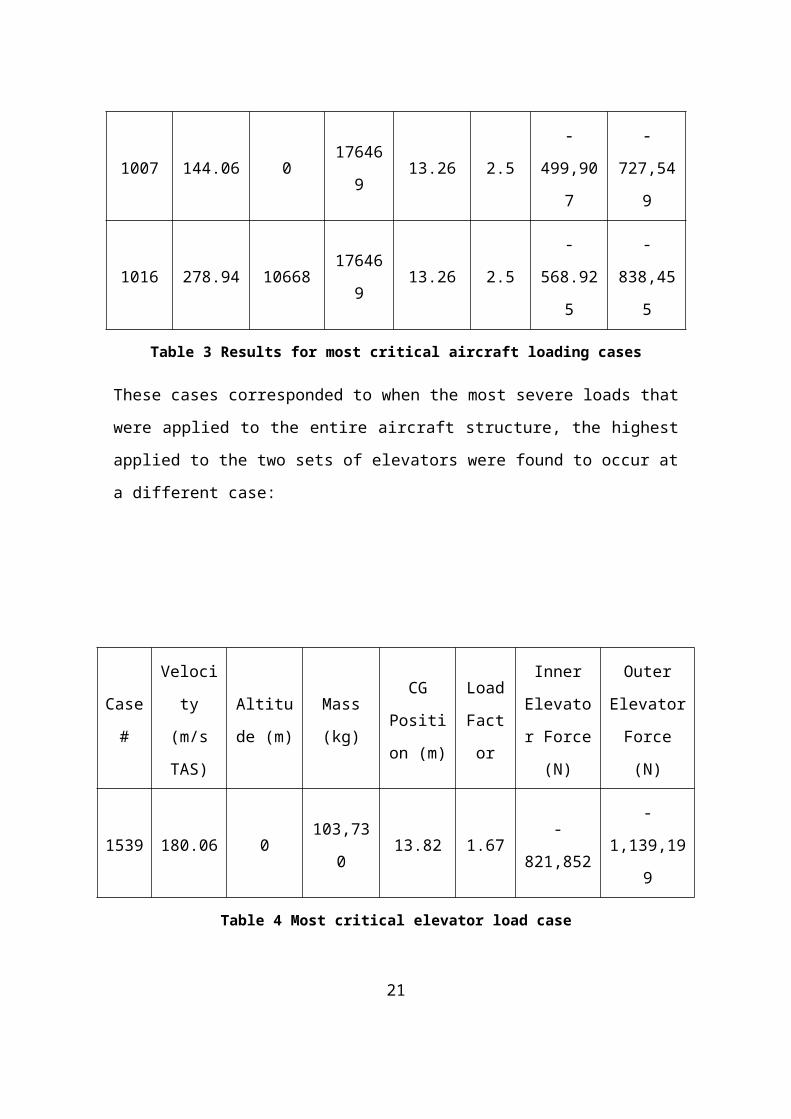
These cases corresponded to when the most severe loads that were applied to
the entire aircraft structure, the highest applied to the two sets of elevators were
found to occur at a different case:
Case
#
Velocity
(m/s
TAS)
Altitude
(m)
Mass
(kg)
CG
Position
(m)
Load
Factor
Inner
Elevator
Force (N)
Outer
Elevator
Force (N)
1539 180.06 0 103,730 13.82 1.67 -821,852 -1,139,199
Table 4 Most critical elevator load case
2.5 Further Calculations
After the calculation of the symmetric load cases along with other loading
analysis tasks had been completed there was still a considerable delay in
producing some of the data required to proceed to the next stage of the design
process. In particular the calculation of the chordwise and spanwise load
distributions were severely delayed which prevented further design work from
going ahead as the loads that each section of the aircraft would be subjected to
were unknown.
This issue was raised several times during the weekly GDP meetings, in
particular by Mr. Julien Ertveldt. Eventually Mr. Ertveldt resolved to calculate the
distributions himself despite never being assigned to this task, had this not been
done the project would likely have been so delayed that it would not have been
possible to complete it in time. The author offered to assist Mr. Ertveldt in
determining these load distributions and so began by calculating the mass
distribution required in order to finalise the spanwise load distribution. The mass
15
distributions given by the previous year were found to contain numerous errors.
In particular the structural mass was incorrectly taken to be distributed evenly
along the chord, this would obviously not be the case as the span of the aircraft,
and therefore the width of the structure, would vary in the chordwise direction
from 0m at the nose of the aircraft to 64m at the wing tips. The author corrected
this distribution by considering the planform area of the aircraft and using its
variation to calculate a weighting factor so that the mass of the structure could
be distributed appropriately.
Once this was done the inertial loads could be added to the aerodynamic loads
that the surface of the aircraft was subjected to and the resulting distribution of
the net loads could be produced. Using this distribution the shear force diagram
was obtained by Mr. Ertveldt by integration of the distribution along the half
span of the aircraft. The bending moment diagram was then produced by
integrating the shear force distribution; again this work was performed by Mr.
Ertveldt.
The author then began work on calculating the chordwise load distribution as
this data was also needed to design the structure of the aircraft but had not
been produced. However, this proved much more difficult than expected mainly
owing to the 6 spar configuration of the FW-12. Eventually this work was
abandoned as work needed to begin on designing the structure and enough
time had been spent trying to perform calculations which other members of the
structures team were responsible for.
The author assisted Mr. Ertveldt by calculating the corrected spanwise mass
distribution and with troubleshooting the MATLAB code used to determine the
shear force, bending moment and torque diagrams which were subsequently
compiled into the loading envelopes. However the majority of the work was
carried out by Mr. Ertveldt and was done voluntarily when the members of the
structures team who had originally been assigned to complete this task failed to
do so which caused considerable delays to the project. In light of this he should
16
be rewarded well for this work as, had it not been done, the project would have
produced much poorer results.
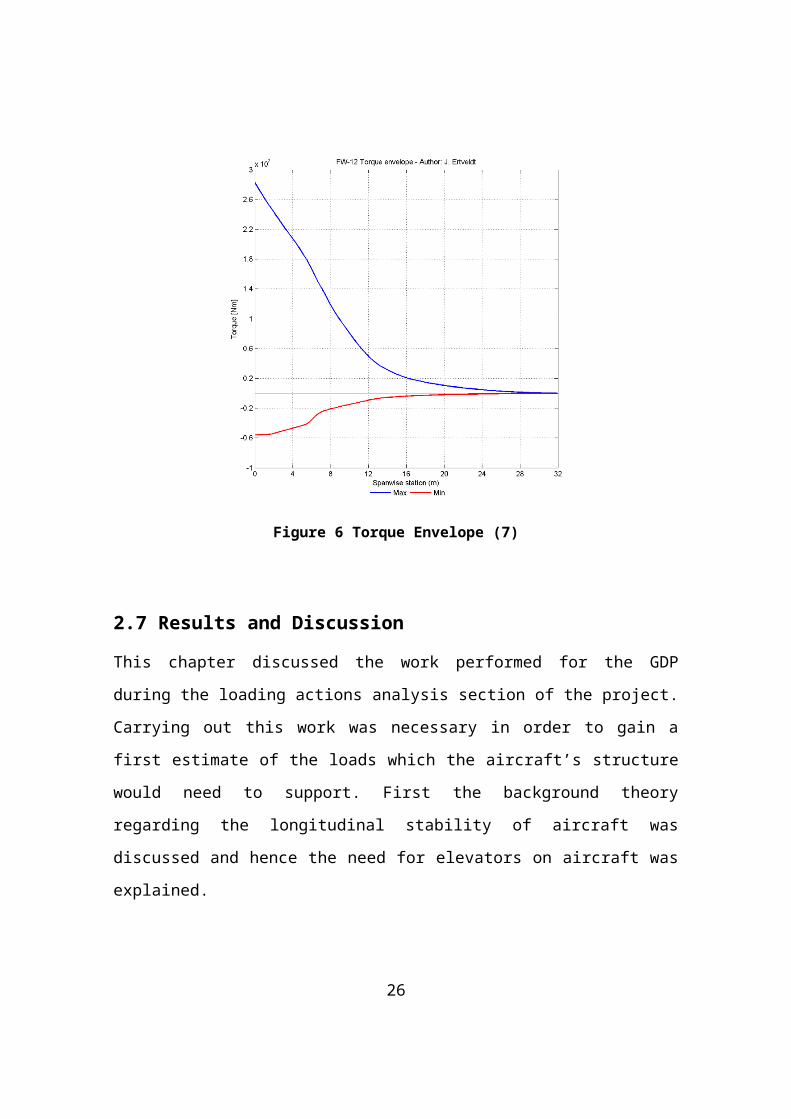
2.6 Critical Cases
After the loading actions had been completed the loads encountered during
various manoeuvres considered were combined as per the requirements of
CS25. The most severe case for each section of the aircraft was determined
and these were collected so that the loading envelopes for the aircraft were
obtained. As these plotted the worst case values for shear force, bending
moment and torque, which the structure must be able to survive under, they
were used in the subsequent design of the various components. Below are the
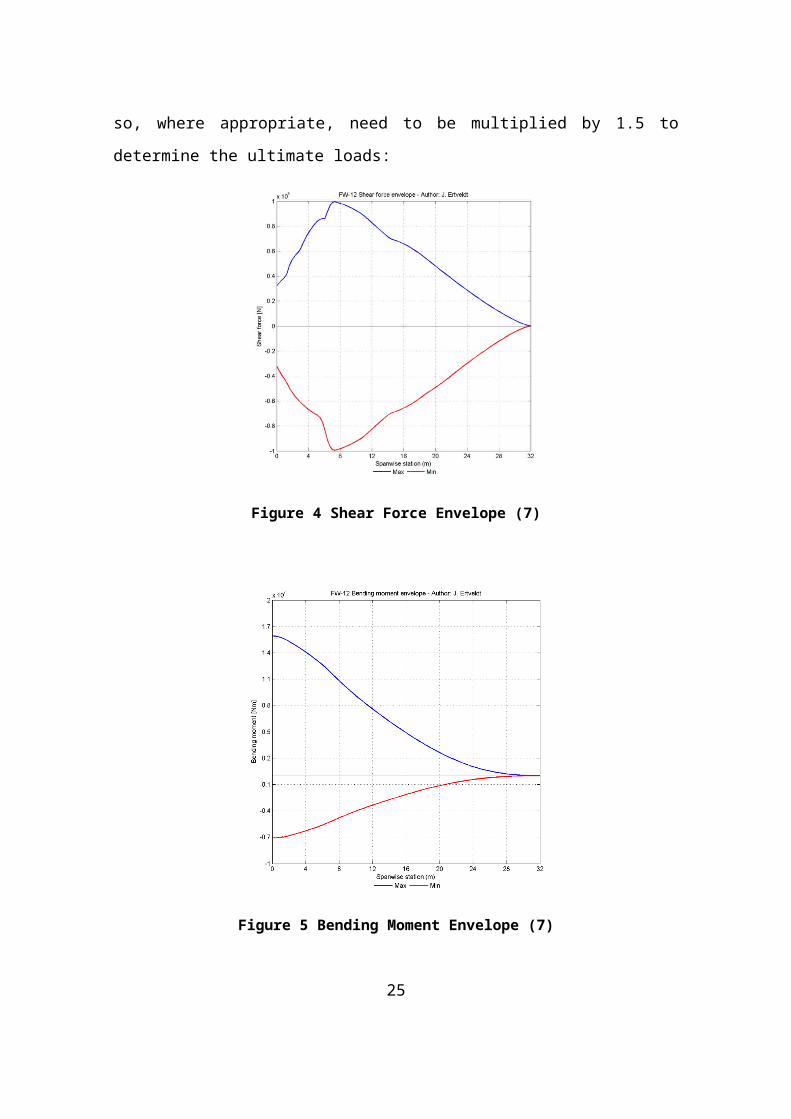
plots of the envelopes. It should be noted that these figures were calculated
based on the limit loads and so, where appropriate, need to be multiplied by 1.5
to determine the ultimate loads:
Figure 4 Shear Force Envelope (7)
17
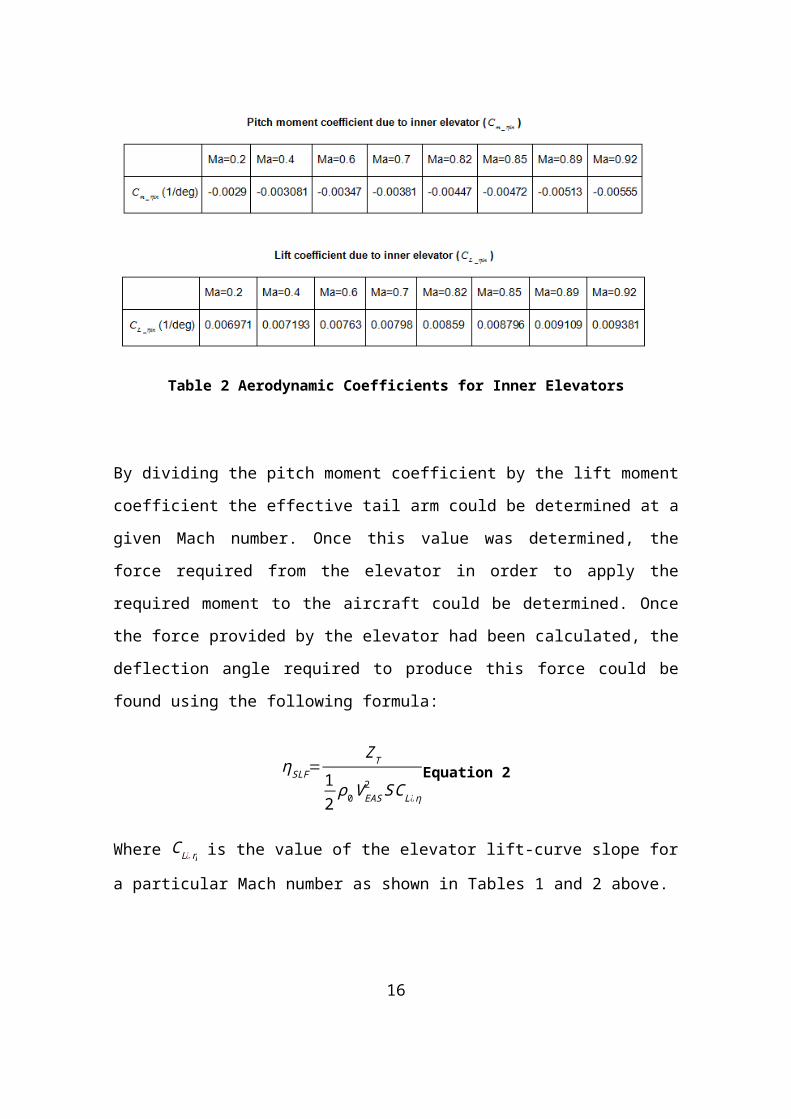
Figure 5 Bending Moment Envelope (7)
Figure 6 Torque Envelope (7)
18
2.7 Results and Discussion
This chapter discussed the work performed for the GDP during the loading
actions analysis section of the project. Carrying out this work was necessary in
order to gain a first estimate of the loads which the aircraft’s structure would
need to support. First the background theory regarding the longitudinal stability
of aircraft was discussed and hence the need for elevators on aircraft was
explained.
Following this the three distinct flight phases considered for the symmetrical
loading manoeuvres, namely steady level flight, steady rotary motion and
pitching acceleration cases were discussed along with the theory used to
determine the elevator loads required to perform these manoeuvres. Examples
of the calculations performed to determine the loads can be found in Appendix
A.
The results of the loading actions were then presented. The cases of most
relevance to the entire structures design team were those which resulted in the
worst load distributions applied to the entire aircraft. These were summarised in
Table 3. The three cases presented all occur when the aircraft is at its
maximum take-off mass. This is unsurprising as the most critical shear forces
and bending moments will occur at locations where the inertial forces
counteracting the lift generated is highest and the magnitudes of these forces
are dependent on the mass on-board. Furthermore it is unsurprising that the
highest loads corresponded with the highest load factor considered, n = 2.5g.
Both the lift forces and inertial loads will increase proportionately with the load
factor and so the highest value of n will result in the highest loads applied.
The most critical loads applied to the elevators were also presented. These
loads occurred at a lower value of mass and load factor than the previously
discussed cases. The reason for this is unclear. The calculations performed to
determine these loads were carried out at a later stage than the cases
presented in Table 3 as they were when combining some of the load cases later
on during the course of the project. It is possible that an error was introduced
19
into the Excel spreadsheet used to determine the loads sometime after the
initial calculations had been completed. However another explanation could be
that the centre of gravity considered in the case is further aft than in the other
three cases discussed. This meant that the distance between the elevators and
the centre of gravity was smaller and therefore the elevators would have to
provide higher forces in order to produce the moment required to perform the
manoeuvre.
In the next section the additional work carried out by the author as part of the
loading actions was then summarised. This work was needed as the delay in
calculating the required loading data was preventing the detailed design of the
structure from beginning.
Finally the loading envelopes which plot the worst loads experienced by each
part of the structure were presented. Using these data the structure could be
designed so that it could support the loads applied.
20
3 Initial Structural Design
3.1 Introduction
An aircraft with a conventional layout will have sections that can easily be
distinguished as forming either part of the fuselage or part of the wing. For a
flying wing aircraft such as the FW-12 this is not the case as the pressurised
areas comprising the passenger cabin and cargo bay are also located within the
wingbox of the aircraft. This means that these sections must be able to
withstand both the loads experienced by a conventional aircraft wing and also
the loads due to the pressure differential across the aerodynamic surface. The
approach adopted for the design of the mid-wing section was to use the
distributed flange philosophy so that the skin stringer panels support the load
due to the bending moment caused by the aerodynamic forces. This is typically
used for large civil transport aircraft. The spars of the aircraft were designed so
that their webs would be capable of supporting the shear loads applied to the
aircraft. The pressurisation was then accounted for by considering the skin to
consist of flat rectangular panels which connected to the flanges of a light frame
at one end and a rib at the other and were simply supported by the stringers. It
was thought that considering the panels to behave as if completely flat would
prove to be a conservative approach as in reality the skins would in fact have
some degree of curvature which would make them more capable of supporting
the pressure loads.
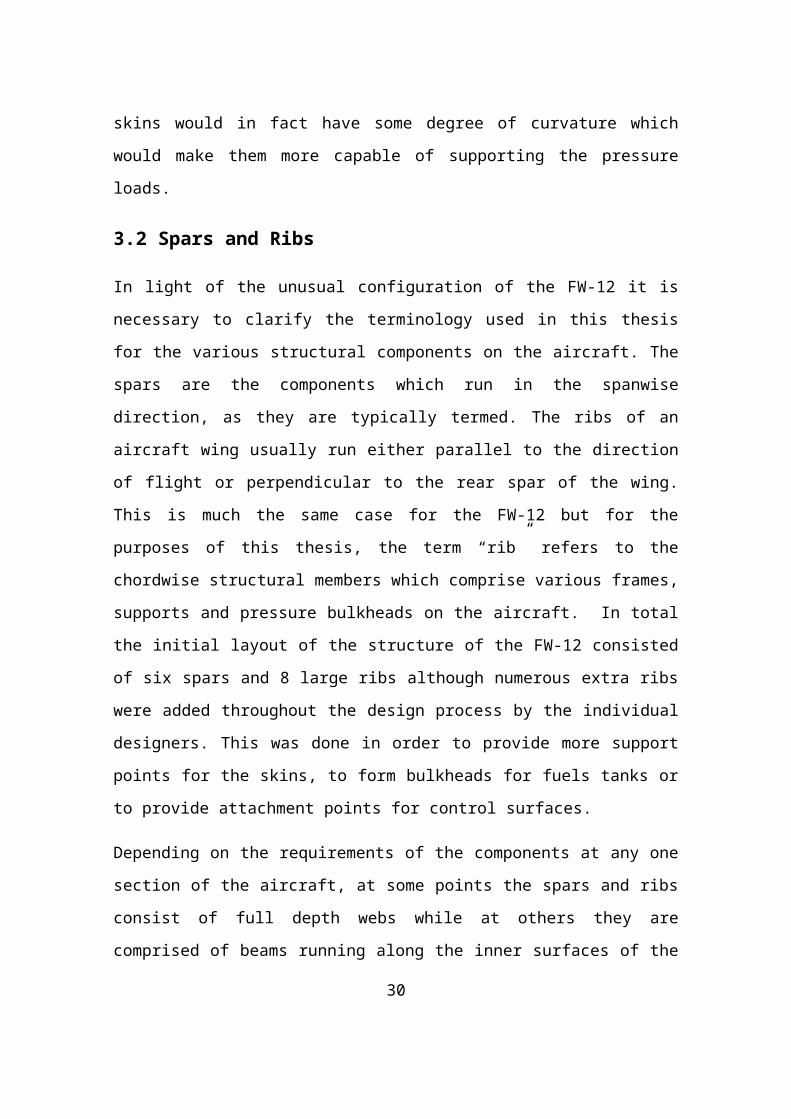
3.2 Spars and Ribs
In light of the unusual configuration of the FW-12 it is necessary to clarify the
terminology used in this thesis for the various structural components on the
aircraft. The spars are the components which run in the spanwise direction, as
they are typically termed. The ribs of an aircraft wing usually run either parallel
to the direction of flight or perpendicular to the rear spar of the wing. This is
much the same case for the FW-12 but for the purposes of this thesis, the term
“rib” refers to the chordwise structural members which comprise various frames,
21
supports and pressure bulkheads on the aircraft. In total the initial layout of the
structure of the FW-12 consisted of six spars and 8 large ribs although
numerous extra ribs were added throughout the design process by the
individual designers. This was done in order to provide more support points for
the skins, to form bulkheads for fuels tanks or to provide attachment points for
control surfaces.
Depending on the requirements of the components at any one section of the
aircraft, at some points the spars and ribs consist of full depth webs while at
others they are comprised of beams running along the inner surfaces of the
upper and lower skins of the aircraft and supported by columns connecting the
two together. In the forward mid-wing section the spars consist of full depth
webs and the ribs have large cut outs in them to allow for the cargo bay.
The locations of the main structural members were decided upon by all of the
wing designers at a meeting during the early stages of the project. From the
offset the intention was to ensure that the spars would, wherever possible, be
aligned with the most heavily loaded components on the aircraft. Therefore the
front spars were set to begin from the nose landing gear bay and then extend
from here out to the wing tips where they would provide rigid connection points
for the leading edge slat. The tallest spar was located so that it would form the
boundary between the cargo bay and the main landing gear bay, this allowed
for one of the largest single pieces of structure on the aircraft to support both
the loads arising from the pressurisation of the cargo bay and those resulting
from the landing forces. Throughout this thesis this component is typically
referred to as the “third spar” as it was the most aft of the three spars passing
through the forward mid-wing.
The heaviest ribs on the aircraft are those which form the walls of the
passenger cabin and they fulfil a number of roles. They support both the
engines and the associated powerplant systems which are amongst the
heaviest objects on the aircraft. From the location where the ribs meet the aft
22
wall of the cargo bay back the rear wall of the cabin the ribs also form a
pressure bulkhead between the mid-wing and the pressurised cabin.
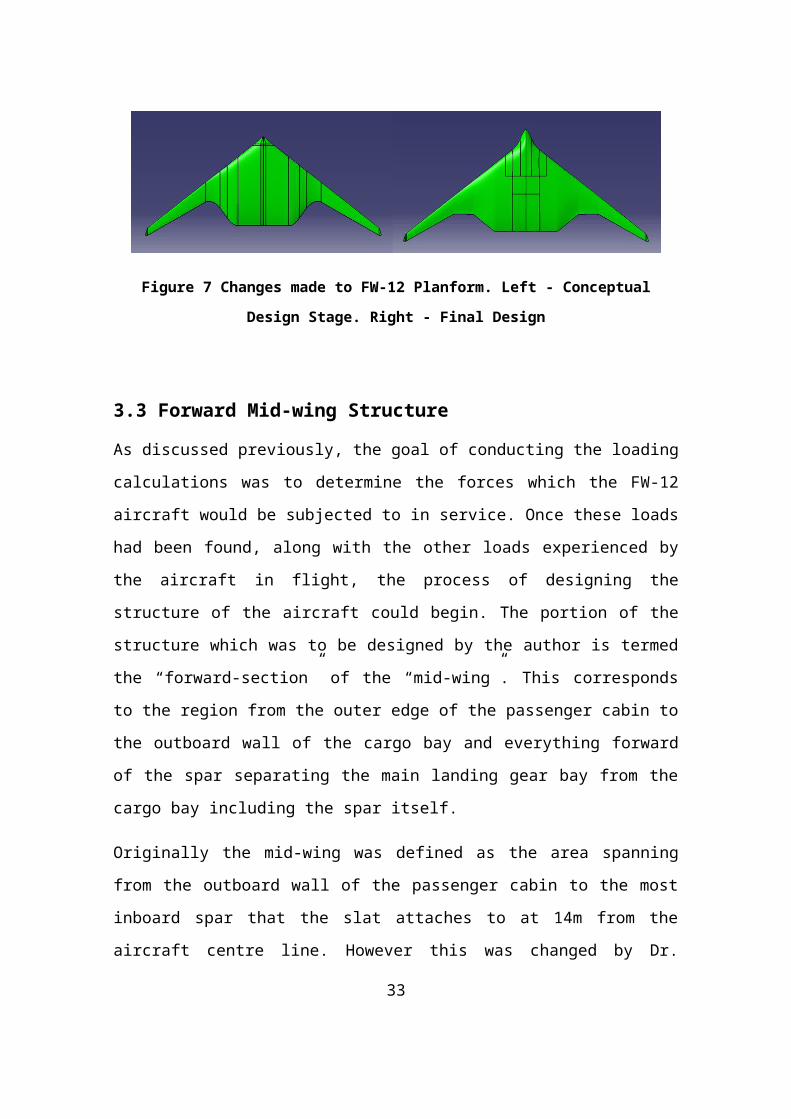
The structural layout of the aircraft was altered during the course of the project
based on recommendations from Prof. John Fielding who pointed out during
one of the weekly GDP meetings that the sharp kink in the aft outer wing spars
could lead to difficulties in manufacturing and stress concentrations at this point.
The changes made to the external shape of the aircraft can be seen in the
image below comparing the original planform from the conceptual design stage,
shown on the left, with the finalised design, shown on th. Another change which
was made during the course of the project was to extend the nose of the aircraft
forward. This was necessary due to requirements in CS-25 which dictate that
the pilot must be able to visually inspect the leading edge of the aircraft.
Figure 7 Changes made to FW-12 Planform. Left - Conceptual Design Stage.
Right - Final Design
3.3 Forward Mid-wing Structure
As discussed previously, the goal of conducting the loading calculations was to
determine the forces which the FW-12 aircraft would be subjected to in service.
Once these loads had been found, along with the other loads experienced by
the aircraft in flight, the process of designing the structure of the aircraft could
begin. The portion of the structure which was to be designed by the author is
termed the “forward-section” of the “mid-wing”. This corresponds to the region
from the outer edge of the passenger cabin to the outboard wall of the cargo
23
bay and everything forward of the spar separating the main landing gear bay
from the cargo bay including the spar itself.
Originally the mid-wing was defined as the area spanning from the outboard
wall of the passenger cabin to the most inboard spar that the slat attaches to at
14m from the aircraft centre line. However this was changed by Dr. Shijun Guo
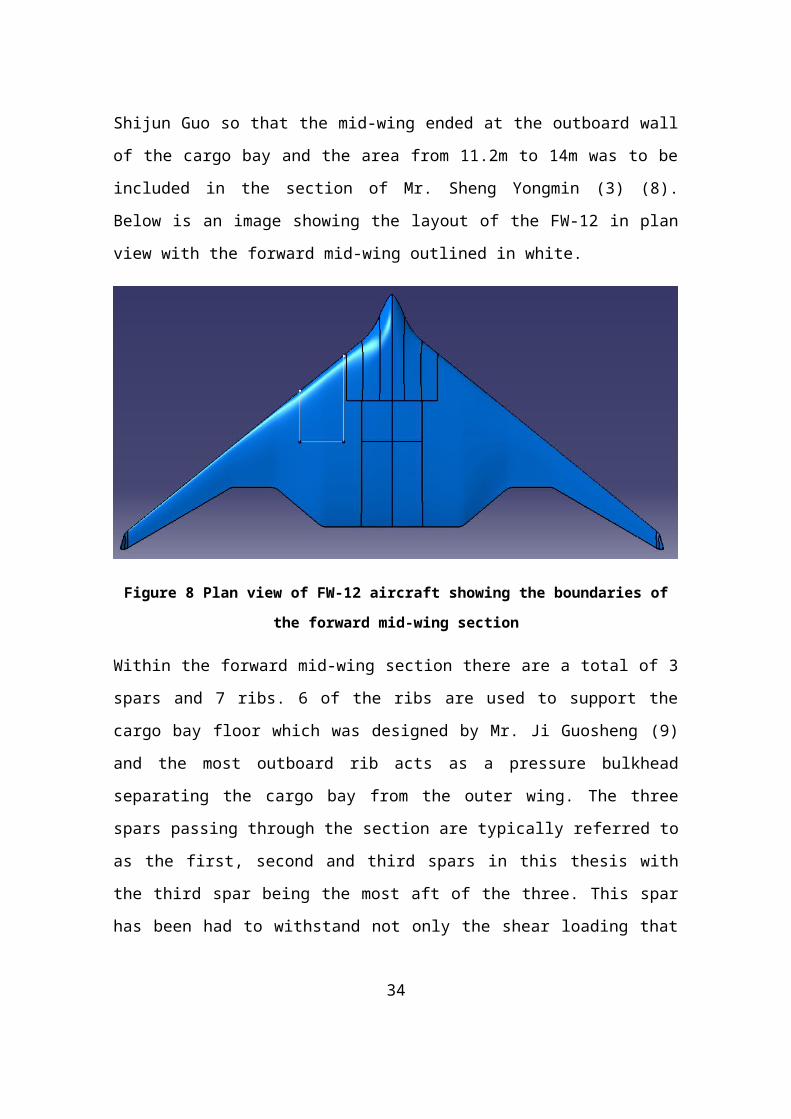
so that the mid-wing ended at the outboard wall of the cargo bay and the area
from 11.2m to 14m was to be included in the section of Mr. Sheng Yongmin (3)
(8). Below is an image showing the layout of the FW-12 in plan view with the
forward mid-wing outlined in white.
Figure 8 Plan view of FW-12 aircraft showing the boundaries of the forward mid-
wing section
Within the forward mid-wing section there are a total of 3 spars and 7 ribs. 6 of
the ribs are used to support the cargo bay floor which was designed by Mr. Ji
Guosheng (9) and the most outboard rib acts as a pressure bulkhead
separating the cargo bay from the outer wing. The three spars passing through
the section are typically referred to as the first, second and third spars in this
thesis with the third spar being the most aft of the three. This spar has been had
to withstand not only the shear loading that all of the spars are subjected to but
also the loads resulting from the pressure differential between the cargo bay
24
and the external conditions. The CATIA model of the section is shown below
with the upper skin removed so that each piece of structure can be seen:
Figure 9 Detailed CATIA Model of Forward Mid-wing Structure
There are numerous challenges to designing this particular section of the
aircraft’s structure. According to the conceptual design data the shape of the
aircraft from the centreline of the aircraft, i.e. Y =0, out to Y=8.4m the profile is
that of aerofoil NASA Symmetric SC. However from Y=8.4m out to the wing tip
at Y=32m the profile of the aircraft changes to that of the cambered aerofoil
NASA RC-SC2. This results in a rapid reduction in the height of the wingbox
across the mid-wing section which in turn leads to a sharp increase in the
magnitude of the force applied to the skin/stringer panels due to the bending
moment produced by the aerodynamic load.
Additionally, the mid forward wing incorporates the cargo bay of the FW-12
which must be pressurised and so this adds an additional challenge to the
design of the structure as it must be capable of handling the loads arising from
the pressure differential. For a civil transport aircraft with a conventional layout
the pressurised fuselage is typically a cylindrical structure and the circular cross
section results in the pressure loads being distributed evenly as hoop stresses.
However, this is not the case for flying wing aircraft and the challenge presented
25
by the pressurisation of a flying wing aircraft has been one of the main
stumbling blocks toward further progression of the design.
Typically there are two distinct philosophies in the design of pressurised
sections on flying wing and blended wing body aircraft. One involves employing
two skin surfaces; one which contains the pressure loads and the other which
maintains the aerodynamic shape and properties of the aircraft. While this
design philosophy has its advantages it can result in a higher structural mass as
the outer skin must also be designed to withstand the pressure differential in the
event of the inner skin failing which therefore increases its mass (8). The
alternative is to design the outer skin to take the pressure load as is the case in
a conventional aircraft and it was this design philosophy which was adopted for
use on the FW-12. This single skin solution to the pressurisation requirements
was chosen not only by the author for the forward mid-wing section but also by
all members of the structural design team who had to design pressurised
sections.
3.4 Light Frames
After discussing the overall concept for the forward mid-wing’s structural design
with Dr. Shijun Guo, the author decided to include some additional structural
components to allow for more support points for the skins and spars. These
components, referred to as the “light frames”, were placed halfway between the
ribs and, in addition to the ribs, provide attachment points for the skin-stringer
panels as well as acting as the vertical stiffeners and restraint points on the aft
pressure bulkhead and spar webs. It was found that including these additional
support points allowed for much lower thicknesses to be used for the supported
components and therefore they led to a reduction in the weight of the structure.
The role of the light frames is essentially to act as a skeleton for the aircraft. As
the skin/stringer panels of the aircraft were designed to take the loads resulting
from the bending moment applied to the aircraft and the spars were designed to
take the shear loads it is assumed that the light frames act only to provide
26
support points and do not take any shear or bending loads. In reality it is
inevitable that the frames will take some of these loads but determining the
magnitude of the loads transmitted through the frames would require quite a
detailed simulation of the entire aircraft’s structure and so, due to the time
constraints of the GDP, these loads were assumed to be negligible.
27
4 Material Selection
4.1 Introduction
Typically in previous Group Design Projects at Cranfield University the
structures design team has been split into two teams, one which would design
the aircraft using composite materials and the other which would design the
structure using metallic alloys. However for this project there were not sufficient
numbers to split the team in two. As a result the decision of which materials
would be used for which components was left to each individual designer. To
gain experience designing aircraft structures using both class of materials, as
well as to capitalise on the respective benefits of each material type, the author
opted to use both composite materials and metallic alloys in the design of the
structure.
The choice of materials used for the various structural components is a key step
in the design process as it defines the mechanical properties which will be used
to determine the sizing of the structure. In all aspects of aircraft design the mass
of the design is one of the most critical quantities and the weight of every
component on an aircraft, be it a piece of structure, avionics or of a system,
should be kept as low as possible while still being able to fulfil the requirements
of its specific function.
The materials used in the structures of an aircraft will have a large impact on
the overall weight of the structure and so key properties when selecting a
material were its density and in particular the specific strength and/or stiffness.
The two different class of materials, that is composite materials and metallic
alloys, will be discussed in this chapter as well as detailing which components
would be made from each material along with the reasoning behind the choices
of material.
28
4.2 Composite Materials
4.2.1 Introduction
Composite materials such as carbon fibre reinforced polymers (CFRP) are
seeing increasing use in aerospace structures. The key advantage to using
these materials in aerospace structures is that their properties can be tailored to
the stress field applied locally to the structure by choosing a suitable layup
arrangement of the plies used. This means that for components where the
loading is very directional composite materials can be tailored for the lowest
possible mass to support this load and so, with good design being employed, a
significant reduction in the structural mass can be achieved.
There are numerous difficulties associated with designing using CFRP materials
compared to isotropic alloys. CFRP is manufactured into “plies” consisting of
several parallel carbon fibres set into a resin material. These plies are then
stacked in various directions so that some may be parallel to the axis of the
loading, some perpendicular and then others at any angle in between and the
stacked plies is then typically termed a laminate. It is by being able to increase
the number of plies and therefore the mechanical properties of the laminate in
the desired direction that composite materials gain their advantage over metallic
alloys. However this also is the root of the difficulty in their use in design as the
properties of the laminates vary greatly depending on the layup used as well as
the properties of the resin and fibres used.
The author investigated numerous combinations of resins and fibres which
could be used in the composite materials. This proved more difficult than
expected. The properties of metallic materials were much easier to find as they
do not vary as much as those of composites and, as metallic alloys have been
in use in the aerospace industry for longer, there are a larger number of reliable
sources available which list their material properties. Therefore the properties of
the composite materials used in the design of the structure should be verified by
tests performed on sample specimens but for a first iteration of the structural
29
design, it is hoped that the accuracy of the material properties will prove
sufficient.
4.2.2 Components Designed Using Composites and Materials
Chosen
The values of the composite materials’ properties were obtained from the
website of their manufacturer, Hexcel (9). Hexcel are a company specialising in
the manufacture of CFRP materials. Their resin HexPly® M91 had been used in
the design of previous aircraft structures and so the author researched the use
of this resin for the FW-12. The resin was chosen as the manufacturer
specifically cited this resin as one which is particularly suited to use in
aerospace applications and offers “superior performance for primary aircraft
structures” (9). The fibres used in conjunction with this resin are IM7 UD fibres
which come recommended for use with M91 resin by Hexcel, the mechanical
properties of each UD ply are shown below:
M91 Resin with IM7 Carbon Fibre Unidirectional Prepreg
Ply thickness (mm) 0.184 Density (kg/m3) 1570
Young’s Modulus (GPa) 0o 165 00 Max Tensile Strain (%) 1.781
Young’s Modulus (GPa) 900 8.300 Max Compressive Strain
(%)1.113
Tensile Strength 00 (MPa) 2980900 Max Tensile Strain
(%)0.454
Tensile Strength 900 (MPa) 76900 Max Compressive Strain
(%)2.278
Compressive Strength 00 (MPa) 1860Shear Maximum Strain
(%)2.435
Compressive Strength 900 (MPa) 250Longitudinal Thermal
Expansion Coefficient -3x10⁻⁷
30
(10-6/0C)
Shear Modulus (GPa) 4.6Transverse Thermal
Expansion3x10-5
Shear Strength (MPa) 120Longitudinal Moisture
Expansion Coefficient0.0001
Major Poisson’s Ratio 0.3Transverse Moisture
Expansion Coefficient0.2
Table 5 CFRP Material Properties (9)
The tack life of the prepreg plies used is up to 15 days when stored at 230C and
the out life is 42 days at the same temperature. If the plies are stored at -180C
then they have a shelf life of 12 months. Hexcel have successfully certified this
material for use on primary structural components and a key reason behind
choosing it was its high toughness as well its damage resistance properties.
The skin of the aircraft will be manufactured from laminates comprised of these
UD plies. The skin/stringer panels contribute more to the mass of the structure
than any other one component on the aircraft. As such, it is hoped that by
choosing CFRP materials the mass of the structure can be kept lower than
would be possible using metallic alloys. The skin is a key structural member as
it must support the aerodynamic loads applied by the atmospheric air. A
composite skin can be manufactured to smoothly follow the complex curvature
of the vehicle without being split into multiple panels as would likely be needed
if the skins were made from metallic alloys. This has the benefit of both
reducing the weight of the fasteners used in the structure and also improving
the aerodynamics of the flow over the aircraft as the interfaces between such
metallic panels as well as their fastening rivets form a significant contribution to
skin drag. Also, the use of composite material could prove to be a cheaper
option than manufacturing the skin from a metallic alloy as these materials will
likely see increased use between now and the aircraft’s introduction to service.
31
Finally the use of composite material and the corresponding reduction in joining
surfaces can also reduce the frequency of maintenance inspections needed
(10).
4.3 Aluminium Alloys
4.3.1 Introduction
While composites lend themselves to use on components where the loading is
well defined, for components where the stress field is more complex metallic
alloys remain the best choice of material due to their isotropic properties.
Aluminium alloys, i.e. alloys whose primary constituent is Aluminium metal, are
used very commonly in aerospace applications owing to their low density and
high strength and stiffness. Titanium alloys are also used in aircraft as they
possess even better specific stiffness than aluminium alloys but they are
considerably more expensive and there are manufacturing difficulties involved
with their use. As with composite materials there are a variety of options
available to designers when it comes to choosing the aluminium alloy used for
design purposes. Typically the 7000 series and 2000 series aluminium alloys
are used for the design of aerospace structures.
4.3.2 Components Designed Using Aluminium Alloy and Materials
Chosen
Aluminium alloys were chosen as the material for the design of the three spars
passing through the front section of the mid-wing as well as the ribs within the
section. Although composite materials would also have been a good material
choice for the first and second spar, the author decided that aluminium alloys
were definitely the most suitable materials for the design of the third spar. This
is because, as well as serving as one of the main spars of the aircraft, the third
spar also acts as the aft pressure bulkhead of the cargo bay. Furthermore the
main landing gear connects to this spar and so considering the very complex
stress states which could arise due to the combination of these high intensity
32
loads it was decided that the isotropic properties of alloy materials were
desirable for the third spar. Composite materials were not suitable as
determining a ply layup that suited such a complex loading situation would have
proved very difficult if not impossible within the time constraints of the GDP.
Once the decision had been taken to design the third spar using aluminium
materials, the design process used for the third spar could be more easily
repeated to design the first and second spars using aluminium alloys also rather
than using composites for these components which would have required further
research and different calculations owing to the anisotropy of the composite
materials. Furthermore, as mentioned earlier in this chapter, the author wanted
to design using aluminium alloys as well as composite materials in order to gain
experience designing aircraft structures with both class of materials.
After a discussion with the designer of the aft mid-wing, Mr. Julien Ertveldt, who
had been working on the retraction of the main landing gear along with the
designer of this component, it was pointed out that space in the main landing
gear bay was very limited. In light of this the stiffness of the alloy material used
was a key parameter as it would determine the deflection of the panels used in
the bulkhead as well as the density of the material used as the bulkhead will be
very large and have a significant weight penalty. After consulting various
sources, the author decided upon the use of Al 2099 T-83 as this alloy
possesses a lower density than other aluminium alloys and a high value of
Young’s modulus. Below is a table showing the properties of Al 2099 T-83
These values were listed as being valid for thicknesses from 0.5 to 0.999 inches
(12.7 to 25.375mm) which exceeded the maximum dimensions used in
subsequent designs and so they are reflective of the true mechanical properties
of the components (11):
Stiffness 78 GPa
Yield Strength 525 MPa
33
Tensile Strength 560 MPa
Compressive Yield Strength 520 MPa
Density2630
kg
m3
fn 495.27 MPa
Shear Modulus 28 (GPa)
Poisson’s Ratio 0.34
1εn
157.29
Table 6 Al 2099 T-83 Material Properties (11)
4.4 Use of Titanium Alloys
Another class of metallic alloys commonly used in aerospace applications are
those whose primary constituent metal is Titanium. Titanium alloys have a very
high yield strength and bearing strength but their use comes at an additional
weight penalty when compared to aluminium alloys. As a result, the use of
titanium alloys on aircraft is generally reserved for only special applications
such as components which must operate under unusually high stresses or
temperatures. In addition, titanium alloys see application for connections made
to CFRP composite materials as there is a galvanic difference between
aluminium alloys and composites which must be insulated against in order to
avoid excessive levels of corrosion.
For the design of the forward mid-wing structure titanium alloys were chosen for
the lugs which connect the outer wing and mid-wing sections together. This
material choice was recommended by Dr. Xiang Zhang due to the high stress
acting on the lugs and the cyclic nature of the load that will be applied. This will
be discussed in more detail in Chapter 8 on fatigue and damage tolerance
34
analysis as one of these lugs was chosen as the component to focus on in
particular for this section of the GDP.
35
5 Initial Sizing
5.1 Introduction
To being the process of designing the structure of the forward section of the
mid-wing the thicknesses and general sizes of the individual components
needed to be calculated. This was done based on values of shear force,
bending moment and torque calculated in the loading analysis and utilising the
theory in various sources but in particular Denis Howe’s book was used as
reference material (6) as well as the Detail Stressing lecture series which were
presented by Mr. Phil Stocking (12). The values determined in the initial sizing
section represent a “starting point” in the design process from which more
detailed design can be carried out. To determine the relevant values for
thickness and to allow for easy adjustment to the design at a later stage if
necessary the author constructed an Excel file for each of the required design
tasks.
5.2 Leading Edge Thickness
The leading edge slat on the FW-12 starts out towards the tip of the wing and
continues until the rib at a spanwise location of 11m from the centreline.
Therefore the slat ends at the outboard wall of the cargo bay and so the entire
leading edge of the mid-wing section is exposed to the ambient airflow during
flight. According to CS 25.631 (2) the leading edge must be capable of surviving
a collision with a 1.8kg bird while the aircraft is travelling at its cruise velocity
and the aircraft must continue to operate safely. The required thickness of the
leading edge could be determined from a semi-empirical formula derived by
Howe in (6):
t=0.02 .V M .m
13 . f (Material ) .cos2 /3θ
exp ( 1230r2+30 r+1000
) Equation 12
36
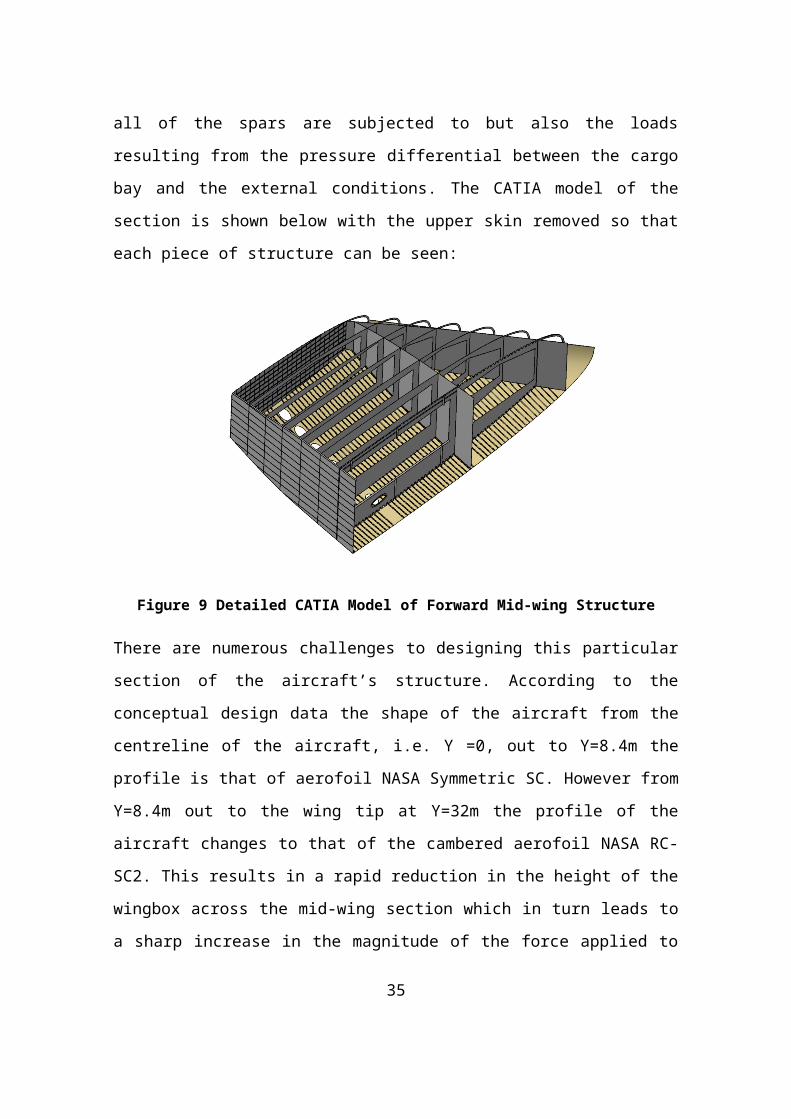
Where: t = thickness of leading edge (mm), r = radius of leading edge nose
(mm), m = mass of the bird/impacting object (kg) , θ = inclination of impact and
f (Mat )=0.8f 1(L73)f 1(Mat) , i.e. 0.8 times the ratio of the 0.1% proof stress of the light
alloy specification L73 and that of the composite material used for the leading
edge.
The formula used for sizing the leading edge is based on empirical methods
and only gives an approximate value for the skin thickness required to allow the
aircraft to continue to operate after the collision. To ensure that the aircraft does
indeed meet the requirements for bird strikes as laid out in CS-25.631 tests
would need to be carried out on manufactured prototypes of the FW-12 or
making suitable comparisons to tests performed on other aircraft. The results of
the initial sizing of the leading edge can be found in Appendix B.1.
5.3 Skin Stringer Panels
As the primary load direction for lifting surfaces is spanwise (6) the values of the
bending moment calculated in the spanwise distribution were used to size the
skin stringer panels. The wing of an aircraft can be simplified as a cantilever
beam that is usually loaded such that the upper side is in compression and the
lower in tension. For a beam subjected to a bending moment, the resulting
stress levels are proportional to the distance from the neutral axis of the beam.
As such, the stresses due to bending will be greatest in the upper and lower
surfaces of the aircraft’s wing and so the panels have been designed to fully
support the bending moment.
The most common loading conditions will occur during flight so the upper skin of
the wing will be subjected to compressive stresses while the lower skin will be
subjected to tensile loads. For the skins to be capable of supporting these
loads, without being so thick as to have an excessively large mass, stiffeners
termed ‘stringers’ are attached to the skin which share the load with the skin
material. One of the first sizing requirements was to calculate an initial estimate
37
for the thicknesses of these stringer sections and the skin material. This was
achieved by calculating an equivalent thickness which is representative of the
total cross sectional area required of the panels to support the load.
Based on the theory outlined in Howe’s “Aircraft Loading and Structural Layout”
the dimensions of the components could be estimated by considering the
moment applied at a spanwise location of the wing, M , and applying the usual
ultimate factor of 1.5 times this value. If this moment is taken to act through the
central plane of a wingbox of average height h then the force required to
balance this moment must be P such that:
P=Mh
Equation 13
Using this value for P the value of σ b can be calculated as follows:
σ b=A Fb√ PWL
Equation 14
where: A is a material constant, Fb is the buckling efficiency factor of the
panel’s construction based on the type of stringer being used, W is the width of
the wingbox and L is the rib pitch.
Using this value of σ b, the “equivalent thickness” of the skin stringer panel
required to support this stress level can be calculated using the following
equation:
t e=M
whσ bEquation 15
This thickness essentially represents a measure of the cross sectional area
required to support the applied load safely. In order to get a more detailed idea
of the approximate thicknesses of the skin it is suggested that the skin thickness
be initially taken as:
t b=0.65M
whσbEquation 16
38
The effective thickness required varied along the span of the aircraft due to the
variation in both the bending moment applied and the height of the wing box by
which the moment must be resisted. This variation of the effective thickness is
illustrated below:
The critical design cases differ depending on the side of the wing being
considered. For the upper surface the tendency to buckle under the applied
compression load needs to be considered and prevented. If buckling were to
occur, this could disrupt the aerodynamic surface and have drastic effects on
the aircraft’s performance as well as lead to the overall failure of the structure.
Once the initial estimate for the thickness of the skin was decided upon, the
buckling analysis was carried out on the skin-stringer panels. This will be
discussed further in the detailed design chapter.
On conventional aircraft wings the skin thickness required to support the
bending loads is greatest at the root of the wing and can be reduced along the
span of the wing in order to reduce the aircraft mass. However, this is not the
case on the FW-12 through the mid-wing section due to the transition from one
aerofoil shape to another across the region. This results in a rapid reduction in
the height of the wingbox and in turn an increase in the load which the panels
are subjected to despite the reduction in applied bending moment.
The panels of the wingbox also need to have sufficient thickness to support the
shear stresses resulting from the torque applied to the structure. Due to the
large wingbox area in the mid-wing section it was suspected that the deciding
factor for the skin thickness would be the loads due to the bending moment
rather than the torsional loads, however, this needed to be double checked.
Using the Bredt-Batho theory, the thickness required to support the shear stress
due to torque can be estimated using the following formula:
t q=T
2∗A∗σsEquation 17
39
where T is the torque applied to the wingbox, A is the wingbox area and σ s is
the shear strength of the material, taken to be half of the ultimate tensile
strength of the material.
Finally the wingbox must have a minimum thickness to resist flutter. To ensure
that the thickness required to support the bending loads is sufficient, and also
resistant to flutter,the following equation is used, again based on the Bredt-
Batho theory:
t θ=mθ
4∗G∫0
0.7 b Pr
A2dl Equation 18
where t θ is the thickness required, mθ is the torsional stiffness at 0.7 half-span,
G is the shear modulus of the material, A is the wingbox area and Pr is the
mean perimeter.
It was found that by far the most critical design case was ensuring that the
panels could support the loads due to bending owing to the large wingbox area
of the mid-wing section and so the detailed design of the skin stringer panels
was based on this criterion. The initial estimates for the required equivalent skin
thickness based on the three separate load cases are shown below:
5.0000 6.0000 7.0000 8.0000 9.0000 10.0000 11.00000.0000
0.5000
1.0000
1.5000
2.0000
2.5000
3.0000
3.5000
4.0000
4.5000
5.0000
Skin Thickness due to TorqueWing Bending Skin ThicknessThickness to resist flutter
Figure 10 Skin thickness requirements
40
5.4 Spar Sizing
The locations of the main ribs and spars which support the structure of the FW-
12 had previously been decided by all members of the wing team and were
outlined in the initial structural layout section. The ends of the spars followed the
inner surface of the skins which meant that their height was fixed and so to
ensure that the applied stresses were not too high, the thickness of the spars
needed to be calculated. To determine an initial estimate for the required
thickness, the minimum thickness was calculated such that the shear stress
developed in the cross section was less than the shear strength of the material.
However, while the spars would be able to support the applied loads this
resulting shear stress could cause the web of the spars to buckle in shear. This
will be discussed in more detail in the next chapter on the detail sizing and
design of the structural components.
The shear force had been calculated over the whole span of the aircraft.
However, only a single value of shear force for each point along the span could
be calculated. In reality, the force would be carried by all of the spars present in
the wing at the specific location. In the mid wing there are four spars and
according to reference (6), the shear force carried by each member can be
approximated by considering the heights of each of the spars. The level to with
each member will be loaded can be estimated by using the following equation:
V i=Vhi2
∑1
j
h j2 Equation 19
where V is the ultimate shear force at the relevant spanwise location, V i is the
shear force in each individual spar, hi is the height of the spars and j is the
number of spars.
This shear force will produce a shear flow within the webs of the spars which
they must be able to react. Furthermore the torque applied to the wingbox will
41
also result in a shear flow in the webs of the spars. The two contributions to the
shear flow in the spar webs can be evaluated as:
QV i=
V i
t i,QT=
T2 A
where QV is the shear flow due to the shear force applied, QT is the shear flow
due to the torque applied and t i is the thickness of the spar being examined.
These shear flows will result in shear stresses being developed in the spar
webs and so a preliminary estimate for the thickness required of the webs can
be found by finding the thickness at which this shear stress is below the shear
yield strength of the material. The shear stress can be evaluated as follows:
σ s=QV i
+QT
tiEquation 20
It should be noted that due to the five spar configuration of the wingbox in the
mid-wing section it was not possible to determine the exact shear flow caused
by the loads applied and so some assumptions had to be made. The shear flow
due to the torque applied has been calculated using the method usually used
for two spar configurations where the front and rear spar react the torsional
shear flow. The resulting value of shear flow due to the torque has then been
assumed to act on all the spars at a given spanwise location equally. In reality
the five spar configuration leads to a statically indeterminate situation and would
require further simulation using finite element analysis to more accurately
predict the shear flows and corresponding shear stresses which each spar must
react.
5.5 Bulkhead Sizing
There was no clear cut method to determine an initial value for the thicknesses
required for the pressure bulkheads of the cargo bay area. Instead the sizes of
the bulkheads were determined in more detail using ESDU data sheet 71013
which will be discussed in more detail in the detail design section.
42
5.6 Rib Sizing
Similarly there is not much theory to base initial predictions for the dimensions
of the ribs on. The ribs were designed in more detail based on the chordwise
distribution of the load applied to the components. However, there is a simple
method to estimate the rib pitch required for maintenance purposes given in
Howe’s book. The relevant equation is:
L=0.55 √dr
where L is the rib pitch and dr is the depth of the wingbox at the root of the
wing.
The above method for estimating the rib pitch is based on maintenance
considerations, specifically so that maintenance workers can fit through
maintenance hatches between the ribs and visually inspect the internal
structure. However for the mid-wing section this approximation gives quite large
values of the required rib pitch due to the very large height of the wingbox at the
root of the FW-12 which corresponds to the centreline of the aircraft. In practice
a rib pitch of approximately 800mm proves sufficient for maintenance purposes
and this value is usually recommended as a minimum. However a number of
the ribs in the mid-wing section were spaced below this minimum value so
some maintenance holes were then placed in the webs of the ribs of the section
to facilitate the inspection of the structure. This will be discussed in more detail
in the next chapter.
5.7 Light Frames
The initial sizing of the light frames was done based on theory provided in
reference (6). It is recommended that the height of the frames is taken as 3-5%
of the diameter of the fuselage and that their thickness be equal to the
equivalent thickness calculated for the skins. However the method for
estimating the frame height proved ineffective and led to very large frame
heights as it assumes a cylindrical fuselage as found in conventional airliners. In
43
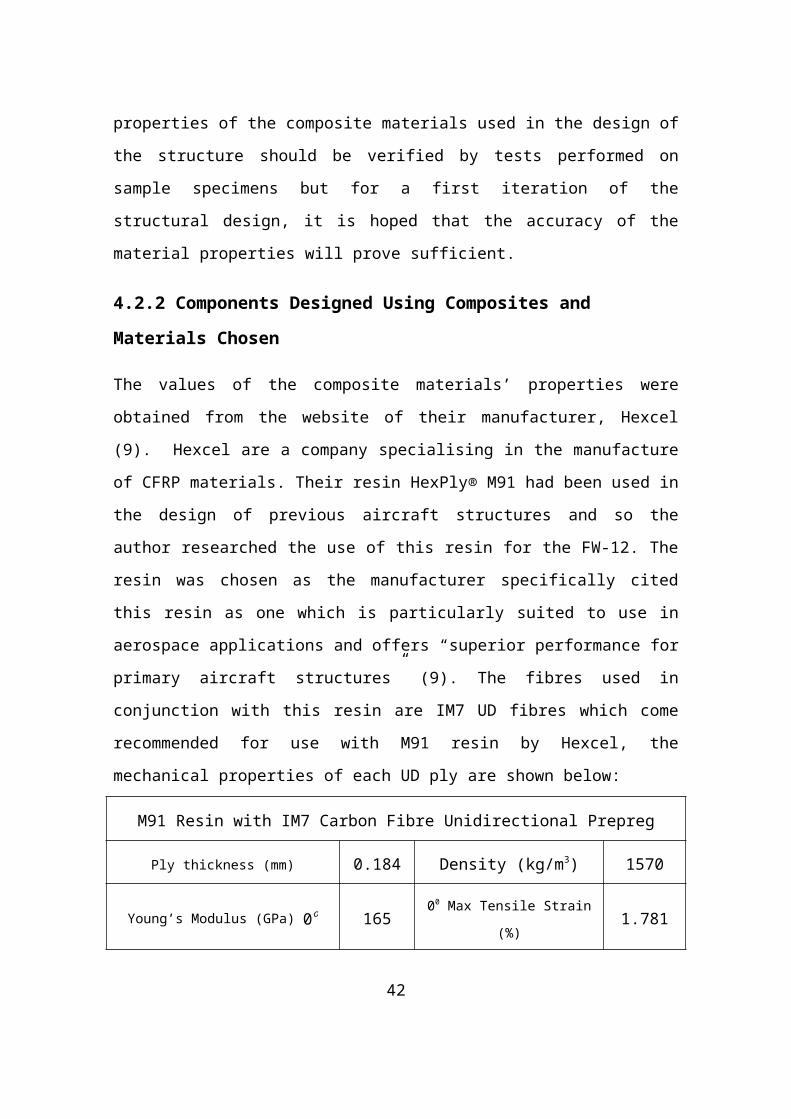
order to use this assumption for the FW-12, the local curvature of the mid-wing
section was measured. The approximate diameter of the aerodynamic surface
was estimated from the CATIA model to be approximately 28m which indicates
the height of the frames should be between 840mm to 1400mm. These values
were deemed too high and so, after consulting with Mr. Phil Stocking, the author
opted to base the size of the frames on the diameter of the A380 aircraft as this
aircraft has a very large fuselage diameter and so it is comparable to the large
diameters found on the FW-12. Based on this assumption, the height of the
frames was found to be 320mm and the thickness was equal to the previously
calculated value of t e.
44
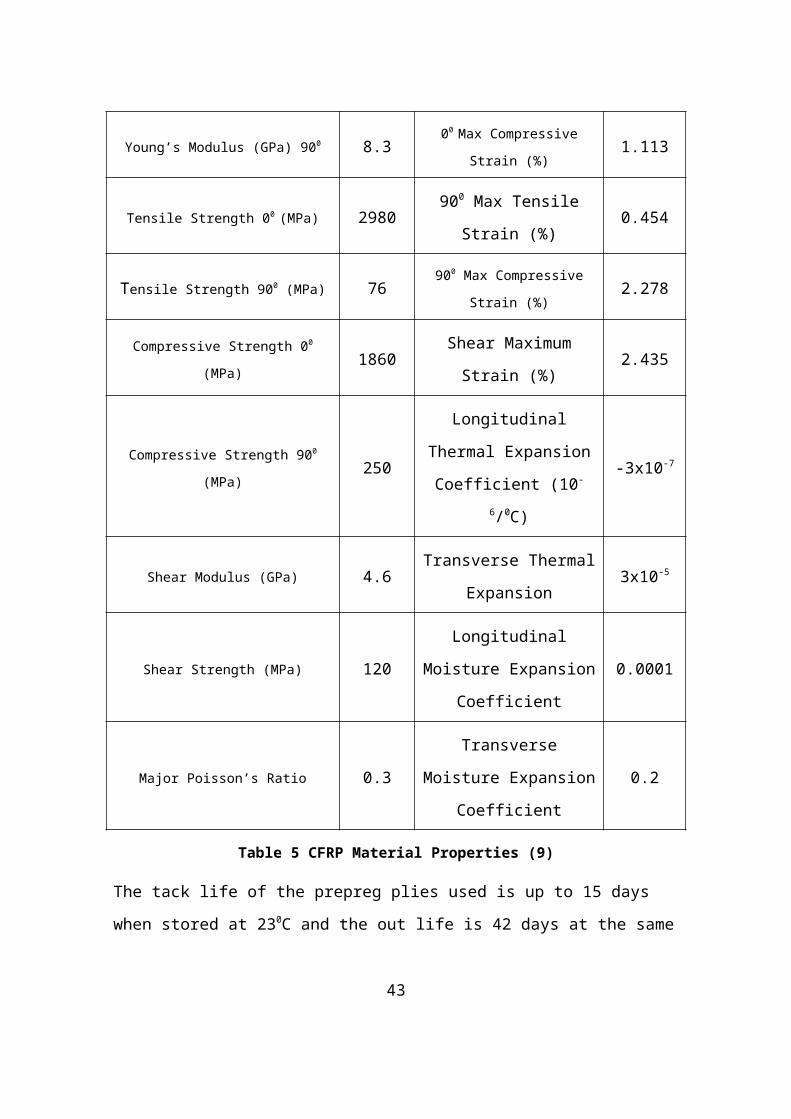
6 Detail Design
6.1 Introduction
The initial sizing stage of the design served to determine the approximate
dimensions of the various structural components of the design. Once these
values had been determined, the design of the components could be taken
forward to the more detailed design phase where more precise dimensions
were calculated taking various factors into consideration, these included:
Manufacturing considerations such as the tolerances which would be
applicable for the finished components
Use of commonly available sheet thicknesses where appropriate rather
than the exactly calculated value
Considering all the methods of failure which the component could
encounter and ensuring that the stress experienced by the structure
under ultimate load would not lead to any of these failure modes.
The calculations performed to determine the dimensions of the components are
discussed here along with some results and full details of this work can be
found in the Detail Stressing Report in Appendix E.
6.2 Skin Stringer Panel Design
6.2.1 Introduction
As outlined in the previous section the first estimate for the skin thickness was
determined by calculating an “effective thickness” required for the skins to react
the forces due to the bending moment. Once this was determined the process
of designing the skin stringer panels was continued using the in-house software
programme “TW Panels”.
For both the upper and lower panels the critical loading case was found to be
when the panels are loaded in compression. Therefore the most severe loading
due to a 2.5g pull up manoeuvre was used to determine the dimensions of the
45
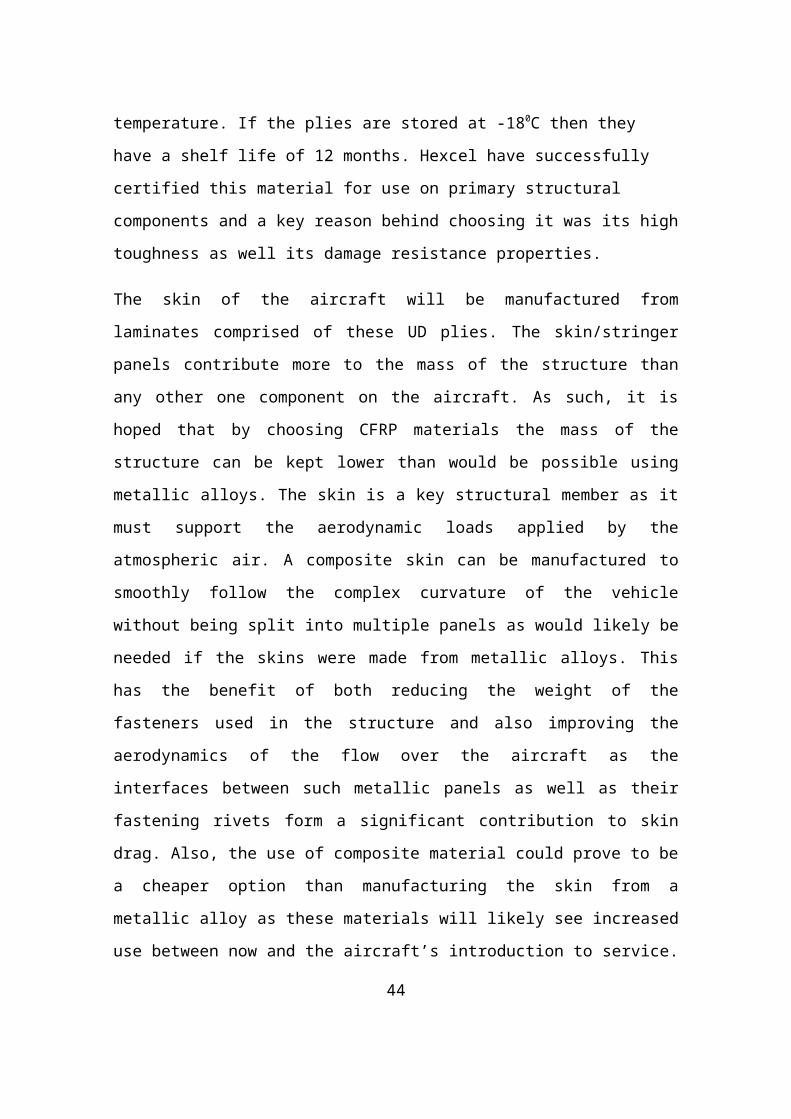
upper panel and for the lower panels a -1g pitching case was the worst case
considered and both of these cases were combined with the loads from rolling
manoeuvres. The task then became to design the panels to ensure that they
had sufficient strength to support the ultimate applied loads without buckling.
6.2.2 Buckling Analysis using TW Panels
The panels were considered to be simply supported at one end by a rib and at
the other by a light frame. Due to their size the panels represent the most
significant contribution to the overall mass of the mid-wing structure and indeed
of the entire FW-12 aircraft, in light of this a significant amount of time was
spent designing the dimensions of the panels in order to maximise the weight
savings. Two different possible designs were derived; the optimal design of the
panels which had the lowest possible mass while still being capable of
supporting the loads applied and the final design of the panels which took
manufacturing and maintenance restraints into consideration despite this
resulting in a weight penalty. This allows for a comparison between the two
designs and gives a measure of the largest weight savings which could be
made in subsequent design iterations.
TW panels requires some input data to be given to compute the dimensions of
the panels and the loads which could be supported before buckling would
occur. One input which was required was a Young’s modulus value for the
material used. In the case of aluminium panels this value could be easily
obtained, however for composite materials it is more difficult to assign a single
value to the material for the purposes of sizing calculations. The author
consulted with Dr. Shijun Guo about this problem and the advice given was to
assume the Young’s modulus for a quasi-isotropic layup to be between 65GPa
and 70GPa. To be conservative in the design of the panels, the lower limit value
of 65GPa was used in the TW Panels software. Below is a sample of the results
obtained from the programme:
46
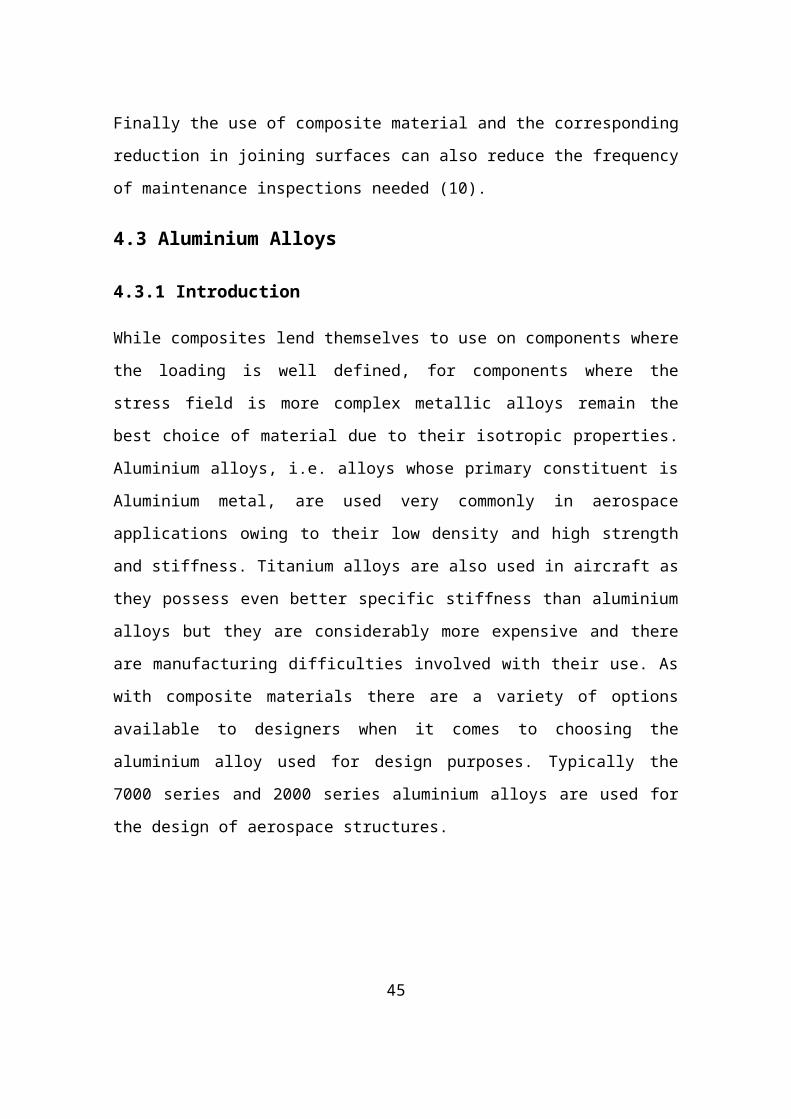
Figure 11 Finalised Upper Panel Sizing Data from TW Panels
The programme returned the dimensions of a skin/stringer panel and the
buckling load that could be supported by the panel. To determine if this panel
would be suitable for the FW-12 aircraft skin the value of bending moment at
the specified spanwise position was used to determine the force acting through
the skins:
F=BM ult
havg
Equation 21
47
The dimensions returned by TW Panels were then used to calculate the area of
the panel and so with the load and area over which it is applied known as the
average applied stress within the panel could then be evaluated:
Apanel=A skin+A stringers , σavg=F
ApanelEquation 22
The dimensions of the panel were then adjusted until the applied stress was
below the value for buckling stresses calculated by TW panels.
There are two modes of buckling which have to be designed against in the case
of aircraft skins both of which are considered by TW Panels, namely global
buckling of the entire skin/stringer panel and local buckling of the individual
components. The panel may be strengthened, at the cost of increased mass, to
resist one form of buckling but this may not improve the panel’s ability to resist
the other form of buckling. This means that the minimum possible mass of the
panels will coincide with when the panel’s values for local and global buckling
stress are equal. TW panels was used to calculate the dimensions at which the
two stress values were equal and hence the lightest possible panel
configuration for the individual panels was found.
However, TW panels returned a different value of stringer pitch for the optimal
design configuration of each panel. This would result in most of or nearly all of
the stringers across the aircraft having to be broken at the ends of each panel
and as a result the structure would prove to be very inefficient and likely fail
under the ultimate applied loads. To solve this problem the stringer pitch value
for the most critically loaded panel was used for all the panels across the
aircraft and the corresponding weight penalty was calculated.
6.2.3 Maintenance Considerations
Despite the structure now having quite a low mass, there were other design
requirements which had to be taken into consideration, namely that the
optimised value of stringer pitch was quite low, approximately 74mm. This led to
a large number of stringers being required across the wingbox and, while this
48
allowed for a low value of skin thickness to be used, the low stringer pitch
meant that the maintainability of the mid-wing section would be compromised as
it may have proved difficult to inspect the stringers for any damage and also to
repair or replace any that had been damaged. After again discussing this design
problem with Dr. Shijun Guo the author resolved to decide upon a stringer pitch
more suitable for maintenance purposes of 150mm, to keep this value constant
across the mid-wing section and redesign the panels based on this new value.
This meant that the local and global buckling stress were no longer equal so
instead the lowest value of buckling stress was used as the design criterion.
The results for the thicknesses of the panels are summarised below:
Stringer Pitch Skin Thickness Stringer
Thickness
Total
mass
First Iteration Variable Variable Variable 1305kg
Second
Iteration
74mm 2.35mm 1.38mm 1546kg
Final Design
(upper)
150mm 3.6mm 3.12mm 1235kg
Final Design
(lower)
150mm 2.8mm 2.8mm 901kg
Final Design 150mm - - 2137kg
Therefore, it can be seen that using a larger and constant stringer pitch to
facilitate the maintenance of the structure comes at a significant weight penalty
of 63.7% when compared to the first iteration of the design. However, as
49
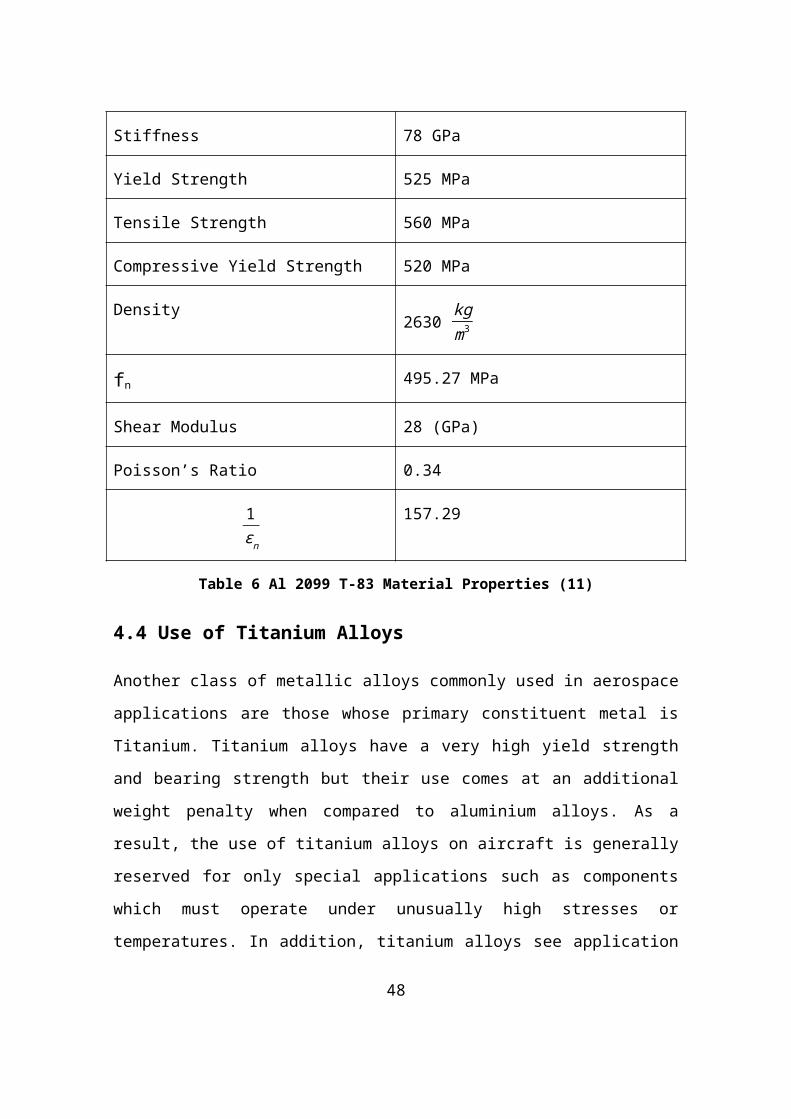
discussed this design represents the optimal configuration if each panel was an
isolated component loaded separately from the others. This is not reflective of
how the panels are used on the aircraft. Therefore a fairer comparison can be
made between the final design’s mass of 2137kg and the mass of the second
set of panels designed which had a mass of 1546kg. The weight penalty is
therefore 38.23% which is still significant but unavoidable as the pitch of 150mm
used was the minimum recommended by Dr. Guo in light of maintenance
considerations.
6.2.4 Skin Pressurisation
The skins also had to be designed to adequately support the loads arising from
the pressure differential between the cargo bay area and the external conditions
during flight. To ensure compliance with the relevant CS.25 requirements the
skins were designed to withstand twice the expected operating pressure
differential. The maximum altitude which the FW-12 is designed to operate at is
42,000ft and the cabin altitude was set by the designer of the Environmental
Control System at 6,000ft. Based on the international standard atmosphere
pressure values at these altitudes the pressure differential across the aircraft’s
skin is 64,164Pa, therefore the structure was designed to withstand a pressure
of 128,328Pa.
To determine the deflections and stresses in the skin panels ESDU data sheet
number 71013 was used. The skins were considered to be attached to the
flanges of the ribs and frames and simply supported by the stringers. The
analysis conducted was the same as that done when designing the pressure
bulkheads and is described in more detail in the section on the spar design.
It was found that the skin thicknesses required to react the wing bending loads
meant that the skins were more than capable of supporting the pressure loads
with reserve factors of greater than two being calculated when the resulting
stresses were compared with the ply failure stresses. Full details of the
pressure analysis can be found in the Detail Stressing Report in Appendix E.
50
6.2.5 Results and Composite Layups Chosen
Once the thickness of the components had been calculated the layups of the
composite plies used to manufacture each component could be decided. The
layups were chosen from those listed in ESDU 82013, entitled “Laminate
Stacking Sequences for Special Orthotropy” (13). Using these layups ensured
that the distortion during manufacture was kept to a minimum as the bending
and twisting moments as well as the end load and shear loads which the
laminate experiences are all uncoupled.
The dimensions of the manufactured panels will differ slightly from those
analysed using TW Panels because the plies used each have a fixed thickness
of 0.184mm. The “exact” number of plies needed to achieve the calculated
thicknesses was determined and then rounded up to the next whole number
rather than rounded down to ensure that the manufactured panels were not
weaker than those designed. In the “Detail Stressing Report” in Appendix E the
theoretical panel dimensions are used and so the reserve factors calculated in
the report represent a conservative estimate of the panels’ ability to support the
applied loads.
Below are the layups chosen for the skin and stringers in the upper and lower
panels:
No. of
plies
Layup Chosen ESDU Ref.
No
Manufactured
Thickness
Upper
Skin
20 [-45/0/-452/90/02/452/-45]s S27 3.68mm
Upper
Stringer
17 [45/-45/90/0/-45/02/45]s [0] S50 3.128mm
51
Lower
Skin
16 [45/-452/0/452/-45/90]s S8 2.944mm
Lower
Stringer
16 [45/-45/0/-45/0/45/90/0]s S5 2.944mm
Table 7 Ply Layups for Skin/Stringer Panels
The layups for the stringers were chosen such that there were a large number
of plies aligned along the axis of loading (0o) i.e. in the spanwise direction. This
was so that the stringers could better support the compressive and tensile loads
to which they are subjected. The layups for the skins were chosen due to the
high number of plies which are aligned at either 45 or -45 degrees to better
support any shear stresses they are subjected to. All layups chosen still have at
least 10% of the plies aligned normal and parallel to the loading axis as
recommended in the lecture series on composite materials (14).
The material properties for the individual plies which were presented in Chapter
4 were entered into the in-house software CoALA along with the layups chosen
and the resulting material properties for the laminates were calculated. A
sample of the results obtained as well as the file input to the software can be
found in Appendix D.
Finally, it should be noted that in manufacturing the skin stringer panels, a
copper wire mesh should be included as the first ply in the layup. This is to
protect the structure from the damage, which would be caused during a
lightning strike. The mesh will conduct the electric current and dissipate it
around the aircraft as occurs when metallic skins are used. This is to ensure
that the structure meets the requirements of CS 25.581 and in particular,
section (c)(2), which states that non-metallic components must have a “means
of diverting the resulting electrical current so as not to endanger the aeroplane”
(2).
52
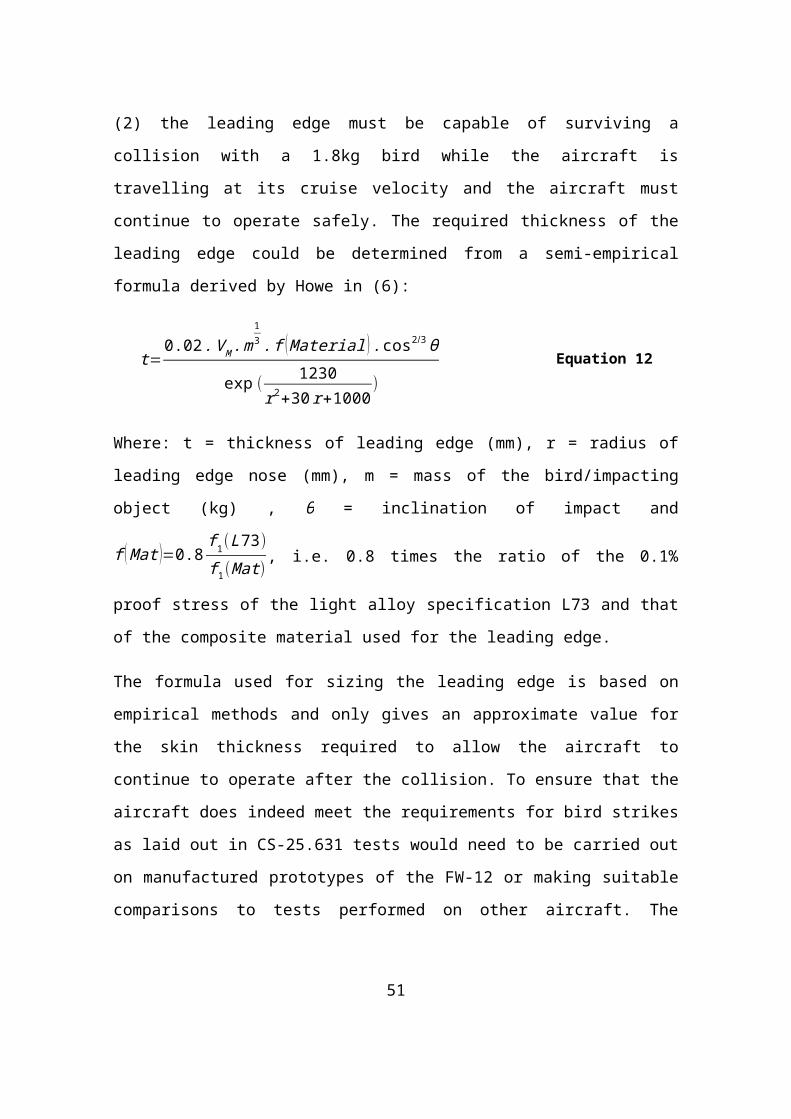
6.3 Detailed Spar Design
6.3.1 Introduction
The critical design case for the spars of the aircraft was ensuring that the web of
the spars were sufficiently thin in order to keep their mass to a minimum but
thick enough to not buckle in shear under the applied loads. To calculate the
required thicknesses the spar of the web was assumed to behave like a number
of rectangular plates loaded in shear with the dimensions of the plate being
determined by the pitch of the horizontal stiffeners and of the ribs and frames to
which the spar was attached. The calculations were performed using data from
ESDU data sheet number 71005 entitled “Buckling of Flat Plates in Shear” (15).
6.3.2 Shear Buckling Analysis
To determine the buckling stress, first the buckling coefficient K needed to be
found. This is a function of the pitch between the vertical and horizontal
stiffeners which supported the spar sections. The horizontal stiffeners were
attached to the web of the spars at a pitch of 300mm while the vertical support
was provided by attaching the spars to the flanges of the ribs and the light
frames. Thus, the parameter “b” was constant and equal to 300mm and the
parameter “a” was equal to the distance between the rib and frame supporting
the web, which varied slightly from one location to another. As the shorter sides
of the rectangular plates were bolted to the flanges of the ribs and frames, the
curve on Figure 1 of ESDU 71005 corresponding to a plate whose shorter sides
are clamped was used. Once the value of K had been determined, the stress
which would cause the spar web to buckle could be calculated:
qbe1=K∗E∗( tb )2
Equation 23
where E is the Young’s modulus of the material, t is the web thickness and b is
the length of the shorter side of the plate.
53
This stress value is based on a value for K determined from data from
experiments using materials with a value of Poisson’s ratio ( ν ) of 0.33. For the
material used for the spars, 2099 T-83, the value of ν is 0.34. To account for
this the stress is multiplied by the following factor:
r= 0.91
1−ν2 Equation 24
So that:
qbe=r∗qbe1 Equation 25
qbe represents the elastic shear buckling stress for the panels, however,
depending on the spar thickness, the stress required to make the panels buckle
could be high enough that plasticity plays an important role in the buckling.
Hence the value of qbe is compared to the value of f n of the material to
determine the plasticity reduction factor using Figure 2 of ESDU 71005. It was
found that the thicknesses required of the spars were sufficiently small that the
buckling stress would not cause appreciable plastic deformation to the plates
and hence the plasticity reduction factor was found to have a value of 1 for all
the cases considered. So the buckling stress for the plate, qb equalled the value
of qbe as calculated above.
To ensure that the spar webs would not buckle, the applied stress had to be
less than the calculated value of qb. As shown in the previous chapter, the shear
stress applied to the spars was calculated as follows:
σ app=
V i
t i+ T2 A
t i
The thickness of the spar webs was set as the minimum value which satisfied
the condition of σ appbeing less than qb.
54
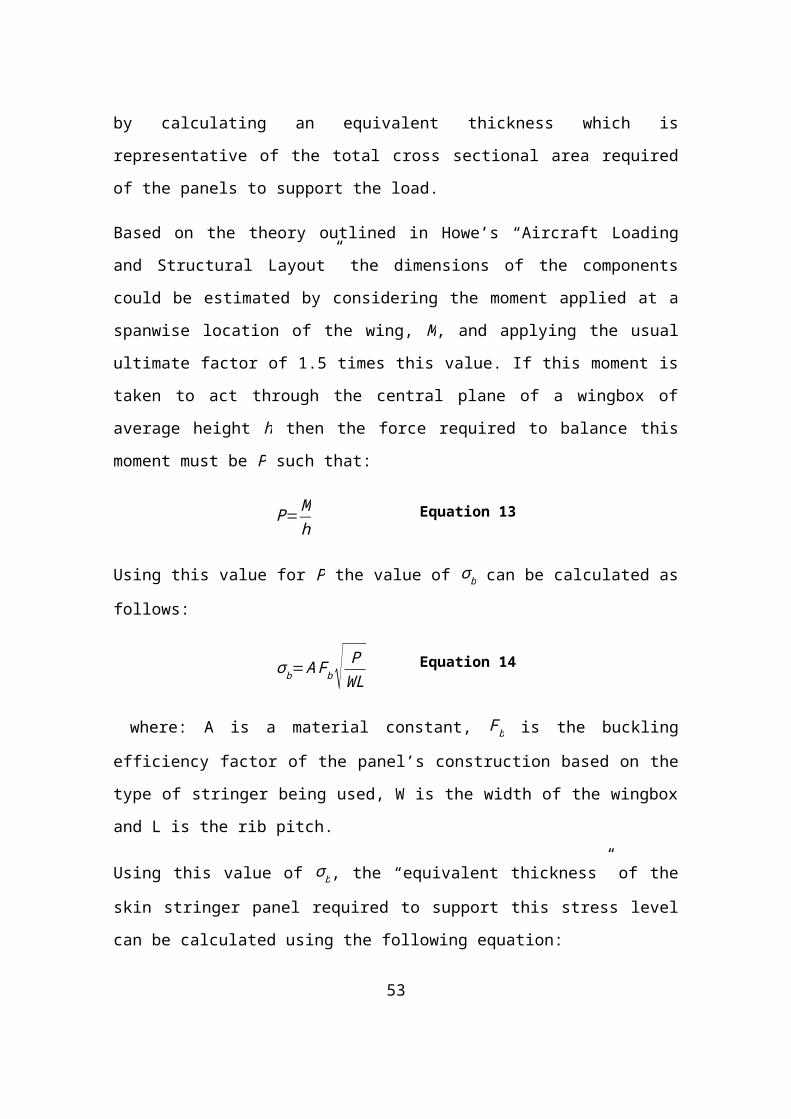
6.3.3 Pressurisation Analysis
Both the third spar and the most outboard rib in the mid-wing section had to act
as pressure bulkheads to maintain the pressure differential between the cargo
bay and the external conditions during flight. The analysis of the bulkhead loads
was identical for both of these components and also for checking that the
skin/stringer panels could support the pressure loads, only the geometrical
values and loads differed.
As mentioned in the previous chapter, there was no method for determining the
initial sizes for the bulkheads. Instead their thicknesses were determined by
using ESDU 71013 entitled “Elastic direct stresses deflections for flat
rectangular plates under uniformly distributed normal pressure” (18). The
rectangular plates which are considered to deform are again those formed
between the horizontal stiffeners and vertical attachments to the flanges of the
ribs and frames and once again the ratio of these sides was a key parameter in
analysing the stresses due to the applied loads. To provide rigid support, the
bulkhead is attached to the flanges of the ribs using bolts as well as being
attached to the flanges of the light frames between the ribs. The horizontal
stiffeners are attached to the opposite side of the bulkhead so that they are not
interrupted by the connection to the ribs and frames. In the case of the
skin/stringer panels the dimensions of the plates were determined by the
stringer pitch and distance between the ribs and frames. The lines where the
various stiffening members support the third spar bulkhead have been projected
onto the spar’s body to indicate the geometry of the pressurised panels and are
shown in the image below:
55
Figure 12: Third Spar and Stiffener Geometry
It was assumed that the edges of the panels were free in translation and fixed in
rotation and then, by using Figures 2, 7 and 8 of ESDU 71013, it was possible
to determine the deflection and stresses which arise in the bulkheads due to the
pressure differential. The thickness of the bulkheads as well as the geometry of
the stiffeners could then be adjusted until acceptable stress and deflection
levels were achieved.
To determine the thickness required of the bulkhead the largest rectangular
panel was considered. The spacing between each of the ten horizontal
stiffeners was constant at 300mm and the largest distance between a rib and
light frame was 412.5mm. This meant the largest of the rectangular plates
would have a value of a = 0.4125m and b = 0.3m. Based on these values the
maximum deflection and various stresses in the panels could be calculated, the
detailed calculations on the bulkhead sizing can be found in Appendix E.
As described earlier the bulkhead is vertically stiffened by being bolted to the
ribs and frames and also stiffened by horizontal stiffeners on the aft side of the
panel. The horizontal stiffeners are integrally machined into the bulkhead and
56
the thickness of the bulkhead is kept constant at the value calculated for the
largest panels rather than varying the thickness for the local stresses and
deflections.
6.3.4 Spar Caps
The skins of the aircraft had been designed to withstand the wing bending loads
on their own while the spars had been designed to withstand the shear loads
due to the aerodynamic loading. As a result the spar caps, which were designed
later on in the project, are not absolutely necessary in order to support these
loads, rather they provide some redundancy to the structure as they are
designed to take a portion of the load which the panels can take on their own.
Furthermore the spar caps also stabilise the spars by providing attachment
points to the aircraft’s skins. The spar caps are L-shaped and placed at the top
and bottom of the spar webs forming C-shaped spars. The proportion of the
total force applied which acts through the spar caps is assumed to be equal to
the ratio of their area to the area of the spar caps and the panels combined:
Pcaps=Pult∗Acap
Acaps+Apanel
To make manufacturing the spars much easier, the thickness of the spar caps is
equal to the thickness of the webs. As a result, the spar caps can be
manufactured from the same sheet of material as the webs by bending the ends
of the metal to the required angle. Note that this angle is not necessarily 90
degrees as the spar caps have been designed to follow the inside of the
aerodynamic surface and therefore the angle varies along the length of the
spars. The dimensions of the spar caps are as shown below:
57
Figure 13 Spar Cap Dimensions
6.3.5 Results and Discussion
Based on the loads discussed in this section the thickness of the spars and the
dimensions of the stiffeners used to support them were calculated to ensure
that reserve factors above one were achieved for all failure cases. The
calculated value of the spar thicknesses is summarised below:
Spar Number Web Thickness (mm)
First Spar 2.9
Second Spar 3.1
Third Spar 3.25
Table 8 Web Thicknesses for forward mid-wing spars
The pitch of the horizontal stiffeners was 300mm for all three of the spars and
as the spars are vertically stiffened by attachment to the ribs and frames the
pitch of the vertical reinforcements was determined by their spanwise locations.
58
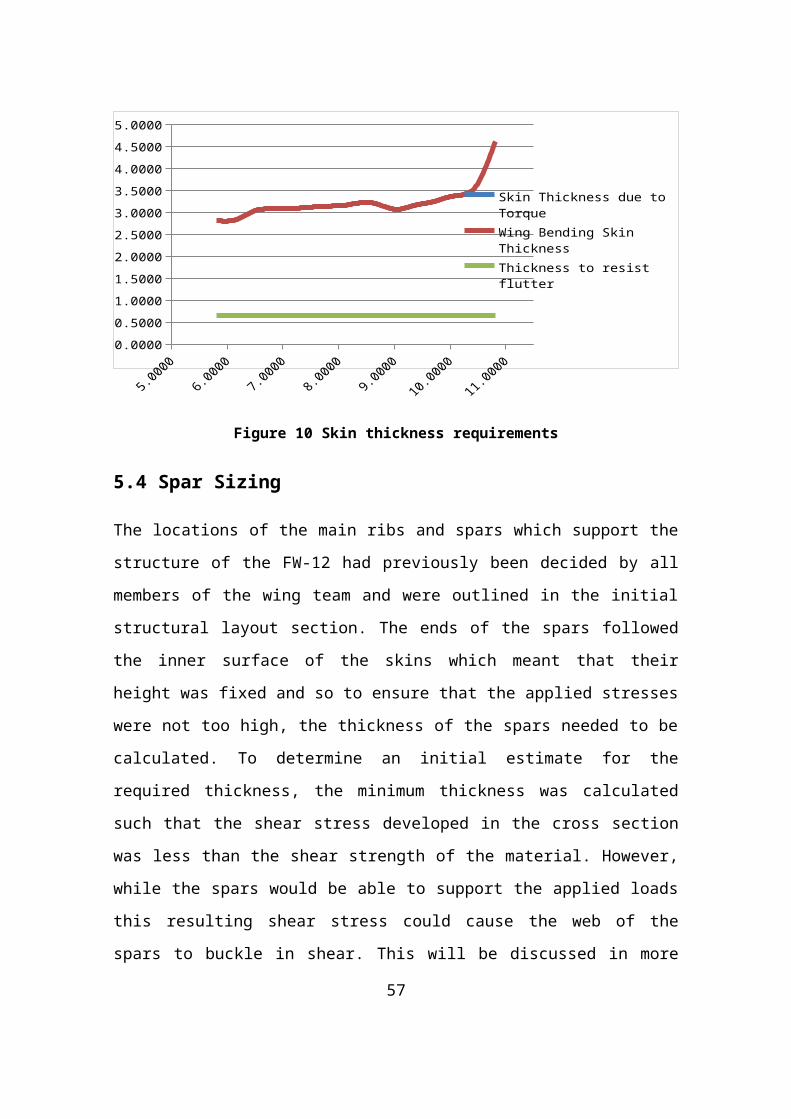
The thicknesses shown in the above table were the thicknesses required to
ensure that the webs would not buckle in shear due to the loads applied at the
most critically loaded section of the spars. For other sections of the spars the
loading was less severe and slightly smaller thicknesses could be used.
Furthermore the thickness of the third spar was found to be slightly smaller than
3.25mm but this thickness was chosen to facilitate the manufacture of the spar,
this is discussed in further detail in the section of this chapter entitled
“Manufacturing Considerations”.
6.4 Rib Design
6.4.1 Introduction
The ribs of an aircraft are designed to meet a number of functions and roles as
they are responsible for transmitting the aerodynamic forces produced by the
lifting surfaces to the rest of the structure as well as maintaining the shape of
the aerofoil which produces these forces. The ribs in the mid-wing section ran
parallel to the centre line of the aircraft and required large cut-outs through their
webs to allow for the cargo bay section.
For the purposes of the GDP one heavy rib and one light rib are chosen to be
designed in detail. A light rib is the term given to a rib which only needs to carry
air loads and a heavy rib is one that has an additional high intensity load applied
to it such as when connected to the landing gear of the aircraft or to a trailing
edge device. Although all of the ribs in the mid-wing are technically heavy ribs
as they have to support the weight of the cargo carried by the aircraft a light rib
has been designed by assuming these loads to be negligible. The total mass of
the cargo carried by the aircraft is 3937kg which is split between the two cargo
bays and then supported by the six ribs in each section so each rib has to
support only one twelfth of this weight so the loads applied are quite small.
Furthermore a significant proportion of the cargo will be carried as carry-on
luggage in the cabin so the loads are even smaller still and therefore neglecting
59
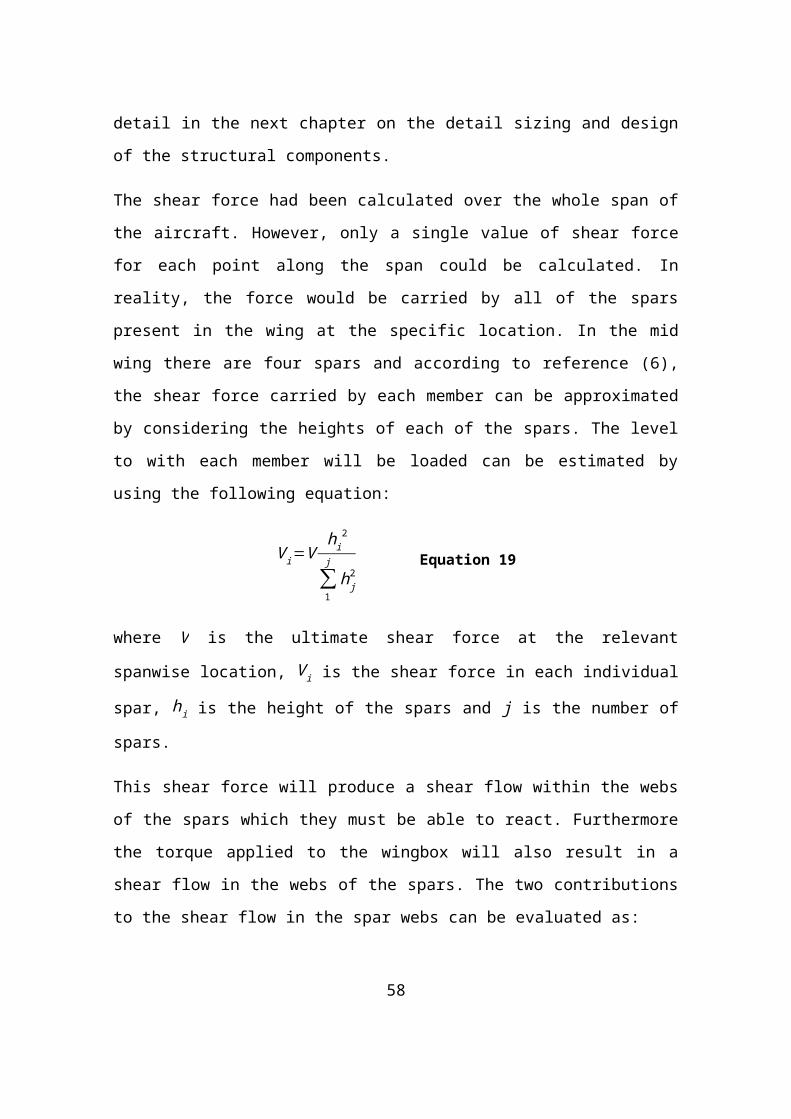
these loads in order to meet the GDP requirements of designing a light rib was
deemed to be reasonable.
6.4.2 Rib flange design
6.4.2.1 Aft Pressure Bulkhead Connection Flanges
The design of the ribs was slowed by the major delay in calculation of the
chordwise distribution of the loads applied to the aircraft. Without this data it
was not possible to size the thickness of the web of the ribs. Instead, focus was
first paid to designing the flanges of the ribs as it was to these flanges that the
aft pressure bulkhead, spars and aerodynamic surfaces would be attached.
The aft flanges were designed to provide connection points for the bulkhead.
The force which the connection must withstand is comprised of two
components. Firstly the pressure difference between the pressurised cargo bay
and the external conditions acting over the surface area of the bulkhead will
result in a force and secondly the same pressure difference will act on the
interior of the aerodynamic surface to which the ribs are also attached and this
will result in a force acting in the opposite direction to act on the connection:
Fbulkhead=P∗Abulkhead
Fbulkhead=128328Pa∗15.357m2=1,970,733N
To estimate the force acting on the aerodynamic shell its area was measured
from the CATIA model and it was then approximated to be a half cylinder of
equivalent area to the actual shell:
A shell=96.464m2=πdL
2
To help visualise the procedure used for calculating the loads, the actual
pressurised skin area considered and the half cylinder with equivalent area are
shown in the following image:
60
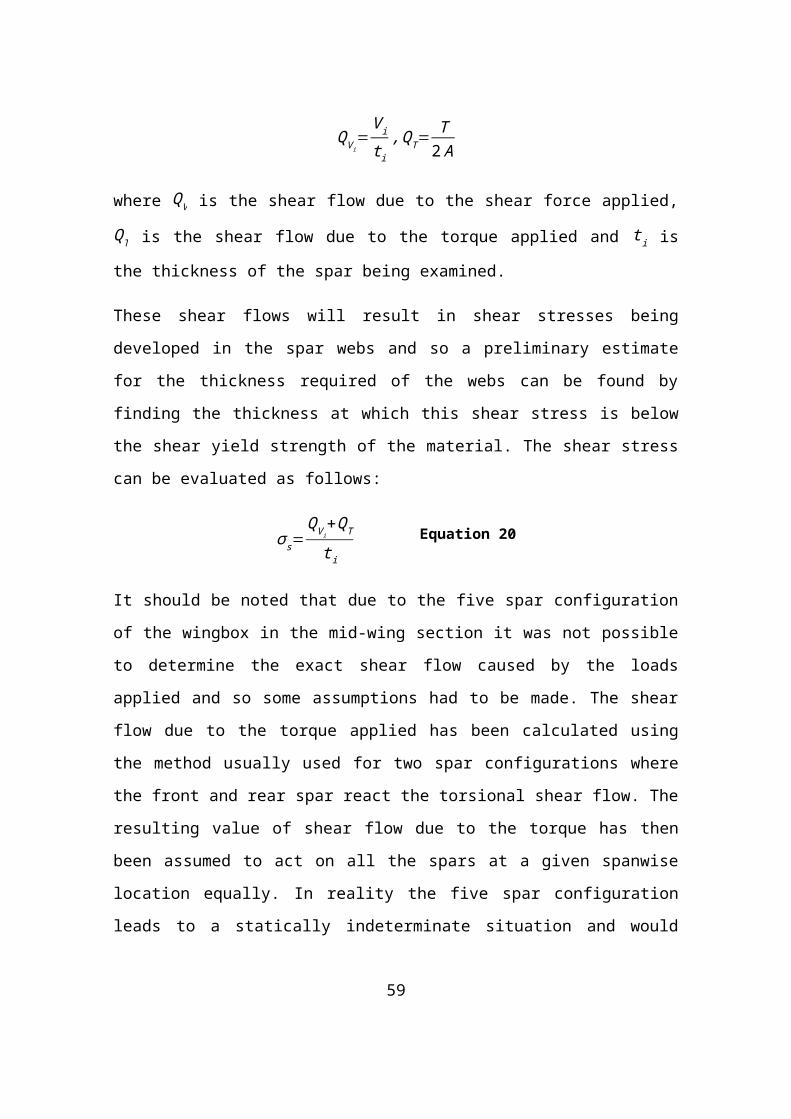
Figure 14 Pressurised Skin Section and Equivalent Cylinder
The width of the mid-wing section (L) is 5.4m so, knowing this, the diameter (d)
of the equivalent cylinder was found to be 11.372m. The force due to the
pressurisation of the shell can then be estimated as the force produced by the
pressure acting over a rectangle measuring 5.4m by 11.37m:
F shell=5.4∗11.37∗128328=7,880,736N
So the total force which the connection must support is:
F total=F shell+Fbulkhead=9,851,469N
Several designs were then considered as there are numerous bolt sizes
available. Eventually a design which was able to support the load was finished
consisting of 4BA bolts spaced 5.6 diameters apart along the flanges of the rib.
However this design was then decided against as it is recommended to not use
bolts with diameters smaller than approximately 6mm for structural design
purposes. This is because a maintenance worker would typically have sufficient
strength to over-tighten a bolt with a diameter smaller than 6mm and if this were
to occur damage would be done to the threads of the bolt which would
compromise their strength. In light of this the design process was repeated
using ¼ inch diameter bolts as this is the recommended minimum bolt diameter
for structural design purposes (17). Using these bolts the connection was sized
to ensure that the flanges would not buckle under the applied load. The inter-
fastener buckling stress could be calculated as shown:
61
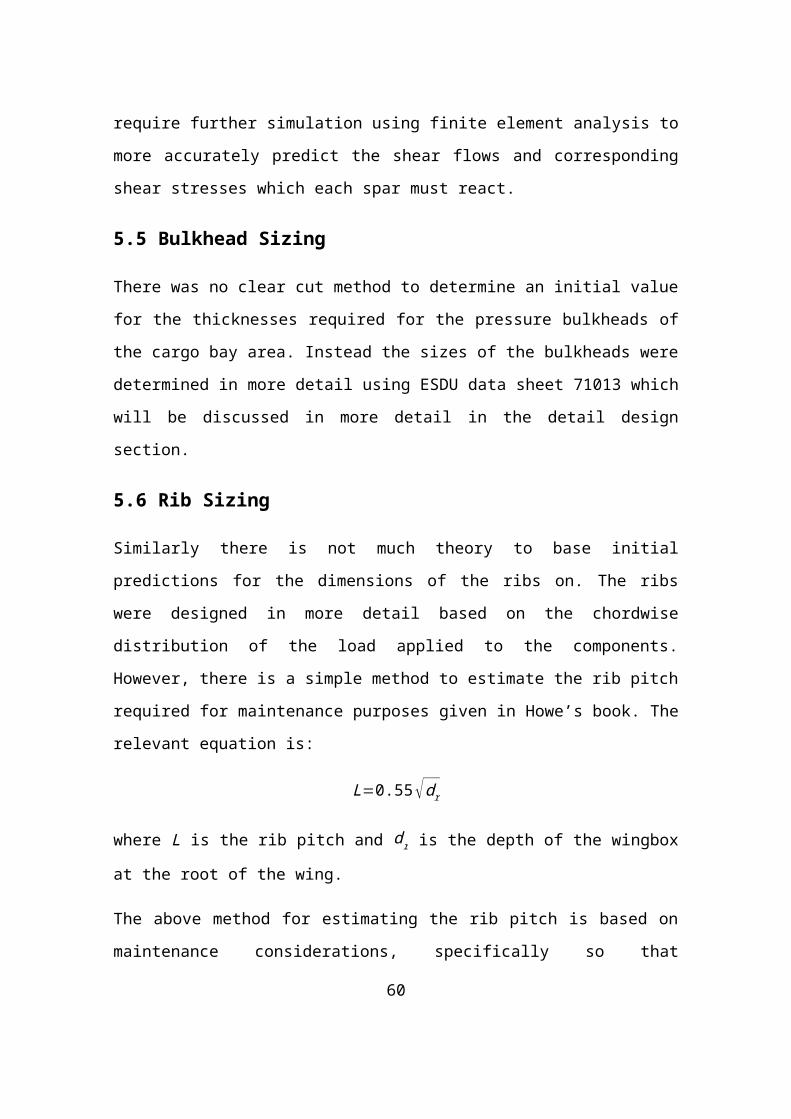
σ IF=K12 ( π∗t f
Lb∗D )2
Equation 26
where K is the fixity coefficient of the fasteners used, t f is the thickness of the
flanges, Lb is the fastener pitch and D is the fastener diameter.
The thickness of the flanges and pitch of bolts required to ensure that the
flanges did not buckle could therefore be calculated. For a flange thickness of
4.5mm the maximum pitch between the bolts was found to be slightly larger
than with the previous design at 5.75D which meant that a total of 1056 bolts
were used.
However this is twice the number of bolts that are needed to hold the calculated
load due to pressure. By increasing the flange thickness to 6.2mm the pitch of
the bolts could be increased to the recommended maximum value of 8D which
allowed for the minimum number of bolts to be used for the connection. This
reduced the weight of the structure as significantly fewer fasteners would be
needed but this, as always, involved a trade-off with an increase in weight due
to the thicker flanges. Overall though this design should prove to be lighter and
will involve less maintenance as fewer fasteners are used to secure the flanges
to the aft pressure bulkhead.
The width of the flanges was then decided based on the recommended
minimum distance from a free edge of a plate to the centreline of a fastener of
2D. This minimum value is used to reduce the risk of cracking or tearing of the
plate under the applied loads and so the width of the flanges was set at four
times the bolt diameter or 25.4mm, i.e. one inch.
6.4.2.2 Upper and Lower Rib Flanges
Originally it was hoped that the connection could be made using MS20426
rivets which are the most commonly used rivet type for attaching the skin of an
aircraft to the supporting structure (20). These rivets are countersunk so that
their upper surface is flush with the aircraft skin and they form a 1000
penetration angle with the skin of the aircraft. However, it is not good design
62
practice to load rivets in tensile loads and so this should be avoided whenever
possible. In the case of conventional aircraft the pressurisation of the fuselage
results in hoop stresses in the skin, which act to deform the skin such that the
circumference will increase and this change in circumferential length manifests
itself as shear loading on the rivets which attach the skin to the structure. As the
rivets are loaded in shear under these conditions they are efficient at supporting
the applied loads. However, yet another consequence of the pressurisation of
the non-cylindrical fuselage of the FW-12 is that the rivets used to attach the
skin are predominantly loaded in tension owing to the fuselage consisting of
much flatter surfaces.
The author consulted Mr. Phil Stocking on advice on how to deal with this
problem and was advised that the acceptable tensile load which could be
applied to the rivets could be taken as one tenth of their maximum strength in
shear. The force acting on the aerodynamic shell due to the pressurisation had
already been calculated when designing the flanges of the rib which connect to
the aft pressure bulkhead. It was estimated that the total pressure load acted
equally on both the upper and lower skin panels and so each set of rivets had to
withstand half of the applied load. It was found, under the assumption of the
rivets being able to support one tenth of their shear strength in tension, that it
would not be possible to use rivets to react the pressure load as the number of
rivets needed exceeded that which could be fit through the flanges.
The upper and lower flanges of the ribs are therefore attached to the skins of
the aircraft using countersunk bolts. The flanges are cut to allow the stringers to
pass through and each section of the flange has three bolts passing through.
For composite materials, it is recommended that the maximum pitch of 9D be
used when fastening pressurised skin sections to the supporting structure in
order to minimise the number of holes cut through the skin (19). Three equally
spaced bolts are used in each flange section to ensure that this 9D pitch is
achieved and again the bolts are located such that there is the minimum
63
required distance of 2D between their centrelines and the free edges of the
flange plates. The skin connection flanges of the ribs are shown below:
Figure 15 Rib/Skin Connection Geometry
Knowing the required pitch of the bolts, the total number of fasteners used in
the connection is easily calculated. Based on the number of bolts required and
the load applied, the bolts used in the connection must have a tensile strength
of 1.996kN. Based on this value any of the bolts listed in the Detail Stressing
course’s stressing data sheets would be easily capable of supporting the load.
However to ensure that the bolt pitch is 9D, a bolt of 6.35mm diameter is
required and countersunk 1/4” UNF bolts are suitable.
Due to the delay in the calculation of the chordwise load distributions the
thickness required of the flanges to resist buckling under the applied bending
moment remains as work to be done. The method of calculating this thickness
however is the same as that presented earlier for the flanges which connect to
the aft bulkhead and the thicknesses would have been determined using this
procedure had more time been available.
6.4.3 Rib Webs
Eventually the delay in the calculation of the chordwise load distribution led to
the author having to determine this data for the mid-wing section himself as it
was needed to complete the design of the ribs. The method for calculating the
required values took some time to determine as thought had not previously
64
been given to how to calculate the data as the author was not assigned to do
this task. The method used in calculating this data and designing the ribs
accordingly is described below. The procedure for designing the webs is
described for the light rib but the same method was employed for the design of
the heavy rib, the only difference being that there were additional loads
considered for the heavy rib. The rib is strengthened by vertical and horizontal
stiffeners which assist the web in resisting shear buckling. There were two
horizontal stiffeners and a total of 45 vertical stiffeners machined along the
entire length of the rib.
To begin the sizing of the light rib the air load which would be applied to it was
calculated by determining the difference in shear force which occurred at half
the rib pitch on either side of the rib from the loading envelope, the value of this
load was found to be 51,887N.
According to reference (6), the shape of the pressure distribution across an
aerofoil can be approximated as being characterised by a quadratic equation in
terms of the normalised length of the chord:
P=a x2+bx+c Equation 27
The constants a, b and c can be determined based on the assumptions that the
pressure at the trailing edge is zero, the integral of P x with respect to x from 0 to
the end of a unit chord (i.e. at x = 1) is unity and the moment of the area under
that curve about the origin is equal to the value of the centre of pressure x
CITATION Den04 \l 2057 (6). This leads to the equation:
P=6 [1−2 x+(8x−3 ) x+2 (1−3 x ) x2 ] Equation 28
A single value of the centre of pressure location is required for this equation,
however the centre of pressure varies across the mid-wing section and so was
assumed to be at a quarter of the local chord length from the leading edge. This
is usually a good approximation for subsonic aerofoils, so for x=0.25:
P=3 x2−6 x+3 Equation 29
65
This gave the overall shape of the pressure distribution which could then be
scaled accordingly so that it gave the loading along the chord of the rib. Below
is the distribution of the airload applied to the light rib situated at 9.725m
outboard:
0 2 4 6 8 10 12 14 160
2000
4000
6000
8000
10000
12000
Chordwise Load Distribution for Light Rib
Chord Length (m)
Air
Loa
d (N
/m)
Figure 16 Chordwise Load Distribution for Light Rib
To ensure that the distribution had the correct magnitude the graph was scaled
so that the integral of the curve shown above along the length of the chord was
equal to the total value of the force which the rib would be subjected to.
Next it was required to determine the shear force and bending moment
diagrams for the rib based on the above load distribution. Methods of
calculating these data had been presented by Mr. Phil Stocking in the Detail
Stressing lecture series (14). However, the methods presented were most
applicable to conventional aircraft wing boxes consisting of no more than three
spars. On the FW-12 the wing-box consists of 6 spars in some places and
essentially incorporates the entire aircraft. This meant that an alternative
method of calculating the required data was needed and so the Strand7 finite
66
element software package (21) was used to determine the required shear loads
and bending moments. The calculated air load distribution was applied to a
model representing the rib which consisted of a series of beam elements the
total length of which was equal to the actual rib length and the height of which
was the average height of the rib. The resulting shear force and bending
moment diagrams are shown below and a detailed description of their derivation
can be found in Appendix C
0 2 4 6 8 10 12 14 160.00E+00
2.00E+00
4.00E+00
6.00E+00
8.00E+00
1.00E+01
1.20E+01
Light Rib Shear Force Distribution
Chordwise Location (m)
Shea
r For
ce (N
)
Figure 17 Light Rib Chordwise Shear Force Distribution
67
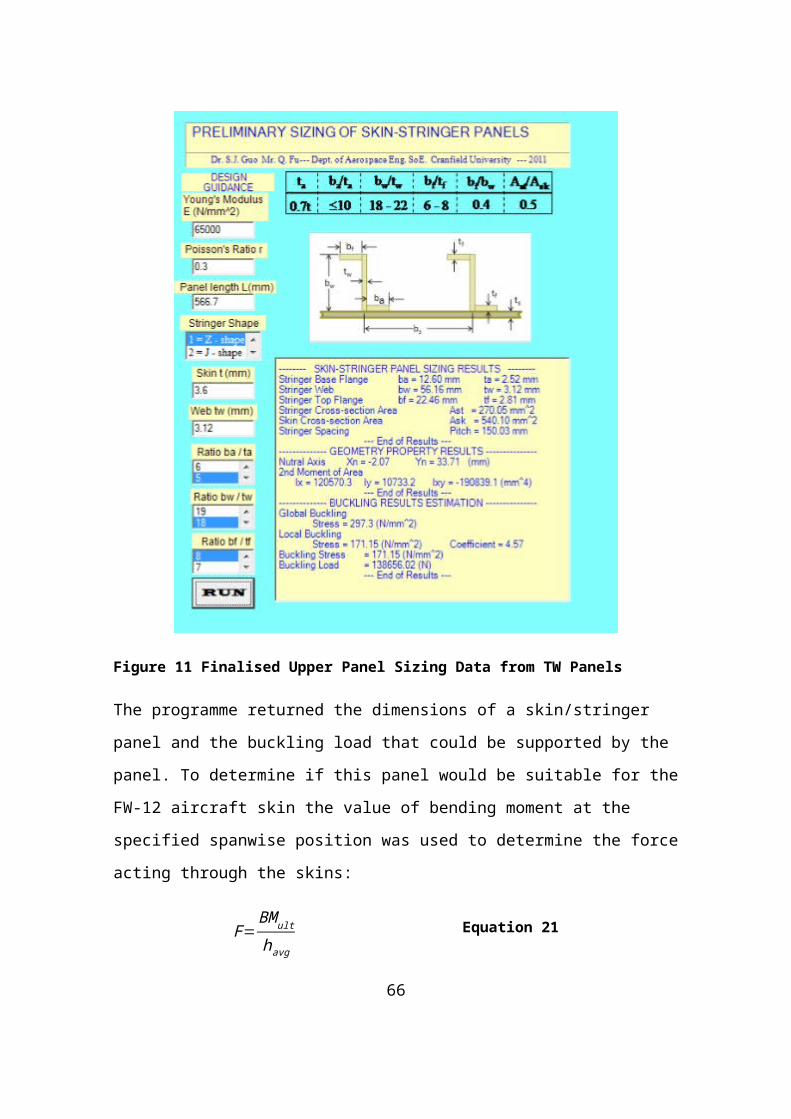
0 2 4 6 8 10 12 14 16
-6.00E+03
-4.00E+03
-2.00E+03
0.00E+00
2.00E+03
4.00E+03
6.00E+03
8.00E+03
1.00E+04
1.20E+04
Light Rib Bending Moment Distribution
Chordwise Location (m)
Bend
ing
Mom
ent (
Nm
)
Figure 18 Light Rib Chordwise Bending Moment Distribution
Once this data had been calculated the rib could be designed to support the
applied loads.
6.4.4 Rib Design Requirements
6.4.4.1 Web Shear Buckling
The thickness of the webs of the ribs was determined in a similar fashion to
those of the spars as the loading cases are similar, i.e. the webs of both
components are loaded in shear. The ribs are loaded as they transmit the air
loads to the spars and this produces a shear stress, which if above a certain
value, will cause the web to buckle. So the required thickness of the rib webs is
the value at which the ultimate applied maximum loads will not cause them to
buckle. The methodology is the same as that outlined in designing the spar
webs and involved using ESDU 71005 to determine the buckling stress of for
the webs. The web is again considered to consist of numerous rectangular
plates loaded in shear and the dimensions of the plates are defined as the
distance between one of the horizontal stiffeners and a free edge of the web in
one direction and the pitch of the vertical stiffeners in the other. The vertical
stiffeners are added to the rib web to ensure that it can support the crushing
force applied due to the bending of the wing, commonly referred to as the
68

Brazier Loads and also to adjust the size of plates loaded in shear and thereby
improve the web’s ability to resist shear buckling. These plates are considered
to be simply supported along their sides which differs from the spar design
where the shorter sides were considered clamped because they were bolted to
the flanges along these sides.
6.4.4.2 Brazier Loads
When an aircraft wing generates upward lift the upper surface is put under
compression and the lower surface under tension. This implies that there is a
compressive deformation between the two surfaces through the plane of the
ribs’ webs and this deformation leads to forces in the webs which could cause
them to fail by buckling which would in turn ruin the aerodynamic shape of the
wing. To prevent this from occurring vertical stiffeners are added to the rib. The
stiffeners are spaced along the length of the rib and their pitch determines the
width of the plate loaded in shear. In designing these stiffeners it has been
conservatively assumed that they react all of the compressive load when, in
reality, the web itself will also react some of the load.
A method of evaluating the magnitude of the Brazier loads is given by Niu in
Airframe Stress Analysis and Sizing (20) whereby the crushing pressure Pcrush
can be estimated as:
Pcrush=2N2
E te havg
Equation 30
where N=BMult
havgc=¿the ultimate load intensity (N/m), t e=¿equivalent skin
thickness, E = skin’s Young’s modulus and havg is the average height of the
vertical stiffener.
Once this crushing pressure has been determined and assuming that the
stiffeners take the entire resulting load, the stress which each stiffener is
subjected to can be calculated:
69
σ crush=Pcrush . L .c
n . AEquation 31
where L is the rib pitch (m), c is the chord length (m), n is the number of vertical
stiffeners and A is the stiffener area (m2)
This stress can then be compared to the Euler buckling stress for the stiffeners
to ensure that they can take the load without failing due to buckling:
σ E=Et( π . kL )2
where Et is the tangent modulus of the material, L is the buckling length of the
stiffeners, and k is the radius of gyration of the stiffeners.
The design of the rib could be varied by adjusting the dimensions of the
stiffeners. If the cross sectional area of the stiffeners was increased then fewer
were needed but this would increase the area of the panels which the buckling
analysis was performed on. The finalised design consists of a total of 45
stiffeners and based on the resulting plate geometry the web thickness for the
light rib was found to be 2mm.This is the recommended minimum thickness
based on the capability of machining techniques (19) and 45 stiffeners were
used so that this thickness could be achieved as this led to the lightest
achievable rib design. The details of the design calculations can be found in the
Detail Stressing report in the appendices.
6.4.4.3 Horizontal Stiffeners
The flanges of the rib are cut to allow for the stringers to pass through which in
turn means that the flanges cannot support the bending moment applied to the
ribs. For this reason, horizontal stiffeners are also machined into the ribs. The
horizontal stiffeners are sized in order to take the bending moment applied to
the ribs which was calculated using Strand7. For the cargo bay section of the
rib the maximum bending moment on the light rib is -5103Nm. By assuming that
the stiffeners act as simply supported beams, the maximum stress due to this
bending moment can be calculated and the dimensions of the stiffeners can be
70
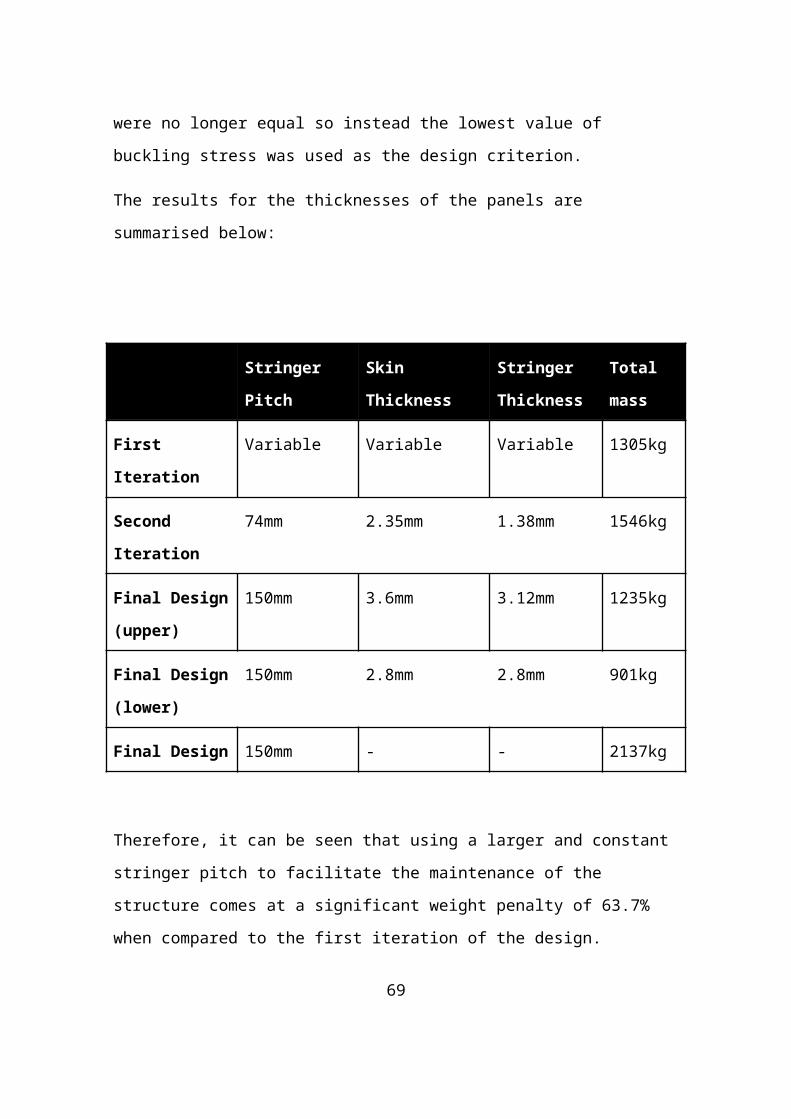
altered so that this stress does not lead to failure. Again, the detailed design
calculations can be found in the Detail Stressing Report.
6.4.5 Heavy Rib Analysis
The heavy rib which was chosen to be designed in detail was located at 6.525m
outboard and connected to the outboard main trunion of the landing gear. The
method of designing the heavy rib is identical to that used for the light rib but
with the additional requirement that the rib must be able to support the load
resulting from this attachment to the main landing gear. The value of this load
was provided by Mr. Julien Ertveldt and it was applied at the connection point
using Strand7. As with the light analysis of the light rib, the rib was represented
as a series of beam elements with the total length of the model being equal to
the length of the actual rib and its height equal to the rib’s average height. The
loads both due to the aerodynamic forces and the landing gear attachment
which were applied to the model are shown below with the air loads shown in
white and the landing gear loads shown in light blue:
Figure 19 Loads applied to heavy rib Strand7 model
The most severe load which could be applied by the main landing gear to the rib
was the one which was analysed and corresponded to the gust case where the
gust causes the aircraft to experience a 3.58g acceleration. Taking the upward
gust case, the resulting inertial load from the landing gear acts downward and in
the opposite direction to the lift force as shown in the above figure and so this is
how the loads were applied to the model.
71
The process of designing the light rib was then repeated based on the values of
the shear force and bending moment applied to the heavy rib calculated using
Strand7. The web thickness required to support the loads applied by the main
landing gear attachment was found to be 8.5mm. This is considerably higher
than the 2mm web thickness required for the light rib which is to be expected as
the main landing gear attachment loads represent some of the most
concentrated and high magnitude loads on the aircraft.
6.4.6 Results and Discussion
The goal of carrying out the rib analysis discussed in this section was to
determine the web thickness required to support the loads applied to the ribs.
To achieve this the bending moment and shear force applied to the rib was
calculated and then the web was designed to take the shear load and two
horizontal stiffeners were designed to take the bending moment. Vertical
stiffeners were also employed to improve the web’s capability to resist buckling
under the shear loads. This in turn allowed for the web thickness to be varied by
changing the number of vertical stiffeners used. The results of the rib design
process are shown below:
Component Web Thickness (mm)No. of vertical
stiffeners
Light Rib 2 45
Heavy Rib 8.5 50
Table 9 Rib Web Thicknesses
The values of web thickness shown above are those which were calculated for
the ribs within the cargo bay section which were the most heavily loaded
sections. The methodology of determining the thicknesses required for all other
rib sections in the mid-wing is the same as was outlined in this section only with
different loads and geometries considered. For the GDP it is only necessary to
72
design one light rib and one heavy rib to demonstrate understanding of the
process involved in doing so, this has been shown here.
6.5 Maintenance Considerations
It is vital that the structure is designed in such a way that it is accessible to
maintenance workers. This is required both for the purposes of inspecting the
structure for any damage and to facilitate the work required to repair this
damage and for general maintenance of the vehicle.
As the forward mid-wing encompasses the cargo bay much of the structure can
be easily visually inspected from this large open space. The upper panels can
be fully inspected from the cargo bay as can the upper portion of the spars and
ribs.
Originally it was hoped that a novel method of inspecting the structure beneath
the cargo floor could be designed whereby access would be provided through a
trap door in the cargo bay floor and then holes could be cut in the webs of the
ribs to allow access to each of the panels. However, after much discussion of
this concept with the cargo bay designer it was eventually decided that it would
not be feasible as there was not sufficient space in the cargo bay floor after its
numerous redesigns to include this access door.
Accordingly some holes were cut in the lower skin panel to allow for access
panels to be installed so that the structure beneath the cargo floor can be
inspected. The holes are elliptical in shape as this means that the maintenance
covers can be inserted back into the aircraft and then rotated and secured in
place but will not physically fit back through the hole without being rotated
again. This ensures that it will not be possible for the pressure load applied to
the cover to remove the cover once it is reinstalled by a maintenance worker
after inspection. The location of the maintenance holes in the lower skin surface
can be seen below:
73
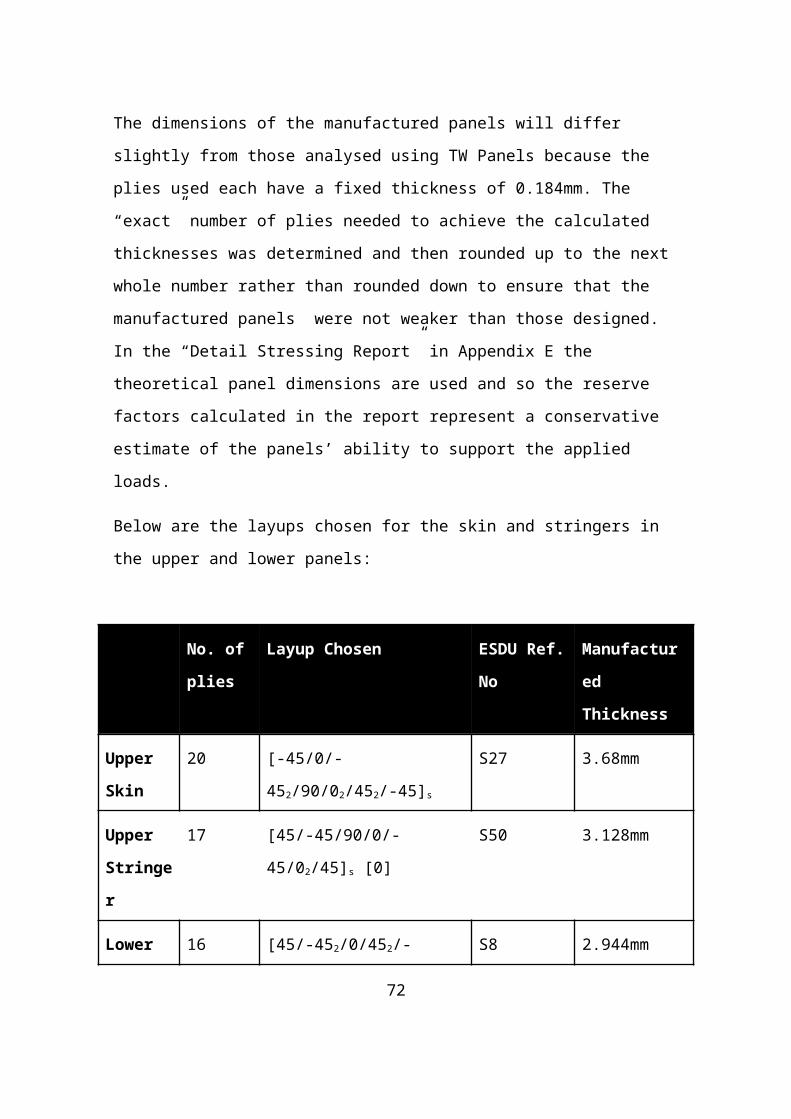
Figure 20 Lower Skin Panel Showing Maintenance Hatch Holes
Two rows of holes were cut for maintenance hatches as the portion of the
structure which is forward of the second spar would not be accessible via the aft
row of holes due to the web of the spar in between.
As can be seen in the above image some of the stringers needed to be
removed in order to cut the maintenance holes in the surface, in total four
stringers were removed, two for each row of holes. This was not a problem for
the holes cut to inspect the forward section of the structure as the number of
stringers used here was dictated by the use of the same value for stringer pitch
at the more critically loaded outboard section. Therefore more stringers than
were required to in this area were present initially and so the removal of the two
stringers did not have a critical effect on the structure’s capability to support the
applied loads.
To confirm whether or not the removal of the two stringers along the aft row of
holes would compromise the structures ability to support the applied loads, the
area of the panels was recalculated without these two stringers. The stress due
to the applied loads was then re-evaluated and it was found that the stress was
still below the local and global buckling stresses calculated using TW Panels.
74
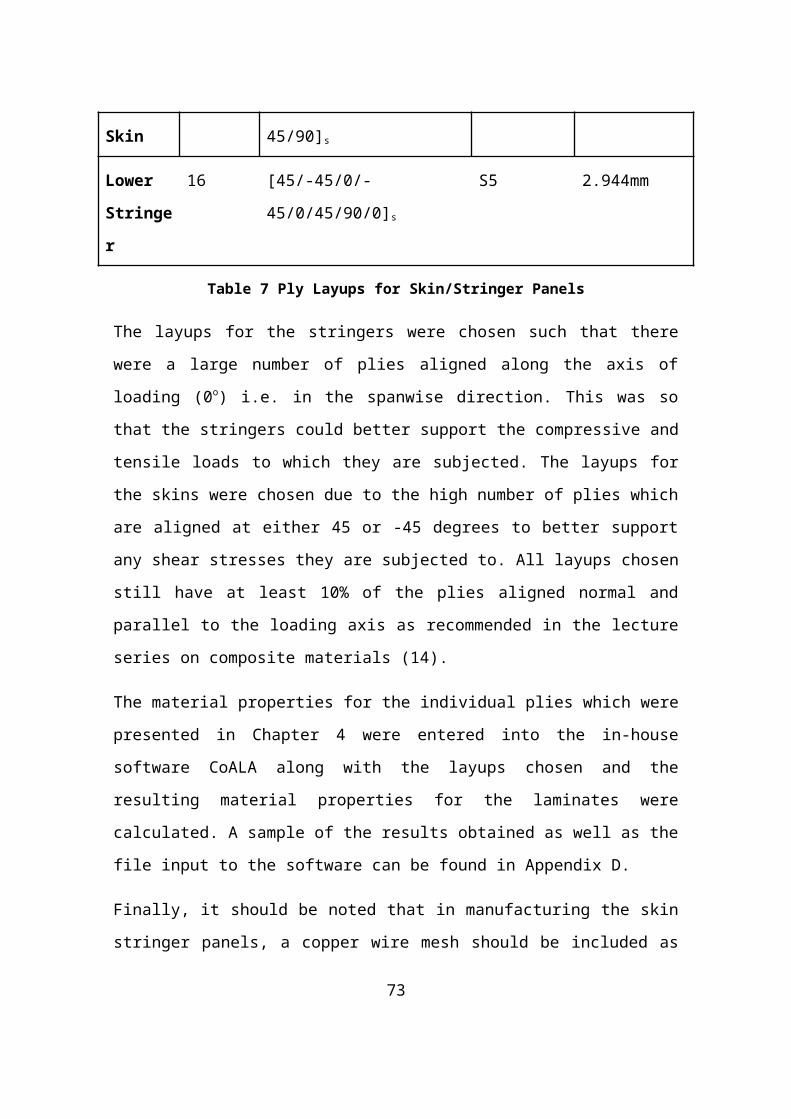
Therefore the removal of the stringers did not prevent the structure from being
able to react the applied loads.
The holes however lead to higher stress levels in the aircraft skins in their
vicinity. To compensate for this the area around the holes needs to be
thickened to ensure there is sufficient material present to support the loads. To
estimate the reinforcement required ESDU data sheet 09014, entitled “Elastic
stress concentration factors. Geometric discontinuities in flat bars or strips of
isotropic material” was used (23). As the title of the data sheet suggests, it was
assumed that the skin was made from an isotropic material and completely flat
in order to simplify the analysis, this was necessary due to time constraints.
Using Figure 5 of ESDU 09014 the stress concentration factor for the holes is
approximately 4.5 and therefore the thickness of the area surrounding the holes
should be increased to 4.5 times the skin thickness, i.e. the thickness of the
surrounding area is 13.25mm. The thickened area around the holes is shown
below:
Figure 21 Hole reinforcement due to stress concentrations
As mentioned above, the original plan for addressing the maintainability of the
structure was to cut holes in the webs of the ribs so that the structure could be
75
accessed via a trap door in the cargo bay floor and then inspected using these
holes. This has the advantage of avoiding having to cut holes in the skin of the
aircraft which lessens their ability to support the applied loads and in particular
cutting or drilling holes in composite materials can prove troublesome because
of the risk of causing delamination between the plies. Furthermore there are
usually holes cut in rib webs to reduce their mass and cutting holes in the webs
is more suitable than doing in the skins as the rib webs are usually less critically
loaded.
Although it was not possible to implement this feature in the final design, the
concept of cutting holes in the rib web was adopted for inspection and
maintenance of the most inboard rib. This rib has the largest average height of
all the ribs in the mid-wing section and therefore its web can still support
considerably high loads even after the maintenance hole has been cut. By
allowing the area of the structure inboard of this rib to be accessed via this hole
it allows for one less hole to be cut in the skin panels which in turn avoids the
disadvantages associated with doing so. This maintenance holes can be seen
in the image below:
76
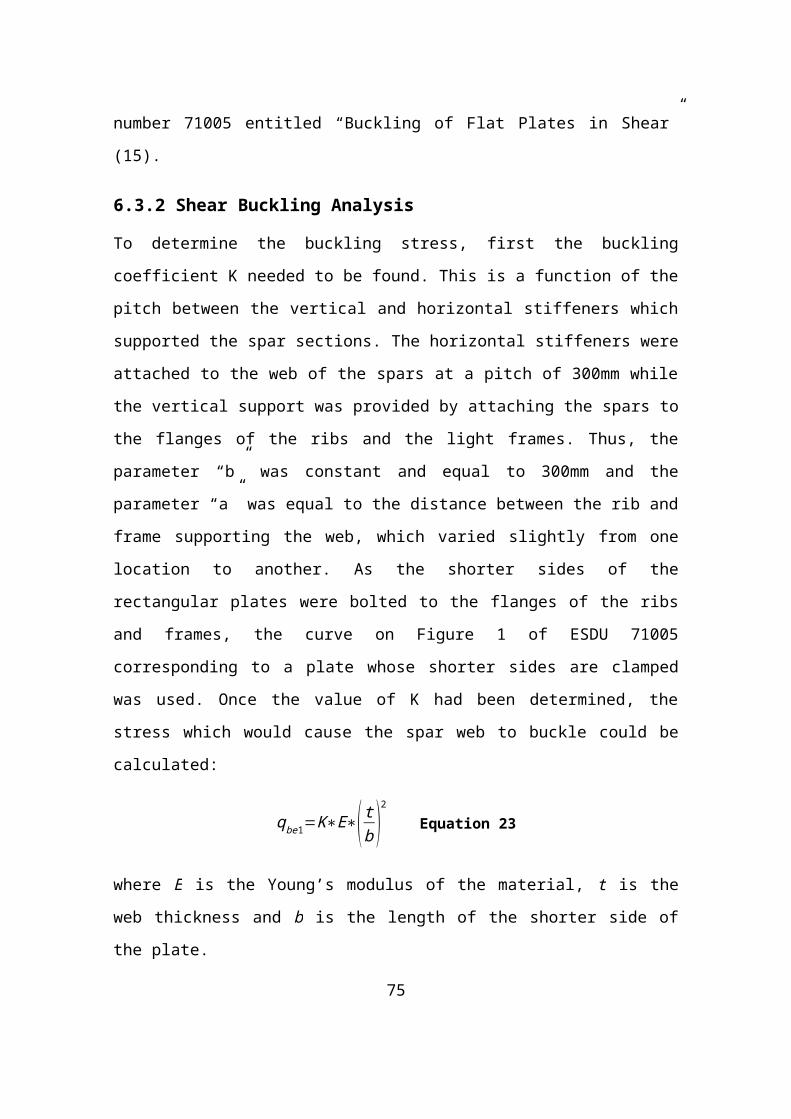
Figure 22 Rib with maintenance hole cut through web
6.6 Manufacturing Considerations
6.6.1 Introduction
This section discusses some of the considerations that have been made
regarding the manufacture of the structure which this chapter has discussed the
design of. There were some instances during the detail design process where
the calculated dimensions were altered in order to facilitate the manufacture of
the structure or particular dimensions were aimed for based on manufacturing
capabilities. After all, there is little value in designing a structure which can
withstand the applied loads perfectly but, for whatever reason, actually cannot
ever be manufactured for use on the aircraft. When considering the
manufacture of the structure the author consulted with Mr. Wang Shang who
was allocated the task of considering the manufacture of the aircraft (24).
77
6.6.2 Skin/Stringer Panels Manufacture
The aerodynamic skin panels of the section are made from CFRP materials.
One of the reasons behind this material choice was that, as the FW-12 is a
flying wing aircraft, the external surface of the vehicle has quite complex curves
in some section of the aircraft. This is particularly true for the mid-wing section
as the aerofoil shape of the aircraft changes across the section, as discussed in
Chapter 3.
While metallic alloys can be used to manufacture the skin they would have to be
comprised of several panels fastened individually to the structure in order to
produce the desired profile. This is in turn would lead to numerous fasteners, all
of which require inspection so the maintenance requirements of the aircraft
would be increased. Furthermore each edge of the panels will contribute slightly
to the skin drag on the aircraft so reducing these edges will improve
performance.
CFRP materials can be moulded to follow the surface of the aircraft and
therefore, by making each moulded part of the skin as large as possible, the two
problems resulting from the use of metallic materials for the skins can be
avoided.
The skins and stringers should be moulded together in order to form one part.
As the material and resin chosen must be cured in an autoclave, the critical
factor in manufacturing the skins will be the size of the autoclave available. The
larger the autoclave is the larger the manufactured component can be and so
fewer parts will be required to make the panels for the entire section. This will in
turn reduce the maintenance and weight of the structure.
The manufacture of the skins could be made cheaper and more consistent by
using Contour Tape Laying machines to lay the plies which form the
components. This state of the art manufacturing method is capable of producing
parts with a double curvature such as the panels of the FW-12. This should
78
prove considerably cheaper than having assembly workers lay the plies by hand
due to the considerable reduction in man-hours involved (25).
It could be possible to improve the design of the panels in terms of their
manufacture even further by carrying out further research to find suitable
materials which can be cured without the use of an autoclave. The use of out of
autoclave curing removes the constraints on component size which result from
the limited size of autoclaves used in their manufacture.
6.6.3 Spar Manufacture
An example of a change made to the design based on manufacturing
considerations was the choice of thickness for the third spar which also
comprised the aft cargo bay pressure bulkhead. It is preferable to have this
component made from a single piece of aluminium alloy in order to reduce the
sealing required to keep it airtight. Due to the very large size of the component,
which measures 3.3m tall at its most inboard point and is 5.4m in length, milling
the component from a single block of aluminium would likely prove difficult and
few manufacturers in the world, if any, would be capable of creating it.
However the thickness which was required to withstand the loads applied was
calculated as 3.158mm. Aluminium sheet metal is commonly available in
various “standard wire gauge” thicknesses and “swg” 10 corresponds to a
thickness of 3.25mm. So by increasing the thickness of the spar to 3.25mm, it
could be manufactured from a single sheet of readily available material. There
are still some difficulties in finding swg 10 sheets of the dimensions required,
but the overall difficulty of manufacture should be greatly reduced by this
decision.
By using this thickness for both the webs and the spar caps the spar can be
manufactured from a single sheet of swg10 aluminium. The required sheet
would be slightly larger than the finished spar so it could then be cut into the
desired shape. Then the edges of the sheet could be bent to the desired angle
79
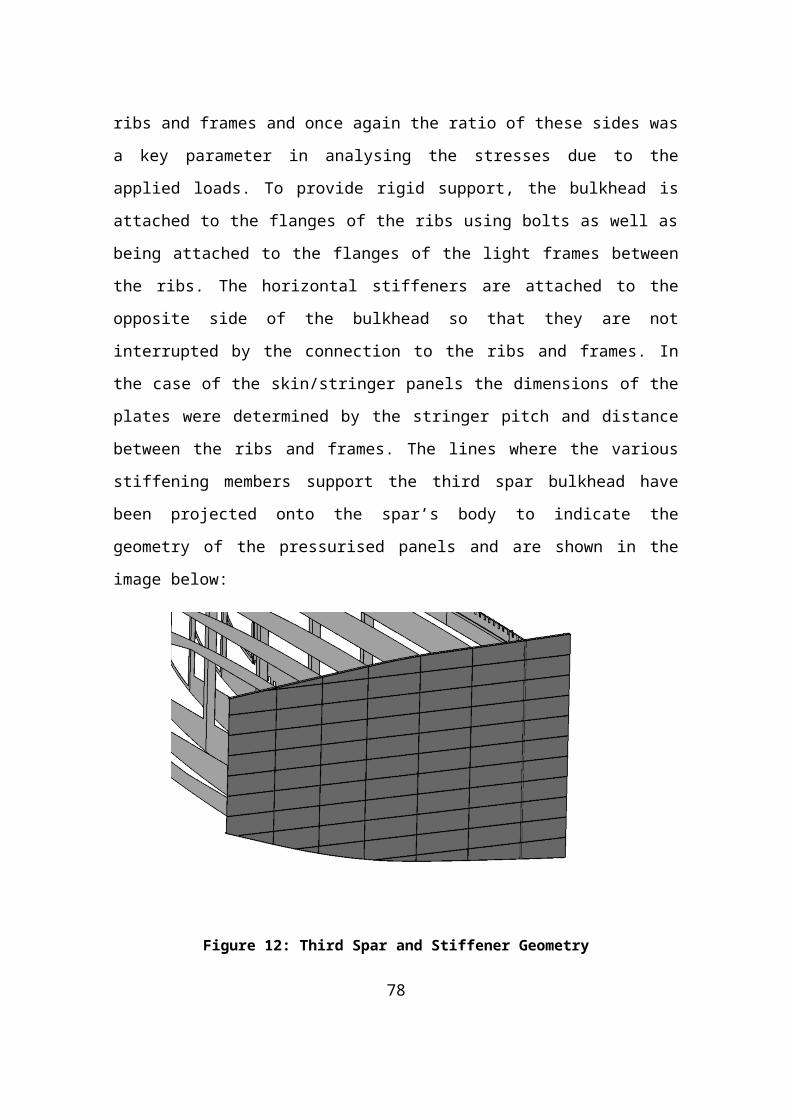
so that the edges form the spar caps which are aligned with the inner surfaces
of the aircraft skins.
Furthermore the weight penalty arising from this decision was very small with an
approximate increase in mass of only 3.1% and, if time had allowed for a more
detailed investigation to be carried out, the weight penalty may have proved to
be even less as smaller stiffeners are required for when a greater spar web
thickness is used.
6.6.4 Rib Manufacture
Each section of the ribs are to be manufactured by milling solid blocks of
aluminium to the desired shape. Based on the width of the flanges of the ribs
the thickness of this block of aluminium should be 25.4mm and the length and
height of the block will vary depending on which rib is being manufactured.
The minimum recommend thickness when machining components in this
manner is 2mm due to the tendency of thinner sections to deform under the
milling loads (19). This can cause components of thickness lower than 2mm to
vibrate during the milling process which in turn makes the surface finish very
poor and this will reduce the fatigue life of the manufactured component as the
imperfections in the surface will act as initiation sites for cracks.
In light of these considerations a total of 45 vertical stiffeners were chosen to
reinforce the web of the light rib. This number was chosen in order to adjust the
sizes of the panels considered to be loaded in shear as 45 was determined to
be the minimum number of stiffeners which would allow for a rib thickness of
2mm. By choosing this number of stiffeners the minimum web thickness was
achieved and so this should prove to be the lightest possible rib design.
6.7 Connection to Inner and Outer Wing
The mid-wing section connects on its inboard side to the central part of the
aircraft which consists of the inner-wing where the cabin is located and to the
80
outer wing on its outboard side. The connection to each of these sections has
been considered and designed in conjunction with the relevant designers.
The outer wing connects to the mid-wing at 11.2 m outboard from the centreline
of the aircraft. This is achieved with the use of lugs on the ends of the webs of
the four spars at the point where the sections meet, there are two lugs on each
spar. Double lugs are used which were sized individually such that if one fails
then the other will be capable of supporting the connection loads. One of these
connection lugs was selected to be studied in detail for the purposes of the
fatigue and damage tolerance analysis section. This work can be found in
Chapter 8.
The connection to the inner wing was discussed with Mr. Jiang Zhen who was
one of the designers of the aft inner wing section. The connection focussed on
was the connection made between the third spar in the mid-wing section and
the fourth spar of the inner wing. These spars meet at 15m aft of the nose of the
aircraft and their webs align to each other such that the web of the inner wing’s
spar continues into the cargo bay to overlap with the third spar. The connection
between the two sections is then achieved by bolting the two webs together.
6.8 Discussion
The detailed design of all the structural components of the mid-wing section has
been discussed in this chapter. The process of designing the structure varied
for each component and a number of different tools were used to determine the
dimensions required of each component to support the loads applied to it.
In industry the design of a new large civil transport aircraft is, more often than
not, delayed at some stage of the project which results in its deadline being
extended and the release date of the aircraft pushed back. This was not
possible during the GDP as the date for the presentation to industry had been
set months in advance and aside from this the Masters course can only last for
one year so any sizeable extensions to deadlines were not feasible in this
project. Therefore numerous assumptions have been made during the design
81
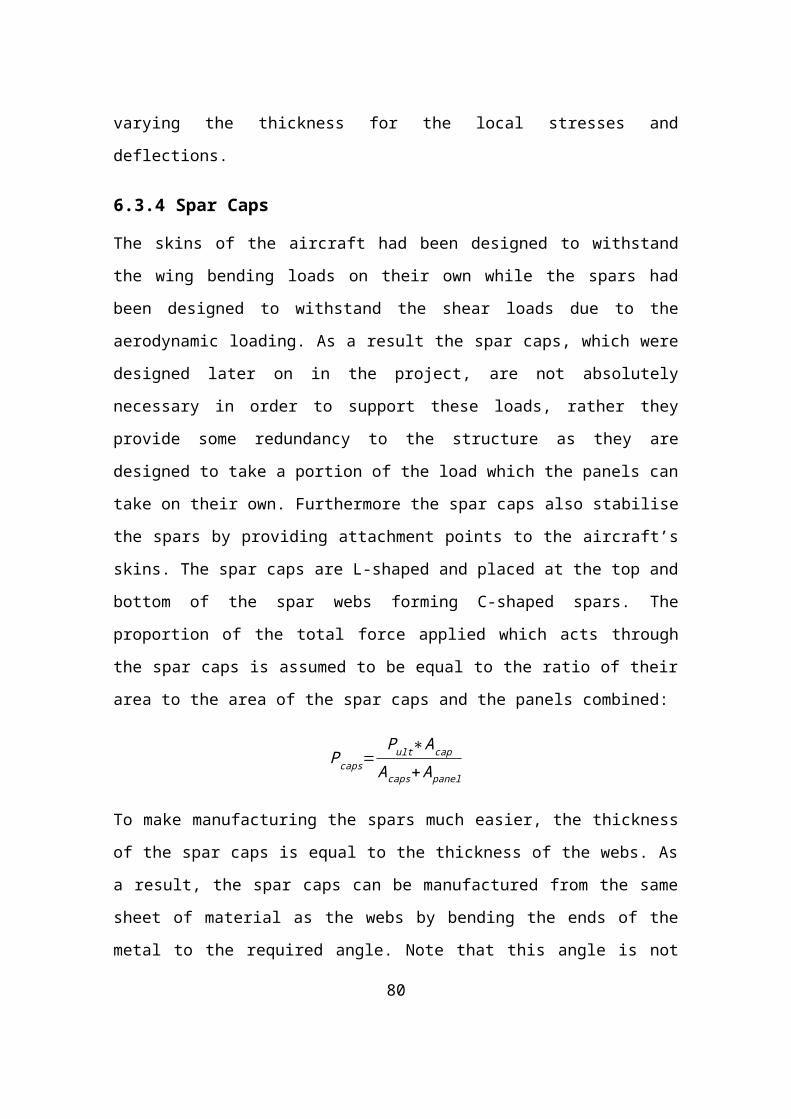
process in order to simplify the task at hand so that a first approximation for the
structure dimensions could be calculated within the time constraints of the
Group Design Project. As a result some work remains to be done on the design
on the mid-forward wing in order to improve on the accuracy of the dimensions
calculated here.
For example, the structure has been designed without considering the effect of
stress concentrations due to the various cut-outs in the spars and ribs. The
reason for this being that the sizes, locations and dimensions of these cut-outs
all depended on the requirements of the cargo bay section and were not
finalised until late in the project. Each week at the GDP meetings different
design concepts were presented by Mr. Ji Guosheng and various suggestions
from members of staff and the design team led to further adjustments having to
be made. As a result the shape of the cut-outs was not known in time and so
the resulting stress concentration factors could not be taken into consideration
when performing the calculations involved in designing the structure.
However the reduction in the cross sectional area due to the cut-outs has been
taken into account when calculating the applied stresses and at distances far
from the cut-outs any stress concentration effect would become negligible.
Therefore ignoring the stress concentration effects of the cutouts should not
have too big of an impact on the accuracy of the results.
Factoring in the full effects of the cut-outs could have been done had more time
been available during the project or had the specifics of the cutouts been
available earlier. Nevertheless the structure that has been designed should at
least be accurate enough for the purposes of an initial design iteration. If future
work is continued on from this project the cut-outs’ effects could be accounted
for as the finalised design of the cargo bay is now available and can be found in
Mr. Ji’s thesis (21).
The theory of how each of the components was designed has been described
here. First the process of designing the skin/stringer panels was outlined and
82
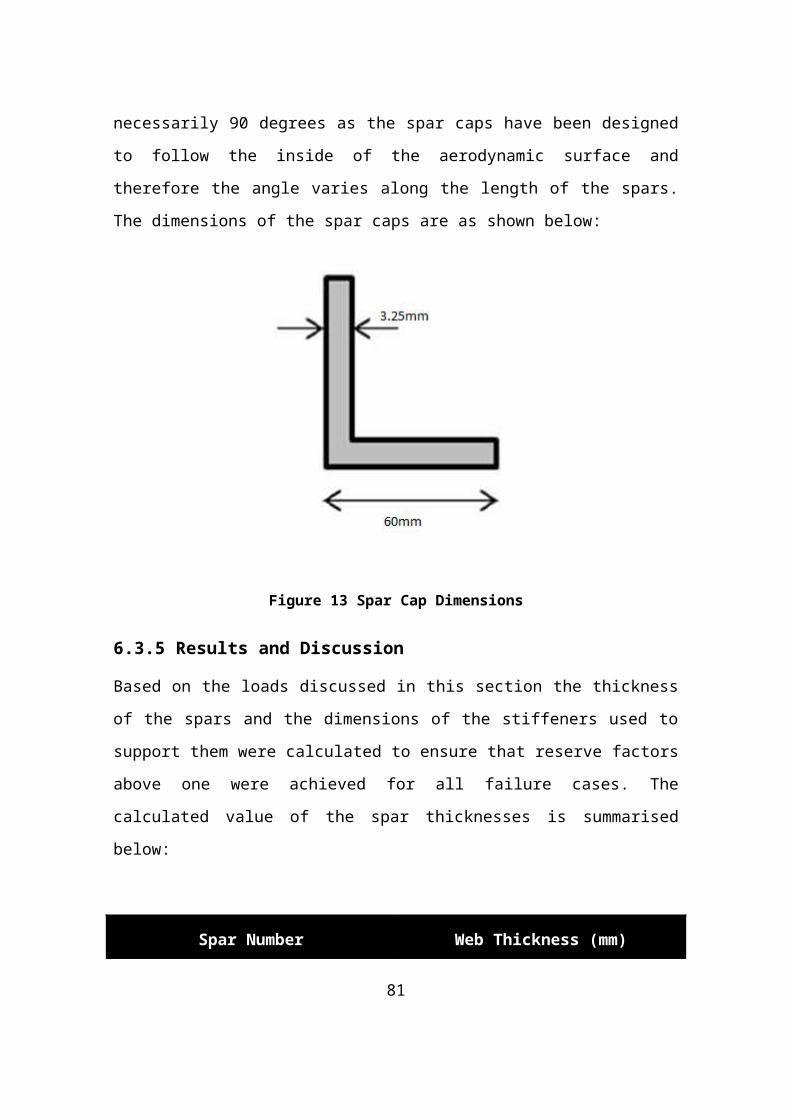
the resulting thicknesses were presented along with the layups of the CFRP
plies chosen for each component.
Next the design of the spars was discussed. The third spar has been designed
in the most detail as this spar must also serve as the aft pressure bulkhead for
the cargo bay area. The analysis of the bulkhead pressurisation, which applies
to both the third spar and the outboard bulkhead, was also discussed as was
the design of the spar caps. The first and second spars in the section were
designed using the same procedure as was used to analyse the shear buckling
of the web in the third spar. These two spars are only loaded in shear and do
not have to withstand the pressure differential that the aft bulkhead, outboard
bulkhead and skins do.
The analysis conducted to design the ribs in the section was then discussed. To
ensure that the GDP requirements of designing both a heavy rib and light rib
were met the inertial loads of the cargo acting on the light rib were neglected
and it was assumed that the rib only had to transmit the air loads to the spars.
The process of calculating the loads applied to the light rib and subsequently
designing the rib was then described in detail and the same process was used
to design the heavy rib.
The maintainability of the structure was then discussed as was the
considerations made to facilitate the manufacture of the structure. In the Detail
Stressing Report the exact method followed to determine the dimensions of the
structure during the design process is described along with all the relevant
calculations. The report can be found in the appendices.
83
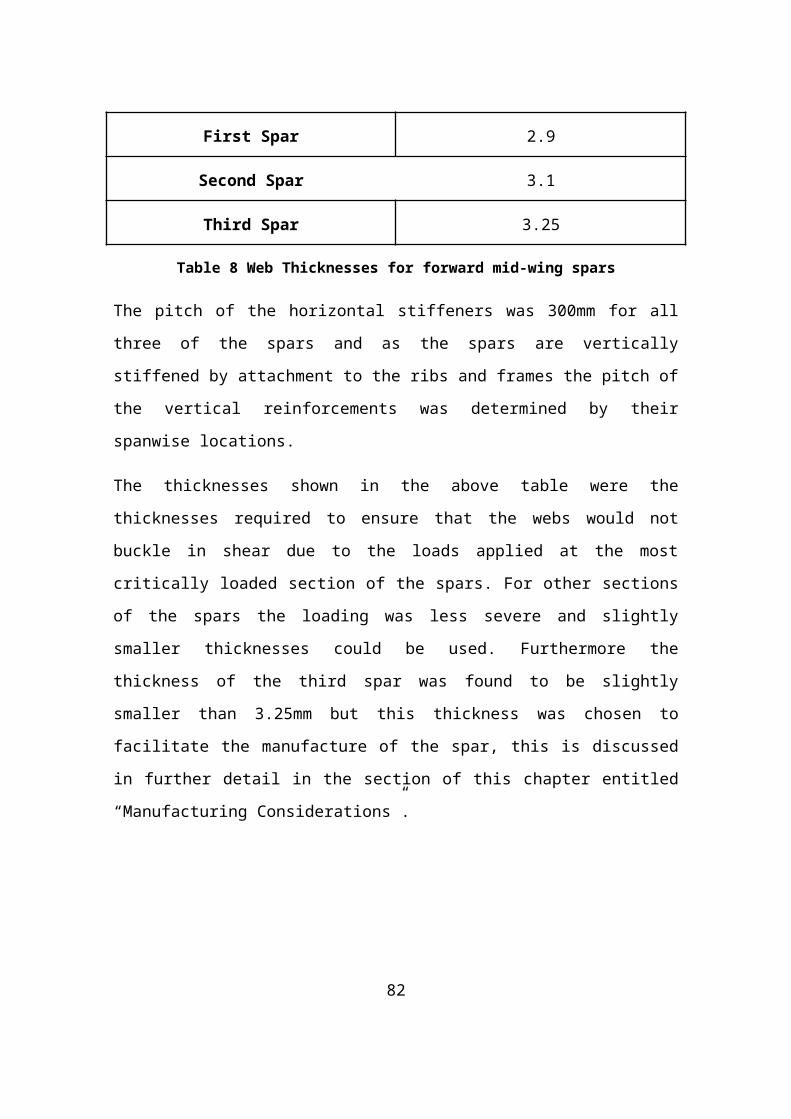
7 Finite Element Analysis
7.1 Introduction
For members of the structures team on the Group Design Project, the goal is to
design a structure which can safely support the loads which the aircraft will be
subjected to while attempting to keep the mass as low as possible. As has been
detailed in the previous chapter, this involved calculating the dimensions
required of the various components so that they would have sufficient strength
to not succumb to any of the various failure mechanisms considered.
However, the data used to perform these calculations may not always be 100%
applicable to the components that they are used in relation to. Some of the
equations are based on assumptions or empirical formulae whereas some other
tools rely upon data from experiments conducted under the carefully controlled
conditions found in a laboratory which will inevitably differ from the conditions of
real world applications. This leads to the possibility that some of the design
techniques employed may not give entirely reliable results so it is desirable to
check these results using another method.
The use of finite element software is one such way of determining the accuracy
of these calculations. Finite element software packages are commonly used in
the aerospace industry, and indeed in a wide variety of engineering
applications, to predict the stresses and deformations which may arise in a
component under a given load. The PATRAN/NASTRAN software package was
taught as part of the AVD course and following this the software has been used
to perform tests on the components designed to provide further validation that
they meet the loading requirements.
To use PATRAN/NASTRAN the following methodology was employed:
Prepare a model of the component to be analysed in CATIA comprised
of surfaces and curves
84
Import the model into PATRAN/NASTRAN
Mesh seed all of the curves at intersections between surfaces equally to
ensure that the nodes coincide between one surface and the next
Mesh the model using elements appropriate to the role of the component
represented by each surface/curve
Apply the relevant boundary conditions and loads to the model
Post-process the results and compare with those obtained in the
previous design work
Simulations have been run using both models which represent individual
components of the structure under the locally applied loads and using a model
of the entire mid-wing section. Due to time constraints and difficulties
encountered using the software, only the skin/stringer panels were modelled as
isolated components. The stresses experienced by the other structural
members can however be evaluated using the full section model.
7.2 Skin/Stringer Panel Analysis
7.2.1 Introduction
As detailed in previous chapters, the dimensions of the skin/stringer panels had
been determined so that they could support both the bending loads and the
loads due to pressurisation. Both of these load scenarios were then simulated
using a model of a panel constructed using PATRAN/NASTRAN so that the
results could be compared. The panel modelled was from the lower skins as
these had the lower value of skin thickness and was therefore the most critical
when subjected to the pressure differential. The model used for the analysis is
shown below:
85
Figure 23 Skin/Stringer Panel Modelled in PATRAN/NASTRAN
7.2.2 Model Construction
The model used in the analysis was constructed using the geometry functions
within PATRAN/NASTRAN. The longest panel will be the one most likely to
buckle in overall Euler buckling so this was the panel constructed. The method
used to construct the panel was the same as that taught in the FEA tutorials
(22).
First a curve was constructed equal to the length of the panel, this was then
extruded the length of the stringer pitch five times to create a panel comprised
of five rectangular surfaces. These surfaces were then meshed using 2D shell
elements and the lines formed at their intersections were meshed using 1D bar
elements. The equivalence function of PATRAN/NASTRAN was then used to
remove any duplicate nodes which were meshed at the intersections.
Two different composite materials were defined in the model, one using the
layup chosen for the lower skin and the other using the layup chosen for the
lower stringers. These materials were then applied to the appropriate sections
and in both cases the thickness of the elements were set to the component
thicknesses calculated during the detailed design stage. The cross-section of
the stringer elements used in the analysis was the same as those calculated by
the TW Panels software and is shown below:
86
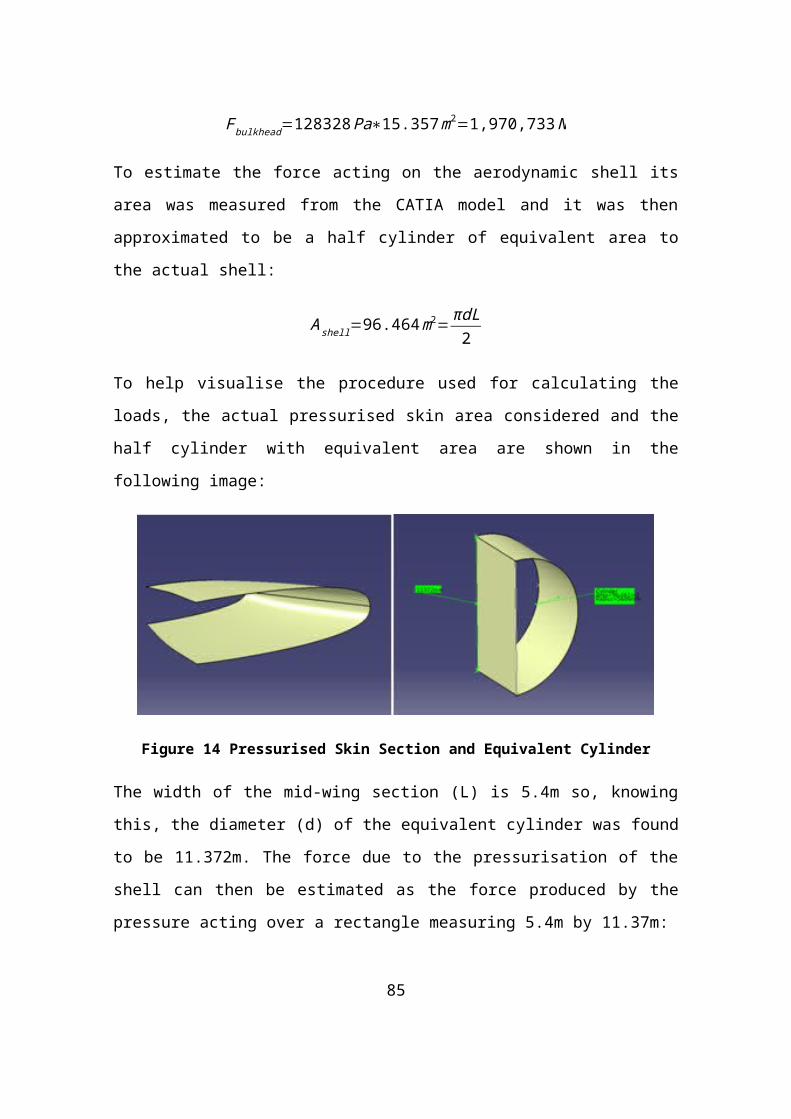
Figure 24 Stringer Cross Section Applied to FEA Panel Model
7.3 Pressurisation Analysis
The first analysis conducted was to determine the deflection and stresses in the
panel when the pressurisation loads were applied. To represent how the panel
would be restrained in application on the FW-12 the panel should be considered
to be simply supported along its edges where it would be attached to light
frames and ribs, these boundary conditions were applied to the model in the
software. The pressurisation was modelled by applying a constant pressure on
the surfaces of the panel equal to twice the operating differential pressure of
64,164kPa. The loads and boundary conditions applied to the panel are
illustrated below with the restraints indicated by the light blue arrows and
numbers and with the pressure load indicated by the red arrows:
87
Figure 25 Simulation of pressure loading on skin/stringer panel
7.4 Panel Buckling Analysis
The next analysis conducted using PATRAN/NASTRAN was the buckling
analysis of the skin/stringer panel. The same model was used as in the
pressurisation analysis but the loads and boundary conditions on the panel
were adjusted for the buckling load case. The side of the panel opposite to
where the buckling load was applied was fixed in translation in all directions
while the two sides running perpendicular to this were fixed in the z-direction
only, that is, the direction normal to the panel surface.
The end where the axial load was applied was allowed to deform in the direction
of the load. The force per unit length was calculated for the most critically
loaded panel and this was then applied as an evenly distributed load over this
edge of panel. The value of the ultimate distributed load was calculated as
being 887N/mm. The loads and boundary conditions applied to the model for
the buckling analysis is shown below:
88
Figure 26 Buckling analysis loads and boundary conditions
The buckling load could then be determined by solving for the eigenvalues of
the buckling solution.
7.5 Full Section Model Analysis
It was also required to model the entire mid-wing section in PATRAN/NASTRAN
in order to get a full appreciation for the deformation of the structure. To perform
this analysis a full CAD model of the structure was prepared represented only
by surfaces. This simplified model was then imported into PATRAN/NASTRAN
as a .stp file and the surfaces were meshed and the elements given the
appropriate dimensions and material properties so that they were representative
of the designed components. As only the wing box is designed to take the
applied loads the leading edge section and the elevator at the trailing edge of
the mid-wing were not included in the model. Below is an image of the model
that was imported into PATRAN/NASTRAN:
89
Figure 27 CATIA Model used in FEA Analysis
Due to time constraints and problems encountered in meshing the model the
analysis was simplified by modelling the skin stringer panels as a series of
panels of constant thickness. To evaluate the required thickness the total cross
sectional area of the upper skin and stringers was divided by the length of the
wingbox:
tmodel=A skin+A stringers
Lwingbox
=55360.25mm2
10177mm=5.44mm
The same equivalent thickness parameter was calculated for the lower panels
to account for the different skin and stringer dimensions used:
tmodel=A skin+A stringers
Lwingbox
=43281.65mm2
10177mm=4.25mm
Therefore the thicknesses of the surfaces representing the upper and lower
skin/stringer panels were set to 5.44mm and 4.25mm respectively.
7.5.1 Meshing
To facilitate the correct meshing of the model in PATRAN the geometric model
was divided into numerous surfaces in CATIA before being imported. The ribs,
spars and skin panels were divided into individual sections wherever they
90
intersected one another. In this way the edges common to each component in
the FEA model could have an equal number of mesh seeds applied to them so
that the mesh of each surface would end at the same nodes.
The spars, ribs and skin panels were each sorted into individual Groups in
PATRAN/NASTRAN so that each could be viewed and edited separately. Each
of the lines at the intersection between components were seeded with a total of
four mesh seeds to ensure that the nodes of one meshed section would
coincide with the neighbouring sections. This is needed so that the forces and
resulting displacements can be properly transmitted from one piece of structure
to the next. The global edge length of the elements used to mesh the model
was chosen as 70mm and the equivalence function was again used to remove
duplicate nodes at the section boundaries.
The meshing of the model proved difficult with numerous problems encountered
during the process. This was exacerbated by the fact that Dr. Rui Pires, who
taught the FEA course earlier in the year, had since left his position at Cranfield
University and no replacement had been hired at the time of writing this thesis.
As a result there was a disappointing lack of help available when problems such
as this were encountered during the course of the FEA analysis work and this
inevitably had an impact on the quality of the results which were eventually
obtained.
7.5.2 Boundary Conditions and Applied Loads
The model was restrained at the inboard side along both the spar webs and the
skins panels so that it was unable to move in any direction. This “built-in”
boundary condition represented the connection of the mid-wing section to the
inner wing section of the aircraft and is shown on the FEA model below:
91
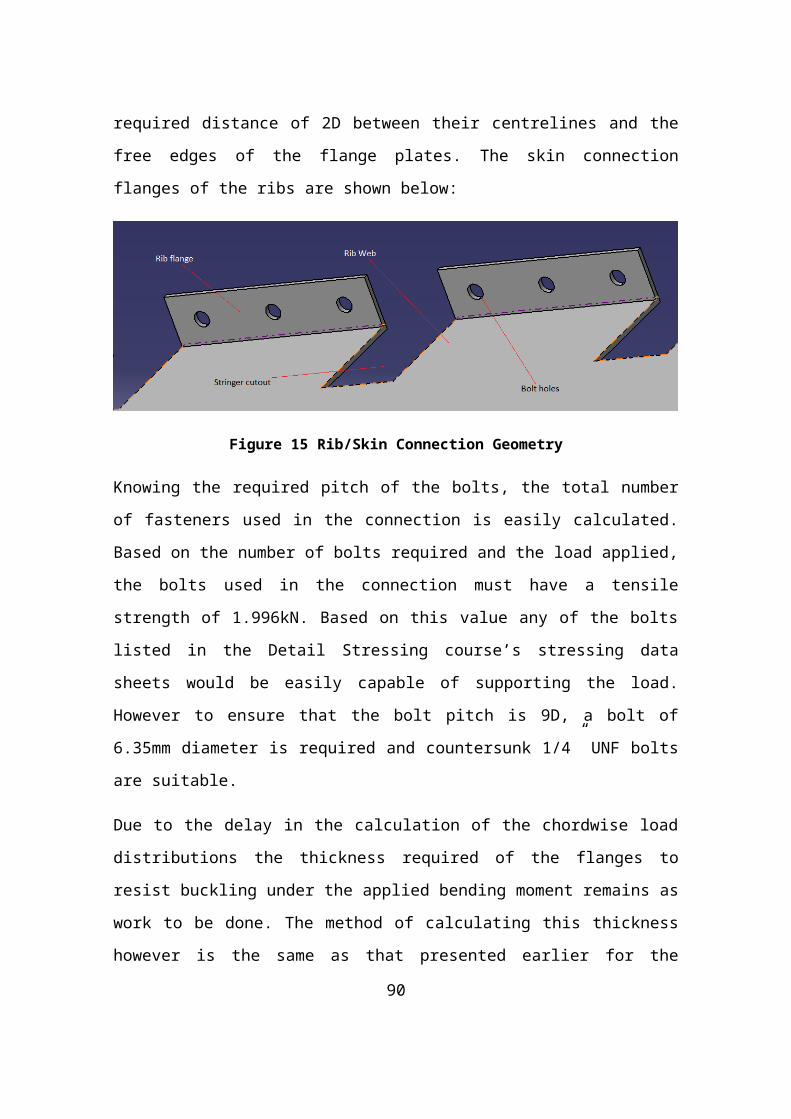
Figure 28 Boundary conditions applied to the full section FEA model
In reality the inner wing section will also deform meaning that this boundary
condition is not completely realistic however it is necessary to apply some
restraints to the model in order to run the simulation. As the wingbox of the mid-
wing section is both very tall and comprises the entire length of the aircraft it will
not experience large deflections and therefore the assumption of the nodes
being fixed is reasonably accurate for the purposes of this simulation.
The force which the outer wing generates was calculated for a 2.5g pull up
case and this load was applied evenly as point loads at each node on the ends
of the spars. The lift force which the mid-wing section generates was also
calculated and the average pressure required to produce this load based on the
area of the mid-wing section was calculated. As is the usual convention, two
thirds of this pressure was applied to the upper skin surface and one third was
applied to the lower surface.
7.6 Results and Discussion
The first simulation discussed in this chapter investigated the pressurisation of
the skin/stringer panels. The analysis was run and the deformation of the panel
can be seen below, only the geometrical features of the panel were shown in
the results and so the stringers, which were represented by lines that had bar
elements assigned to them, are not visible but based on the deformation shape
of the panel it is clear that their effects are still present:
92
Figure 29 FEA Pressurisation Analysis Results
The model would in reality be part of a much longer panel the length of the
aircraft’s wingbox and therefore the surfaces at either end of the panel stiffened
by the presence of additional stringers here. Therefore it was the three sections
towards the inside of the panel which were taken to be most reflective of how
the actual panel would deform under the pressure load. The maximum
deflection for these areas of the panels between the stringers was 1.5mm. this
value agreed quite well with the calculations performed using EDSU 71005
which predicted a maximum deflection of 1.26mm in the lower skin panels.
The next simulation presented was a buckling analysis conducted on the same
skin/stringer panel model as was used in the pressurisation simulation. The load
applied to the model was reflective of those that the actual panels will
experience and the resulting displacement perpendicular to the panel’s surface
is shown below:
93
Figure 30 Panel deflection under axial load
The results showed that the maximum deflection of the panel was 8.76×10⁻⁴
mm or 0.876μm. This is a very small value of deflection which indicates that the
load applied to the panel will not buckle. This validates the buckling analysis
performed earlier using TW Panels and confirms that the panels which have
been designed will be able to support the applied loads.
The final set of results was obtained using the model of the entire mid-wing
section which was constructed. These results were difficult to obtain owing to
the resignation of Dr. Pires which was mentioned earlier. However eventually
the problems encountered in meshing the model were overcome and once the
model was meshed correctly it was tested using a simplified load case in order
to inspect the behaviour of the model. After this the boundary conditions and
loads discussed earlier were applied and the results for the deformation and
stress levels present in the model were calculated. Below is a figure showing
the variation of the deflection of the section:
94

Figure 31 Deflection of full section FEA model
The value of maximum deflection was returned as 74.2mm as shown above.
However this is not representative of the actual deformation because this
deflection corresponds to a section of the aircraft which should have been fully
restrained as can be seen in the image. The reason for this high deflection is
unclear but likely results from the high reaction load required to restrain the
model at the inboard side mistakenly resulting in a large deformation of the
surrounding area. As this deflection is not reflective of the true deformation of
the aircraft it should be ignored.
The values of the model’s deflection elsewhere seem much more sensible. The
deflection is at a maximum at the further outboard point of the structure and the
decreases further inboard as expected due to the increasing size of the
wingbox. The deflection of the model at the most outboard section of the mid-
wing was found to be 39.6mm. To determine the accuracy of the simulation
these results were compared with those obtained using a model of the entire
half span of the aircraft which was constructed by Mr. Li Yan (27). The
deflection of the outboard mid-wing predicted by this model was on the same
95

order of magnitude as the result obtained here but slightly higher, approximately
85mm. This is to be expected because the inboard side of the mid-wing section
was not fixed on the model of the full half span as was the case with the model
presented here, rather the centreline was fixed and the rest of the aircraft
allowed to deform.
Having validated the results for the deflection of the model against another
simulation it is assumed that the stress values predicted by the model were also
reasonably accurate. The stress tensor field was plotted and from this data the
predicted value of the stress in the upper panels could be found as indicated in
the image below:
Figure 32 Stress Tensor Field of entire section FEA model
From this the maximum value of stress in the panels, excluding the inboard
area close where the boundary conditions were applied as the results once
again are inconsistent with the expected values, was 147MPa. This agrees
reasonably well with the values calculated previously which predicted stress
96
levels ranging from 163MPa to 112Mpa and so the stress values obtained are
correct within an order of magnitude and accurate to within 70%.
The predicted values of stress in the spars can be seen in the aft spar shown
above. Excluding the results from the inboard section again the stress ranges
from 59.1MPa to 118MPa with the most common stress value being
approximately 88.4MPa. These results agree very well with those predicted in
the Detail Design section where the shear stresses calculated in the spar web
ranged from 72MPa to 82MPa with an average value of 77MPa.
As discussed, the FEA analysis section proved particularly challenging as the
author was left to learn the process of analysing the full section model largely
unassisted as no replacement had been hired after Dr. Pires’s departure from
Cranfield University. In light of the time constraints involved in the GDP and the
steep learning curve involved in meshing a brand new model as opposed to the
simplified models covered in tutorials the results overall were reasonably good
and the process of meshing FEA models eventually became clearer. The
deflection values predicted by the model of the skin/stringer panel were
comparable to those calculated previously. Similarly the deflection of the full
section model compared well with a similar simulation performed by another
member of the structures team. The stress levels predicted by this model also
compared reasonably well with those obtained beforehand. If more time had
been available and, having become more familiar and proficient with the
PATRAN/NASTRAN software package, it is believed that these results could
have been improved further.
97
8 Fatigue and Damage Tolerance
8.1 Introduction
Aircraft manufacturers all strive to make their aircraft as light, fuel efficient,
affordable and well designed as possible however there is one criterion in the
design of these vehicles which outweighs all the above combined: their safety.
This is especially true in the design of large civil transport aircraft where during
any one flight there may be hundreds of human lives placed in the hands of the
designers, it is an enormous responsibility.
While every care possible is taken to make aircraft safe, accidents still happen.
And while an aircraft can crash on its very first flight, it is more typically aircraft
which have been in use for lengths of time approaching their service life which
are most at risk of being involved in an accident. There are many reasons why
this is the case but in terms of the structure of the aircraft one of the main
factors in its degradation is fatigue.
Fatigue is a failure mode which causes a component to fail at stress levels far
beneath the failure stresses which were predicted during its design. The reason
for this is that the load is applied and removed multiple times and this leads to
cracks in the structure forming and growing under the cyclic nature of the
loading.
While fatigue is a concern for every component designed as part of the GDP
and is kept in mind during the entire design process, it is required that each
structural designer choose one component from their own section and design it
paying specific attention to the fatigue behaviour of the component. To fulfil this
requirement a connection lug has been designed and analysed using the
AFGROW software package.
8.2 Component Analysed for Fatigue and Damage Tolerance
The mid-wing section connects to the outer wing at 11.2 m from the centre of
the aircraft. This is achieved with the use of 8 lugs with two being placed on
98
each of the spars at the interface between the sections. The aerodynamic force
produced by the outer wing section must be transmitted into the rest of the
aircraft via this connection to the mid-wing. A sizeable quantity of the total lift
force is generated by the outer wing which is shaped like the wing of a
conventional aircraft and therefore the magnitude of the load transmitted is
considerably high. The lugs which comprise this connection will be subjected to
the fatigue loading spectrum of the whole aircraft and it was one of these lugs
which was chosen to focus on in terms of fatigue study for the purposes of the
Group Design Project.
The maximum loading condition for the lug connections may not necessarily be
the same case as those used in other design calculations due to the inertia
relief effect due to the fuel stored in the wings, or lack thereof in cases where
these tanks are empty. Furthermore, whereas the data related to various
combined pitch and roll manoeuvres were used to size the structural
components, the loads used for the purpose of the fatigue analysis section were
taken from the loads encountered in steady level 1g flight as advised by Dr.
Xiang Zhang. This is because the loading spectrum given for fatigue analysis is
in terms of the normalised load factor so the 1g loads must be multiplied by the
relevant “g” factors at a later stage. As such, the author examined the data from
the relevant cases for various mass values and found that for steady level flight
loads the following loads are generated by the outer wing section:
Mass Case Force from Outer Wing
MTOW – 176,469kg 573,198 N
MZFW – 103,730 kg 275,970 N
OEW – 75,024kg 234,676 N
Table 10 1g Flight Cases Considered for Fatigue Loading
99
These three cases were evaluated when the aircraft is flying at its cruise altitude
of 35,000 feet and cruise velocity of 243 m/s true airspeed. It is clear that the
maximum take off mass case represented the most critical 1g flight case and so
it was the load corresponding to this case which was used for the fatigue
analysis of the connection lugs.
At the spanwise location where the outer wing joins the mid-wing there are a
total of four spars, a set of lugs is attached to points near the top and bottom of
these spars and to simplify the analysis it is assumed that each lug will support
one eighth of the total load. Due to the applied load, tensile stresses, shear
stresses and bearing stresses will arise in the lug all of which must be checked
to ensure none are high enough to cause failure. However it is the tensile
stresses which will cause cracks to grow through the lug due to the cyclic nature
of the load.
As shown above the total aerodynamic load is 573,198 N, assuming that this
load is shared equally amongst the eight lugs then each one must support a
load of 71,650 N. Originally the intention was to take this load to act vertically
which would cause a crack to grow through the lug in the horizontal direction.
However AFGROW cannot model the growth of a crack in this direction so,
based on the advice of Dr. Zhang, the load was taken to act at an angle to the
vertical. The horizontal component of this force would then produce tensile
stresses which would cause cracks to grow in such a manner that could be
modelled using AFGROW. To model the growth of a crack due to the tensile
loads applied by the vertical component of the lift force would require a finite
element simulation which there was not sufficient time for and is outside of the
scope of the GDP (27). The loading on the lug is illustrated below:
100
Figure 33 Loading of lug modelled using AFGROW
The angle which the force was inclined at was assumed to be 20 degrees to the
vertical, this allowed for the tensile stress to be determined as follows:
F x=FT sinθ=573198∗sin (20 )=24,505.66N
Using the same notation for lug geometry as was used in the Detail Stressing
lecture series (24), i.e. that c is the minimum distance between the edge of the
lug and the edge of the hole, and for a lug of thickness t, the tensile stress due
to this load is:
σ t=Fx
2∗c∗tEquation 32
So, based on the dimensions of the final design of the lug, the tensile stress
was calculated as being:
σ t=24,505.662∗12∗12
=85.089 N
mm2=85.089MPa
101
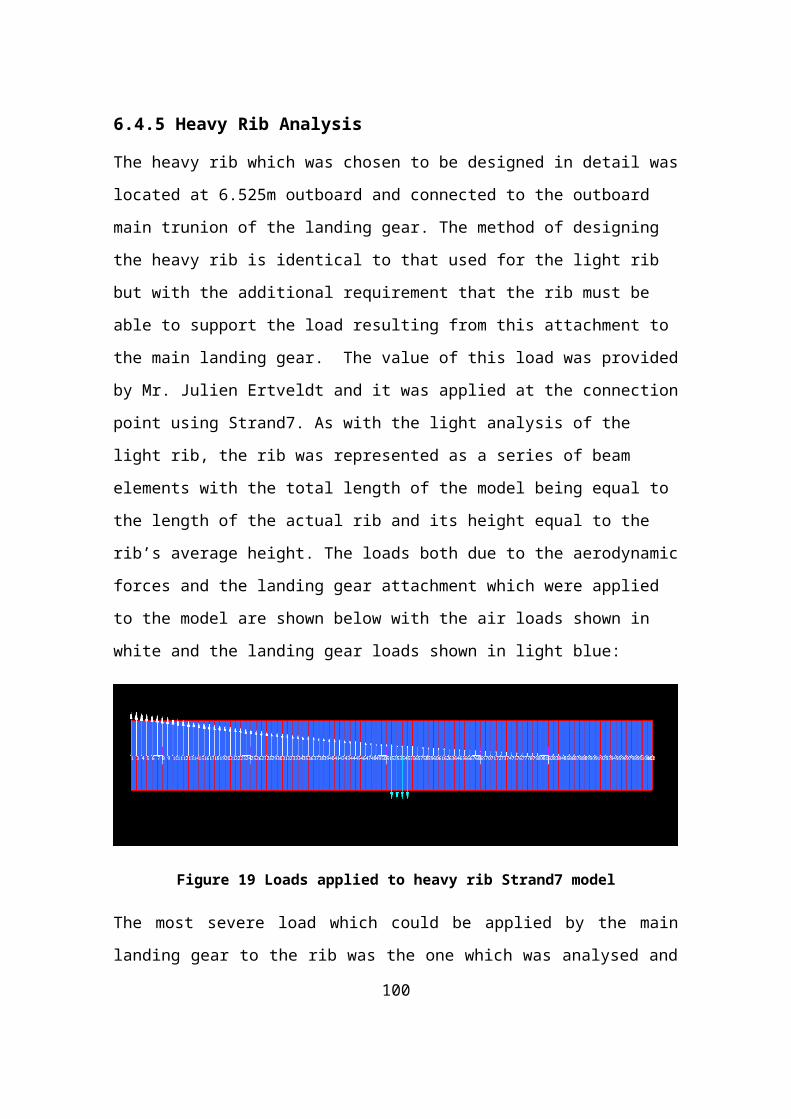
Originally the design was carried out using aluminium alloys, however the
calculated load resulted in quite a high stress unless unacceptably larger
thicknesses were used. These high stresses had the effect of drastically
shortening the fatigue life of the lugs when designed using aluminium alloys. In
light of this it was decided that a titanium alloy would be used for the connection
lugs. The alloy chosen was Ti-6Al-4V based on the recommendation of Dr.
Zhang, the high bearing stress and yield strength of this material would allow for
more suitable lug dimensions to be used while still resulting in an acceptable
fatigue life for the connection. Furthermore the outer wing designer had decided
to make the spars in this section from a composite material and so the use of
titanium lugs for the connection would circumvent the necessity of isolating the
materials from each other in order to avoid the problems arising from the
galvanic difference between them had aluminium alloys been chosen.
8.3 Loading Spectrum
The loading spectrum is the same spectrum that is used for the entire FW-12
aircraft which was derived by Mr. Li Yan (29). In this, the number of times a
particular load is expected to occur during the aircraft’s lifetime is given in terms
of a load factor, as shown:
102
Figure 34 Fatigue Analysis Load Spectrum
The total number of cycles is therefore 11,111,111 which represents the entire
service life of the aircraft. The results of the AFGROW simulations could be
compared against this number of cycles to predict the fatigue life of the
connection lug.
To obtain the load which must be considered for fatigue calculations, these load
factors must be multiplied by the stress calculated above:
Probable
number of
cycles
Nz + Nz - σ+¿ σ−¿
1 1.92 0.09 163.37 7.65
103
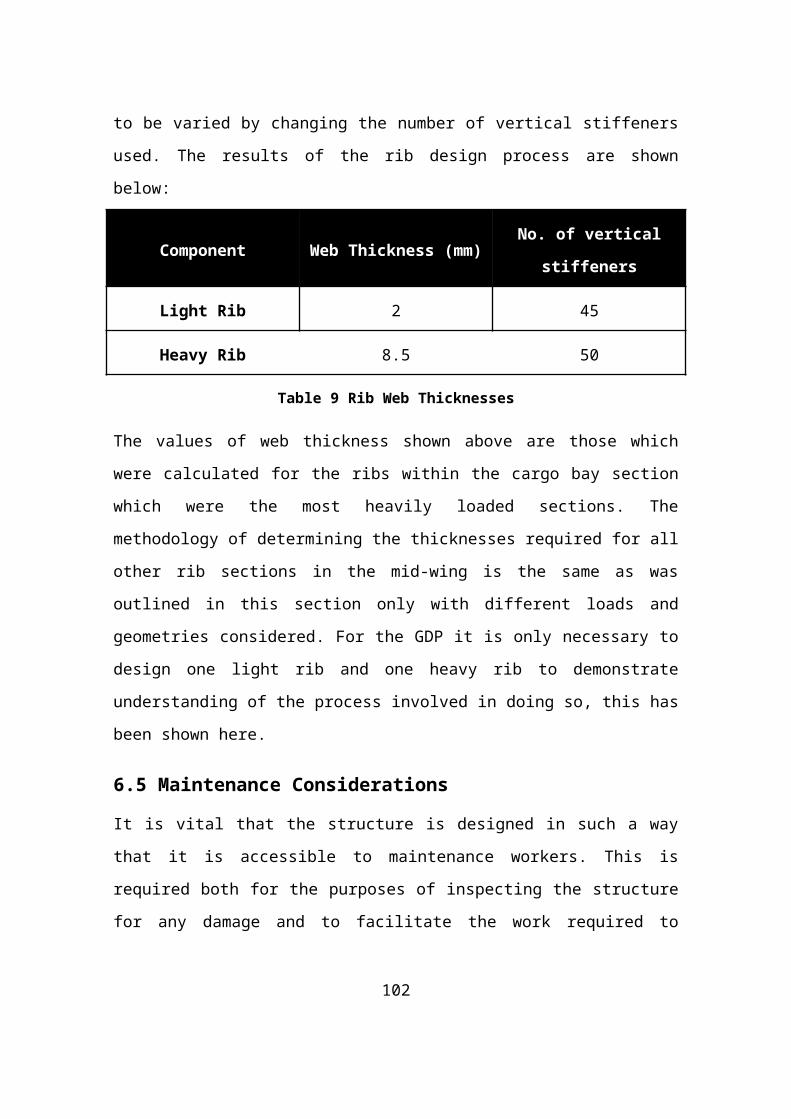
10 1.91 0.1 162.52 8.51
100 1.88 0.18 159.96 15.31
1000 1.82 0.28 154.86 23.82
10000 1.66 0.46 141.25 39.14
100000 1.48 0.63 125.93 53.61
1000000 1.32 0.76 112.32 64.67
10000000 1.18 0.88 100.41 74.88
Table 11 Fatigue Stress Input Data
This data was applied to the model using the AFGROW software package.
However, each time the lug’s geometry was changed the stress applied would
also vary. To avoid having to change the input spectrum each time the
spectrum was entered in terms of the values for Nz+ and Nz-. The stress
multiplication factor was then set equal to the stress resulting from the 1g loads
for each new iteration of the lug design, the stress shown in the table above
were for the finalised design.
8.4 AFGROW Analysis
As discussed above, the crack growth had to be simulated using one of the
models available within AFGROW. The model chosen was “Single Corner
Crack in Lug”. Based on the recommendations in reference (26) the initial size
of the crack was 0.00127mm both in depth and width. It was assumed that a
large bolt and connection would be needed to attach the outer wing as the total
length of the section outboard of the lugs is approximately 20m in length, the
following geometry was input into AFGROW:
104
Figure 35: Lug Dimensions for AFGROW Simulation
From this the tensile stress causing the crack to grow was determined as:
σ t=24,505.66
0.015∗(0.06−0.0254 )=41.22MPa
This value was then input into the spectrum of AFGROW and the simulation
was run to predict the number of cycles to failure of the lug. The results of the
AFGROW simulation indicated that this configuration of lug would fail after
1.133e+008 cycles which was over ten times the design life of the aircraft.
Designers of large civil transport aircraft such as Airbus typically aim for primary
structure components to have design lives of 2 to 4 times the length of the
aircraft service life.
It was therefore decided that this lug was too robust for the purposes of
connecting the outer wing and mid wing sections together. Accordingly, the
design process was repeated until the predicted number of cycles to failure fell
within more acceptable limits. The dimensions of the final design of the
connection lug are shown below:
105
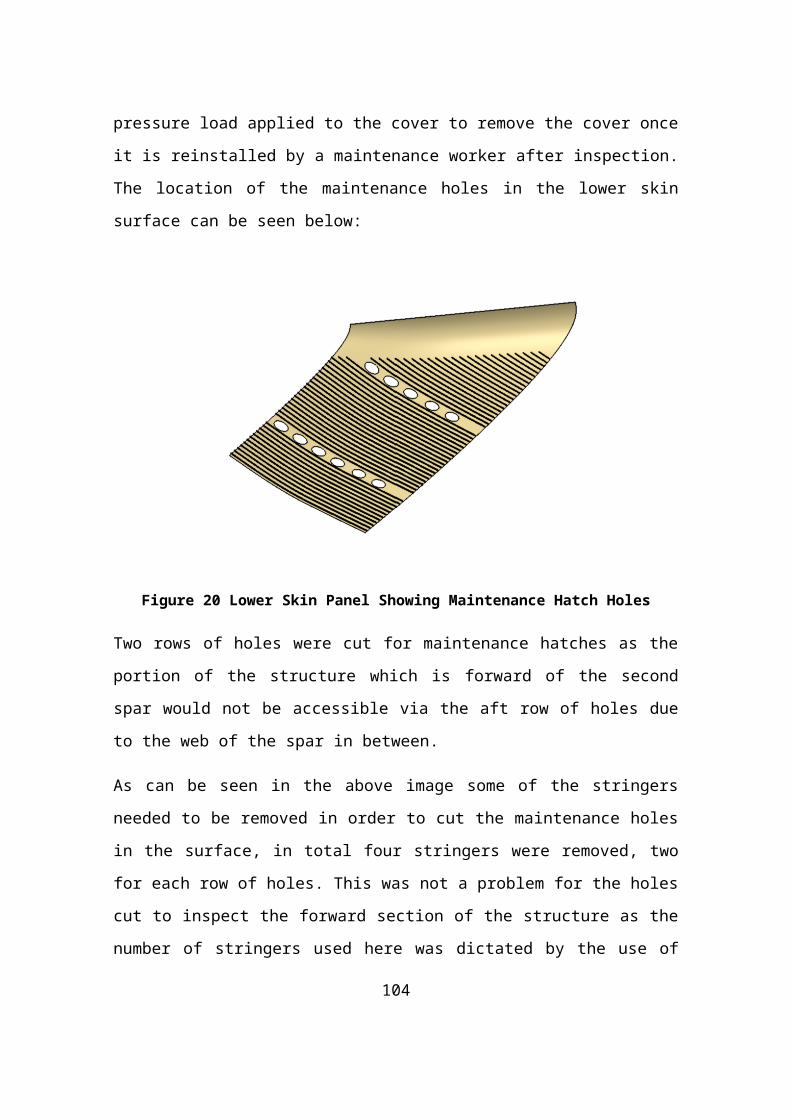
So the tensile stress applied to the lug was:
σ t=24,505.66
0.015∗(0.0367−0.0127)=85.089MPa
The predicted number of cycles to failure for this configuration was 2.259e+007
which equates to 2.33 times the aircraft service life which fits well within the
recommended lifespan of 2 to 4 times the aircraft’s service life. The service life
of the FW-12 aircraft is 10,000 flights or 80,000 flight hours, so based on this
the lug should survive 186400 flight hours.
Below is a plot of the progression of the crack until failure which occurred when
the crack had reached the free edge of the lug:
106
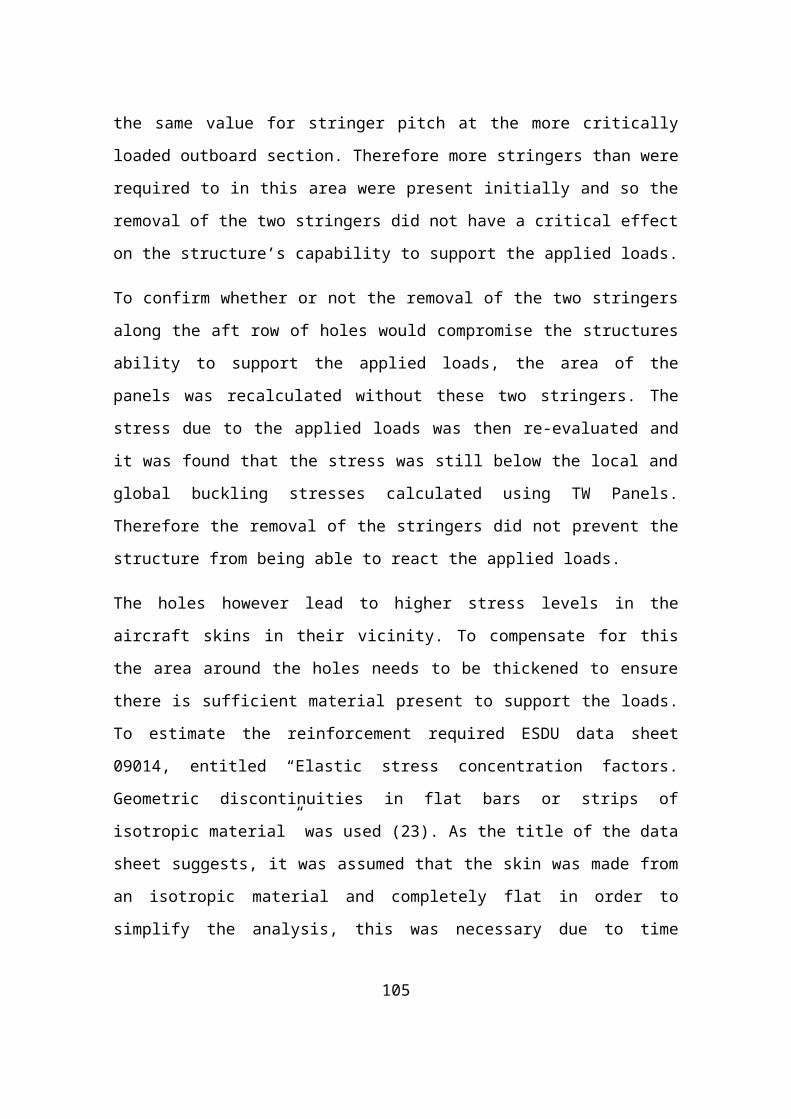
Table 12 Fatigue Crack Growth Plot
8.5 Inspection Intervals
The crack growth life of the connection lug exceeds the service life of the
aircraft but nevertheless it is desirable to detect any cracks in the lugs as soon
as possible so that they can be replaced. The detectable crack length depends
on the methods of inspection being deployed and can vary from anything
between 0.25 – 2.5mm (30). This means that using the more advanced
detection techniques the crack can be detected from when the aircraft enters
service based on the assumed initial crack length of 1.27mm and so it could be
detected at any time. Therefore the lugs should be inspected during the same
inspection intervals as are applied for the rest of the aircraft.
8.6 Results and Discussion
This chapter presented a lug which has been designed based on the Damage
Tolerance design philosophy for the connection between the mid-wing and
outer wing sections. Based on the results of a fatigue simulation run using
AFGROW the connection lugs should have a longer crack growth life than the
service life of the aircraft by a factor of 2.33, in keeping with common industry
practice. The initial design proved to be excessive to the requirements of the lug
107
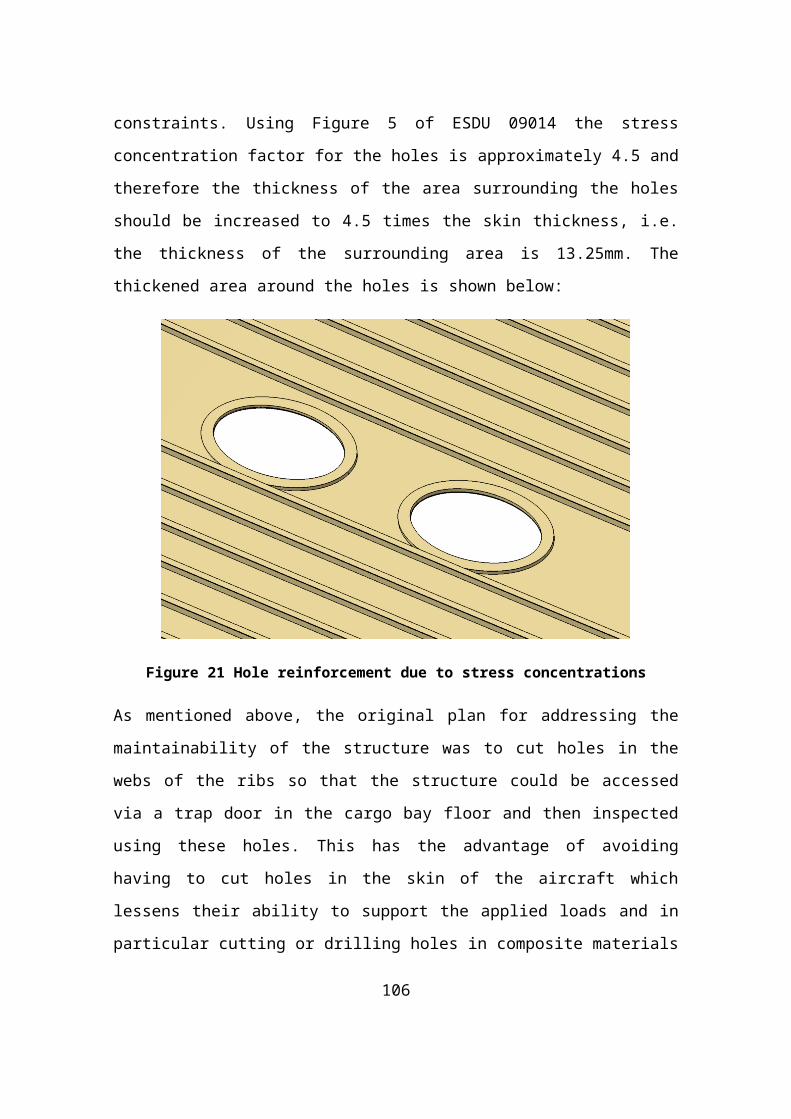
with a predicted crack growth life of 10.197 times the service life of the aircraft.
The design was subsequently iterated until the lugs were predicted to have the
much more acceptable fatigue life of 2.33 aircraft service lives.
A number of assumptions were made during the lug analysis in order to simplify
the design procedure so that it could be completed within the time constraints of
the GDP. The load which was taken to be applied to the lug was that produced
by the outer wing during 1g steady level flight. In reality the lugs will also have
to be able to withstand the loads encountered during the pitching and rolling
manoeuvres which the other structural components have been designed using.
Furthermore it was assumed that the lugs would each take one eighth of the
applied force and that this force will act at an angle of twenty degrees to the
vertical. In reality the loading will be different for each lug, a more detailed
simulation of the connection using finite element analysis would provide more
accurate design data. However, allowing for these assumptions, the lug has
been designed according to the Damage Tolerance philosophy to have
sufficient fatigue life to safely fulfil its role of connecting the mid and outer wing
sections together as per the requirements of the Group Design Project.
108
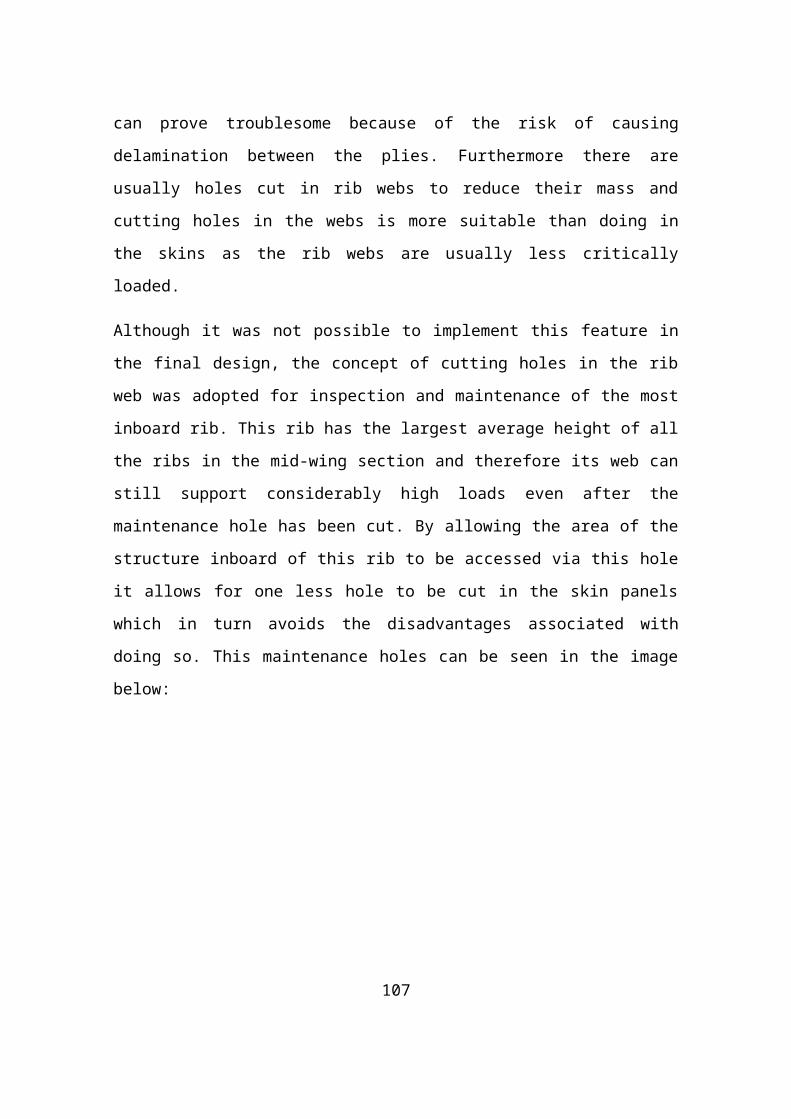
9 Aeroelasticity
9.1 Introduction
When the loading on a wing is calculated it is assumed the wing is a completely
rigid body and does not deform due to the applied loads. In reality this is not the
case and instead the applied aerodynamic load will cause the wing to change
shape which will in turn change the characteristics of the aerodynamic load
created. Aeroelasticity is the field concerned with this coupling of the
aerodynamic loads with the deformation of the structure. This chapter discusses
the aeroelastic phenomena which were taken into consideration when designing
the forward mid-wing’s structure.
9.1.1 Static Aeroelastic Phenomena
As the wing generates lift it is twisted about its longitudinal axis by these applied
loads and the angle of attack of the wing will increase which in turn leads to an
increase in the aerodynamic load and so this cycle repeats. This torsional
deformation cycle diverges at a certain velocity V ¿ and will subsequently lead to
structural failure.
Another static aeroelastic phenomenon which should be considered in
designing a wing is the reversal of control devices. When a trailing edge control
device is deployed a nose-down moment will be produced. This moment will
cause the wing to twist so that the angle of attack of the entire wing, and hence
that of the deployed control surface, is reduced. At a certain speed, V R the nose
down twist will result in the net deflection of the surface being zero and above
this speed the deflection will be negative relative to the direction of the flow. As
the design of the forward mid-wing does not involve the consideration of trailing
edge devices only the divergence speed has been investigated here.
109
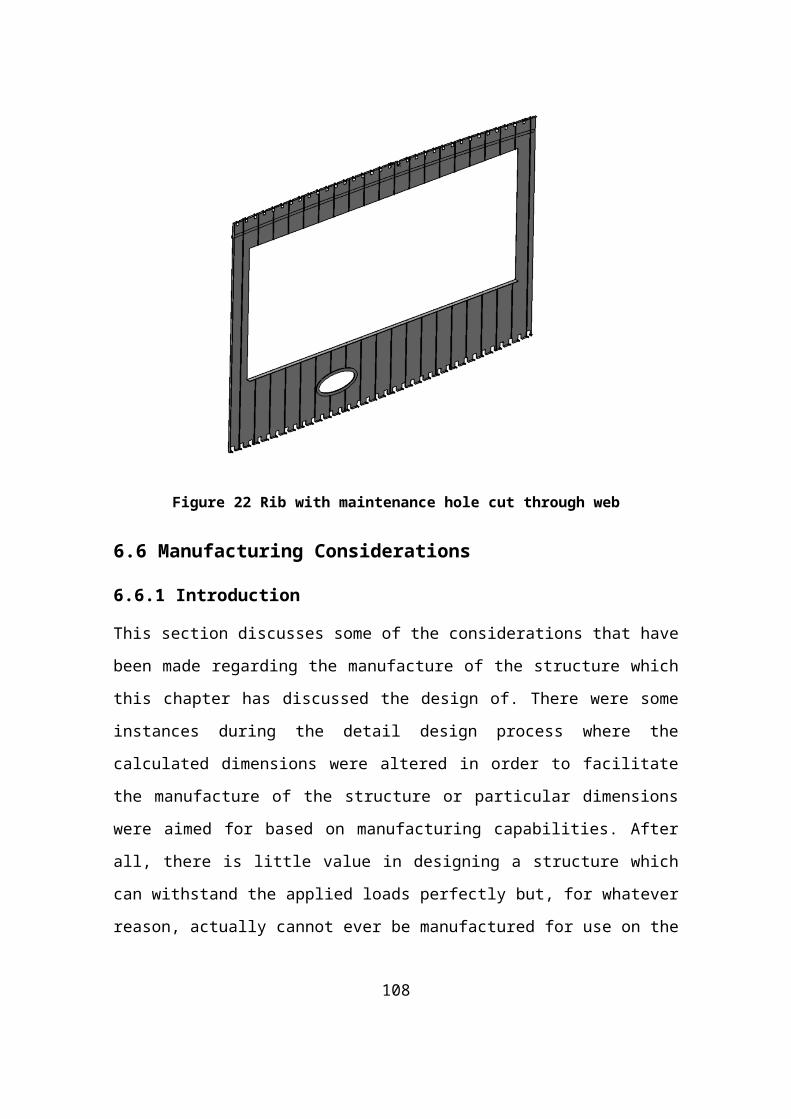
9.2 Torsional Divergence
In order to calculate the value of V ¿ the following formula was used which was
given in the notes of the Aeroelasticity course given by Dr. Shijun Guo (31):
V ¿=1.314√ 2∗mθ
ρ∗e∗c2∗a1∗s Equation 33
where mθ is the torsional stiffness of the section calculated at 0.7 semi-span, ρ
is the air density, e is the distance between the centre of pressure and the
flexural axis expressed as a fraction of the local chord (c) and s is the semi-
span.
This formula is only valid for unswept wings. The FW-12 has a sweep angle of
39 degrees (1) and so the effect of this sweep must be accounted for. A method
of doing so is provided by Wright and Cooper in reference (32). The following
graph illustrates the relationship between sweep angle and the divergence
speed:
Figure 36 Relationship between divergence speed and sweep angle (32)
By extrapolation the factor corresponding to a sweep angle of 39 degrees was found to be 2.1544. The value of V ¿ could now be calculated and compared to the requirement stated in CS 25.629 that divergence should not occur below 1.15V d at any altitude. To illustrate the effect of altitude on the aircraft’s capability of meeting this criterion the value of V ¿ was calculated at 4 altitudes:
110
Altitude (ft)
V d m/s (TAS)
1.15V d m/s (TAS)
V ¿m/s (TAS) V ¿390 m/s (TAS)
0 180 207 364.583 785.4594
25000 266.58 306.567 534.53 1151.596
35000 272.94 313.881 642.802 1384.852
42000 277.34 318.941 756.705 1630.245
Table 13 Divergence Velocity Results
9.3 DiscussionThe divergence velocities at four different altitudes were calculated and are shown in the 5th column in the above table. From the results it is clear that the aircraft easily meets the divergence requirements as specified in CS25. The relatively high sweep angle of the FW-12 leads to divergence not being a significant concern but even if the effect of sweep is ignored the velocities at which divergence will occur still exceed 1.15V d considerably.
As is the case with the majority of the work carried out for the GDP some assumptions have been made here and so more detailed simulation may be needed before it can be absolutely certain that the aircraft complies with the requirements. However as the predicted divergence velocity is more than twice the design speed of the aircraft it is almost certain that divergence will not present a significant design problem for the aircraft.
111
10 Project Management & Interface Issues Control
10.1 Introduction
The author took on the voluntary secondary task of being a member of the
Interface Issues Control Team (IICT) along with Mr. Julien Ertveldt (7) and Mr.
Sheng Yongmin (8). Early in the project the author discussed the
responsibilities of the IICT with the course director, Dr. Shijun Guo. Dr. Guo
instructed that the purpose of this team was to facilitate the resolving of any
issues which arose during the project by coordinating the relevant team
members as necessary. The IICT formed one of the sub-teams of the Project
Management Team, the other groups which comprised the management team
and the structure of the team is illustrated below:
Figure 37 Project Management Team Hierarchy
Essentially the goal of the IICT was that if a member of the team had an issue
which was hindering their design progress they could report it to the IICT who
would then organise a meeting with the relevant designers so that the best
possible solution for all those involved in the issue could be implemented.
112
Project Management
Team
Project Plan & Progress
Management
Mass, Inertia and CG Control
Risk Register Management
Interface Issues Control
10.2 Issues Addressed
10.2.1 Redesign of Trailing Edge
As was mentioned earlier in Chapter 3, the trailing edge of the aircraft was
redesigned based on the recommendations of Prof. Fielding. It was believed
that the sharp kink in the rear spar would lead to manufacturing difficulties and
stress concentrations in the spar. To determine the exact changes which would
be made and how the new design might be optimised with regards to the
location of the trailing edge devices, a meeting was called by the IICT for all the
members of the structural design team. The team discussed the various
implications of the redesign and together finalised the planform of the FW-12 as
shown earlier in Chapter 2 and here again below:
Figure 38 Planform of the FW-12 before (left) and after (right) the redesign of the
trailing edge.
The changes agreed on in this meeting allowed for the flaps of the aircraft,
which were initially aligned with the original sweep angle of the trailing edge of
the outer wings, to be set perpendicular to the direction of flight. This improved
the efficiency of the flaps which would prove useful later in the project when
concerns over the lift required at take-off arose and also removed the risks
associated with the sharp kink in the spars.
10.2.2 Location of ribs in mid-wing and outer-wing
One other example of an interface issue which arose during the project was the
decision of where to locate the ribs which would support the outer elevators and
the slats. The leading edge slats would connect to the ribs and so the hinge
113

points of the slats would be determined by the rib locations and vice-versa.
Similarly the location of the hinge positions for the outer elevator also depended
on the location of the ribs so the designers were faced with the task of
determining how the rib locations would be decided; based on the requirements
of the outer elevators or of the slats.
The solution was developed not by the interface issues control team but by all
the designers involved during a meeting which the IICT organised to solve the
problem. The decision was taken that the rib locations would be first determined
by the attachment requirements of the outer elevators and the attachment of the
slat would be then designed based on these rib locations. The reasoning behind
this was that, due to the short moment arm over which the elevators act
because of the FW-12’s flying wing configuration, the magnitude of the loads
which they generate can be very high. Furthermore, the elevators will be used
in more phases of flight and more frequently than the slats so the requirements
of the elevator design were deemed to be more critical than those of the slat
design.
10.2.3 CATIA Black Box Conflicts
Another responsibility of the Interface Issues Control team was resolving the
conflicts in the assembly of the black box CAD model of the FW-12. This
consisted of an assembly of very simplified models or “black box models” which
represented each of the components on the aircraft. The goal of assembling the
black box models was to determine if any conflicts were presented regarding
the allocation of space on-board the aircraft.
These issues tended to arise more so at the beginning of the project, in
particular the black box representing the cargo bay section overlapped with
black box of the main landing gear bay. This issue had to be resolved and so
the IICT organised a meeting between the relevant designers to determine the
cause of the problem and find a solution.
114
The reason for the conflict between the cargo bay and main landing gear bay
turned out to be a result of the redesign of the trailing edge of the aircraft from
the original external shape to the new profile. The changes made to the kink of
the wing and the nose led to a mismatch of the dimensions of the components.
However the conflict was small, on the scale of only a couple of hundred
millimetres, and so the resolution was that the cargo bay would be reduced in
size as the space required to retract the main landing gear was the limiting
factor. This solution was agreed upon by all designers involved.
115
11 Mass Estimation
The mass and position of centre of gravity (CG) are key parameters in the
design of any aircraft and in particular the centre of gravity location is of vital
importance when designing a flying wing aircraft such as the FW-12 due to the
inherent reduced stability of such vehicles. Throughout the course of the Group
Design Project the CG was monitored by Mr. Alasdair MacBean (33) as the sole
member of the CG Monitoring Team. As well as this the overall mass of the
aircraft was monitored throughout, in particular the maximum take-off mass
(MTOW) which is a vital characteristic of the aircraft as it determines the
minimum amount of lift which the aircraft must be able to produce in order to fly.
The initial values for the masses and locations of the various components of the
aircraft had been determined from the conceptual design study performed
previously (1), this gave a preliminary value for the CG position and MTOW.
The CG position could change slightly as needed provided that it did not exceed
the limits with which the stability system could cope but the value of MTOW was
regarded as being an upper limit as any significant increases in its value may
have required drastic changes to the aerodynamics of the aircraft to ensure
enough lift could be produced.
The mass and CG of the various components within the forward section of the
mid-wing were calculated using the values of the area and centre of gravity for
each component which were determined using the CATIA model and the values
for thickness which had been calculated during the detail design section.
The pie chart below indicates the proportion of the section’s total mass which
can be attributed to each component:
116
Upper Skin16%
Upper Stringer8%
Lower Skin13%
Lower Stringers
6%Third Spars
10%
Second Spars
9%
Front Spars9%
Outboard Bulkheads
6%
Leading Edge7%
Ribs16%
Mass Breakdown
Figure 39: Forward Mid-Wing Mass Breakdown
The choice of materials has had an impact on the estimated mass breakdown of
the structure. The skin stringer panels make up 44.39% of the total mass of the
structure. Typically this figure would be higher but as the spars and ribs are
made from aluminium alloys and the skins from composite materials, the skins
are comparatively lighter than would be the case had all the components been
made from the same materials.
The estimated value of each component’s mass is shown in the table below:
Component Mass (kg)
Upper Skin 435.58
Upper Stringers 218.51
Lower Skin 338.847
Lower Stringers 170.27
Third Spars 255.57
117
Second Spars 243.77
Front Spars 230.85
Outboard Bulkheads 171.37
Leading Edge 183.66
Rib 434.07
Total 2682.9
Table 14Mass Breakdown of Forward Mid-Wing Structure
118
12 Airworthiness Requirements Section:
In order for a new aircraft or variation of a previous aircraft to be issued with a
Certificate of Compliance it must be shown that all components comprising the
aircraft have met the requirements of the relative airworthiness authority.
As the FW-12 will be used as what is termed a large civil transport aircraft it
must show compliance with the requirements of EASA’s Certification
Specifications 25 requirements (CS-25) (2). In CS-25 there is a standard set of
“Means of Compliance” (MOC) codes as listed in the lecture notes of the
sustaining design course (17) and these are shown below:
MOC Code Description
0 Definition
1 Drawing, Description or Report
2 Calculations and Analysis
3 Safety Analysis
4 Lab/Rig Testing
5 Aircraft Ground Tests
6 Aircraft Flight Tests
7 Inspection/Survey
8 Simulator Test
9 Equipment Qualification and
Procurement
119
13 Conclusion
This thesis has documented and discussed the work conducted by the author in
the course of the Group Design Project. The task at hand was to design the
structure of the forward mid-wing section of the FW-12 flying wing civil transport
aircraft so that it could survive the ultimate loads which it would encounter
during service.
The first chapter discussed the loading analysis conducted at the beginning of
the project which involved determining the loads required from the elevators to
perform various symmetric manoeuvres. The additional work performed by the
author in assisting the calculation of the loading distributions was also
discussed. The goal of conducting this phase of the project was to determine
the loads which the aircraft would be subjected to, this in turn allowed for the
structure to be designed to support these loads.
The initial structural design of the mid-wing section of the aircraft was then
presented in Chapter 3. The structural layout was decided upon by all members
of the structures design team and the roles of the main structural members
were outlined. The subsequent chapters detailed the process followed to design
the individual structural components and the development of finite element
simulations of the section’s response to the applied loads so that the results of
the two approaches could be compared. The evaluation of the fatigue behaviour
of the lugs which connect the outer wing to the mid-wing was then covered as
was the considerations made regarding the effects of aeroelastic phenomena
on the structure. The final three chapters discussed the work done for the
secondary task of Interface Issues Control management, the breakdown of the
mass of the structure designed and the compliance of the design with the
airworthiness requirements as specified in CS-25. The detailed calculations
performed and procedures followed to arrive at the results presented in this
thesis can be found in the appendices following this section.
The Group Design Project comprises the largest percentage of the total marks
on the Aerospace Vehicle Design course at Cranfield University. The aim of the
120
project is to teach the students of the AVD course to design specific
components of an aircraft and do so in an environment which resembles that
found in the aerospace industry. The work performed on the project resulted in
the author gaining experience in using software packages which are commonly
used in industry such as CATIA, Strand7 and PATRAN/NASTRAN as well as
further experience using Microsoft Excel.
Furthermore the process of designing engineering components to fulfil a
particular role but having been given only the most basic data to begin the
design process was a new experience which led to an increased appreciation of
the overall design process, not just in the aerospace field but in engineering in
general.
121
ITEM
DESCRIPTION
CS-25
REFERENCE
COMPLIANCE
STATUS
REQUIREMENT MEANS OF COMPLIANCE MOC
CODE
Loads CS 25.301 Compliant Definition of loads to be
used for sizing structural
components
The loads used to design
each component have been
specified
2
Factor of Safety CS 25.303 Compliant A factor of safety must be
applied when designing the
structure
Limit loads have been scaled
up by a factor of 1.5
2
Strength and
deformation
CS 25.305 Compliant The structure must be able
to withstand limit loads and
ultimate loads for 3
seconds
The structure has been
designed to withstand the
ultimate loads
2
Proof of structure CS 25.307 To be verified The structure has to
demonstrate its
survivability under critical
conditions
Testing of manufactured
structure, more accurate FEA
analysis, more detailed
calculations
2,4,5,6,
Flight loads CS 25.321 Compliant The load factor n must be Load factors obtained from 2
122
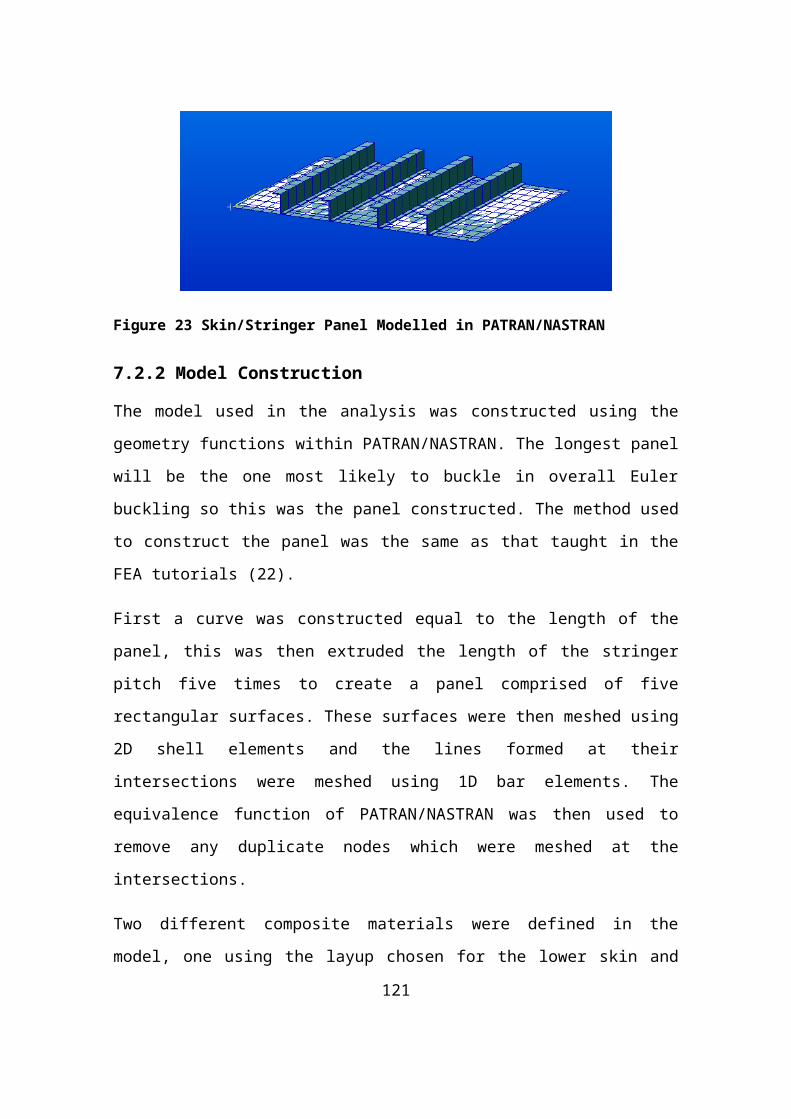
investigated for each
relevant case (mass,
altitude, manoeuvre, etc)
gust analysis and pitch
manoeuvres have been
applied
Flight
manoeuvring
envelopes
CS 25.333 Compliant The aircraft must be able
to survive loads
encountered within the n-V
diagram domain
The loading actions combine
all the relevant cases
encountered in the n-V
diagrams
2
Design airspeeds CS 25.335 Compliant The requirements for the
various design airspeeds
from the relevant CS-25
section must be met
Airspeeds were based on
those provided in the
conceptual design work and
comply with the requirements
1,2
Limiting
manoeuvring load
factors
CS 25.337 Compliant Requirement for the
maximum and minimum
load factor
n-V diagram has been
compiled based on these
load factor requirements
2
Gust and
turbulence loads
CS 25.341 To be verified The structure has to
survive discrete and
continuous gusts
The gust analysis was
simplified due to time
constraints and carried out
2
123
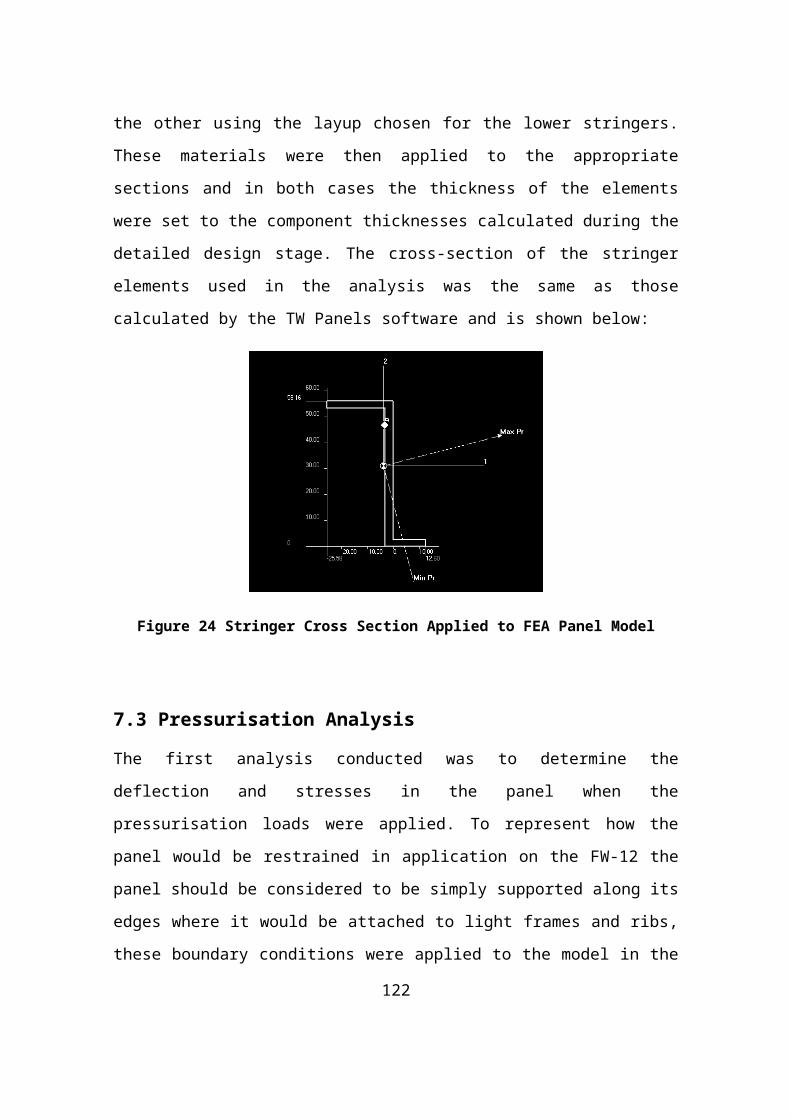
according to CS 23.341’s
alleviated sharp edge gust
method
Pressurised
compartment
loads
25.365a Compliant The aircraft structure must
be strong enough to
withstand the loads
resulting from pressure
differentials across its
surfaces
The skin stringer panels of
the structure were sized
based on the stresses
encountered during the
ultimate applied loads and
also when a pressure
differential of twice the
expected operating pressure
exists
2
Damage tolerance
and fatigue
evaluation of
structure
CS 25.371 To be verified The structure must be
shown to be damage
tolerant and that its fatigue
life is greater than the
aircraft service life
A connection lug was studied
in detail to meet these
requirements, more work is
required to ensure the entire
structure complies
2,4
Lightning CS 25.581 Compliant The aircraft must be able The skin is a composite 2
124
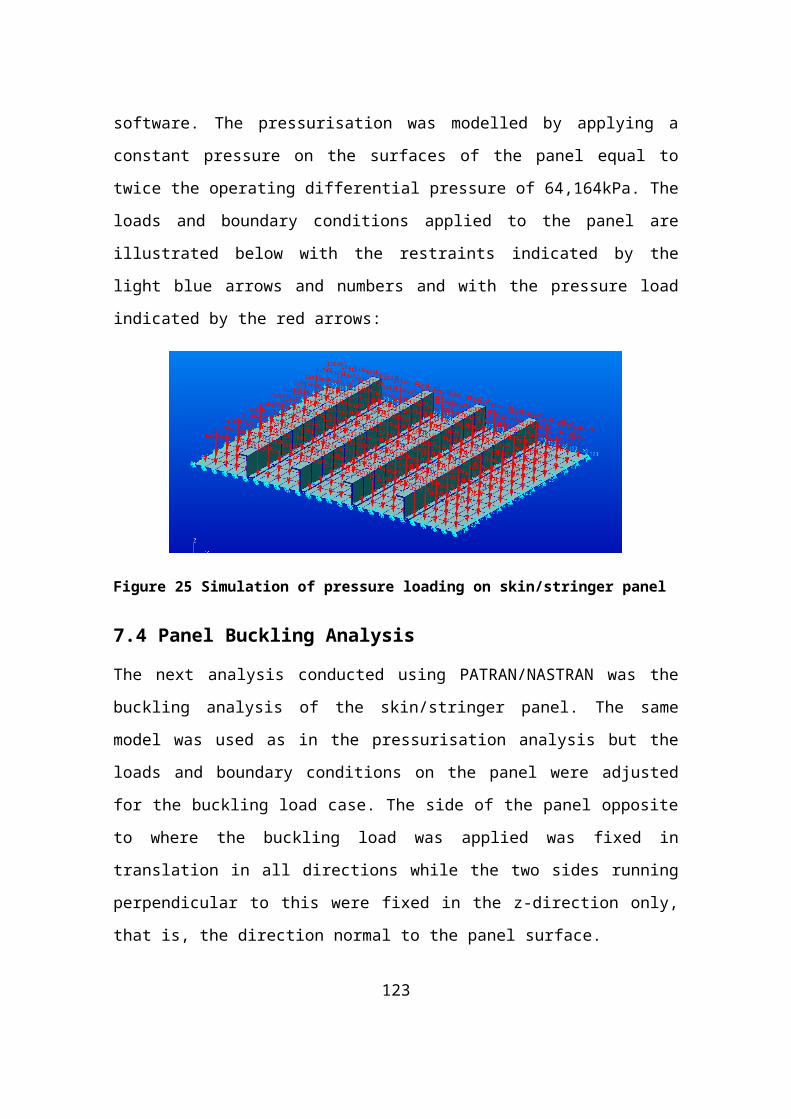
protection to withstand and survive
lightning strike effects
material and so to ensure
compliance a copper mesh
will be added in manufacture
Materials CS 25.603 Compliant The aircraft must be
manufactured from
approved materials
Only approved aerospace
materials were selected
2
Approved
fabrication
methods
CS 605 (b) Compliant Each new aircraft
fabrication method must be
substantiated by a test
programme
Where manufacturing
considerations have been
made, they employ the use
of tried and testing
manufacturing processes
2
Proof of structure
– flutter
CS 25.629 Partially compliant The aircraft must be
designed to be free from
flutter and divergence
The relevant flutter analysis
was conducted and
presented, tests may be
needed to validate fully
2,4
Accessibility
provisions
CS 25.611 Compliant Access must be provided
in order to inspect the
Visual inspection from the
cargo bay for most of the
2
125
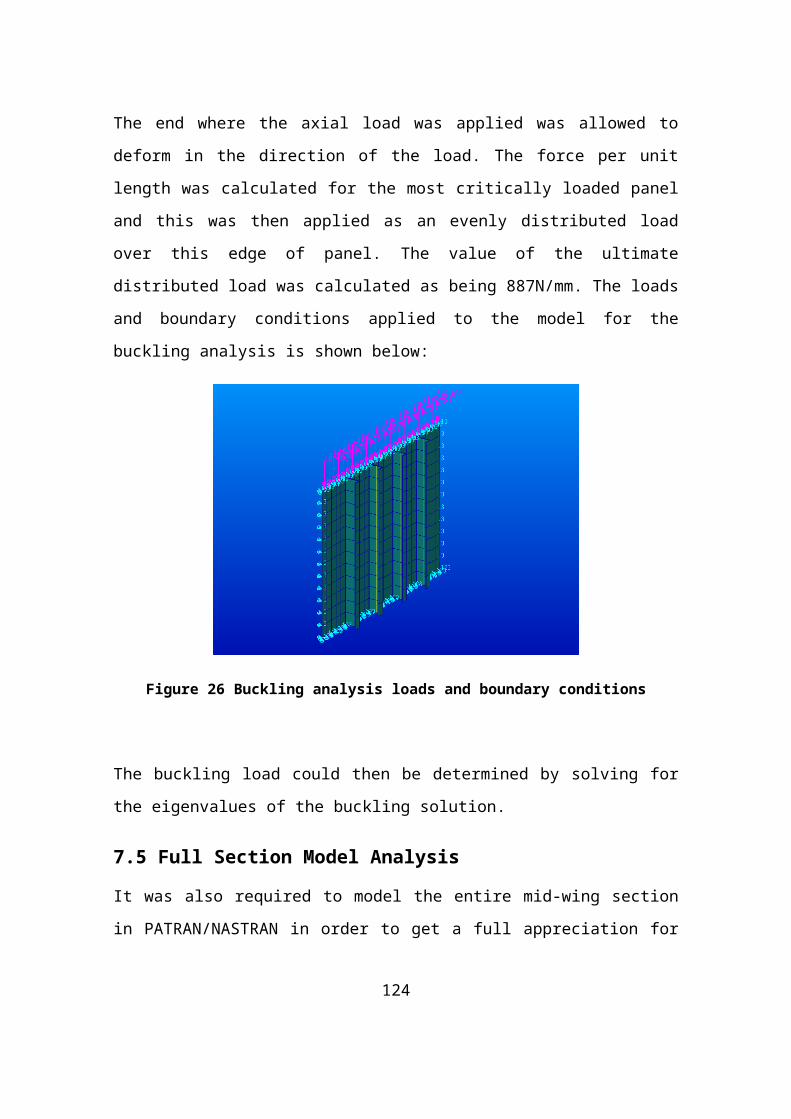
structure structure and access panels
cut in lower skin
Bird strike damage CS 25.631 Compliant/Partially
Compliant
The aircraft has to survive
a bird strike
The leading edge of the
aircraft was sized based on
this requirement. However
the formula used was
empirical and so testing is
needed to confirm if the
structure is fully compliant.
2,4
126
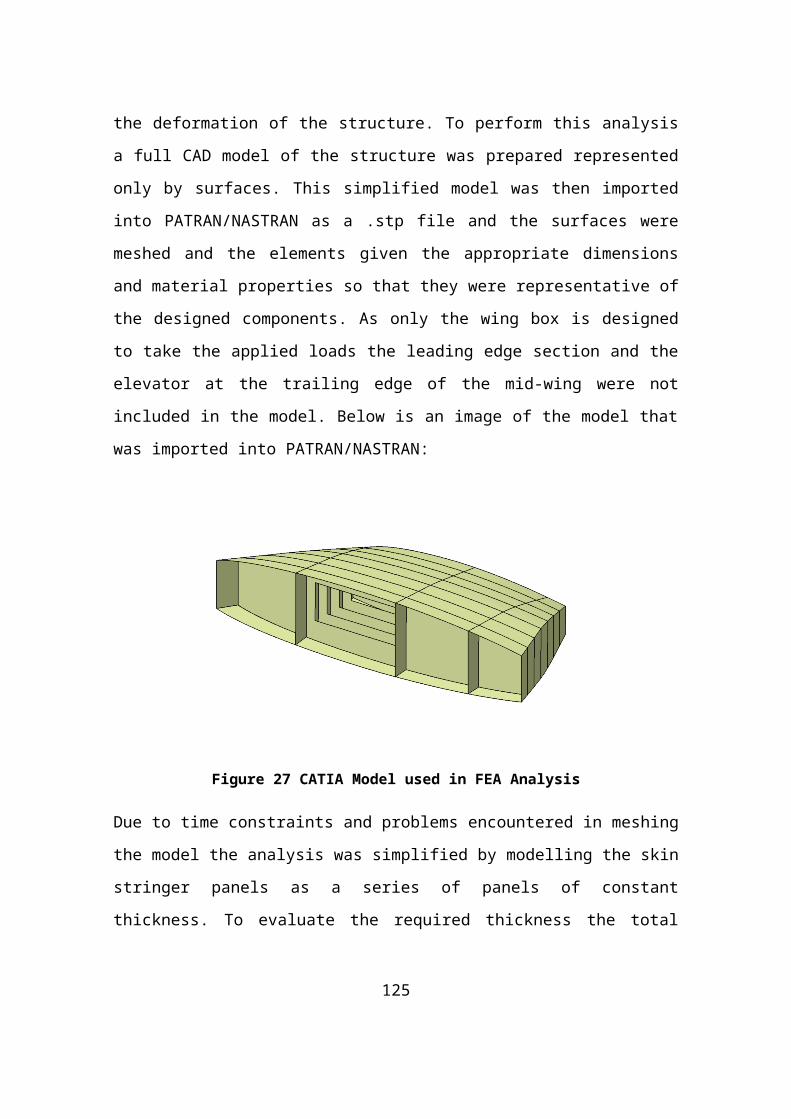
14 Bibliography
1. Students, AVIC. FW-11 Specifications Report - Conceptual Design Data.
2011.
2. CS-25. Certification Specifications and Acceptable Means of Compliance for
Large Aeroplanes. 2011.
3. Guo, Dr. S. FW-12 GDP Task List. s.l. : Cranfield University, 2012.
4. Stinton, Darrol. The Anatomy of the Airplane. 1998.
5. Smith, H. Loading Actions Lecture Notes. 2012.
6. Howe, Denis. Aircraft Loading and Structural Layout. s.l. : Professional
Engineerig Publishing UK, 2004.
7. Ertveldt, J. Structural Design of Mid-Wing Aft Section on FW-12 MSc Thesis.
s.l. : Cranfield University, 2012.
8. Hybrid Wing-Body Pressurized Fuselage Modelling, Analysis and Design for
Weight Reduction. Mukhopadhyay, V. s.l. : American Institute of Aeronautics
and Astronautics, 2012.
9. Company, Hexcel. Hexcel Prepregs for Aerospace. [Online] [Cited: 5 August
2012.] http://www.hexcel.com/products/aerospace/aprepregs.
10. NewAirplane.com. [Online] The Boeing Company, 2012. [Cited: 24 May
2012.] http://www.newairplane.com/787/design_highlights/#/VisionaryDesign/
Composites/OnePieceBarrelConstruction.
11. Alcoa. Technical Data Sheet for Aluminium Alloy 2099 T-83. [Online] Alcoa.
[Cited: 07 08 2012.]
http://www.alcoa.com/adip/catalog/pdf/Alloy2099TechSheet.pdf.
12. Stocking, P. Detail Stressing Lecture Note AVD9638. s.l. : Cranfield
University, 2012.
127
13. ESDU. Laminate Stacking Sequences for Special Orthotropy. s.l. : ESDU,
1982.
14. Guo, S. Design and Analysis of Composite Structures Lecture Series. s.l. :
Cranfield University, 2012.
15. ESDU 71005 Buckling of Flat Plates in Shear. ESDU.
16. ESDU. Elastic direct stresses deflections for flat rectangular plates under
uniformly distributed normal pressure.
17. Stocking, P. Structural Durability - Sustaining Design Course. s.l. :
Cranfield University, 2012.
18. Aircraft hardware - The MS20426 and NAS1097 rivet. Aerospace
Engineering Teaching Blog. [Online] [Cited: 14 September 2012.]
http://aeroteaching.blogspot.co.uk/2012/04/aircraft-hardware-ms20426-and-
nas1097.html.
19. Ltd., Strand7 Pty. Strand7 Tutorial Notes. 2012.
20. Niu, M. Airframe Stress Analysis and Sizing. 2001.
21. Guosheng, Mr. Ji. Cabin Layout - Structural Design and Cargo Handling -
FW-12 Group Design Project. s.l. : Cranfield University.
22. Pires, Dr. R. PATRAN/NASTRAN FEA Analysis Lecture Notes. 2012.
23. Zhang, Dr. Xiang. Meeting with Dr. Zhang and lug fatigue analysis group
on August 29th.
24. Stocking, Mr. Phil. Detail Stressing Data Sheets.
25. Yan, Li. Structural Design of Inner Wing Structure of FW-12 Aircraft. s.l. :
Cranfield University, 2012.
26. Zhang, Dr. X. Fatigue, Fracture & Damage Tolerance Lecture Notes.
128
27. Yongmin, Mr. Sheng. Structural Design of Outer Wing Section on FW-12.
s.l. : Cranfield University, 2012.
28. Company, Airbus. A380 Specifications. [Online] [Cited: 21 May 2012.]
http://www.airbus.com/aircraftfamilies/passengeraircraft/a380family/a380-800/
specifications/.
29. Palmer, Barbarie E. Blended Wing Body Airliner Advanced Technology
Integration Study (BW-01) Centre Fuselage - Unvaulted Pressure Hull Design.
30. Assair, E. BW-11 Eagle Ray Blended Wing Body - Design of the Outer
Wing in Composite Materials. s.l. : Cranfield University, 2012.
31. University, Stanford.
adg.stanford.edu/aa241/structures/structuraldesign.html. [Online] [Cited: 04 09
2012.]
32. Zhang, Dr. X. Conversation on September 6th 2012. 2012.
129
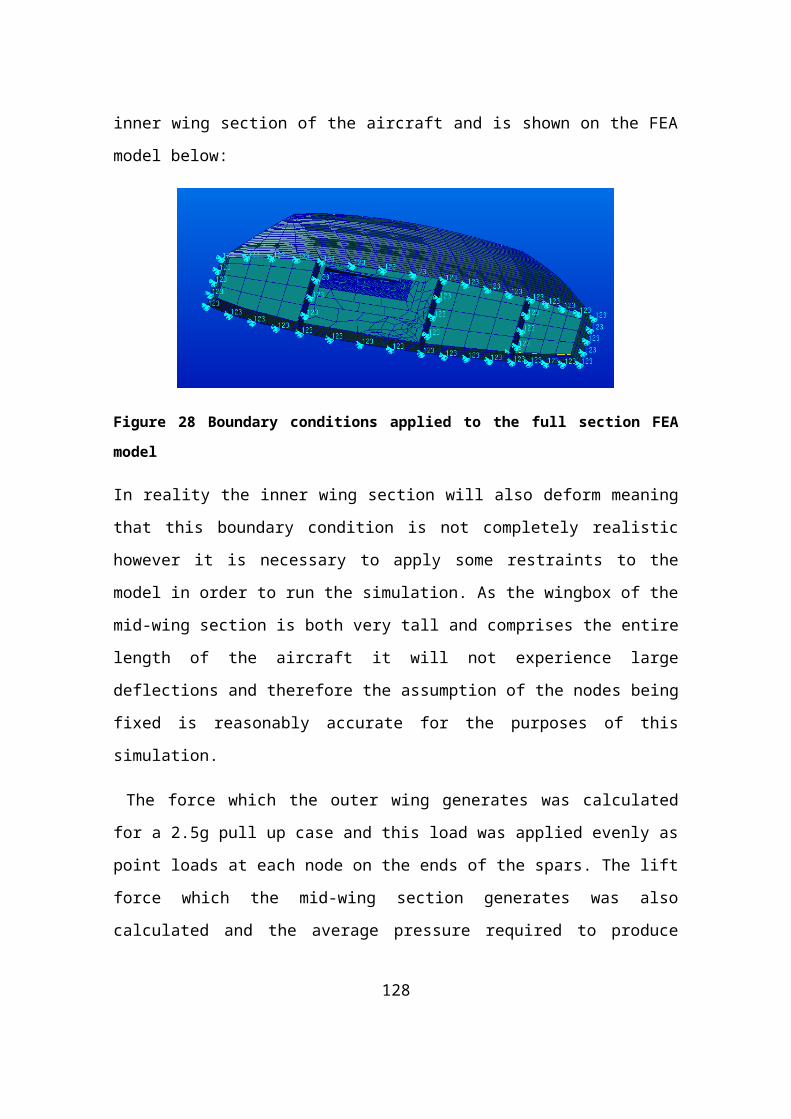
15 Appendices
Appendix A Loading Actions
The loading actions work performed in the earlier stages of the project were
discussed in Chapter 2 and some sample calculations are shown here to
demonstrate the work performed as part of this section
A.1 Steady Level Flight
An example of the calculations performed to determine the force required to
keep the aircraft trimmed in steady level flight is shown here. The case
considered in this example is when the aircraft is flying at its cruise altitude of
35,000 feet or 10.668 km and at its cruise velocity corresponding to an
equivalent airspeed of 144.04m/s. That mass of the aircraft considered is its
maximum take-off mass of 176,469kg and its centre of gravity is at its most
forward position. The calculation considers the case where the inner elevator is
used to trim the aircraft and the relevant case number is 45_1.
To determine the force required to trim the aircraft all of the forces acting on it
must be determined along with their corresponding moments about the vehicle’s
centre of gravity. Once this has been determined the moment required to trim
can be calculated along with the necessary elevator force.
From the conceptual design study performed previously (1), the locations of the
centre of gravity (h) and aerodynamic centre (H 0) of the aircraft expressed as a
fraction of the mean aerodynamic chord (c ) are:
h=0.3089∧H 0=0.387
The mean aerodynamic chord has a value of 12.28m and is located 9.49m from
the nose of the aircraft, therefore
X h=13.2575m∧X H 0=14.24m
130
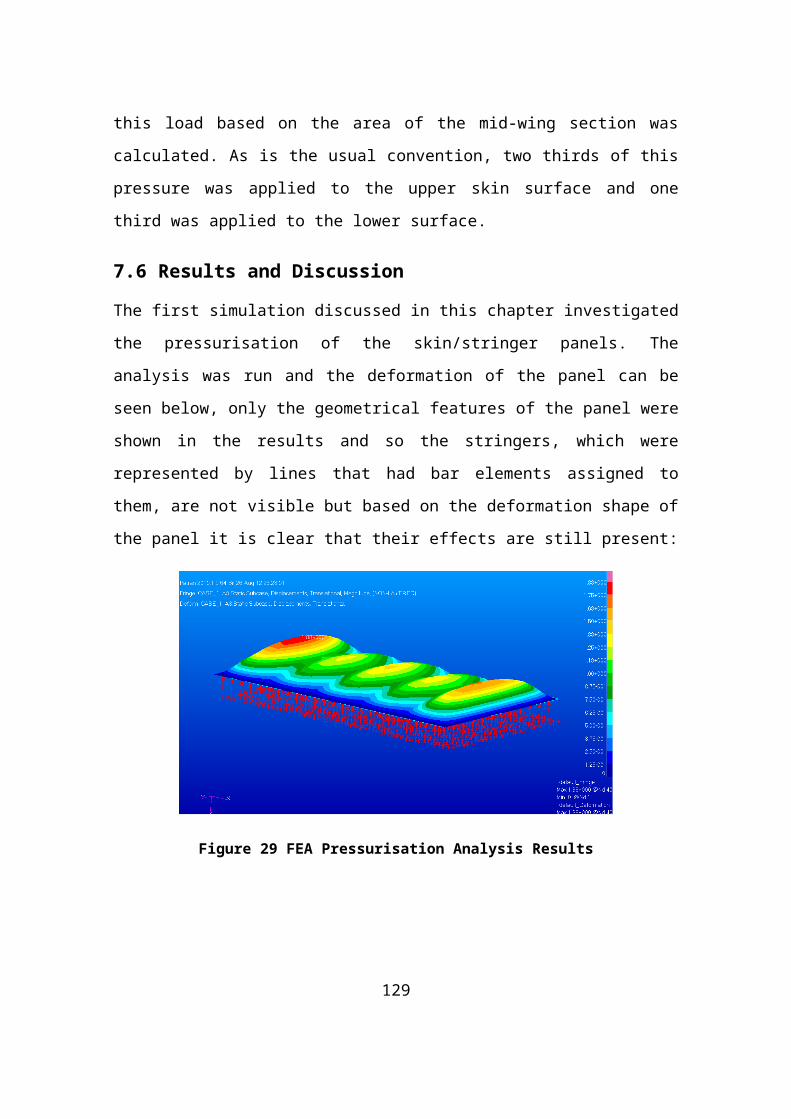
The moment arm over which the lift force will act about the centre of gravity is
therefore:
Llift=14.24−13.2575=0.9849m
In steady level flight the wings must produce a lift force (L) equal in magnitude
to the weight of the aircraft(W ). The mass of the aircraft is 176,469kg, therefore
its weight is:
W=9.81∗176469=1731160.89N=L
The moment due to the lift generated is therefore:
M lift=1731160.89∗0.9849=1704944.19Nm
Next the moment due to the thrust produced by the engines must be evaluated.
In steady level flight the thrust must equal the drag acting on the aircraft, so it is
necessary to calculate this first.
The drag (D) acting on the aircraft is a function of the dynamic pressure (q)
which is in turn a function of the local air density (ρ) and the true airspeed:
D=q∗S∗Cd
q=12∗ρV TAS
2
V TAS=V EAS∗√ ρ0ρ
=144.04∗√ 1.18390.363=260.14m /s
Therefore
q=0.5∗0.363∗260.142=12,282Pa
With this value known the coefficient of lift (C l ) of the aircraft can also be found
as this will be required in to calculate the drag coefficient (Cd):
C l=LqS
= 1731160.8912,282∗647
=0.21785
131
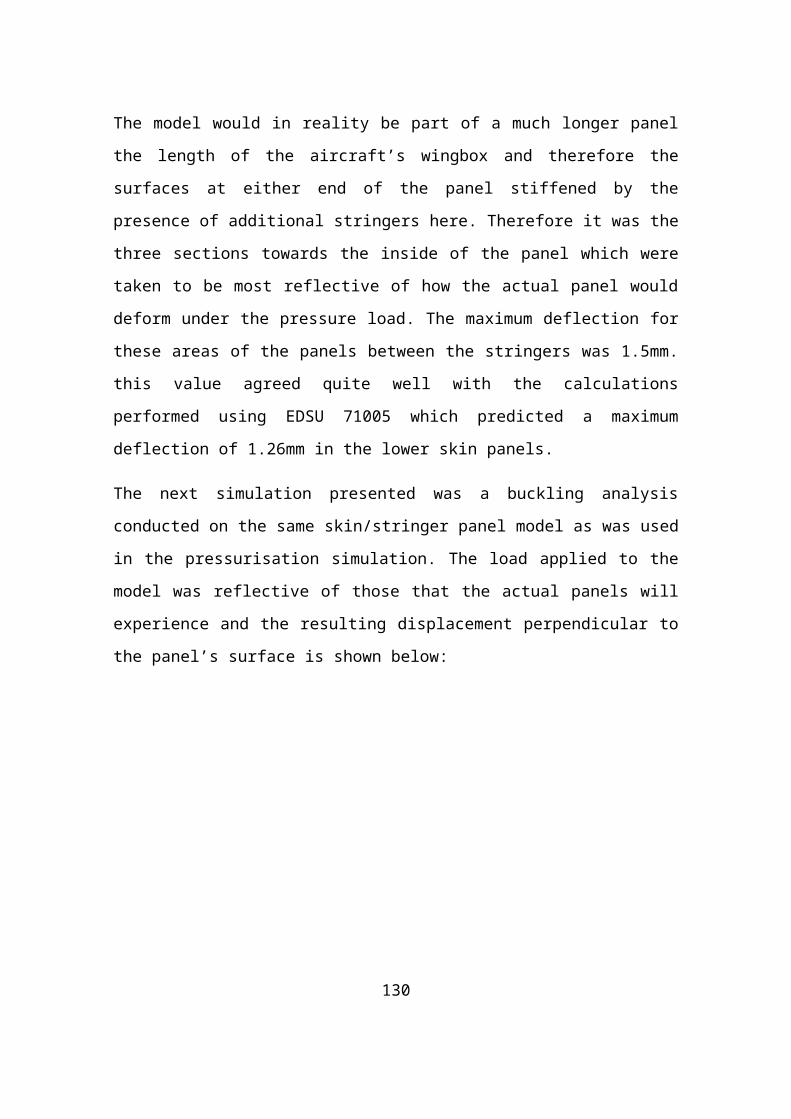
The drag coefficient (Cd ¿ can now be evaluated, this is a function of the
aircraft’s shape and also the lift generated:
Cd=Cd 0+k Cl2=0.00848+0.0535∗0.217852=0.01102
Therefore the drag acting on the aircraft is:
D=q∗S∗Cd=12282∗647∗0.01102=87569.923N
So the thrust which the engines must provide to maintain steady level flight is
87,569N.The engine pylon length given in the conceptual design data was
3.2m, therefore the moment due to the thrust is:
M thrust=3.2∗87659=280,508.8Nm
The final moment acting on the aircraft which must be determined is the zero lift
pitching moment. This is done using the zero pitching moment coefficient which
was determined during the conceptual design phase:
M 0=CM 0∗q∗S∗c=0.00659∗12,282∗647∗12.28=643068.38Nm
Finally the moment required to trim the aircraft can now be found by summing
the moments previously calculated in the appropriate directions. Nose down
moments are taken as being negative and nose up moments are positive,
therefore:
M Z=M lift+Mthr ust−M 0
M z=1704944.19+280508.8−643068.38=1,342,384.61Nm
To determine the force required from the inner elevator to produce this moment
the effective tail length discussed in Chapter 2 must be evaluated. The effective
tail length relative to the aerodynamic centre can be found as follows:
Lt=|c∗Cmηin
Clηin|
132
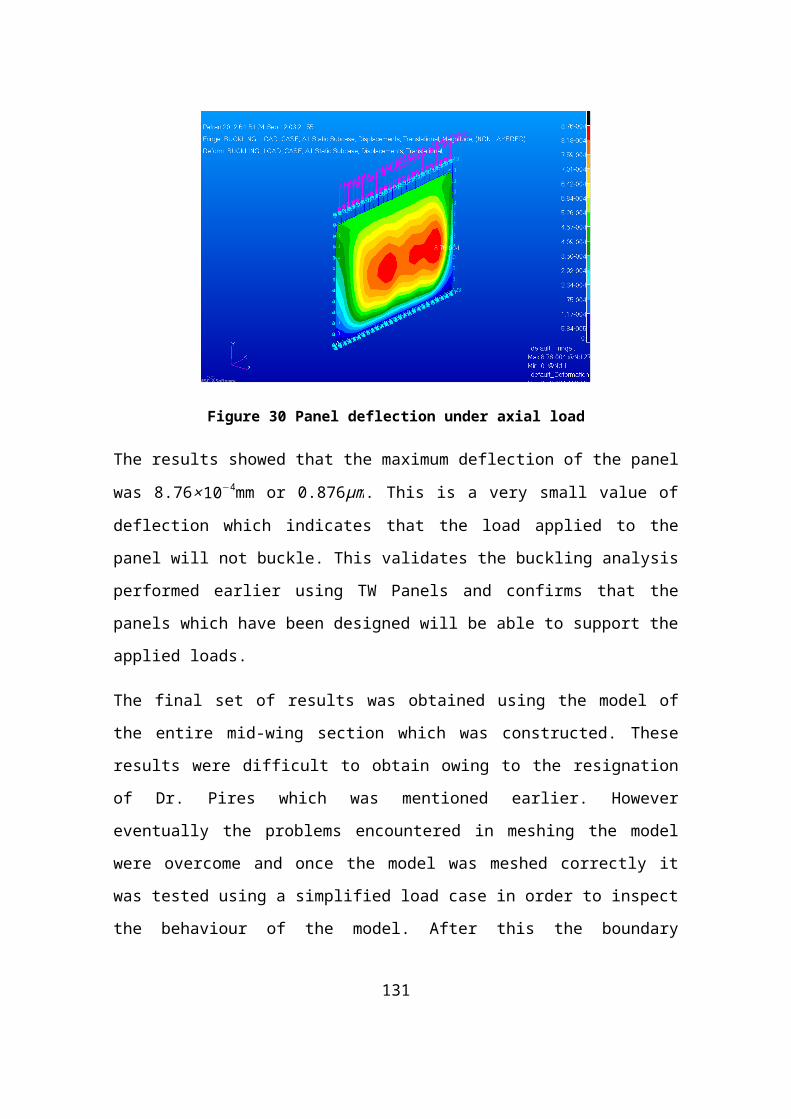
From the conceptual design data, the values of the rate of change of the
elevator pitch moment (C ¿¿mηin)¿ and the lift curve slope for the elevator
(C ¿¿ lηin)¿ at aircraft’s cruise velocity of M=0.82 are:
Cmηin=−0.00447∧Clηin
=0.00859
Therefore:
|c∗Cmηin
C lηin|=12.28∗0.004470.00859
=6.39m
So the moment arm over which the elevator force acts is this distance plus the
distance between the aerodynamic centre and the centre of gravity:
Lt'=6.39+0.9849=7.3749m
So with this the force required from the elevator to maintain steady level flight is:
Z t=1,342,384.617.3749
=182,020.7203N
This force must be applied in a downward direction in order to produce a nose
up moment.
A.2 Steady Rotary Motion
The force required of the elevators to put the aircraft into a state of steady rotary
motion was also calculated. The altitude and velocity of the aircraft in this
sample calculation are the same as used in the previous section as is the
vehicle’s mass and centre of gravity location. The sample calculation finds the
force required to hold the aircraft in a 2.5g pull-up manoeuvre in steady rotary
motion and the case number used to distinguish the case was 1015. The theory
detailing this calculation can be found in Chapter 2.
First the aircraft relative density is calculated:
133
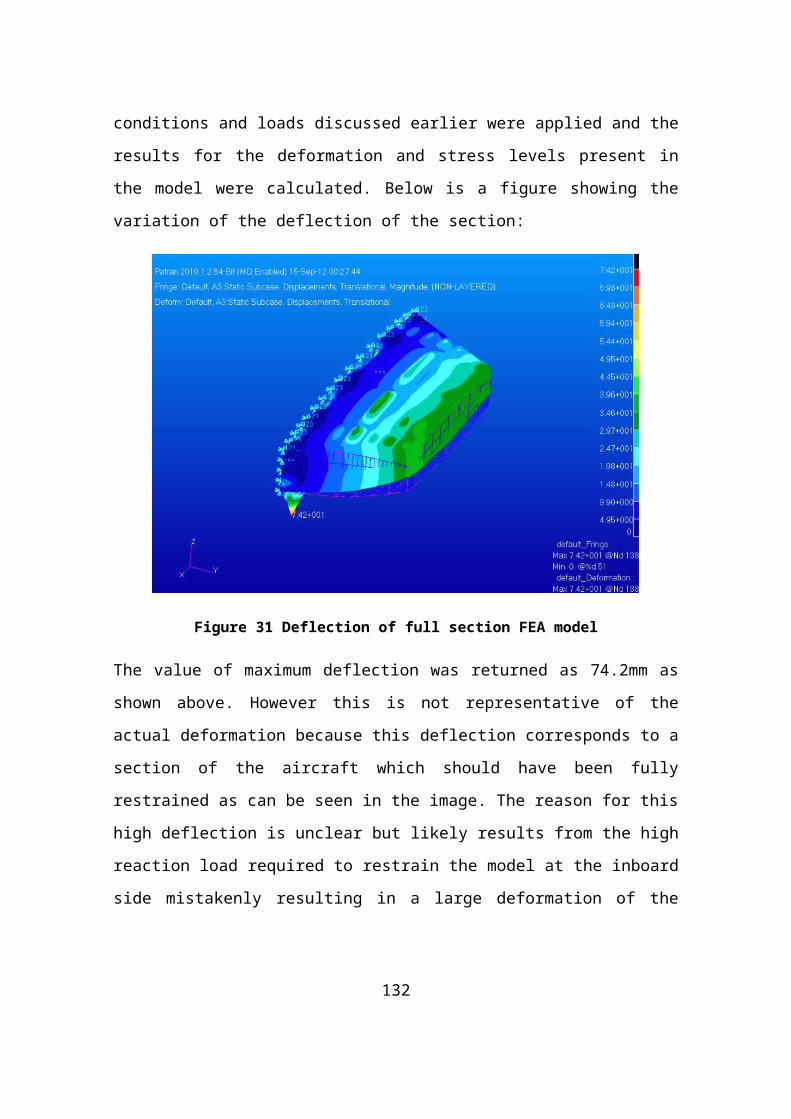
μ=2MρSc
= 2∗1764690.363∗647∗12.28
=122.374 s2
m2
Using this and the pitch moment damping coefficient, given in the conceptual
design data as M θ= -1.13810, the manoeuvre margin of the aircraft can be
calculated:
Hm=H 0−h−M θ
μ=0.387−0.3068−−1.13810
112.374=0.09032
The lift-curve slope for the inner elevator at this velocity is:
C lηin=0.49217 1
rad
The increment in the inner elevator’s deflection is therefore:
ηss=−2MH m (n−1 )g
C lηinSρV 2( Lt
'
c−
M θ
μ )ηss=
−2∗176469∗0.09032∗(2.5−1 )∗9.81
0.49217∗647∗0.363∗260.142∗(7.374912.28−−1.1381122.37 )
=−0.098334 rad
From this the increment in elevator load can be found:
Lηss=−M Hmc (n−1 ) g
Lt'−c
M θ
μ
Lηss=−176469∗0.09032∗12.28∗(2.5−1 )∗9.81
7.3749−12.28∗−1.1381
122.374
=−384574.96N
Therefore the total load required from the inner elevators to perform this
manoeuvre is the sum of this increment in elevator load and the load required to
maintain steady level flight:
Lη¿=−182,020.7203−384,574.96=−564,595.68N
134
Appendix B - Initial Sizing Appendix
B.1 Leading Edge Thickness
The thickness required to survive bird-strikes satisfactorily can be estimated
using the following formula:
t=0.02 .V M .m
13 . f (Mat ) .cos2 /3θ
exp ( 1230r2+30r+1000
)
V M is taken to be the greater of either the cruise velocity of the aircraft at sea
level or 85% of the cruise velocity at an altitude of 8000ft. Taking the FW-12’s
cruise speed to be Mach 0.82 and the speed of sound at 8000ft to be
330.802m/s the required velocity for the collision was found to be 230.57m/s. As
discussed in Chapter 5 f (Mat) is a material factor defined as 0.8f 1(L73)f 1(Mat ) and is
equal to 5.891 based on the CoALA results for the composite layup used for the
leading edge which is taken to be the same as for the upper skin (i.e. the thicker
skin layup).
The value of the leading edge thickness is not very dependent on the value of
the radius r and so a simple approximation for the radius is sufficient to
estimate the thickness. Using the CATIA model the average value of the radius
of the leading edge was found to be 11840mm.
The value of m is 1.8kg as dictated by CS.25 requirements and θ varies from 0
degrees at the foremost point of the leading edge to 90 degrees where the
leading edge meets the first spar.
Based on these values the largest value of the leading edge thickness can now
be found:
135
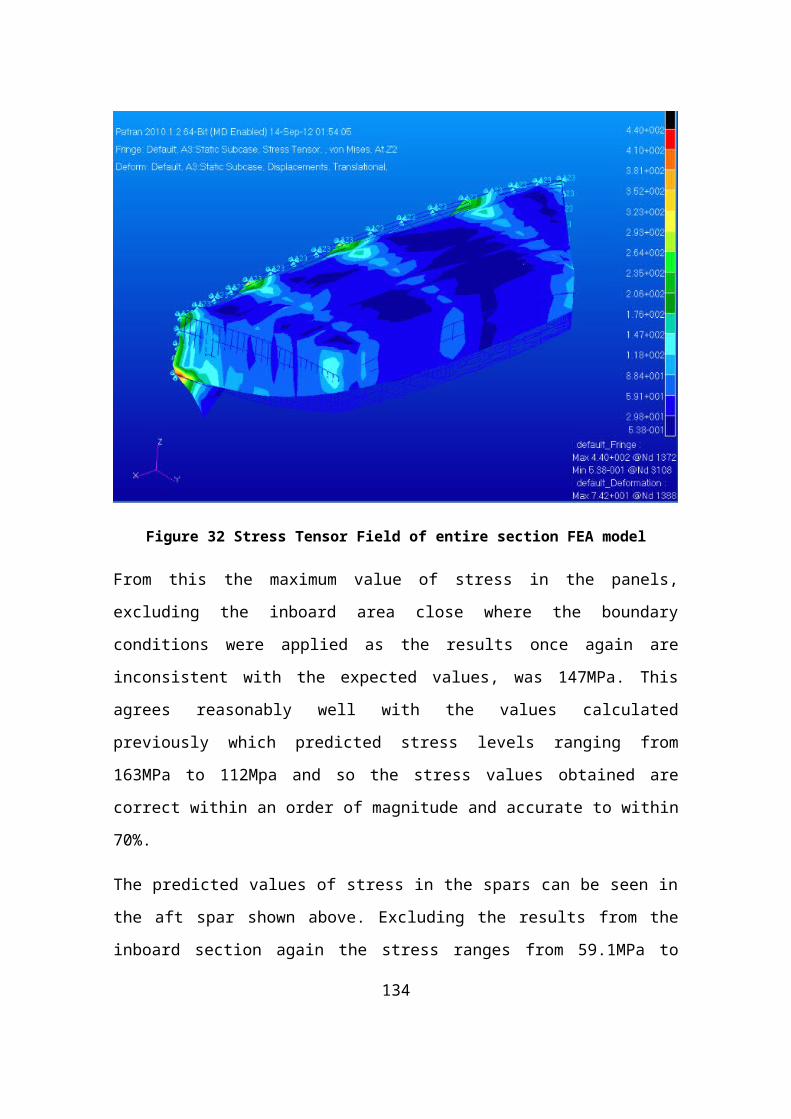
t=0.02∗230.57∗(1.8
13 )∗5.891∗(cos (00)2/3 )
exp ( 1230
130002+(30∗13000)+1000 )=5.43mm
This value of thickness corresponds to that which is required to withstand a
collision with a bird at the exact front of the aircraft, i.e. when θ=0. To minimise
the weight of the leading edge section the thickness can be reduced for angles
greater than zero, the variation of the leading edge skin thickness is illustrated
below:
Figure 40 Variation of Leading Edge Thickness due to bird-strike requirement
B.2 Equivalent Skin Thickness Calculations
The bending moment at 10.825m outboard is:
BM=10,285,715
The dimensions of the wingbox were measured from the CATIA model. The
average height is 1.7088m and the length of the wingbox is 10.177m.
The ultimate load applied to the stringer panels is therefore:
136
Pult=BM ult
h=1.5∗10,285,715
1.7088=9.0286MN
From Howe’s book the value of σ b can be found using:
σ b=A∗Fb∗√ Pult
W∗L=150∗1.02∗√ 9.0286
10.177∗0.566=191.44MPa
Where A is a material constant and recommended to be taken as 150 for quasi-
isotropic layups as was assumed for the purposes of initial sizing, Fb is a factor
to account for the efficiency of the stringer type chosen, W is the wingbox width
and L is the rib pitch.
Based on this value of σ b, the value of the equivalent thickness could be found:
t e=BMult
W∗h∗σ b
=4.6342mm
This provided an initial estimate for the required skin thickness which could then
be improved on in the detail design process.
B.3
137

Appendix C Rib Analysis using Strand7
In order to size the ribs of the mid-wing section it was necessary to calculate the
shear force and bending moment applied to the rib over its length. Methods of
doing this were presented in the Detail Stressing lecture series however these
methods were generally intended for use on more conventional aircraft using a
two spar or three spar wing. The analysis becomes very complicated when
applied to a 5 spar configuration such as is used in the mid-wing section of the
FW-12. Therefore in order to determine the required data the Strand7 finite
element software package was used. This appendix describes the work done in
order to achieve this for the light rib which was designed. The same process
was used in the design of the heavy rib only with different loads applied.
The length of the rib was measured from the CATIA model to be
14.148m.
Two nodes were created, one at 0m and the other at 14.148.
These nodes were then connected using a beam element.
The elements were assigned an aluminium alloy material closely
resembling Al 2099 T83 as this specific material was not available.
The height of the beam was set to the average value of the light rib’s
height which was found to be 2.0992m and the elements were assigned
a thickness of 3mm. The width of the flanges had already been decided
on as being 4 times the diameter of the bolts used in the connection. The
geometry entered into the software is shown below:
138
Figure 41 Geometry of Light Rib Model in Strand 7
The airload distribution which had been previously calculated was then
applied to the model
After the distribution had been applied the model was divided into 100
equally sized beams, each beam element contained two nodes.
The chordwise locations of each of the spars were measured from the
CATIA model and the nodes created in the previous step which
corresponded to a spar location were identified.
These nodes were then fixed in place to model the beam being simply
supported at each of the five spars. The final set up of the model is
shown below:
Figure 42 Loads and Boundary Conditions on Strand7 Model
139
The simulation was then run and the shear force and bending moment
diagrams were produced from the results, using these dimensions of the
ribs could be designed. The resulting diagrams are shown below:
0 2 4 6 8 10 12 14 160.00E+00
2.00E+00
4.00E+00
6.00E+00
8.00E+00
1.00E+01
1.20E+01
Light Rib Shear Force Distribution
Chordwise Location (m)
Shea
r For
ce (N
)
Figure 43 Shear Force Distribution
0 2 4 6 8 10 12 14 16
-6.00E+03
-4.00E+03
-2.00E+03
0.00E+00
2.00E+03
4.00E+03
6.00E+03
8.00E+03
1.00E+04
1.20E+04
Light Rib Bending Moment Distribution
Chordwise Location (m)
Bend
ing
Mom
ent (
Nm
)
Figure 44 Bending Moment Distribution
140
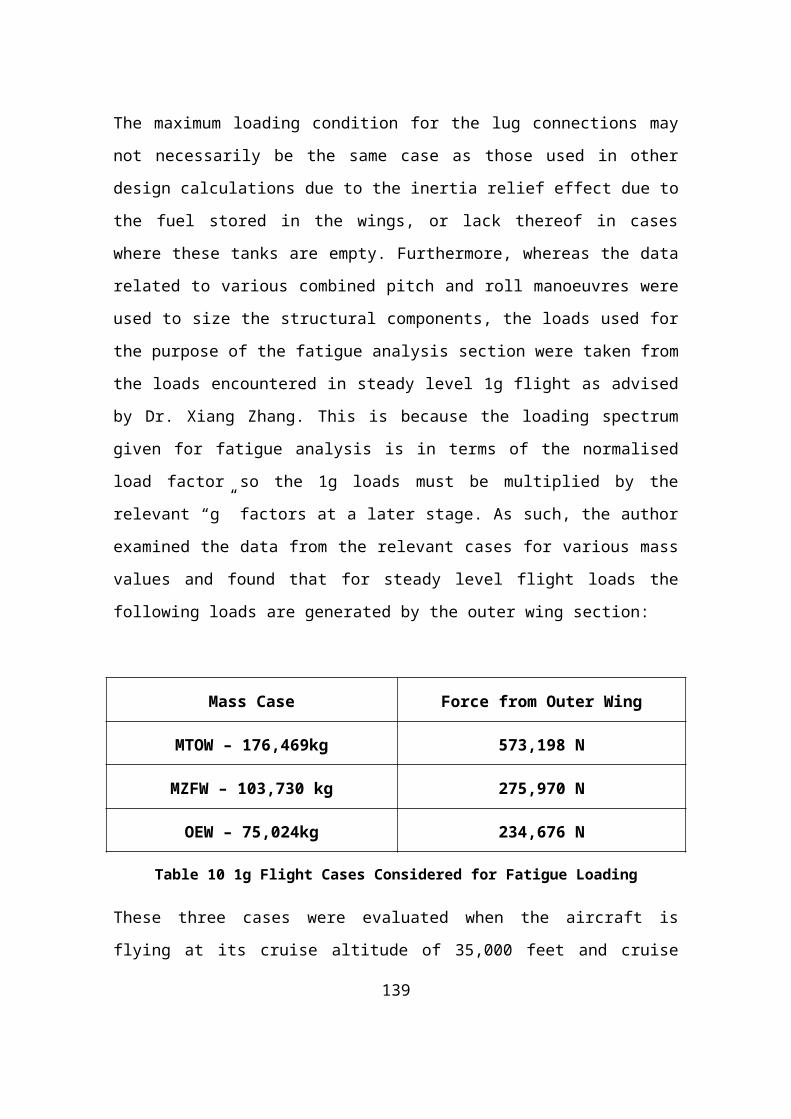
Appendix D CoALA ResultsThe analysis of the layup required for the components made from CFRP
composite materials was done using the in house software programme College
of Aeronautics Laminate Analysis or “COALA”. Below is a sample of the input
and output files of the programme, in this case the analysis is for the layup used
in the skin of the upper panel which corresponds to layup S27 from ESDU
82013:
141
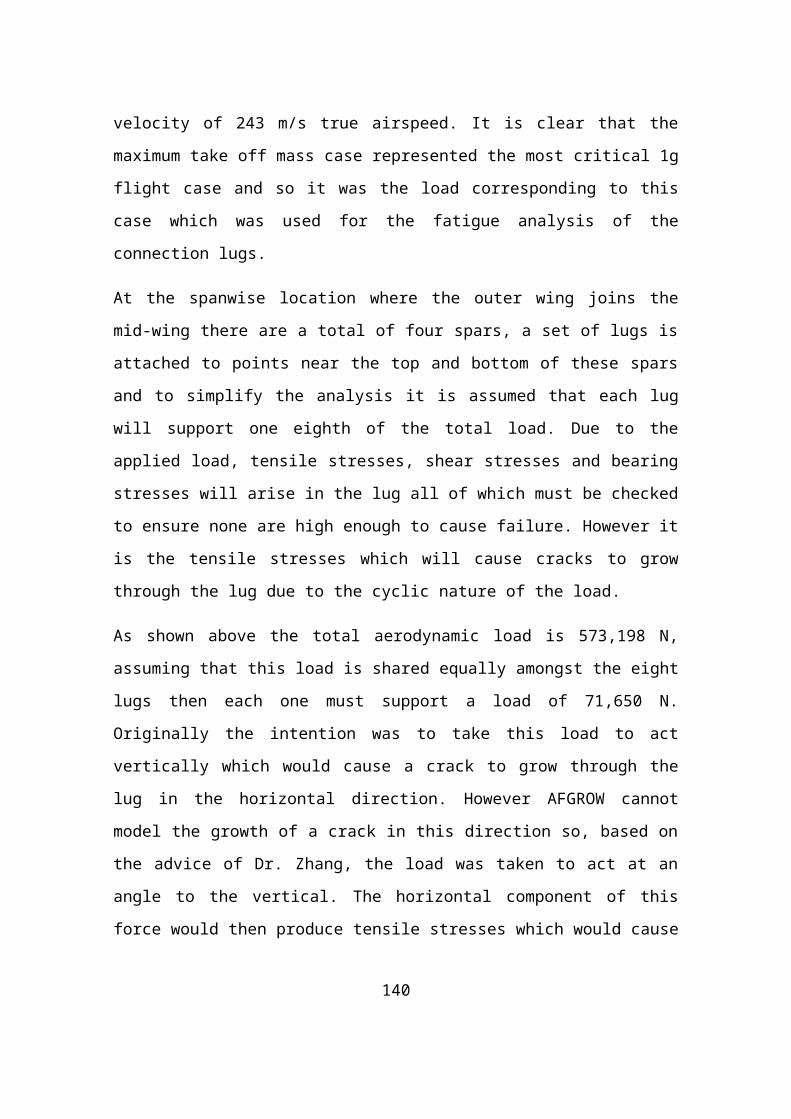
The output from the programme based on this data gave the required properties
of the laminate.
As a specially orthotropic layup was chosen for all composite components, the
A13 , A23D13 and D23 entries of the “A” and “D” matrices for the layup were equal
to zero. However the programme computed a non-zero value for these entries
but, when compared with the other entries of the matrices, it can be seen that
these values are negligible and can be taken as zero.
142
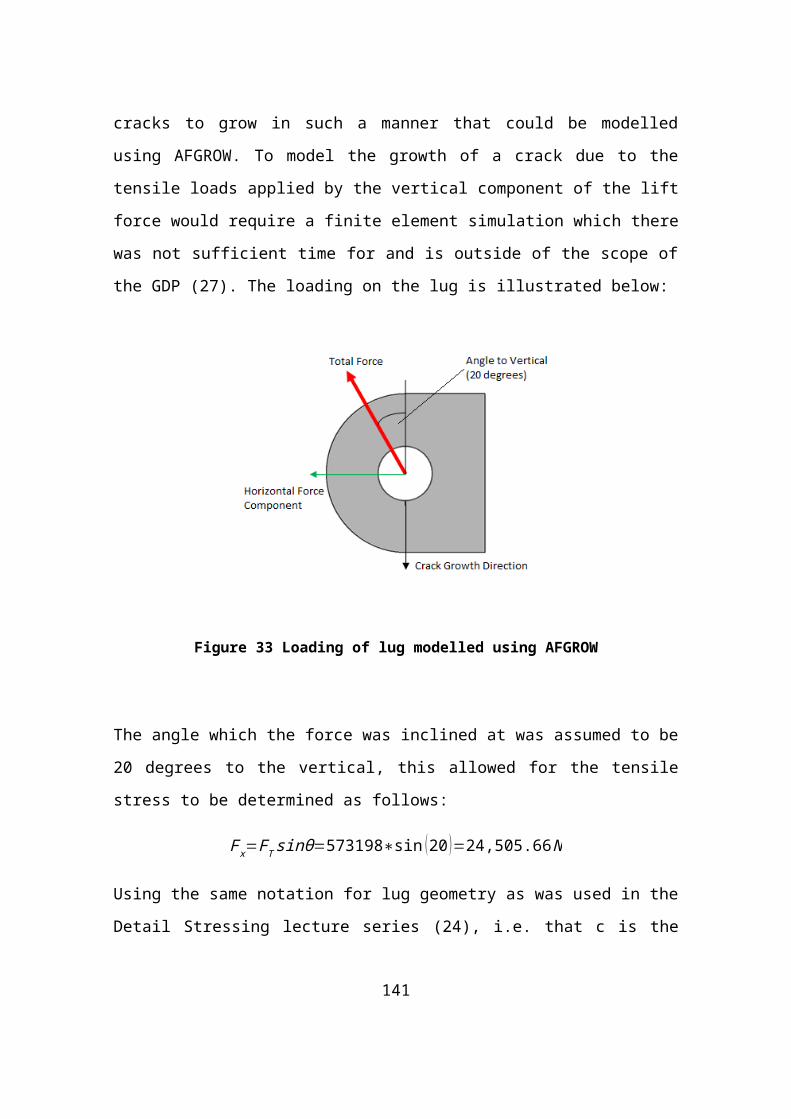
The stresses and strains experience by the individual plies was also computed
as well as the corresponding failure indices for each ply.
Finally the programme computed the membrane and bending equivalent
engineering elastic constants for the layup:
143
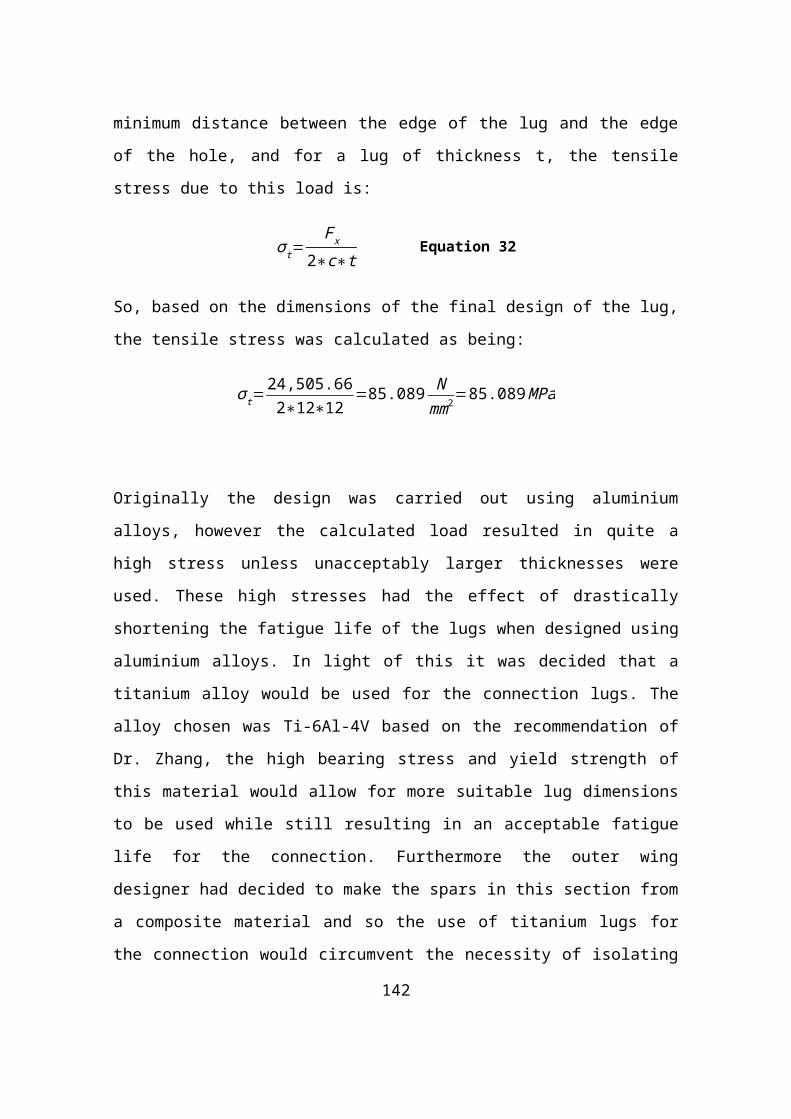
The programme could also be used to calculate the effect that temperature
changes would have on the composite components, however due to time
constraints the analysis was carried out under the assumption of constant
temperature.
144
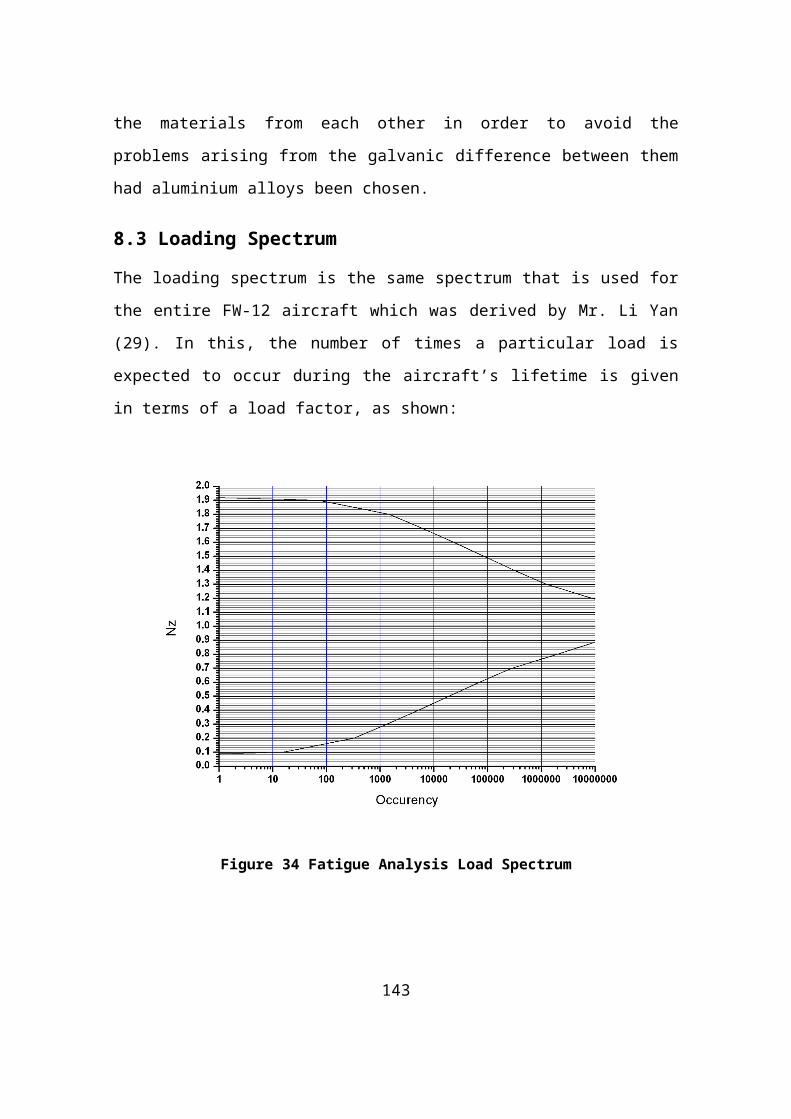
Appendix E Detail Stressing
The following appendix shows the calculations performed to determine the
exact dimensions of the various structural components designed during the
course of the project. The components presented include the upper skin/stringer
panels, the lower skin/stringer panels, the third spar, the light rib, the bulkhead
connection flanges and the outboard wing connection lug. The calculations
regarding the heavy rib’s connection to the main landing gear is also discussed.
For the design against shear buckling of the first and second spar the same
method was used as for the third spar and the process of designing the light rib
was also repeated for many aspects of the heavy rib. As such the calculations
are not shown for these components to avoid repetition.
Furthermore only the detail stressing for one sub-section of each component is
shown in detail. For example the skin/stringer panels are comprised of many
separate panels supported between the ribs and frames but only the
calculations related to one of these panels is shown. Unless otherwise stated
the section used in calculations was the most critically loaded one.
145
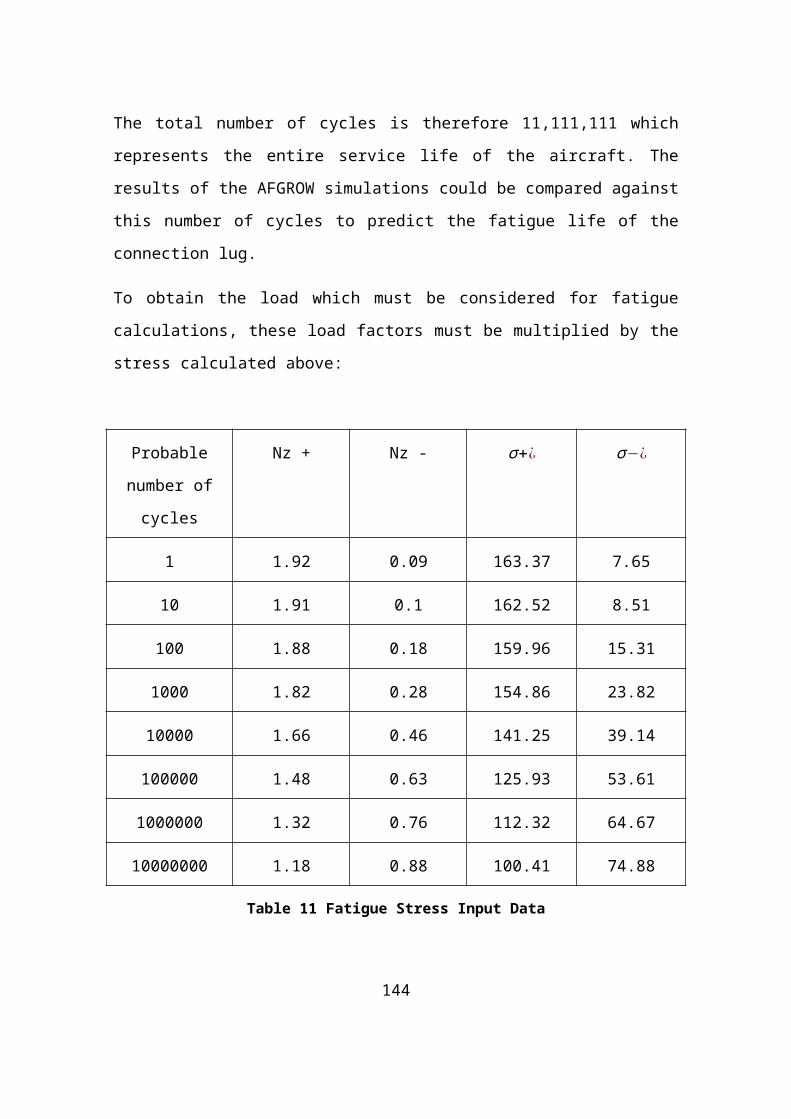
Material: M91 Resin with IM7 FibreDate: 21-08-2012
Component: Mid-wing Forward Section
Sub-Component: Upper Skin/Stringer Panel
Global Buckling Analysis
Spanwise Location 10.63333m to 11.2mBending Moment (-) 10,285,712NmPanel Length 566.66mmAverage Wingbox Height
1.7088m
Stringer Pitch 150mmWingbox Length 10.177mSkin Thickness 3.6mm
The global buckling stress for the whole panel was calculated using the
in-house software TW-Panels:
σ global=297.3MPaFrom the loading analysis the bending moment at the spanwise location of the panel is 10,285,712Nm, therefore the ultimate bending moment is:
BMult=BM∗1.5=15,428,568Nm
P=BMult
h=15428568
1.7088=9.0286MN
The cross sectional area of a single panel was also computed by TW panels:
A stringer=270mm2
A skin=540.1mm2
Stringer Pitch=150mm
RF
146
Therefore the number of total panel “sections” as computed by the software is:
Wingbox LengthStringer Pitch
=10.1770.15
=67.8331=68 sections
Therefore the total cross sectional area of the panel can be computed:
Atotal=68∗( A strigner+A skin)+A stringer=55360.25mm2
So the applied stress for the panel can be found:
σ app=P
A total
=9.0286×10⁶N
55360.25mm2 =163.088N
mm2=163.088MPa
So the reserve factor against failure due to global buckling of the panel is:
RF= 297.3163.088
=1.8229
Local Buckling Analysis
The skin must also be designed to withstand local buckling. The local
buckling stress was calculated using TW panels:
σ local=171.15MPa
So the reserve factor against this failure mode is:
RF= 171.15163.088
=1.0494
1.82
1.05
147
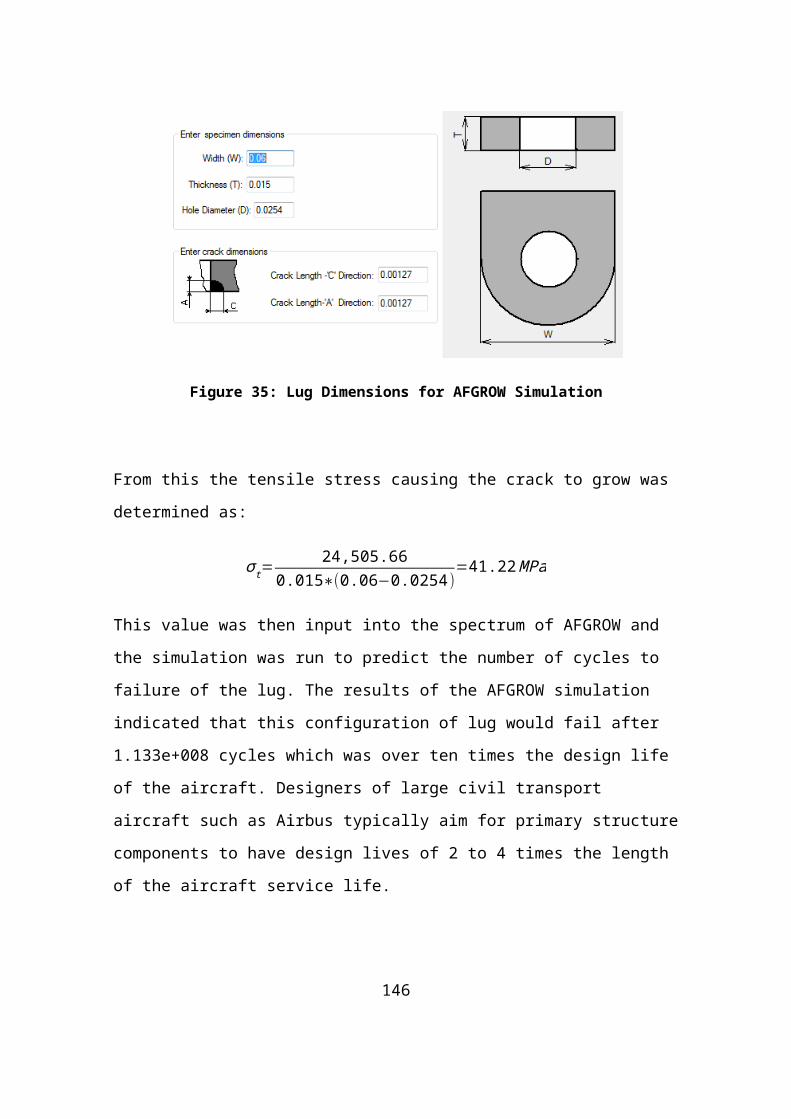
Buckling Load
TW panels also computes the load which would be required to cause a
panel consisting of one stringer and a section of skin as wide as the
stringer pitch to buckle and so the reserve factor for the overall buckling
of the panel can also be calculated based on the force applied. For the
upper panels this load was found to be:
Pbuckle=138656.02N
As the panel consists of 68 of these sections the total load that can be
support by the entire panel is:
Ptotal=68∗Pbuckle=9,428,608N
Therefore the reserve factor in terms of the buckling load is:
RF=98246089028600
=1.0882
Pressurisation Loads
As well as supporting the wing bending loads the skin stringer panels
also had to be capable of supporting the loads resulting from the
pressure difference between the cargo bay and the external conditions.
The cabin altitude is set to 6,000 ft which corresponds to a pressure of
81,199 Pa and the ceiling altitude for the FW-12 is 42,000 ft where the
atmospheric pressure is 17,035 Pa. The pressure differential is
1.09
148
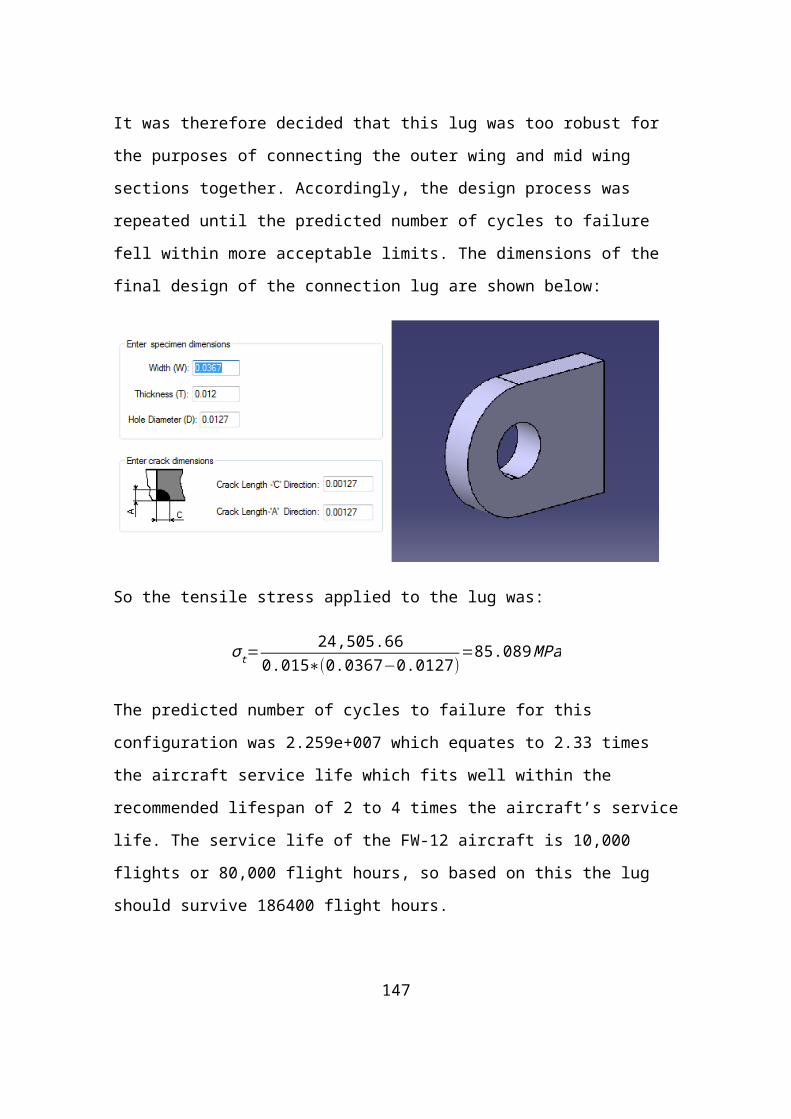
therefore:
∆ P=81,1990−17035=64,164 Pa
To ensure compliance with CS 25 the structure is designed to be able to
withstand twice this pressure, i.e. 128328 Pa.
To determine the stress and deformations arising in the skin due to the
pressure loads the panels are considered to deform like rectangular
plates simply supported by the stringers and the light frame and rib to
which they are connected. Based on the rib pitch and the stringer pitch
the values of a and b are 566mm and 150mm respectively, therefore:
ab=3.777
ESDU 71013 was used to calculate the stresses and deformation of the
panels. The parameter used to find the values is:
bt (r PE )
1/4
=1503.6 ( 1∗12832865∗(109) )
1/4
=1.56
Assuming that the panels’ edges being free in translation and fixed in
rotation Figure 2 of ESDU 71013 was used to determine the maximum
deflection of the panels:
149
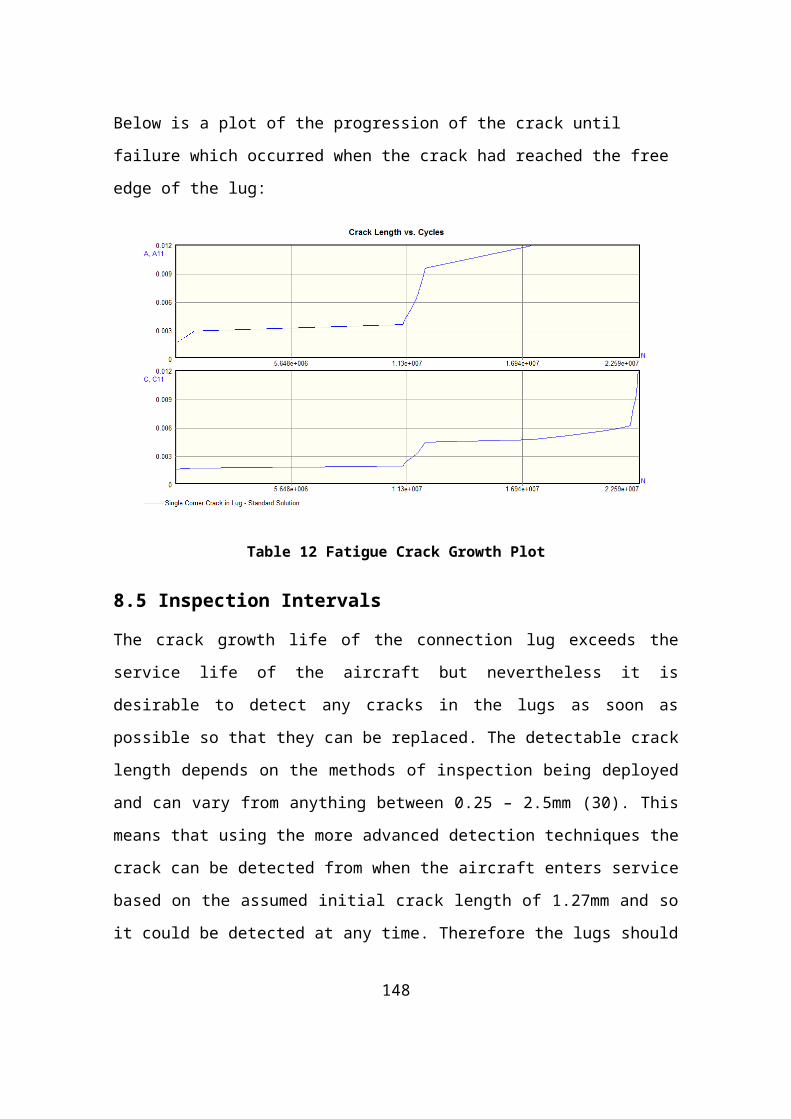
δt=0.175therefore δ=0.175∗3.6=0.63mm
ESDU 71013 allowed for the calculation of the maximum stress at the
centre of the plate f C, the stress at the middle surface of the plate
corresponding to f C which was denoted with a lower case c: f c and the
total stress at the mid-point of the long-edge f E. It should be noted that
the stress at the middle surface corresponding to f E , f ewas stated to be
equal to zero for plates whose edges are free in translation but fixed in
rotation. The orientation of each of the stresses calculated is illustrated
below:
150
Using Figures 7 and 8 of ESDU 71013 the stresses in the panels could
be found:
151
The term relating to f C was found to be 0.25, therefore
f C=0.25∗( 1503.6 )2
∗128328=55.697MPa
Similarly, for f c:
f c=0.03∗( 1503.6 )2
∗128328=6.68375MPa
And finally, for f E:
f E=0.5∗( 1503.6 )2
∗128328=111.396MPa
Therefore the largest stress arising in the panels is f E. Comparing this
stress value to the maximum allowable stresses for the layup used in the
composite skin, which were calculated using CoALA and based on the
Tsai-Wu failure theory, allowed for the reserve factor to be found:
>2
152
RF=701.631111.396
=6.299
153
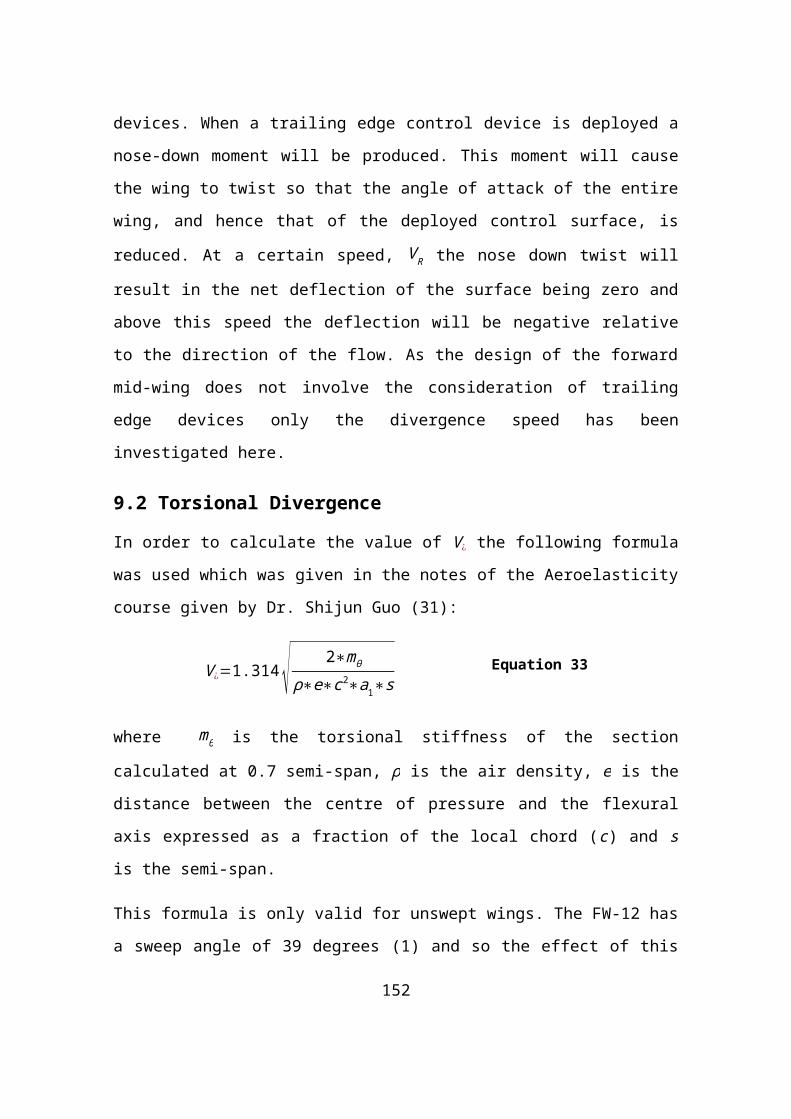
Material: M91 Resin with IM7 FibreDate: 21-08-2012
Component: Mid-wing Forward Section
Sub-Component: Lower Skin/Stringer Panel
For the lower skin/stringer panels the critical design case is again the prevention
of buckling in the panels but this will occur when the lower panel is loaded in
compression. The data used to load the panels is from a rolling case combined
with a -1g pitch manoeuvre.
Spanwise Location 10.63333m to 11.2mBending Moment 5,015,535NmPanel Length 566.66mmAverage Wingbox Height
1.7088m
Stringer Pitch 150mmWingbox Length 10.177mSkin Thickness 2.8mm
Global Buckling Analysis
Again the buckling stresses were determined using TW panels. For the lower
panel the value of the global buckling stress was:
σ global=228.6MPa
BMult=BM∗1.5=5,015,535Nm
P=BMult
h=50155351.7088
=4.4026MN
RF
154
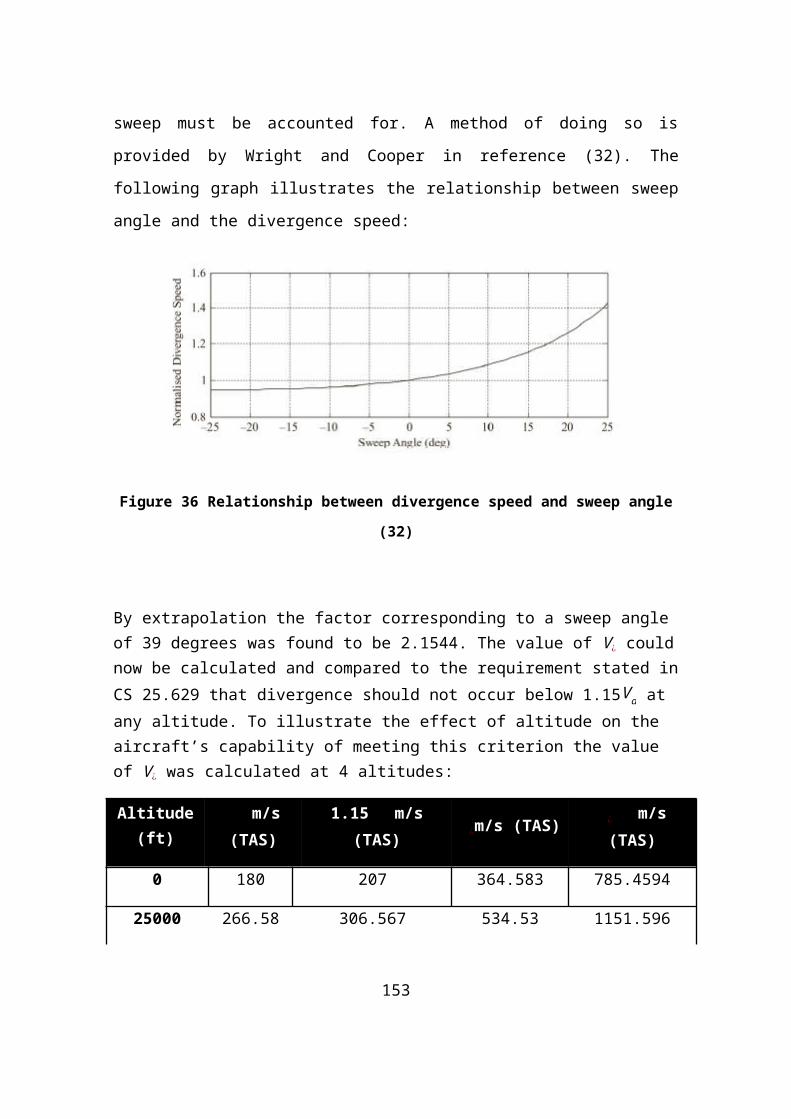
As before, the cross sectional area of a single section of one of the lower panels
was computed by TW Panels:
A stringer=211.13mm2
A skin=422.26mm2
Stringer Pitch=150mm
So, as before:
Wingbox LengthStringer Pitch
=10.1770.15
=67.8331=68 sections
Therefore the total cross sectional area of the panel can be computed:
Atotal=68∗( A strigner+A skin)+A stringer=43281.65mm2
So the applied stress for the panel can be found:
σ app=P
A total
=4.4026×10⁶N
43281.65mm2 =101.7188N
mm2=101.7188MPa
So the reserve factor against failure due to global buckling of the panel is:
RF= 228.6101.7188
=2.2474
Local Buckling Analysis
The local buckling stress was calculated using TW panels:
σ local=109.40MPa
So the reserve factor against this failure mode is therefore:
RF= 109.40101.7188
=1.0755
2.25
1.08
155
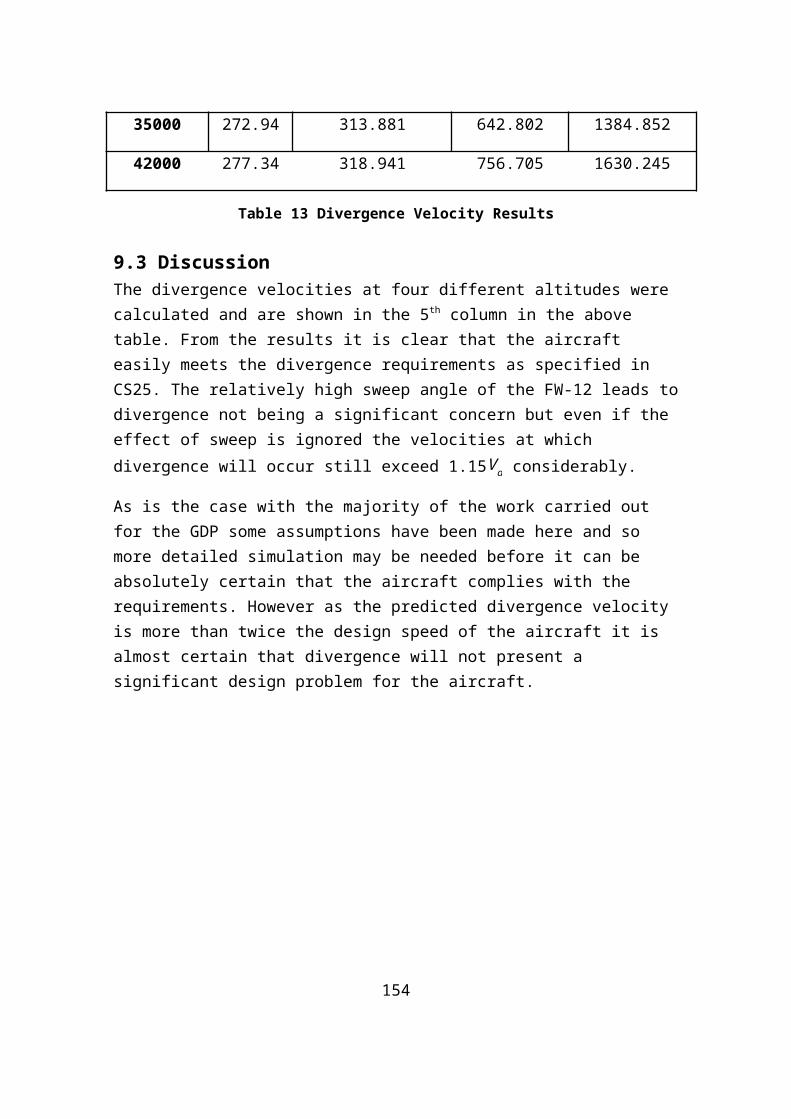
Buckling Load
For the lower panels the buckling load was found to be:
Pbuckle=69292.29N
As the panel consists of 68 of these sections the total load that can be support
by the entire panel is:
Ptotal=68∗Pbuckle=4,642,583N
Therefore the reserve factor in terms of the buckling load is:
RF=46425834402600
=1.0545
Pressurisation Loads
The pressure loads for the lower skin panels were analysed in the same manner
as shown previously for the upper panels. All parameters used were the same
except for the skin thickness which was 2.8mm instead of 3.6mm as was the
case for the upper skin.
The values the term required for calculating based on Figures 2, 7 and 8 was
therefore:
bt (r PE )
1/4
=1502.8
∗( 1∗12832865×109 )14=2.01
The corresponding value for the deflection term was found from Figure 2 to be:
δt=0.43therefore δ=0.43∗2.8=1.204mm
1.05
156

The values of the stresses were found to be:
f c=11.05MPa
f C=92.07MPa
f E=184.144MPa
So, once again f Eis the predominant stress value. Comparing this value to the
max allowable stress from CoALA for the lower skin’s layup allows for the
reserve factor to be determined:
RF=1148.83184.144
=6.239
From the design calculations performed and presented here it is clear that the
skin thicknesses required to support the wing bending loads mean that the
panels are more than capable of supporting the loads due to pressurisation. As
discussed in the detail design section the dimensions shown in calculations here
are those calculated using the TW panels software as opposed to the
dimensions the panels would be once manufactured, the difference in
dimensions being due to the panels being constructed from plies of a thickness
of 0.184mm. In reality the panels would be thicker so the figures calculated here
are actually lower limits for reserve factor and the actual panels would be even
more capable of supporting the applied loads.
6.24
157
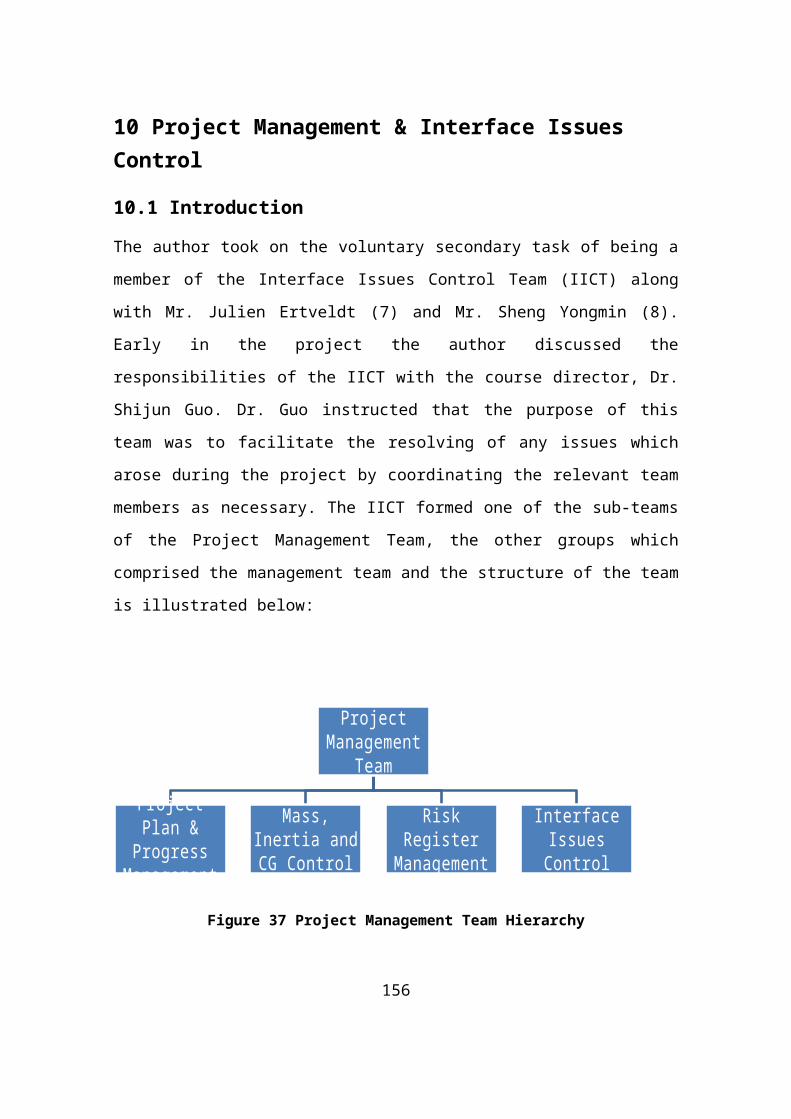
Material: 2099 T-83Date: 21-08-2012
Component: Mid-wing Forward Section
Sub-Component: MLG Bay Spar
The spar that divided the cargo bay from the main landing gear bay had
to withstand the loads due to the pressure differential across the spar
and also the shear loads resulting from the inertial and aerodynamic
loads applied to the aircraft.
Pressurisation Requirement
Spanwise Location 6.5m to 6.9mPressure Differential 64,164 PaHorizontal Stiffener Pitch
300mm
Max Vertical Stiffener Pitch (rib/frame pitch)
412.5mm
Thickness 3.25mmPoisso n' s Ratio 0.34Young’s Modulus 78 GPa
According to CS-25 requirements the spar acting as a pressure
bulkhead needed to be able to withstand twice the expected operating
pressure differential.
∆ P=2∗64164=128328 Pa
ESDU data sheet 71013 was used to determine the stresses and
deflections which would be experienced by the spar. To use this data
RF
158
sheet the spar is assumed to be split into a number of panels bordered
by the horizontal stiffeners and the points were it is attached to the rib
and light frame flanges, the distances between these members give the
values of b and a respectively. In order to determine the minimum
thickness required of the bulkhead the panel with the largest area was
identified, so the ratio of a/b could be found:
ab=1.37666
The spar and panel in question can be seen below, the CATIA model of
the bulkhead has been made partially transparent so that the outline of
the stiffening members can be seen, in reality they are on opposite sides
of the spar:
Each panel is restrained by connection to a light frame and a rib on its
shorter sides and supported by a horizontal stiffener along the longer
edges. As the horizontal stiffeners will be able to deform under the
pressure loads but the edges which are connected to the flanges will be
unable to rotate the plate was considered to have its edges free in
159

translation but fixed in rotation. This meant that Figures 2, 7 and 8 of
ESDU 71013 could be used to design the panels.
ESDU 71013 Figure 2 plots the ratio of the maximum deflection of the
panels and their thickness against the parameter bt (r p
E )1/4
as shown
below:
To calculate this parameter, the value of r, which takes the Poisson’s
ratio of the material used into account, must be calculated:
160
r=1−ν2
0.91=1−0.34
2
0.91=0.97186
bt (r p
E )1/4
= 0.30.00325
∗( 0.97186∗6416478000000000 )14=3.28243
From this, the deflection could be calculated by interpolation between
the results for the curves where a/b equal 1.25 and 1.5:
δt=1.8 , δ=1.802∗3.25=5.86mm
Next the stresses acting on the panel could be found, the highest stress
in the panel could then be compared to the failure mode stresses to
determine the reserve factor.
To evaluate the stress in the plate the following two graphs, Figures 7
and 8 respectively, were used:
161
As shown above:
bt (r p
E )14=3.28
Interpolating between the corresponding values for a/b =1.25 and a/b =
1.5:
f E2
p ( tb )2
=0.34234
So:
f E2=0.34234∗128328∗( 0.30.00325 )
2
=372.06MPa
From the second graph shown above it was found that:
f C 2p ( tb )
2
=0.1456
Therefore:
162
f C 2=0.1456∗128328∗( 0.30.00325 )
2
=159.23MPa
Finally the value for f c was determined:
f c 2p ( tb )
2
=0.018
f c2=0.018∗128328∗( 0.30.004 )2
=19.68MPa
It is clear from the values calculated that f E2is the dominant stress which
arises in the plates of the bulkhead, this proved to always be the case
regardless of how the geometry was varied by altering the thickness or
the pitch of the stiffeners. As such it was this stress value which was
used as a design criteria, first the stress must be below the yield
strength of the material:
σ y=524MPa
So the reserve factor against yield of the material is:
RF= 524283.213
=1.85019
Shear Loading
As well as acting as a pressure bulkhead the third spar still had to fulfil
its role as a spar and support the shear loads applied. It was taken that
the shear load is supported by the web of the spar, the main design
criterion was to determine the thickness of the web at which the spar will
163
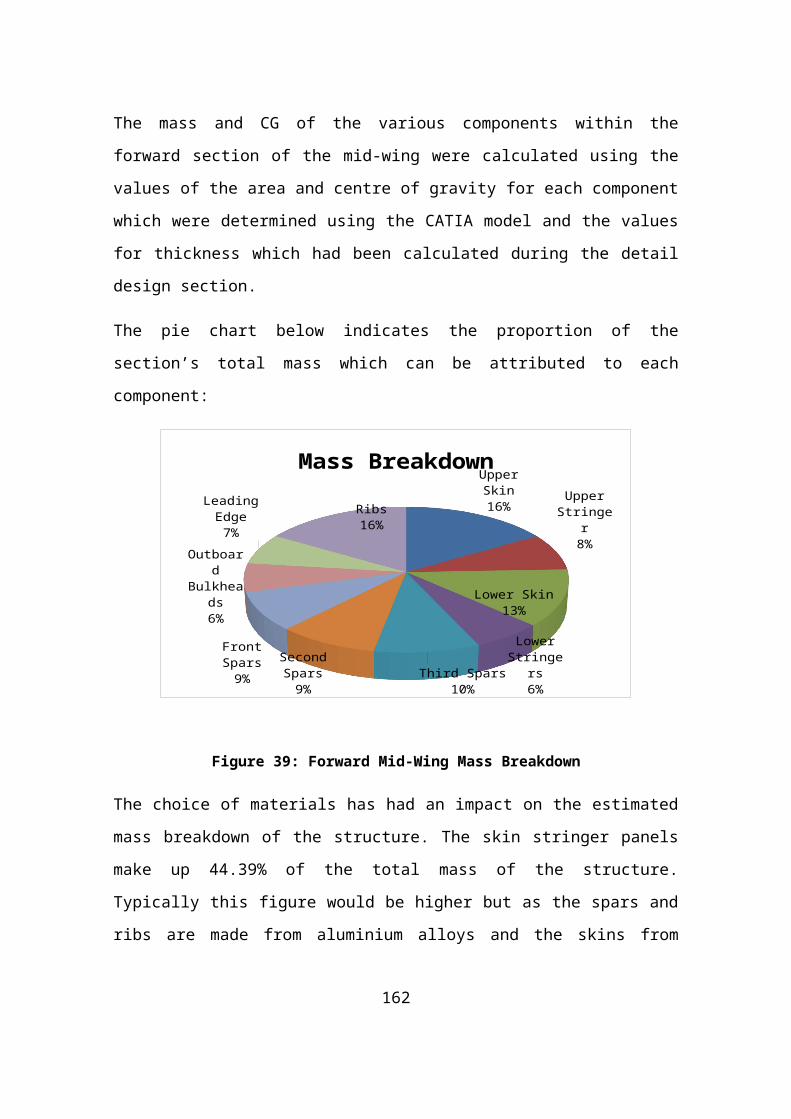
support the load without buckling in shear. To determine this thickness
the spar was considered to be divided into multiple panels by the vertical
and horizontal stiffening members and ESDU data sheet 71005 was
then used to determine the required thickness.
The most critical panel for the shear loading differed to the most critical
panel for pressurisation which depended largely upon the area of the
panel whereas the ratio of the panel lengths to each other is more
critical for shear buckling as well as the cross-sectional area of the spar.
For shear buckling, the most critical panel dimensions were found to be
a=360mm and b=300mm
So:
ba=0.8219
The panels were fastened to the ribs along their shorter sides and
stiffened by the horizontal stiffeners on the longer side, therefore the
value of the bucking coefficient K was calculated using the curve
corresponding to these conditions on the following graph, ESDU 71005
Figure 1:
1.85
164
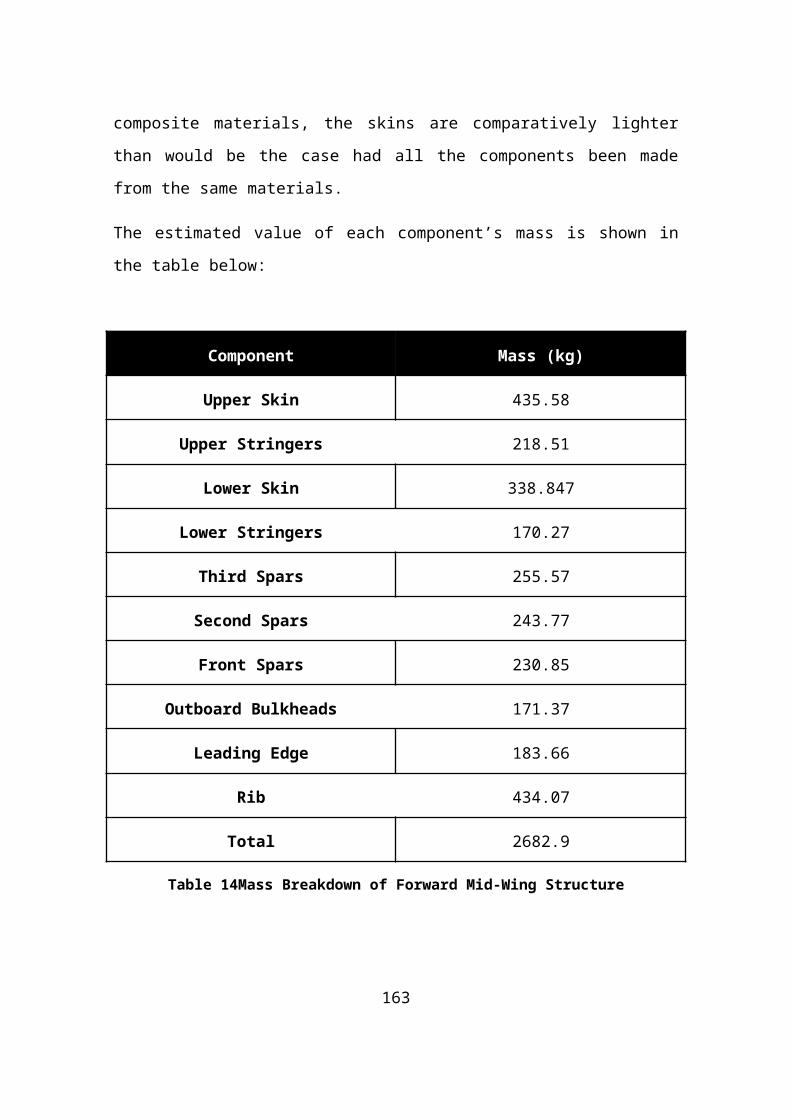
Resulting in:
K=8.6913
The stress at which the panels will buckle ignoring plasticity effects is:
qbe=K∗E∗( tb )2
So:
qbe1=8.6913∗(78×109 )∗( 3.25300 )2
=79.562MPa
This value for qbe1 is valid for a material whose Poisson’s ratio is 0.3, in
order to correct for this qbe must be multiplied by a factor which is a
165

function of ν:
qbe=qbe1∗0.91
1−ν2=79.562∗0.91
1−0.342
qbe=81.865MPa
For high values of qbe the stress taken to make a plate buckle in shear
may well have exceeded the yield strength of the material. The resulting
plastic deformation will alter the buckling behaviour of the plate and so
the plasticity reduction factor, η, is used to correct for this, determined
from graph 2 of ESDU 71005:
With:
qbe
f n=73.2393495.27
=0.16
166
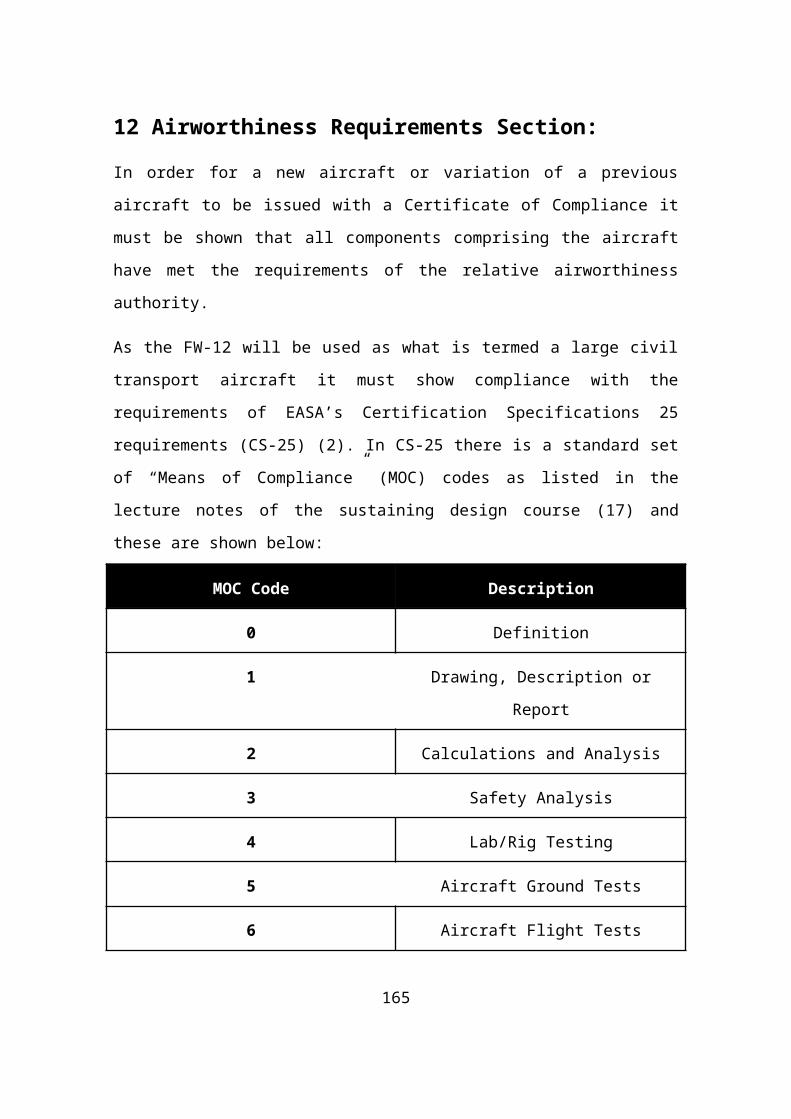
So for m=22, the plasticity reduction factor is equal to 1. This is because
the stress required to buckle the plate is not high enough to lead to
complications due to plastic deformation.
So the buckling shear stress is as calculated above:
qbe=qb=81.8645MPa
The applied shear stress needs to be calculated to determine the
reserve factor. The shear force at a spanwise location of 10.825m is:
SF=890,818N
SFultimate=1.5∗890,818=1,336,228N
There are five spars passing through the mid-wing section. From
Howe’s book the shear force applied to each spar at a given spanwise
location can be estimated by:
SFi=SF∗hi
2
∑1
n
h j2
So for the third spar:
SF= 1336228∗2.232
1.442+1.582+2.232+1.782+1.52=445,016.92N
The resulting shear stress can be found by dividing this value by the
cross sectional area of the spar at this point:
A=t∗h=0.00325∗2.23=0.0073m2
So the stress due to the shear load is:
σ=445,016.920.0073
=61.231MPa
167
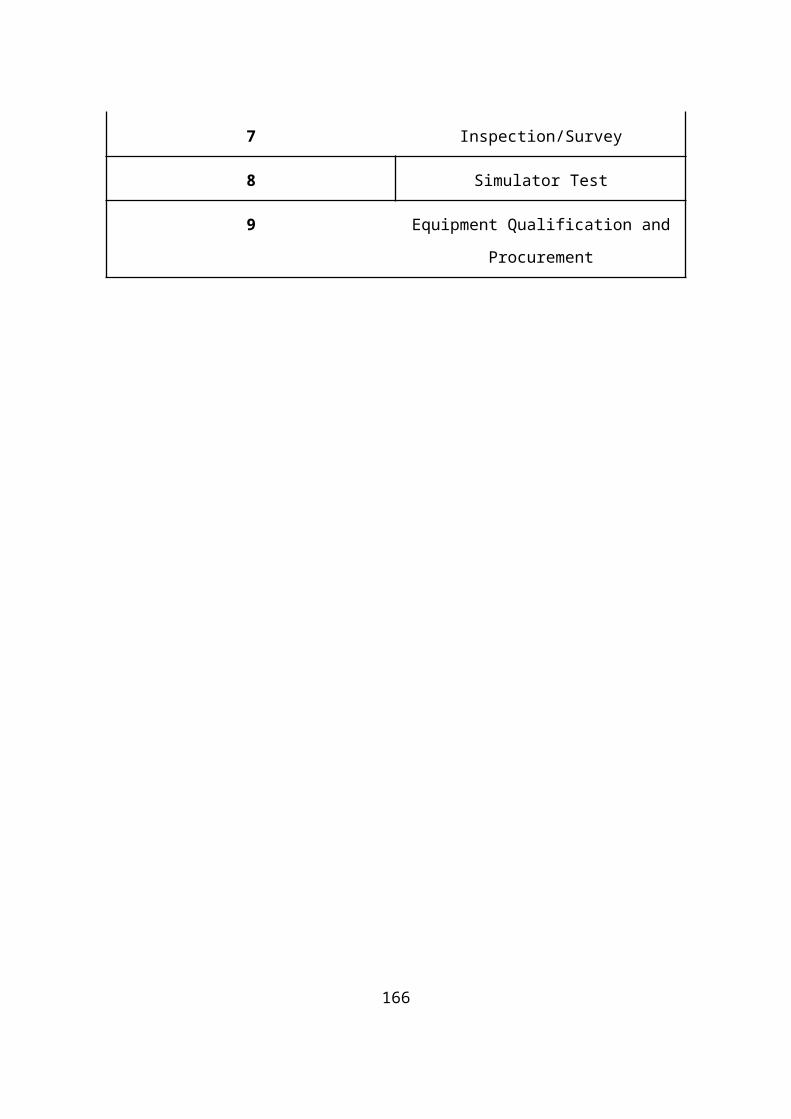
The torque applied to the wing box will also lead to shear stresses
developing in the spars:
T=1,395,885Nm
T ult=1.5∗1,395,885=2,093,828.52Nm
The shear stress due to this torque is then:
σ t=T2 At
Where A can be determined as follows:
A=10.177∗1.7088=17.3909m2
Therefore:
σ t=2093828.52
2∗17.3909∗0.00325=18.522MPa
So finally the total applied shear stress on the spar can be found:
σ applied=18.522+61.231=79.7547MPa
So the reserve factor against shear buckling is therefore:
RF=81.85679.755
=1.0265
The strength of the material was easily sufficient to withstand this
applied shear load, taking the UTS of the material in shear to be half of
the tensile value:
1.03
>2
168
τ s=σUTS
2=5582
=279MPa
RF= 27979.7547
=3.498
169
Material: 2099 T83 Aluminium AlloyDate: 21-08-2012
Component: Mid-wing Forward Section
Sub-Component: Aft Rib Flanges
Bulkhead Area 15.357m2
2∆ P 128328 PaSection Width 5.4m
The aft rib flanges were used as attachment points for the pressure bulkhead which comprised the aft wall of the cargo bay area. The connection was achieved by drilling holes through the flanges and bulkhead and securing them together using bolts. The calculations done in order to design these connections are shown below. The worst loading scenario for the connection is the same as the worst pressurisation case as specified in CS 25 where twice the normal operating pressure differential is in effect.
First the force which the bolts would have to withstand was found based on the areas over which the pressure differential between the cargo bay and the external conditions would act:
Fbulkhead=P∗Abulkhead
Fbulkhead=128328Pa∗15.357m2=1,970,733N
Next the force exerted on the aerodynamic shell surface by the pressure was calculated by estimating the shell to be a cylinder of an equivalent diameter such that the areas of the cylinder and the actual shell were equal:
A shell=96.464=πdL2
, d=11.372m
Knowing the width of the section to be 5.4m:
F shell=5.4∗11.37∗128328=7,880,736N
F total=F shell+Fbulkhead=9,851,469N
In light of recommendations given in the Sustaining Design course the
bolts chosen were 1/4 “ UNF bolts which have a diameter of 6.35mm.
The maximum strength of these bolts S0 was found in the Detailed
R F
170

Stressing Data Sheet to be 18900 N. However the strength of the bolt is
effected by its bearing on the sheets it attaches:
Dt
=6.353.25
=¿1.95385
From page S4B of the data sheet the reduction factor k for these
dimensions was found to be 0.985, therefore:
S=S0∗0.985=18616.5N
From this the number of bolts required to withstand the applied loads
can be easily calculated:
Number of Bolts=9,851,46918616,5
=529.1795=530bolts
This is the minimum number of bolts that would be required in order to
hold the bulkhead and ribs together. However if this number of bolts
were used and evenly spaced apart along the stiffeners they would be a
distance of 11.5 times their diameter apart. According to the Sustaining
Design lecture notes the distance between fasteners should be 8
fastener diameters or less in order to reduce the risk of inter rivet
buckling. This failure case was investigated to determine the minimum
number of bolts.
Inter Rivet Buckling:
The stress applied to the flanges is assumed to be due to the bending
moment caused by the pressure load applied to the entire bulkhead:
F total=9,851,469N
This load is shared equally by the 14 stiffeners used to support the
bulkhead, for simplicity they are assumed to have an equal height equal
to their average height of 2.843m. Considering the applied force to be
acting along a beam of this length allows the distributed load to be
171
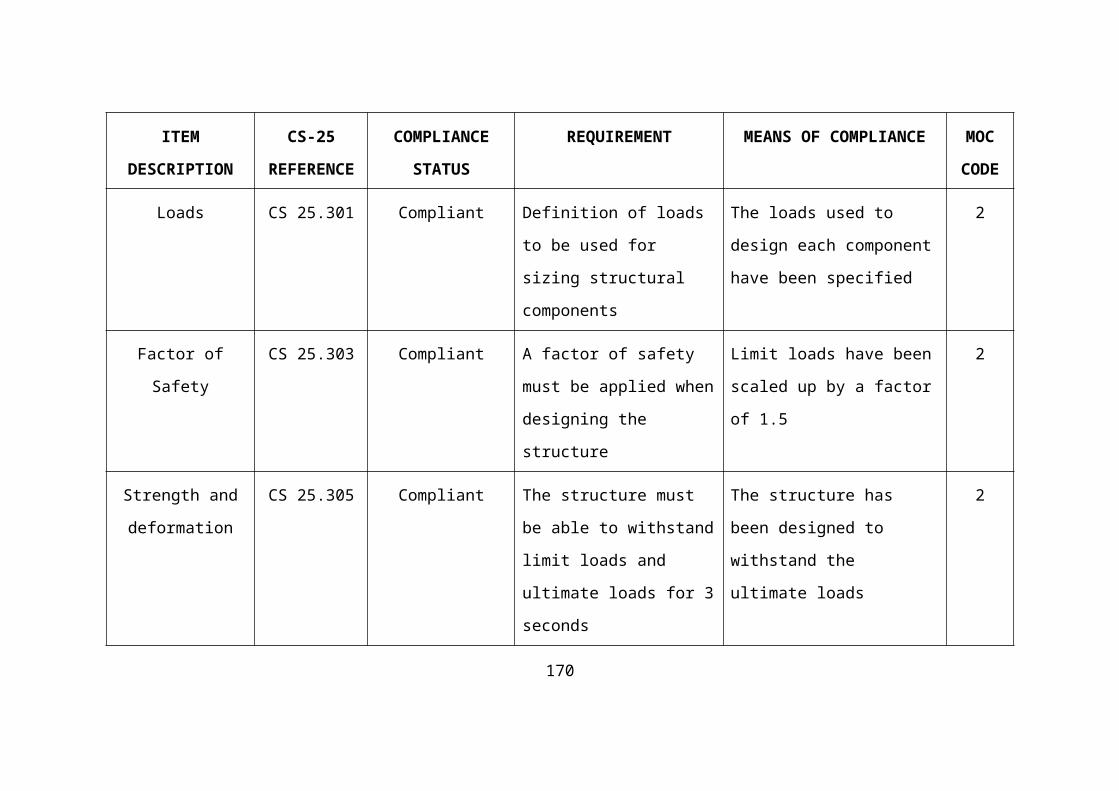
calculated:
q=9,851,46914∗2.843
=247,434.56N /m
q N /m
To be conservative, the beam is considered to be simply supported at
each bolt, the length of each individual beam is therefore the bolt pitch,p
, and the maximum bending moment due to the distributed load can be
found using the formula:
BMmax=q ( pD )2
8=247,434∗(8∗0.00635 )2
8=79.82Nm
The value of 8D for the bolt pitch was selected so that the minimum
number of bolts would be used which results in reductions in both the
maintenance of the structure and its weight. With this value fixed the
dimensions of the flanges were found such that the applied stress would
not lead to buckling:
σ applied=BMmax∗y
I xx
The width of the flanges was chosen as 4D = 25.4mm, again this was so
that the fasteners were 2D from the free edges of the flange as advised
by Mr. Phil Stocking and his lecture notes on the Sustaining Design
Course. The thickness of the flanges was determined to be 6.2mm and
the moment of inertia of the flanges is therefore:
I xx=b d3
12=25.4∗(6.23)
12∗(1012)=5.04461×10⁻¹⁰m4
172
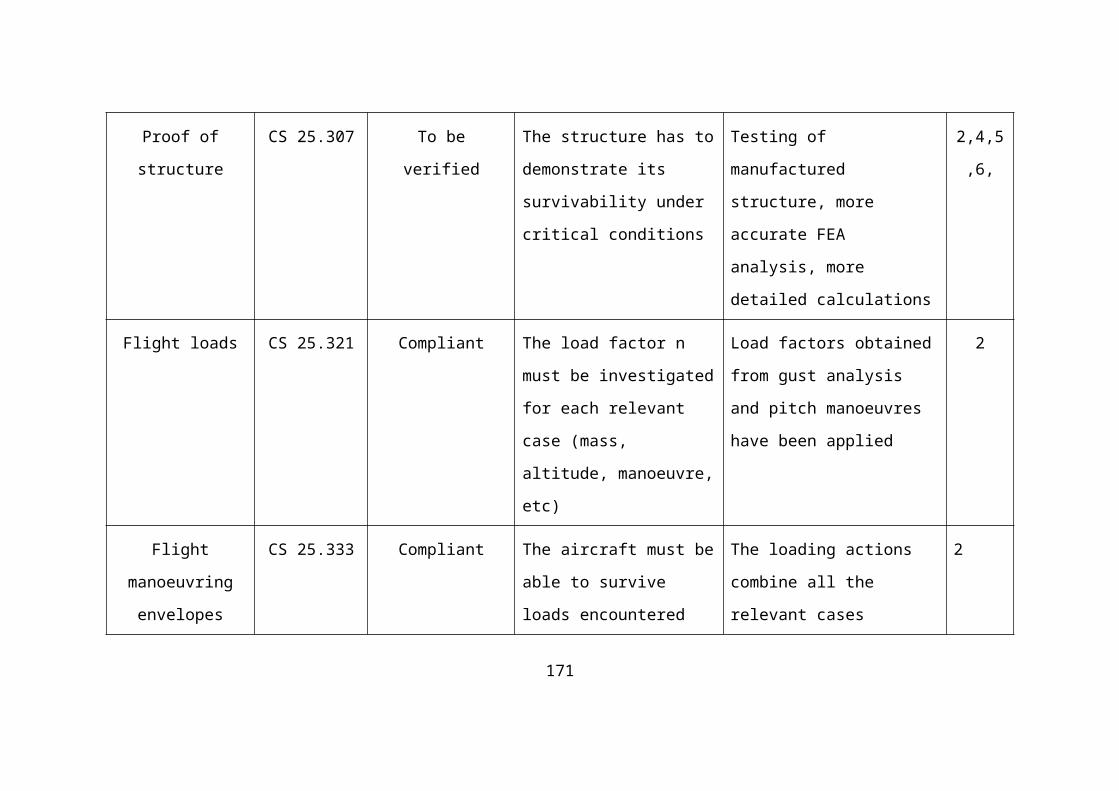
So the applied stress can be determined:
σ applied=
79.82∗0.00622
5.04461×10−10=490.49MPa
This can then be compared to the inter-fastener buckling stress:
σ b=K12
Et ( πtL )2
For K = 1.5, 1εn
=157.29, t = 6.2mm and L = 8D = 50.8mm:
σb
Et
=0.01837∴σb
E t
.1εn
=0.01837∗157.29=2.8905
Using this, the buckling stress can be calculated in terms of the f n value
of the material using ESDU 76016 Figure 2, note that different notation
is used in ESDU 76016 than that used here in calculations which is the
notation used in the Detail Stressing Lecture Notes.
173
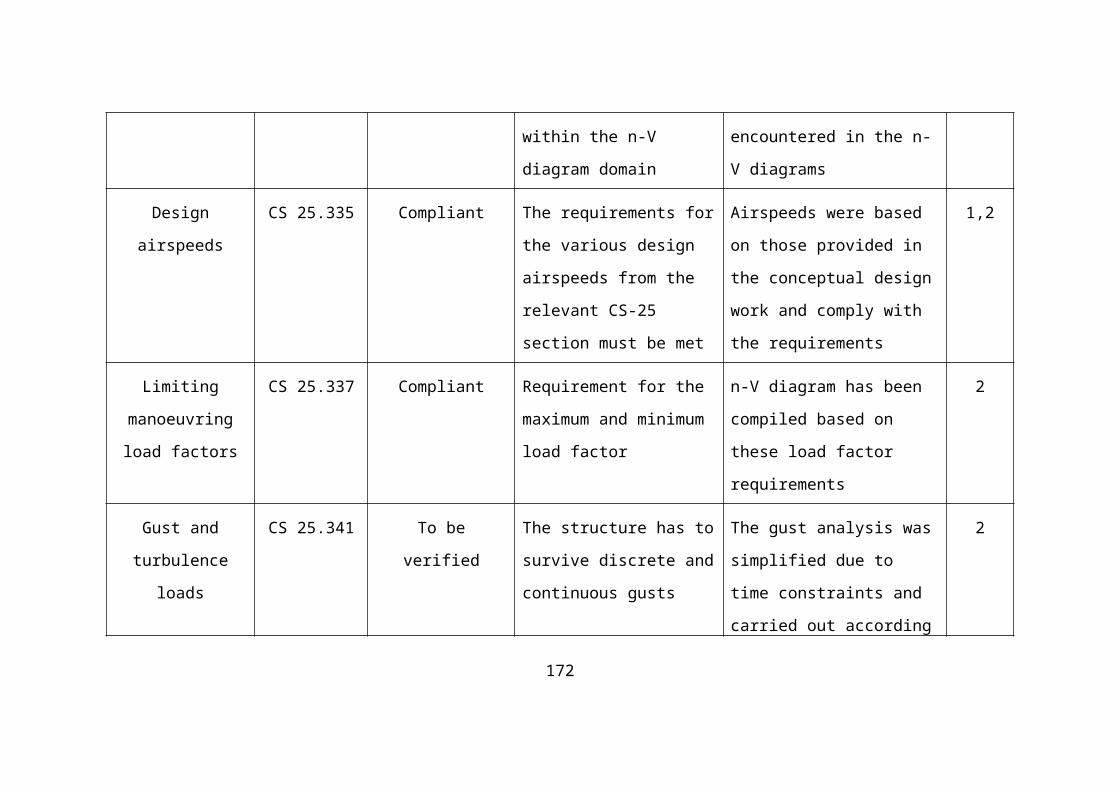
Therefore:
ff n
=1.025 , f =σ b=1.03∗495.27=510.1281MPa
The reserve factor against failure of the rib flanges due to buckling is
therefore:
RF=510.1281490.49
=1.04
The applied stress is quite high so is also compared to the yield strength
of the material:
RF=525480
=1.09375
Based on the selected bolt pitch of 8D the total number of bolts used is
762. As shown above, the tensile strength of each bolt was found to be
18616.5N, therefore the maximum load which the connection can
support is:
Fmax=18616.5∗762=14,185,773N
So knowing the total load applied to the connection, the reserve factor
against the bolts failing in tension is:
RF=14,185,7739,851,469
=1.4399
1.04
1.09
1.44
174
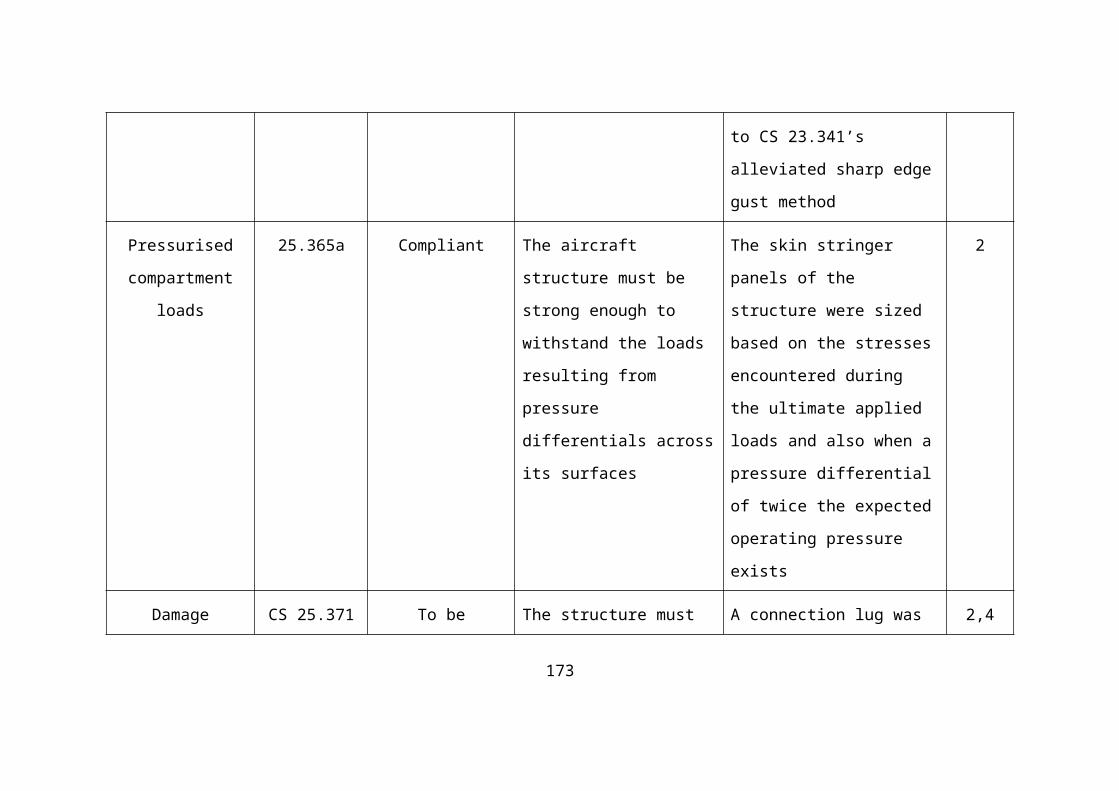
175
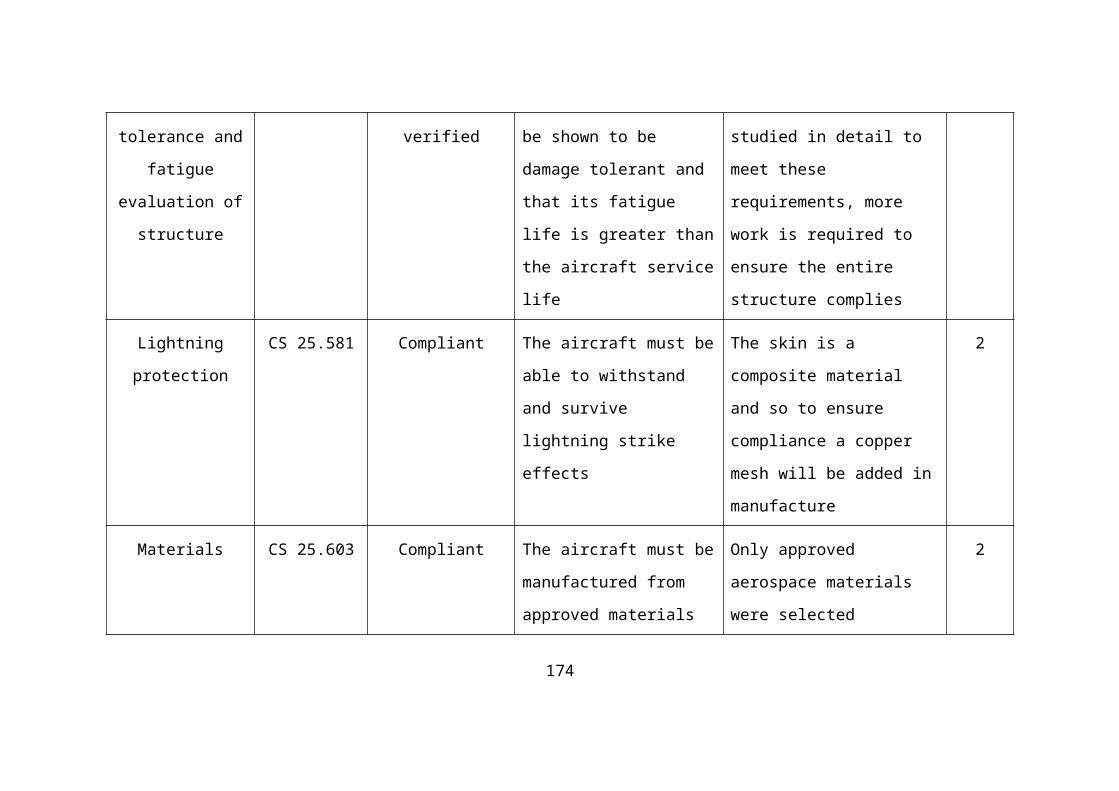
Material: 2099 T83 Aluminium AlloyDate: 21-08-2012
Component: Mid-wing Forward Section
Sub-Component: Light Rib 1, Section 2
Web thickness 2mmSpanwise Location 9.725mAverage Wingbox Height 1.7088mRib Pitch 825mmChord length 14.148mWingbox length 11.395m
The following calculations detail the work carried out in designing a light rib in the mid-wing section. The rib is cut into multiple sections between any two spars and the work shown here is for Section 2 of the rib is shown outlined in orange in the image below:
The net value of the inertia and air loads which must be transmitted by the rib can be found by determining the difference in the cumulative shear force at a distance of half the rib pitch to either side of the rib, i.e. at 9.325m and 10.125m from the centreline:
SF9.325m=916,806.92Nand SF10.125m=968,694.51N
Therefore:SFrib=968694.51−916806.92=51,887.59N
This force is then distributed along the length of the rib using a quadratic relationship as suggested by Howe, as discussed in the Detail Design chapter:
RF
176
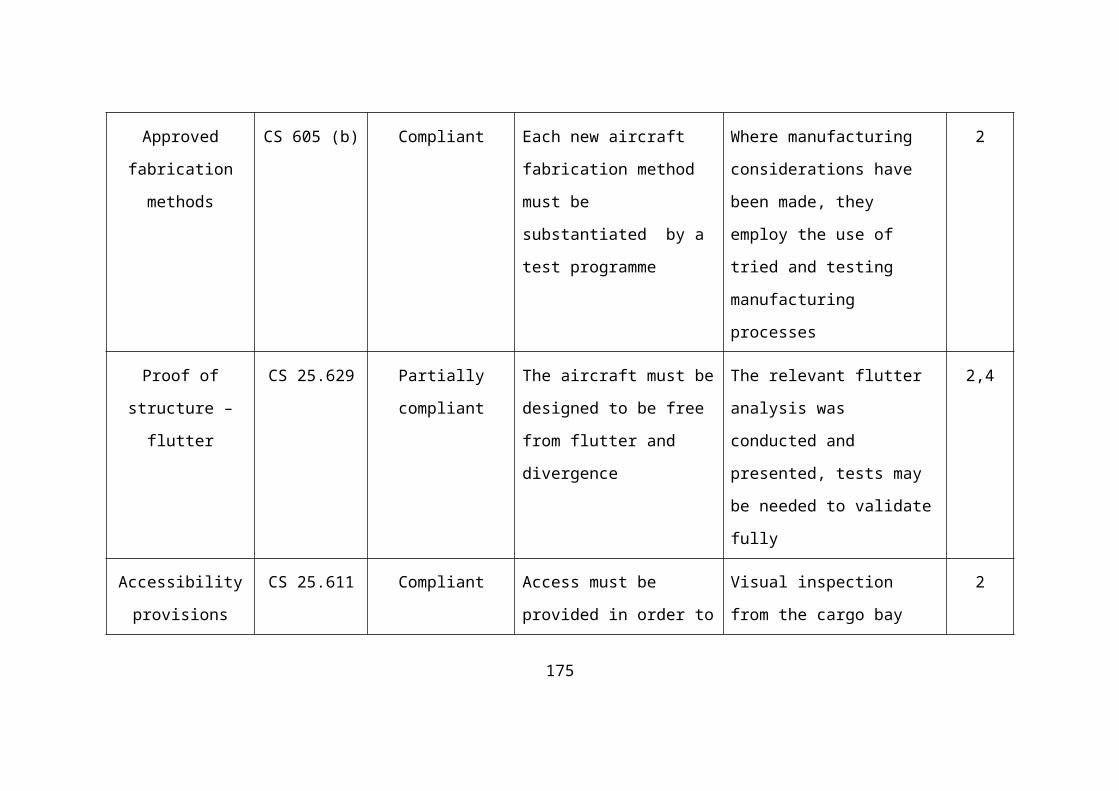
P=3 x2−6 x+3This is then scaled appropriately such that the integral of the load distribution along the length of the chord is equal to the magnitude of the total force which the rib must transmit:
The quadratic equation shown was then input into Strand7 as a distributed load along the rib. The rib was restrained at the point where it connects to each of the five spars and from this the shear force and bending moment applied along the rib was calculated:
Using this data the usual 1.5 ultimate factor was applied and the ultimate maximum value of shear force applied to the section of the rib at spars 2 and 3 was found. From this the shear force applied to the section could be calculated:
SF spar2=−22,100N∧SF spar3=14590NSFmax=55095N
This will tend to make the web of the rib buckle in shear so the rib must be adequately stiffened and must have sufficient thickness to stop this.
177
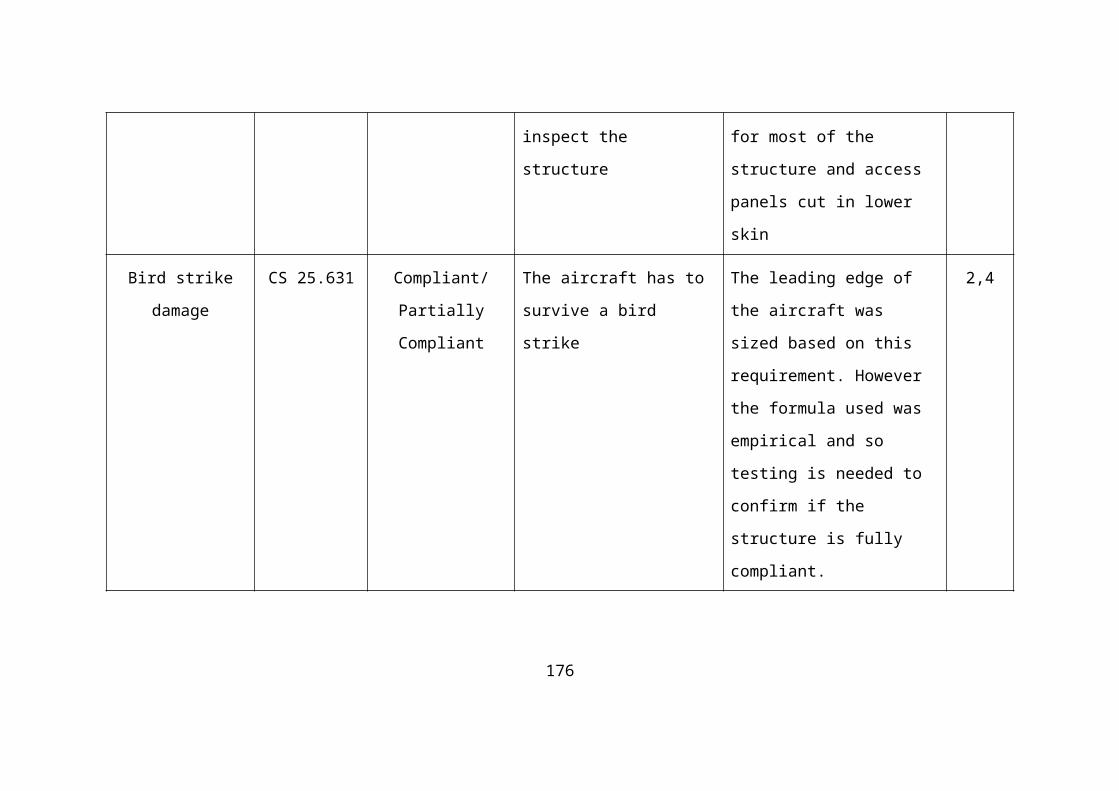
The web thickness is calculated in the same manner as already shown for the spar webs. However, first the Brazier Loads must be accounted for as this will determine the number of stiffeners required to support the rib which will in turn effect the geometry of the plates loaded in shear.
The crushing pressure due to the wing bending can be found as follows:
Pcrush=2N2
E skin t ehavg
The loading per unit length (N) at the spanwise location of the rib is calculated based on the ultimate bending moment, the length of the wingbox and the average height of the wingbox:
N= BMhL
=1.5∗11.346×106
2.1706∗11.395=688,115N /m
From this:
Pcrush=2∗(688,1152)
(65×109 )∗(0.00543 )∗(2.1706)=1236.95 Pa
The corresponding crushing stress applied to the ribs is therefore:
σ crush=Pcrush Lribc
nA=1236.95∗0.825∗14.1481
45∗(0.01∗0.0035)=7.383MPa
This stress can then be compared to the buckling stress for the stiffeners.
σ=Et ( πkL )2
The stiffeners have a thickness of 3.5mm and height of 10mm, therefore:
I xx=0.0035∗0.013
12=2.9167×10⁻¹⁰m4
So the radius of gyration, k, of the stiffeners is:
k=√ IA
=√ 2.9167×10⁻¹⁰
0.01∗0.0035=0.002887m
178

So, considering the maximum buckling length of the stiffeners which was measured from the CATIA model to be 880mm:
σEt
=( 3.14159∗0.0028870.88 )2
=1.0621×10⁻⁴
Therefore:σEt
1εn
=1.0621×10−4∗157.29=0.01671
This value is very small which is reflective of the small cross section and long column length of the stiffeners, it is not possible to use ESDU 76016 Figure 2 to determine the buckling stress directly however, as the lower part of the graph varies linearly, it has been assumed that this linear relationship is still valid for small values such as that calculated above, therefore:
σf n
=0.01671 , therefore σ=0.01671∗495.27=8.2736MPa
So the reserve factor against the stiffeners buckling can be determined:
RF=8.27357.383
=1.12
The vertical stiffeners were purposefully designed to have a small cross sectional area so that a higher number would be required to resist the Brazier loads. This in turn made the panels considered for shear buckling of the web small enough so that the minimum machinable thickness of 2mm could be used.
The panel dimensions were also dependent on the location of the horizontal stiffeners. Two horizontal stiffeners are used to support the rib by taking the bending moment applied due to the airloads transmitted by the rib.
The maximum bending moment occurring in the cargo bay section of the rib is -5103Nm. The horizontal stiffeners are considered to act as beams simply supported at the points where they meet the vertical stiffeners which are on the opposite side of the web. The max stress can be found using simply beam bending theory:
1.02
179
σ max=
BM∗h2I zz
The stiffeners measure 39mm in the z direction and 15mm in the y direction, therefore:
I zz=15∗393
12=7.41488×10⁻⁸m4
So:
σ max=
5103∗0.0392
7.41488×10−8=516.1584MPa
This is then compared to the strength of the material:
RF= 524516.1584
=1.02
As the total length of the rib is 11.395 and there are 45 stiffeners, the stiffener pitch is therefore 0.2532m. The most critical rectangular section is considered here which was located near the front spar, this dictated the required web thickness which is then kept constant elsewhere.
a=0.2532m,b=0.2m
Thereforeba=0.789
Again using ESDU 71005 and assuming the sides of the plates to be simply supported the buckling coefficient K was found:
K=7.076
So based on this the stress to cause the panels to buckle in shear is:
σ b=K∗E∗( tb )2
=7.076∗(78×109 )∗( 0.0020.2 )2
=55.1844 MPa
1.07
180
This must be compared to the stress applied to the rib. The applied stress results from the shear force applied to the section as calculated above. The area which resists the load is calculated based on the web depth in the region:
hshear=havg−hcargobay=2.3555−1.845=0.5105m
The area is therefore:
A shear=0.002∗0.5105=1.021×10⁻³m2
So the applied shear stress is
σ shear=SFmax
A shear
= 55095.751.021×10−3=53.9625MPa
So finally the reserve factor against buckling of the web under shear can be evaluated:
RF=55.184453.9625
=1.022
The web thickness used was 2mm which is the minimum recommended dimension for machining components, this is why 45 stiffeners were chosen in designing the rib as this configuration led to the minimum possible thickness being used hence producing the lightest possible rib.
Heavy Rib Analysis
Web thickness 8.5mmSpanwise Location 6.525mNumber of vertical stiffeners 40Chord length 19.872mWingbox length 15.89m
As discussed in the introduction to this section, the method of designing the heavy rib is the same as that described already for the light rib, albeit with different values for the loads applied and dimensions of the rib. However to show that the rib can support the additional load due to the
181
landing gear attachment the following calculation is presented.
The load due to the attachment of the landing gear was provided by the aft mid-wing designer as the main landing gear are located in this section. The vertical component of the outboard main trunion attachment load is considered to be applied as a point load:
FMLG=−2476812N
This load was applied to the Strand7 model representing the rib via the attachment point at the third spar. The load at the second spar was computed to be much considerably lower:
F spar2=−21,711N
Therefore the total shear force applied across the rib is:
F total=−21711−(−2476812 )=2455101N
This load is considered for the worst possible gust case and therefore does not need to be multiplied by the ultimate factor. To compute the shear stress resulting from this load the area must be computed. The most critical area is where the maintenance hole is located as shown:
Therefore the height of the section which supports the shear load is:
hshear=0.464+0.338+0.325=1.127m
The area is therefore:
A shear=tweb∗hshear=0.0085∗1.127=9.5795×10⁻³m2
182
So the applied shear stress is:
σ app=2455101
9.5795×10−3=256.287MPa
To determine if the correct thickness has been used the shear buckling stress is again considered. A total of 40 stiffeners are used on the heavy rib whose length is 15.89m, so therefore the spacing is 0.39725m. From the image above the dimensions of the buckling plates can be taken as:
a=0.464m∧b=0.39725
Therefore:ba=0.8565
Assuming the plates are simply supported by the stiffeners and using ESDU 71005 the buckling coefficient K is calculated:
K=7.45
The buckling stress is found as before:
σ b=K∗E∗( tb )2
Therefore:
σ b=7.45∗(78×109 )∗( 0.00850.39766 )2
=265.5MPa
So the reserve factor is:
RF= 265.5256.287
=1.036
183
Material: 2099 T83 Aluminium AlloyDate: 21-08-2012
Component: Mid-wing Forward SectionSub-Component: Outer Wing Connection Lug
In the chapter on design based on fatigue and damage tolerance a lug
was designed to support the loads transmitted from the outer wing to the
inner wing. Although the main criterion driving the design was to ensure
that the lug’s crack growth life would exceed the aircraft’s service life the
stresses on the lug also had to be checked to ensure it would not fail
under the applied loads. This work is presented here.
The geometry of the lug is as shown below, taken from the Detail
Stressing data sheet:
With d=12.7mm,c=12mm∧a=18.35mm. The thickness of the lug was
12mm.
The lug will experience tensile stress and shear stress due to the applied
load as well as a bearing stress due to the contact between it and the
bolt. The bolt is made from a titanium alloy with composition Ti-6Al-4V.
R F
184
Specifically the alloy used is TA10 as listed in the stressing data sheets
and from this source the mechanical properties used for the alloy are as
follows:
Fail Proof
Tension 788 680
Shear 334 255
Bearing - 1037
As discussed in the chapter on fatigue the load transmitted from the
outer wing is taken to act at an angle of 20 degrees to the vertical based
on the recommendations of Dr. Zhang. The magnitude of the load is
573,198N and acts as shown:
The tensile load is taken to be due to the horizontal component of the
force, therefore:
Fhorizontal=Ft sin (20 )=24,505.66N
The area over which this force will cause tensile stresses to arise is:
Atensile=2∗c∗t=2∗12∗12=288mm2
Therefore the tensile stress due to the applied loads is:
σ t=24505.66288
=85.089MPa
185
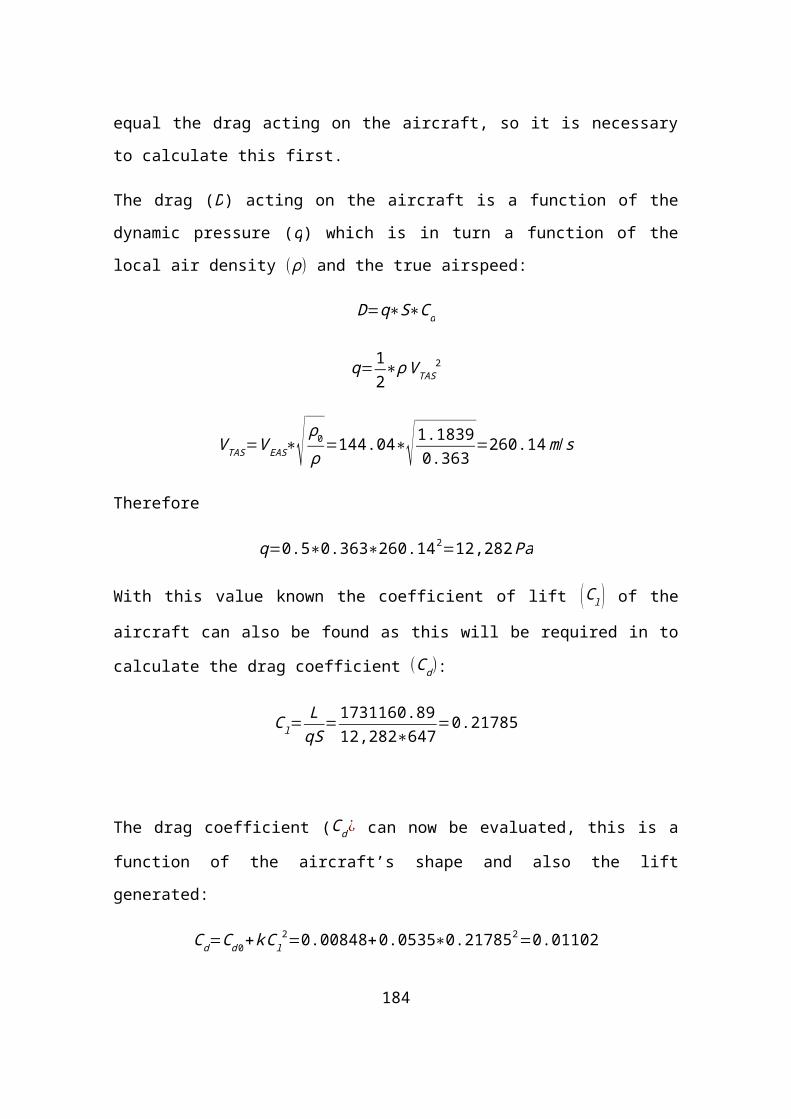
To determine the reserve factor this is compared to the lower of the
failure stress listed for the material and its proof stress when multiplied
by 1.5:
RF= 78885.089
=9.261
Next the shear stress due to the applied load is considered. The load
considered is the same as above but the area over which this acts is
equal to:
A shear=t∗(a−d2 )=12∗(18.35−6.35 )=144mm2
The shear stress is therefore:
F shear=24,505.66144
=156.367MPa
Again this is compared to the material properties:
RF= 334156.367
=2.136
Finally the bearing stress is evaluated for the lug. When evaluating the
bearing stress the entire load is used for calculations as the interior
surface of the lug’s hole which will be loaded is in the direction the force
acts in from the centreline.
Abearing=d∗t=12.7∗12=152.4mm
Therefore the bearing stress is:
186
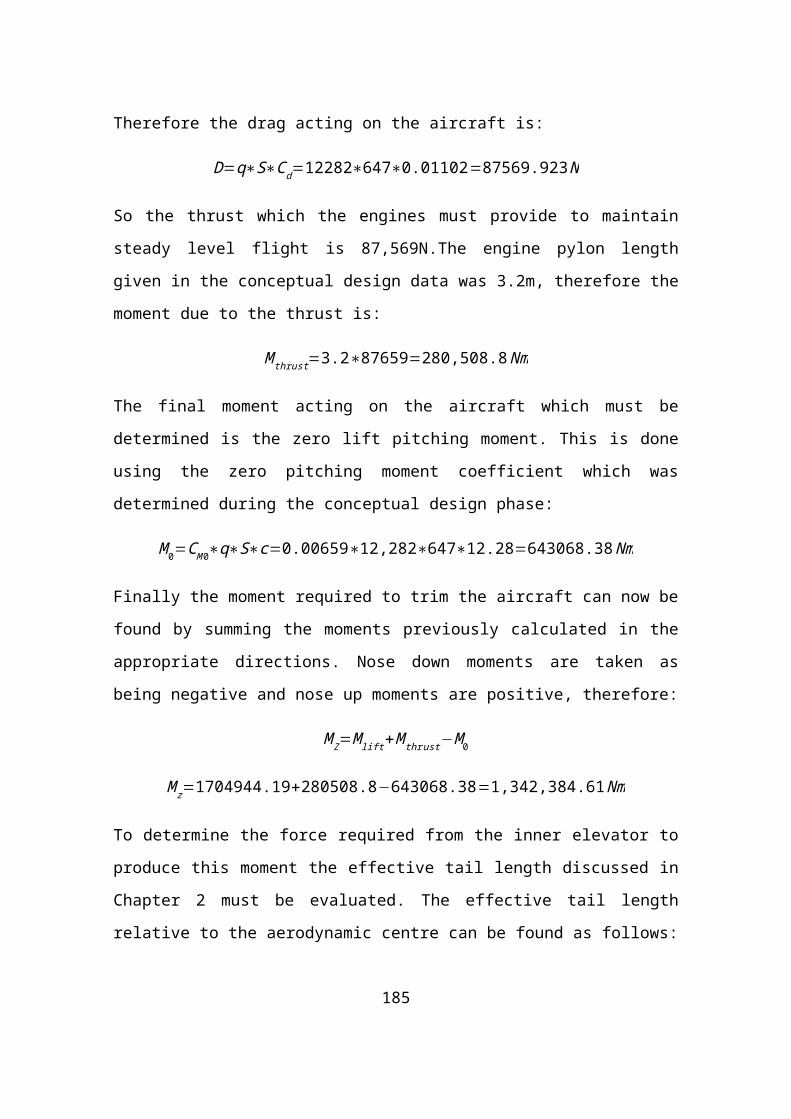
σ bearing=71650152.44
=470.021MPa
The reserve factor against the lug failing due to this bearing stress is
therefore:
RF=1.5∗1037470.021
=3.309
187
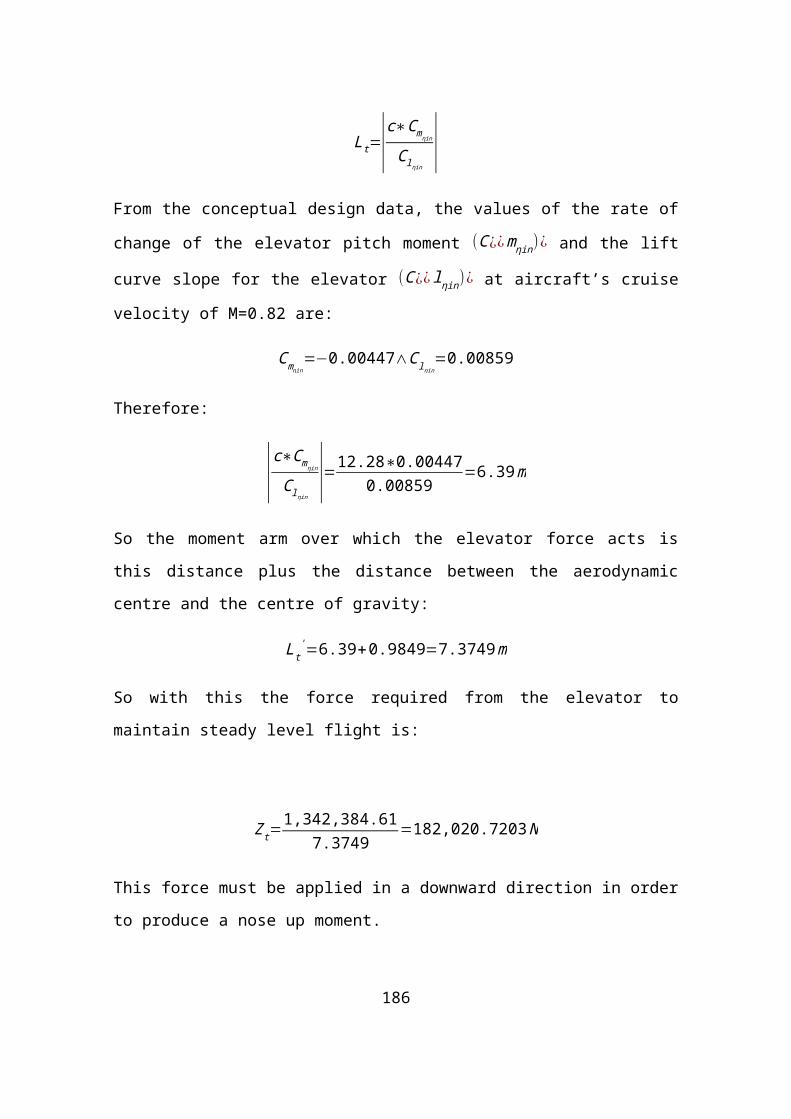
Material: 2099 T83 Aluminium AlloyDate: 21-08-2012
Component: Mid-wing Forward SectionSub-Component: Outboard Pressure Bulkhead
Bulkhead Area 8.8822∆ P 128328 PaThickness 2.5mm
The pressurisation of the cargo bay area is maintained using the third
spar as the aft pressure bulkhead, the skin of the aircraft and the
outboard pressure bulkhead. The calculations detailing the design of this
component are shown here.
The bulkhead is stiffened by integrally machined horizontal and vertical
stiffeners on opposing sides of the bulkhead. The pitch of these
stiffeners are both 0.2m, i.e.:
a=b=0.2 , therefore ab=1
The deflection of the bulkhead can be determined using the same
method as was used for the third spar’s pressurisation and for the skin,
i.e. using ESDU 71013 and assuming that the panels are simply
supported by the stiffeners such that their edges are free in translation
but fixed in rotation. So using Figure 2, the deflection of the outboard
bulkhead was found to be:
δt=0.83 ,δ=0,83∗2.5=2.075mm
The stress in the panels due to the pressure loads were then found
using Figures 7 and 8 as shown before:
R F
188
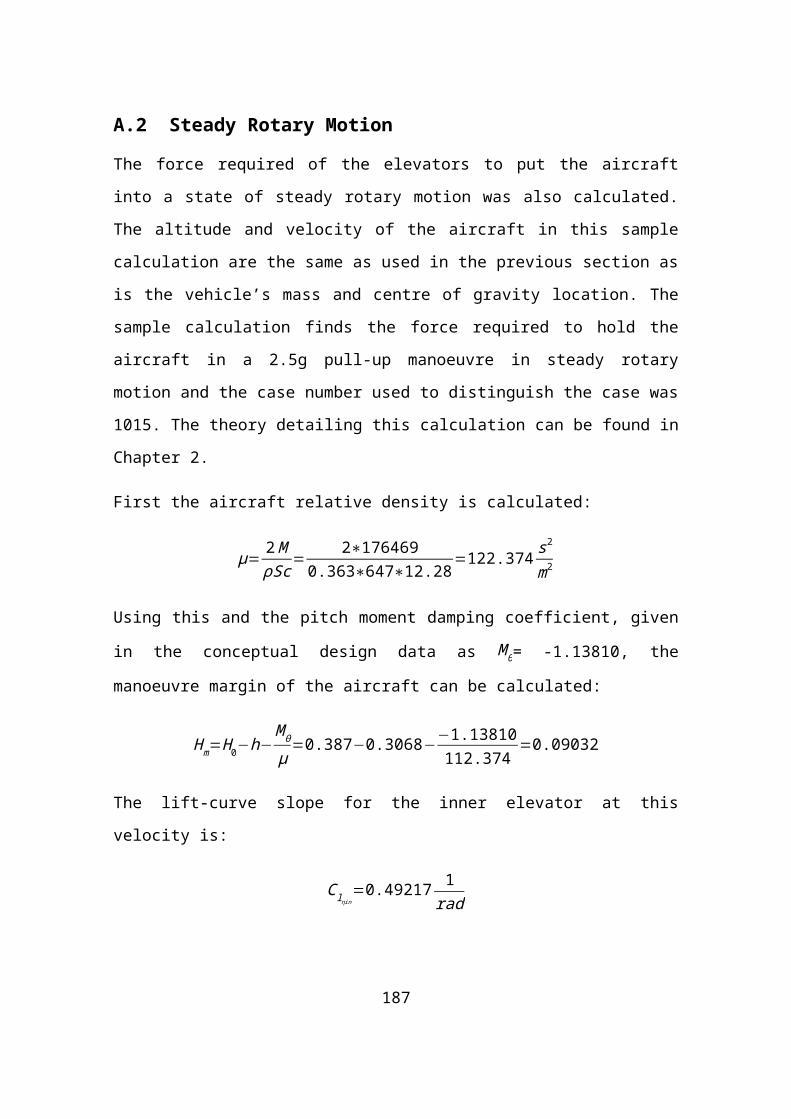
f CP ( tb )
2
=0.133 , therefore f C=0.133∗128328∗( 2002.5 )2
=109.2327MPa
f cP ( tb )
2
=0.018 ,therefore f c=0.018∗128328∗( 2002.5 )2
=14.7834MPa
f E
P ( tb )2
=0.28 ,therefore f E=0.28∗128328∗( 2002.5 )2
=229.963MPa
Again the most critical stress value was f E so this is compared to the
yield strength of the material:
RF= 524229.963
=2.2786
The thickness of 2.5mm was chosen based on the deflection as thinner
web sizes would lead to deflections larger than the web thickness which
is not advised.
Next the stiffeners used to support the bulkhead are checked for
buckling and strength analysis. The area of the bulkhead is 8.882m2,
therefore the total pressure load acting on the component is:
F total=8.882∗128328=1,139,809.3N
First the dimensions of the horizontal stiffeners are checked. A total of 9
horizontal stiffeners are used and their average length is 4.68425m.
Assuming each stiffener supports an equal portion of the applied force
then the distributed load is:
q=Ftotal
nL= 1139809.39∗4.68425
=27,036.4471N /m
The horizontal stiffeners are assumed to be simply supported at the
points where they coincide with the vertical stiffeners, therefore using
bending beam theory the maximum bending moment due to this applied
189
load is:
BMmax=q L2
8=27036.4471∗(0.22)
8=135.182Nm
Based on this the maximum stress applied to the stiffeners can be
varied by adjusting their dimensions. The stiffeners are rectangular in
cross section with a thickness of 6mm and height of 18mm, therefore:
I xx=t h3
12=6∗18
3
12×10−12=2.916×10⁻⁹m4
From this the max stress in the stiffeners is:
σ max=BMmax
h2
I xx=135.182∗0.0092.916×10−9
=417.23MPa
This can now be checked against the yield strength of the material:
RF= 524417.23
=1.2559
As the horizontal stiffeners are placed on the inboard side of the
bulkhead the pressure load causes them to be put under compressive
stresses, therefore the buckling strength of the stiffeners must also be
checked. The radius of gyration of the stiffeners must therefore be
calcaulted:
k=√ IA
=√ 2.916×10⁻⁹
0.006∗0.018=5.1962×10⁻³m
The buckling stress can then be evaluated using ESDU 76016 Figure 2
as shown previously, first though the parameter σEt
1εn
must be evaluated:
190
σ=Et ( πkL )2
So:
σEt
=( 3.14159∗5.1962×10−3
0.2 )2
=6.6621×10⁻³
And:
σEt
1εn
=6.6621×10−3∗157.29=1.04788
Therefore, from ESDU 76016 Figure 2, the value of the required
parameter is:
σf n
=0.91 , therefore σ=0.91∗495.27=450.6957MPa
So the reserve factor against the applied stress causing the horizontal
stiffeners to buckle is:
RF=450.6957417.23
=1.08021
Next the vertical stiffeners of the outboard bulkhead are analysed, the
method for deriving the applied stress is the same as for the horizontal
stiffeners. There are 24 vertical stiffeners which have an average length
of 1.8057m
q=Ftotal
n∗L=1,139,809.296
24∗1.8057=26,301.187N /m
BMmax=q L2
8=26,301.187∗0.2
2
8=131.505 N /m
As can be seen the bending moment applied to the vertical stiffeners
and horizontal stiffeners are very nearly identical, this is because the
pressure applied is equal and both sets of stiffeners have equal spacing
between individual members. The values would likely be even closer but
for the assumption that the length of each stiffener is equal to their
191
average length.
As the vertical stiffeners are put under tensile stress by the load,
buckling is not a concern, therefore they can be slightly thinner than the
horizontal stiffeners as only the reserve factor against yield is
considered. The thickness of the stiffeners is 5mm and their height is
18mm:
I xx=t h3
12=5∗18
3
12×10−12=2.43×10⁻⁹m4
Therefore the applied stress is:
σ app=BMmax
h2
I xx=131.505∗0.0092.43×10−9 =487.056MPa
This is compared against the tensile strength of the material:
RF= 524487.056
=1.076
192


![Almost Done--INTERN[1]](https://img.pdfslide.net/doc/110x75/589b01801a28abb85d8b4a4f/almost-done-intern1.jpg)