Embed Size (px)
Citation preview

1
PRESS RELEASE
GE ANNOUNCES SECOND QUARTER 2018 RESULTS • 2Q’18 continuing operations EPS (GAAP) of $0.08
• 2Q’18 adjusted EPS (non-GAAP) of $0.19
• GE CFOA (GAAP) of $0.2 billion; adjusted GE Industrial free cash flows (non-GAAP) of $0.3 billion-a)
• Reduced Industrial structural costs (non-GAAP) by $1.1 billion -b) in the first half of 2018 driven by Corporate, Power, and Oil & Gas
• Completed strategic review in June and announced plans to separate GE Healthcare and BHGE; GE’s $20 billion divestiture target is substantially complete
• Total-year framework: adjusted EPS (non-GAAP) of $1.00-1.07 and adjusted GE Industrial free cash flows (non-GAAP) of ~$6 billion
BOSTON – July 20, 2018 - GE (NYSE:GE) announced results today for the second quarter of 2018. GE Chairman and CEO John Flannery said, “With our strategic review now complete, GE is moving forward to implement the strategy and structure we laid out in June. Our focus is on unrelenting execution of this plan to improve operating results, strengthen our balance sheet, accelerate growth across our businesses, and increase shareholder value.”
Flannery added, “The second quarter was in line with expectations, and we saw continued strength across many of our segments, especially in Aviation and Healthcare. We expect the power market to remain challenging, and we continue our focus on operational improvement. In the first half of the year, we reduced Industrial structural costs by $1.1 billion, more than halfway toward our 2018 goal of more than $2 billion. Our adjusted Industrial free cash flows improved in the first half year over year, and we plan to end 2018 with more than $15 billion of cash.” Flannery concluded, “We are progressing on our plans to make GE simpler and stronger. We closed the Industrial Solutions and Value-Based Care transactions; announced plans to separate GE Healthcare into a standalone company over 12-18 months, pursue an orderly separation of BHGE over 2-3 years, and combine GE Transportation with Wabtec; and announced the sale of Distributed Power to Advent International for $3.25 billion.”
Three months ended June 30 Six months ended June 30
(Dollars in millions; except per-share amounts) 2018 2017 Year on Year 2018 2017 Year on
Year GAAP Metrics
Continuing Operations EPS $ 0.08 $ 0.12 (33) % $ 0.13 $ 0.13 0 %
Net Earnings EPS 0.07 0.10 (30) % (0.07) 0.09 U
Total Revenues 30,104 29,097 3 % 58,764 55,978 5 %
GE Industrial Margin 9.7 % 9.3 % 40 bps 8.7 % 7.3 % 140 bps
GE Cash From Operating Activities (GE CFOA) 238 3,218 (93) % (773) 3,586 U
Non-GAAP Metrics
Adjusted EPS $ 0.19 $ 0.21 (10) % $ 0.35 $ 0.35 0 %
GE Industrial Segment Organic Revenues 25,242 26,910 (6) % 49,059 51,634 (5) %
Adjusted GE Industrial Profit-c) 2,917 3,262 (11) % 5,662 5,639 0 %
Adjusted GE Industrial Margin-c) 10.4 % 12.0 % (160) bps 10.3 % 10.9 % (60) bps
Adjusted GE Industrial Free Cash Flows (FCF)-a) 258 369 (30) % (1,423) (2,379) 40 %
-a) Excluding deal taxes and GE Pension Plan funding, and with BHGE on a dividend basis -b) Industrial structural costs exclude gains and restructuring & other, and impact of acquisitions & dispositions and FX; BHGE on proforma basis -c) Excludes gains/(losses) and restructuring & other charges
We present both GAAP and non-GAAP measures to provide investors with additional information. We believe that providing these non-GAAP measures along with GAAP measures allows for increased comparability of our ongoing performance from period to period. Please see pages 8-14 for explanations of why we use these non-GAAP measures and the reconciliation to the most comparable GAAP financial measures.

2
Results by Reporting Segment The following segment discussions and variance explanations are intended to reflect management’s view of the relevant comparisons of financial results.
Power
Three months ended June 30 Six months ended June 30
(in millions) 2018 2017 Year on Year 2018 2017 Year on
Year Orders $ 7,366 $ 9,902 (26) % $ 12,928 $ 17,764 (27) %
Revenues 7,579 9,400 (19) % 14,801 17,341 (15) %
Segment Profit 421 994 (58) % 694 1,432 (52) %
Segment Profit Margin 5.6 % 10.6 % (500) bps 4.7 % 8.3 % (360) bps
Orders of $7.4 billion were down 26%. Revenues of $7.6 billion were down 19%. Segment profit of $421 million was down 58%. First-half trends continue to indicate a gas power market of less than 30 gigawatts in 2018, and orders softness resulted in lower progress collections. The team continues to focus on right-sizing footprint and structural cost and maximizing the value of Power’s installed base. Renewable Energy
Three months ended June 30 Six months ended June 30
(in millions) 2018 2017 Year on Year 2018 2017 Year on
Year Orders $ 1,739 $ 2,052 (15) % $ 4,162 $ 4,155 0 %
Revenues 1,653 2,312 (29) % 3,299 4,079 (19) %
Segment Profit 82 158 (48) % 159 228 (30) %
Segment Profit Margin 5.0 % 6.8 % (180) bps 4.8 % 5.6 % (80) bps
Orders of $1.7 billion were down 15%, principally driven by timing as first half orders versus last year were flat. Despite the decline in wind turbine orders in the second quarter, a strong global demand for Onshore Wind continues with backlog growing 32% versus prior year. Revenues of $1.7 billion were down 29%. Segment profit of $82 million was down 48% driven by a challenging price dynamic in the market. Oil & Gas
Three months ended June 30 Six months ended June 30
(in millions) 2018 2017 Year on Year 2018 2017 Year on
Year Orders $ 6,043 $ 3,106 95 % $ 11,275 $ 5,694 98 %
Revenues 5,554 2,997 85 % 10,939 6,083 80 %
Adjusted Segment Profit (Non-GAAP)-a) 222 120 85 % 402 380 6 %
Adjusted Segment Profit Margin (Non-GAAP)-a) 4.0 % 4.0 % 0 bps 3.7 % 6.2 % (250) bps
-a) Excluded restructuring and other charges; O&G segment profit including these items was $73 million for three months ended June 30th and $(70) million for the six months ended June 30th.
BHGE is releasing its financial results this morning. Orders were $6.0 billion, up 95% reported and up 2% organic. Revenues were $5.6 billion, up 85% reported and down 12% organic*. Adjusted segment profit* was $222 million, up 85% reported and down 27% organic*. July marks the one-year anniversary of the combination of GE’s Oil and Gas business with Baker Hughes, and the integration is progressing well with $189 million of synergies in the quarter, on track for approximately $700 million in 2018. During the quarter, GE received cash distributions from BHGE totaling $439 million, comprising GE’s portion of share repurchases of $313 million and quarterly dividend of $125 million. Aviation
Three months ended June 30 Six months ended June 30
(in millions) 2018 2017 Year on Year 2018 2017 Year on
Year Orders $ 9,521 $ 7,378 29 % $ 17,635 $ 14,559 21 %
Revenues 7,519 6,634 13 % 14,631 13,307 10 %
Segment Profit 1,475 1,374 7 % 3,078 2,647 16 %
Segment Profit Margin 19.6 % 20.7 % (110) bps 21.0 % 19.9 % 110 bps
Orders of $9.5 billion were up 29%. Equipment orders grew 62%, driven by key wins in GEnx and continued LEAP momentum. Not included in orders are more than $22 billion of wins from the Farnborough airshow. Revenues of $7.5 billion were up 13%, and Aviation shipped 250 LEAP engines this quarter versus 69 last year. Segment profit of $1.5 billion was up 7%. * Non-GAAP Financial Measure

3
Healthcare
Three months ended June 30 Six months ended June 30
(in millions) 2018 2017 Year on Year 2018 2017 Year on
Year Orders $ 5,320 $ 4,977 7 % $ 10,052 $ 9,512 6 %
Revenues 4,978 4,688 6 % 9,680 8,993 8 %
Segment Profit 926 826 12 % 1,660 1,487 12 %
Segment Profit Margin 18.6 % 17.6 % 100 bps 17.1 % 16.5 % 60 bps
Orders of $5.3 billion were up 7% reported and up 5% organic. Revenues of $5.0 billion grew 6% reported and 4% organic*, with Healthcare Systems up 6% and Life Sciences up 7% reported. Growth markets continue to be strong with revenues up 9% reported while developed markets were up 5% versus last year. Segment profit of $926 million was up 12%. Transportation
Three months ended June 30 Six months ended June 30
(in millions) 2018 2017 Year on Year 2018 2017 Year on
Year Orders $ 1,106 $ 778 42 % $ 2,615 $ 1,814 44 %
Revenues 942 1,077 (13) % 1,814 2,057 (12) %
Segment Profit 155 183 (15) % 285 278 3 %
Segment Profit Margin 16.5 % 17.0 % (50) bps 15.7 % 13.5 % 220 bps
Orders of $1.1 billion were up 42%. Transportation received orders for 115 locomotives principally from North American customers versus 26 in 2Q’17. Revenues of $942 million were down 13%. Segment profit of $155 million was down 15%. As announced in May, GE expects the merger of its Transportation business with Wabtec to close in early 2019, subject to regulatory approvals and other customary closing conditions. Lighting
Three months ended June 30 Six months ended June 30
(in millions) 2018 2017 Year on Year 2018 2017 Year on
Year Orders $ 275 $ 380 (28) % $ 496 $ 623 (20) %
Revenues 431 473 (9) % 887 935 (5) %
Segment Profit 24 17 41 % 26 27 (4) %
Segment Profit Margin 5.6 % 3.6 % 200 bps 2.9 % 2.9 % 0 bps
Orders of $275 million were down 28%. Revenues of $431 million were down 9%. Segment profit of $24 million was up 41%. In 2Q, GE closed on the majority of the sale of its Europe, Middle East, Africa, Turkey and Global Automotive Lighting businesses. These businesses represented approximately 15% of Lighting’s annual revenues. GE expects to sign a deal by the end of 2018 to sell the remainder of Lighting.
GE Capital
Three months ended June 30 Six months ended June 30
(in millions) 2018 2017 Year on Year 2018 2017 Year on
Year Capital continuing operations $ (207) $ (172) (20) % $ (422) $ (219) (93) %
Discontinued operations (66) (152) 57 % (1,618) (395) U
GE Capital Loss $ (273) $ (324) 16 % $ (2,041) $ (614) U
Continuing operations generated a loss of $207 million in the quarter, versus a loss of $172 million in the prior year. GE Capital ended the quarter with $136 billion of assets, including $16 billion of liquidity. GE continues to work to make GE Capital smaller and more focused and is making progress on the planned reduction of $25 billion in assets by the end of 2019. * Non-GAAP Financial Measure

4
GENERAL ELECTRIC COMPANY CONDENSED STATEMENT OF EARNINGS (LOSS) (UNAUDITED) Consolidated GE(a) Financial Services (GE Capital) Three months ended June 30 2018 2017 V% 2018 2017 V% 2018 2017 V% Revenues Sales of goods and services $ 28,093 $ 27,075 4 % $ 28,079 $ 27,129 4 % $ 31 $ 33 (6 )% GE Capital revenues from services 2,011 2,022 — — 2,398 2,413
Total revenues 30,104 29,097 3 % 28,079 27,129 4 % 2,429 2,446 (1 )% Costs and expenses Cost of sales 22,423 21,623 21,877 21,158 571 547 Selling, general and administrative expenses 4,488 4,152 4,331 3,792 312 490 Interest and other financial charges 1,295 1,174 690 637 772 771 Investment contracts, insurance losses and
insurance annuity benefits 669 657 — — 694 682 Non-operating benefit costs 693 561 690 552 3 9 Other costs and expenses 68 133 — — 79 144
Total costs and expenses 29,636 28,300 5 % 27,588 26,139 6 % 2,432 2,641 (8 )% Other income 864 330 843 332 — — GE Capital earnings (loss) from continuing operations — — (207 ) (172 ) — — Earnings (loss) from continuing operations
before income taxes 1,331 1,127 18 % 1,127 1,150 (2 )% (3 ) (195 ) 98 % Benefit (provision) for income taxes (542 ) 38 (525 ) (165 ) (17 ) 202 Earnings (loss) from continuing operations 789 1,164 (32 )% 602 985 (39 )% (20 ) 7 U Earnings (loss) from discontinued
operations, net of taxes (121 ) (146 ) (121 ) (152 ) (66 ) (146 ) Net earnings (loss) 669 1,019 (34 )% 482 833 (42 )% (86 ) (138 ) 38 % Less net earnings (loss) attributable to
noncontrolling interests (132 ) (38 ) (133 ) (42 ) 2 4 Net earnings (loss) attributable to the Company 800 1,057 (24 )% 615 875 (30 )% (88 ) (142 ) 38 % Preferred stock dividends (185 ) (182 ) — — (185 ) (182 ) Net earnings (loss) attributable to
GE common shareowners $ 615 $ 875 (30 )% $ 615 $ 875 (30 )% $ (273 ) $ (324 ) 16 % Amounts attributable to GE common shareowners:
Earnings (loss) from continuing operations $ 789 $ 1,164 (32 )% $ 602 $ 985 (39 )% $ (20 ) $ 7 U Less net earnings (loss) attributable
to noncontrolling interests, continuing operations (132 ) (45 ) (133 ) (42 ) 2 (3 ) Earnings (loss) from continuing operations
attributable to the Company 921 1,210 (24 )% 736 1,028 (28 )% (22 ) 10 U Preferred stock dividends (185 ) (182 ) — — (185 ) (182 ) Earnings (loss) from continuing operations
attributable to GE common shareowners 736 1,028 (28 )% 736 1,028 (28 )% (207 ) (172 ) (20 )% Earnings (loss) from discontinued
operations, net of taxes (121 ) (146 ) (121 ) (152 ) (66 ) (146 ) Less net earnings (loss) attributable to
noncontrolling interests, discontinued operations — 7 — — — 7 Net earnings (loss) attributable to GE
common shareowners $ 615 $ 875 (30 )% $ 615 $ 875 (30 )% $ (273 ) $ (324 ) 16 % Per-share amounts - earnings (loss) from
continuing operations Diluted earnings (loss) per share $ 0.08 $ 0.12 (33 )% Basic earnings (loss) per share $ 0.08 $ 0.12 (33 )% Per-share amounts - net earnings (loss) Diluted earnings (loss) per share $ 0.07 $ 0.10 (30 )% Basic earnings (loss) per share $ 0.07 $ 0.10 (30 )% Total average equivalent shares Diluted 8,699 8,760 (1 )% Basic 8,688 8,671 — % Dividends declared per common share $ 0.12 $ 0.24 (50 )%
(a) Represents the adding together of all affiliated companies except GE Capital, which is presented on a one-line basis. Amounts may not add due to rounding. Dollar amounts and share amounts in millions; per-share amounts in dollars. "GE Capital" means GE Capital Global Holdings, LLC (GECGH) and all of their affiliates and associated companies. Separate information is shown for "GE" and "Financial Services (GE Capital)." Transactions between GE and GE Capital have been eliminated from the "Consolidated" column. See Note 1 to the 2017 consolidated financial statements at www.ge.com/ar2017 for further information about consolidation matters.
5
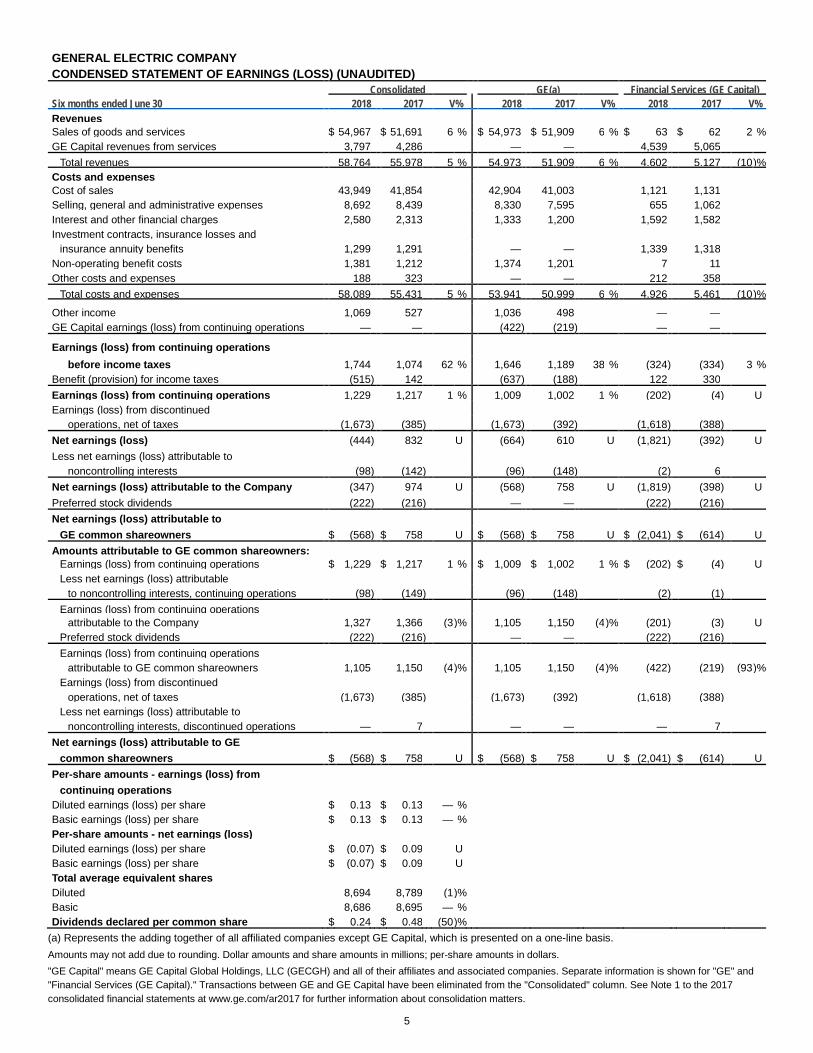
GENERAL ELECTRIC COMPANY CONDENSED STATEMENT OF EARNINGS (LOSS) (UNAUDITED) Consolidated GE(a) Financial Services (GE Capital) Six months ended June 30 2018 2017 V% 2018 2017 V% 2018 2017 V% Revenues Sales of goods and services $ 54,967 $ 51,691 6 % $ 54,973 $ 51,909 6 % $ 63 $ 62 2 % GE Capital revenues from services 3,797 4,286 — — 4,539 5,065
Total revenues 58,764 55,978 5 % 54,973 51,909 6 % 4,602 5,127 (10 )% Costs and expenses Cost of sales 43,949 41,854 42,904 41,003 1,121 1,131 Selling, general and administrative expenses 8,692 8,439 8,330 7,595 655 1,062 Interest and other financial charges 2,580 2,313 1,333 1,200 1,592 1,582 Investment contracts, insurance losses and
insurance annuity benefits 1,299 1,291 — — 1,339 1,318 Non-operating benefit costs 1,381 1,212 1,374 1,201 7 11 Other costs and expenses 188 323 — — 212 358
Total costs and expenses 58,089 55,431 5 % 53,941 50,999 6 % 4,926 5,461 (10 )% Other income 1,069 527 1,036 498 — — GE Capital earnings (loss) from continuing operations — — (422 ) (219 ) — — Earnings (loss) from continuing operations
before income taxes 1,744 1,074 62 % 1,646 1,189 38 % (324 ) (334 ) 3 % Benefit (provision) for income taxes (515 ) 142 (637 ) (188 ) 122 330 Earnings (loss) from continuing operations 1,229 1,217 1 % 1,009 1,002 1 % (202 ) (4 ) U Earnings (loss) from discontinued
operations, net of taxes (1,673 ) (385 ) (1,673 ) (392 ) (1,618 ) (388 ) Net earnings (loss) (444 ) 832 U (664 ) 610 U (1,821 ) (392 ) U Less net earnings (loss) attributable to
noncontrolling interests (98 ) (142 ) (96 ) (148 ) (2 ) 6 Net earnings (loss) attributable to the Company (347 ) 974 U (568 ) 758 U (1,819 ) (398 ) U Preferred stock dividends (222 ) (216 ) — — (222 ) (216 ) Net earnings (loss) attributable to
GE common shareowners $ (568 ) $ 758 U $ (568 ) $ 758 U $ (2,041 ) $ (614 ) U Amounts attributable to GE common shareowners:
Earnings (loss) from continuing operations $ 1,229 $ 1,217 1 % $ 1,009 $ 1,002 1 % $ (202 ) $ (4 ) U Less net earnings (loss) attributable
to noncontrolling interests, continuing operations (98 ) (149 ) (96 ) (148 ) (2 ) (1 ) Earnings (loss) from continuing operations
attributable to the Company 1,327 1,366 (3 )% 1,105 1,150 (4 )% (201 ) (3 ) U Preferred stock dividends (222 ) (216 ) — — (222 ) (216 ) Earnings (loss) from continuing operations
attributable to GE common shareowners 1,105 1,150 (4 )% 1,105 1,150 (4 )% (422 ) (219 ) (93 )% Earnings (loss) from discontinued
operations, net of taxes (1,673 ) (385 ) (1,673 ) (392 ) (1,618 ) (388 ) Less net earnings (loss) attributable to
noncontrolling interests, discontinued operations — 7 — — — 7 Net earnings (loss) attributable to GE
common shareowners $ (568 ) $ 758 U $ (568 ) $ 758 U $ (2,041 ) $ (614 ) U Per-share amounts - earnings (loss) from
continuing operations Diluted earnings (loss) per share $ 0.13 $ 0.13 — % Basic earnings (loss) per share $ 0.13 $ 0.13 — % Per-share amounts - net earnings (loss) Diluted earnings (loss) per share $ (0.07 ) $ 0.09 U Basic earnings (loss) per share $ (0.07 ) $ 0.09 U Total average equivalent shares Diluted 8,694 8,789 (1 )% Basic 8,686 8,695 — % Dividends declared per common share $ 0.24 $ 0.48 (50 )%
(a) Represents the adding together of all affiliated companies except GE Capital, which is presented on a one-line basis. Amounts may not add due to rounding. Dollar amounts and share amounts in millions; per-share amounts in dollars. "GE Capital" means GE Capital Global Holdings, LLC (GECGH) and all of their affiliates and associated companies. Separate information is shown for "GE" and "Financial Services (GE Capital)." Transactions between GE and GE Capital have been eliminated from the "Consolidated" column. See Note 1 to the 2017 consolidated financial statements at www.ge.com/ar2017 for further information about consolidation matters.

6
GENERAL ELECTRIC COMPANY SUMMARY OF OPERATING SEGMENTS (UNAUDITED) Three months ended June 30 Six months ended June 30 (Dollars in millions) 2018 2017 V% 2018 2017 V%
Revenues(a) Power(b) $ 7,579 $ 9,400 (19 )% $ 14,801 $ 17,341 (15 )% Renewable Energy 1,653 2,312 (29 )% 3,299 4,079 (19 )% Oil & Gas 5,554 2,997 85 % 10,939 6,083 80 % Aviation 7,519 6,634 13 % 14,631 13,307 10 % Healthcare 4,978 4,688 6 % 9,680 8,993 8 % Transportation 942 1,077 (13 )% 1,814 2,057 (12 )% Lighting(b) 431 473 (9 )% 887 935 (5 )%
Total industrial segment revenues 28,657 27,582 4 % 56,052 52,795 6 % Capital 2,429 2,446 (1 )% 4,602 5,127 (10 )%
Total segment revenues 31,085 30,028 4 % 60,654 57,923 5 % Corporate items and eliminations(a) (982 ) (932 ) (1,890 ) (1,945 )
Consolidated revenues $ 30,104 $ 29,097 3 % $ 58,764 $ 55,978 5 %
Segment profit (loss)(a) Power(b) $ 421 $ 994 (58 )% $ 694 $ 1,432 (52 )% Renewable Energy 82 158 (48 )% 159 228 (30 )% Oil & Gas 73 120 (39 )% (70 ) 380 U Aviation 1,475 1,374 7 % 3,078 2,647 16 % Healthcare 926 826 12 % 1,660 1,487 12 % Transportation 155 183 (15 )% 285 278 3 % Lighting(b) 24 17 41 % 26 27 (4 )%
Total industrial segment profit 3,157 3,673 (14 )% 5,832 6,480 (10 )% Capital (207 ) (172 ) (20 )% (422 ) (219 ) (93 )% Total segment profit (loss) 2,950 3,502 (16 )% 5,410 6,261 (14 )%
Corporate items and eliminations(a) (309 ) (1,120 ) (962 ) (2,522 ) GE interest and other financial charges (690 ) (637 ) (1,333 ) (1,200 ) GE benefit (provision) for income taxes (525 ) (165 ) (637 ) (188 ) GE non-operating benefit costs (690 ) (552 ) Earnings (loss) from continuing operations
attributable to GE common shareowners 736 1,028 (28 )% 1,105 1,150 (4 )% Earnings (loss) from discontinued operations,
net of taxes (121 ) (146 ) 17 % (1,673 ) (385 ) U Less net earnings attributable to
noncontrolling interests, discontinued operations — 7 — 7 Earnings (loss) from discontinued operations,
net of tax and noncontrolling interests (121 ) (152 ) 20 % (1,673 ) (392 ) U Consolidated net earnings (loss)
attributable to GE common shareowners $ 615 $ 875 (30 )% $ (568 ) $ 758 U (a) Segment revenues include sales of products and services related to the segment. Segment profit excludes results reported as discontinued
operations and material accounting changes, the portion of earnings or loss attributable to noncontrolling interests of consolidated subsidiaries, and as such only includes the portion of earnings or loss attributable to our share of the consolidated earnings or loss of consolidated subsidiaries. Segment profit excludes or includes interest and other financial charges, non-operating benefit costs, income taxes, and preferred stock dividends according to how a particular segment's management is measured – excluded in determining segment profit for Power, Renewable Energy, Oil & Gas, Aviation, Healthcare, Transportation and Lighting; included in determining segment profit, which we sometimes refer to as "net earnings," for Capital. Other income is included in segment profit for the industrial segments and the Capital segment. Certain corporate costs, such as shared services, employee benefits and information technology are allocated to our segments based on usage. A portion of the remaining corporate costs is allocated based on each segment's relative net cost of operations. Industrial segment revenues and profit include the sum of our seven industrial reporting segments without giving effect to the elimination of transactions among such segments and between these segments and our financial services segment. Total segment revenues and profit include the sum of our seven industrial segments and one financial services segment, without giving effect to the elimination of transactions among such segments. We believe that this provides investors with a view as to the results of all of our segments, without inter-segment eliminations and corporate items.
(b) Beginning in the third quarter of 2017, the Energy Connections business within the former Energy Connections & Lighting segment has been combined with the Power segment and presented as one reporting segment called Power. As a result of this combination, our GE Lighting and Current, powered by GE (Current) businesses, have been reported as a separate segment called Lighting.
Amounts may not add due to rounding

7
GENERAL ELECTRIC COMPANY CONDENSED STATEMENT OF FINANCIAL POSITION (UNAUDITED)
Consolidated GE(a) Financial Services (GE Capital)
June 30, December 31, June 30, December 31, June 30, December 31, (Dollars in billions) 2018 2017 2018 2017 2018 2017 Assets Cash, cash equivalents and restricted cash and marketable securities(b)(c) $ 64.3
$ 82.7 $ 14.7
$ 19.4 $ 49.6
$ 63.4
Receivables 20.8 24.2 14.5 14.6 — — Inventories 20.5 19.4 20.4 19.3 0.1 0.1 GE Capital financing receivables - net 8.4 10.3 — — 16.4 22.0 Property, plant & equipment - net 50.9 53.9 22.7 24.0 29.0 30.6 Receivable from GE Capital (debt assumption) — — 29.3 39.8 — — Investment in GE Capital — — 11.7 13.5 — — Goodwill & intangible assets 102.2 104.2 101.0 103.0 1.2 1.2 Contract assets 20.8 20.4 20.8 20.4 — — Other assets 45.0 44.1 20.4 21.4 34.8 33.5 Assets of businesses held for sale 4.9 4.2 4.6 3.8 — — Assets of discontinued operations 5.1 5.9 — — 5.1 5.9 Total assets $ 342.8 $ 369.2 $ 260.0 $ 279.3 $ 136.1 $ 156.7 Liabilities and equity Borrowings(d) $ 115.6 $ 134.6 $ 71.0 $ 81.6 $ 76.4 $ 95.2 Investment contracts, insurance liabilities and
insurance annuity benefits 36.2 38.1 — — 36.8 38.6 Non-current compensation and benefits 39.7 41.6 38.9 40.8 0.8 0.8 Other liabilities 73.0 76.0 73.9 78.9 8.4 7.7 Liabilities of businesses held for sale 1.2 1.2 1.2 1.2 — — Liabilities of discontinued operations 1.9 0.7 0.1 — 1.9 0.7 Redeemable noncontrolling interests 3.4 3.4 3.4 3.4 — — GE shareowners' equity 55.1 56.0 55.1 56.0 11.7 13.5 Noncontrolling interests 16.7 17.5 16.5 17.3 0.2 0.2 Total liabilities and equity $ 342.8 $ 369.2 $ 260.0 $ 279.3 $ 136.1 $ 156.7
(a) Represents the adding together of all affiliated companies except GE Capital, which is presented on a one-line basis.
(b) At June 30, 2018, GE Capital maintained liquidity sources of $15.6 billion that consisted of cash and equivalents of $13.9 billion, high-quality investments of $1.1 billion and cash and equivalents of $0.6 billion classified as discontinued operations. Additionally, at June 30, 2018, GE has $47.0 billion ($40.3 billion net of offset provisions) of committed credit lines, consisting primarily of a $20 billion unused syndicated credit facility extended by 36 banks expiring in 2021, a $19.8 billion unused syndicated credit facility extended by six banks expiring in 2020, and $5 billion of credit facilities extended by 10 banks with expiration dates ranging from September 2018 to May 2019. GE Capital has the right to compel GE to borrow under certain of these credit lines and transfer the proceeds as loans to GE Capital.
(c) Balance included consolidated restricted cash of $0.7 billion at both June 30, 2018 and December 31, 2017. GE restricted cash was $0.4 billion and $0.6 billion at June 30, 2018 and December 31, 2017, respectively, and GE Capital restricted cash was $0.3 billion and $0.1 billion at June 30, 2018 and December 31, 2017, respectively.
(d) GE Capital borrowings includes commercial paper of $3 billion and $5 billion for the periods ended June 30, 2018 and December 31, 2017. Amounts may not add due to rounding "GE Capital" means GE Capital Global Holdings, LLC (GECGH) and all of their affiliates and associated companies. Separate information is shown for "GE" and "Financial Services (GE Capital)." Transactions between GE and GE Capital have been eliminated from the "Consolidated" column. See Note 1 to the 2017 consolidated financial statements at www.ge.com/ar2017 for further information about consolidation matters.

8
GENERAL ELECTRIC COMPANY Financial Measures That Supplement GAAP
We sometimes use financial measures derived from consolidated financial information but not presented in our financial statements prepared in accordance with U.S. generally accepted accounting principles (GAAP). Certain of these are considered "non-GAAP financial measures" under the U.S. Securities and Exchange Commission rules. The following non-GAAP financial measures supplement our GAAP disclosures and should not be considered an alternative to the GAAP measure. • Adjusted earnings (loss)
• Adjusted earnings (loss) per share (EPS)
• Adjusted GE Industrial profit and profit margin (excluding certain items)
• GE Industrial segments organic revenue growth
• Oil & Gas organic revenue growth
• Healthcare organic revenue growth
• Oil & Gas organic segment profit and profit margins
• GE Industrial structural costs
• GE Industrial free cash flows (FCF) and adjusted GE Industrial FCF
The reasons we use these non-GAAP financial measures and the reconciliations to their most directly comparable GAAP financial measures follow. Certain columns, rows or percentages within these reconciliations may not add or recalculate due to the use of rounded numbers. Totals and percentages presented are calculated from the underlying numbers in millions.

9
ADJUSTED EARNINGS (LOSS) (NON-GAAP) Three months ended June 30 Six months ended June 30 (Dollars in millions) 2018 2017 V% 2018 2017 V% Consolidated earnings (loss) from continuing operations attributable to GE common shareowners (GAAP) $ 736
$ 1,028
(28 )% $ 1,105
$ 1,150
(4 )%
Non-operating benefits costs (pre-tax) (GAAP) (690 ) (552 ) (1,374 ) (1,201 ) Tax effect on non-operating benefit costs(a) 145 193 289 420
Less: non-operating benefit costs (net of tax) (545 ) (359 ) (1,085 ) (781 ) Adjusted consolidated earnings (Non-GAAP) $ 1,281 $ 1,387 (8 )% $ 2,190 $ 1,931 13 % Less: GE Capital earnings (loss) from continuing operations attributable to GE common shareowners (GAAP) (207 ) (172 ) (422 ) (219 ) GE Industrial earnings (Non-GAAP) $ 1,488 $ 1,558 (4 )% $ 2,613 $ 2,150 22 %
Gains (losses) and impairments for businesses held for sale (pre-tax) 309
—
243
2
Tax effect on gains (losses) and impairments for businesses held for sale(b) (125 ) —
(101 ) (1 )
Less: gains (losses) and impairments for businesses held for sale (net of tax) 185
—
142
1
Restructuring & other charges (pre-tax) (645 ) (709 ) (1,166 ) (1,682 ) Tax effect on restructuring & other(b) (72 ) 213 61 505
Less: restructuring & other (net of tax) (716 ) (496 ) (1,106 ) (1,177 ) Unrealized gains (losses) (pre-tax) 266 — 266 — Tax effect on unrealized gains (losses)(a) (56 ) — (56 ) —
Less: unrealized gains (losses) (net of tax) 210 — 210 — Less: GE Industrial U.S. tax reform enactment adjustment (24 ) — (55 ) — Adjusted GE Industrial earnings (Non-GAAP) $ 1,834 $ 2,054 (11 )% $ 3,421 $ 3,326 3 % GE Capital earnings (loss) from continuing operations attributable to GE common shareowners (GAAP) (207 ) (172 ) (20 )% (422 ) (219 ) (93 )% Less: GE Capital U.S. tax reform enactment adjustment — — (45 ) — Adjusted GE Capital earnings (Non-GAAP) $ (207 ) $ (172 ) (20 )% $ (377 ) $ (219 ) (72 )% Adjusted GE Industrial earnings (Non-GAAP) $ 1,834 $ 2,054 (11 )% $ 3,421 $ 3,326 3 % Add: Adjusted GE Capital earnings (Non-GAAP) (207 ) (172 ) (377 ) (219 ) Adjusted earnings (Non-GAAP) $ 1,627 $ 1,883 (14 )% $ 3,044 $ 3,107 (2 )%
(a) The tax effect was calculated using a 21% and 35% U.S. federal statutory tax rate in 2018 and 2017, respectively, based on its applicability to such cost.
(b) The tax effect presented includes both the rate for the relevant item as well as other direct and incremental tax charges.
Adjusted earnings* excludes non-operating benefit costs, gains, and restructuring and other items, after tax, excluding the effect of U.S. tax reform enactment adjustment. The service cost of our pension and other benefit plans are included in adjusted earnings, which represents the ongoing cost of providing pension benefits to our employees. The components of non-operating benefit costs are mainly driven by capital allocation decisions and market performance, and we manage these separately from the operational performance of our businesses. Gains and restructuring and other items are impacted by the timing and magnitude of gains associated with dispositions, and the timing and magnitude of costs associated with restructuring activities. We believe that the retained costs in Adjusted earnings* provides management and investors a useful measure to evaluate the performance of the total company, and increases period-to-period comparability. We believe that presenting Adjusted Industrial earnings separately for our financial services businesses also provides management and investors with useful information about the relative size of our industrial and financial services businesses in relation to the total company.
*Non-GAAP Financial Measure
10
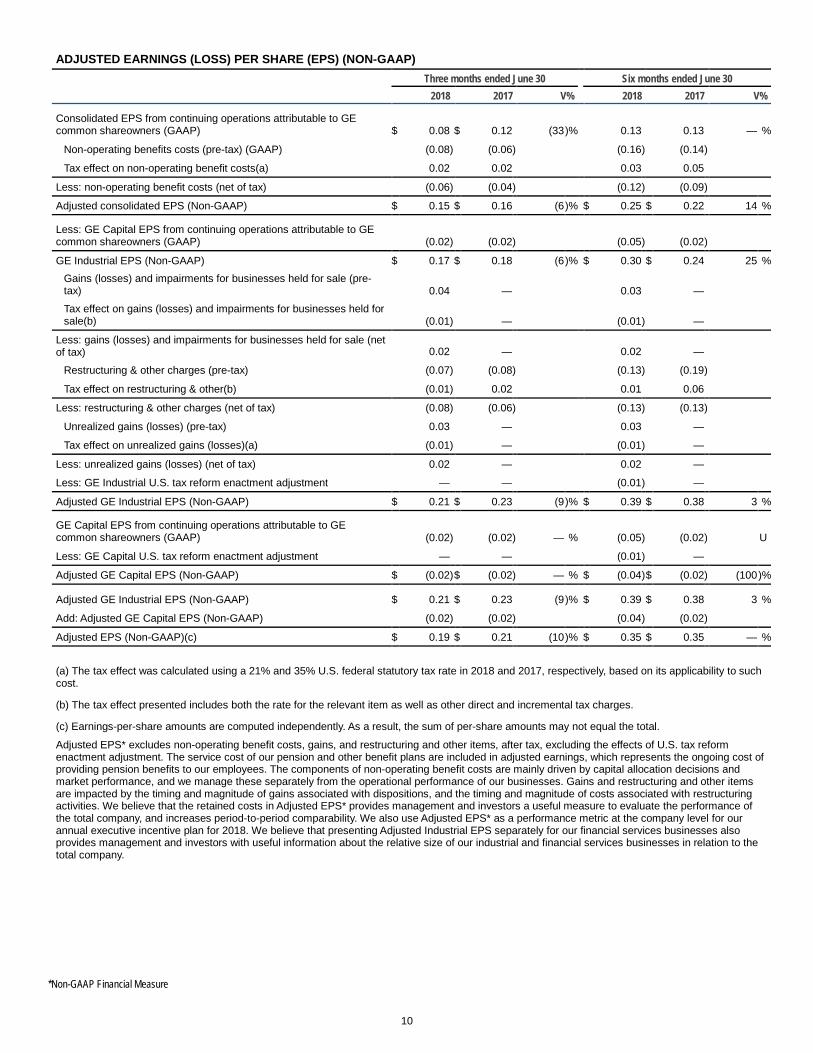
ADJUSTED EARNINGS (LOSS) PER SHARE (EPS) (NON-GAAP) Three months ended June 30 Six months ended June 30
2018 2017 V% 2018 2017 V% Consolidated EPS from continuing operations attributable to GE common shareowners (GAAP) $ 0.08
$ 0.12
(33 )% 0.13
0.13
— %
Non-operating benefits costs (pre-tax) (GAAP) (0.08 ) (0.06 ) (0.16 ) (0.14 ) Tax effect on non-operating benefit costs(a) 0.02 0.02 0.03 0.05
Less: non-operating benefit costs (net of tax) (0.06 ) (0.04 ) (0.12 ) (0.09 ) Adjusted consolidated EPS (Non-GAAP) $ 0.15 $ 0.16 (6 )% $ 0.25 $ 0.22 14 %
Less: GE Capital EPS from continuing operations attributable to GE common shareowners (GAAP) (0.02 ) (0.02 ) (0.05 ) (0.02 ) GE Industrial EPS (Non-GAAP) $ 0.17 $ 0.18 (6 )% $ 0.30 $ 0.24 25 %
Gains (losses) and impairments for businesses held for sale (pre-tax) 0.04
—
0.03
—
Tax effect on gains (losses) and impairments for businesses held for sale(b) (0.01 ) —
(0.01 ) —
Less: gains (losses) and impairments for businesses held for sale (net of tax) 0.02
—
0.02
—
Restructuring & other charges (pre-tax) (0.07 ) (0.08 ) (0.13 ) (0.19 ) Tax effect on restructuring & other(b) (0.01 ) 0.02 0.01 0.06
Less: restructuring & other charges (net of tax) (0.08 ) (0.06 ) (0.13 ) (0.13 ) Unrealized gains (losses) (pre-tax) 0.03 — 0.03 — Tax effect on unrealized gains (losses)(a) (0.01 ) — (0.01 ) —
Less: unrealized gains (losses) (net of tax) 0.02 — 0.02 — Less: GE Industrial U.S. tax reform enactment adjustment — — (0.01 ) — Adjusted GE Industrial EPS (Non-GAAP) $ 0.21 $ 0.23 (9 )% $ 0.39 $ 0.38 3 %
GE Capital EPS from continuing operations attributable to GE common shareowners (GAAP) (0.02 ) (0.02 ) — % (0.05 ) (0.02 ) U
Less: GE Capital U.S. tax reform enactment adjustment — — (0.01 ) — Adjusted GE Capital EPS (Non-GAAP) $ (0.02 ) $ (0.02 ) — % $ (0.04 ) $ (0.02 ) (100 )%
Adjusted GE Industrial EPS (Non-GAAP) $ 0.21 $ 0.23 (9 )% $ 0.39 $ 0.38 3 %
Add: Adjusted GE Capital EPS (Non-GAAP) (0.02 ) (0.02 ) (0.04 ) (0.02 ) Adjusted EPS (Non-GAAP)(c) $ 0.19 $ 0.21 (10 )% $ 0.35 $ 0.35 — %
(a) The tax effect was calculated using a 21% and 35% U.S. federal statutory tax rate in 2018 and 2017, respectively, based on its applicability to such cost.
(b) The tax effect presented includes both the rate for the relevant item as well as other direct and incremental tax charges.
(c) Earnings-per-share amounts are computed independently. As a result, the sum of per-share amounts may not equal the total.
Adjusted EPS* excludes non-operating benefit costs, gains, and restructuring and other items, after tax, excluding the effects of U.S. tax reform enactment adjustment. The service cost of our pension and other benefit plans are included in adjusted earnings, which represents the ongoing cost of providing pension benefits to our employees. The components of non-operating benefit costs are mainly driven by capital allocation decisions and market performance, and we manage these separately from the operational performance of our businesses. Gains and restructuring and other items are impacted by the timing and magnitude of gains associated with dispositions, and the timing and magnitude of costs associated with restructuring activities. We believe that the retained costs in Adjusted EPS* provides management and investors a useful measure to evaluate the performance of the total company, and increases period-to-period comparability. We also use Adjusted EPS* as a performance metric at the company level for our annual executive incentive plan for 2018. We believe that presenting Adjusted Industrial EPS separately for our financial services businesses also provides management and investors with useful information about the relative size of our industrial and financial services businesses in relation to the total company.
*Non-GAAP Financial Measure

11
ADJUSTED GE INDUSTRIAL PROFIT AND PROFIT MARGIN (EXCLUDING CERTAIN ITEMS) (NON-GAAP) Three months ended June 30 Six months ended June 30 (Dollars in millions) 2018 2017 2018 2017 GE total revenue (GAAP) $ 28,079 $ 27,129 $ 54,973 $ 51,909 Costs GE total costs and expenses (GAAP) $ 27,588 $ 26,139 $ 53,941 $ 50,999 Less: GE interest and other financial charges (GAAP) 690 637 1,333 1,200 Less: non-operating benefit costs (GAAP) 690 552 1,374 1,201 GE Industrial costs excluding interest and other financial charges and non-operating benefit costs (Non-GAAP) $ 26,208
$ 24,950
$ 51,234
$ 48,597
Less: restructuring and other charges 645 709 1,300 1,682 Add: noncontrolling interests (133 ) (42 ) (96 ) (148 ) Adjusted GE Industrial costs (Non-GAAP) $ 25,430 $ 24,199 $ 49,838 $ 46,767
Other Income GE other income (GAAP) $ 843 $ 332 $ 1,036 $ 498 Less: unrealized gains (losses) 266 — 266 — Less: gains (losses) and impairments for businesses held for sale 309 — 243 2 Adjusted GE other income (Non-GAAP) $ 268 $ 332 $ 527 $ 497 GE Industrial profit (GAAP) $ 2,714 $ 2,511 $ 4,775 $ 3,810
GE Industrial profit margins (GAAP) 9.7 % 9.3 % 8.7 % 7.3 %
Adjusted GE Industrial profit (Non-GAAP) $ 2,917 $ 3,262 $ 5,662 $ 5,639 Adjusted GE Industrial profit margins (Non-GAAP) 10.4 % 12.0 % 10.3 % 10.9 %
We have presented our adjusted GE Industrial profit* and profit margin* excluding gains and impairments for businesses held for sale, restructuring and other charges, noncontrolling interests and unrealized gains on Pivotal equity investment. We believe that GE Industrial profit* and profit margin* adjusted for these items are meaningful measures because they increase the comparability of period-to-period results.
*Non-GAAP Financial Measure

12
GE INDUSTRIAL SEGMENT ORGANIC REVENUE GROWTH (NON-GAAP) Three months ended June 30 Six months ended June 30 (In millions) 2018 2017 V% 2018 2017 V%
GE Industrial segment revenue (GAAP) $ 28,657 $ 27,582 4 % $ 56,052 $ 52,795 6 % Adjustments:
Acquisitions 2,859 84 5,584 91 Business dispositions (other than dispositions acquired for investment) 2
588
3
1,070
Currency exchange rate(a) 553 — 1,406 — GE Industrial segment organic revenue (Non-GAAP) $ 25,242 $ 26,910 (6 ) % $ 49,059 $ 51,634 (5 )%
(a) Translational foreign exchange OIL & GAS ORGANIC REVENUE GROWTH (NON-
Three months ended June 30 Six months ended June 30 (In millions) 2018 2017 V% 2018 2017 V% Oil & Gas segment revenue (GAAP) $ 5,554 $ 2,997 85 % $ 10,939 $ 6,083 80 %
Adjustments: Acquisitions 2,805 — 5,366 — Business dispositions (other than dispositions acquired for investment) —
—
—
—
Currency exchange rate(a) 114 273 — Oil & Gas organic revenue (Non-GAAP) $ 2,635 $ 2,997 (12 ) % $ 5,301 $ 6,083 (13 )%
(a) Translational foreign exchange HEALTHCARE ORGANIC REVENUE GROWTH (NON-GAAP) Three months ended June 30 Six months ended June 30 (In millions) 2018 2017 V% 2018 2017 V% Healthcare segment revenue (GAAP) $ 4,978 $ 4,688 6 % $ 9,680 $ 8,993 8 %
Adjustments: Acquisitions 2 — 4 — Business dispositions (other than dispositions acquired for investment) 2
24
3
41
Currency exchange rate(a) 113 — 287 — Healthcare organic revenue (Non-GAAP) $ 4,861 $ 4,664 4 % $ 9,386 $ 8,952 5 %
(a) Translational foreign exchange Organic revenue growth* measures revenue growth excluding the effects of acquisitions, business dispositions and currency exchange rates. We believe that this measure provides management and investors with a more complete understanding of underlying operating results and trends of established, ongoing operations by excluding the effect of acquisitions, dispositions and currency exchange, which activities are subject to volatility and can obscure underlying trends. We also believe that presenting organic revenue growth* separately for our industrial businesses provides management and investors with useful information about the trends of our industrial businesses and enables a more direct comparison to other non-financial businesses and companies. Management recognizes that the term "organic revenue growth" may be interpreted differently by other companies and under different circumstances. Although this may have an effect on comparability of absolute percentage growth from company to company, we believe that these measures are useful in assessing trends of the respective businesses or companies and may therefore be a useful tool in assessing period-to-period performance trends.
*Non-GAAP Financial Measure
13
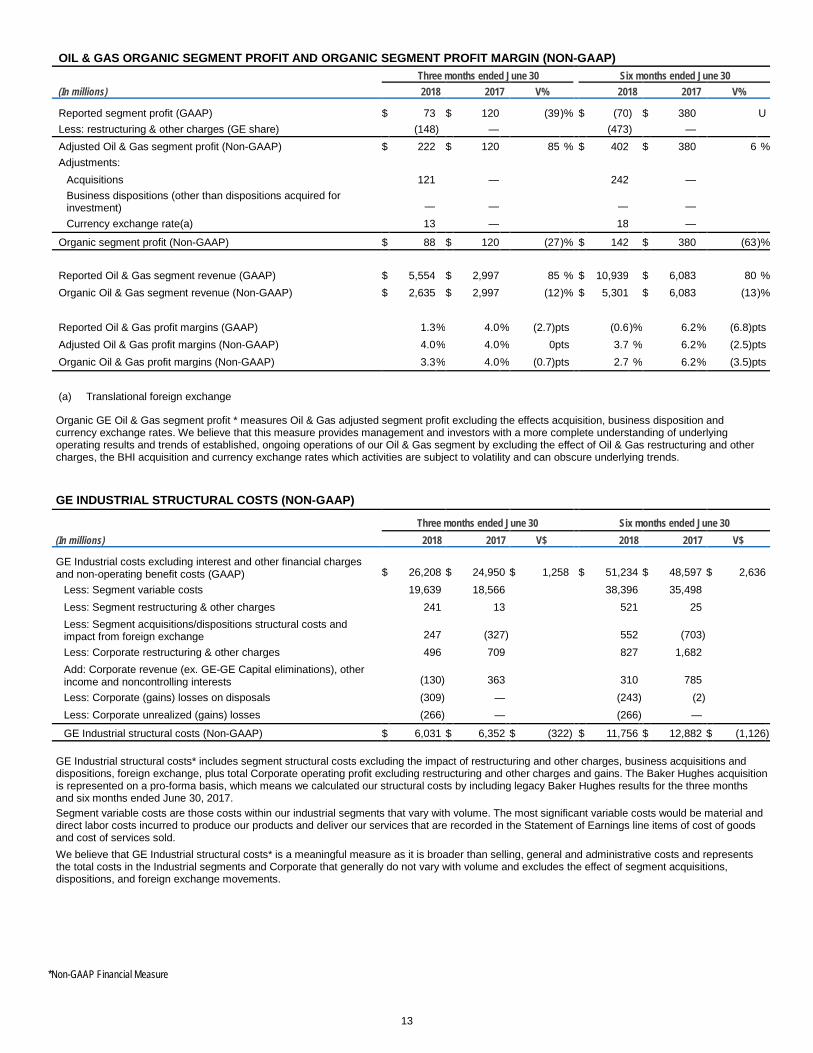
OIL & GAS ORGANIC SEGMENT PROFIT AND ORGANIC SEGMENT PROFIT MARGIN (NON-GAAP) Three months ended June 30 Six months ended June 30 (In millions) 2018 2017 V% 2018 2017 V% Reported segment profit (GAAP) $ 73 $ 120 (39 )% $ (70 ) $ 380 U Less: restructuring & other charges (GE share) (148 ) — (473 ) — Adjusted Oil & Gas segment profit (Non-GAAP) $ 222 $ 120 85 % $ 402 $ 380 6 % Adjustments:
Acquisitions 121 — 242 — Business dispositions (other than dispositions acquired for investment) —
—
—
—
Currency exchange rate(a) 13 — 18 — Organic segment profit (Non-GAAP) $ 88 $ 120 (27 )% $ 142 $ 380 (63 )%
Reported Oil & Gas segment revenue (GAAP) $ 5,554 $ 2,997 85 % $ 10,939 $ 6,083 80 % Organic Oil & Gas segment revenue (Non-GAAP) $ 2,635 $ 2,997 (12 )% $ 5,301 $ 6,083 (13 )%
Reported Oil & Gas profit margins (GAAP) 1.3 % 4.0 % (2.7)pts (0.6 )% 6.2 % (6.8)pts Adjusted Oil & Gas profit margins (Non-GAAP) 4.0 % 4.0 % 0pts 3.7 % 6.2 % (2.5)pts Organic Oil & Gas profit margins (Non-GAAP) 3.3 % 4.0 % (0.7)pts 2.7 % 6.2 % (3.5)pts
(a) Translational foreign exchange Organic GE Oil & Gas segment profit * measures Oil & Gas adjusted segment profit excluding the effects acquisition, business disposition and
currency exchange rates. We believe that this measure provides management and investors with a more complete understanding of underlying operating results and trends of established, ongoing operations of our Oil & Gas segment by excluding the effect of Oil & Gas restructuring and other charges, the BHI acquisition and currency exchange rates which activities are subject to volatility and can obscure underlying trends.
GE INDUSTRIAL STRUCTURAL COSTS (NON-GAAP) Three months ended June 30 Six months ended June 30 (In millions) 2018 2017 V$ 2018 2017 V$ GE Industrial costs excluding interest and other financial charges and non-operating benefit costs (GAAP) $ 26,208
$ 24,950
$ 1,258
$ 51,234
$ 48,597
$ 2,636
Less: Segment variable costs 19,639 18,566 38,396 35,498 Less: Segment restructuring & other charges 241 13 521 25 Less: Segment acquisitions/dispositions structural costs and impact from foreign exchange 247
(327 ) 552
(703 )
Less: Corporate restructuring & other charges 496 709 827 1,682 Add: Corporate revenue (ex. GE-GE Capital eliminations), other income and noncontrolling interests (130 ) 363
310
785
Less: Corporate (gains) losses on disposals (309 ) — (243 ) (2 ) Less: Corporate unrealized (gains) losses (266 ) — (266 ) — GE Industrial structural costs (Non-GAAP) $ 6,031 $ 6,352 $ (322 ) $ 11,756 $ 12,882 $ (1,126 )
GE Industrial structural costs* includes segment structural costs excluding the impact of restructuring and other charges, business acquisitions and dispositions, foreign exchange, plus total Corporate operating profit excluding restructuring and other charges and gains. The Baker Hughes acquisition is represented on a pro-forma basis, which means we calculated our structural costs by including legacy Baker Hughes results for the three months and six months ended June 30, 2017. Segment variable costs are those costs within our industrial segments that vary with volume. The most significant variable costs would be material and direct labor costs incurred to produce our products and deliver our services that are recorded in the Statement of Earnings line items of cost of goods and cost of services sold. We believe that GE Industrial structural costs* is a meaningful measure as it is broader than selling, general and administrative costs and represents the total costs in the Industrial segments and Corporate that generally do not vary with volume and excludes the effect of segment acquisitions, dispositions, and foreign exchange movements.
*Non-GAAP Financial Measure
14
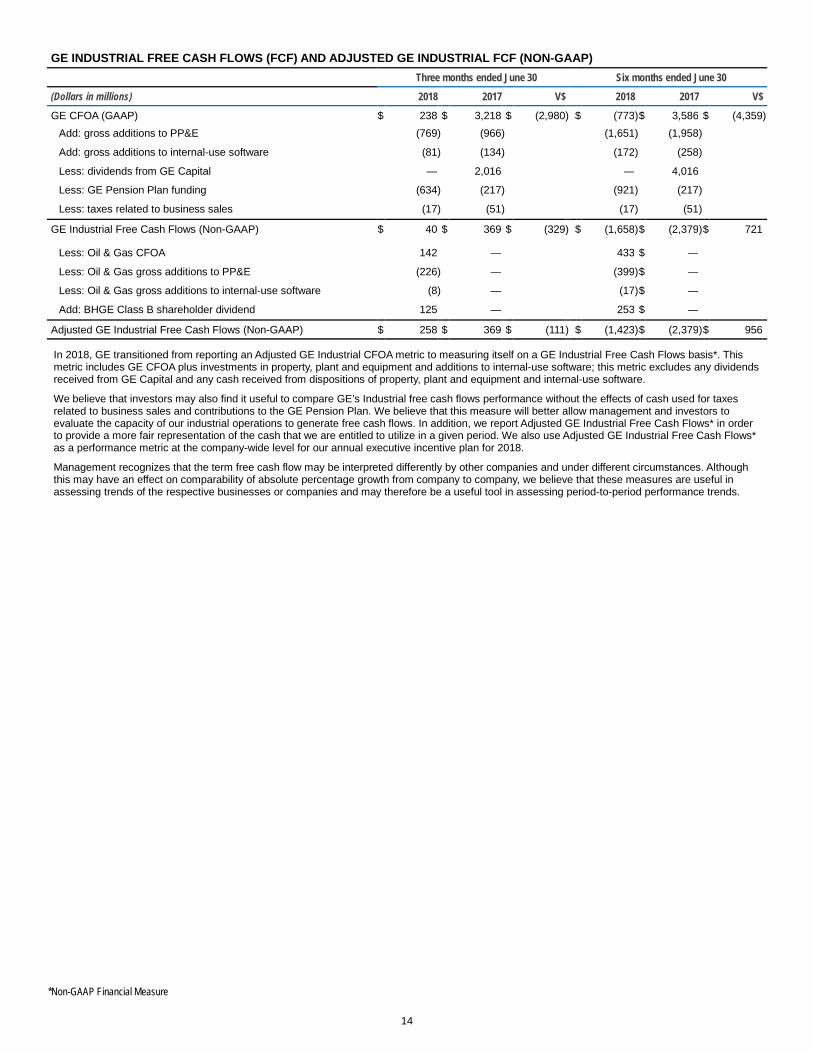
GE INDUSTRIAL FREE CASH FLOWS (FCF) AND ADJUSTED GE INDUSTRIAL FCF (NON-GAAP)
Three months ended June 30 Six months ended June 30
(Dollars in millions) 2018 2017 V$ 2018 2017 V$
GE CFOA (GAAP) $ 238 $ 3,218 $ (2,980 ) $ (773 ) $ 3,586 $ (4,359 ) Add: gross additions to PP&E (769 ) (966 ) (1,651 ) (1,958 ) Add: gross additions to internal-use software (81 ) (134 ) (172 ) (258 ) Less: dividends from GE Capital — 2,016 — 4,016 Less: GE Pension Plan funding (634 ) (217 ) (921 ) (217 ) Less: taxes related to business sales (17 ) (51 ) (17 ) (51 )
GE Industrial Free Cash Flows (Non-GAAP) $ 40 $ 369 $ (329 ) $ (1,658 ) $ (2,379 ) $ 721 Less: Oil & Gas CFOA 142 — 433 $ — Less: Oil & Gas gross additions to PP&E (226 ) — (399 ) $ — Less: Oil & Gas gross additions to internal-use software (8 ) — (17 ) $ — Add: BHGE Class B shareholder dividend 125 — 253 $ —
Adjusted GE Industrial Free Cash Flows (Non-GAAP) $ 258 $ 369 $ (111 ) $ (1,423 ) $ (2,379 ) $ 956 In 2018, GE transitioned from reporting an Adjusted GE Industrial CFOA metric to measuring itself on a GE Industrial Free Cash Flows basis*. This metric includes GE CFOA plus investments in property, plant and equipment and additions to internal-use software; this metric excludes any dividends received from GE Capital and any cash received from dispositions of property, plant and equipment and internal-use software.
We believe that investors may also find it useful to compare GE’s Industrial free cash flows performance without the effects of cash used for taxes related to business sales and contributions to the GE Pension Plan. We believe that this measure will better allow management and investors to evaluate the capacity of our industrial operations to generate free cash flows. In addition, we report Adjusted GE Industrial Free Cash Flows* in order to provide a more fair representation of the cash that we are entitled to utilize in a given period. We also use Adjusted GE Industrial Free Cash Flows* as a performance metric at the company-wide level for our annual executive incentive plan for 2018.
Management recognizes that the term free cash flow may be interpreted differently by other companies and under different circumstances. Although this may have an effect on comparability of absolute percentage growth from company to company, we believe that these measures are useful in assessing trends of the respective businesses or companies and may therefore be a useful tool in assessing period-to-period performance trends.
*Non-GAAP Financial Measure

15
Caution Concerning Forward Looking Statements: This document contains "forward-looking statements" - that is, statements related to future, not past, events. In this context, forward-looking statements often address our expected future business and financial performance and financial condition, and often contain words such as "expect," "anticipate," "intend," "plan," "believe," "seek," "see," "will," "would," “estimate,” “forecast,” "target," “preliminary,” or “range.” Forward-looking statements by their nature address matters that are, to different degrees, uncertain, such as statements about plans to maintain the GE dividend; statements about potential business or asset dispositions, including plans to separate GE Healthcare into a standalone company, the timing and structure for that separation, the characteristics of the business to be separated and the expected benefits to GE; plans to exit our equity ownership position in Baker Hughes, a GE Company (BHGE) and the expected benefits to GE; debt repayment plans; the benefits of the new GE operating system; divestiture proceeds expectations; GE and GE Capital liquidity; future corporate performance; leverage targets; future charges and capital contributions that may be required in connection with GE Capital’s run-off insurance operations and related GE Capital portfolio actions; revenues; organic growth; cash flows and cash conversion, including the impact of working capital, contract assets and pension funding contributions; earnings per share, including the impact of the new revenue recognition accounting standard and U.S. tax reform; growth and productivity associated with our Digital and Additive businesses; profit margins; cost structure and plans to reduce costs; restructuring, goodwill impairment or other financial charges; tax rates; transaction-related synergies, proceeds and gains; returns on capital and investment; capital allocation, including organic investment, dividends and other priorities; or capital structure and access to funding, including credit ratings and outlooks and debt-to-earnings ratios. For us, particular uncertainties that could cause our actual results to be materially different than those expressed in our forward-looking statements include:
• our success in executing and completing, including obtaining regulatory approvals and satisfying other closing conditions for, GE Industrial and GE Capital business or asset dispositions or other announced transactions, including our planned separation of GE Healthcare and dispositions of GE Transportation and BHGE, the pricing, timing, and anticipated proceeds from those or other transactions and potential trailing liabilities;
• GE’s liquidity and the amount and timing of our GE Industrial cash flows and earnings, which may be impacted by customer, competitive, contractual and other dynamics and conditions;
• our capital allocation plans, as such plans may change including with respect to the timing and amount of GE dividends, organic investments, including research and development, investments in Digital and capital expenditures, the repayment or allocation of our outstanding debt obligations, pension funding contributions, acquisitions, joint ventures and other strategic actions;
• our ability to maintain our current short- and long-term credit ratings and the impact on our funding costs and competitive position if we do not do so;
• customer actions or market developments such as reduced demand for equipment and services and other challenges in our Power business, other shifts in the competitive landscape for our products and services, changes in economic conditions, including oil prices, early aircraft retirements and other factors that may affect the level of demand and financial performance of the major industries and customers we serve;
• changes in law, economic and financial conditions, including the effect of enactment of U.S. tax reform or other tax law changes, trade policy and tariffs, interest and exchange rate volatility, commodity and equity prices and the value of financial assets;
• GE Capital's capital and liquidity needs, including in connection with GE Capital’s run-off insurance operations and related strategic actions that we may pursue, the impact of conditions in the financial and credit markets on GE Capital's ability to sell financial assets, GE Capital’s leverage and credit ratings, the availability and cost of GE Capital funding and GE Capital's exposure to counterparties;
• pending and future mortgage loan repurchase claims, other litigation claims and the U.S. Department of Justice's investigation under the Financial Institutions Reform, Recovery and Enforcement Act of 1989 and other investigations in connection with WMC, which may affect our estimates of liability, including possible loss estimates;
• our ability to launch new products in a cost-effective manner; • our ability to increase margins through implementation of the new GE operating system, restructuring and other cost
reduction measures; • our ability to convert pre-order commitments/wins into orders/bookings, and the price we realize on orders/bookings
since commitments/wins are stated at list prices; • the impact of regulation and regulatory, investigative and legal proceedings and legal compliance risks, including the
impact of WMC, Alstom, SEC and other investigative and legal proceedings; • our success in integrating acquired businesses and operating joint ventures, and our ability to realize revenue and
cost synergies from announced transactions, acquired businesses and joint ventures, including Alstom and BHGE; • the impact of potential product safety failures and related reputational effects; • the impact of potential information technology, cybersecurity or data security breaches; • the other factors that are described in "Forward-Looking Statements" in BHGE’s most recent earnings release or SEC
filings; and • the other factors that are described in "Risk Factors" in our Annual Report on Form 10-K for the year ended
December 31, 2017. These or other uncertainties may cause our actual future results to be materially different than those expressed in our forward-looking statements. We do not undertake to update our forward-looking statements.

16
Our public communications and SEC filings may include certain forward-looking projected financial information that is based on current estimates and forecasts. Actual results could differ materially. General Electric Capital Corporation (GECC) has been merged into GE and our financial services business is now operated by GE Capital Global Holdings, LLC (GECGH). In our public communications and SEC filings, we refer to GECC and GECGH as “GE Capital”. We refer to the industrial businesses of the Company including GE Capital on an equity basis as “GE”. “GE (ex-GE Capital)” and /or “Industrial” refer to GE excluding GE Capital. Our financial services segment previously referred to as GE Capital is now referred to as Capital. GE’s Investor Relations website at www.ge.com/investor and our corporate blog at www.ge.com/reports, as well as GE’s Facebook page and Twitter accounts, contain a significant amount of information about GE, including financial and other information for investors. GE encourages investors to visit these websites from time to time, as information is updated and new information is posted. Supplemental Financial Information Supplemental financial information can be found on the Company’s website at: ge.com/investor under Events and Reports. Conference Call and Webcast The Company has scheduled an investor conference call to discuss management’s outlook and the results reported in today’s earnings announcement. The call will begin at 8:30 a.m. Eastern time, on Friday, July 20, 2018, the content of which is not part of this earnings release. A slide presentation providing summary financial and statistical information that will be discussed on the call will also be posted to the Company’s website and available for real-time viewing at www.ge.com/investor. The conference call will be broadcast live via a webcast and can be accessed by visiting the Events and Reports page on the Company’s website at: www.ge.com/investor. An archived version of the webcast will be available on the website after the call. About GE GE (NYSE:GE) drives the world forward by tackling its biggest challenges: Energy, health, transportation—the essentials of modern life. By combining world-class engineering with software and analytics, GE helps the world work more efficiently, reliably, and safely. For more than 125 years, GE has invented the future of industry, and today it leads new paradigms in additive manufacturing, materials science, and data analytics. GE people are global, diverse and dedicated, operating with the highest integrity and passion to fulfill GE’s mission and deliver for our customers. www.ge.com GE Investor Contacts: Matt Cribbins, 617.443.3400 [email protected] Todd Ernst, 617.443.3450 [email protected] GE Media Contact: Jennifer Erickson, 646.682.5620 [email protected]