Embed Size (px)
Citation preview
GE Investments Funds, Inc.
Small-Cap Equity Fund
Semi-Annual ReportJune 30, 2016
GE Investments Funds, Inc.Small-Cap Equity Fund
Table of Contents
Fund Information . . . . . . . . . . . . . . . . . . . . . . . . . . . . . . . . . . . . . . . . . . . . . . . . . . . . . . . . . . . . . . . . . . . . . . . . . . . . . . . . . 1
Understanding Your Fund’s Expenses . . . . . . . . . . . . . . . . . . . . . . . . . . . . . . . . . . . . . . . . . . . . . . . . . . . . . . . . . . . . . . 2
Schedule of Investments . . . . . . . . . . . . . . . . . . . . . . . . . . . . . . . . . . . . . . . . . . . . . . . . . . . . . . . . . . . . . . . . . . . . . . . . . . . 3
Notes to Schedule of Investments . . . . . . . . . . . . . . . . . . . . . . . . . . . . . . . . . . . . . . . . . . . . . . . . . . . . . . . . . . . . . . . . . 10
Financial Statements
Financial Highlights . . . . . . . . . . . . . . . . . . . . . . . . . . . . . . . . . . . . . . . . . . . . . . . . . . . . . . . . . . . . . . . . . . . . . . . . . . . . . . . . . . . . . . . . . . . . . . . . . . . . 11
Statement of Assets and Liabilities . . . . . . . . . . . . . . . . . . . . . . . . . . . . . . . . . . . . . . . . . . . . . . . . . . . . . . . . . . . . . . . . . . . . . . . . . . . . . . . . . . . . . . 12
Statement of Operations . . . . . . . . . . . . . . . . . . . . . . . . . . . . . . . . . . . . . . . . . . . . . . . . . . . . . . . . . . . . . . . . . . . . . . . . . . . . . . . . . . . . . . . . . . . . . . . 13
Statements of Changes in Net Assets . . . . . . . . . . . . . . . . . . . . . . . . . . . . . . . . . . . . . . . . . . . . . . . . . . . . . . . . . . . . . . . . . . . . . . . . . . . . . . . . . . . . 14
Notes to Financial Statements . . . . . . . . . . . . . . . . . . . . . . . . . . . . . . . . . . . . . . . . . . . . . . . . . . . . . . . . . . . . . . . . . . . . . . . . . . . . . . . . . . . . . . . . . . 15
Advisory and Administrative Agreement Approval . . . . . . . . . . . . . . . . . . . . . . . . . . . . . . . . . . . . . . . . . . . . . . . . . . 21
Sub-Advisory Agreement Approval . . . . . . . . . . . . . . . . . . . . . . . . . . . . . . . . . . . . . . . . . . . . . . . . . . . . . . . . . . . . . . . . . 24
Special Meeting of Shareholders - Voting Results . . . . . . . . . . . . . . . . . . . . . . . . . . . . . . . . . . . . . . . . . . . . . . . . . . . 27
Additional Information . . . . . . . . . . . . . . . . . . . . . . . . . . . . . . . . . . . . . . . . . . . . . . . . . . . . . . . . . . . . . . . . . . . . . . . . . . . . 30
Investment Team . . . . . . . . . . . . . . . . . . . . . . . . . . . . . . . . . . . . . . . . . . . . . . . . . . . . . . . . . . . . . . . . . . . . . . . . . . . . . . . . . 32
This report is prepared for Policyholders of certain variable contracts and may be distributed to others only if preceded or accompaniedby the variable contract’s current prospectus and the current summary prospectus of the Fund available for investments thereunder.
Small-Cap Equity Fund (Unaudited)
Fund Information
Notes to Performance
Total return performance shown in this report for the GE Investments Small-Cap Equity Fund (the “Fund”) takes into account changesin share price and assumes reinvestment of dividends and capital gains distributions, if any. Total returns shown are net of Fund feesand expenses but do not reflect fees and charges associated with the variable contracts such as administrative fees, account chargesand surrender charges, which, if reflected, would reduce the Fund’s total returns for all periods shown.
The performance data quoted represents past performance; past performance does not guarantee future results. Investment returnand principal value will fluctuate so your shares, when redeemed, may be worth more or less than their original cost. Currentperformance may be higher or lower than the performance data quoted. Periods less than one year are not annualized. Please call800-242-0134 or visit the Fund’s website at http://www.geam.com for the most recent month-end performance data.
An investment in the Fund is not a deposit of any bank and is not insured or guaranteed by the Federal Deposit Insurance Corporation(“FDIC”) or any other government agency. An investment in the Fund is subject to risk, including possible loss of principal invested.
Investment Profile
A mutual fund designed for investors who seek long-term growth of capital. The Fund seeks to achieve its investment objective byinvesting at least 80% of its net assets under normal circumstances in equity securities of small-cap companies, such as common andpreferred stocks. The Fund uses a multi-sub-adviser investment strategy that combines growth, value and core investmentmanagement styles. This orientation will typically produce a portfolio that does not materially favor value or growth style investing,and allows the Fund the potential to benefit from both value and growth cycles in the marketplace.
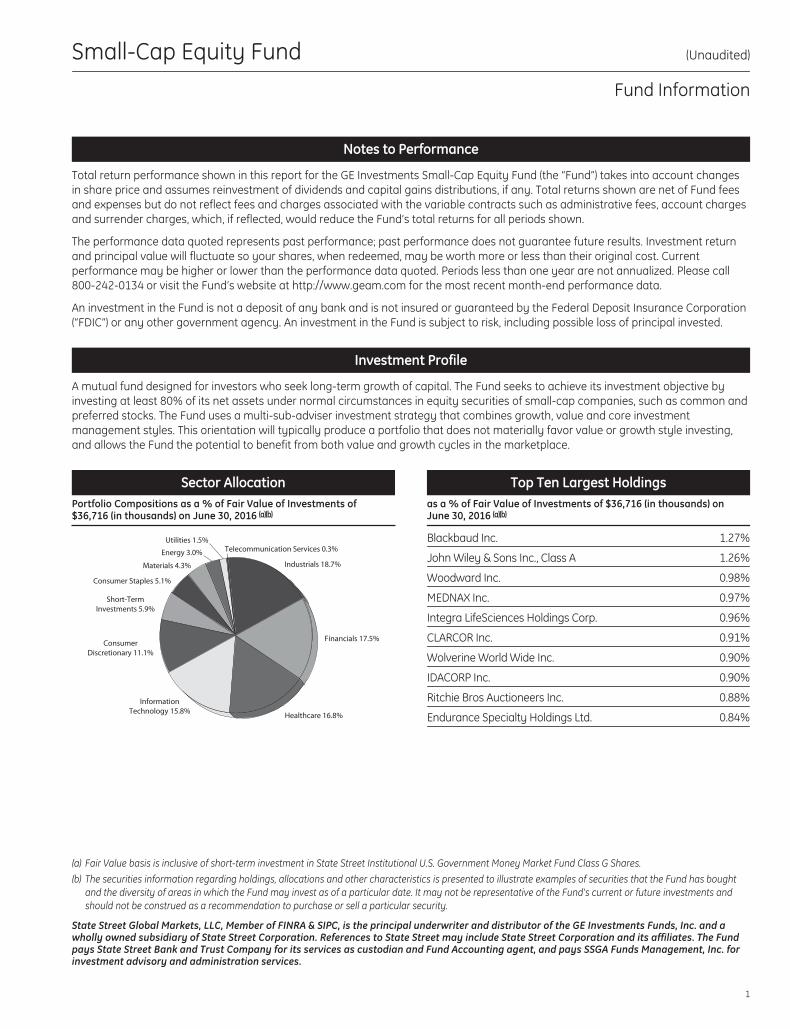
Sector AllocationPortfolio Compositions as a % of Fair Value of Investments of$36,716 (in thousands) on June 30, 2016 (a)(b)
Industrials 18.7%
Financials 17.5%
Healthcare 16.8%
InformationTechnology 15.8%
ConsumerDiscretionary 11.1%
Short-TermInvestments 5.9%
Consumer Staples 5.1%
Materials 4.3%
Energy 3.0%
Utilities 1.5%Telecommunication Services 0.3%
Top Ten Largest Holdingsas a % of Fair Value of Investments of $36,716 (in thousands) onJune 30, 2016 (a)(b)
Blackbaud Inc. 1.27%
John Wiley & Sons Inc., Class A 1.26%
Woodward Inc. 0.98%
MEDNAX Inc. 0.97%
Integra LifeSciences Holdings Corp. 0.96%
CLARCOR Inc. 0.91%
Wolverine World Wide Inc. 0.90%
IDACORP Inc. 0.90%
Ritchie Bros Auctioneers Inc. 0.88%
Endurance Specialty Holdings Ltd. 0.84%
(a) Fair Value basis is inclusive of short-term investment in State Street Institutional U.S. Government Money Market Fund Class G Shares.
(b) The securities information regarding holdings, allocations and other characteristics is presented to illustrate examples of securities that the Fund has boughtand the diversity of areas in which the Fund may invest as of a particular date. It may not be representative of the Fund’s current or future investments andshould not be construed as a recommendation to purchase or sell a particular security.
State Street Global Markets, LLC, Member of FINRA & SIPC, is the principal underwriter and distributor of the GE Investments Funds, Inc. and awholly owned subsidiary of State Street Corporation. References to State Street may include State Street Corporation and its affiliates. The Fundpays State Street Bank and Trust Company for its services as custodian and Fund Accounting agent, and pays SSGA Funds Management, Inc. forinvestment advisory and administration services.
1
Small-Cap Equity Fund (Unaudited)
Understanding Your Fund’s Expenses
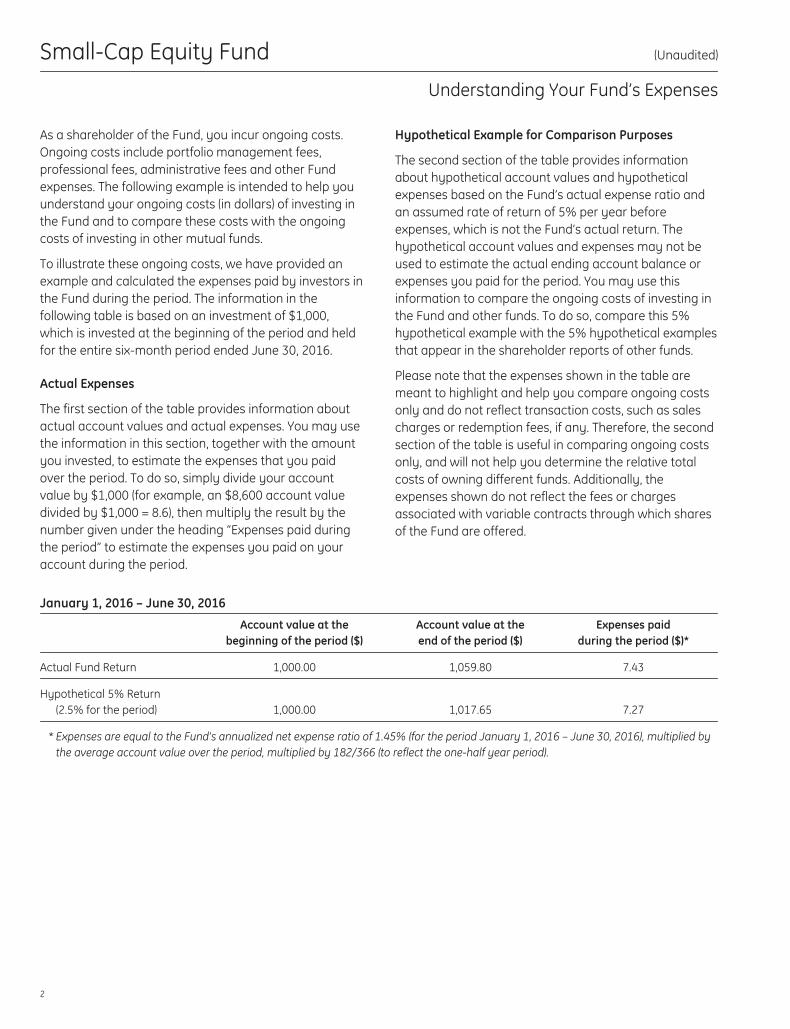
As a shareholder of the Fund, you incur ongoing costs.Ongoing costs include portfolio management fees,professional fees, administrative fees and other Fundexpenses. The following example is intended to help youunderstand your ongoing costs (in dollars) of investing inthe Fund and to compare these costs with the ongoingcosts of investing in other mutual funds.
To illustrate these ongoing costs, we have provided anexample and calculated the expenses paid by investors inthe Fund during the period. The information in thefollowing table is based on an investment of $1,000,which is invested at the beginning of the period and heldfor the entire six-month period ended June 30, 2016.
Actual Expenses
The first section of the table provides information aboutactual account values and actual expenses. You may usethe information in this section, together with the amountyou invested, to estimate the expenses that you paidover the period. To do so, simply divide your accountvalue by $1,000 (for example, an $8,600 account valuedivided by $1,000 = 8.6), then multiply the result by thenumber given under the heading “Expenses paid duringthe period” to estimate the expenses you paid on youraccount during the period.
Hypothetical Example for Comparison Purposes
The second section of the table provides informationabout hypothetical account values and hypotheticalexpenses based on the Fund’s actual expense ratio andan assumed rate of return of 5% per year beforeexpenses, which is not the Fund’s actual return. Thehypothetical account values and expenses may not beused to estimate the actual ending account balance orexpenses you paid for the period. You may use thisinformation to compare the ongoing costs of investing inthe Fund and other funds. To do so, compare this 5%hypothetical example with the 5% hypothetical examplesthat appear in the shareholder reports of other funds.
Please note that the expenses shown in the table aremeant to highlight and help you compare ongoing costsonly and do not reflect transaction costs, such as salescharges or redemption fees, if any. Therefore, the secondsection of the table is useful in comparing ongoing costsonly, and will not help you determine the relative totalcosts of owning different funds. Additionally, theexpenses shown do not reflect the fees or chargesassociated with variable contracts through which sharesof the Fund are offered.
January 1, 2016 – June 30, 2016
Account value at thebeginning of the period ($)
Account value at theend of the period ($)
Expenses paidduring the period ($)*
Actual Fund Return 1,000.00 1,059.80 7.43
Hypothetical 5% Return(2.5% for the period) 1,000.00 1,017.65 7.27
* Expenses are equal to the Fund’s annualized net expense ratio of 1.45% (for the period January 1, 2016 – June 30, 2016), multiplied bythe average account value over the period, multiplied by 182/366 (to reflect the one-half year period).
2
Small-Cap Equity Fund
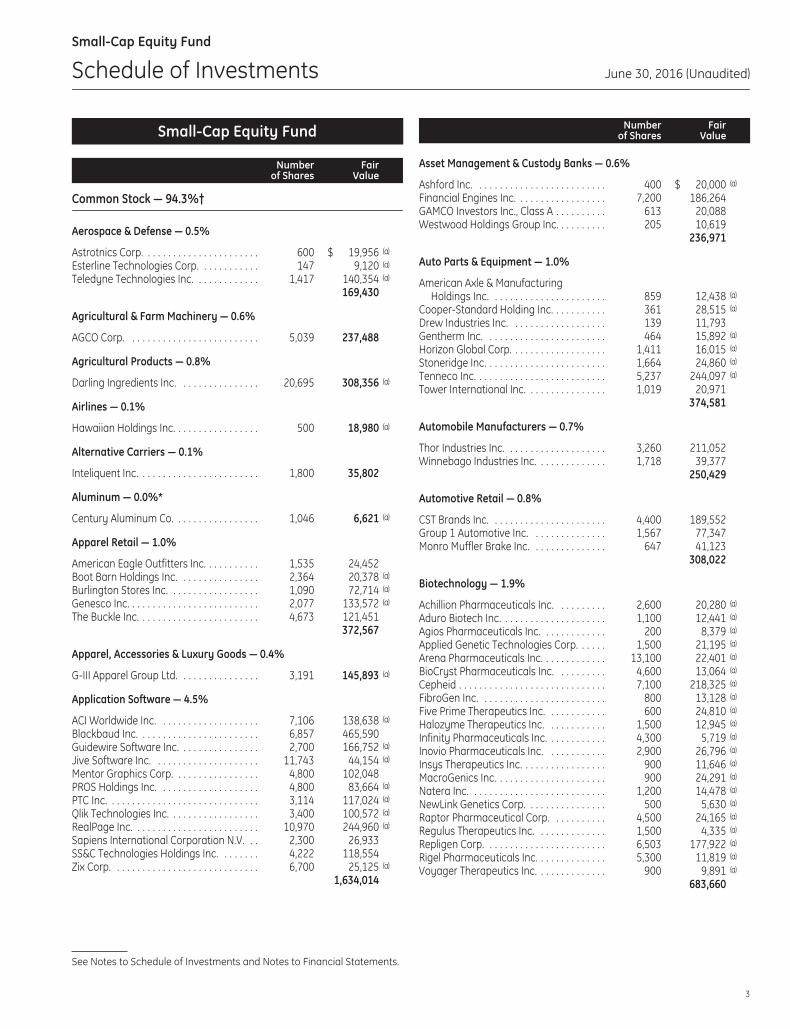
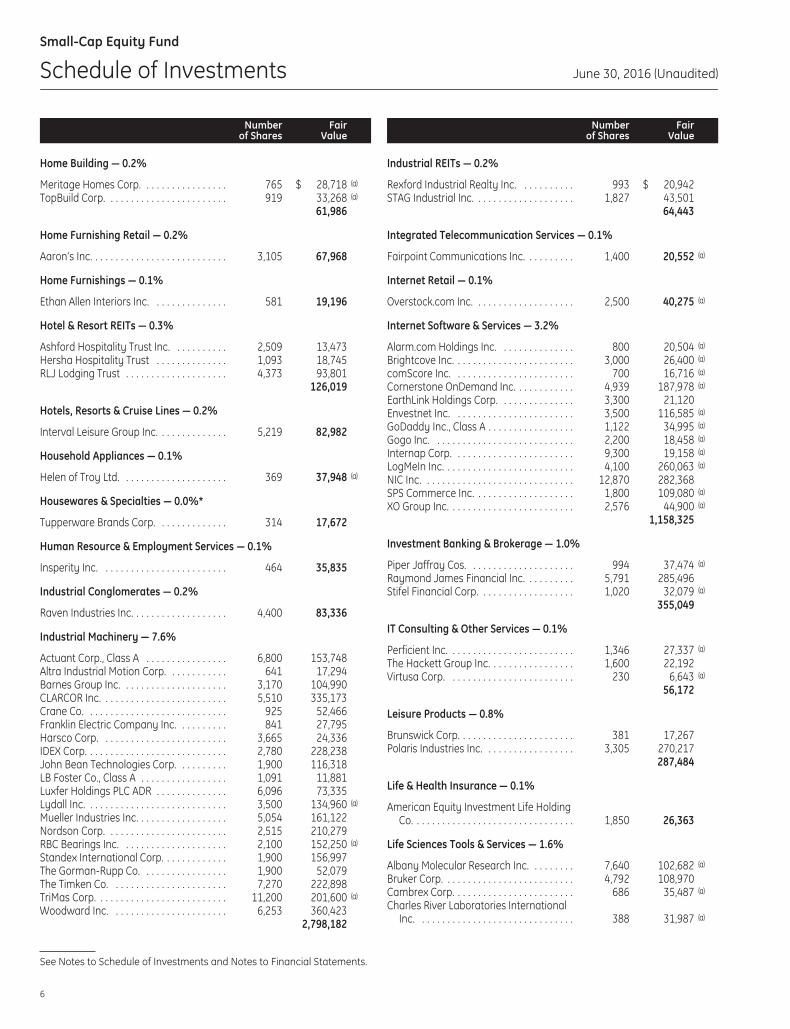
Schedule of Investments June 30, 2016 (Unaudited)
Small-Cap Equity Fund
Numberof Shares
FairValue
Common Stock — 94.3%†
Aerospace & Defense — 0.5%
Astrotnics Corp. . . . . . . . . . . . . . . . . . . . . . . 600 $ 19,956 (a)
Esterline Technologies Corp. . . . . . . . . . . . 147 9,120 (a)
Teledyne Technologies Inc. . . . . . . . . . . . . 1,417 140,354 (a)
169,430
Agricultural & Farm Machinery — 0.6%
AGCO Corp. . . . . . . . . . . . . . . . . . . . . . . . . . 5,039 237,488
Agricultural Products — 0.8%
Darling Ingredients Inc. . . . . . . . . . . . . . . . 20,695 308,356 (a)
Airlines — 0.1%
Hawaiian Holdings Inc. . . . . . . . . . . . . . . . . 500 18,980 (a)
Alternative Carriers — 0.1%
Inteliquent Inc. . . . . . . . . . . . . . . . . . . . . . . . 1,800 35,802
Aluminum — 0.0%*
Century Aluminum Co. . . . . . . . . . . . . . . . . 1,046 6,621 (a)
Apparel Retail — 1.0%
American Eagle Outfitters Inc. . . . . . . . . . . 1,535 24,452Boot Barn Holdings Inc. . . . . . . . . . . . . . . . 2,364 20,378 (a)
Burlington Stores Inc. . . . . . . . . . . . . . . . . . 1,090 72,714 (a)
Genesco Inc. . . . . . . . . . . . . . . . . . . . . . . . . . 2,077 133,572 (a)
The Buckle Inc. . . . . . . . . . . . . . . . . . . . . . . . 4,673 121,451372,567
Apparel, Accessories & Luxury Goods — 0.4%
G-III Apparel Group Ltd. . . . . . . . . . . . . . . . 3,191 145,893 (a)
Application Software — 4.5%
ACI Worldwide Inc. . . . . . . . . . . . . . . . . . . . 7,106 138,638 (a)
Blackbaud Inc. . . . . . . . . . . . . . . . . . . . . . . . 6,857 465,590Guidewire Software Inc. . . . . . . . . . . . . . . . 2,700 166,752 (a)
Jive Software Inc. . . . . . . . . . . . . . . . . . . . . 11,743 44,154 (a)
Mentor Graphics Corp. . . . . . . . . . . . . . . . . 4,800 102,048PROS Holdings Inc. . . . . . . . . . . . . . . . . . . . 4,800 83,664 (a)
PTC Inc. . . . . . . . . . . . . . . . . . . . . . . . . . . . . . 3,114 117,024 (a)
Qlik Technologies Inc. . . . . . . . . . . . . . . . . . 3,400 100,572 (a)
RealPage Inc. . . . . . . . . . . . . . . . . . . . . . . . . 10,970 244,960 (a)
Sapiens International Corporation N.V. . . 2,300 26,933SS&C Technologies Holdings Inc. . . . . . . . 4,222 118,554Zix Corp. . . . . . . . . . . . . . . . . . . . . . . . . . . . . 6,700 25,125 (a)
1,634,014
Numberof Shares
FairValue
Asset Management & Custody Banks — 0.6%
Ashford Inc. . . . . . . . . . . . . . . . . . . . . . . . . . 400 $ 20,000 (a)
Financial Engines Inc. . . . . . . . . . . . . . . . . . 7,200 186,264GAMCO Investors Inc., Class A . . . . . . . . . . 613 20,088Westwood Holdings Group Inc. . . . . . . . . . 205 10,619
236,971
Auto Parts & Equipment — 1.0%
American Axle & ManufacturingHoldings Inc. . . . . . . . . . . . . . . . . . . . . . . 859 12,438 (a)
Cooper-Standard Holding Inc. . . . . . . . . . . 361 28,515 (a)
Drew Industries Inc. . . . . . . . . . . . . . . . . . . 139 11,793Gentherm Inc. . . . . . . . . . . . . . . . . . . . . . . . 464 15,892 (a)
Horizon Global Corp. . . . . . . . . . . . . . . . . . . 1,411 16,015 (a)
Stoneridge Inc. . . . . . . . . . . . . . . . . . . . . . . . 1,664 24,860 (a)
Tenneco Inc. . . . . . . . . . . . . . . . . . . . . . . . . . 5,237 244,097 (a)
Tower International Inc. . . . . . . . . . . . . . . . 1,019 20,971374,581
Automobile Manufacturers — 0.7%
Thor Industries Inc. . . . . . . . . . . . . . . . . . . . 3,260 211,052Winnebago Industries Inc. . . . . . . . . . . . . . 1,718 39,377
250,429
Automotive Retail — 0.8%
CST Brands Inc. . . . . . . . . . . . . . . . . . . . . . . 4,400 189,552Group 1 Automotive Inc. . . . . . . . . . . . . . . 1,567 77,347Monro Muffler Brake Inc. . . . . . . . . . . . . . . 647 41,123
308,022
Biotechnology — 1.9%
Achillion Pharmaceuticals Inc. . . . . . . . . . 2,600 20,280 (a)
Aduro Biotech Inc. . . . . . . . . . . . . . . . . . . . . 1,100 12,441 (a)
Agios Pharmaceuticals Inc. . . . . . . . . . . . . 200 8,379 (a)
Applied Genetic Technologies Corp. . . . . . 1,500 21,195 (a)
Arena Pharmaceuticals Inc. . . . . . . . . . . . . 13,100 22,401 (a)
BioCryst Pharmaceuticals Inc. . . . . . . . . . 4,600 13,064 (a)
Cepheid . . . . . . . . . . . . . . . . . . . . . . . . . . . . . 7,100 218,325 (a)
FibroGen Inc. . . . . . . . . . . . . . . . . . . . . . . . . 800 13,128 (a)
Five Prime Therapeutics Inc. . . . . . . . . . . . 600 24,810 (a)
Halozyme Therapeutics Inc. . . . . . . . . . . . 1,500 12,945 (a)
Infinity Pharmaceuticals Inc. . . . . . . . . . . . 4,300 5,719 (a)
Inovio Pharmaceuticals Inc. . . . . . . . . . . . 2,900 26,796 (a)
Insys Therapeutics Inc. . . . . . . . . . . . . . . . . 900 11,646 (a)
MacroGenics Inc. . . . . . . . . . . . . . . . . . . . . . 900 24,291 (a)
Natera Inc. . . . . . . . . . . . . . . . . . . . . . . . . . . 1,200 14,478 (a)
NewLink Genetics Corp. . . . . . . . . . . . . . . . 500 5,630 (a)
Raptor Pharmaceutical Corp. . . . . . . . . . . 4,500 24,165 (a)
Regulus Therapeutics Inc. . . . . . . . . . . . . . 1,500 4,335 (a)
Repligen Corp. . . . . . . . . . . . . . . . . . . . . . . . 6,503 177,922 (a)
Rigel Pharmaceuticals Inc. . . . . . . . . . . . . . 5,300 11,819 (a)
Voyager Therapeutics Inc. . . . . . . . . . . . . . 900 9,891 (a)
683,660
See Notes to Schedule of Investments and Notes to Financial Statements.
3
Small-Cap Equity Fund
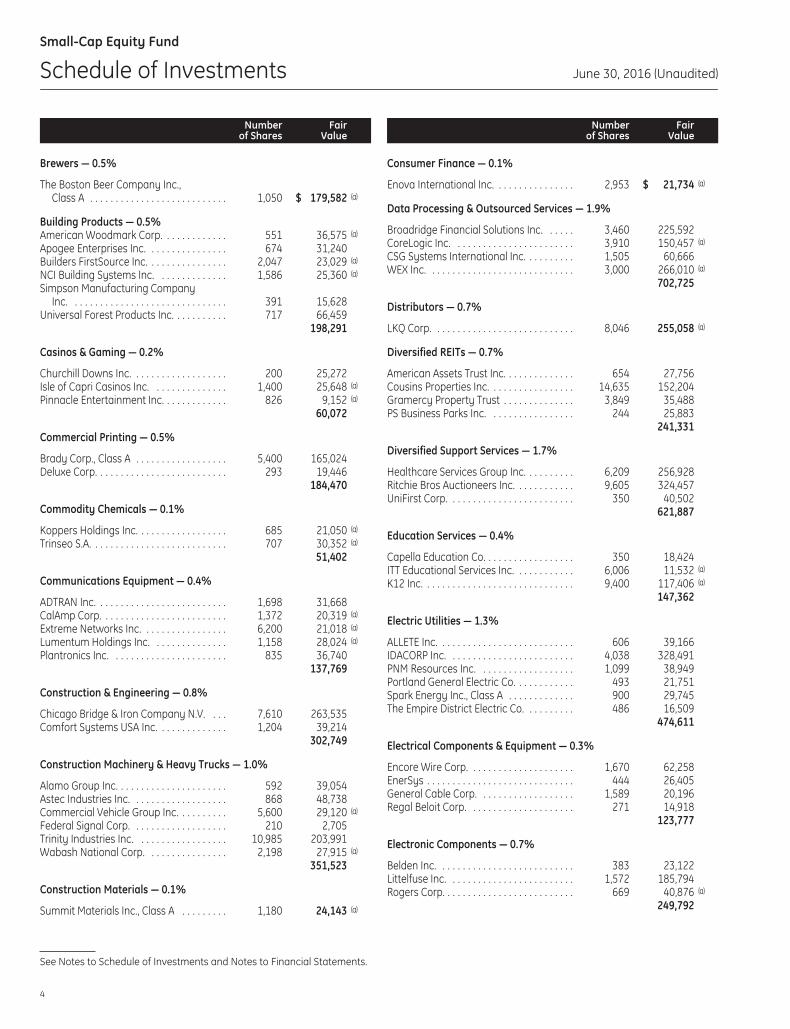
Schedule of Investments June 30, 2016 (Unaudited)
Numberof Shares
FairValue
Brewers — 0.5%
The Boston Beer Company Inc.,Class A . . . . . . . . . . . . . . . . . . . . . . . . . . . 1,050 $ 179,582 (a)
Building Products — 0.5%American Woodmark Corp. . . . . . . . . . . . . 551 36,575 (a)
Apogee Enterprises Inc. . . . . . . . . . . . . . . . 674 31,240Builders FirstSource Inc. . . . . . . . . . . . . . . . 2,047 23,029 (a)
NCI Building Systems Inc. . . . . . . . . . . . . . 1,586 25,360 (a)
Simpson Manufacturing CompanyInc. . . . . . . . . . . . . . . . . . . . . . . . . . . . . . . 391 15,628
Universal Forest Products Inc. . . . . . . . . . . 717 66,459198,291
Casinos & Gaming — 0.2%
Churchill Downs Inc. . . . . . . . . . . . . . . . . . . 200 25,272Isle of Capri Casinos Inc. . . . . . . . . . . . . . . 1,400 25,648 (a)
Pinnacle Entertainment Inc. . . . . . . . . . . . . 826 9,152 (a)
60,072
Commercial Printing — 0.5%
Brady Corp., Class A . . . . . . . . . . . . . . . . . . 5,400 165,024Deluxe Corp. . . . . . . . . . . . . . . . . . . . . . . . . . 293 19,446
184,470
Commodity Chemicals — 0.1%
Koppers Holdings Inc. . . . . . . . . . . . . . . . . . 685 21,050 (a)
Trinseo S.A. . . . . . . . . . . . . . . . . . . . . . . . . . . 707 30,352 (a)
51,402
Communications Equipment — 0.4%
ADTRAN Inc. . . . . . . . . . . . . . . . . . . . . . . . . . 1,698 31,668CalAmp Corp. . . . . . . . . . . . . . . . . . . . . . . . . 1,372 20,319 (a)
Extreme Networks Inc. . . . . . . . . . . . . . . . . 6,200 21,018 (a)
Lumentum Holdings Inc. . . . . . . . . . . . . . . 1,158 28,024 (a)
Plantronics Inc. . . . . . . . . . . . . . . . . . . . . . . 835 36,740137,769
Construction & Engineering — 0.8%
Chicago Bridge & Iron Company N.V. . . . 7,610 263,535Comfort Systems USA Inc. . . . . . . . . . . . . . 1,204 39,214
302,749
Construction Machinery & Heavy Trucks — 1.0%
Alamo Group Inc. . . . . . . . . . . . . . . . . . . . . . 592 39,054Astec Industries Inc. . . . . . . . . . . . . . . . . . . 868 48,738Commercial Vehicle Group Inc. . . . . . . . . . 5,600 29,120 (a)
Federal Signal Corp. . . . . . . . . . . . . . . . . . . 210 2,705Trinity Industries Inc. . . . . . . . . . . . . . . . . . 10,985 203,991Wabash National Corp. . . . . . . . . . . . . . . . 2,198 27,915 (a)
351,523
Construction Materials — 0.1%
Summit Materials Inc., Class A . . . . . . . . . 1,180 24,143 (a)
Numberof Shares
FairValue
Consumer Finance — 0.1%
Enova International Inc. . . . . . . . . . . . . . . . 2,953 $ 21,734 (a)
Data Processing & Outsourced Services — 1.9%
Broadridge Financial Solutions Inc. . . . . . 3,460 225,592CoreLogic Inc. . . . . . . . . . . . . . . . . . . . . . . . 3,910 150,457 (a)
CSG Systems International Inc. . . . . . . . . . 1,505 60,666WEX Inc. . . . . . . . . . . . . . . . . . . . . . . . . . . . . 3,000 266,010 (a)
702,725
Distributors — 0.7%
LKQ Corp. . . . . . . . . . . . . . . . . . . . . . . . . . . . 8,046 255,058 (a)
Diversified REITs — 0.7%
American Assets Trust Inc. . . . . . . . . . . . . . 654 27,756Cousins Properties Inc. . . . . . . . . . . . . . . . . 14,635 152,204Gramercy Property Trust . . . . . . . . . . . . . . 3,849 35,488PS Business Parks Inc. . . . . . . . . . . . . . . . . 244 25,883
241,331
Diversified Support Services — 1.7%
Healthcare Services Group Inc. . . . . . . . . . 6,209 256,928Ritchie Bros Auctioneers Inc. . . . . . . . . . . . 9,605 324,457UniFirst Corp. . . . . . . . . . . . . . . . . . . . . . . . . 350 40,502
621,887
Education Services — 0.4%
Capella Education Co. . . . . . . . . . . . . . . . . . 350 18,424ITT Educational Services Inc. . . . . . . . . . . . 6,006 11,532 (a)
K12 Inc. . . . . . . . . . . . . . . . . . . . . . . . . . . . . . 9,400 117,406 (a)
147,362
Electric Utilities — 1.3%
ALLETE Inc. . . . . . . . . . . . . . . . . . . . . . . . . . . 606 39,166IDACORP Inc. . . . . . . . . . . . . . . . . . . . . . . . . 4,038 328,491PNM Resources Inc. . . . . . . . . . . . . . . . . . . 1,099 38,949Portland General Electric Co. . . . . . . . . . . . 493 21,751Spark Energy Inc., Class A . . . . . . . . . . . . . 900 29,745The Empire District Electric Co. . . . . . . . . . 486 16,509
474,611
Electrical Components & Equipment — 0.3%
Encore Wire Corp. . . . . . . . . . . . . . . . . . . . . 1,670 62,258EnerSys . . . . . . . . . . . . . . . . . . . . . . . . . . . . . 444 26,405General Cable Corp. . . . . . . . . . . . . . . . . . . 1,589 20,196Regal Beloit Corp. . . . . . . . . . . . . . . . . . . . . 271 14,918
123,777
Electronic Components — 0.7%
Belden Inc. . . . . . . . . . . . . . . . . . . . . . . . . . . 383 23,122Littelfuse Inc. . . . . . . . . . . . . . . . . . . . . . . . . 1,572 185,794Rogers Corp. . . . . . . . . . . . . . . . . . . . . . . . . . 669 40,876 (a)
249,792
See Notes to Schedule of Investments and Notes to Financial Statements.
4
Small-Cap Equity Fund
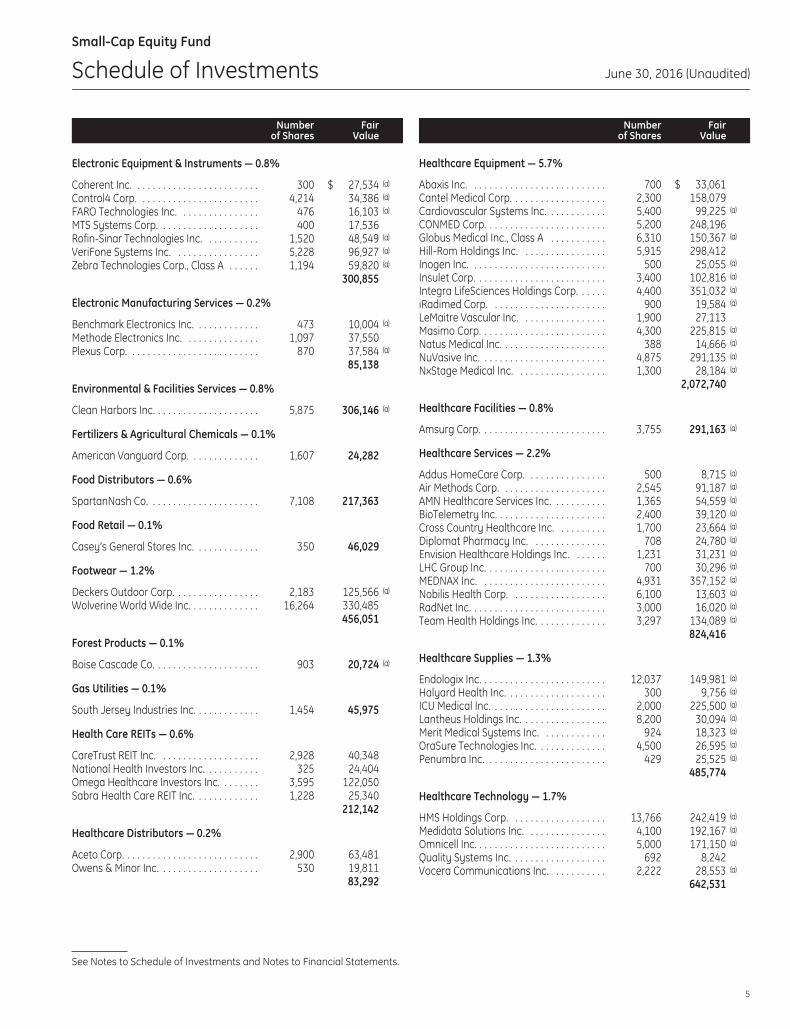
Schedule of Investments June 30, 2016 (Unaudited)
Numberof Shares
FairValue
Electronic Equipment & Instruments — 0.8%
Coherent Inc. . . . . . . . . . . . . . . . . . . . . . . . . 300 $ 27,534 (a)
Control4 Corp. . . . . . . . . . . . . . . . . . . . . . . . 4,214 34,386 (a)
FARO Technologies Inc. . . . . . . . . . . . . . . . 476 16,103 (a)
MTS Systems Corp. . . . . . . . . . . . . . . . . . . . 400 17,536Rofin-Sinar Technologies Inc. . . . . . . . . . . 1,520 48,549 (a)
VeriFone Systems Inc. . . . . . . . . . . . . . . . . 5,228 96,927 (a)
Zebra Technologies Corp., Class A . . . . . . 1,194 59,820 (a)
300,855
Electronic Manufacturing Services — 0.2%
Benchmark Electronics Inc. . . . . . . . . . . . . 473 10,004 (a)
Methode Electronics Inc. . . . . . . . . . . . . . . 1,097 37,550Plexus Corp. . . . . . . . . . . . . . . . . . . . . . . . . . 870 37,584 (a)
85,138
Environmental & Facilities Services — 0.8%
Clean Harbors Inc. . . . . . . . . . . . . . . . . . . . . 5,875 306,146 (a)
Fertilizers & Agricultural Chemicals — 0.1%
American Vanguard Corp. . . . . . . . . . . . . . 1,607 24,282
Food Distributors — 0.6%
SpartanNash Co. . . . . . . . . . . . . . . . . . . . . . 7,108 217,363
Food Retail — 0.1%
Casey’s General Stores Inc. . . . . . . . . . . . . 350 46,029
Footwear — 1.2%
Deckers Outdoor Corp. . . . . . . . . . . . . . . . . 2,183 125,566 (a)
Wolverine World Wide Inc. . . . . . . . . . . . . . 16,264 330,485456,051
Forest Products — 0.1%
Boise Cascade Co. . . . . . . . . . . . . . . . . . . . . 903 20,724 (a)
Gas Utilities — 0.1%
South Jersey Industries Inc. . . . . . . . . . . . . 1,454 45,975
Health Care REITs — 0.6%
CareTrust REIT Inc. . . . . . . . . . . . . . . . . . . . 2,928 40,348National Health Investors Inc. . . . . . . . . . . 325 24,404Omega Healthcare Investors Inc. . . . . . . . 3,595 122,050Sabra Health Care REIT Inc. . . . . . . . . . . . . 1,228 25,340
212,142
Healthcare Distributors — 0.2%
Aceto Corp. . . . . . . . . . . . . . . . . . . . . . . . . . . 2,900 63,481Owens & Minor Inc. . . . . . . . . . . . . . . . . . . . 530 19,811
83,292
Numberof Shares
FairValue
Healthcare Equipment — 5.7%
Abaxis Inc. . . . . . . . . . . . . . . . . . . . . . . . . . . 700 $ 33,061Cantel Medical Corp. . . . . . . . . . . . . . . . . . . 2,300 158,079Cardiovascular Systems Inc. . . . . . . . . . . . 5,400 99,225 (a)
CONMED Corp. . . . . . . . . . . . . . . . . . . . . . . . 5,200 248,196Globus Medical Inc., Class A . . . . . . . . . . . 6,310 150,367 (a)
Hill-Rom Holdings Inc. . . . . . . . . . . . . . . . . 5,915 298,412Inogen Inc. . . . . . . . . . . . . . . . . . . . . . . . . . . 500 25,055 (a)
Insulet Corp. . . . . . . . . . . . . . . . . . . . . . . . . . 3,400 102,816 (a)
Integra LifeSciences Holdings Corp. . . . . . 4,400 351,032 (a)
iRadimed Corp. . . . . . . . . . . . . . . . . . . . . . . 900 19,584 (a)
LeMaitre Vascular Inc. . . . . . . . . . . . . . . . . 1,900 27,113Masimo Corp. . . . . . . . . . . . . . . . . . . . . . . . . 4,300 225,815 (a)
Natus Medical Inc. . . . . . . . . . . . . . . . . . . . . 388 14,666 (a)
NuVasive Inc. . . . . . . . . . . . . . . . . . . . . . . . . 4,875 291,135 (a)
NxStage Medical Inc. . . . . . . . . . . . . . . . . . 1,300 28,184 (a)
2,072,740
Healthcare Facilities — 0.8%
Amsurg Corp. . . . . . . . . . . . . . . . . . . . . . . . . 3,755 291,163 (a)
Healthcare Services — 2.2%
Addus HomeCare Corp. . . . . . . . . . . . . . . . 500 8,715 (a)
Air Methods Corp. . . . . . . . . . . . . . . . . . . . . 2,545 91,187 (a)
AMN Healthcare Services Inc. . . . . . . . . . . 1,365 54,559 (a)
BioTelemetry Inc. . . . . . . . . . . . . . . . . . . . . . 2,400 39,120 (a)
Cross Country Healthcare Inc. . . . . . . . . . 1,700 23,664 (a)
Diplomat Pharmacy Inc. . . . . . . . . . . . . . . 708 24,780 (a)
Envision Healthcare Holdings Inc. . . . . . . 1,231 31,231 (a)
LHC Group Inc. . . . . . . . . . . . . . . . . . . . . . . . 700 30,296 (a)
MEDNAX Inc. . . . . . . . . . . . . . . . . . . . . . . . . 4,931 357,152 (a)
Nobilis Health Corp. . . . . . . . . . . . . . . . . . . 6,100 13,603 (a)
RadNet Inc. . . . . . . . . . . . . . . . . . . . . . . . . . . 3,000 16,020 (a)
Team Health Holdings Inc. . . . . . . . . . . . . . 3,297 134,089 (a)
824,416
Healthcare Supplies — 1.3%
Endologix Inc. . . . . . . . . . . . . . . . . . . . . . . . . 12,037 149,981 (a)
Halyard Health Inc. . . . . . . . . . . . . . . . . . . . 300 9,756 (a)
ICU Medical Inc. . . . . . . . . . . . . . . . . . . . . . . 2,000 225,500 (a)
Lantheus Holdings Inc. . . . . . . . . . . . . . . . . 8,200 30,094 (a)
Merit Medical Systems Inc. . . . . . . . . . . . . 924 18,323 (a)
OraSure Technologies Inc. . . . . . . . . . . . . . 4,500 26,595 (a)
Penumbra Inc. . . . . . . . . . . . . . . . . . . . . . . . 429 25,525 (a)
485,774
Healthcare Technology — 1.7%
HMS Holdings Corp. . . . . . . . . . . . . . . . . . . 13,766 242,419 (a)
Medidata Solutions Inc. . . . . . . . . . . . . . . . 4,100 192,167 (a)
Omnicell Inc. . . . . . . . . . . . . . . . . . . . . . . . . . 5,000 171,150 (a)
Quality Systems Inc. . . . . . . . . . . . . . . . . . . 692 8,242Vocera Communications Inc. . . . . . . . . . . 2,222 28,553 (a)
642,531
See Notes to Schedule of Investments and Notes to Financial Statements.
5
Small-Cap Equity Fund
Schedule of Investments June 30, 2016 (Unaudited)
Numberof Shares
FairValue
Home Building — 0.2%
Meritage Homes Corp. . . . . . . . . . . . . . . . . 765 $ 28,718 (a)
TopBuild Corp. . . . . . . . . . . . . . . . . . . . . . . . 919 33,268 (a)
61,986
Home Furnishing Retail — 0.2%
Aaron’s Inc. . . . . . . . . . . . . . . . . . . . . . . . . . . 3,105 67,968
Home Furnishings — 0.1%
Ethan Allen Interiors Inc. . . . . . . . . . . . . . . 581 19,196
Hotel & Resort REITs — 0.3%
Ashford Hospitality Trust Inc. . . . . . . . . . . 2,509 13,473Hersha Hospitality Trust . . . . . . . . . . . . . . 1,093 18,745RLJ Lodging Trust . . . . . . . . . . . . . . . . . . . . 4,373 93,801
126,019
Hotels, Resorts & Cruise Lines — 0.2%
Interval Leisure Group Inc. . . . . . . . . . . . . . 5,219 82,982
Household Appliances — 0.1%
Helen of Troy Ltd. . . . . . . . . . . . . . . . . . . . . 369 37,948 (a)
Housewares & Specialties — 0.0%*
Tupperware Brands Corp. . . . . . . . . . . . . . 314 17,672
Human Resource & Employment Services — 0.1%
Insperity Inc. . . . . . . . . . . . . . . . . . . . . . . . . 464 35,835
Industrial Conglomerates — 0.2%
Raven Industries Inc. . . . . . . . . . . . . . . . . . . 4,400 83,336
Industrial Machinery — 7.6%
Actuant Corp., Class A . . . . . . . . . . . . . . . . 6,800 153,748Altra Industrial Motion Corp. . . . . . . . . . . . 641 17,294Barnes Group Inc. . . . . . . . . . . . . . . . . . . . . 3,170 104,990CLARCOR Inc. . . . . . . . . . . . . . . . . . . . . . . . . 5,510 335,173Crane Co. . . . . . . . . . . . . . . . . . . . . . . . . . . . 925 52,466Franklin Electric Company Inc. . . . . . . . . . 841 27,795Harsco Corp. . . . . . . . . . . . . . . . . . . . . . . . . 3,665 24,336IDEX Corp. . . . . . . . . . . . . . . . . . . . . . . . . . . . 2,780 228,238John Bean Technologies Corp. . . . . . . . . . 1,900 116,318LB Foster Co., Class A . . . . . . . . . . . . . . . . . 1,091 11,881Luxfer Holdings PLC ADR . . . . . . . . . . . . . . 6,096 73,335Lydall Inc. . . . . . . . . . . . . . . . . . . . . . . . . . . . 3,500 134,960 (a)
Mueller Industries Inc. . . . . . . . . . . . . . . . . . 5,054 161,122Nordson Corp. . . . . . . . . . . . . . . . . . . . . . . . 2,515 210,279RBC Bearings Inc. . . . . . . . . . . . . . . . . . . . . 2,100 152,250 (a)
Standex International Corp. . . . . . . . . . . . . 1,900 156,997The Gorman-Rupp Co. . . . . . . . . . . . . . . . . 1,900 52,079The Timken Co. . . . . . . . . . . . . . . . . . . . . . . 7,270 222,898TriMas Corp. . . . . . . . . . . . . . . . . . . . . . . . . . 11,200 201,600 (a)
Woodward Inc. . . . . . . . . . . . . . . . . . . . . . . 6,253 360,4232,798,182
Numberof Shares
FairValue
Industrial REITs — 0.2%
Rexford Industrial Realty Inc. . . . . . . . . . . 993 $ 20,942STAG Industrial Inc. . . . . . . . . . . . . . . . . . . . 1,827 43,501
64,443
Integrated Telecommunication Services — 0.1%
Fairpoint Communications Inc. . . . . . . . . . 1,400 20,552 (a)
Internet Retail — 0.1%
Overstock.com Inc. . . . . . . . . . . . . . . . . . . . 2,500 40,275 (a)
Internet Software & Services — 3.2%
Alarm.com Holdings Inc. . . . . . . . . . . . . . . 800 20,504 (a)
Brightcove Inc. . . . . . . . . . . . . . . . . . . . . . . . 3,000 26,400 (a)
comScore Inc. . . . . . . . . . . . . . . . . . . . . . . . 700 16,716 (a)
Cornerstone OnDemand Inc. . . . . . . . . . . . 4,939 187,978 (a)
EarthLink Holdings Corp. . . . . . . . . . . . . . . 3,300 21,120Envestnet Inc. . . . . . . . . . . . . . . . . . . . . . . . 3,500 116,585 (a)
GoDaddy Inc., Class A . . . . . . . . . . . . . . . . . 1,122 34,995 (a)
Gogo Inc. . . . . . . . . . . . . . . . . . . . . . . . . . . . 2,200 18,458 (a)
Internap Corp. . . . . . . . . . . . . . . . . . . . . . . . 9,300 19,158 (a)
LogMeIn Inc. . . . . . . . . . . . . . . . . . . . . . . . . . 4,100 260,063 (a)
NIC Inc. . . . . . . . . . . . . . . . . . . . . . . . . . . . . . 12,870 282,368SPS Commerce Inc. . . . . . . . . . . . . . . . . . . . 1,800 109,080 (a)
XO Group Inc. . . . . . . . . . . . . . . . . . . . . . . . . 2,576 44,900 (a)
1,158,325
Investment Banking & Brokerage — 1.0%
Piper Jaffray Cos. . . . . . . . . . . . . . . . . . . . . 994 37,474 (a)
Raymond James Financial Inc. . . . . . . . . . 5,791 285,496Stifel Financial Corp. . . . . . . . . . . . . . . . . . . 1,020 32,079 (a)
355,049
IT Consulting & Other Services — 0.1%
Perficient Inc. . . . . . . . . . . . . . . . . . . . . . . . . 1,346 27,337 (a)
The Hackett Group Inc. . . . . . . . . . . . . . . . . 1,600 22,192Virtusa Corp. . . . . . . . . . . . . . . . . . . . . . . . . 230 6,643 (a)
56,172
Leisure Products — 0.8%
Brunswick Corp. . . . . . . . . . . . . . . . . . . . . . . 381 17,267Polaris Industries Inc. . . . . . . . . . . . . . . . . . 3,305 270,217
287,484
Life & Health Insurance — 0.1%
American Equity Investment Life HoldingCo. . . . . . . . . . . . . . . . . . . . . . . . . . . . . . . . 1,850 26,363
Life Sciences Tools & Services — 1.6%
Albany Molecular Research Inc. . . . . . . . . 7,640 102,682 (a)
Bruker Corp. . . . . . . . . . . . . . . . . . . . . . . . . . 4,792 108,970Cambrex Corp. . . . . . . . . . . . . . . . . . . . . . . . 686 35,487 (a)
Charles River Laboratories InternationalInc. . . . . . . . . . . . . . . . . . . . . . . . . . . . . . . 388 31,987 (a)
See Notes to Schedule of Investments and Notes to Financial Statements.
6
Small-Cap Equity Fund
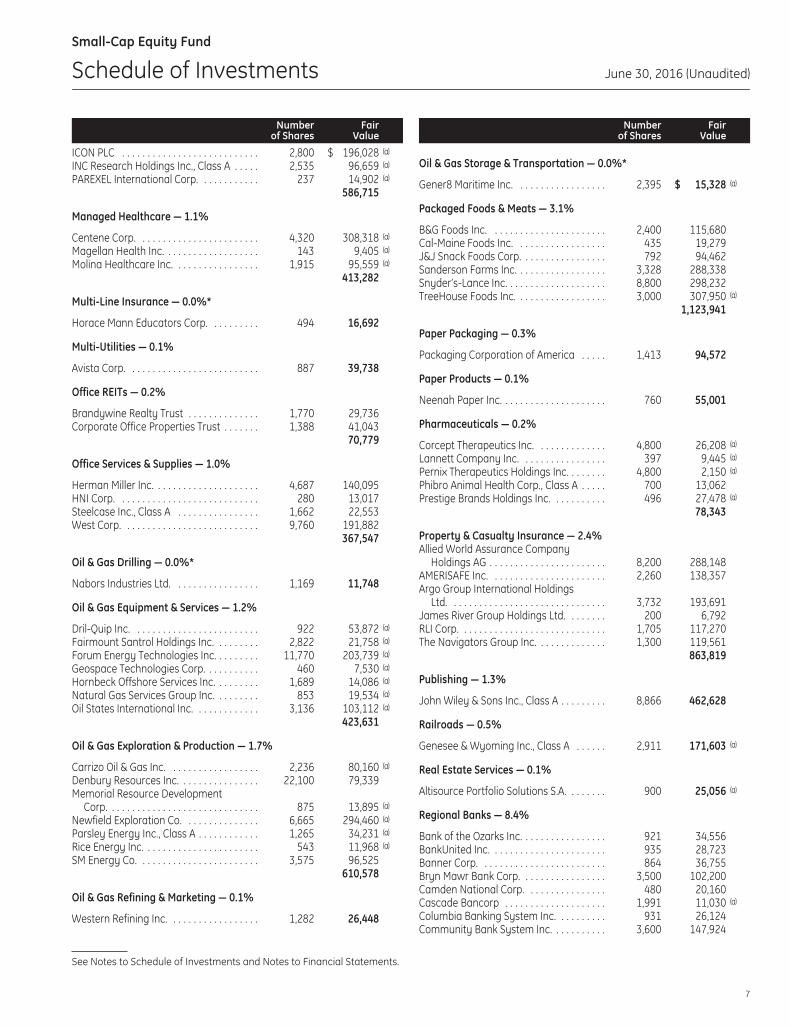
Schedule of Investments June 30, 2016 (Unaudited)
Numberof Shares
FairValue
ICON PLC . . . . . . . . . . . . . . . . . . . . . . . . . . . 2,800 $ 196,028 (a)
INC Research Holdings Inc., Class A . . . . . 2,535 96,659 (a)
PAREXEL International Corp. . . . . . . . . . . . 237 14,902 (a)
586,715
Managed Healthcare — 1.1%
Centene Corp. . . . . . . . . . . . . . . . . . . . . . . . 4,320 308,318 (a)
Magellan Health Inc. . . . . . . . . . . . . . . . . . . 143 9,405 (a)
Molina Healthcare Inc. . . . . . . . . . . . . . . . . 1,915 95,559 (a)
413,282
Multi-Line Insurance — 0.0%*
Horace Mann Educators Corp. . . . . . . . . . 494 16,692
Multi-Utilities — 0.1%
Avista Corp. . . . . . . . . . . . . . . . . . . . . . . . . . 887 39,738
Office REITs — 0.2%
Brandywine Realty Trust . . . . . . . . . . . . . . 1,770 29,736Corporate Office Properties Trust . . . . . . . 1,388 41,043
70,779
Office Services & Supplies — 1.0%
Herman Miller Inc. . . . . . . . . . . . . . . . . . . . . 4,687 140,095HNI Corp. . . . . . . . . . . . . . . . . . . . . . . . . . . . 280 13,017Steelcase Inc., Class A . . . . . . . . . . . . . . . . 1,662 22,553West Corp. . . . . . . . . . . . . . . . . . . . . . . . . . . 9,760 191,882
367,547
Oil & Gas Drilling — 0.0%*
Nabors Industries Ltd. . . . . . . . . . . . . . . . . 1,169 11,748
Oil & Gas Equipment & Services — 1.2%
Dril-Quip Inc. . . . . . . . . . . . . . . . . . . . . . . . . 922 53,872 (a)
Fairmount Santrol Holdings Inc. . . . . . . . . 2,822 21,758 (a)
Forum Energy Technologies Inc. . . . . . . . . 11,770 203,739 (a)
Geospace Technologies Corp. . . . . . . . . . . 460 7,530 (a)
Hornbeck Offshore Services Inc. . . . . . . . . 1,689 14,086 (a)
Natural Gas Services Group Inc. . . . . . . . . 853 19,534 (a)
Oil States International Inc. . . . . . . . . . . . . 3,136 103,112 (a)
423,631
Oil & Gas Exploration & Production — 1.7%
Carrizo Oil & Gas Inc. . . . . . . . . . . . . . . . . . 2,236 80,160 (a)
Denbury Resources Inc. . . . . . . . . . . . . . . . 22,100 79,339Memorial Resource Development
Corp. . . . . . . . . . . . . . . . . . . . . . . . . . . . . . 875 13,895 (a)
Newfield Exploration Co. . . . . . . . . . . . . . . 6,665 294,460 (a)
Parsley Energy Inc., Class A . . . . . . . . . . . . 1,265 34,231 (a)
Rice Energy Inc. . . . . . . . . . . . . . . . . . . . . . . 543 11,968 (a)
SM Energy Co. . . . . . . . . . . . . . . . . . . . . . . . 3,575 96,525610,578
Oil & Gas Refining & Marketing — 0.1%
Western Refining Inc. . . . . . . . . . . . . . . . . . 1,282 26,448
Numberof Shares
FairValue
Oil & Gas Storage & Transportation — 0.0%*
Gener8 Maritime Inc. . . . . . . . . . . . . . . . . . 2,395 $ 15,328 (a)
Packaged Foods & Meats — 3.1%
B&G Foods Inc. . . . . . . . . . . . . . . . . . . . . . . 2,400 115,680Cal-Maine Foods Inc. . . . . . . . . . . . . . . . . . 435 19,279J&J Snack Foods Corp. . . . . . . . . . . . . . . . . 792 94,462Sanderson Farms Inc. . . . . . . . . . . . . . . . . . 3,328 288,338Snyder’s-Lance Inc. . . . . . . . . . . . . . . . . . . . 8,800 298,232TreeHouse Foods Inc. . . . . . . . . . . . . . . . . . 3,000 307,950 (a)
1,123,941
Paper Packaging — 0.3%
Packaging Corporation of America . . . . . 1,413 94,572
Paper Products — 0.1%
Neenah Paper Inc. . . . . . . . . . . . . . . . . . . . . 760 55,001
Pharmaceuticals — 0.2%
Corcept Therapeutics Inc. . . . . . . . . . . . . . 4,800 26,208 (a)
Lannett Company Inc. . . . . . . . . . . . . . . . . 397 9,445 (a)
Pernix Therapeutics Holdings Inc. . . . . . . . 4,800 2,150 (a)
Phibro Animal Health Corp., Class A . . . . . 700 13,062Prestige Brands Holdings Inc. . . . . . . . . . . 496 27,478 (a)
78,343
Property & Casualty Insurance — 2.4%Allied World Assurance Company
Holdings AG . . . . . . . . . . . . . . . . . . . . . . . 8,200 288,148AMERISAFE Inc. . . . . . . . . . . . . . . . . . . . . . . 2,260 138,357Argo Group International Holdings
Ltd. . . . . . . . . . . . . . . . . . . . . . . . . . . . . . . 3,732 193,691James River Group Holdings Ltd. . . . . . . . 200 6,792RLI Corp. . . . . . . . . . . . . . . . . . . . . . . . . . . . . 1,705 117,270The Navigators Group Inc. . . . . . . . . . . . . . 1,300 119,561
863,819
Publishing — 1.3%
John Wiley & Sons Inc., Class A . . . . . . . . . 8,866 462,628
Railroads — 0.5%
Genesee & Wyoming Inc., Class A . . . . . . 2,911 171,603 (a)
Real Estate Services — 0.1%
Altisource Portfolio Solutions S.A. . . . . . . . 900 25,056 (a)
Regional Banks — 8.4%
Bank of the Ozarks Inc. . . . . . . . . . . . . . . . . 921 34,556BankUnited Inc. . . . . . . . . . . . . . . . . . . . . . . 935 28,723Banner Corp. . . . . . . . . . . . . . . . . . . . . . . . . 864 36,755Bryn Mawr Bank Corp. . . . . . . . . . . . . . . . . 3,500 102,200Camden National Corp. . . . . . . . . . . . . . . . 480 20,160Cascade Bancorp . . . . . . . . . . . . . . . . . . . . 1,991 11,030 (a)
Columbia Banking System Inc. . . . . . . . . . 931 26,124Community Bank System Inc. . . . . . . . . . . 3,600 147,924
See Notes to Schedule of Investments and Notes to Financial Statements.
7
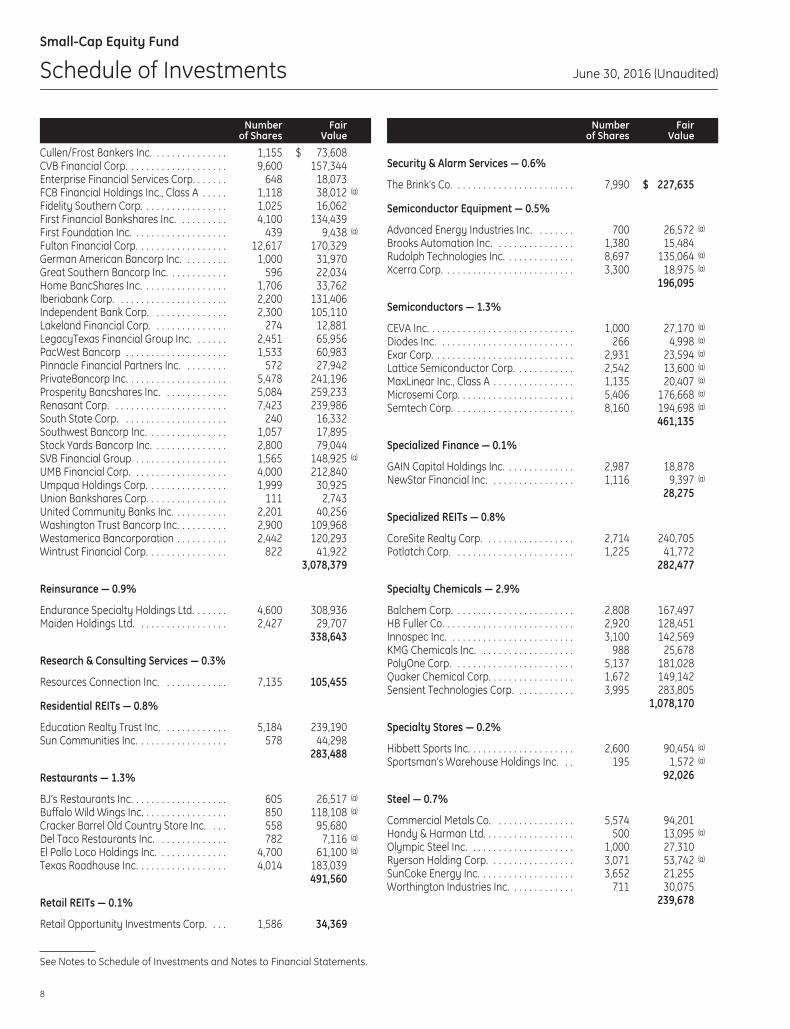
Small-Cap Equity Fund
Schedule of Investments June 30, 2016 (Unaudited)
Numberof Shares
FairValue
Cullen/Frost Bankers Inc. . . . . . . . . . . . . . . 1,155 $ 73,608CVB Financial Corp. . . . . . . . . . . . . . . . . . . . 9,600 157,344Enterprise Financial Services Corp. . . . . . . 648 18,073FCB Financial Holdings Inc., Class A . . . . . 1,118 38,012 (a)
Fidelity Southern Corp. . . . . . . . . . . . . . . . . 1,025 16,062First Financial Bankshares Inc. . . . . . . . . . 4,100 134,439First Foundation Inc. . . . . . . . . . . . . . . . . . . 439 9,438 (a)
Fulton Financial Corp. . . . . . . . . . . . . . . . . . 12,617 170,329German American Bancorp Inc. . . . . . . . . 1,000 31,970Great Southern Bancorp Inc. . . . . . . . . . . . 596 22,034Home BancShares Inc. . . . . . . . . . . . . . . . . 1,706 33,762Iberiabank Corp. . . . . . . . . . . . . . . . . . . . . . 2,200 131,406Independent Bank Corp. . . . . . . . . . . . . . . 2,300 105,110Lakeland Financial Corp. . . . . . . . . . . . . . . 274 12,881LegacyTexas Financial Group Inc. . . . . . . 2,451 65,956PacWest Bancorp . . . . . . . . . . . . . . . . . . . . 1,533 60,983Pinnacle Financial Partners Inc. . . . . . . . . 572 27,942PrivateBancorp Inc. . . . . . . . . . . . . . . . . . . . 5,478 241,196Prosperity Bancshares Inc. . . . . . . . . . . . . 5,084 259,233Renasant Corp. . . . . . . . . . . . . . . . . . . . . . . 7,423 239,986South State Corp. . . . . . . . . . . . . . . . . . . . . 240 16,332Southwest Bancorp Inc. . . . . . . . . . . . . . . . 1,057 17,895Stock Yards Bancorp Inc. . . . . . . . . . . . . . . 2,800 79,044SVB Financial Group . . . . . . . . . . . . . . . . . . 1,565 148,925 (a)
UMB Financial Corp. . . . . . . . . . . . . . . . . . . 4,000 212,840Umpqua Holdings Corp. . . . . . . . . . . . . . . . 1,999 30,925Union Bankshares Corp. . . . . . . . . . . . . . . . 111 2,743United Community Banks Inc. . . . . . . . . . . 2,201 40,256Washington Trust Bancorp Inc. . . . . . . . . . 2,900 109,968Westamerica Bancorporation . . . . . . . . . . 2,442 120,293Wintrust Financial Corp. . . . . . . . . . . . . . . . 822 41,922
3,078,379
Reinsurance — 0.9%
Endurance Specialty Holdings Ltd. . . . . . . 4,600 308,936Maiden Holdings Ltd. . . . . . . . . . . . . . . . . . 2,427 29,707
338,643
Research & Consulting Services — 0.3%
Resources Connection Inc. . . . . . . . . . . . . 7,135 105,455
Residential REITs — 0.8%
Education Realty Trust Inc. . . . . . . . . . . . . 5,184 239,190Sun Communities Inc. . . . . . . . . . . . . . . . . . 578 44,298
283,488
Restaurants — 1.3%
BJ’s Restaurants Inc. . . . . . . . . . . . . . . . . . . 605 26,517 (a)
Buffalo Wild Wings Inc. . . . . . . . . . . . . . . . . 850 118,108 (a)
Cracker Barrel Old Country Store Inc. . . . 558 95,680Del Taco Restaurants Inc. . . . . . . . . . . . . . 782 7,116 (a)
El Pollo Loco Holdings Inc. . . . . . . . . . . . . . 4,700 61,100 (a)
Texas Roadhouse Inc. . . . . . . . . . . . . . . . . . 4,014 183,039491,560
Retail REITs — 0.1%
Retail Opportunity Investments Corp. . . . 1,586 34,369
Numberof Shares
FairValue
Security & Alarm Services — 0.6%
The Brink’s Co. . . . . . . . . . . . . . . . . . . . . . . . 7,990 $ 227,635
Semiconductor Equipment — 0.5%
Advanced Energy Industries Inc. . . . . . . . 700 26,572 (a)
Brooks Automation Inc. . . . . . . . . . . . . . . . 1,380 15,484Rudolph Technologies Inc. . . . . . . . . . . . . . 8,697 135,064 (a)
Xcerra Corp. . . . . . . . . . . . . . . . . . . . . . . . . . 3,300 18,975 (a)
196,095
Semiconductors — 1.3%
CEVA Inc. . . . . . . . . . . . . . . . . . . . . . . . . . . . . 1,000 27,170 (a)
Diodes Inc. . . . . . . . . . . . . . . . . . . . . . . . . . . 266 4,998 (a)
Exar Corp. . . . . . . . . . . . . . . . . . . . . . . . . . . . 2,931 23,594 (a)
Lattice Semiconductor Corp. . . . . . . . . . . . 2,542 13,600 (a)
MaxLinear Inc., Class A . . . . . . . . . . . . . . . . 1,135 20,407 (a)
Microsemi Corp. . . . . . . . . . . . . . . . . . . . . . . 5,406 176,668 (a)
Semtech Corp. . . . . . . . . . . . . . . . . . . . . . . . 8,160 194,698 (a)
461,135
Specialized Finance — 0.1%
GAIN Capital Holdings Inc. . . . . . . . . . . . . . 2,987 18,878NewStar Financial Inc. . . . . . . . . . . . . . . . . 1,116 9,397 (a)
28,275
Specialized REITs — 0.8%
CoreSite Realty Corp. . . . . . . . . . . . . . . . . . 2,714 240,705Potlatch Corp. . . . . . . . . . . . . . . . . . . . . . . . 1,225 41,772
282,477
Specialty Chemicals — 2.9%
Balchem Corp. . . . . . . . . . . . . . . . . . . . . . . . 2,808 167,497HB Fuller Co. . . . . . . . . . . . . . . . . . . . . . . . . . 2,920 128,451Innospec Inc. . . . . . . . . . . . . . . . . . . . . . . . . 3,100 142,569KMG Chemicals Inc. . . . . . . . . . . . . . . . . . . 988 25,678PolyOne Corp. . . . . . . . . . . . . . . . . . . . . . . . 5,137 181,028Quaker Chemical Corp. . . . . . . . . . . . . . . . . 1,672 149,142Sensient Technologies Corp. . . . . . . . . . . . 3,995 283,805
1,078,170
Specialty Stores — 0.2%
Hibbett Sports Inc. . . . . . . . . . . . . . . . . . . . . 2,600 90,454 (a)
Sportsman’s Warehouse Holdings Inc. . . 195 1,572 (a)
92,026
Steel — 0.7%
Commercial Metals Co. . . . . . . . . . . . . . . . 5,574 94,201Handy & Harman Ltd. . . . . . . . . . . . . . . . . . 500 13,095 (a)
Olympic Steel Inc. . . . . . . . . . . . . . . . . . . . . 1,000 27,310Ryerson Holding Corp. . . . . . . . . . . . . . . . . 3,071 53,742 (a)
SunCoke Energy Inc. . . . . . . . . . . . . . . . . . . 3,652 21,255Worthington Industries Inc. . . . . . . . . . . . . 711 30,075
239,678
See Notes to Schedule of Investments and Notes to Financial Statements.
8
Small-Cap Equity Fund
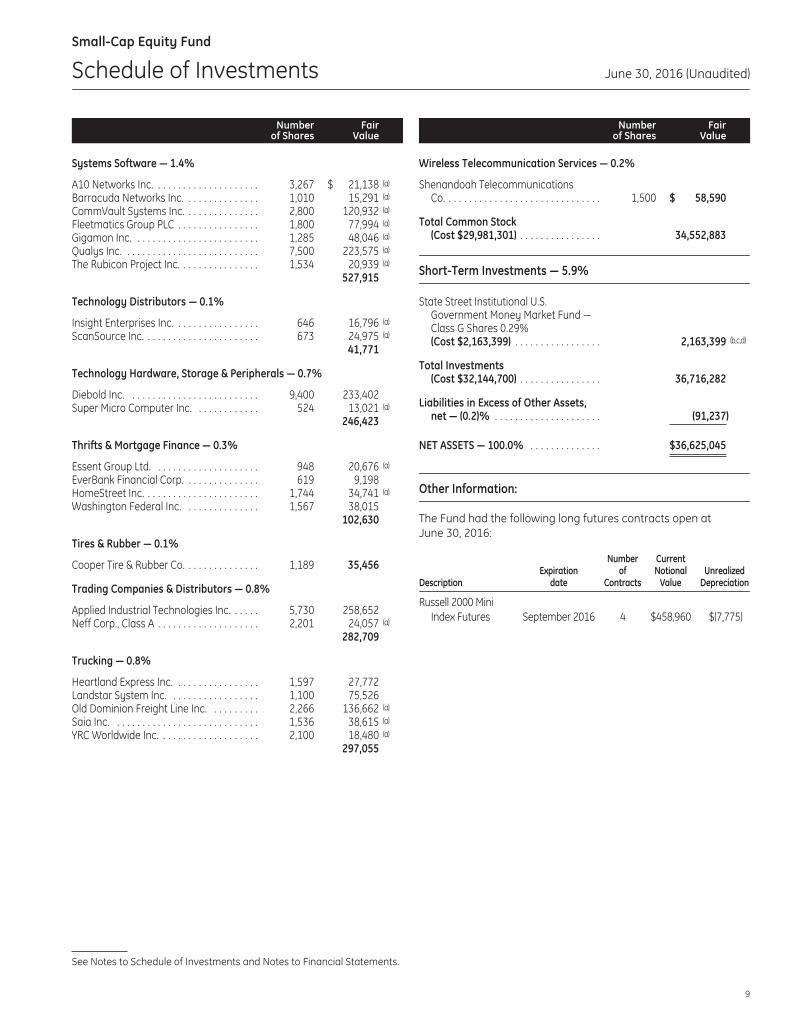
Schedule of Investments June 30, 2016 (Unaudited)
Numberof Shares
FairValue
Systems Software — 1.4%
A10 Networks Inc. . . . . . . . . . . . . . . . . . . . . 3,267 $ 21,138 (a)
Barracuda Networks Inc. . . . . . . . . . . . . . . 1,010 15,291 (a)
CommVault Systems Inc. . . . . . . . . . . . . . . 2,800 120,932 (a)
Fleetmatics Group PLC . . . . . . . . . . . . . . . . 1,800 77,994 (a)
Gigamon Inc. . . . . . . . . . . . . . . . . . . . . . . . . 1,285 48,046 (a)
Qualys Inc. . . . . . . . . . . . . . . . . . . . . . . . . . . 7,500 223,575 (a)
The Rubicon Project Inc. . . . . . . . . . . . . . . . 1,534 20,939 (a)
527,915
Technology Distributors — 0.1%
Insight Enterprises Inc. . . . . . . . . . . . . . . . . 646 16,796 (a)
ScanSource Inc. . . . . . . . . . . . . . . . . . . . . . . 673 24,975 (a)
41,771
Technology Hardware, Storage & Peripherals — 0.7%
Diebold Inc. . . . . . . . . . . . . . . . . . . . . . . . . . 9,400 233,402Super Micro Computer Inc. . . . . . . . . . . . . 524 13,021 (a)
246,423
Thrifts & Mortgage Finance — 0.3%
Essent Group Ltd. . . . . . . . . . . . . . . . . . . . . 948 20,676 (a)
EverBank Financial Corp. . . . . . . . . . . . . . . 619 9,198HomeStreet Inc. . . . . . . . . . . . . . . . . . . . . . . 1,744 34,741 (a)
Washington Federal Inc. . . . . . . . . . . . . . . 1,567 38,015102,630
Tires & Rubber — 0.1%
Cooper Tire & Rubber Co. . . . . . . . . . . . . . . 1,189 35,456
Trading Companies & Distributors — 0.8%
Applied Industrial Technologies Inc. . . . . . 5,730 258,652Neff Corp., Class A . . . . . . . . . . . . . . . . . . . . 2,201 24,057 (a)
282,709
Trucking — 0.8%
Heartland Express Inc. . . . . . . . . . . . . . . . . 1,597 27,772Landstar System Inc. . . . . . . . . . . . . . . . . . 1,100 75,526Old Dominion Freight Line Inc. . . . . . . . . . 2,266 136,662 (a)
Saia Inc. . . . . . . . . . . . . . . . . . . . . . . . . . . . . 1,536 38,615 (a)
YRC Worldwide Inc. . . . . . . . . . . . . . . . . . . . 2,100 18,480 (a)
297,055
Numberof Shares
FairValue
Wireless Telecommunication Services — 0.2%
Shenandoah TelecommunicationsCo. . . . . . . . . . . . . . . . . . . . . . . . . . . . . . . 1,500 $ 58,590
Total Common Stock(Cost $29,981,301) . . . . . . . . . . . . . . . . 34,552,883
Short-Term Investments — 5.9%
State Street Institutional U.S.Government Money Market Fund —Class G Shares 0.29%(Cost $2,163,399) . . . . . . . . . . . . . . . . . 2,163,399 (b,c,d)
Total Investments(Cost $32,144,700) . . . . . . . . . . . . . . . . 36,716,282
Liabilities in Excess of Other Assets,net — (0.2)% . . . . . . . . . . . . . . . . . . . . . (91,237)
NET ASSETS — 100.0% . . . . . . . . . . . . . . $36,625,045
Other Information:
The Fund had the following long futures contracts open atJune 30, 2016:
DescriptionExpiration
date
Numberof
Contracts
CurrentNotional
ValueUnrealized
Depreciation
Russell 2000 MiniIndex Futures September 2016 4 $458,960 $(7,775)
See Notes to Schedule of Investments and Notes to Financial Statements.
9
Notes to Schedule of Investments June 30, 2016 (Unaudited)
The views expressed in this document reflect our judgmentas of the publication date and are subject to change at anytime without notice. The securities cited may not berepresentative of the Fund’s future investments and shouldnot be construed as a recommendation to purchase or sella particular security. See the Fund’s summary prospectusand statutory prospectus for complete descriptions ofinvestment objectives, policies, risks and permissibleinvestments.
(a) Non-income producing security.
(b) At June 30, 2016, all or a portion of this security waspledged to cover collateral requirements for futures.
(c) Sponsored by SSGA Funds Management, Inc., theFund’s investment adviser and administrator, effectiveJuly 1, 2016, and an affiliate of State Street Bank &Trust Co., the Fund’s sub-administrator, custodian andaccounting agent.
(d) Coupon amount represents effective yield.
† Percentages are based on net assets as of June 30,2016.
* Less than 0.05%.
Abbreviations:
ADR — American Depositary Receipt
REIT — Real Estate Investment Trust
10
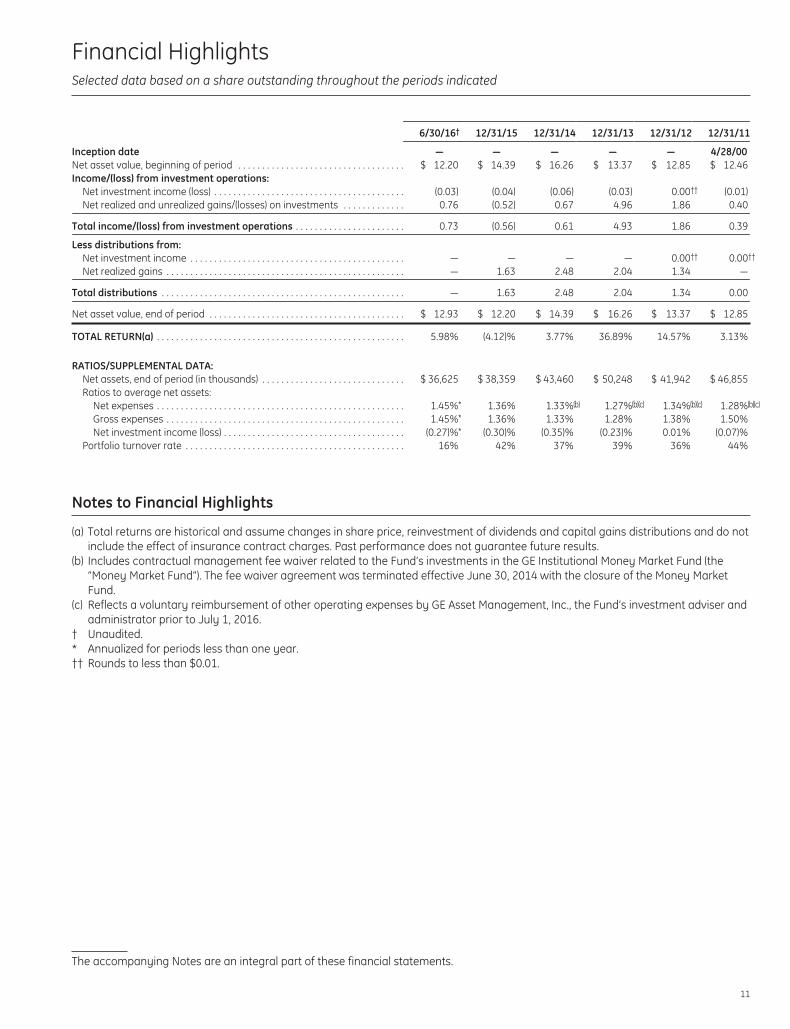
Financial HighlightsSelected data based on a share outstanding throughout the periods indicated
6/30/16† 12/31/15 12/31/14 12/31/13 12/31/12 12/31/11
Inception date — — — — — 4/28/00Net asset value, beginning of period . . . . . . . . . . . . . . . . . . . . . . . . . . . . . . . . . . . $ 12.20 $ 14.39 $ 16.26 $ 13.37 $ 12.85 $ 12.46Income/(loss) from investment operations:
Net investment income (loss) . . . . . . . . . . . . . . . . . . . . . . . . . . . . . . . . . . . . . . . . (0.03) (0.04) (0.06) (0.03) 0.00†† (0.01)Net realized and unrealized gains/(losses) on investments . . . . . . . . . . . . . 0.76 (0.52) 0.67 4.96 1.86 0.40
Total income/(loss) from investment operations . . . . . . . . . . . . . . . . . . . . . . . 0.73 (0.56) 0.61 4.93 1.86 0.39
Less distributions from:Net investment income . . . . . . . . . . . . . . . . . . . . . . . . . . . . . . . . . . . . . . . . . . . . . — — — — 0.00†† 0.00††
Net realized gains . . . . . . . . . . . . . . . . . . . . . . . . . . . . . . . . . . . . . . . . . . . . . . . . . . — 1.63 2.48 2.04 1.34 —
Total distributions . . . . . . . . . . . . . . . . . . . . . . . . . . . . . . . . . . . . . . . . . . . . . . . . . . . — 1.63 2.48 2.04 1.34 0.00
Net asset value, end of period . . . . . . . . . . . . . . . . . . . . . . . . . . . . . . . . . . . . . . . . . $ 12.93 $ 12.20 $ 14.39 $ 16.26 $ 13.37 $ 12.85
TOTAL RETURN(a) . . . . . . . . . . . . . . . . . . . . . . . . . . . . . . . . . . . . . . . . . . . . . . . . . . . . 5.98% (4.12)% 3.77% 36.89% 14.57% 3.13%
RATIOS/SUPPLEMENTAL DATA:Net assets, end of period (in thousands) . . . . . . . . . . . . . . . . . . . . . . . . . . . . . . $ 36,625 $ 38,359 $ 43,460 $ 50,248 $ 41,942 $ 46,855Ratios to average net assets:
Net expenses . . . . . . . . . . . . . . . . . . . . . . . . . . . . . . . . . . . . . . . . . . . . . . . . . . . . 1.45%* 1.36% 1.33%(b) 1.27%(b)(c) 1.34%(b)(c) 1.28%(b)(c)
Gross expenses . . . . . . . . . . . . . . . . . . . . . . . . . . . . . . . . . . . . . . . . . . . . . . . . . . 1.45%* 1.36% 1.33% 1.28% 1.38% 1.50%Net investment income (loss) . . . . . . . . . . . . . . . . . . . . . . . . . . . . . . . . . . . . . . (0.27)%* (0.30)% (0.35)% (0.23)% 0.01% (0.07)%
Portfolio turnover rate . . . . . . . . . . . . . . . . . . . . . . . . . . . . . . . . . . . . . . . . . . . . . . 16% 42% 37% 39% 36% 44%
Notes to Financial Highlights
(a) Total returns are historical and assume changes in share price, reinvestment of dividends and capital gains distributions and do notinclude the effect of insurance contract charges. Past performance does not guarantee future results.
(b) Includes contractual management fee waiver related to the Fund’s investments in the GE Institutional Money Market Fund (the“Money Market Fund”). The fee waiver agreement was terminated effective June 30, 2014 with the closure of the Money MarketFund.
(c) Reflects a voluntary reimbursement of other operating expenses by GE Asset Management, Inc., the Fund’s investment adviser andadministrator prior to July 1, 2016.
† Unaudited.* Annualized for periods less than one year.†† Rounds to less than $0.01.
The accompanying Notes are an integral part of these financial statements.
11
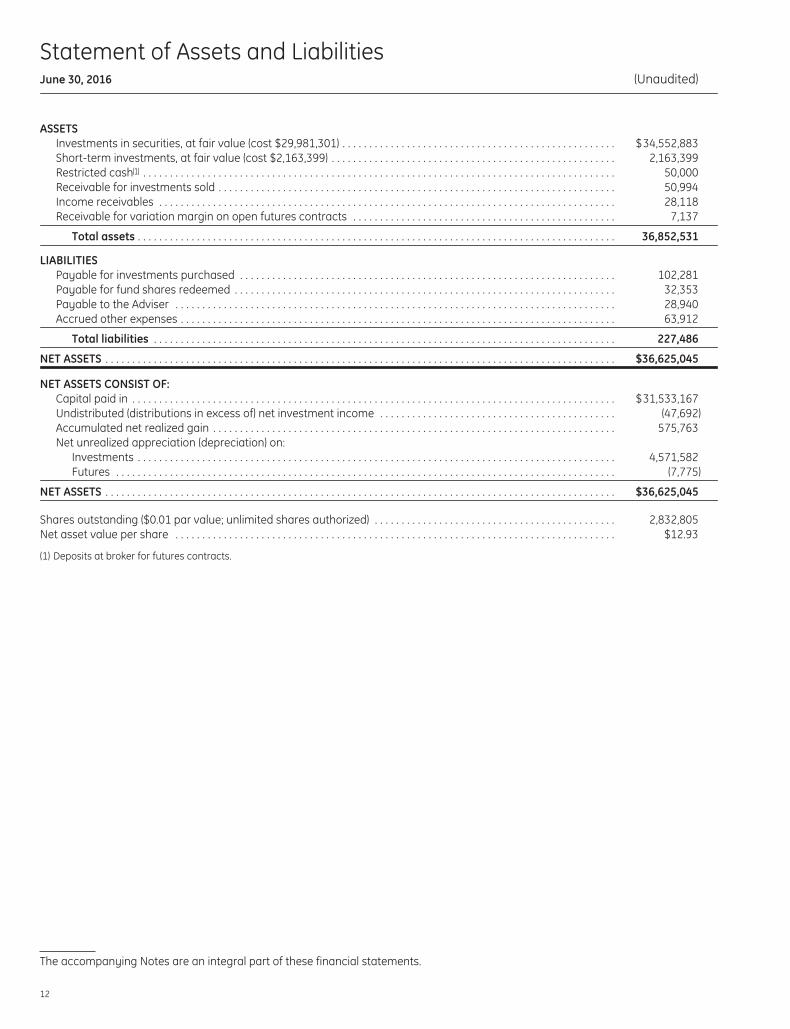
Statement of Assets and LiabilitiesJune 30, 2016 (Unaudited)
ASSETSInvestments in securities, at fair value (cost $29,981,301) . . . . . . . . . . . . . . . . . . . . . . . . . . . . . . . . . . . . . . . . . . . . . . . . . . . $34,552,883Short-term investments, at fair value (cost $2,163,399) . . . . . . . . . . . . . . . . . . . . . . . . . . . . . . . . . . . . . . . . . . . . . . . . . . . . . 2,163,399Restricted cash(1) . . . . . . . . . . . . . . . . . . . . . . . . . . . . . . . . . . . . . . . . . . . . . . . . . . . . . . . . . . . . . . . . . . . . . . . . . . . . . . . . . . . . . . . . 50,000Receivable for investments sold . . . . . . . . . . . . . . . . . . . . . . . . . . . . . . . . . . . . . . . . . . . . . . . . . . . . . . . . . . . . . . . . . . . . . . . . . . 50,994Income receivables . . . . . . . . . . . . . . . . . . . . . . . . . . . . . . . . . . . . . . . . . . . . . . . . . . . . . . . . . . . . . . . . . . . . . . . . . . . . . . . . . . . . . 28,118Receivable for variation margin on open futures contracts . . . . . . . . . . . . . . . . . . . . . . . . . . . . . . . . . . . . . . . . . . . . . . . . . 7,137
Total assets . . . . . . . . . . . . . . . . . . . . . . . . . . . . . . . . . . . . . . . . . . . . . . . . . . . . . . . . . . . . . . . . . . . . . . . . . . . . . . . . . . . . . . . . . 36,852,531
LIABILITIESPayable for investments purchased . . . . . . . . . . . . . . . . . . . . . . . . . . . . . . . . . . . . . . . . . . . . . . . . . . . . . . . . . . . . . . . . . . . . . . 102,281Payable for fund shares redeemed . . . . . . . . . . . . . . . . . . . . . . . . . . . . . . . . . . . . . . . . . . . . . . . . . . . . . . . . . . . . . . . . . . . . . . . 32,353Payable to the Adviser . . . . . . . . . . . . . . . . . . . . . . . . . . . . . . . . . . . . . . . . . . . . . . . . . . . . . . . . . . . . . . . . . . . . . . . . . . . . . . . . . . 28,940Accrued other expenses . . . . . . . . . . . . . . . . . . . . . . . . . . . . . . . . . . . . . . . . . . . . . . . . . . . . . . . . . . . . . . . . . . . . . . . . . . . . . . . . . 63,912
Total liabilities . . . . . . . . . . . . . . . . . . . . . . . . . . . . . . . . . . . . . . . . . . . . . . . . . . . . . . . . . . . . . . . . . . . . . . . . . . . . . . . . . . . . . . 227,486
NET ASSETS . . . . . . . . . . . . . . . . . . . . . . . . . . . . . . . . . . . . . . . . . . . . . . . . . . . . . . . . . . . . . . . . . . . . . . . . . . . . . . . . . . . . . . . . . . . . . . . $36,625,045
NET ASSETS CONSIST OF:Capital paid in . . . . . . . . . . . . . . . . . . . . . . . . . . . . . . . . . . . . . . . . . . . . . . . . . . . . . . . . . . . . . . . . . . . . . . . . . . . . . . . . . . . . . . . . . . $31,533,167Undistributed (distributions in excess of) net investment income . . . . . . . . . . . . . . . . . . . . . . . . . . . . . . . . . . . . . . . . . . . . (47,692)Accumulated net realized gain . . . . . . . . . . . . . . . . . . . . . . . . . . . . . . . . . . . . . . . . . . . . . . . . . . . . . . . . . . . . . . . . . . . . . . . . . . . 575,763Net unrealized appreciation (depreciation) on:
Investments . . . . . . . . . . . . . . . . . . . . . . . . . . . . . . . . . . . . . . . . . . . . . . . . . . . . . . . . . . . . . . . . . . . . . . . . . . . . . . . . . . . . . . . . . 4,571,582Futures . . . . . . . . . . . . . . . . . . . . . . . . . . . . . . . . . . . . . . . . . . . . . . . . . . . . . . . . . . . . . . . . . . . . . . . . . . . . . . . . . . . . . . . . . . . . . (7,775)
NET ASSETS . . . . . . . . . . . . . . . . . . . . . . . . . . . . . . . . . . . . . . . . . . . . . . . . . . . . . . . . . . . . . . . . . . . . . . . . . . . . . . . . . . . . . . . . . . . . . . . $36,625,045
Shares outstanding ($0.01 par value; unlimited shares authorized) . . . . . . . . . . . . . . . . . . . . . . . . . . . . . . . . . . . . . . . . . . . . . 2,832,805Net asset value per share . . . . . . . . . . . . . . . . . . . . . . . . . . . . . . . . . . . . . . . . . . . . . . . . . . . . . . . . . . . . . . . . . . . . . . . . . . . . . . . . . . $12.93
(1) Deposits at broker for futures contracts.
The accompanying Notes are an integral part of these financial statements.
12
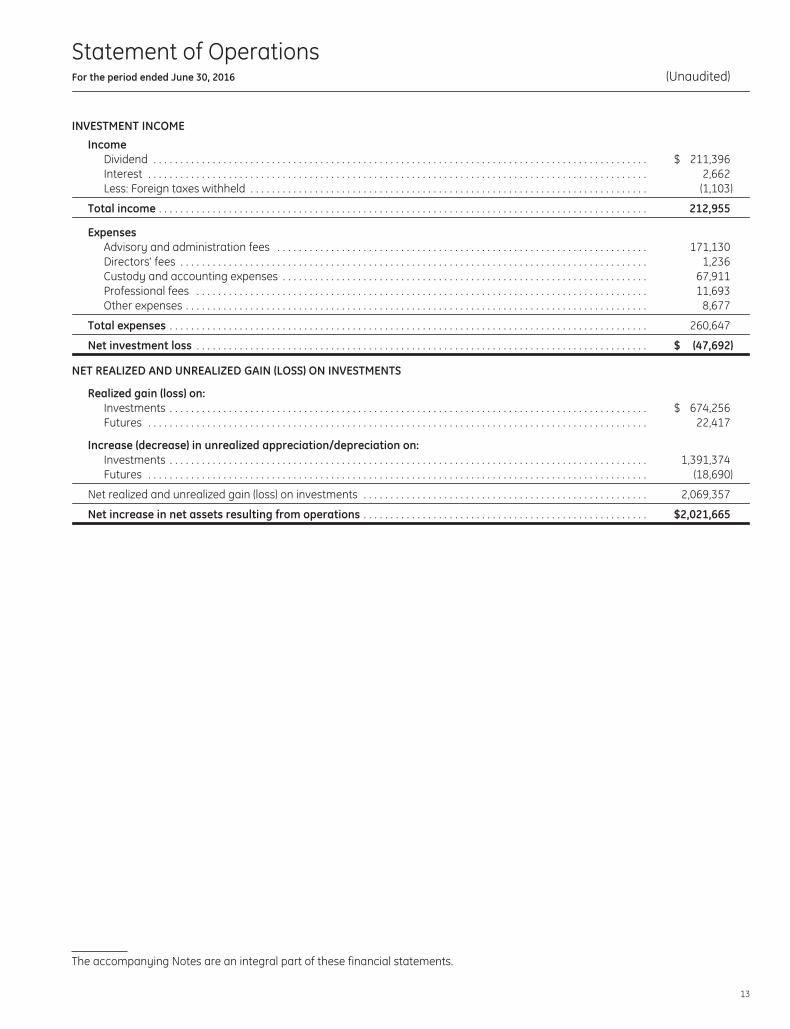
Statement of OperationsFor the period ended June 30, 2016 (Unaudited)
INVESTMENT INCOME
IncomeDividend . . . . . . . . . . . . . . . . . . . . . . . . . . . . . . . . . . . . . . . . . . . . . . . . . . . . . . . . . . . . . . . . . . . . . . . . . . . . . . . . . . . . . . . . . . . . $ 211,396Interest . . . . . . . . . . . . . . . . . . . . . . . . . . . . . . . . . . . . . . . . . . . . . . . . . . . . . . . . . . . . . . . . . . . . . . . . . . . . . . . . . . . . . . . . . . . . . 2,662Less: Foreign taxes withheld . . . . . . . . . . . . . . . . . . . . . . . . . . . . . . . . . . . . . . . . . . . . . . . . . . . . . . . . . . . . . . . . . . . . . . . . . . (1,103)
Total income . . . . . . . . . . . . . . . . . . . . . . . . . . . . . . . . . . . . . . . . . . . . . . . . . . . . . . . . . . . . . . . . . . . . . . . . . . . . . . . . . . . . . . . . . . . 212,955
ExpensesAdvisory and administration fees . . . . . . . . . . . . . . . . . . . . . . . . . . . . . . . . . . . . . . . . . . . . . . . . . . . . . . . . . . . . . . . . . . . . . 171,130Directors’ fees . . . . . . . . . . . . . . . . . . . . . . . . . . . . . . . . . . . . . . . . . . . . . . . . . . . . . . . . . . . . . . . . . . . . . . . . . . . . . . . . . . . . . . . 1,236Custody and accounting expenses . . . . . . . . . . . . . . . . . . . . . . . . . . . . . . . . . . . . . . . . . . . . . . . . . . . . . . . . . . . . . . . . . . . . 67,911Professional fees . . . . . . . . . . . . . . . . . . . . . . . . . . . . . . . . . . . . . . . . . . . . . . . . . . . . . . . . . . . . . . . . . . . . . . . . . . . . . . . . . . . . 11,693Other expenses . . . . . . . . . . . . . . . . . . . . . . . . . . . . . . . . . . . . . . . . . . . . . . . . . . . . . . . . . . . . . . . . . . . . . . . . . . . . . . . . . . . . . . 8,677
Total expenses . . . . . . . . . . . . . . . . . . . . . . . . . . . . . . . . . . . . . . . . . . . . . . . . . . . . . . . . . . . . . . . . . . . . . . . . . . . . . . . . . . . . . . . . . 260,647
Net investment loss . . . . . . . . . . . . . . . . . . . . . . . . . . . . . . . . . . . . . . . . . . . . . . . . . . . . . . . . . . . . . . . . . . . . . . . . . . . . . . . . . . . . $ (47,692)
NET REALIZED AND UNREALIZED GAIN (LOSS) ON INVESTMENTS
Realized gain (loss) on:Investments . . . . . . . . . . . . . . . . . . . . . . . . . . . . . . . . . . . . . . . . . . . . . . . . . . . . . . . . . . . . . . . . . . . . . . . . . . . . . . . . . . . . . . . . . $ 674,256Futures . . . . . . . . . . . . . . . . . . . . . . . . . . . . . . . . . . . . . . . . . . . . . . . . . . . . . . . . . . . . . . . . . . . . . . . . . . . . . . . . . . . . . . . . . . . . . 22,417
Increase (decrease) in unrealized appreciation/depreciation on:Investments . . . . . . . . . . . . . . . . . . . . . . . . . . . . . . . . . . . . . . . . . . . . . . . . . . . . . . . . . . . . . . . . . . . . . . . . . . . . . . . . . . . . . . . . . 1,391,374Futures . . . . . . . . . . . . . . . . . . . . . . . . . . . . . . . . . . . . . . . . . . . . . . . . . . . . . . . . . . . . . . . . . . . . . . . . . . . . . . . . . . . . . . . . . . . . . (18,690)
Net realized and unrealized gain (loss) on investments . . . . . . . . . . . . . . . . . . . . . . . . . . . . . . . . . . . . . . . . . . . . . . . . . . . . . 2,069,357
Net increase in net assets resulting from operations . . . . . . . . . . . . . . . . . . . . . . . . . . . . . . . . . . . . . . . . . . . . . . . . . . . . . $2,021,665
The accompanying Notes are an integral part of these financial statements.
13
Statements ofChanges in Net Assets
Six Months EndedJune 30,
2016*
Year EndedDecember 31,
2015
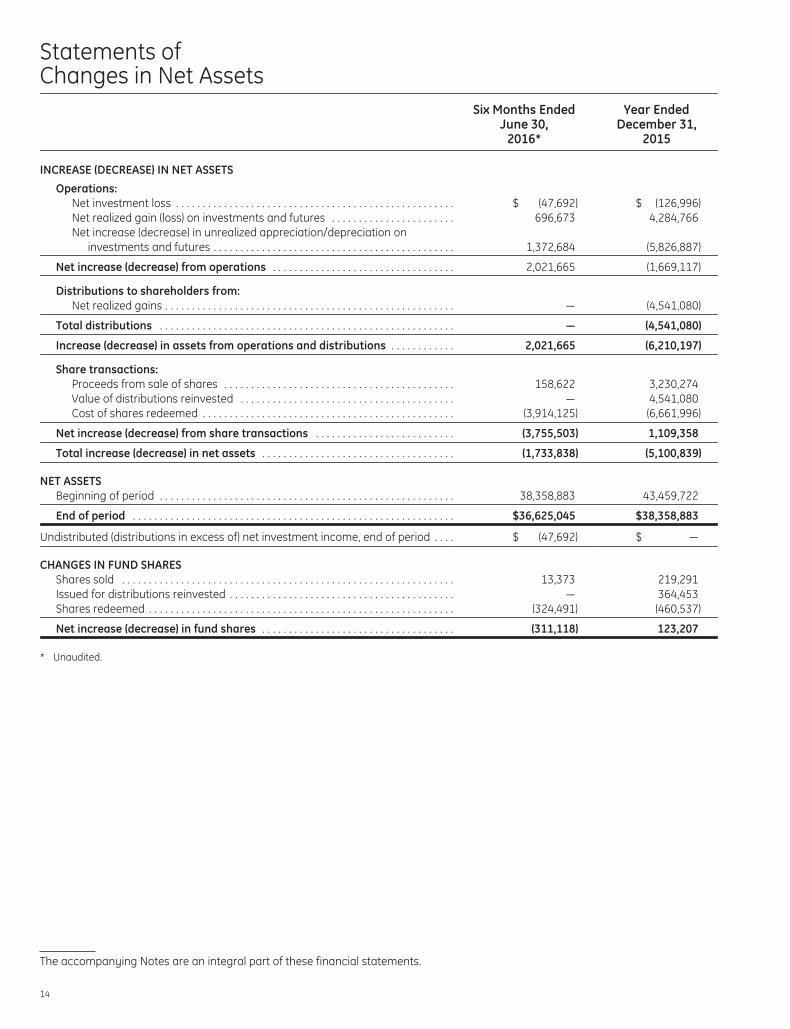
INCREASE (DECREASE) IN NET ASSETS
Operations:Net investment loss . . . . . . . . . . . . . . . . . . . . . . . . . . . . . . . . . . . . . . . . . . . . . . . . . . . . $ (47,692) $ (126,996)Net realized gain (loss) on investments and futures . . . . . . . . . . . . . . . . . . . . . . . 696,673 4,284,766Net increase (decrease) in unrealized appreciation/depreciation on
investments and futures . . . . . . . . . . . . . . . . . . . . . . . . . . . . . . . . . . . . . . . . . . . . . 1,372,684 (5,826,887)
Net increase (decrease) from operations . . . . . . . . . . . . . . . . . . . . . . . . . . . . . . . . . . 2,021,665 (1,669,117)
Distributions to shareholders from:Net realized gains . . . . . . . . . . . . . . . . . . . . . . . . . . . . . . . . . . . . . . . . . . . . . . . . . . . . . . — (4,541,080)
Total distributions . . . . . . . . . . . . . . . . . . . . . . . . . . . . . . . . . . . . . . . . . . . . . . . . . . . . . . . — (4,541,080)
Increase (decrease) in assets from operations and distributions . . . . . . . . . . . . 2,021,665 (6,210,197)
Share transactions:Proceeds from sale of shares . . . . . . . . . . . . . . . . . . . . . . . . . . . . . . . . . . . . . . . . . . . 158,622 3,230,274Value of distributions reinvested . . . . . . . . . . . . . . . . . . . . . . . . . . . . . . . . . . . . . . . . — 4,541,080Cost of shares redeemed . . . . . . . . . . . . . . . . . . . . . . . . . . . . . . . . . . . . . . . . . . . . . . . (3,914,125) (6,661,996)
Net increase (decrease) from share transactions . . . . . . . . . . . . . . . . . . . . . . . . . . (3,755,503) 1,109,358
Total increase (decrease) in net assets . . . . . . . . . . . . . . . . . . . . . . . . . . . . . . . . . . . . (1,733,838) (5,100,839)
NET ASSETSBeginning of period . . . . . . . . . . . . . . . . . . . . . . . . . . . . . . . . . . . . . . . . . . . . . . . . . . . . . . . 38,358,883 43,459,722
End of period . . . . . . . . . . . . . . . . . . . . . . . . . . . . . . . . . . . . . . . . . . . . . . . . . . . . . . . . . . . . $36,625,045 $38,358,883
Undistributed (distributions in excess of) net investment income, end of period . . . . $ (47,692) $ —
CHANGES IN FUND SHARESShares sold . . . . . . . . . . . . . . . . . . . . . . . . . . . . . . . . . . . . . . . . . . . . . . . . . . . . . . . . . . . . . . 13,373 219,291Issued for distributions reinvested . . . . . . . . . . . . . . . . . . . . . . . . . . . . . . . . . . . . . . . . . . — 364,453Shares redeemed . . . . . . . . . . . . . . . . . . . . . . . . . . . . . . . . . . . . . . . . . . . . . . . . . . . . . . . . . (324,491) (460,537)
Net increase (decrease) in fund shares . . . . . . . . . . . . . . . . . . . . . . . . . . . . . . . . . . . . (311,118) 123,207
* Unaudited.
The accompanying Notes are an integral part of these financial statements.
14
Notes to Financial Statements June 30, 2016 (Unaudited)
1. Organization of the CompanyGE Investments Funds, Inc. (the “Company”) wasincorporated under the laws of the Commonwealth ofVirginia on May 14, 1984 and is registered under theInvestment Company Act of 1940, as amended (the “1940Act”), as an open-end management investment company.The Company is currently composed of eleveninvestment portfolios (collectively, the “Funds”), althoughonly the following eight Funds are currently beingoffered: U.S. Equity Fund, S&P 500 Index Fund, PremierGrowth Equity Fund, Core Value Equity Fund, Small-CapEquity Fund (the “Fund”), Total Return Fund, Income Fundand Real Estate Securities Fund. Each Fund is aninvestment company and accordingly follows theinvestment company accounting and reporting guidanceof the Financial Accounting Standards Board (“FASB”)Accounting Standard Codification (“ASC”) Topic 946Financial Services—Investment Companies.
Shares of the Funds of the Company are offered only toinsurance company separate accounts that fund certainvariable life insurance contracts and variable annuitycontracts. SSGA Funds Management, Inc. (“SSGA FM”) isthe investment adviser and administrator of each of theFunds effective July 1, 2016. Prior to July 1, 2016, GEAsset Management Incorporated (“GEAM”) served as theinvestment adviser and administrator to each Fund.
The Company currently offers one share class (Class 1) ofthe Fund as an investment option for variable lifeinsurance and variable annuity contracts.
2. Summary of SignificantAccounting Policies
The preparation of financial statements in conformitywith U.S. generally accepted accounting principles(“GAAP”) requires management to make estimates andassumptions that affect the reported amounts of assetsand liabilities and disclosure of contingent assets andliabilities at the date of the financial statements and thereported amounts of increases and decreases in netassets from operations during the reporting period.Actual results may differ from those estimates.
Subsequent events after the balance sheet date throughthe date the financial statements were issued have beenevaluated in the preparation of the financial statements.There are no items to report.
The following summarizes the significant accountingpolicies of the Company:
Securities Valuation and Transactions All investmentsin securities are recorded at their estimated fair value, asdescribed in Note 3.
Securities transactions are accounted for as of the tradedate. Realized gains and losses on investments sold arerecorded on the basis of identified cost for both financialstatement and federal tax purposes.
Derivatives The Fund is subject to equity price risk in thenormal course of pursuing its investment objectives. TheFund may enter into various types of derivativetransactions (such as futures) to gain or hedge exposureto certain types of securities as an alternative to investingdirectly in or selling such securities.
Futures Contracts A futures contract is an agreement tobuy or sell a specific amount of a commodity, financialinstrument, currency or index at a particular price andfuture date. During the six-month period ended June 30,2016, the Fund invested in stock index futures contractsto gain equity exposure for accumulating and residualcash positions. Buying futures tends to increase theFund’s exposure to the underlying instrument whileselling futures tends to decrease the Fund’s exposure tothe underlying instrument, or hedge other Fundinvestments. With futures contracts, there is minimalcounterparty credit risk to the Fund since futurescontracts are exchange traded and the exchange’sclearinghouse, as counterparty to all traded futures,guarantees the futures against default. The Fund’s risks inusing these contracts include changes in the value of theunderlying instruments, non-performance of thecounterparties under the contracts’ terms and changes inthe liquidity of the secondary market for the contracts.Futures contracts are valued at the settlement priceestablished each day by the board of trade or exchangeon which they principally trade.
Upon entering into a financial futures contract, the Fundis required to pledge to the broker an amount of cashand/or other assets equal to a certain percentage of thecontract amount, known as initial margin deposit.Subsequent payments, known as variation margin, aremade or received by the Fund each day, depending onthe daily fluctuation in the fair value of the underlyingsecurity. The Fund records an unrealized gain or lossequal to the daily variation margin. Should market
15
Notes to Financial Statements June 30, 2016 (Unaudited)
conditions move unexpectedly, the Fund may notachieve the anticipated benefits of the futures contractsand may incur a loss. The Fund recognizes a realized gainor loss on the expiration or closing of a futures contract.
Investment Income Corporate actions (including cashdividends) are recorded on the ex-dividend date, net ofapplicable withholding taxes, except for certain foreigncorporate actions which are recorded as soon after theex-dividend date as such information becomes available.Withholding taxes on foreign dividends, if any, have beenprovided for in accordance with the Fund’sunderstanding of the applicable country’s tax rules andrates.
Interest income is recorded on the accrual basis.Accretion of discounts and amortization of premiums ontaxable bonds are to the call or maturity date, whicheveris shorter, using the effective yield method.
Expenses Fund specific expenses are charged to theFund that incurs such expenses. Such expenses mayinclude custodial fees, legal and accounting fees, printingcosts and registration fees. Expenses that are not fundspecific are allocated pro rata across the Funds.Expenses of the Fund are generally paid directly by theFund, however, expenses may be paid by the investmentadviser and reimbursed by the Fund.
Federal Income Taxes The Fund intends to comply withall sections of the Internal Revenue Code of 1986, asamended (the “Internal Revenue Code”) applicable toregulated investment companies, including thedistribution of substantially all of its taxable netinvestment income and net realized capital gains to itsshareholders. Therefore, no provision for federal incometax has been made. The Fund is treated as a separatetaxpayer for federal income tax purposes.
3. Securities ValuationThe Fund utilizes various methods to measure the fairvalue of most of its investments on a recurring basis.GAAP establishes a framework for measuring fair valueand providing related disclosures. Broadly, the frameworkrequires fair value to be determined based on theexchange price that would be received for an asset orpaid to transfer a liability (an exit price) in the principal ormost advantageous market for the asset or liability in anorderly transaction between market participants at themeasurement date. In the absence of active markets for
the identical assets or liabilities, such measurementsinvolve developing assumptions based on marketobservable data and, in the absence of such data,internal information that is consistent with what marketparticipants would use in a hypothetical transaction thatoccurs at the measurement date. It also establishes athree-level valuation hierarchy based upon observableand non-observable inputs.
Observable inputs reflect market data obtained fromindependent sources, while unobservable inputs reflectour market assumptions. Preference is given toobservable inputs. These two types of inputs create thefollowing fair value hierarchy:
Level 1 – Quoted prices for identical investments in activemarkets.
Level 2 – Quoted prices for similar investments in activemarkets; quoted prices for identical or similar investmentsin markets that are not active; and model-derivedvaluations whose inputs are observable or whosesignificant value drivers are observable.
Level 3 – Significant inputs to the valuation model areunobservable.
Policies and procedures are maintained to valueinvestments using the best and most relevant dataavailable. In addition, pricing vendors are utilized to assistin valuing investments. The investment adviser performsperiodic reviews of the methodologies used byindependent pricing services including price validation ofindividual securities.
Fair Value Measurement The following sectiondescribes the valuation methodologies the Fund uses tomeasure different financial investments at fair value.
The Fund’s portfolio securities are valued generally on thebasis of market quotations. Equity securities generallyare valued at the last reported sale price on the primarymarket in which they are traded. Portfolio securities listedon NASDAQ are valued using the NASDAQ Official ClosingPrice. Level 1 securities primarily include publicly-tradedequity securities, which may not necessarily representthe last sales price. If no sales occurred on the exchangeor NASDAQ that day, the portfolio security generally isvalued using the last reported bid price. In thosecircumstances, the Fund typically classifies theinvestment securities in Level 2.
16
Notes to Financial Statements June 30, 2016 (Unaudited)
Short-term securities of sufficient credit quality withremaining maturities of sixty days or less at the time ofpurchase are typically valued on the basis of amortizedcost which approximates fair value and these areincluded in Level 2. If it is determined that amortized costdoes not approximate fair value, securities may bevalued based on dealer supplied valuations or quotations.In these infrequent circumstances, pricing services mayprovide the Fund with valuations that are based onsignificant unobservable inputs, and in thosecircumstances the investment securities are classified inLevel 3.
Investments in registered investment companies arevalued at the published daily net asset value (“NAV”) andclassified in Level 1.
If prices are not readily available for a portfolio security,or if it is believed that a price for a portfolio security doesnot represent its fair value, the security may be valuedusing procedures approved by the Fund’s Board ofDirectors that are designed to establish its “fair” value.These securities are typically classified in Level 3. Thoseprocedures require that the fair value of a security beestablished by a valuation committee of the investmentadviser. The valuation committee follows differentprotocols for different types of investments andcircumstances. The fair value procedures may be used tovalue any investment of the Fund in the appropriatecircumstances.
Fair value determinations generally are used forsecurities whose value is affected by a significant eventthat will materially affect the value of a security andwhich occurs subsequent to the time of the close of the
principal market on which such security trades but priorto the calculation of the Fund’s NAV.
The value established for such a portfolio security valuedother than by use of a market quotation (as describedabove) may be different than what would be producedthrough the use of market quotations or anothermethodology. Portfolio securities that are valued usingtechniques other than market quotations, including “fairvalued” securities, may be subject to greater fluctuation intheir value from one day to the next than would be thecase if market quotations were used. In addition, there isno assurance that the Fund could sell a portfolio securityfor the value established for it at any time and it is possiblethat the Fund would incur a loss because a portfoliosecurity is sold at a discount to its established value.
Other financial investments are derivative instrumentsthat are not reflected in total investments, such asfutures, forwards, swaps, and written options contracts,which are valued based on fair value as discussed above.
The Fund uses closing prices for derivatives included inLevel 1, which are traded either on exchanges or liquidover-the-counter markets. Derivative assets and liabilitiesincluded in Level 2 primarily represent interest rateswaps, cross-currency swaps and foreign currency andcommodity forward and option contracts. Derivativeassets and liabilities included in Level 3 primarilyrepresent interest rate products that contain embeddedoptionality or prepayment features.
The inputs or methodology used for valuing securities arenot an indication of the risk associated with investing inthose securities.
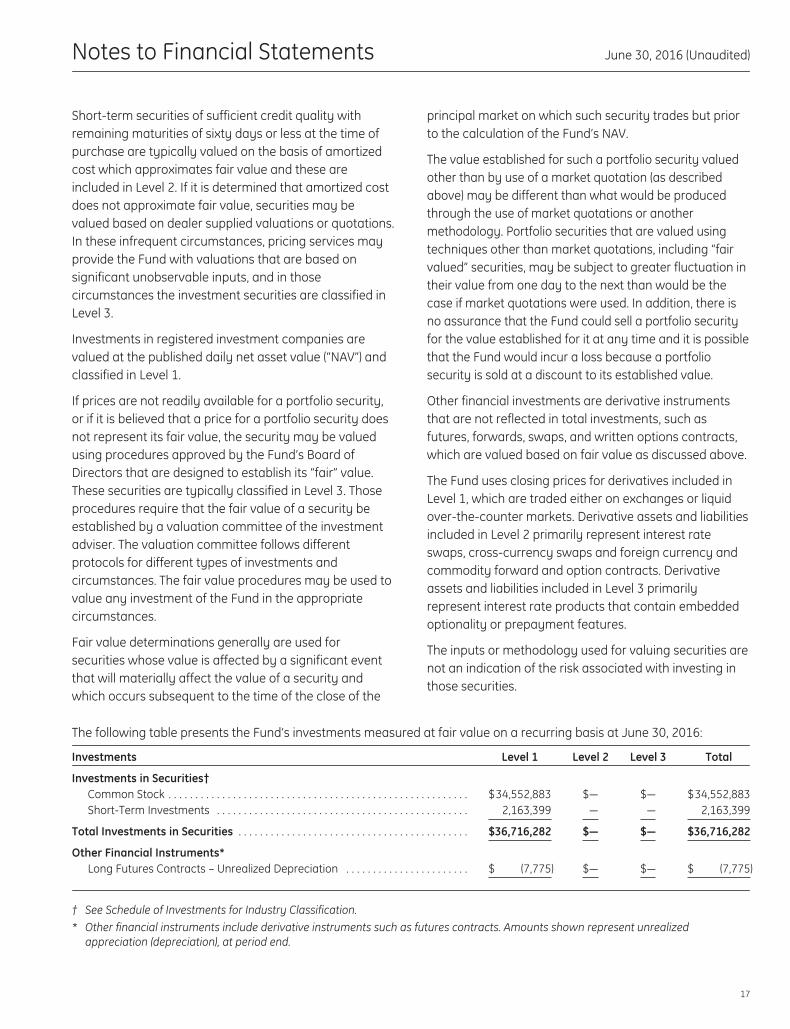
The following table presents the Fund’s investments measured at fair value on a recurring basis at June 30, 2016:
Investments Level 1 Level 2 Level 3 Total
Investments in Securities†Common Stock . . . . . . . . . . . . . . . . . . . . . . . . . . . . . . . . . . . . . . . . . . . . . . . . . . . . . . . . $34,552,883 $— $— $34,552,883Short-Term Investments . . . . . . . . . . . . . . . . . . . . . . . . . . . . . . . . . . . . . . . . . . . . . . . 2,163,399 — — 2,163,399
Total Investments in Securities . . . . . . . . . . . . . . . . . . . . . . . . . . . . . . . . . . . . . . . . . . . $36,716,282 $— $— $36,716,282
Other Financial Instruments*Long Futures Contracts – Unrealized Depreciation . . . . . . . . . . . . . . . . . . . . . . . $ (7,775) $— $— $ (7,775)
† See Schedule of Investments for Industry Classification.* Other financial instruments include derivative instruments such as futures contracts. Amounts shown represent unrealized
appreciation (depreciation), at period end.
17
Notes to Financial Statements June 30, 2016 (Unaudited)
There were no transfers between fair value levels during the period. Transfers between fair value levels are considered tooccur at the beginning of the period.
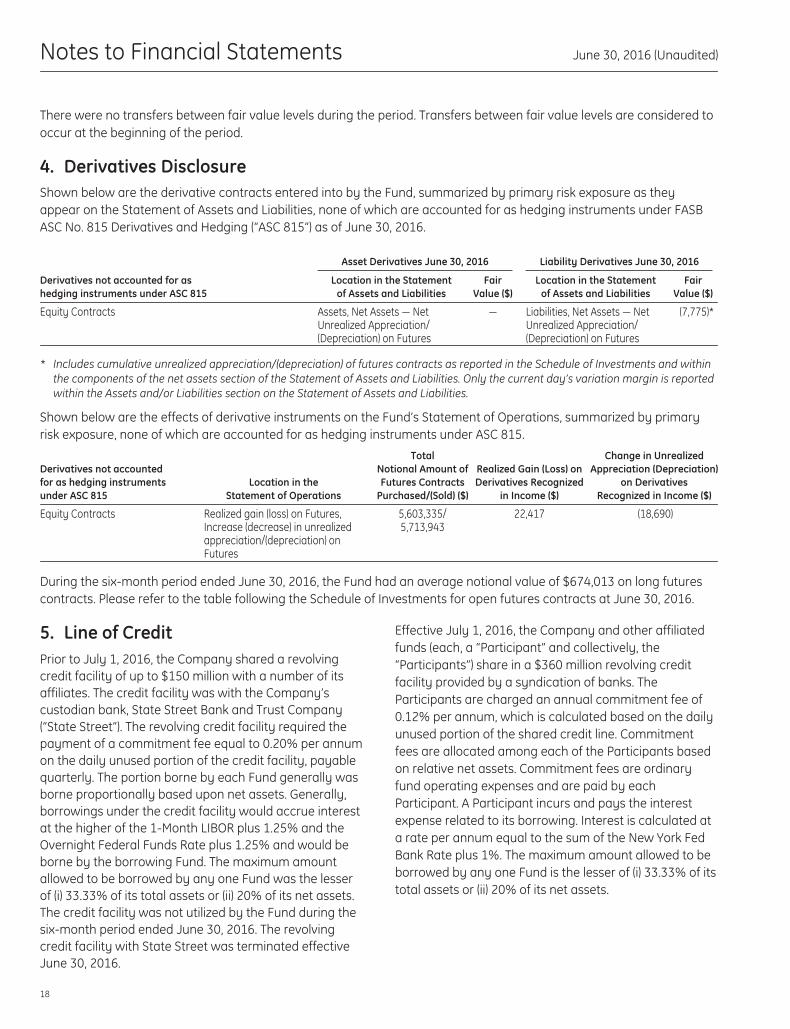
4. Derivatives DisclosureShown below are the derivative contracts entered into by the Fund, summarized by primary risk exposure as theyappear on the Statement of Assets and Liabilities, none of which are accounted for as hedging instruments under FASBASC No. 815 Derivatives and Hedging (“ASC 815”) as of June 30, 2016.
Asset Derivatives June 30, 2016 Liability Derivatives June 30, 2016
Derivatives not accounted for ashedging instruments under ASC 815
Location in the Statementof Assets and Liabilities
FairValue ($)
Location in the Statementof Assets and Liabilities
FairValue ($)
Equity Contracts Assets, Net Assets — NetUnrealized Appreciation/(Depreciation) on Futures
— Liabilities, Net Assets — NetUnrealized Appreciation/(Depreciation) on Futures
(7,775)*
* Includes cumulative unrealized appreciation/(depreciation) of futures contracts as reported in the Schedule of Investments and withinthe components of the net assets section of the Statement of Assets and Liabilities. Only the current day’s variation margin is reportedwithin the Assets and/or Liabilities section on the Statement of Assets and Liabilities.
Shown below are the effects of derivative instruments on the Fund’s Statement of Operations, summarized by primaryrisk exposure, none of which are accounted for as hedging instruments under ASC 815.
Derivatives not accountedfor as hedging instrumentsunder ASC 815
Location in theStatement of Operations
TotalNotional Amount ofFutures Contracts
Purchased/(Sold) ($)
Realized Gain (Loss) onDerivatives Recognized
in Income ($)
Change in UnrealizedAppreciation (Depreciation)
on DerivativesRecognized in Income ($)
Equity Contracts Realized gain (loss) on Futures,Increase (decrease) in unrealizedappreciation/(depreciation) onFutures
5,603,335/5,713,943
22,417 (18,690)
During the six-month period ended June 30, 2016, the Fund had an average notional value of $674,013 on long futurescontracts. Please refer to the table following the Schedule of Investments for open futures contracts at June 30, 2016.
5. Line of CreditPrior to July 1, 2016, the Company shared a revolvingcredit facility of up to $150 million with a number of itsaffiliates. The credit facility was with the Company’scustodian bank, State Street Bank and Trust Company(“State Street”). The revolving credit facility required thepayment of a commitment fee equal to 0.20% per annumon the daily unused portion of the credit facility, payablequarterly. The portion borne by each Fund generally wasborne proportionally based upon net assets. Generally,borrowings under the credit facility would accrue interestat the higher of the 1-Month LIBOR plus 1.25% and theOvernight Federal Funds Rate plus 1.25% and would beborne by the borrowing Fund. The maximum amountallowed to be borrowed by any one Fund was the lesserof (i) 33.33% of its total assets or (ii) 20% of its net assets.The credit facility was not utilized by the Fund during thesix-month period ended June 30, 2016. The revolvingcredit facility with State Street was terminated effectiveJune 30, 2016.
Effective July 1, 2016, the Company and other affiliatedfunds (each, a “Participant” and collectively, the“Participants”) share in a $360 million revolving creditfacility provided by a syndication of banks. TheParticipants are charged an annual commitment fee of0.12% per annum, which is calculated based on the dailyunused portion of the shared credit line. Commitmentfees are allocated among each of the Participants basedon relative net assets. Commitment fees are ordinaryfund operating expenses and are paid by eachParticipant. A Participant incurs and pays the interestexpense related to its borrowing. Interest is calculated ata rate per annum equal to the sum of the New York FedBank Rate plus 1%. The maximum amount allowed to beborrowed by any one Fund is the lesser of (i) 33.33% of itstotal assets or (ii) 20% of its net assets.
18

Notes to Financial Statements June 30, 2016 (Unaudited)
6. Compensation and Fees Paid toAffiliates
SSGA FM, a registered investment adviser, was retainedby the Company’s Board of Directors effective July 1,2016 to act as investment adviser and administrator ofthe Fund. SSGA FM’s compensation for investmentadvisory and administrative services (“Management Fee”)is paid monthly based on the average daily net assets ofthe Fund at an annualized rate of 0.95%.
Prior to July 1, 2016, GEAM served as the Fund’sinvestment adviser and administrator and the Fund paidGEAM a Management Fee at an annualized rate of 0.95%.
Directors’ Compensation The Fund pays nocompensation to its Directors who are officers oremployees of SSGA FM or its affiliates. Directors who arenot such officers or employees also serve in a similarcapacity for other funds advised by SSGA FM.Compensation paid to non-interested Directors arereflected on the Statement of Operations. These fees areallocated pro rata across all of the mutual fund platformsserved by the Directors, including the Fund, and arebased upon the relative net assets of each fund withinsuch platforms. (For additional information aboutDirectors’ compensation, please refer to the Funds’Statement of Additional Information.)
7. Sub-Advisory FeesPursuant to investment sub-advisory agreements withSSGA FM, the assets of the Fund are allocated to andmanaged by each of the following sub-advisers:(i) Palisade Capital Management, L.L.C.; (ii) ChamplainInvestment Partners, LLC; (iii) GlobeFlex Capital, L.P.;(iv) Kennedy Capital Management, Inc. and(v) SouthernSun Asset Management, LLC. SSGA FM isresponsible for allocating the Fund’s assets among thesub-advisers in its discretion (“Allocated Assets”), and formanaging the Fund’s cash position, while each sub-adviser is responsible for the day-to-day management oftheir portion of the Allocated Assets, under the generalsupervision and oversight of SSGA FM and the Board. Fortheir services, SSGA FM pays each sub-adviser aninvestment sub-advisory fee, which is calculated as apercentage of the average daily net assets of therespective Allocated Assets that it manages.
8. Investment TransactionsPurchases and Sales of Securities The cost of purchasesand the proceeds from sales of investments, other thanshort-term securities, for the six-month period endedJune 30, 2016, were as follows:
Non-U.S. Government Securities
Purchases Sales
$5,690,144 $9,179,948
9. Income TaxesThe Fund is subject to ASC 740, Income Taxes (“ASC 740”).ASC 740 provides guidance for financial accounting andreporting for the effects of income taxes that result froman entity’s activities during the year. ASC 740 alsoprovides guidance regarding how uncertain tax positionsshould be recognized, measured, presented anddisclosed in the financial statements. ASC 740 requiresevaluation of tax positions taken or expected to be takenin the course of preparing the Fund’s tax returns todetermine whether the tax positions are “more likely thannot” of being sustained by the applicable tax authority.There are no adjustments to the Fund’s net assetsrequired under ASC 740. The Fund’s 2012, 2013, 2014,and 2015 fiscal year tax returns are still open toexamination by the Federal and applicable state taxauthorities.
At June 30, 2016, information on the tax cost ofinvestments was as follows:
Cost ofInvestments
for TaxPurposes
Gross TaxAppreciation
Gross TaxDepreciation
Net TaxAppreciation/(Depreciation)
$32,466,581 $6,247,457 $(1,997,756) $4,249,701
As of December 31, 2015, the Fund had no capital losscarryovers. Capital loss carryovers are available to offsetfuture realized capital gains to the extent provided in theInternal Revenue Code and regulations thereunder. Tothe extent that these carryover losses are used to offsetfuture capital gains, it is probable that the gains offset willnot be distributed to shareholders because they would betaxable as ordinary income.
Any qualified late-year loss is deemed to arise on the firstday of the Fund’s next tax year (if the Fund elects to defersuch loss). Under this regime, generally, the Fund canelect to defer any post-October capital loss and/or anylate-year ordinary loss as defined by the InternalRevenue Code.
19
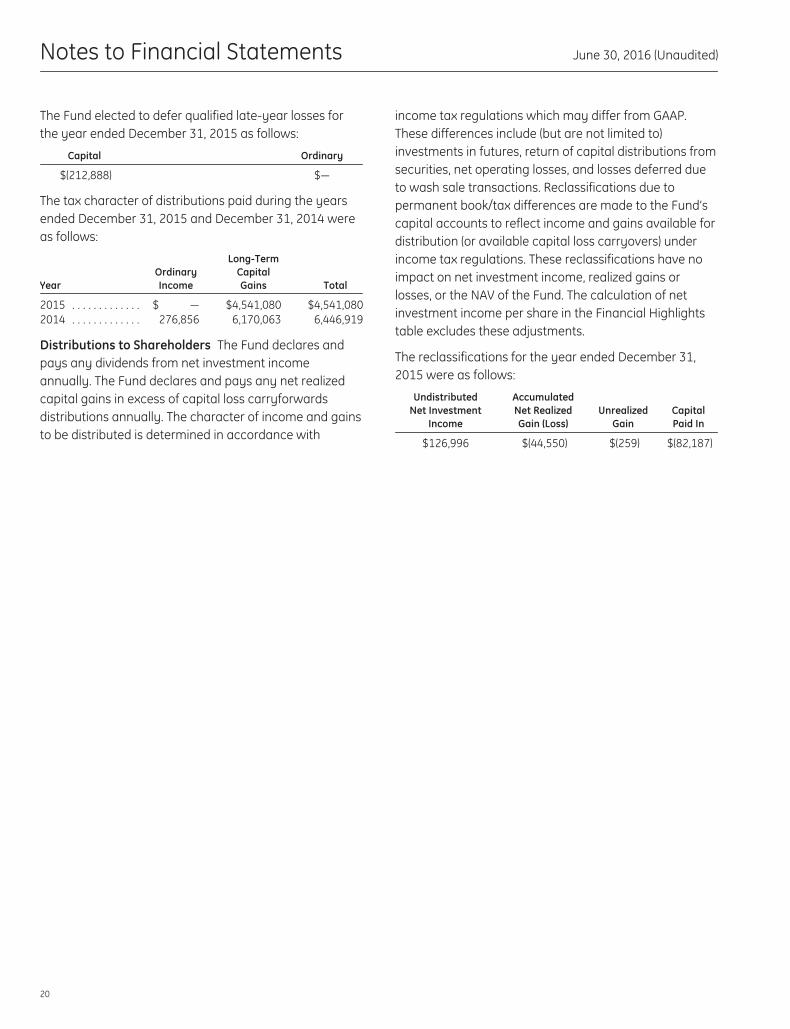
Notes to Financial Statements June 30, 2016 (Unaudited)
The Fund elected to defer qualified late-year losses forthe year ended December 31, 2015 as follows:
Capital Ordinary
$(212,888) $—
The tax character of distributions paid during the yearsended December 31, 2015 and December 31, 2014 wereas follows:
YearOrdinaryIncome
Long-TermCapitalGains Total
2015 . . . . . . . . . . . . . $ — $4,541,080 $4,541,0802014 . . . . . . . . . . . . . 276,856 6,170,063 6,446,919
Distributions to Shareholders The Fund declares andpays any dividends from net investment incomeannually. The Fund declares and pays any net realizedcapital gains in excess of capital loss carryforwardsdistributions annually. The character of income and gainsto be distributed is determined in accordance with
income tax regulations which may differ from GAAP.These differences include (but are not limited to)investments in futures, return of capital distributions fromsecurities, net operating losses, and losses deferred dueto wash sale transactions. Reclassifications due topermanent book/tax differences are made to the Fund’scapital accounts to reflect income and gains available fordistribution (or available capital loss carryovers) underincome tax regulations. These reclassifications have noimpact on net investment income, realized gains orlosses, or the NAV of the Fund. The calculation of netinvestment income per share in the Financial Highlightstable excludes these adjustments.
The reclassifications for the year ended December 31,2015 were as follows:
UndistributedNet Investment
Income
AccumulatedNet RealizedGain (Loss)
UnrealizedGain
CapitalPaid In
$126,996 $(44,550) $(259) $(82,187)
20
Advisory and Administrative Agreement Approval (Unaudited)
Disclosure for the Board of Directors’ Consideration ofthe Approval of the New Investment Advisory andAdministration Agreements with SSGA FundsManagement, Inc.
At a meeting of the Board of Directors held on April 19-20,2016 (the “Board Meeting”), the Directors, including amajority of the Independent Directors, who were presentat the Board Meeting considered and unanimouslyapproved an investment advisory and administrationagreement (the “New Investment Advisory andAdministration Agreement”) with SSGA FundsManagement, Inc. (“SSGA FM” or the “Adviser”) on behalfof each Fund. In considering whether to approve the NewInvestment Advisory and Administration Agreement, theDirectors considered and discussed a substantial amountof information and analysis provided, at the Board’srequest, by the Adviser and GE Asset ManagementIncorporated (“GEAM”).
Before approving the New Investment Advisory andAdministration Agreement on behalf of each Fund, theBoard reviewed the information provided withmanagement of the Adviser and GEAM. The Board alsoreviewed a memorandum prepared by independent legalcounsel discussing the legal standards for theconsideration of the proposed New Investment Advisoryand Administration Agreement, as well as othermemoranda and information relevant to the legalstandards and related considerations for a transactionsuch as the one between the Adviser and GEAM. TheIndependent Directors discussed the New InvestmentAdvisory and Administration Agreement in detail duringprivate sessions in advance of, and at, the Board Meetingwith their independent legal counsel at which norepresentatives of the Adviser or GEAM were present. TheIndependent Directors and their independent legalcounsel requested, and received and considered,additional information from the Adviser and GEAM priorto the Board Meeting.
Prior to and at the Board Meeting, representatives ofGEAM and the Adviser explained and discussed with theBoard the specific terms of the asset purchaseagreement entered into on March 29, 2016 by GeneralElectric Company (“GE”) with State Street Corporation(“SSC”) for the sale of the asset management andadvisory services business conducted by GEAM, a whollyowned subsidiary of GE and the Funds’ investment
adviser, and certain of its subsidiaries (the “Transaction”)and responded to questions raised by the Board. TheDirectors posed questions to these representatives andengaged in significant discussions. In addition, inresponse to their detailed requests, the Board receivedfrom the Adviser written responses to its inquiries, whichincluded substantial exhibits and other materials relatedto the Adviser’s business and the services it proposes toprovide to each Fund. The Directors took into accounttheir multi-year experience as Directors and particularlytheir consideration of the current investment advisoryand administration agreements under which GEAMprovides investment advisory services to the Funds (the“Existing GEAM Agreements”) in recent years.
The Board also received materials relating to theorganizational structure and business of the Adviser,including materials describing changes expected as aresult of the Transaction. Various information relating tothe terms of the Transaction, including the goals, interestsand timetable of the Adviser, was discussed as well. TheAdviser also advised that no change in investmentprocesses is anticipated as a result of the Transaction, asall of the personnel of GEAM responsible for the dailymanagement and operations of the Funds, includingcurrent officers of the Funds, were expected to becomeemployees of SSGA FM or its affiliates and continue toserve in the same capacities upon the closing of theTransaction.
In approving the New Investment Advisory andAdministration Agreement with the Adviser, the Directorsconsidered those factors it deemed relevant, includingthe factors discussed below. In its deliberations, theBoard did not identify any single factor that wasdispositive and each Director may have attributeddifferent weights to the various factors. The Directorsevaluated the information provided to them by GEAM andthe Adviser, as well as the presentations and discussionsthat occurred at the Board Meeting, for each Fund on aFund-by-Fund basis, and their determinations were madeseparately in respect of each Fund.
21
Advisory and Administrative Agreement Approval (Unaudited)
The material factors and conclusions that formed thebasis for the Board’s determinations to approve the NewInvestment Advisory and Administration Agreement withthe Adviser on behalf of each Fund are as discussedbelow.
The Nature, Extent and Quality of Services Expected to beProvided.
The Directors reviewed the services expected to beprovided to the Funds by the Adviser. The Boardconsidered the Adviser’s favorable attributes, including itssubstantial experience managing mutual funds,investment philosophy and discipline, experiencedinvestment and trading personnel, systems and otherresources, and favorable history and reputation. TheBoard also reviewed the extensive information providedby the Adviser related to its business, legal andregulatory affairs. This review considered the resourcesavailable to the Adviser to provide the services specifiedunder the New Investment Advisory and AdministrationAgreement, including the supervision of the Existing Sub-Advisers. Additionally, the Board considered that it isanticipated that substantially all of the portfoliomanagers currently managing the Funds will be joiningthe Adviser as part of the Transaction.
In light of the foregoing, the Board, including theIndependent Directors, concluded that the servicesexpected to be provided by the Adviser would besatisfactory, particularly given that the same individualswho currently provide portfolio management services tothe Funds as employees of GEAM are expected tocontinue providing such services as employees of theAdviser, benefiting the Funds by providing continuity ofservice following the Transaction.
Investment Performance of GEAM and the Adviser.
The Directors considered the investment performance ofGEAM and the Adviser for various periods focusing onGEAM’s and the Adviser’s investment performance withrespect to registered investment companies and otheraccounts that have investment objectives and strategiessimilar to that of the Funds. The Board also engaged indetailed discussions with GEAM and the Adviser abouttheir investment processes, focusing on the number andexperience of portfolio management and supportingresearch personnel and GEAM’s and the Adviser’s
investment style and approach employed. The Boardnoted that the Funds’ historical performance under theExisting GEAM Agreements was relevant as the personnelproviding portfolio management services would continueto provide those services under the New InvestmentAdvisory and Administration Agreement.
Taking these factors into consideration, the Board,including the Independent Directors, concluded that eachFund’s performance was acceptable.
Cost of the Services to be Provided And Profits to beRealized From The Relationship with the Funds.
The Directors considered the proposed ManagementFees that would be paid to the Adviser by the Funds, aswell as the fees proposed to be paid to each of the sub-advisers by the Adviser, which will reduce the netManagement Fees retained by the Adviser.Representatives of the Adviser stated that the Adviserwas not able to estimate profitability in a meaningful waybut expected to discuss any changes in the level ofprofitability with the Board during the contract renewalprocess. The Directors considered the renewalrequirements for advisory agreements and their ability toreview the Management Fees annually after the initialterm of the New Investment Advisory and AdministrationAgreement.
Information also was presented regarding the financialcondition of the Adviser for various past periods. TheDirectors also considered the Adviser’s statementsconcerning its significant investment in supportingregistered investment companies.
The Extent to Which Economies of Scale Would BeRealized as the Funds Grow and Whether Fee LevelsWould Reflect Such Economies of Scale.
The Directors considered the extent to which economiesof scale would be realized as the Funds grow, andwhether the proposed fee levels reflect these economiesof scale for the benefit of Fund investors. The Directorsnoted that the Adviser expects its distribution plans andcapabilities to provide an opportunity for the Funds toexperience additional growth. The Board considered thatthere might be some opportunities for reductions incertain fixed operating expenses that might be enjoyedby the Funds depending on the extent to which theirassets increase and determined that, to the extent in the
22

Advisory and Administrative Agreement Approval (Unaudited)
future it were determined that material economies ofscale had not been shared with the Funds, the Boardwould seek to have those economies of scale shared withthe Funds.
Comparison of Services to be Rendered and Fees to bePaid.
The Board discussed the services expected to be providedto the Funds by the Adviser, and the proposedManagement Fees to be charged to the Funds for thoseservices. Representatives of the Adviser statedinformation regarding the fee and expense ratio for eachFund and comparative information with respect to similarproducts was not expected to be materially different fromthe information provided to the Board at its December2015 meeting. Representatives of the Adviser noted thatmost of the Funds’ fees and expenses generally shouldremain within applicable peer group ranges, and that theManagement Fee rate is not proposed to change (exceptfor the lowered fee rate for the S&P 500 Index Fund).
In light of the foregoing, the Board, including theIndependent Directors, determined that the proposedManagement Fees, considered in relation to the services
to be provided to the Funds, supported the Board’sapproval of the New Investment Advisory andAdministration Agreement.
Fall-Out Benefits.
The Board considered actual and potential financialbenefits that the Adviser could derive from its relationshipwith the Funds, including the custody, fund accountingand sub-administration services being provided to theFunds by affiliates of the Adviser. The Board noted,however, that the affiliates of the Adviser had alreadybeen providing such services to the Funds pursuant tovarious services agreements that had been negotiated atarm’s-length prior to the Transaction, and that theAdviser would not derive any additional benefits fromsuch services following the close of the Transaction.
Conclusion.
No single factor was determinative to the Board’s decision.Based on their discussion and such other matters as weredeemed relevant, the Directors, including the IndependentDirectors, concluded that the approval of the NewInvestment Advisory and Administration Agreement withthe Adviser was in the best interests of the Funds.
23
Sub-Advisory Agreement Approval (Unaudited)
Disclosure for the Board of Directors’ Consideration ofthe Approval of a New Sub-Advisory Agreement witheach of Palisade Capital Management, LLC, ChamplainInvestment Partners, LLC, GlobeFlex Capital, L.P.,Kennedy Capital Management, Inc. and SouthernSunAsset Management, LLC
At the Board Meeting, members of the Board, including amajority of the Independent Directors, who were presentat the Board Meeting considered and unanimouslyapproved the new sub-advisory agreements (each, a“New Small-Cap Sub-Advisory Agreement”) betweenSSGA FM and each of Palisade Capital Management, LLC,Champlain Investment Partners, LLC, GlobeFlex Capital,L.P., Kennedy Capital Management, Inc. and SouthernSunAsset Management, LLC (collectively, the “Small-CapEquity Fund Sub-Advisers”). The Directors noted that theyhad previously considered and approved the current sub-advisory agreements between GEAM and each Small-CapEquity Fund Sub-Adviser (each, an “Existing Sub-AdvisoryAgreement”) at meetings held on December 16 and 18,2015. For that reason, the Directors focused oninformation with respect to those Small-Cap Equity FundSub-Advisers that had changed since that prior approval,but otherwise relied in part on their prior determinations,consideration and analysis.
In advance of the Board Meeting, the Board receivedmaterials from GEAM, the Adviser and each of the Small-Cap Equity Fund Sub-Advisers, and had the opportunityto ask questions and request additional information inconnection with its consideration. The materials detailed,among other things, information about each of the Small-Cap Equity Fund Sub-Advisers and its professional staff,the Small-Cap Equity Fund Sub-Advisers’ experience,expertise, and historical performance in managing similarfunds and in servicing institutional clients.
In approving the New Small-Cap Sub-AdvisoryAgreements with each of the Small-Cap Equity Fund Sub-Advisers, the Directors considered those factors theydeemed relevant, including the nature, quality and extentof services expected to be provided by Small-Cap EquityFund Sub-Advisers. In its deliberations, the Board did notidentify any single factor that was dispositive and eachDirector may have attributed different weights to thevarious factors. The Directors evaluated this informationand all other information made available to them byGEAM, the Adviser and the Small-Cap Equity Fund
Sub-Advisers, as well as the presentations anddiscussions that occurred at the Board Meeting.
The material factors and conclusions that formed thebasis for the Board’s determinations to approve the NewSmall-Cap Sub-Advisory Agreements with the Small-CapEquity Fund Sub-Advisers are as discussed below.
The Nature, Extent and Quality of Services Expected to beProvided.
The Directors reviewed the services expected to beprovided to the Small-Cap Equity Fund by the Small-CapEquity Fund Sub-Advisers under the New Small-Cap Sub-Advisory Agreements. The Board noted that as a result ofthe Transaction, there was not expected to be anymaterial changes in the nature, extent or quality of thesub-advisory services currently provided by the Small-Cap Equity Fund Sub-Advisers, or in the portfoliomanagement of the Small-Cap Equity Fund. The Boardfocused on its experiences with each Small-Cap EquityFund Sub-Adviser in connection with its prior and currentservice as sub-adviser to the Small-Cap Equity Fund. TheBoard considered each Small-Cap Equity Fund Sub-Adviser’s attributes relating to its investment philosophyoriented toward long-term performance, its process forselecting investments, and its experienced professionals,including research analysts and portfolio managers withexperience involving small-cap equity securities, accessto significant technological resources and a favorablehistory and reputation. The Board also considered thereview process undertaken by the Adviser and theAdviser’s favorable assessment of the nature and qualityof the investment sub-advisory services provided andexpected to be provided to the Small-Cap Equity Fund bythe Small-Cap Equity Fund Sub-Advisers afterconsummation of the Transaction.
In light of the foregoing, the Board, including theIndependent Directors, concluded that the breadth andquality of services provided by each of the Small-CapEquity Fund Sub-Advisers was expected to continue to besatisfactory.
Investment Performance of the Small-Cap Equity FundSub-Advisers.
The Directors considered the investment performance ofthe Small-Cap Equity Fund for various periods. TheDirectors reviewed detailed information provided by the
24
Sub-Advisory Agreement Approval (Unaudited)
Small-Cap Equity Fund Sub-Advisers comparing theirperformance to that of relevant securities indices andpeer groupings over these periods, at the Meeting as wellas the annual contract renewal meetings held onDecember 16 and 18, 2015. On this basis, the Board,including the Independent Directors, concluded that eachSmall-Cap Equity Fund Sub-Adviser’s historicalperformance record in managing its allocated portion ofthe Small-Cap Equity Fund’s investment portfolio, whenviewed together with the other factors considered by theBoard, supported a decision to approve New Small-CapSub-Advisory Agreements.
Cost of the Services to be Provided to the Small-Cap EquityFund.
The Board considered the proposed fees payable underthe New Small-Cap Sub-Advisory Agreements, notingthat the fees would be paid by the Adviser, and not theSmall-Cap Equity Fund. The Board considered that theproposed fee rates to be paid to the Small-Cap EquityFund Sub-Advisers by the Adviser under the New Small-Cap Sub-Advisory Agreements were the same as the feerates paid under the Existing Sub-Advisory Agreementswith the Small-Cap Equity Fund Sub-Advisers and havebeen negotiated at arm’s-length. The Board concludedthat the fees payable to each of the Small-Cap EquityFund Sub-Advisers by the Adviser under the New Sub-Advisory Agreements with the Small-Cap Equity FundSub-Advisers with respect to the assets to be allocated toeach Small-Cap Equity Fund Sub-Adviser werereasonable and appropriate.
In addition, the Board recognized that, because the feerates payable to the Small-Cap Equity Fund Sub-Adviserswere the same as the fee rates paid under the ExistingSub-Advisory Agreements and would be paid by theAdviser, an analysis of profitability was more appropriatein the context of the Board’s consideration of the Small-Cap Equity Fund’s New Investment Advisory andAdministration Agreement with the Adviser. Accordingly,considerations of profitability with respect to approval ofthe New Small-Cap Sub-Advisory Agreements with theSmall-Cap Equity Fund Sub-Advisers were not relevant tothe Board’s determination to approve such agreements.
The Extent to Which Economies of Scale Would be Realizedas the Fund Grows and Whether Fee Levels Would ReflectSuch Economies of Scale.
The Directors considered the extent to which economiesof scale would be realized as the Small-Cap Equity Fundgrows, and whether fee levels reflect these economies ofscale for the benefit of Small-Cap Equity Fund investors.The Board recognized that this consideration is lessrelevant with respect to the proposed sub-advisory fees,because the Adviser will pay Small-Cap Equity Fund Sub-Advisers out of its advisory fees received from the Small-Cap Equity Fund, and noted that the Board consideredeconomies of scale for the Small-Cap Equity Fund inconnection with the Small-Cap Equity Fund’s NewInvestment Advisory and Administration Agreement withthe Adviser. The Board also recognized the benefits to theSmall-Cap Equity Fund of being able to leverage afavorable cost structure achieved with respect to theSmall-Cap Equity Fund’s other operating expenses as aresult of the Adviser’s large overall base of assets undermanagement.
Comparison of Services to be Rendered and Fees to bePaid.
The Board reviewed and discussed the services expectedto be provided to the Small-Cap Equity Fund by each ofthe Small-Cap Equity Fund Sub-Advisers, and theproposed fee rates to be charged to the Adviser for thoseservices. The Directors noted that they had reviewed thecomparative fee information provided by each of theSmall-Cap Equity Fund Sub-Advisers at the December 16and 18, 2015 board meetings with respect to comparablemutual fund or other client accounts managed by eachof the Small-Cap Equity Fund Sub-Advisers.
The Board, including the Independent Directors,concluded that, based on this information, the proposedsub-advisory fees were reasonable in relation to theservices expected to be provided to the Small-Cap EquityFund.
Fall-Out Benefits.
The Board considered that there may be financialbenefits that Small-Cap Equity Fund Sub-Advisers mayderive from their relationships with the Adviser and theSmall-Cap Equity Fund, including soft dollar commissionbenefits generated through the Small-Cap Equity Fundportfolio transactions. The Board noted, however, that theSmall-Cap Equity Fund should benefit from the resourcesexpected to be made available through the Small-Cap
25
Sub-Advisory Agreement Approval (Unaudited)
Equity Fund Sub-Advisers, and that the Fund representsonly a small portion of the assets managed by the Small-Cap Equity Fund Sub-Advisers.
The Board did not view this consideration as having amaterial effect on its overall view of the reasonablenessof the proposed fees under the New Small-Cap Sub-Advisory Agreements.
Conclusion.
No single factor was determinative to the Board’sdecision. Based on the Directors’ discussion and suchother matters as were deemed relevant, the Board,including the Directors who are not interested persons (asdefined in the Investment Company Act of 1940, asamended) of the Small-Cap Equity Fund, concluded thatthe New Sub-Advisory Agreements were in the bestinterest of the Small-Cap Equity Fund.
26
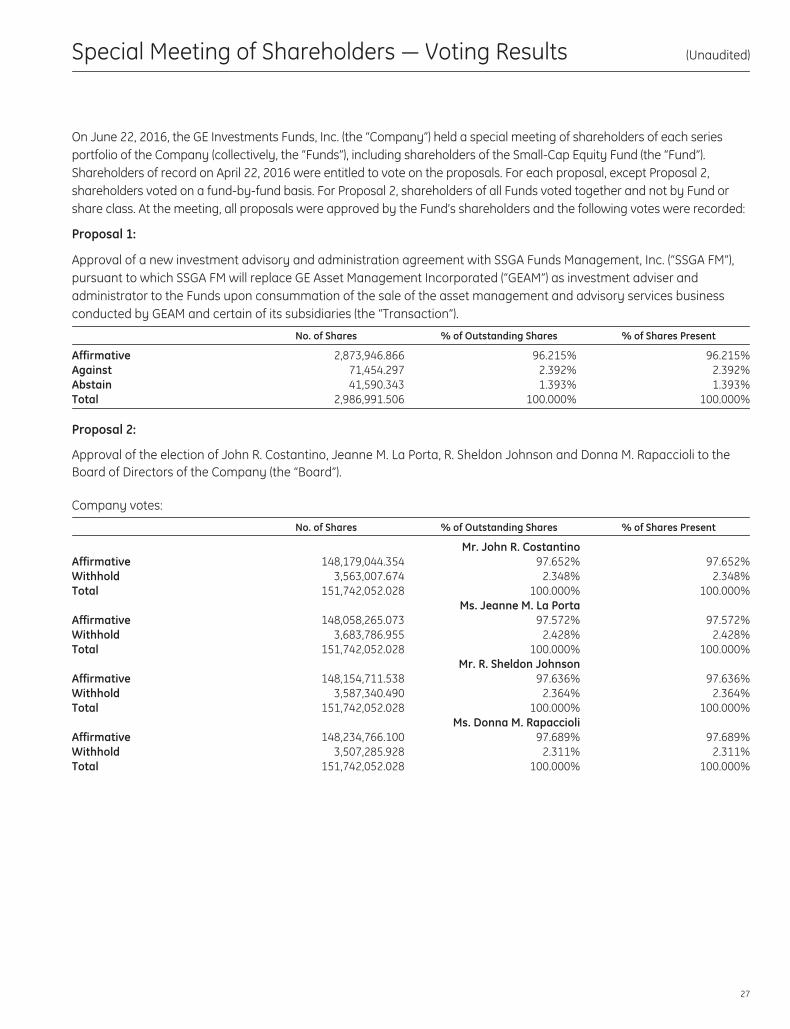
Special Meeting of Shareholders — Voting Results (Unaudited)
On June 22, 2016, the GE Investments Funds, Inc. (the “Company”) held a special meeting of shareholders of each seriesportfolio of the Company (collectively, the “Funds”), including shareholders of the Small-Cap Equity Fund (the “Fund”).Shareholders of record on April 22, 2016 were entitled to vote on the proposals. For each proposal, except Proposal 2,shareholders voted on a fund-by-fund basis. For Proposal 2, shareholders of all Funds voted together and not by Fund orshare class. At the meeting, all proposals were approved by the Fund’s shareholders and the following votes were recorded:
Proposal 1:
Approval of a new investment advisory and administration agreement with SSGA Funds Management, Inc. (“SSGA FM”),pursuant to which SSGA FM will replace GE Asset Management Incorporated (“GEAM”) as investment adviser andadministrator to the Funds upon consummation of the sale of the asset management and advisory services businessconducted by GEAM and certain of its subsidiaries (the “Transaction”).
No. of Shares % of Outstanding Shares % of Shares Present
Affirmative 2,873,946.866 96.215% 96.215%Against 71,454.297 2.392% 2.392%Abstain 41,590.343 1.393% 1.393%Total 2,986,991.506 100.000% 100.000%
Proposal 2:
Approval of the election of John R. Costantino, Jeanne M. La Porta, R. Sheldon Johnson and Donna M. Rapaccioli to theBoard of Directors of the Company (the “Board”).
Company votes:
No. of Shares % of Outstanding Shares % of Shares Present
Mr. John R. CostantinoAffirmative 148,179,044.354 97.652% 97.652%Withhold 3,563,007.674 2.348% 2.348%Total 151,742,052.028 100.000% 100.000%
Ms. Jeanne M. La PortaAffirmative 148,058,265.073 97.572% 97.572%Withhold 3,683,786.955 2.428% 2.428%Total 151,742,052.028 100.000% 100.000%
Mr. R. Sheldon JohnsonAffirmative 148,154,711.538 97.636% 97.636%Withhold 3,587,340.490 2.364% 2.364%Total 151,742,052.028 100.000% 100.000%
Ms. Donna M. RapaccioliAffirmative 148,234,766.100 97.689% 97.689%Withhold 3,507,285.928 2.311% 2.311%Total 151,742,052.028 100.000% 100.000%
27
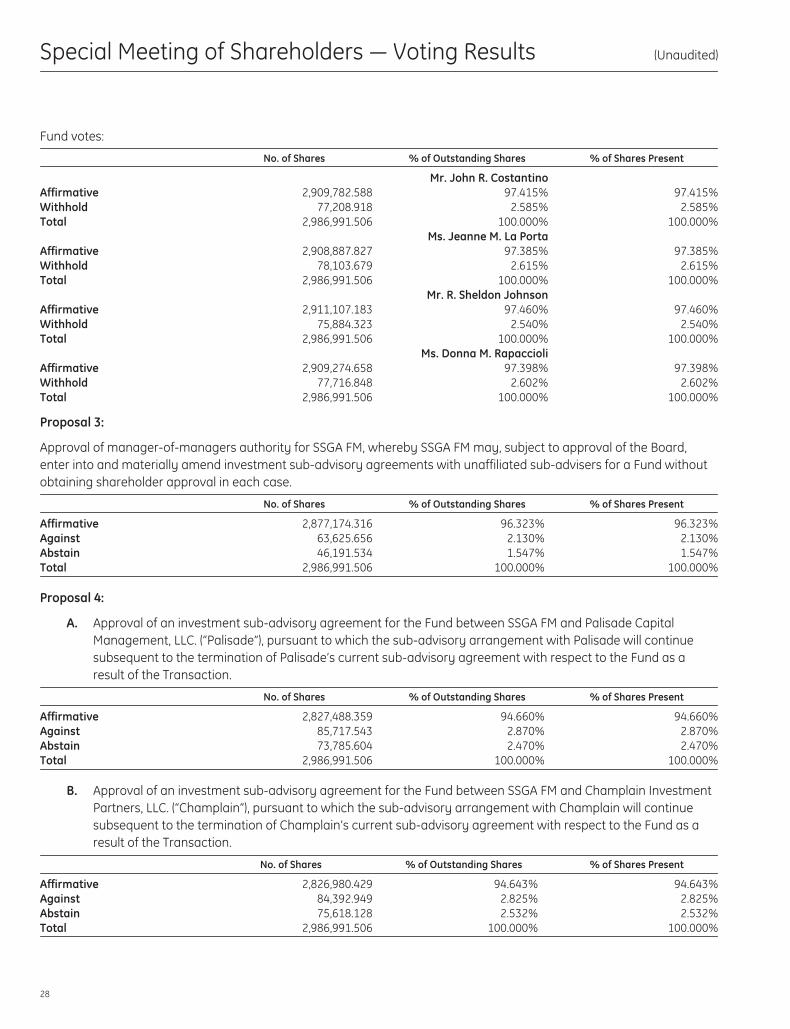
Special Meeting of Shareholders — Voting Results (Unaudited)
Fund votes:
No. of Shares % of Outstanding Shares % of Shares Present
Mr. John R. CostantinoAffirmative 2,909,782.588 97.415% 97.415%Withhold 77,208.918 2.585% 2.585%Total 2,986,991.506 100.000% 100.000%
Ms. Jeanne M. La PortaAffirmative 2,908,887.827 97.385% 97.385%Withhold 78,103.679 2.615% 2.615%Total 2,986,991.506 100.000% 100.000%
Mr. R. Sheldon JohnsonAffirmative 2,911,107.183 97.460% 97.460%Withhold 75,884.323 2.540% 2.540%Total 2,986,991.506 100.000% 100.000%
Ms. Donna M. RapaccioliAffirmative 2,909,274.658 97.398% 97.398%Withhold 77,716.848 2.602% 2.602%Total 2,986,991.506 100.000% 100.000%
Proposal 3:
Approval of manager-of-managers authority for SSGA FM, whereby SSGA FM may, subject to approval of the Board,enter into and materially amend investment sub-advisory agreements with unaffiliated sub-advisers for a Fund withoutobtaining shareholder approval in each case.
No. of Shares % of Outstanding Shares % of Shares Present
Affirmative 2,877,174.316 96.323% 96.323%Against 63,625.656 2.130% 2.130%Abstain 46,191.534 1.547% 1.547%Total 2,986,991.506 100.000% 100.000%
Proposal 4:
A. Approval of an investment sub-advisory agreement for the Fund between SSGA FM and Palisade CapitalManagement, LLC. (“Palisade”), pursuant to which the sub-advisory arrangement with Palisade will continuesubsequent to the termination of Palisade’s current sub-advisory agreement with respect to the Fund as aresult of the Transaction.
No. of Shares % of Outstanding Shares % of Shares Present
Affirmative 2,827,488.359 94.660% 94.660%Against 85,717.543 2.870% 2.870%Abstain 73,785.604 2.470% 2.470%Total 2,986,991.506 100.000% 100.000%
B. Approval of an investment sub-advisory agreement for the Fund between SSGA FM and Champlain InvestmentPartners, LLC. (“Champlain”), pursuant to which the sub-advisory arrangement with Champlain will continuesubsequent to the termination of Champlain’s current sub-advisory agreement with respect to the Fund as aresult of the Transaction.
No. of Shares % of Outstanding Shares % of Shares Present
Affirmative 2,826,980.429 94.643% 94.643%Against 84,392.949 2.825% 2.825%Abstain 75,618.128 2.532% 2.532%Total 2,986,991.506 100.000% 100.000%
28
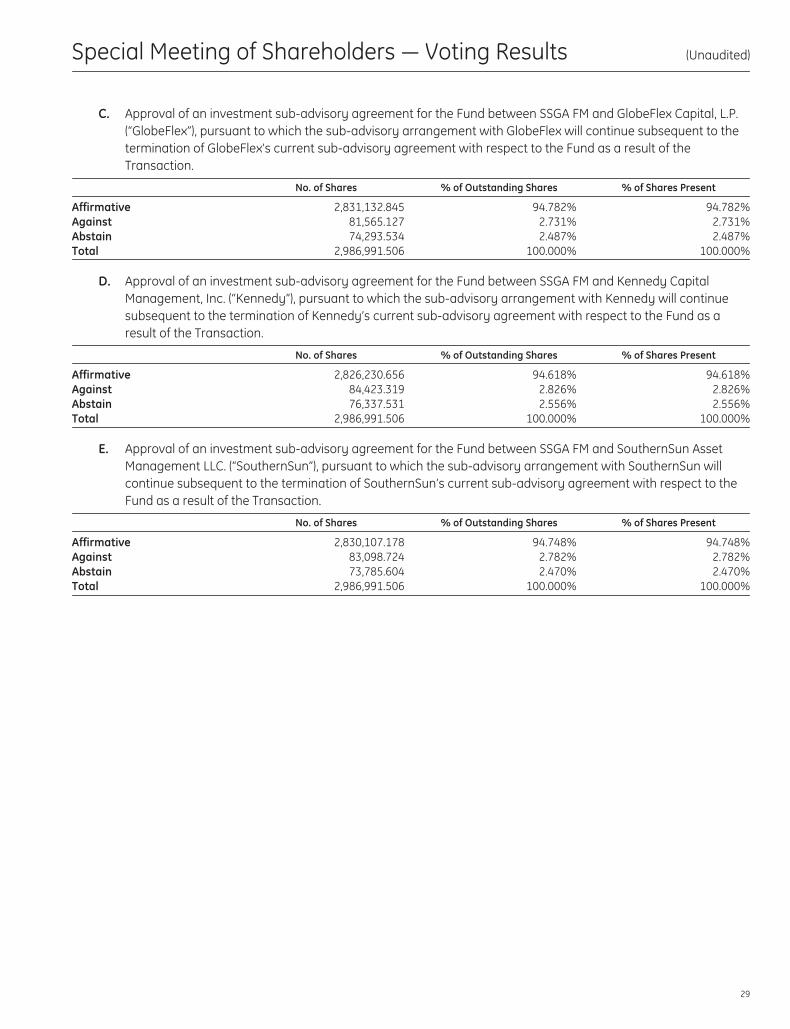
Special Meeting of Shareholders — Voting Results (Unaudited)
C. Approval of an investment sub-advisory agreement for the Fund between SSGA FM and GlobeFlex Capital, L.P.(“GlobeFlex”), pursuant to which the sub-advisory arrangement with GlobeFlex will continue subsequent to thetermination of GlobeFlex’s current sub-advisory agreement with respect to the Fund as a result of theTransaction.
No. of Shares % of Outstanding Shares % of Shares Present
Affirmative 2,831,132.845 94.782% 94.782%Against 81,565.127 2.731% 2.731%Abstain 74,293.534 2.487% 2.487%Total 2,986,991.506 100.000% 100.000%
D. Approval of an investment sub-advisory agreement for the Fund between SSGA FM and Kennedy CapitalManagement, Inc. (“Kennedy”), pursuant to which the sub-advisory arrangement with Kennedy will continuesubsequent to the termination of Kennedy’s current sub-advisory agreement with respect to the Fund as aresult of the Transaction.
No. of Shares % of Outstanding Shares % of Shares Present
Affirmative 2,826,230.656 94.618% 94.618%Against 84,423.319 2.826% 2.826%Abstain 76,337.531 2.556% 2.556%Total 2,986,991.506 100.000% 100.000%
E. Approval of an investment sub-advisory agreement for the Fund between SSGA FM and SouthernSun AssetManagement LLC. (“SouthernSun”), pursuant to which the sub-advisory arrangement with SouthernSun willcontinue subsequent to the termination of SouthernSun’s current sub-advisory agreement with respect to theFund as a result of the Transaction.
No. of Shares % of Outstanding Shares % of Shares Present
Affirmative 2,830,107.178 94.748% 94.748%Against 83,098.724 2.782% 2.782%Abstain 73,785.604 2.470% 2.470%Total 2,986,991.506 100.000% 100.000%
29
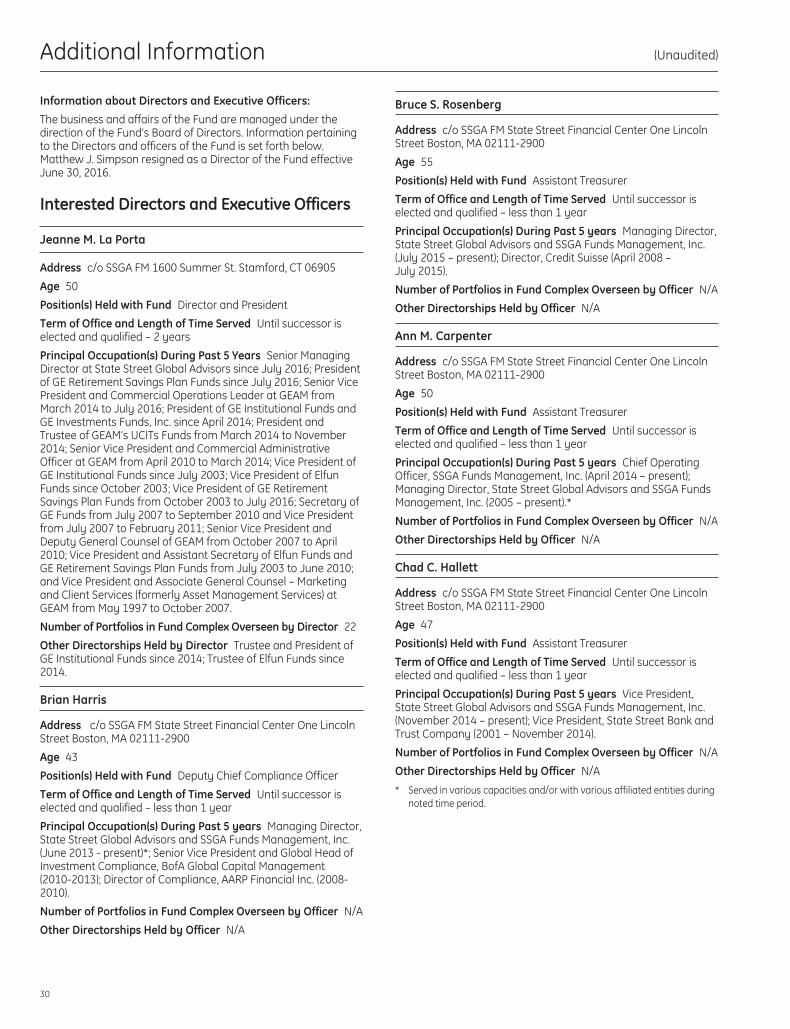
Additional Information (Unaudited)
Information about Directors and Executive Officers:
The business and affairs of the Fund are managed under thedirection of the Fund’s Board of Directors. Information pertainingto the Directors and officers of the Fund is set forth below.Matthew J. Simpson resigned as a Director of the Fund effectiveJune 30, 2016.
Interested Directors and Executive Officers
Jeanne M. La Porta
Address c/o SSGA FM 1600 Summer St. Stamford, CT 06905
Age 50
Position(s) Held with Fund Director and President
Term of Office and Length of Time Served Until successor iselected and qualified – 2 years
Principal Occupation(s) During Past 5 Years Senior ManagingDirector at State Street Global Advisors since July 2016; Presidentof GE Retirement Savings Plan Funds since July 2016; Senior VicePresident and Commercial Operations Leader at GEAM fromMarch 2014 to July 2016; President of GE Institutional Funds andGE Investments Funds, Inc. since April 2014; President andTrustee of GEAM’s UCITs Funds from March 2014 to November2014; Senior Vice President and Commercial AdministrativeOfficer at GEAM from April 2010 to March 2014; Vice President ofGE Institutional Funds since July 2003; Vice President of ElfunFunds since October 2003; Vice President of GE RetirementSavings Plan Funds from October 2003 to July 2016; Secretary ofGE Funds from July 2007 to September 2010 and Vice Presidentfrom July 2007 to February 2011; Senior Vice President andDeputy General Counsel of GEAM from October 2007 to April2010; Vice President and Assistant Secretary of Elfun Funds andGE Retirement Savings Plan Funds from July 2003 to June 2010;and Vice President and Associate General Counsel – Marketingand Client Services (formerly Asset Management Services) atGEAM from May 1997 to October 2007.
Number of Portfolios in Fund Complex Overseen by Director 22
Other Directorships Held by Director Trustee and President ofGE Institutional Funds since 2014; Trustee of Elfun Funds since2014.
Brian Harris
Address c/o SSGA FM State Street Financial Center One LincolnStreet Boston, MA 02111-2900
Age 43
Position(s) Held with Fund Deputy Chief Compliance Officer
Term of Office and Length of Time Served Until successor iselected and qualified – less than 1 year
Principal Occupation(s) During Past 5 years Managing Director,State Street Global Advisors and SSGA Funds Management, Inc.(June 2013 - present)*; Senior Vice President and Global Head ofInvestment Compliance, BofA Global Capital Management(2010-2013); Director of Compliance, AARP Financial Inc. (2008-2010).
Number of Portfolios in Fund Complex Overseen by Officer N/A
Other Directorships Held by Officer N/A
Bruce S. Rosenberg
Address c/o SSGA FM State Street Financial Center One LincolnStreet Boston, MA 02111-2900
Age 55
Position(s) Held with Fund Assistant Treasurer
Term of Office and Length of Time Served Until successor iselected and qualified – less than 1 year
Principal Occupation(s) During Past 5 years Managing Director,State Street Global Advisors and SSGA Funds Management, Inc.(July 2015 – present); Director, Credit Suisse (April 2008 –July 2015).
Number of Portfolios in Fund Complex Overseen by Officer N/A
Other Directorships Held by Officer N/A
Ann M. Carpenter
Address c/o SSGA FM State Street Financial Center One LincolnStreet Boston, MA 02111-2900
Age 50
Position(s) Held with Fund Assistant Treasurer
Term of Office and Length of Time Served Until successor iselected and qualified – less than 1 year
Principal Occupation(s) During Past 5 years Chief OperatingOfficer, SSGA Funds Management, Inc. (April 2014 – present);Managing Director, State Street Global Advisors and SSGA FundsManagement, Inc. (2005 – present).*
Number of Portfolios in Fund Complex Overseen by Officer N/A
Other Directorships Held by Officer N/A
Chad C. Hallett
Address c/o SSGA FM State Street Financial Center One LincolnStreet Boston, MA 02111-2900
Age 47
Position(s) Held with Fund Assistant Treasurer
Term of Office and Length of Time Served Until successor iselected and qualified – less than 1 year
Principal Occupation(s) During Past 5 years Vice President,State Street Global Advisors and SSGA Funds Management, Inc.(November 2014 – present); Vice President, State Street Bank andTrust Company (2001 – November 2014).
Number of Portfolios in Fund Complex Overseen by Officer N/A
Other Directorships Held by Officer N/A
* Served in various capacities and/or with various affiliated entities duringnoted time period.
30
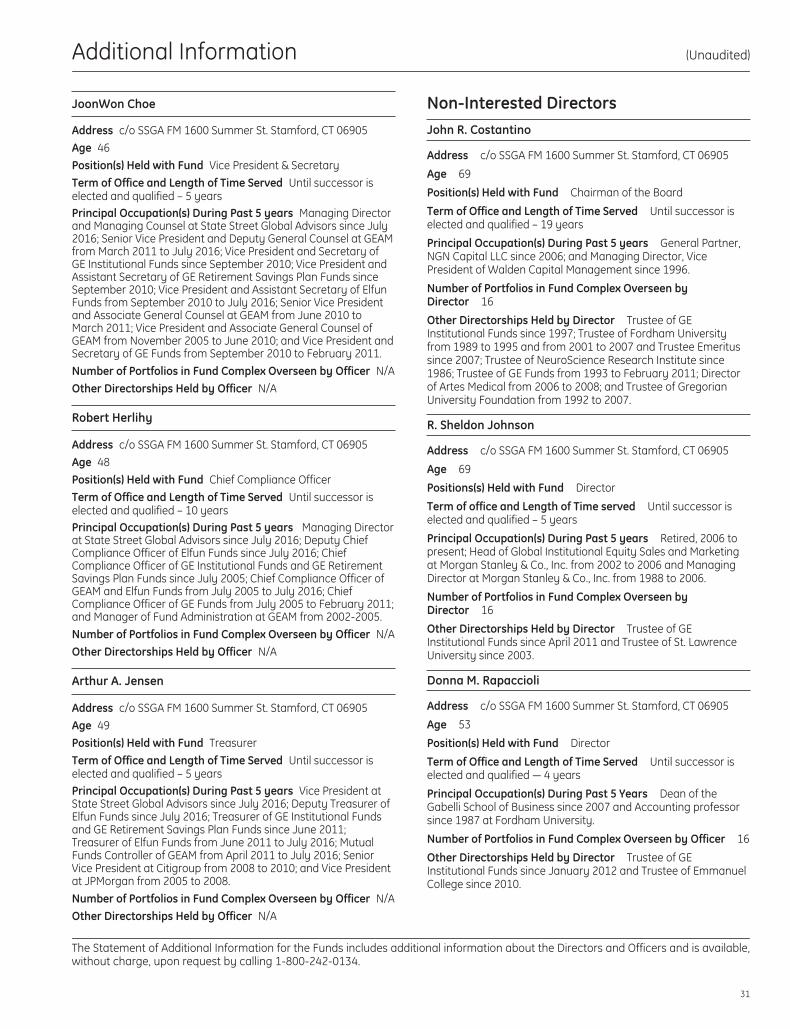
Additional Information (Unaudited)
JoonWon Choe
Address c/o SSGA FM 1600 Summer St. Stamford, CT 06905
Age 46
Position(s) Held with Fund Vice President & Secretary
Term of Office and Length of Time Served Until successor iselected and qualified – 5 yearsPrincipal Occupation(s) During Past 5 years Managing Directorand Managing Counsel at State Street Global Advisors since July2016; Senior Vice President and Deputy General Counsel at GEAMfrom March 2011 to July 2016; Vice President and Secretary ofGE Institutional Funds since September 2010; Vice President andAssistant Secretary of GE Retirement Savings Plan Funds sinceSeptember 2010; Vice President and Assistant Secretary of ElfunFunds from September 2010 to July 2016; Senior Vice Presidentand Associate General Counsel at GEAM from June 2010 toMarch 2011; Vice President and Associate General Counsel ofGEAM from November 2005 to June 2010; and Vice President andSecretary of GE Funds from September 2010 to February 2011.
Number of Portfolios in Fund Complex Overseen by Officer N/A
Other Directorships Held by Officer N/A
Robert Herlihy
Address c/o SSGA FM 1600 Summer St. Stamford, CT 06905
Age 48
Position(s) Held with Fund Chief Compliance Officer
Term of Office and Length of Time Served Until successor iselected and qualified – 10 yearsPrincipal Occupation(s) During Past 5 years Managing Directorat State Street Global Advisors since July 2016; Deputy ChiefCompliance Officer of Elfun Funds since July 2016; ChiefCompliance Officer of GE Institutional Funds and GE RetirementSavings Plan Funds since July 2005; Chief Compliance Officer ofGEAM and Elfun Funds from July 2005 to July 2016; ChiefCompliance Officer of GE Funds from July 2005 to February 2011;and Manager of Fund Administration at GEAM from 2002-2005.
Number of Portfolios in Fund Complex Overseen by Officer N/A
Other Directorships Held by Officer N/A
Arthur A. Jensen
Address c/o SSGA FM 1600 Summer St. Stamford, CT 06905
Age 49
Position(s) Held with Fund Treasurer
Term of Office and Length of Time Served Until successor iselected and qualified – 5 yearsPrincipal Occupation(s) During Past 5 years Vice President atState Street Global Advisors since July 2016; Deputy Treasurer ofElfun Funds since July 2016; Treasurer of GE Institutional Fundsand GE Retirement Savings Plan Funds since June 2011;Treasurer of Elfun Funds from June 2011 to July 2016; MutualFunds Controller of GEAM from April 2011 to July 2016; SeniorVice President at Citigroup from 2008 to 2010; and Vice Presidentat JPMorgan from 2005 to 2008.
Number of Portfolios in Fund Complex Overseen by Officer N/A
Other Directorships Held by Officer N/A
Non-Interested DirectorsJohn R. Costantino
Address c/o SSGA FM 1600 Summer St. Stamford, CT 06905
Age 69
Position(s) Held with Fund Chairman of the Board
Term of Office and Length of Time Served Until successor iselected and qualified – 19 years
Principal Occupation(s) During Past 5 years General Partner,NGN Capital LLC since 2006; and Managing Director, VicePresident of Walden Capital Management since 1996.
Number of Portfolios in Fund Complex Overseen byDirector 16
Other Directorships Held by Director Trustee of GEInstitutional Funds since 1997; Trustee of Fordham Universityfrom 1989 to 1995 and from 2001 to 2007 and Trustee Emeritussince 2007; Trustee of NeuroScience Research Institute since1986; Trustee of GE Funds from 1993 to February 2011; Directorof Artes Medical from 2006 to 2008; and Trustee of GregorianUniversity Foundation from 1992 to 2007.
R. Sheldon Johnson
Address c/o SSGA FM 1600 Summer St. Stamford, CT 06905
Age 69
Positions(s) Held with Fund Director
Term of office and Length of Time served Until successor iselected and qualified – 5 years
Principal Occupation(s) During Past 5 years Retired, 2006 topresent; Head of Global Institutional Equity Sales and Marketingat Morgan Stanley & Co., Inc. from 2002 to 2006 and ManagingDirector at Morgan Stanley & Co., Inc. from 1988 to 2006.
Number of Portfolios in Fund Complex Overseen byDirector 16
Other Directorships Held by Director Trustee of GEInstitutional Funds since April 2011 and Trustee of St. LawrenceUniversity since 2003.
Donna M. Rapaccioli
Address c/o SSGA FM 1600 Summer St. Stamford, CT 06905
Age 53
Position(s) Held with Fund Director
Term of Office and Length of Time Served Until successor iselected and qualified — 4 years
Principal Occupation(s) During Past 5 Years Dean of theGabelli School of Business since 2007 and Accounting professorsince 1987 at Fordham University.
Number of Portfolios in Fund Complex Overseen by Officer 16
Other Directorships Held by Director Trustee of GEInstitutional Funds since January 2012 and Trustee of EmmanuelCollege since 2010.
The Statement of Additional Information for the Funds includes additional information about the Directors and Officers and is available,without charge, upon request by calling 1-800-242-0134.
31
Investment Team (Unaudited)
Investment Adviser and AdministratorSSGA Funds Management, Inc.
Board of DirectorsJohn R. Costantino, Chairman
R. Sheldon Johnson
Jeanne M. La Porta
Donna M. Rapaccioli
SecretaryJoonWon Choe
Assistant SecretaryMichelle Matzelle
TreasurerArthur A. Jensen
Assistant TreasurersBruce S. Rosenberg
Ann M. Carpenter
Chad C. Hallett
DistributorState Street Global Markets, LLCMember FINRA and SIPC
CustodianState Street Bank & Trust Company
32


Investment AdviserSSGA Funds Management, Inc.1600 Summer StreetStamford, CT 06905or at:P.O. Box 7900Stamford, CT 06904-7900
DistributorState Street Global Markets, LLCMember FINRA and SIPCState Street Financial CenterOne Lincoln StreetBoston, MA 02111
www.geam.com
The Fund files its complete schedule of portfolio holdings with the Securities and Exchange Commission for the firstand third quarters of each fiscal year on Form N-Q. The Fund’s Forms N-Q, as well as a description of the policies andprocedures that the Fund uses to determine how to vote proxies (if any) relating to portfolio securities is availablewithout charge (i) upon request, by calling 1-800-242-0134; (ii) on the Fund’s website at http://www.geam.com; and(iii) on the Commission’s website at http://www.sec.gov. The Fund’s Forms N-Q may be reviewed and copied at theCommission’s Public Reference Room in Washington, DC – information on the operation of the Public Reference Roommay be obtained by calling 1-800-SEC-0330.
Information (if any) regarding how the Fund voted proxies relating to portfolio securities during the most recentlydisclosed 12-month period ended June 30 is available without charge (i) through the Fund’s website athttp://www.geam.com; and (ii) on the Commission’s website at http://www.sec.gov.