Embed Size (px)
Citation preview

GEELONG LEATHER PTY LTD
ANNUAL PERFORMANCE SYSTEM REPORT 2016
Jay Stottelaar [email protected]
116 Schnaars Road, Culcairn NSW 2640
Abstract Environmental Protection License
License Number 3465
Reporting Period 27-Sep-2015 to 26-Sep-2016

GEELONG LEATHER PTY LTD
ANNUAL PERFORMANCE SYSTEM REPORT 2016 REVISION: 1
DATE: 27/10/2016
IRRISEC1-12_EPA ANNUAL RETURN_LIC NO 3465_SEP2015 – SEP2016 1
This document was prepared for the sole use of Geelong Leather Pty Ltd and the New South Wales
Environmental Protection Authority and the private individuals provided with a copy of the report
by Geelong Leather. These are the only intended beneficiaries of our work. No other party should
rely on the information contained herein without the prior written consent of Geelong Leather Pty
Ltd.

GEELONG LEATHER PTY LTD
ANNUAL PERFORMANCE SYSTEM REPORT 2016 REVISION: 1
DATE: 27/10/2016
IRRISEC1-12_EPA ANNUAL RETURN_LIC NO 3465_SEP2015 – SEP2016 2
TABLE OF CONTENTS
1. Irrigation Operations .......................................................................................................................... 3
2. Mean Laboratory Results .................................................................................................................... 6
3. Sampling Data .................................................................................................................................... 9
3.1. Electrical Conductivity Trends ............................................................................................................. 10
3.2. Chloride Trends ................................................................................................................................... 12
4. Sample Depths and Sample Locations ............................................................................................... 16
4.1. Sample Depths ..................................................................................................................................... 16
4.2. Sample Locations (GPS Points) ............................................................................................................ 16
5. Mass Balance ................................................................................................................................... 16
5.1. Industry Standards .............................................................................................................................. 17
5.2. Table: Nutrient Removal ..................................................................................................................... 17
5.3. Geelong Leather 2014 Farming Operation Summary ......................................................................... 18
5.4. Table: Nutrient Uptake ........................................................................................................................ 18
6. Hydraulic Balance ............................................................................................................................. 19
6.1. The Water Balance .............................................................................................................................. 19
6.2. Precipitation ........................................................................................................................................ 19
6.3. Effluent Applied ................................................................................................................................... 19
6.4. Evapotranspiration .............................................................................................................................. 20
6.5. Crop Factors......................................................................................................................................... 20
6.6. Percolation .......................................................................................................................................... 20
6.7. Run-off ................................................................................................................................................. 21
6.8. Total Water Balance for each sector based on 150ML / year total irrigation and proportional
application .......................................................................................................................................... 21
6.8.1. Irrigation Sectors 1 – 9, 11, 12 ............................................................................................................ 21
6.8.2. Irrigation Sectors 10, 11 ..................................................................................................................... 21
6.9. Hydraulic Loading Tables ..................................................................................................................... 22
7. Soil Conditions ................................................................................................................................. 34
8. Vegetation Conditions ...................................................................................................................... 35
9. Assessment of Performance of the Cropping Scheme ........................................................................ 35
10. Identified Sustainability Indicators .................................................................................................. 36
10.1. Irrigation Management ....................................................................................................................... 36
10.2. Crop Selection...................................................................................................................................... 36

GEELONG LEATHER PTY LTD
ANNUAL PERFORMANCE SYSTEM REPORT 2016 REVISION: 1
DATE: 27/10/2016
IRRISEC1-12_EPA ANNUAL RETURN_LIC NO 3465_SEP2015 – SEP2016 3
11. Impacts .......................................................................................................................................... 37
11.1. Irrigation Sector 2, 4, 6 ........................................................................................................................ 37
11.2. Irrigation Sector 1 -12 .......................................................................................................................... 37
12. Recommendations for Future Actions ............................................................................................. 38
12.1. Irrigation Sector 2, 4, 6 ........................................................................................................................ 38
12.2. Irrigation Sector 1 - 12 ......................................................................................................................... 38
12.3. Procurement of Additional Land ......................................................................................................... 38
13. Declaration .................................................................................................................................... 39
14. References ..................................................................................................................................... 40
Appendixes .......................................................................................................................................... 41
GPS Sample Point Site Map ..............................................................................................................................
GLC Annual Soil Analysis Summary...................................................................................................................

GEELONG LEATHER PTY LTD
ANNUAL PERFORMANCE SYSTEM REPORT 2016 REVISION: 1
DATE: 27/10/2016
IRRISEC1-12_EPA ANNUAL RETURN_LIC NO 3465_SEP2015 – SEP2016 4
1. IRRIGATION OPERATIONS
1.1. Irrigation Sector 1
AREA IRRIGATED 10.5 Ha ACTUAL FRESH WATER APPLIED 766,000 Lt
SET TOTAL EFFLUENT APPLICATION 10,500,000 Lt SET APPLICATION RATE 1 ML/Ha
ACTUAL EFFLUENT APPLIED 10,311,813 Lt ACTUAL APPLICATION RATE 0.98 ML/Ha
1.2. Irrigation Sector 2
AREA IRRIGATED 10.5 Ha ACTUAL FRESH WATER APPLIED 386,000 Lt
SET TOTAL EFFLUENT APPLICATION 10,500,000 Lt SET APPLICATION RATE 1 ML/Ha
ACTUAL EFFLUENT APPLIED 10,148,156 Lt ACTUAL APPLICATION RATE 0.97 ML/Ha
1.3. Irrigation Sector 3
AREA IRRIGATED 10.5 Ha ACTUAL FRESH WATER APPLIED 324,100 Lt
SET TOTAL EFFLUENT APPLICATION 10,500,000 Lt SET APPLICATION RATE 1 ML/Ha
ACTUAL EFFLUENT APPLIED 11,589,616 Lt ACTUAL APPLICATION RATE 1.10 ML/Ha
1.4. Irrigation Sector 4
AREA IRRIGATED 10.5 Ha ACTUAL FRESH WATER APPLIED 236,800 Lt
SET TOTAL EFFLUENT APPLICATION 10,500,000 Lt SET APPLICATION RATE 1 ML/Ha
ACTUAL EFFLUENT APPLIED 7,237,772 Lt ACTUAL APPLICATION RATE 0.69 ML/Ha
1.5. Irrigation Sector 5
AREA IRRIGATED 10.5 Ha ACTUAL FRESH WATER APPLIED 338,000 Lt
SET TOTAL EFFLUENT APPLICATION 10,500,000 Lt SET APPLICATION RATE 1 ML/Ha
ACTUAL EFFLUENT APPLIED 10,412,872 Lt ACTUAL APPLICATION RATE 0.99 ML/Ha
Indicates over the set application
rate

GEELONG LEATHER PTY LTD
ANNUAL PERFORMANCE SYSTEM REPORT 2016 REVISION: 1
DATE: 27/10/2016
IRRISEC1-12_EPA ANNUAL RETURN_LIC NO 3465_SEP2015 – SEP2016 5
1.6. Irrigation Sector 6
AREA IRRIGATED 10.5 Ha ACTUAL FRESH WATER APPLIED 337,500 Lt
SET TOTAL EFFLUENT APPLICATION 10,500,000 Lt SET APPLICATION RATE 1 ML/Ha
ACTUAL EFFLUENT APPLIED 10,139,575 Lt ACTUAL APPLICATION RATE 0.97 ML/Ha
1.7. Irrigation Sector 7
AREA IRRIGATED 10.5 Ha ACTUAL FRESH WATER APPLIED 4,355,021 Lt
SET TOTAL EFFLUENT APPLICATION 10,500,000 Lt SET APPLICATION RATE 1 ML/Ha
ACTUAL EFFLUENT APPLIED 12,863,465 Lt ACTUAL APPLICATION RATE 1.23 ML/Ha
1.8. Irrigation Sector 8
AREA IRRIGATED 10.5 Ha ACTUAL FRESH WATER APPLIED 4,138,021 Lt
SET TOTAL EFFLUENT APPLICATION 10,500,000 Lt SET APPLICATION RATE 1 ML/Ha
ACTUAL EFFLUENT APPLIED 9,063,000 Lt ACTUAL APPLICATION RATE 0.86 ML/Ha
1.9. Irrigation Sector 9
AREA IRRIGATED 10.5 Ha ACTUAL FRESH WATER APPLIED 7,577,472 Lt
SET TOTAL EFFLUENT APPLICATION 10,500,000 Lt SET APPLICATION RATE 1 ML/Ha
ACTUAL EFFLUENT APPLIED 12,830,372 Lt ACTUAL APPLICATION RATE 1.22 ML/Ha
1.10. Irrigation Sector 10
AREA IRRIGATED 10.5 Ha ACTUAL FRESH WATER APPLIED 7,744,772 Lt
SET TOTAL EFFLUENT APPLICATION 10,500,000 Lt SET APPLICATION RATE 1 ML/Ha
ACTUAL EFFLUENT APPLIED 15,009,544 Lt ACTUAL APPLICATION RATE 1.43 ML/Ha
1.11. Irrigation Sector 11
AREA IRRIGATED 10.5 Ha ACTUAL FRESH WATER APPLIED 698,000 Lt
SET TOTAL EFFLUENT APPLICATION 10,500,000 Lt SET APPLICATION RATE 1 ML/Ha
ACTUAL EFFLUENT APPLIED 9,922,252 Lt ACTUAL APPLICATION RATE 0.94 ML/Ha

GEELONG LEATHER PTY LTD
ANNUAL PERFORMANCE SYSTEM REPORT 2016 REVISION: 1
DATE: 27/10/2016
IRRISEC1-12_EPA ANNUAL RETURN_LIC NO 3465_SEP2015 – SEP2016 6
1.12. Irrigation Sector 12
AREA IRRIGATED 10.5 Ha ACTUAL FRESH WATER APPLIED 3,377,853 Lt
SET TOTAL EFFLUENT APPLICATION 10,500,000 Lt SET APPLICATION RATE 1 ML/Ha
ACTUAL EFFLUENT APPLIED 10,987,503 Lt ACTUAL APPLICATION RATE 1.05 ML/Ha

GEELONG LEATHER PTY LTD
ANNUAL PERFORMANCE SYSTEM REPORT 2016 REVISION: 1
DATE: 27/10/2016
IRRISEC1-12_EPA ANNUAL RETURN_LIC NO 3465_SEP2015 – SEP2016 7
2. MEAN LABORATORY RESULTS
2.1. Irrigation Sector 1
Chloride – mg/kg 37 Exchangeable Nitrate – mg/kg 39
Conductivity – µS/cm 330 Colwell P – mg/kg 24
Exchangeable Calcium – mg/kg 1328 Nitrogen TKN-N – mg/kg 827
Exchangeable Magnesium – mg/kg 561 Organic Carbon - % 0.71
Exchangeable Potassium – mg/kg 167 pH 5.67
Exchangeable Sodium – mg/kg 565 Phosphorus – mg/kg 130
2.2. Irrigation Sector 2
Chloride – mg/kg 45 Exchangeable Nitrate – mg/kg 54
Conductivity – µS/cm 493 Colwell P – mg/kg 493
Exchangeable Calcium – mg/kg 1254 Nitrogen TKN-N – mg/kg 1178
Exchangeable Magnesium – mg/kg 329 Organic Carbon - % 0.85
Exchangeable Potassium – mg/kg 189 pH 5.37
Exchangeable Sodium – mg/kg 469 Phosphorus – mg/kg 155
2.3. Irrigation Sector 3
Chloride – mg/kg 24 Exchangeable Nitrate – mg/kg 17
Conductivity – µS/cm 653 Colwell P – mg/kg 16
Exchangeable Calcium – mg/kg 1654 Nitrogen TKN-N – mg/kg 682
Exchangeable Magnesium – mg/kg 179 Organic Carbon - % 0.63
Exchangeable Potassium – mg/kg 183 pH 7.74
Exchangeable Sodium – mg/kg 143 Phosphorus – mg/kg 126
2.4. Irrigation Sector 4
Chloride – mg/kg 34 Exchangeable Nitrate – mg/kg 29
Conductivity – µS/cm 1667 Colwell P – mg/kg 14
Exchangeable Calcium – mg/kg 2406 Nitrogen TKN-N – mg/kg 1070
Exchangeable Magnesium – mg/kg 487 Organic Carbon - % 0.66
Exchangeable Potassium – mg/kg 173 pH 5.20
Exchangeable Sodium – mg/kg 897 Phosphorus – mg/kg 122

GEELONG LEATHER PTY LTD
ANNUAL PERFORMANCE SYSTEM REPORT 2016 REVISION: 1
DATE: 27/10/2016
IRRISEC1-12_EPA ANNUAL RETURN_LIC NO 3465_SEP2015 – SEP2016 8
2.5. Irrigation Sector 5
Chloride – mg/kg 36 Exchangeable Nitrate – mg/kg 32
Conductivity – µS/cm 370 Colwell P – mg/kg 10
Exchangeable Calcium – mg/kg 754 Nitrogen TKN-N – mg/kg 733
Exchangeable Magnesium – mg/kg 174 Organic Carbon - % 0.60
Exchangeable Potassium – mg/kg 127 pH 5.22
Exchangeable Sodium – mg/kg 325 Phosphorus – mg/kg 172
2.6. Irrigation Sector 6
Chloride – mg/kg 38 Exchangeable Nitrate – mg/kg 32
Conductivity – µS/cm 350 Colwell P – mg/kg 9
Exchangeable Calcium – mg/kg 1386 Nitrogen TKN-N – mg/kg 1100
Exchangeable Magnesium – mg/kg 438 Organic Carbon - % 1.01
Exchangeable Potassium – mg/kg 115 pH 5.05
Exchangeable Sodium – mg/kg 423 Phosphorus – mg/kg 176
2.7. Irrigation Sector 7
Chloride – mg/kg 50 Exchangeable Nitrate – mg/kg 13
Conductivity – µS/cm 183 Colwell P – mg/kg 12
Exchangeable Calcium – mg/kg 986 Nitrogen TKN-N – mg/kg 585
Exchangeable Magnesium – mg/kg 379 Organic Carbon - % 0.44
Exchangeable Potassium – mg/kg 54 pH 5.89
Exchangeable Sodium – mg/kg 350 Phosphorus – mg/kg 105
2.8. Irrigation Sector 8
Chloride – mg/kg 22 Exchangeable Nitrate – mg/kg 12
Conductivity – µS/cm 166 Colwell P – mg/kg 2
Exchangeable Calcium – mg/kg 796 Nitrogen TKN-N – mg/kg 654
Exchangeable Magnesium – mg/kg 280 Organic Carbon - % 0.47
Exchangeable Potassium – mg/kg 133 pH 5.68
Exchangeable Sodium – mg/kg 198 Phosphorus – mg/kg 142

GEELONG LEATHER PTY LTD
ANNUAL PERFORMANCE SYSTEM REPORT 2016 REVISION: 1
DATE: 27/10/2016
IRRISEC1-12_EPA ANNUAL RETURN_LIC NO 3465_SEP2015 – SEP2016 9
2.9. Irrigation Sector 9
Chloride – mg/kg 23 Exchangeable Nitrate – mg/kg 7
Conductivity – µS/cm 183 Colwell P – mg/kg 9
Exchangeable Calcium – mg/kg 703 Nitrogen TKN-N – mg/kg 426
Exchangeable Magnesium – mg/kg 309 Organic Carbon - % 0.36
Exchangeable Potassium – mg/kg 37 pH 5.29
Exchangeable Sodium – mg/kg 245 Phosphorus – mg/kg 76
2.10. Irrigation Sector 10
Chloride – mg/kg 21 Exchangeable Nitrate – mg/kg 9
Conductivity – µS/cm 183 Colwell P – mg/kg 15
Exchangeable Calcium – mg/kg 749 Nitrogen TKN-N – mg/kg 390
Exchangeable Magnesium – mg/kg 251 Organic Carbon - % 0.32
Exchangeable Potassium – mg/kg 86 pH 5.35
Exchangeable Sodium – mg/kg 174 Phosphorus – mg/kg 98
2.11. Irrigation Sector 11
Chloride – mg/kg 95 Exchangeable Nitrate – mg/kg 18.43
Conductivity – µS/cm 226 Colwell P – mg/kg 3
Exchangeable Calcium – mg/kg 1228 Nitrogen TKN-N – mg/kg 741
Exchangeable Magnesium – mg/kg 579 Organic Carbon - % 0.57
Exchangeable Potassium – mg/kg 129 pH 6.31
Exchangeable Sodium – mg/kg 497 Phosphorus – mg/kg 115
2.12. Irrigation Sector 12
Chloride – mg/kg 58 Exchangeable Nitrate – mg/kg 18
Conductivity – µS/cm 113 Colwell P – mg/kg 9
Exchangeable Calcium – mg/kg 1457 Nitrogen TKN-N – mg/kg 512
Exchangeable Magnesium – mg/kg 264 Organic Carbon - % 0.31
Exchangeable Potassium – mg/kg 248 pH 6.78
Exchangeable Sodium – mg/kg 117 Phosphorus – mg/kg 111

GEELONG LEATHER PTY LTD
ANNUAL PERFORMANCE SYSTEM REPORT 2016 REVISION: 1
DATE: 27/10/2016
IRRISEC1-12_EPA ANNUAL RETURN_LIC NO 3465_SEP2015 – SEP2016 10
3. SAMPLING DATA
3.1. Electrical Conductivity Trends
Sector 1 2006 2007 2008 2009 2010 2011 2012 2013 2014 2015
0-10cm 5 9 2 3 2 4 4 1
10-30cm 2 6 7 3 4 3 4 4 3
30-60cm 3 6 6 9 6 4 4 6 3 4
Sector 2 2006 2007 2008 2009 2010 2011 2012 2013 2014 2015
0-10cm 6 7 2 4 2 4 7 2
10-30cm 5 8 11 4 4 3 5 9 5
30-60cm 4 4 10 13 6 2 8 10 8 6
Sector 3 2006 2007 2008 2009 2010 2011 2012 2013 2014 2015
0-10cm 8 10 2 3 1 10 1 1
10-30cm 6 5 6 1 2 1 1 1 7
30-60cm 10 9 6 5 3 2 2 2 2 9
Sector 4 2006 2007 2008 2009 2010 2011 2012 2013 2014 2015
0-10cm 14 10 11 13 4 4 5 5
10-30cm 19 16 14 10 10 9 7 3 5
30-60cm 20 10 13 11 9 15 6 12 6 5
Sector 5 2006 2007 2008 2009 2010 2011 2012 2013 2014 2015
0-10cm 5 4 3 6 2 2 4 2
10-30cm 10 2 3 1 3 2 2 3 3
30-60cm 8 3 4 3 2 3 2 3 3 4
Non-saline <2
Slightly saline 2 to 4
Moderately saline 4 to 8
Highly saline 8 to 16
Extremely saline >16

GEELONG LEATHER PTY LTD
ANNUAL PERFORMANCE SYSTEM REPORT 2016 REVISION: 1
DATE: 27/10/2016
IRRISEC1-12_EPA ANNUAL RETURN_LIC NO 3465_SEP2015 – SEP2016 11
Sector 6 2006 2007 2008 2009 2010 2011 2012 2013 2014 2015
0-10cm 7 9 2 5 5 4 5 4
10-30cm 1 3 5 1 3 3 3 4 3
30-60cm 3 5 4 2 3 5 4 6 3
Sector 7 2006 2007 2008 2009 2010 2011 2012 2013 2014 2015
0-10cm 1 6 1 1 1 10 1 1
10-30cm 4 1 2 1 0 2 5 1 2
30-60cm 2 2 1 2 1 1 1 4 1 2
Sector 8 2006 2007 2008 2009 2010 2011 2012 2013 2014 2015
0-10cm 2 26 2 3 3 11 1 0
10-30cm 2 2 6 1 3 2 5 2 1
30-60cm 2 1 1 5 2 2 2 3 2 2
Sector 9 2006 2007 2008 2009 2010 2011 2012 2013 2014 2015
0-10cm 9 11 7 2 4 2 3 0
10-30cm 1 6 7 4 2 2 3 2 1
30-60cm 1 2 5 6 4 4 3 3 3 3
Sector 10 2006 2007 2008 2009 2010 2011 2012 2013 2014 2015
0-10cm 2 2 4 1 2 2 1 1
10-30cm 1 2 2 1 1 1 2 1 2
30-60cm 1 2 2 2 1 1 2 3 1 2
Sector 11 2006 2007 2008 2009 2010 2011 2012 2013 2014 2015
0-10cm 11 13 3 5 8 2 2 1
10-30cm 2 7 5 3 3 5 4 3 2
30-60cm 2 2 4 5 5 4 4 6 5 3

GEELONG LEATHER PTY LTD
ANNUAL PERFORMANCE SYSTEM REPORT 2016 REVISION: 1
DATE: 27/10/2016
IRRISEC1-12_EPA ANNUAL RETURN_LIC NO 3465_SEP2015 – SEP2016 12
Sector 12 2006 2007 2008 2009 2010 2011 2012 2013 2014 2015
0-10cm 1 6 2 1 1 1 2 1
10-30cm 1 0 3 1 1 2 3 4 1
30-60cm 2 2 0 4 3 2 1 1 3 1
3.2. Chloride Trends
050
100150200250300350400450500550600
2006 2007 2008 2009 2010 2011 2012 2013 2014 2015
Ch
lori
de
(m
g/k
g)
Year
Sector 1 Chloride (mg/kg)
0-10cm
10-30cm
30-60cm
050
100150200250300350400450500550600
2006 2007 2008 2009 2010 2011 2012 2013 2014 2015
Ch
lori
de
(m
g/k
g)
Year
Sector 2 Chloride (mg/kg)
0-10cm
10-30cm
30-60cm

GEELONG LEATHER PTY LTD
ANNUAL PERFORMANCE SYSTEM REPORT 2016 REVISION: 1
DATE: 27/10/2016
IRRISEC1-12_EPA ANNUAL RETURN_LIC NO 3465_SEP2015 – SEP2016 13
050
100150200250300350400450500550600
2006 2007 2008 2009 2010 2011 2012 2013 2014 2015
Ch
lori
de
(m
g/k
g)
Year
Sector 3 Chloride (mg/kg)
0-10cm
10-30cm
30-60cm
050
100150200250300350400450500550600
2006 2007 2008 2009 2010 2011 2012 2013 2014 2015
Ch
lori
de
(m
g/k
g)
Year
Sector 4 Chloride (mg/kg)
0-10cm
10-30cm
30-60cm
050
100150200250300350400450500550600
2006 2007 2008 2009 2010 2011 2012 2013 2014 2015
Ch
lori
de
(m
g/k
g)
Year
Sector 5 Chloride (mg/kg)
0-10cm
10-30cm
30-60cm

GEELONG LEATHER PTY LTD
ANNUAL PERFORMANCE SYSTEM REPORT 2016 REVISION: 1
DATE: 27/10/2016
IRRISEC1-12_EPA ANNUAL RETURN_LIC NO 3465_SEP2015 – SEP2016 14
050
100150200250300350400450500550600
2006 2007 2008 2009 2010 2011 2012 2013 2014 2015
Ch
lori
de
(m
g/k
g)
Year
Sector 6 Chloride (mg/kg)
0-10cm
10-30cm
30-60cm
050
100150200250300350400450500550600
2006 2007 2008 2009 2010 2011 2012 2013 2014 2015
Ch
lori
de
(m
g/k
g)
Year
Sector 7 Chloride (mg/kg)
0-10cm
10-30cm
30-60cm
050
100150200250300350400450500550600
2006 2007 2008 2009 2010 2011 2012 2013 2014 2015
Ch
lori
de
(m
g/k
g)
Year
Sector 8 Chloride (mg/kg)
0-10cm
10-30cm
30-60cm

GEELONG LEATHER PTY LTD
ANNUAL PERFORMANCE SYSTEM REPORT 2016 REVISION: 1
DATE: 27/10/2016
IRRISEC1-12_EPA ANNUAL RETURN_LIC NO 3465_SEP2015 – SEP2016 15
050
100150200250300350400450500550600
2006 2007 2008 2009 2010 2011 2012 2013 2014 2015
Ch
lori
de
(m
g/k
g)
Year
Sector 9 Chloride (mg/kg)
0-10cm
10-30cm
30-60cm
050
100150200250300350400450500550600
2006 2007 2008 2009 2010 2011 2012 2013 2014 2015
Ch
lori
de
(m
g/k
g)
Year
Sector 10 Chloride (mg/kg)
0-10cm
10-30cm
30-60cm
050
100150200250300350400450500550600
2006 2007 2008 2009 2010 2011 2012 2013 2014 2015
Ch
lori
de
(m
g/k
g)
Year
Sector 11 Chloride (mg/kg)
0-10cm
10-30cm
30-60cm

GEELONG LEATHER PTY LTD
ANNUAL PERFORMANCE SYSTEM REPORT 2016 REVISION: 1
DATE: 27/10/2016
IRRISEC1-12_EPA ANNUAL RETURN_LIC NO 3465_SEP2015 – SEP2016 16
4. SAMPLE DEPTHS AND SAMPLE LOCATION
4.1. Sample Depths
Surface 0-10cm
Subsurface 10-30cm
Root Zone 30-60cm
4.2. Sample Locations (GPS Points)
IRRIGATION GPS POINT IRRIGATION GPS POINT
Sector 1 S35˚ 39.475’
E146˚ 59.750’ Sector 7
S35˚ 39.846’
E146˚ 59.385’
Sector 2 S35˚ 39.551’
E147˚ 00.092’ Sector 8
S35˚ 39.814’
E146˚ 59.241’
Sector 3 S35˚ 39.641’
E147˚ 00.155’ Sector 9
S35˚ 39.437’
E146˚ 59.519’
Sector 4 S35˚ 39.812’
E146˚ 00.170’ Sector 10
S35˚ 39.433’
E146˚ 59.181’
Sector 5 S35˚ 39.723’
E146˚ 59.688’ Sector 11
S35˚ 39.414’
E146˚ 59.073’
Sector 6 S35˚ 39.787’
E146˚ 59.690’ Sector 12
S35˚ 39.735’
E146˚ 59.001’
050
100150200250300350400450500550600
2006 2007 2008 2009 2010 2011 2012 2013 2014 2015
Ch
lori
de
(m
g/k
g)
Year
Sector 12 Chloride (mg/kg)
0-10cm
10-30cm
30-60cm

GEELONG LEATHER PTY LTD
ANNUAL PERFORMANCE SYSTEM REPORT 2016 REVISION: 1
DATE: 27/10/2016
IRRISEC1-12_EPA ANNUAL RETURN_LIC NO 3465_SEP2015 – SEP2016 17
5. MASS BALANCE
5.1. Industry Standard
TYPE OF CROP Coarse Grains, Barley, Wheat and Oats Hay (Dry matter crop)
NITROGEN 25kg per tonne of yield 20kg per tonne of yield
PHOSPHORUS 2.5kg per tonne of yield 1.5kg per tonne of yield
POTASSIUM 5kg per tonne of yield 20kg per tonne of yield
SULPHUR 3kg per tonne of yield 1.5kg per tonne of yield
5.2. Table: Nutrient Removal 2015
NUTRIENT REMOVAL
IRRIGATION CROP SOWN STRIPPED Ha. SOWN YIELD
(tn/Ha)
FERTILIZER
(kg/Ha)
NITROGEN
(kg/tn)
PHOSPHORUS
(kg/tn)
POTASSIUM
(kg/tn)
SULPHUR
(kg/tn)
SECTOR 1 Barley Grain 15 3.12 15 78 8 16 9
SECTOR 2 Barley Grain 15 3.12 15 78 8 16 9
SECTOR 3 Oats Grain 10 3.12 10 78 8 16 9
SECTOR 4 Oats Grain 7 1.28 7 32 3 6 4
Oats Hay 7 9.4 7 235 24 44 28
SECTOR 5 Oats Grain 8 2.93 8 73 7 14 9
Straw 8 2.99 8 75 8 16 9
SECTOR 6 Oats Grain 8 2.93 8 73 7 14 9
Straw 8 2.99 8 75 8 16 9
SECTOR 7 Oats Grain 8 2.93 8 73 7 14 9
Hay 8 7.87 8 197 20 40 24
SECTOR 8 Oats Grain 8 2.93 8 73 7 14 9
Hay 8 7.87 8 197 20 40 24
SECTOR 9 Barley Grain 13.5 3.11 13.5 78 8 16 9
SECTOR 10 Barley Grain 12 2.38 12 60 6 12 7
Sorghum Hay 12 6.04 12 151 15 30 18
SECTOR 11 Barley Grain 20 2.38 20 60 6 12 7
SECTOR 12 Barley Grain 20 2.38 20 60 6 12 7
TABLE CALCULATIONS: Nutrient Removal
Average Yield / Sector x Industry Standard for Grains
Average Yield / Sector x Industry Standard for Hay

GEELONG LEATHER PTY LTD
ANNUAL PERFORMANCE SYSTEM REPORT 2016 REVISION: 1
DATE: 27/10/2016
IRRISEC1-12_EPA ANNUAL RETURN_LIC NO 3465_SEP2015 – SEP2016 18
5.3. Geelong Leather 2015 Farming Operation Summary
5.4. Table: Nutrient Uptake 2015
NUTRIENT INPUTS NUTRIENT REMOVAL
IRRIGATION Ha.
SOWN
STRIPPED NITROGEN
(kg/Ha)
PHOSPHOR
US (kg/Ha)
POTASSIUM
(kg/Ha)
SULPHUR
(kg/Ha)
NITROGEN
(kg/Ha)
PHOSPHORUS
(kg/Ha)
POTASSIUM
(kg/Ha)
SULPHUR
(kg/Ha)
SECTOR 1 15 Grain 374 8 47 801 5.20 0.53 1.06 0.60
SECTOR 2 15 Grain 368 8 46 788 5.20 0.53 1.06 0.60
SECTOR 3 10 Grain 630 14 79 1350 5.20 0.53 1.06 0.60
SECTOR 4 14 Grn/Hay 281 6 35 602 19.07 1.92 3.57 2.28
SECTOR 5 16 Grn/Stw 354 8 44 758 9.25 0.94 1.88 1.12
SECTOR 6 16 Grn/Stw 345 8 43 738 9.25 0.94 1.88 1.12
SECTOR 7 16 Grn/Hay 437 10 55 937 16.87 1.68 3.38 2.06
SECTOR 8 16 Grn/Hay 308 7 39 660 16.87 1.68 3.38 2.06
SECTOR 9 13.5 Grain 517 11 65 1107 5.77 0.59 1.19 0.66
SECTOR 10 24 Grn/Hay 340 8 43 729 8.80 0.88 1.75 1.04
SECTOR 11 20 Grain 270 6 34 578 3.00 0.30 0.60 0.35
SECTOR 12 20 Grain 299 7 37 640 3.00 0.30 0.60 0.35
TOTAL HA SOWN 207 Ha.
TOTAL FERTILIZER APPLIED 20 Tn.
TOTAL NUTRIENTS REMOVED
WHEAT GRAIN
BARLEY GRAIN
WHEATEN HAY
LUCERNE HAY
OATEN HAY
SORGHUM HAY
STRAW
921.3 Tn.
0 Tn.
548.2 Tn.
0 Tn.
0 Tn.
192.7 Tn.
72.5 Tn.
107.9 Tn.
TOTAL AVERAGE / HA REMOVED 5.47 Tn.
TOTAL RAINFALL FOR THE YEAR 586.8 mm
TABLE CALCULATIONS: Nutrient Inputs
RESULTS: Irrigation Effluent Mean Discharge 2015/2016
Nitrogen - ppm 544 Potassium - ppm 68
Phosphorus - ppm 12 Sulphur - ppm 1165
ppm / 1,000,000 = kg/Lt.
kg/Lt x total effluent applied to sector = Total kg applied for year.
Total kg / Ha Sown = Nutrient Inputs
Results from Table 5.2 / Ha Sown = Nutrient Outputs

GEELONG LEATHER PTY LTD
ANNUAL PERFORMANCE SYSTEM REPORT 2016 REVISION: 1
DATE: 27/10/2016
IRRISEC1-12_EPA ANNUAL RETURN_LIC NO 3465_SEP2015 – SEP2016 19
6. HYDRAULIC BALANCE FOR EFFLUENT APPLIED
6.1. The Water Balance
To have an effective effluent irrigation system, it is essential that the correct amount of effluent is applied
at the right times to meet the crop requirements while ensuring increases in runoff and percolation are
minimised. A water balance should be constructed to determine the maximum volume of effluent that
could be sustainably used on average each year. The elements to be considered in a water balance are:
(a) precipitation
(b) effluent applied
(c) evapotranspiration
(d) percolation
(e) runoff
Significant amounts of percolation and runoff occur as a result of natural rainfall events. However, to
ensure a sustainable system, percolation and runoff should not increase significantly above rain fed
conditions thereby increasing the risk of pollution and changes in catchment hydrology.
The water balance is generally expressed as follows:
Equation: Water balance Precipitation + Effluent applied = Evapotranspiration + Percolation + Runoff
EPA Guidelines: Use of effluent by irrigation (October 2004)
6.2. Precipitation
The rainfall data over a historical period is used. This data can be obtained in monthly or daily format from
the Bureau of Meteorology.
6.3. Effluent Applied
The amount of effluent to be applied can be expressed as volume (ML). Seasonal variations in effluent
volume must be taken into account together with any impacts on effluent volume as a result of significant
rainfall events. Discounting for losses from spray irrigation can be used with caution when it is obvious that
some water will be lost for example during low humidity and high temperature. However, for the amount
that evaporates before reaching the ground, there will be a similar reduction in available evaporation.
Therefore any estimated allowance for spray losses must be accompanied by an estimated reduction in
evaporation and must be seasonally adjusted based on an analysis of local data.
EPA Guidelines: Use of effluent by irrigation (October 2004)

GEELONG LEATHER PTY LTD
ANNUAL PERFORMANCE SYSTEM REPORT 2016 REVISION: 1
DATE: 27/10/2016
IRRISEC1-12_EPA ANNUAL RETURN_LIC NO 3465_SEP2015 – SEP2016 20
6.4. Evapotranspiration
Is the sum of evaporation and plant transpiration from the Earth's land and ocean surface to the
atmosphere. Evaporation accounts for the movement of water to the air from sources such as the soil,
canopy interception, and waterbodies.
This will vary throughout the year depending on temperature, humidity, solar radiation, wind, crop type
and crop growth patterns. It can be estimated by multiplying daily or monthly evaporation values for a
district by the appropriate crop factor for the particular species of plant to be grown.
EPA Guidelines: Use of effluent by irrigation (October 2004)
6.5. Crop Factors
The crop factor takes into account plant productivity, and the meteorological factors. Crop factors are
sometimes expressed on different bases. Some are expressed as the ratio of crop evapotranspiration to pan
evaporation while others are expressed as the ratio of potential evapotranspiration to crop
evapotranspiration. The difference between pan evaporation and potential evapotranspiration is known as
the pan factor.
EPA Guidelines: Use of effluent by irrigation (October 2004)
6.6. Percolation
Percolation is the movement of water down through the soil profile and is a natural phenomenon after any
rainfall event that exceeds the soil moisture deficit. An irrigated site will have more percolation than a site
with rainfall only. Percolation is a process that prevents build-up of salt in the root zone. In humid coastal
and mountain areas percolation due to natural rainfall may be sufficient to prevent salt build up, but in dry
climates, a small fraction of irrigated effluent may be all that is required to leach salts out of the root zone.
The need for deliberate percolation of effluent will also depend on the salt tolerance of the plants and the
salt concentration in the irrigation effluent. Percolation must not simply be used as a means to dispose of
effluent to the environment as there is potential for other pollutants (e.g. nitrates) to be leached in
addition to salts. The rate of salt accumulation depends on a number of factors including the effluent
salinity, hydraulic loading, rainfall and resulting natural leaching. One simple method for determining the
fraction of irrigation water required to leach salts is to use the following equation:
Equation: EC (irrigation water) ÷ EC (50% yield reduction)
For example, if EC (irrigation water) is 0.75 dS/m (TDS = 450 mg/L) and EC (50% yield reduction) is 8.8 dS/m
(TDS = 5,280 mg/L), then the required fraction is 0.085.

GEELONG LEATHER PTY LTD
ANNUAL PERFORMANCE SYSTEM REPORT 2016 REVISION: 1
DATE: 27/10/2016
IRRISEC1-12_EPA ANNUAL RETURN_LIC NO 3465_SEP2015 – SEP2016 21
If the annual effluent application is 800 mm, then the annual leaching requirement is 68 mm (0.085 x 800).
However, the most direct way to determine the need for deliberate leaching is to monitor salt levels in the
lower part of the plant root zone. If these start to increase to above acceptable levels then leaching is
required.
EPA Guidelines: Use of effluent by irrigation (October 2004)
6.7. Runoff
Irrigation tends to increase runoff due to the reduction in the amount of rain needed to saturate soil to a
point where runoff occurs. Therefore, runoff as a result of irrigation with effluent should be set to zero in a
water balance. This will provide a safety factor to ensure that runoff is not used as a means to dispose of
the effluent to the environment and ensure that runoff does not increase significantly above the natural
baseline. Runoff, however, will occur during protracted or heavy rain. Runoff from irrigation areas also
should be controlled and managed to limit soil loss and export of nutrients from the site.
EPA Guidelines: Use of effluent by irrigation (October 2004)
6.8. Total Water Balance for each sector based on 150ML / year total irrigation and proportional
application
6.8.1. Irrigation Sectors 1 – 9, 11, 12
The hydraulic loading of these sectors on an annual basis can be shown to balance relatively easily as
shown below in the respective tables.
6.8.2. Irrigation Sector 10, 11
The hydraulic loading of this sector on an annual basis is shown to be out of balance. Irrigation sector 10
had an additional summer crop sown during the months November to February. These additional sowings
were not accounted for in the Hydraulic Balance calculations as to avoid confusion for the purpose of this
report.
Although irrigation sector 11 had an undesirable water balance result in 2014, it was carefully managed
during the year and soil moisture was monitored on a day to day basis too ensure that the water and
nutrients in the effluent irrigation were being recycled and not simply running off the land. As a result this
sector has been brought back into balance during 2015.

GEELONG LEATHER PTY LTD
ANNUAL PERFORMANCE SYSTEM REPORT 2016 REVISION: 1
DATE: 27/10/2016
IRRISEC1-12_EPA ANNUAL RETURN_LIC NO 3465_SEP2015 – SEP2016 22
6.9. Hydraulic Loading Tables
IRRIGATION SECTOR 1 JAN FEB MAR APR MAY JUN JUL AUG SEP OCT NOV DEC TOTAL
AREA IRRIGATED (Ha) 10.5 10.5 10.5 10.5 10.5 10.5 10.5
EFFLUENT APPLICATION (ML) 2.98 1.82 2.44 0.86 1.84 0.34 10.28
EFFLUENT APPLICATION (mm) 298 182 244 86 184 34 1028
PRECIPITATION (mm) 60.2 65.2 2 68.4 17.4 84.4 55.8 69.8 33 14.6 73.4 42.6 586.8
EVAPORATION (mm) 266.6 249.2 232.5 105 68.2 42 403 49.6 96 176.7 219 291.4 2199.2
EVAPOTRANSPIRATION (mm) 266.6 249.2 232.5 105 148.8 144 148.8 148.8 144 148.8 144 148.8 2029.3
AVERAGE ANNUAL PERMABILITY (mm/hr) 10 10 10 10 10 10 10 10 10 10 10 10 10
RUN-OFF 0 0 0 0 0 0 0 0 0 0 0 0 0
PERCOLATION 0 0 0 0 0 0 0 0 0 0 0 0 0
CROP FACTOR – BARLEY (mm) 0 0 0 0 4.8 4.8 4.8 4.8 4.8 4.8 4.8 4.8 576
CROP FACTOR – SORGHUM (mm) 0 0 0 0 0 0 0 0 0 0 0 0 0
WATER DEFICIT (-) / EXCESS (mm) -206.4 114 -230.5 -36.6 -131.4 -59.6 89 165 -25 49.8 -70.6 -72.2 -414.5
Precipitation (Rainfall): Bureau of Meteorology Station: 074188 Culcairn Bowling Club
Evaporation: Bureau of Meteorology Station: 072150 Wagga Wagga AMO
Effluent Application (mm): 1ML = 100mm over 10,000m² (1Ha)
Evapotranspiration (mm): Crop Factor WUE (mm) x days in the month (www.bom.gov.au/climate/averages/climatology/evapotrans/text/et-description.pdf)
Run-off: Zero Run-off is assumed to ensure that it is not used as a means to dispose of effluent to the environment.
Percolation: Zero percolation is assumed to ensure ground water is protected.
Water Deficit (-) / Excess (mm): Effluent applied (mm) + Precipitation – Evapotranspiration (if no crop factor or crop grown) or evaporation
Crop Factor - Barley: Is expressed in mm of Water Use Efficiency /day as an average for the growing period of May to September.
Crop Factor – Sorghum: Is expressed in mm of Water Use Efficiency /day as an average for the growing period of August to May. Applicable to Sector 10 only.

GEELONG LEATHER PTY LTD
ANNUAL PERFORMANCE SYSTEM REPORT 2016 REVISION: 1
DATE: 27/10/2016
IRRISEC1-12_EPA ANNUAL RETURN_LIC NO 3465_SEP2015 – SEP2016 23
IRRIGATION SECTOR 2 JAN FEB MAR APR MAY JUN JUL AUG SEP OCT NOV DEC TOTAL
AREA IRRIGATED (Ha) 10.5 10.5 10.5 10.5 10.5 10.5 10.5 10.5 10.5 10.5
EFFLUENT APPLICATION (ML) 3.5 1.68 0.72 0.25 0.27 1.57 1.13 0.77 0.22 10.11
EFFLUENT APPLICATION (mm) 350 168 72 25 27 157 113 77 22 1011
PRECIPITATION (mm) 60.2 65.2 2 68.4 17.4 84.4 55.8 69.8 33 14.6 73.4 42.6 586.8
EVAPORATION (mm) 266.6 249.2 232.5 105 68.2 42 403 49.6 96 176.7 219 291.4 2199.2
EVAPOTRANSPIRATION (mm) 266.6 249.2 232.5 105 148.8 144 148.8 148.8 144 148.8 144 148.8 2029.3
AVERAGE ANNUAL PERMABILITY (mm/hr) 10 10 10 10 10 10 10 10 10 10 10 10 10
RUN-OFF 0 0 0 0 0 0 0 0 0 0 0 0 0
PERCOLATION 0 0 0 0 0 0 0 0 0 0 0 0 0
CROP FACTOR – BARLEY (mm) 0 0 0 0 4.8 4.8 4.8 4.8 4.8 4.8 4.8 4.8 576
CROP FACTOR – SORGHUM (mm) 0 0 0 0 0 0 0 0 0 0 0 0 0
WATER DEFICIT (-) / EXCESS (mm) 143.6 -16 -158.5 -11.6 -104.4 -59.6 64 34 -34 -112.2 -70.6 -106.2 -431.5
Rainfall: Bureau of Meteorology Station: 074188 Culcairn Bowling Club
Evaporation: Bureau of Meteorology Station: 072150 Wagga Wagga AMO
Effluent Application (mm): 1ML = 100mm over 10,000m² (1Ha)
Evapotranspiration (mm): Crop Factor WUE (mm) x days in the month (www.bom.gov.au/climate/averages/climatology/evapotrans/text/et-description.pdf)
Run-off: Zero Run-off is assumed to ensure that it is not used as a means to dispose of effluent to the environment.
Percolation: Zero percolation is assumed to ensure ground water is protected.
Water Deficit (-) / Excess (mm): Effluent applied (mm) + Precipitation – Evapotranspiration (if no crop factor or crop grown) or evaporation
Crop Factor - Barley: Is expressed in mm of Water Use Efficiency /day as an average for the growing period of May to September.
Crop Factor – Sorghum: Is expressed in mm of Water Use Efficiency /day as an average for the growing period of August to May. Applicable to Sector 10 only.

GEELONG LEATHER PTY LTD
ANNUAL PERFORMANCE SYSTEM REPORT 2016 REVISION: 1
DATE: 27/10/2016
IRRISEC1-12_EPA ANNUAL RETURN_LIC NO 3465_SEP2015 – SEP2016 24
IRRIGATION SECTOR 3 JAN FEB MAR APR MAY JUN JUL AUG SEP OCT NOV DEC TOTAL
AREA IRRIGATED (Ha) 10.5 10.5 10.5 10.5 10.5 10.5 10.5 10.5 10.5
EFFLUENT APPLICATION (ML) 1.26 2 1.33 2.22 0.59 1.14 1.37 1.64 11.55
EFFLUENT APPLICATION (mm) 126 200 133 222 59 114 137 164 1155
PRECIPITATION (mm) 60.2 65.2 2 68.4 17.4 84.4 55.8 69.8 33 14.6 73.4 42.6 586.8
EVAPORATION (mm) 266.6 249.2 232.5 105 68.2 42 403 49.6 96 176.7 219 291.4 2199.2
EVAPOTRANSPIRATION (mm) 266.6 249.2 232.5 144 148.8 144 148.8 148.8 144 148.8 144 148.8 2068.3
AVERAGE ANNUAL PERMABILITY (mm/hr) 10 10 10 10 10 10 10 10 10 10 10 10 10
RUN-OFF 0 0 0 0 0 0 0 0 0 0 0 0 0
PERCOLATION 0 0 0 0 0 0 0 0 0 0 0 0 0
CROP FACTOR – OATS (mm) 0 0 0 4.8 4.8 4.8 4.8 4.8 4.8 4.8 4.8 4.8 576
CROP FACTOR – SORGHUM (mm) 0 0 0 0 0 0 0 0 0 0 0 0 0
WATER DEFICIT (-) / EXCESS (mm) -80.4 16 -97.5 -75.6 90.6 -0.6 21 -79 -111 -134.2 66.4 57.8 -326.5
Rainfall: Bureau of Meteorology Station: 074188 Culcairn Bowling Club
Evaporation: Bureau of Meteorology Station: 072150 Wagga Wagga AMO
Effluent Application (mm): 1ML = 100mm over 10,000m² (1Ha)
Evapotranspiration (mm): Crop Factor WUE (mm) x days in the month (www.bom.gov.au/climate/averages/climatology/evapotrans/text/et-description.pdf)
Run-off: Zero Run-off is assumed to ensure that it is not used as a means to dispose of effluent to the environment.
Percolation: Zero percolation is assumed to ensure ground water is protected.
Water Deficit (-) / Excess (mm): Effluent applied (mm) + Precipitation – Evapotranspiration (if no crop factor or crop grown) or evaporation
Crop Factor - Oats: Is expressed in mm of Water Use Efficiency /day as an average for the growing period of May to September.
Crop Factor – Sorghum: Is expressed in mm of Water Use Efficiency /day as an average for the growing period of August to May. Applicable to Sector 10 only.

GEELONG LEATHER PTY LTD
ANNUAL PERFORMANCE SYSTEM REPORT 2016 REVISION: 1
DATE: 27/10/2016
IRRISEC1-12_EPA ANNUAL RETURN_LIC NO 3465_SEP2015 – SEP2016 25
IRRIGATION SECTOR 4 JAN FEB MAR APR MAY JUN JUL AUG SEP OCT NOV DEC TOTAL
AREA IRRIGATED (Ha) 10.5 10.5 10.5 10.5 10.5 10.5 10.5
EFFLUENT APPLICATION (ML) 0.46 1.64 0.9 0.89 2.14 1.17 7.2
EFFLUENT APPLICATION (mm) 46 164 90 89 214 117 720
PRECIPITATION (mm) 60.2 65.2 2 68.4 17.4 84.4 55.8 69.8 33 14.6 73.4 42.6 586.8
EVAPORATION (mm) 266.6 249.2 232.5 105 68.2 42 403 49.6 96 176.7 219 291.4 2199.2
EVAPOTRANSPIRATION (mm) 266.6 249.2 232.5 144 148.8 144 148.8 148.8 144 148.8 144 148.8 2068.3
AVERAGE ANNUAL PERMABILITY (mm/hr) 10 10 10 10 10 10 10 10 10 10 10 10 10
RUN-OFF 0 0 0 0 0 0 0 0 0 0 0 0 0
PERCOLATION 0 0 0 0 0 0 0 0 0 0 0 0 0
CROP FACTOR – OATS (mm) 0 0 0 4.8 4.8 4.8 4.8 4.8 4.8 4.8 4.8 4.8 576
CROP FACTOR – SORGHUM (mm) 0 0 0 0 0 0 0 0 0 0 0 0 0
WATER DEFICIT (-) / EXCESS (mm) -160.4 -184 -66.5 -75.6 -41.4 29.4 121 38 -111 -134.2 -70.6 -106.2 -761.5
Rainfall: Bureau of Meteorology Station: 074188 Culcairn Bowling Club
Evaporation: Bureau of Meteorology Station: 072150 Wagga Wagga AMO
Effluent Application (mm): 1ML = 100mm over 10,000m² (1Ha)
Evapotranspiration (mm): Crop Factor WUE (mm) x days in the month (www.bom.gov.au/climate/averages/climatology/evapotrans/text/et-description.pdf)
Run-off: Zero Run-off is assumed to ensure that it is not used as a means to dispose of effluent to the environment.
Percolation: Zero percolation is assumed to ensure ground water is protected.
Water Deficit (-) / Excess (mm): Effluent applied (mm) + Precipitation – Evapotranspiration (if no crop factor or crop grown) or evaporation
Crop Factor - Oats: Is expressed in mm of Water Use Efficiency /day as an average for the growing period of May to September.
Crop Factor – Sorghum: Is expressed in mm of Water Use Efficiency /day as an average for the growing period of August to May. Applicable to Sector 10 only.

GEELONG LEATHER PTY LTD
ANNUAL PERFORMANCE SYSTEM REPORT 2016 REVISION: 1
DATE: 27/10/2016
IRRISEC1-12_EPA ANNUAL RETURN_LIC NO 3465_SEP2015 – SEP2016 26
IRRIGATION SECTOR 5 JAN FEB MAR APR MAY JUN JUL AUG SEP OCT NOV DEC TOTAL
AREA IRRIGATED (Ha) 10.5 10.5 10.5 10.5 10.5 10.5 10.5 10.5
EFFLUENT APPLICATION (ML) 3.13 0.97 1.08 0.74 0.79 2.56 1.12 10.39
EFFLUENT APPLICATION (mm) 313 97 108 74 79 256 112 1039
PRECIPITATION (mm) 60.2 65.2 2 68.4 17.4 84.4 55.8 69.8 33 14.6 73.4 42.6 586.8
EVAPORATION (mm) 266.6 249.2 232.5 105 68.2 42 403 49.6 96 176.7 219 291.4 2199.2
EVAPOTRANSPIRATION (mm) 266.6 249.2 232.5 144 148.8 144 148.8 148.8 144 148.8 144 148.8 2068.3
AVERAGE ANNUAL PERMABILITY (mm/hr) 10 10 10 10 10 10 10 10 10 10 10 10 10
RUN-OFF 0 0 0 0 0 0 0 0 0 0 0 0 0
PERCOLATION 0 0 0 0 0 0 0 0 0 0 0 0 0
CROP FACTOR – OATS (mm) 0 0 0 4.8 4.8 4.8 4.8 4.8 4.8 4.8 4.8 4.8 576
CROP FACTOR – SORGHUM (mm) 0 0 0 0 0 0 0 0 0 0 0 0 0
WATER DEFICIT (-) / EXCESS (mm) -206.4 -184 -230.5 237.4 -34.4 -59.6 15 -5 -32 121.8 41.4 -106.2 -442.5
Rainfall: Bureau of Meteorology Station: 074188 Culcairn Bowling Club
Evaporation: Bureau of Meteorology Station: 072150 Wagga Wagga AMO
Effluent Application (mm): 1ML = 100mm over 10,000m² (1Ha)
Evapotranspiration (mm): Crop Factor WUE (mm) x days in the month (www.bom.gov.au/climate/averages/climatology/evapotrans/text/et-description.pdf)
Run-off: Zero Run-off is assumed to ensure that it is not used as a means to dispose of effluent to the environment.
Percolation: Zero percolation is assumed to ensure ground water is protected.
Water Deficit (-) / Excess (mm): Effluent applied (mm) + Precipitation – Evapotranspiration (if no crop factor or crop grown) or evaporation
Crop Factor - Oats: Is expressed in mm of Water Use Efficiency /day as an average for the growing period of May to September.
Crop Factor – Sorghum: Is expressed in mm of Water Use Efficiency /day as an average for the growing period of August to May. Applicable to Sector 10 only.

GEELONG LEATHER PTY LTD
ANNUAL PERFORMANCE SYSTEM REPORT 2016 REVISION: 1
DATE: 27/10/2016
IRRISEC1-12_EPA ANNUAL RETURN_LIC NO 3465_SEP2015 – SEP2016 27
IRRIGATION SECTOR 6 JAN FEB MAR APR MAY JUN JUL AUG SEP OCT NOV DEC TOTAL
AREA IRRIGATED (Ha) 10.5 10.5 10.5 10.5 10.5 10.5
EFFLUENT APPLICATION (ML) 2.06 1.72 1.31 2.71 2.31 10.11
EFFLUENT APPLICATION (mm) 206 172 131 271 231 1011
PRECIPITATION (mm) 60.2 65.2 2 68.4 17.4 84.4 55.8 69.8 33 14.6 73.4 42.6 586.8
EVAPORATION (mm) 266.6 249.2 232.5 105 68.2 42 403 49.6 96 176.7 219 291.4 2199.2
EVAPOTRANSPIRATION (mm) 266.6 249.2 232.5 105 148.8 144 148.8 148.8 144 148.8 144 148.8 2029.3
AVERAGE ANNUAL PERMABILITY (mm/hr) 10 10 10 10 10 10 10 10 10 10 10 10 10
RUN-OFF 0 0 0 0 0 0 0 0 0 0 0 0 0
PERCOLATION 0 0 0 0 0 0 0 0 0 0 0 0 0
CROP FACTOR – OATS (mm) 0 0 0 0 4.8 4.8 4.8 4.8 4.8 4.8 4.8 4.8 576
CROP FACTOR – SORGHUM (mm) 0 0 0 0 0 0 0 0 0 0 0 0 0
WATER DEFICIT (-) / EXCESS (mm) -206.4 -184 -230.5 -36.6 74.6 -59.6 79 -79 20 136.8 160.4 -106.2 -431.5
Rainfall: Bureau of Meteorology Station: 074188 Culcairn Bowling Club
Evaporation: Bureau of Meteorology Station: 072150 Wagga Wagga AMO
Effluent Application (mm): 1ML = 100mm over 10,000m² (1Ha)
Evapotranspiration (mm): Crop Factor WUE (mm) x days in the month (www.bom.gov.au/climate/averages/climatology/evapotrans/text/et-description.pdf)
Run-off: Zero Run-off is assumed to ensure that it is not used as a means to dispose of effluent to the environment.
Percolation: Zero percolation is assumed to ensure ground water is protected.
Water Deficit (-) / Excess (mm): Effluent applied (mm) + Precipitation – Evapotranspiration (if no crop factor or crop grown) or evaporation
Crop Factor - Oats: Is expressed in mm of Water Use Efficiency /day as an average for the growing period of May to September.
Crop Factor – Sorghum: Is expressed in mm of Water Use Efficiency /day as an average for the growing period of August to May. Applicable to Sector 10 only.

GEELONG LEATHER PTY LTD
ANNUAL PERFORMANCE SYSTEM REPORT 2016 REVISION: 1
DATE: 27/10/2016
IRRISEC1-12_EPA ANNUAL RETURN_LIC NO 3465_SEP2015 – SEP2016 28
IRRIGATION SECTOR 7 JAN FEB MAR APR MAY JUN JUL AUG SEP OCT NOV DEC TOTAL
AREA IRRIGATED (Ha) 10.5 10.5 10.5 10.5 10.5 10.5 10.5
EFFLUENT APPLICATION (ML) 2.8 3.94 3.8 0.39 1.41 0.5 12.84
EFFLUENT APPLICATION (mm) 280 394 380 39 141 50 1284
PRECIPITATION (mm) 60.2 65.2 2 68.4 17.4 84.4 55.8 69.8 33 14.6 73.4 42.6 586.8
EVAPORATION (mm) 266.6 249.2 232.5 105 68.2 42 403 49.6 96 176.7 219 291.4 2199.2
EVAPOTRANSPIRATION (mm) 266.6 249.2 232.5 105 148.8 144 148.8 148.8 144 148.8 219 291.4 2246.9
AVERAGE ANNUAL PERMABILITY (mm/hr) 10 10 10 10 10 10 10 10 10 10 10 10 10
RUN-OFF 0 0 0 0 0 0 0 0 0 0 0 0 0
PERCOLATION 0 0 0 0 0 0 0 0 0 0 0 0 0
CROP FACTOR – OATS (mm) 0 0 0 0 4.8 4.8 4.8 4.8 4.8 4.8 0 0 576
CROP FACTOR – SORGHUM (mm) 0 0 0 0 0 0 0 0 0 0 0 0 0
WATER DEFICIT (-) / EXCESS (mm) -206.4 96 163.5 -36.6 -131.4 320.4 -54 -79 30 -84.2 -145.6 -248.8 -376.1
Rainfall: Bureau of Meteorology Station: 074188 Culcairn Bowling Club
Evaporation: Bureau of Meteorology Station: 072150 Wagga Wagga AMO
Effluent Application (mm): 1ML = 100mm over 10,000m² (1Ha)
Evapotranspiration (mm): Crop Factor WUE (mm) x days in the month (www.bom.gov.au/climate/averages/climatology/evapotrans/text/et-description.pdf)
Run-off: Zero Run-off is assumed to ensure that it is not used as a means to dispose of effluent to the environment.
Percolation: Zero percolation is assumed to ensure ground water is protected.
Water Deficit (-) / Excess (mm): Effluent applied (mm) + Precipitation – Evapotranspiration (if no crop factor or crop grown) or evaporation
Crop Factor - Oats: Is expressed in mm of Water Use Efficiency /day as an average for the growing period of May to September.
Crop Factor – Sorghum: Is expressed in mm of Water Use Efficiency /day as an average for the growing period of August to May. Applicable to Sector 10 only.

GEELONG LEATHER PTY LTD
ANNUAL PERFORMANCE SYSTEM REPORT 2016 REVISION: 1
DATE: 27/10/2016
IRRISEC1-12_EPA ANNUAL RETURN_LIC NO 3465_SEP2015 – SEP2016 29
IRRIGATION SECTOR 8 JAN FEB MAR APR MAY JUN JUL AUG SEP OCT NOV DEC TOTAL
AREA IRRIGATED (Ha) 10.5 10.5 10.5 10.5 10.5 10.5 10.5
EFFLUENT APPLICATION (ML) 2.8 3.94 3.8 0.39 1.41 0.5 12.84
EFFLUENT APPLICATION (mm) 280 394 380 39 141 50 1284
PRECIPITATION (mm) 60.2 65.2 2 68.4 17.4 84.4 55.8 69.8 33 14.6 73.4 42.6 586.8
EVAPORATION (mm) 266.6 249.2 232.5 105 68.2 42 403 49.6 96 176.7 219 291.4 2199.2
EVAPOTRANSPIRATION (mm) 266.6 249.2 232.5 105 148.8 144 148.8 148.8 144 148.8 219 291.4 2246.9
AVERAGE ANNUAL PERMABILITY (mm/hr) 10 10 10 10 10 10 10 10 10 10 10 10 10
RUN-OFF 0 0 0 0 0 0 0 0 0 0 0 0 0
PERCOLATION 0 0 0 0 0 0 0 0 0 0 0 0 0
CROP FACTOR – OATS (mm) 0 0 0 0 4.8 4.8 4.8 4.8 4.8 4.8 0 0 576
CROP FACTOR – SORGHUM (mm) 0 0 0 0 0 0 0 0 0 0 0 0 0
WATER DEFICIT (-) / EXCESS (mm) -206.4 96 163.5 -36.6 -131.4 320.4 -54 -79 30 -84.2 -145.6 -248.8 -376.1
Rainfall: Bureau of Meteorology Station: 074188 Culcairn Bowling Club
Evaporation: Bureau of Meteorology Station: 072150 Wagga Wagga AMO
Effluent Application (mm): 1ML = 100mm over 10,000m² (1Ha)
Evapotranspiration (mm): Crop Factor WUE (mm) x days in the month (www.bom.gov.au/climate/averages/climatology/evapotrans/text/et-description.pdf)
Run-off: Zero Run-off is assumed to ensure that it is not used as a means to dispose of effluent to the environment.
Percolation: Zero percolation is assumed to ensure ground water is protected.
Water Deficit (-) / Excess (mm): Effluent applied (mm) + Precipitation – Evapotranspiration (if no crop factor or crop grown) or evaporation
Crop Factor - Oats: Is expressed in mm of Water Use Efficiency /day as an average for the growing period of May to September.
Crop Factor – Sorghum: Is expressed in mm of Water Use Efficiency /day as an average for the growing period of August to May. Applicable to Sector 10 only.
GEELONG LEATHER PTY LTD
ANNUAL PERFORMANCE SYSTEM REPORT 2016 REVISION: 1
DATE: 27/10/2016
IRRISEC1-12_EPA ANNUAL RETURN_LIC NO 3465_SEP2015 – SEP2016 30
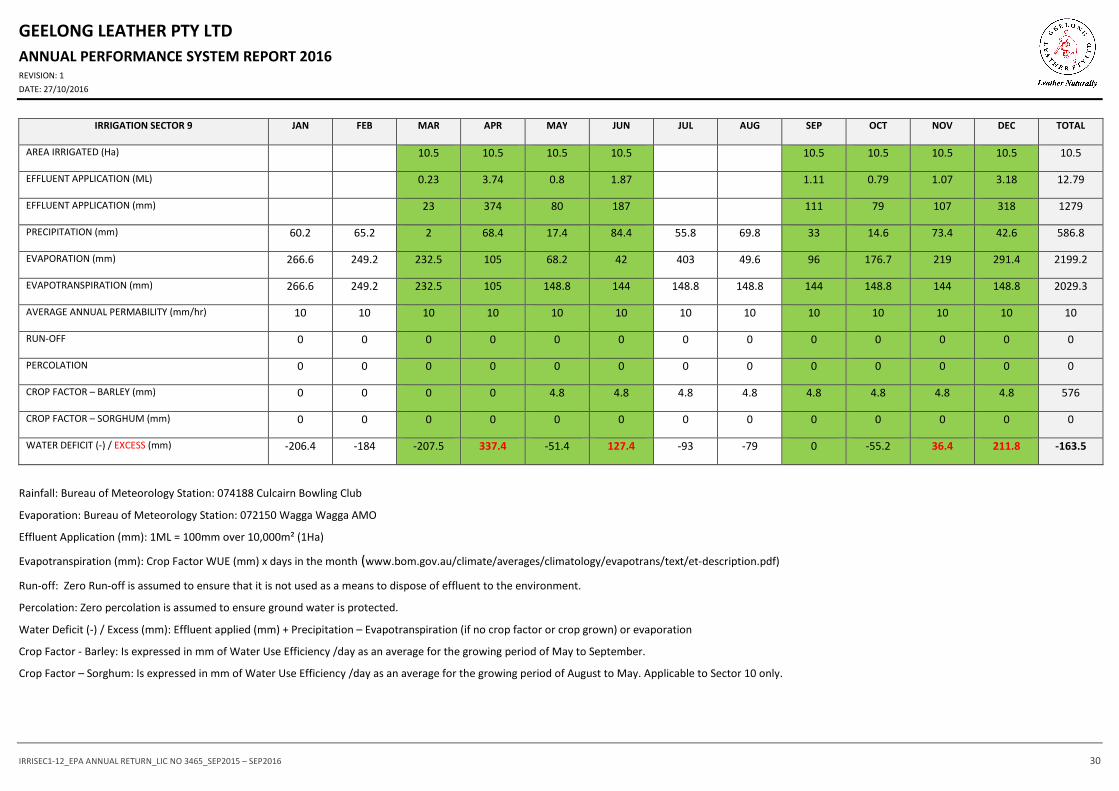
IRRIGATION SECTOR 9 JAN FEB MAR APR MAY JUN JUL AUG SEP OCT NOV DEC TOTAL
AREA IRRIGATED (Ha) 10.5 10.5 10.5 10.5 10.5 10.5 10.5 10.5 10.5
EFFLUENT APPLICATION (ML) 0.23 3.74 0.8 1.87 1.11 0.79 1.07 3.18 12.79
EFFLUENT APPLICATION (mm) 23 374 80 187 111 79 107 318 1279
PRECIPITATION (mm) 60.2 65.2 2 68.4 17.4 84.4 55.8 69.8 33 14.6 73.4 42.6 586.8
EVAPORATION (mm) 266.6 249.2 232.5 105 68.2 42 403 49.6 96 176.7 219 291.4 2199.2
EVAPOTRANSPIRATION (mm) 266.6 249.2 232.5 105 148.8 144 148.8 148.8 144 148.8 144 148.8 2029.3
AVERAGE ANNUAL PERMABILITY (mm/hr) 10 10 10 10 10 10 10 10 10 10 10 10 10
RUN-OFF 0 0 0 0 0 0 0 0 0 0 0 0 0
PERCOLATION 0 0 0 0 0 0 0 0 0 0 0 0 0
CROP FACTOR – BARLEY (mm) 0 0 0 0 4.8 4.8 4.8 4.8 4.8 4.8 4.8 4.8 576
CROP FACTOR – SORGHUM (mm) 0 0 0 0 0 0 0 0 0 0 0 0 0
WATER DEFICIT (-) / EXCESS (mm) -206.4 -184 -207.5 337.4 -51.4 127.4 -93 -79 0 -55.2 36.4 211.8 -163.5
Rainfall: Bureau of Meteorology Station: 074188 Culcairn Bowling Club
Evaporation: Bureau of Meteorology Station: 072150 Wagga Wagga AMO
Effluent Application (mm): 1ML = 100mm over 10,000m² (1Ha)
Evapotranspiration (mm): Crop Factor WUE (mm) x days in the month (www.bom.gov.au/climate/averages/climatology/evapotrans/text/et-description.pdf)
Run-off: Zero Run-off is assumed to ensure that it is not used as a means to dispose of effluent to the environment.
Percolation: Zero percolation is assumed to ensure ground water is protected.
Water Deficit (-) / Excess (mm): Effluent applied (mm) + Precipitation – Evapotranspiration (if no crop factor or crop grown) or evaporation
Crop Factor - Barley: Is expressed in mm of Water Use Efficiency /day as an average for the growing period of May to September.
Crop Factor – Sorghum: Is expressed in mm of Water Use Efficiency /day as an average for the growing period of August to May. Applicable to Sector 10 only.

GEELONG LEATHER PTY LTD
ANNUAL PERFORMANCE SYSTEM REPORT 2016 REVISION: 1
DATE: 27/10/2016
IRRISEC1-12_EPA ANNUAL RETURN_LIC NO 3465_SEP2015 – SEP2016 31
IRRIGATION SECTOR 10 JAN FEB MAR APR MAY JUN JUL AUG SEP OCT NOV DEC TOTAL
AREA IRRIGATED (Ha) 10.5 10.5 10.5 10.5 10.5 10.5 10.5 10.5 10.5 10.5 10.5
EFFLUENT APPLICATION (ML) 0.23 3.74 1.39 1.87 0.44 0.47 0.96 0.79 1.89 3.18 14.96
EFFLUENT APPLICATION (mm) 23 374 139 187 44 47 96 79 189 318 1496
PRECIPITATION (mm) 60.2 65.2 2 68.4 17.4 84.4 55.8 69.8 33 14.6 73.4 42.6 586.8
EVAPORATION (mm) 266.6 249.2 232.5 105 68.2 42 403 49.6 96 176.7 219 291.4 2199.2
EVAPOTRANSPIRATION (mm) 155 140 232.5 105 68.2 42 403 49.6 96 155 150 155 1751.3
AVERAGE ANNUAL PERMABILITY (mm/hr) 10 10 10 10 10 10 10 10 10 10 10 10 10
RUN-OFF 0 0 0 0 0 0 0 0 0 0 0 0 0
PERCOLATION 0 0 0 0 0 0 0 0 0 0 0 0 0
CROP FACTOR – BARLEY (mm) 0 0 0 0 0 0 0 0 0 0 0 0 0
CROP FACTOR – SORGHUM (mm) 5 5 0 0 0 0 0 0 0 5 5 5 1520
WATER DEFICIT (-) / EXCESS (mm) -94.8 -74.8 -207.5 337.4 88.2 229.4 -303.2 67.2 33 -61.4 112.4 205.6 331.5
Rainfall: Bureau of Meteorology Station: 074188 Culcairn Bowling Club
Evaporation: Bureau of Meteorology Station: 072150 Wagga Wagga AMO
Effluent Application (mm): 1ML = 100mm over 10,000m² (1Ha)
Evapotranspiration (mm): Crop Factor WUE (mm) x days in the month (www.bom.gov.au/climate/averages/climatology/evapotrans/text/et-description.pdf)
Run-off: Zero Run-off is assumed to ensure that it is not used as a means to dispose of effluent to the environment.
Percolation: Zero percolation is assumed to ensure ground water is protected.
Water Deficit (-) / Excess (mm): Effluent applied (mm) + Precipitation – Evapotranspiration (if no crop factor or crop grown) or evaporation
Crop Factor - Barley: Is expressed in mm of Water Use Efficiency /day as an average for the growing period of May to September.
Crop Factor – Sorghum: Is expressed in mm of Water Use Efficiency /day as an average for the growing period of August to May. Applicable to Sector 10 only.

GEELONG LEATHER PTY LTD
ANNUAL PERFORMANCE SYSTEM REPORT 2016 REVISION: 1
DATE: 27/10/2016
IRRISEC1-12_EPA ANNUAL RETURN_LIC NO 3465_SEP2015 – SEP2016 32
IRRIGATION SECTOR 11 JAN FEB MAR APR MAY JUN JUL AUG SEP OCT NOV DEC TOTAL
AREA IRRIGATED (Ha) 10.5 10.5 10.5 10.5 10.5 10.5
EFFLUENT APPLICATION (ML) 2.3 1.79 1.18 2.24 2.39 9.9
EFFLUENT APPLICATION (mm) 230 179 118 224 239 990
PRECIPITATION (mm) 60.2 65.2 2 68.4 17.4 84.4 55.8 69.8 33 14.6 73.4 42.6 586.8
EVAPORATION (mm) 266.6 249.2 232.5 105 68.2 42 403 49.6 96 176.7 219 291.4 2199.2
EVAPOTRANSPIRATION (mm) 266.6 249.2 232.5 105 148.8 144 148.8 148.8 144 148.8 144 148.8 2029.3
AVERAGE ANNUAL PERMABILITY (mm/hr) 10 10 10 10 10 10 10 10 10 10 10 10 10
RUN-OFF 0 0 0 0 0 0 0 0 0 0 0 0 0
PERCOLATION 0 0 0 0 0 0 0 0 0 0 0 0 0
CROP FACTOR – BARLEY (mm) 4.8 4.8 0 0 0 0 0 0 0 4.8 4.8 4.8 576
CROP FACTOR – SORGHUM (mm) 0 0 0 0 0 0 0 0 0 0 0 0 0
WATER DEFICIT (-) / EXCESS (mm) -206.4 -184 -230.5 -36.6 98.6 -59.6 86 39 113 -134.2 168.4 -106.2 -452.5
Rainfall: Bureau of Meteorology Station: 074188 Culcairn Bowling Club
Evaporation: Bureau of Meteorology Station: 072150 Wagga Wagga AMO
Effluent Application (mm): 1ML = 100mm over 10,000m² (1Ha)
Evapotranspiration (mm): Crop Factor WUE (mm) x days in the month (www.bom.gov.au/climate/averages/climatology/evapotrans/text/et-description.pdf)
Run-off: Zero Run-off is assumed to ensure that it is not used as a means to dispose of effluent to the environment.
Percolation: Zero percolation is assumed to ensure ground water is protected.
Water Deficit (-) / Excess (mm): Effluent applied (mm) + Precipitation – Evapotranspiration (if no crop factor or crop grown) or evaporation
Crop Factor - Barley: Is expressed in mm of Water Use Efficiency /day as an average for the growing period of May to September.
Crop Factor – Sorghum: Is expressed in mm of Water Use Efficiency /day as an average for the growing period of August to May. Applicable to Sector 10 only.

GEELONG LEATHER PTY LTD
ANNUAL PERFORMANCE SYSTEM REPORT 2016 REVISION: 1
DATE: 27/10/2016
IRRISEC1-12_EPA ANNUAL RETURN_LIC NO 3465_SEP2015 – SEP2016 33
IRRIGATION SECTOR 12 JAN FEB MAR APR MAY JUN JUL AUG SEP OCT NOV DEC TOTAL
AREA IRRIGATED (Ha) 10.5 10.5 10.5 10.5
EFFLUENT APPLICATION (ML) 7.76 2.57 0.65 10.98
EFFLUENT APPLICATION (mm) 776 257 65 1098
PRECIPITATION (mm) 60.2 65.2 2 68.4 17.4 84.4 55.8 69.8 33 14.6 73.4 42.6 586.8
EVAPORATION (mm) 266.6 249.2 232.5 105 68.2 42 403 49.6 96 176.7 219 291.4 2199.2
EVAPOTRANSPIRATION (mm) 266.6 249.2 232.5 105 148.8 144 148.8 148.8 144 148.8 144 148.8 2029.3
AVERAGE ANNUAL PERMABILITY (mm/hr) 10 10 10 10 10 10 10 10 10 10 10 10 10
RUN-OFF 0 0 0 0 0 0 0 0 0 0 0 0 0
PERCOLATION 0 0 0 0 0 0 0 0 0 0 0 0 0
CROP FACTOR – BARLEY (mm) 0 0 0 0 4.8 4.8 4.8 4.8 4.8 4.8 4.8 4.8 576
CROP FACTOR – SORGHUM (mm) 0 0 0 0 0 0 0 0 0 0 0 0 0
WATER DEFICIT (-) / EXCESS (mm) 569.6 -184 -230.5 -36.6 -131.4 -59.6 -93 178 -46 -134.2 -70.6 -106.2 -344.5
Rainfall: Bureau of Meteorology Station: 074188 Culcairn Bowling Club
Evaporation: Bureau of Meteorology Station: 072150 Wagga Wagga AMO
Effluent Application (mm): 1ML = 100mm over 10,000m² (1Ha)
Evapotranspiration (mm): Crop Factor WUE (mm) x days in the month (www.bom.gov.au/climate/averages/climatology/evapotrans/text/et-description.pdf)
Run-off: Zero Run-off is assumed to ensure that it is not used as a means to dispose of effluent to the environment.
Percolation: Zero percolation is assumed to ensure ground water is protected.
Water Deficit (-) / Excess (mm): Effluent applied (mm) + Precipitation – Evapotranspiration (if no crop factor or crop grown) or evaporation
Crop Factor - Barley: Is expressed in mm of Water Use Efficiency /day as an average for the growing period of May to September.
Crop Factor – Sorghum: Is expressed in mm of Water Use Efficiency /day as an average for the growing period of August to May. Applicable to Sector 10 only.
GEELONG LEATHER PTY LTD
ANNUAL PERFORMANCE SYSTEM REPORT 2016 REVISION: 1
DATE: 27/10/2016
IRRISEC1-12_EPA ANNUAL RETURN_LIC NO 3465_SEP2015 – SEP2016 34
7. SOIL CONDITIONS
Significant steps have been taken by the Management of Geelong Leather to create a sustainable working
effluent disposal model that we believe to be Industry leading and a model for others in the Industry to
follow. A model that deals with the waste products from the plant, yet continues the long term agricultural
productivity of the farm land associated with the leather plant.
Steps taken;
(a) A thorough review of the plant and farm practice, identifying the significant issues affecting the
long term soil health and therefore the viability of the practices currently in use.
(b) Scientifically calculated reduction of effluent application in line with the existing soil E.C and
Chloride levels, particularly on the oldest sectors. These targets are adjusted on an as needs basis
over time. A significant reduction on individual sectors has been implemented.
(c) The major capital investment in the purchase of the adjoining property. Effectively this will halve
the long term effluent load across all sectors due to the doubling of the arable area. Once the
irrigation capital projects are completed, the plants long term future is secure.
(d) A change in plant practice, removing much of the Chloride from the waste effluent, before
application.
(e) Extensive testing for Cadmium across all sectors showed that this was not a risk.
(f) A conscious farm Management plan, focusing on high nutrient removal production systems with
more Hay, and a continuation of summer crop/pasture have led to increased nutrient removal.
Reference to Table 3.2 shows that the soil Chloride levels continue to fall and now all Sectors fall within the
target range of less than 150 mg/kg of Chloride. What is the most pleasing with this data set is that our
deep soil Chloride level in the 30 – 60 cm tests have declined and with the only exception being Sector 4
which is stable and I would expect it to fall in line with all other sectors.
Clearly the implementation of the recommendations made previously and plant operational changes are
working.
Good Applied science is to test, make changes and re-test and this is showing excellent and pleasing long
term decline in the Chloride soil load.
All other agriculturally significant elements and measures, pH, Phosphorous, Nitrogen and Sulphur remain
within long term sustainable limits.
The Physical structure of the soil is excellent and significantly better than on many of the district properties.
I hypothesize that the soil Biota, amoeba, fungi, nematode’s and earth worms feed on the effluent products
and have had a beneficial soil structure impact.

GEELONG LEATHER PTY LTD
ANNUAL PERFORMANCE SYSTEM REPORT 2016 REVISION: 1
DATE: 27/10/2016
IRRISEC1-12_EPA ANNUAL RETURN_LIC NO 3465_SEP2015 – SEP2016 35
The soils across all sectors continue to show good porosity and water infiltration rates remain high.
Crop production remains very high by district averages with significant biomass production, greater than 8
tonne of dry matter production anticipated in the 2016 year.
C. Levitzke, Agronomist, Rodwells Culcairn
8. VEGETATION CONDITION
In this year, 2015/2016, crop establishment has been good for both crop types grown Oats and Wheat. The
soils ability to handle an exceptionally wet winter is significantly better than those properties adjoining
which reflects good control traffic practices put in place by the farm manager and also the soils inherent
porosity.
We anticipate the wheat should yield 4 – 4.5 tonne / hectare and that dry matter Oaten hay yields will be
greater than 8 tonne of dry matter / hectare and possibly higher depending on continued soft finish to the
growing season.
There have been no significant crop issues reported this year. It has however been an exceptionally wet
winter with 570mm of growing season rainfall recorded leading to some areas of the farm being submersed
in water.
C. Levitzke, Agronomist, Rodwells Culcairn
9. ASSESSMENT OF PERFORMANCE OF THE CROPPING SCHEME
9.1. Irrigation Sectors 1 - 12
The cropping program has continued annually on these sectors with excellent crop results. There are no
crop growth impediments observed in the irrigation sectors by the agronomist, nor any issues reported by
the shared farmer. In fact the moderate nitrogen and phosphorous environment leads to very good crops
being produced, generally above district averages.
Proof of this has been shown by the continued high production levels produced on the farm with little or no
ill crop effects.

GEELONG LEATHER PTY LTD
ANNUAL PERFORMANCE SYSTEM REPORT 2016 REVISION: 1
DATE: 27/10/2016
IRRISEC1-12_EPA ANNUAL RETURN_LIC NO 3465_SEP2015 – SEP2016 36
10. IDENTIFIED SUSTAINABILITY INDICATORS
10.1. Irrigation Management
Reduced effluent application across all Sectors to target 1.0 ML/Ha and further reduction to 0.7 of a ML/ha
on sector 4 have achieved exactly what was anticipated with Chloride levels falling within the target
guidelines of 150 mg/kg of Chloride. This is a very satisfying outcome.
An annual review of the performance of the irrigation management system by Chris Levitzke, Rodwells
Culcairn, from data collected on operation and environmental performance will assist Geelong Leather with
identifying areas of potential risk and improvements to the system ensuring the effluent is being managed
in a responsible, sustainable fashion for the long term.
The Additional Farm Purchased in this year as previously stated will double the amount of arable land
available to Geelong leather to apply effluent to.
This property has already had 1.0 t/ha of Lime applied and 1.0 t/ha of Gypsum applied. It has had very long
history of poor farming practice, one way disc workings resulting poor soil structure, low porosity and
significant hard pans. This property will respond very well to another tonne of gypsum being applied and
good control traffic farming practice. There is no soil type difference between the two properties and
envisage that the new property will be equally productive in time.
10.2. Crop Selection
The choice of the crop to be grown by Geelong Leather in an effluent irrigation sectors involved considering
the following factors:
(a) Characteristics of the soil type, topography, climate
(b) The effort needed to manage the irrigation area
(c) Level of management of irrigation application
(d) Cultivation, planting, and harvesting operations
(e) marketing of agricultural products
(f) weed control
(g) Possible need for tolerance to high nutrient levels or salinity
(h) Ability to accumulate nutrients – if nutrient loads are high then crops capable of using these
nutrients are preferred
(i) Water requirements – crops with higher water use may not necessarily be the best because water
is often in short supply compared with the amount of nutrients to be used for irrigation producing
Lucerne or Sorghum
(j) Financial considerations – capital costs, operating costs.

GEELONG LEATHER PTY LTD
ANNUAL PERFORMANCE SYSTEM REPORT 2016 REVISION: 1
DATE: 27/10/2016
IRRISEC1-12_EPA ANNUAL RETURN_LIC NO 3465_SEP2015 – SEP2016 37
With the above in mind Geelong Leather has found that cropping programs using a combination of the
following have best performed year after year; Wheat, Barley, Sorghum, Oats and Canola. This selection has
ensured Geelong Leather is able to maximise the removal of nutrients through harvesting and minimise the
accumulation of nutrients in the soils to achieve a sustainable site nutrient balance.
11. IMPACTS (NON-COMPLIANCES)1
11.1. Irrigation Sectors 2, 4, 6
Chloride levels are now at sustainable long term levels and the current effluent application rates can be
maintained until the new irrigation works are completed on the new block at which time we could halve
our application rates again.
11.2. Irrigation Sectors 1 - 12
Undesirable chloride levels were being discharged in final effluent from November 2014 until May 2015.
The chrome supernatant, generated from the highly efficient chromium removal process, is the main
contributor to the undesirable chloride levels. However since the end of May 2015 the chrome supernatant
has been diverted to one of the onsite 40ML evaporation ponds, reducing the chloride levels below
700ppm and final effluent discharged by 25%.
1 Assessments of the area and strategy of how they will be addressed.

GEELONG LEATHER PTY LTD
ANNUAL PERFORMANCE SYSTEM REPORT 2016 REVISION: 1
DATE: 27/10/2016
IRRISEC1-12_EPA ANNUAL RETURN_LIC NO 3465_SEP2015 – SEP2016 38
12. RECOMMENDATIONS FOR FUTURE ACTIONS2
12.1. Irrigation Sectors 2, 4, 6
Chloride Reduction – maintain current effluent application rate of 1ML/Ha to 0.7ML/Ha for this season with
planned reduction or full rotation onto the new block.
12.2. Irrigation Sectors 1 - 12
Geelong Leather will continue to transfer the chrome supernatant to the one onsite 40ML evaporation dam
to aid in removing as much chloride from the effluent discharge as possible, hence reducing the load on the
land. The second 40ML dam will only be considered if the current dam does not achieve desired
evaporation rates.
Hay making will be increased on the farm as a general practice. It removes the maximum nutrient load per
hectare. Further Straw removal following harvest of coarse grains such as wheat and barley also removes a
further, admittedly small proportion of nutrients.
12.3. Procurement of Additional land
The purchase of the adjoining farm in July 2016 will also, over time, once the infrastructure is completed
(June 2017), allow the irrigation effluent to be effectively halved in application rate. That plus the reduced
effluent concentration will in effect make the plant at current production levels future proof in its effluent
management.
2 So as to achieve a sustainable effluent management system.

GEELONG LEATHER PTY LTD
ANNUAL PERFORMANCE SYSTEM REPORT 2016 REVISION: 1
DATE: 27/10/2016
IRRISEC1-12_EPA ANNUAL RETURN_LIC NO 3465_SEP2015 – SEP2016 39
13. DECLARATION
Declaration of accuracy of data presented to the New South Wales Environmental Protection Authority.
I Jay Stottelaar, a Plant Manager of Geelong Leather PTY LTD (“the company”) confirm, on behalf of the
company that I have reviewed the data recorded in the attached document and that the results presented
from the monitoring has been undertaken by a person(s) with qualifications and experience in soil science
and water quality. The person(s) is/are also able to provide specialised advice on the impacts of current
effluent irrigation practises and on future sustainable management effluent irrigation areas.
Signature …………………………………………………….
Name …………………………………………………….
Position …………………………………………………….
Date …………………………………………………….

GEELONG LEATHER PTY LTD
ANNUAL PERFORMANCE SYSTEM REPORT 2016 REVISION: 1
DATE: 27/10/2016
IRRISEC1-12_EPA ANNUAL RETURN_LIC NO 3465_SEP2015 – SEP2016 40
14. REFERENCES
Department of Environment and Conservation (NSW), Environmental Guidelines: Use of effluent by
irrigation, October 2004, DEC2004/87
MAPS OF EVAPOTRANSPIRATION Q.J. Wang, F.L.N. McConachy, F.H.S. Chiew Cooperative Research Centre
for Catchment Hydrology University of Melbourne R. James, G.C. de Hoedt and W.J. Wright Cooperative
Research Centre for Catchment Hydrology Bureau of Meteorology
http://www.bom.gov.au/climate/averages/climatology/evapotrans/text/et-description.pdf
Australian Government: Rainfall: Bureau of Meteorology Station: 074188 Culcairn Bowling Club,
Evaporation: Bureau of Meteorology Station: 072150 Wagga Wagga AMO
http://www.bom.gov.au