Embed Size (px)
Citation preview

The private schooling phenomenon in India: A review
Geeta Gandhi Kingdon
Department of Quantitative Social Science
Working Paper No. 17-06
April 2017
Disclaimer
Any opinions expressed here are those of the author(s) and not those of the UCL Institute of Education. Research published in this series may include views on policy, but the institute itself takes no institutional policy positions. DoQSS Workings Papers often represent preliminary work and are circulated to encourage discussion. Citation of such a paper should account for its provisional character. A revised version may be available directly from the author. Department of Quantitative Social Science, UCL Institute of Education, University College London,
20 Bedford Way, London WC1H 0AL, UK

3
The private schooling phenomenon in India: A review
Geeta Gandhi Kingdon1 Abstract
This paper examines the size, growth, salaries, per-pupil-costs, pupil achievement levels and cost-effectiveness of private schools, and compares these with the government school sector. Official data show a steep growth of private schooling and a corresponding rapid shrinkage in the size of the government school sector in India, suggesting parental abandonment of government schools. Data show that a very large majority of private schools in most states are ‘low-fee’ when judged in relation to: state per capita income, per-pupil expenditure in the government schools, and the officially-stipulated rural minimum wage rate for daily-wage-labour. This suggests that affordability is an important factor behind the migration towards and growth of private schools. The main reason for the very low fee levels in private schools is their lower teacher salaries, which the data show to be a small fraction of the salaries paid in government schools; this is possible because private schools pay the market-clearing wage, which is depressed by a large supply of unemployed graduates in the country, whereas government schools pay bureaucratically determined minimum-wages. Private schools’ substantially lower per-student-cost combined with their students’ modestly higher learning achievement levels, means that they are significantly more cost-effective than government schools. The paper shows how education policies relating to private schools are harmful when formulated without seeking the evidence.
Keywords: Private schooling; learning achievement; value for money; India
Contact Details: Geeta Gandhi Kingdon ([email protected]) UCL Institute of Education
Acknowledgements: The author gratefully acknowledges the research assistance of Prashant Verma
with the statistical analysis of NSS and DISE data. Any errors are the author’s.
1 UCL Institute of Education

4
1. Introduction
Private fee charging schools are a visibly ubiquitous phenomenon in urban and rural India. On the one hand they are in high public demand and growing in numbers, on the other, in public discourse their growth is often dubbed the ‘mushrooming of teaching shops’ and opposed. State governments regulate private schools to a lesser or greater degree. The Right to Education Act 2009 co-opts them for the delivery of education, mandating that they give at least 25% of their seats to children of ‘economically weaker sections and disadvantaged groups’ for which the state governments will reimburse them, thus setting up a unique kind of public-private partnership in education.
Yet, despite their preponderance and growth, and the public expectation from them, relatively little is known about the nature of private schools in the country. This review unravels the enigma by presenting up-to-date evidence on several important facets of private schools, and benchmarks these by comparing with government schools. The paper asks a number of questions: Policy makers’ perceptions about private schools are more heavily shaped by the types of private schools that are prominent and visible in the national and state capitals, but are these schools representative of the wider reality of private schooling in the country? What are the actual numbers of private schools, and just how rapidly are they growing? How diverse are they in terms of their fee levels and costs, and are high-fee private schools the main bulk – or just a small minority – of all private schools? What are their teacher salaries, the achievement levels of their students, and the ‘value for money’ they offer? What are the implications of the RTE Act for the existence and spread of private schools? Given the omnipresence of private schools in India, these are important questions, and it is not possible to make sensible education policies in ignorance of the reality of private schooling in the country. This paper offers evidence on these issues from the official District Education System on Education (DISE) data, National Sample Survey (NSS) household data, the Annual Status of Education Report (ASER) data, and from data presented in a number of existing studies.
Section 2 describes the datasets used, and assesses their strengths and drawbacks. Section 3 examines the size and recent growth of the private and government schooling sectors in India. Section 4 presents evidence on the fee levels of private schools by state. Section 5 presents data on teacher salaries in private and government schools while Section 6 examines the learning outcomes in these two school sectors. Section 7 compares the cost-effectiveness of private and government schools, assessing whether private schools offer higher value-for-money to parents than that which the tax-payer gets from public expenditure on education. Section 8 considers the provisions of the Right to Education Act that impinge on private schools and the last Section concludes.
2. The data

5
There are several challenges in piecing together the picture on private unaided schooling in India to answer the above questions, since there is no one comprehensive data source on private schooling in India. Before the passage of the Right to Education (RTE) Act 2009, in most states private schools were not even required to be registered let alone be mandatorily government-‘recognised’. While officials thus do not have a comprehensive list of all unrecognised private schools, they do informally know of many of these schools, since they are required to serve closure notices to the unrecognised schools. Yet, the official District information System on Education (DISE), which is meant to be an annual census of all schools in the country, generally does not collect data from most of the so-called non-recognised private schools2. Moreover, coverage of even the recognised private schools is incomplete in DISE since not all private unaided schools give their data. Finally, to compound matters, although the DISE questionnaire separately identifies aided and unaided private schools, in the DISE data report cards published annually by the official agency3, in practice unfortunately these two types of schools are often lumped together and treated as a single category ‘private schools’.
While the Annual Status of Education Report (ASER) published by NGO Pratham is helpful in generating extensive evidence on private as well as public schools across about 15,000 villages across all Indian districts annually, it is based on a rural survey only and misses out urban India altogether. Moreover, it also lumps together private aided and private unaided schools into a single category ‘private’. While for some states, the distinction is unimportant because there are few aided private schools there, in other states with a higher proportion of aided private schools, the distinction matters much. Despite sharing the word ‘private’ in their names, private unaided and private aided schools differ fundamentally in their modes of operation. Private aided schools are virtually like public schools in the way they are governed. Although nominally and de jure run by their private management boards, de facto they are heavily governed by the state. Following centralising legislation in the early 1970s which virtually nationalised the aided schools4, their teachers’ salaries are paid by the government treasury and not via the private school management; they are paid at the same rate as government school teachers; and their salaries are paid directly into the bank accounts of their teachers, exactly as in government schools. Moreover, private aided schools’ teachers are recruited and appointed not by their respective managements but by a government-appointed state Education Service Commission, the same body that recruits and appoints teachers to the government schools. All this implies that after the early 1970s, aided schools became virtually like government schools, where teachers are roughly only as accountable to their
2 ‘Recognition’ is a government stamp of approval for a private school, to certify that it is fit to run as a school.
Since the enactment of the Right to Education Act 2009, all private schools have to legally be recognised. The
Act stipulates the conditions a private school has to fulfil in order to be ‘recognised’ and it allows state
governments to add further recognition conditions. Although the state governments are clamping down on
unrecognised private schools, surveys suggest that their numbers continue to be substantial. 3 The agency that collates the DISE data nationally from all the states is the National University of Educational
Planning and Administration, NUEPA, in New Delhi. The inconsistencies in DISE data have often been
highlighted (for one example, see NUEPA study by Ramachandran, 2015). 4 Following extensive teacher union protests by the teachers of aided private schools, sit-ins, strikes and exam-
boycotts over a period of months in Uttar Pradesh, the Salary Disbursement Act 1971 was passed by the state
Legislative Assembly; similar Acts were passed in other states, e.g. the Direct Payment Act of Kerala in 1972.

6
respective private managements as government school teachers are to district education authorities. Furthermore, aided private cannot charge any tuition fee in elementary education (upto grade 8), just as government schools cannot.
By contrast, private unaided schools conform to the stereotypical idea of what private schools are, namely autonomous fee charging schools run by private managements and which recruit/appoint their own teachers and pay them salary scales determined by themselves (roughly based on the supply and demand of educated persons in their local labour market), rather than necessarily following the government pay structure. Thus, we shall refer to private aided schools simply as Aided schools, and shall refer to private unaided schools simply as Private schools. Thus, for the purposes of this paper, all Indian schools are categorised into three major types: Government schools (whether run by state, central or local government), Aided schools and Private schools.
The National Sample Survey (NSS) which is an annual household survey, periodically collects information on education, for example, in 1995-96, 2007-08 and again in 2014-15. While NSS is a household survey and not a school survey, it nevertheless has valuable information on enrolment in different school types, which permits cross-checking the veracity and comprehensiveness of school censuses (such as DISE) and surveys (such as ASER), and it also furnishes data on household expenditure on education in different types of school – government, aided, and private5.
This paper draws together evidence from all the above sources, i.e., raw National Sample Survey (NSS) data for various years (latest being 2014-15, 71st Round NSS), the ASER data, District Information System on Education (DISE) data, and data in studies carried out by individual scholars or institutions.
3. The size and growth of the private schooling sector in India
A useful starting point is to first establish the extent of private schooling in the country, and to see its growth over time. We present some data on this. But before doing that, it is useful to consider the definition of ‘private schools’ in official DISE data. Published DISE tables typically divide all schools into two types: ‘government’ and ‘private’ schools. They inadvertently misestimate the extent of private schooling, for three reasons:
1. DISE fails to cover all of the so-called ‘unrecognised’ private unaided schools, leading to an under-estimation in the true size of the private school sector.
5 One caveat with NSS data is that when householders fill this survey, some may not know whether the school
their child attends is private aided or unaided, since this distinction is not clear since: all aided schools start life
as unaided and later some of them apply for and get government grant-in-aid, and some parents may not know
about this change; many aided schools run unaided primary sections and run aided upper primary
(middle/junior) sections and parents may be unaware of this change when their child moves from primary to
upper primary; although aided schools are not meant to charge any tuition fee, de facto they charge fee under
other heads, but the parent may not know this distinction – knowing only that she has to pay a given amount.

7
2. In its published tables, DISE does not add even the few unrecognised private schools that it does collect data on, again leading to an underestimation of the private sector.
3. DISE lumps together aided and private unaided schools into a single category ‘private’, leading to an over-estimation of the true size of the private school sector.
Of these three sources of bias, the third leads to a relatively minor over-estimation, but the first two sources lead to a substantial under-estimation, of the size of the private schooling sector in India, and we turn to show this below. Failure to comprehensively cover the unrecognised private schools As stated in the Introduction, DISE does not cover all the un-recognised private schools. Kingdon (2007) reported the findings of five studies from different parts of India to show that there were roughly as many unrecognised private schools in India as there were recognised ones6 and there continue to be journalistic reports of large numbers of unrecognised schools. In other words, DISE reportage of private schools appears to be greatly under-estimated. While the RTE Act 2009 mandated that no school can run without obtaining a certificate of government recognition, thousands such schools nevertheless continue to function. District education authorities routinely give warning notices to unrecognised schools each year, threatening to close them down, which suggests they are well aware of many unrecognised schools, and yet DISE data report zero unrecognised schools in many states, as seen in Table 3, e.g. Chhattisgarh, Gujarat, Himachal, Jharkhand, Karnataka, Maharashtra, Rajasthan and Uttar Pradesh, thus missing out at least tens of thousands of unrecognised private schools7. In summary, DISE seriously under-estimates the extent of private schooling in the country because of its failure to comprehensively cover the unrecognised private schools. Failure to include even the unrecognised private schools on which data is collected While DISE collects information on a few unrecognised private schools in many states, and Table 3 (calculated by the author from raw DISE data), shows that such included schools constituted 2% of all elementary schools in the country in 2014-15, many DISE tables published by NUEPA exclude these schools from the ‘private schools’ category. This leads to another small under-estimation of the true extent of private schooling in the country.
6 Muralidharan and Kremer (2006) find that in their national survey of 20 states, 51% of all private rural primary
schools were unrecognized. This accords with evidence from individual states in other studies which find that
between 41 and 86 percent of all primary private schools were unrecognized in different parts of India:
Aggarwal (2000) found that in his four surveyed districts of Haryana in 1999, there were 2120 private primary
schools of which 41% were unrecognized. The PROBE survey of 1996 in 5 north Indian states did a complete
census of all schools in 188 sample villages. It found 41 private schools, of which 63% were unrecognized.
Mehta (2005) found that in 7 districts of Punjab, there were 3058 private elementary (primary +junior) schools,
of which 86% were unrecognized. For more evidence based on various data sources, see Kingdon (2006). 7 A newspaper report in June 2016, included here as Annex 1, shows the local teacher union alleging that there
are at least 2000 unrecognised private schools in one district (Lucknow) of Uttar Pradesh but the DISE District
Report Card 2014-15 shows 0 unrecognised private schools and 2840 recognised private schools in this district.
There are 75 districts in UP and DISE reports a total of 78,094 recognised private schools in UP. Thus, if the
same ratio of recognised to unrecognised schools exists in the whole UP as in Lucknow district, then there
would be an estimated 54,996 unrecognised private elementary schools in Uttar Pradesh alone!

8
Lumping together aided and private schools As mentioned above in the Introduction, aided schools are private virtually only in name, since their pupil fee levels and teacher salaries and emoluments are the same as in government schools, and since their teachers are paid directly by the government, and are recruited and appointed by the same body and via the same process as government school teachers. The only role of the private management is that they originally provided the land/buildings in which the school runs and, in consideration of that, the monthly salary sheet of the aided school teachers is counter-signed by their private management before salaries are transferred by the government treasury into the teachers’ bank accounts. This minor role plus the fact that aided school teachers cannot be transferred to other schools (whereas government school teachers can), is used to maintain the veneer that these schools belong to their private managements, and in most of the tables presented in the DISE data reports, the term ‘Private’ school includes both aided and private schools. The separate classification of these two school types – aided and private – and separate presentation of data on them, is an important issue that needs serious thought by policy makers. In summary, published DISE data over-estimates the extent of private schooling in the country by including aided schools in the category of ‘private schools’, but seriously underestimates the extent of private schooling by excluding the unrecognised private schools. The impact of the RTE Act 2009 on the number of unrecognised private schools is unclear as yet, and is a subject for new research. For the purposes of this paper, and in contrast with DISE data, we use the term ‘private school’ to include private unaided schools (both recognised and unrecognised) as these display the conventional defining features of ‘private’, i.e. schools that have autonomy in teacher recruitment and job-separation and in fixing teacher salary and pupil fee levels, and our definition of ‘private’ excludes aided schools. Where we present data on government (public) schools, aided schools are again not taken into account, even though they are publicly funded and controlled. Extent of private schooling (in 2014-15)
What proportion of the elementary age children are actually studying in private schools in the different states of India? Table 1 shows the pattern of private school attendance in India. Firstly, private schooling is much more spread in urban than in rural areas. Secondly, the utilisation of private schooling is perverse from an equity point of view because (except in rural areas in the secondary age) private schooling is most prevalent at the primary school stage, less prevalent at the upper primary stage, and the least prevalent than at the secondary/higher-secondary school stage.
Table 1 shows that in 2014-15, in the primary school age group (6-10 year olds), 49% of urban and 21% of rural children attended private schools. That nearly half of all primary age children in urban India are studying in private schools is striking. In the upper primary school age group (11-14 year olds), a rather smaller proportion are attending private unaided schools: 40.7% in urban and 17.5% in rural India. This is perverse from an equity point of view because it implies that many children who were willing and able to pay for their primary education (by attending private schools) end up going to free government or aided schools for their upper primary education.

9
In urban areas, at the secondary school stage, the proportion attending private schools shrinks further still, to 36% - compared with 49% at the primary and 41% at the upper primary stage.
Apart from this wide rural-urban disparity, there are also pronounced inter-state
variations in the extent of utilisation of private schooling, as seen in Table 2. States with high prevalence of private schooling are Andhra, Haryana, Punjab, Rajasthan, Telengana and Uttar Pradesh. Change in private schooling, over time
How has the extent of private schooling changed over time? Table 4 shows the temporal change in number of government and private schools, and Table 5 shows the change in their enrolments, based on the author’s analysis of raw DISE data on 20 major states of India. Table 4 shows that, over the four year period 2010-11 to 2014-15, the total stock of government schools in India (20 major states of India) rose by a mere 16,376 govt. schools. By contrast the number of private schools rose by 71,360 schools. Despite the modest increase in the number of govt. schools, the total enrolment in govt. schools over this period actually fell by 11.1 million (1 crore 11 lakh) students, whereas total enrolment in private schools rose by 16 million (1 crore 60 lakh) students, over the same 4 year period.
In some states, the growth of private schooling was very pronounced, e.g. in Tables 4 and 5 in Uttar Pradesh, the number of private schools rose by 31,196 over this short four-year period, and private school enrolment rose by nearly 7 million (70 lakh) students and govt. school enrolment fell by 2.6 million (26 lakh) students, over this four-year period.
Another way of gauging the demand for private and government schools is to
observe how the average size of schools has changed over time. Table 5 shows that the average size of govt. elementary schools in India fell from 122 students per school in 2010-11 to 109 students per school by 2014-15, a decline of 12 students per govt. school, or a decline of about 10% over a short four year period. In some states, the average size of govt. schools fell steeply, e.g. in Maharashtra, UP, etc. By contrast, the average size of private schools was significantly larger in the baseline year (202 instead of 122), and it also further rose from 202 to 207 in the four year period between 2011 and 2015, even though the number (supply) of private schools also rose strongly over the period by around 70,000 new private schools.
Table 5 also shows the picture for each state. In Madhya Pradesh, mean govt.
school size fell from an already low of 95 students in 2010 to only 70 students in 2015, reduction of 26.3% in mean govt. school size in just 4 years. While it is expected that average school size in the hilly states would be lower, the very low average enrolment per govt. school of 49 in Himachal, 54 in Uttarakhand and 55 in Jammu-Kashmir in 2010 fell further to 38, 44 and 43 respectively, by 2015. An average size of 38 students per govt. school means less than 8 students per class (for primary schools with classes 1 to 5) or less than 5 students per class (for elementary schools, with classes 1 to 8). Thus, the govt. schools in these three hilly states are both pedagogically and economically unviable. Other states which saw a

10
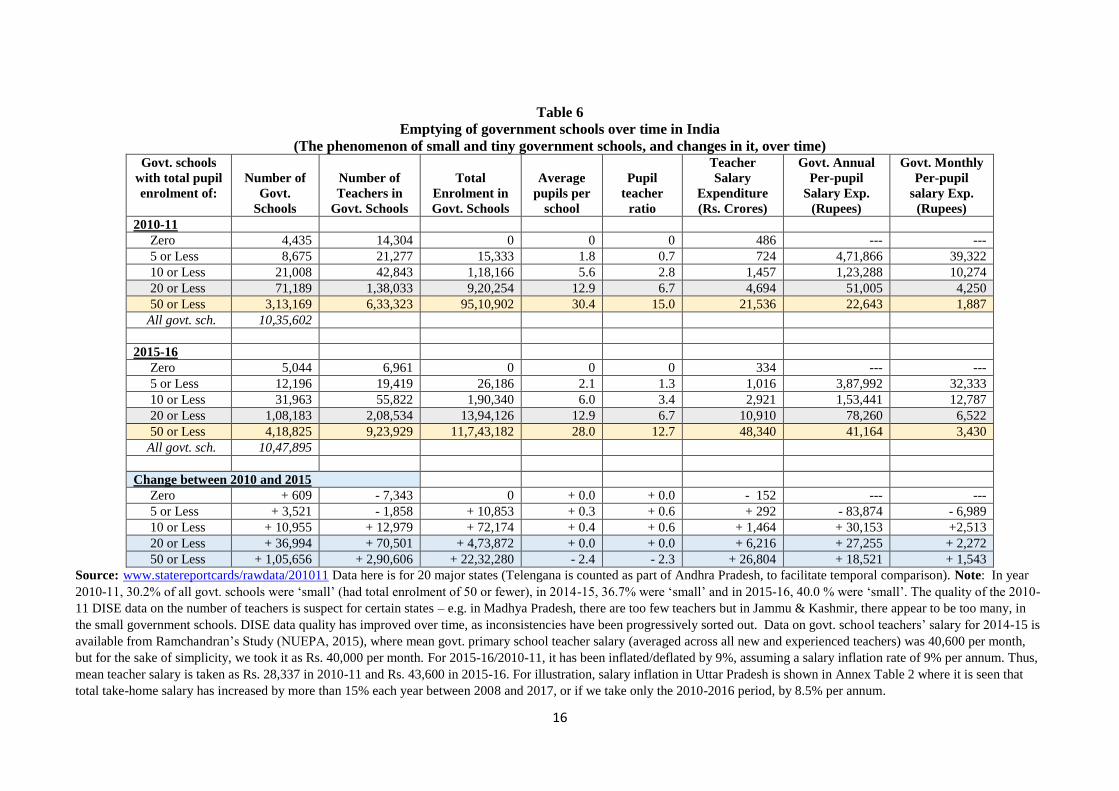
heavy reduction in govt. school enrolments and thus in the mean govt. school size are Uttar Pradesh, West Bengal, Maharashtra and Haryana. In several large states, by 2015-16, the mean number of pupils in govt. schools fell to significantly below 100, e.g. Madhya Pradesh (70), Andhra (73), Chattisgarh (74), Assam (83), Odisha (86) Maharashtra (88), Karnataka (89), Rajasthan (89), again pointing to both pedagogical and economic unviability. The abandonment of govt. schools and the shift towards private schools is also clearly visible when we examine how the number of govt. schools that are ‘small’ or ‘tiny’ has increased over time. Abandonment of government schools, migration to private schools We define a ‘small’ school as one in which total enrolment (in the school as a whole) is 50 or fewer students, which means 10 or fewer students per class, in a primary school, or it means 6 or fewer students per class, in an elementary school. We define a ‘tiny’ school as one in which total enrolment is 20 or fewer students, which means 4 or fewer students per class, in a primary school or say 3 students per class in an elementary school8. Table 6 illustrates the phenomenon of the abandonment and emptying of govt. schools by highlighting its manifestation in the rapid growth of ‘small’ and ‘tiny’ government schools in India. We can measure the emptying of government schools further by examining the small-school phenomenon, and asking whether the number of govt. schools that are small or tiny is growing over time. Table 6 shows that in the year 2010-11, India (20 major states) had 3,13,169 small govt. schools, which constituted 30.2% of all govt. schools. By 2014-15, the number of small govt. schools had increased 3,86,328 (36.7% of all govt. schools), and by the following year 2015-16, their number had rather sharply further increased to 4,18,825 small schools (40.0% of all govt. schools). In other words, small govt. schools increased from 30% to 40% of all govt. schools, signifying a rapid emptying of govt. schools in a short period. Correspondingly, the average number of pupils per small govt. school fell from 30.4 pupils in 2010 to 28 pupils in 2015. Pupil teacher ratio also fell from 15 to 12.7 between 2011 and 2015. The government’s teacher salary per-pupil-expenditure increased from Rs. 1887 per pupil per month in 2010 to 3090 pppm in 2014 and further to 3430 pppm in 2015. What has happened to the number of govt. schools that are ‘tiny’ i.e. with a total
enrolment of 20 or fewer students? Here too the number of such tiny govt. schools
has increased over time, from 71,189 tiny govt. schools in 2010, to 100,409 tiny govt.
schools in 2014, and further to 108,183 tiny govt schools in 2015. The average
teacher-salary-cost-per-pupil in these tiny government schools rose from being
around Rs. 4250 per pupil per month in 2010 to 6522 pppm in 2015.
8 If a school has both primary and middle sections in it, i.e. has 8 grades in it (class 1 to 5 being the primary
grades and class 6 to 8 being the middle/junior grades), then the number of students per class will be even lower.

11
Older DISE data for 2005-06 shows that there were 60,033 tiny govt. schools (with <=20 pupils) and 2.31,989 small govt. schools (with <=50 pupils) in the same 20 major states, indicating that the emptying and decline of govt. schools is a long term trend. Table 7 shows the emptying govt. schools phenomenon by state, for the period 2010 to 2015. Madhya Pradesh, Rajasthan, West Bengal and Andhra Pradesh have had the greatest emptying of govt. schools, in terms of highest absolute increases in the number of tiny govt. schools. Madhya Pradesh and Maharashtra saw an increase of nearly 24,000 and nearly 22,000 in the number of ‘small’ govt. schools, and West Bengal and Uttar Pradesh also saw large increases. The emptying of govt. schools – and the resultant swelling number of govt. schools that have become ‘tiny’ or ‘small’ – is largely the result of an exodus of students from government schools and migration towards private schools, since there has been no drop in the child population. On the contrary, over the period under consideration, there has been a substantial increase of 4.3% in the absolute primary-school-age population of 6-10 year olds in India between 2009 and 2014 (IMRB Surveys 2009, 2014), see Annex Table 1.
Table 1
Percentage of children studying in private unaided schools in India,
by age and area, 2014-15
Age Rural Urban Total
6-10 20.8 48.9 31.8
11-14 17.5 40.7 27.0
15-18 24.5 36.1 29.6
Total 20.8 42.1 29.6
Source: Author’s calculations from the National Sample Survey raw data, 71st Round, 2014-15.
Note: ASER (2014) data show that 30% of rural 6-14 year olds attended private schools in rural India in 2014
which is higher than the numbers given here, but ASER combines aided and unaided private schools while the
above table is for purely private unaided schools.

12
Table 2
Percentage of children in private unaided schools, by state, 2014-15
RURAL URBAN TOTAL
Age
6-10
Age
11-14
Age
15-18
Rural
Total
Age
6-10
Age
11-14
Age
15-18
Urban
Total
State
Total
ANDHRA PRADESH 28.3 17.0 52.3 31.9 69.2 55.6 67.9 64.5 47.8
ASSAM 5.1 4.5 5.2 5.0 25.5 26.7 23.5 25.3 9.0
BIHAR 10.6 9.2 12.3 10.6 43.8 31.3 23.0 33.2 18.2
CHHATTISGARH 6.8 10.0 8.8 8.4 47.5 41.9 37.5 42.7 22.4
DELHI 43.8 34.8 40.0 39.1 33.6 28.6 23.1 28.8 29.4
GUJARAT 4.9 4.9 14.7 7.7 27.7 24.1 22.2 24.8 15.4
HARYANA 40.1 29.6 39.4 36.7 72.7 68.9 58.0 67.2 51.2
HIMACHAL PRADESH 33.3 21.1 18.7 24.3 62.3 48.1 35.3 49.4 28.7
JAMMU & KASHMIR 36.7 29.0 15.6 27.8 72.5 60.1 26.8 53.0 37.1
JHARKHAND 8.9 9.6 16.0 10.8 45.3 47.3 41.4 44.7 23.5
KARNATAKA 12.8 9.7 19.2 13.8 42.1 34.9 31.6 36.5 24.6
KERALA 36.3 20.3 25.9 27.2 45.7 31.7 32.6 36.6 32.0
MADHYA PRADESH 17.3 15.3 18.8 17.0 53.1 48.1 48.3 50.0 31.0
MAHARASHTRA 7.9 3.6 8.6 6.7 26.4 19.8 15.0 20.3 13.1
NORTHEAST STATES* 18.5 14.9 17.1 17.1 38.7 31.5 28.4 32.9 23.0
ODISHA 8.4 4.5 22.1 10.4 33.9 26.2 30.8 30.3 15.8
PUNJAB 36.7 32.5 30.8 33.5 64.5 60.5 44.4 56.2 44.4
RAJASTHAN 36.7 35.0 44.6 38.3 77.1 74.9 58.8 70.1 50.9
TAMIL NADU 32.1 14.4 36.0 27.2 57.5 40.4 44.7 47.5 37.0
TELENGANA 41.6 34.2 58.0 45.3 82.5 75.3 74.6 77.6 62.0
UTTAR PRADESH 38.1 41.5 42.8 40.5 69.2 61.6 47.3 60.0 47.2
UTTARANCHAL 14.4 12.2 14.0 13.5 67.0 64.8 42.3 57.9 30.6
WEST BENGAL 6.0 2.8 6.0 4.9 24.5 13.2 14.7 17.4 10.2
India Total 20.8 17.5 24.5 20.8 48.9 40.7 36.1 42.1 29.6
Source: Author’s calculations from the raw data of the National Sample Survey, 71st Round, 2014-15.
Notes: *The average of the Northeast states; these are Arunachal Pradesh, Manipur, Meghalaya, Mizoram,
Nagaland, Sikkim and Tripura.

13
Table 3
Percentage of schools of different management-types (from raw DISE data, 2015-16)
School
Management
Government
Schools
Private
Aided
School
Private
Unaided
recognised
School
Private unaided
unrecognised
Schools
Madarsas Total
Andhra Pradesh 73.5 3.8 21.9 0.6 0.3 100
Assam 76.1 6.0 5.9 11.6 0.4 100
Bihar 89.1 0.3 4.1 5.1 1.5 100
Chhattisgarh 87.5 0.8 11.2 0.0 0.4 100
Gujrat 76.8 1.8 21.4 0.0 0.0 100
Haryana 65.6 1.0 29.7 3.7 0.1 100
Himachal Pradesh 85.4 0.0 14.6 0.0 0.0 100
Jammu & Kashmir 81.6 0.0 18.4 0.0 0.0 100
Jharkhand 85.2 2.4 3.1 9.0 0.3 100
Karnataka 73.8 5.1 21.1 0.0 0.0 100
Kerala 27.8 41.7 20.4 10.1 0.0 100
Madhya Pradesh 80.3 0.7 17.9 0.0 1.2 100
Maharashtra 68.5 18.5 12.4 0.5 0.0 100
Odisha 84.8 7.0 5.3 2.8 0.0 100
Punjab 71.2 1.6 23.3 3.8 0.1 100
Rajasthan 65.5 0.0 32.3 0.0 2.2 100
Tamil Nadu 66.4 14.6 18.7 0.3 0.0 100
Telangana 70.3 1.8 26.5 0.4 1.1 100
Uttar Pradesh 65.6 3.3 29.4 0.0 1.7 100
Uttaranchal 74.0 2.3 22.2 0.8 0.7 100
West Bengal 86.4 0.3 9.9 1.7 1.7 100
Major 20 States 74.5 4.4 18.5 1.7 0.9 100
Source: www.dise.in/statereportcards/rawdata201415
Note: ‘Government schools’ includes Dept. of Education schools, Tribal and Social Welfare Dept. schools,
Local Body schools and Central govt. schools.

14
Table 4
Change in the number of Government and Private schools, by state
(2010-11 to 2015-16)
State Government schools Private schools
2010-11 2015-16 Change 2010-11 2015-16 Change
Andhra Pradesh* 79314 73078 -6236 24823 25159 336
Assam 44371 50143 5772 13144 11821 -1323
Bihar 67930 71411 3481 1423 8534 7111
Chhattisgarh 46390 44387 -2003 4552 5918 1366
Gujarat 33531 33843 312 6405 9418 3013
Haryana 14955 14598 -357 5549 7443 1894
Himachal Pradesh 15126 15386 260 2285 2638 353
Jammu-Kashmir 22180 23329 1149 4915 5249 334
Jharkhand 40517 40437 -80 2949 5870 2921
Karnataka 46522 45556 -966 10259 13063 2804
Kerala 4958 4573 -385 906 5023 4117
Madhya Pradesh 111943 114465 2522 23710 27194 3484
Maharashtra 68691 67294 -1397 9775 12737 2962
Odisha 57171 58476 1305 4347 5642 1295
Punjab 20238 20488 250 10139 7820 -2319
Rajasthan 77529 70664 -6865 26760 37267 10507
Tamil Nadu 36120 38200 2080 10622 10946 324
Uttar Pradesh 151448 161329 9881 41961 76546 34585
Uttaranchal 17345 17505 160 4823 5616 793
West Bengal 79323 82737 3414 10227 12733 2506
India (20 states) 10,35,602 10,47,899 12,297 2,19,574 2,96,637 77,063
Source: DISE raw data, from www.dise.in
Note: *Andhra Pradesh here includes Telengana even in 2015-16, in order to permit comparison with 2010-11. Thus the reduction in
the number of govt schools in Andhra Pradesh by 2015-16 here is not due to any removal of Telengana.

15
Table 5
Change in student enrolment in Government and Private schools, by state
(2010-11 to 2015-16)
Total student Enrolment Average Enrolment Per School
Government schools Private schools Government Private
2010-11 2015-16 Change 2010-11 2015-16 Change 2010-11 2015-16 Change 2010-11 2015-16 Change
Andhra Pradesh* 6186492 5367402 -819090 4592255 4943739 351484 78 73 -5 185 196 11
Assam 4082132 4140192 58060 998944 1013270 14326 92 83 -9 76 86 10
Bihar 19495910 21548010 2052100 404132 1812378 1408246 287 302 15 284 212 -72
Chhattisgarh 3808619 3281257 -527362 755632 1113912 358280 82 74 -8 166 188 22
Gujarat 5901456 5816280 -85176 2017575 3031588 1014013 176 172 -4 315 322 7
Haryana 2093700 1663752 -429948 1304015 2006442 702427 140 114 -26 235 270 35
Himachal Pradesh 745712 580395 -165317 284026 370371 86345 49 38 -11 124 140 16
Jammu-Kashmir 1213246 1024643 -188603 786400 832133 45733 55 44 -11 160 159 -1
Jharkhand 5591346 4727894 -863452 928935 1508344 579409 138 117 -21 315 257 -58
Karnataka 4624287 4043609 -580678 2328793 3007783 678990 99 89 -10 227 230 3
Kerala 1075886 859682 -216204 375084 1471373 1096289 217 188 -29 414 293 -121
Madhya Pradesh 10634585 7979148 -2655437 4623450 4720051 96601 95 70 -25 195 174 -21
Maharashtra 7418628 5937688 -1480940 2433975 3803480 1369505 108 88 -20 249 299 50
Odisha 5659929 5053711 -606218 599886 992117 392231 99 86 -13 138 176 38
Punjab 2165466 2072324 -93142 1642518 1760579 118061 107 101 -6 162 225 63
Rajasthan 7132668 6264557 -868111 4736520 6073144 1336624 92 89 -3 177 163 -14
Tamil Nadu 4262160 4170562 -91598 3250332 3196288 -54044 118 109 -9 306 292 -14
Uttar Pradesh 19688240 16602404 -3085836 10280445 17622294 7341849 130 103 -27 245 230 -15
Uttaranchal 936630 757137 -179493 617344 886874 269530 54 43 -11 128 158 30
West Bengal 13484910 11193885 -2291025 1349964 1662095 312131 170 135 -35 132 131 -1
India (20 states) 12,62,02,002 11,30,84,532 -1,31,17,470 4,43,10,225 6,18,28,256 1,75,18,031 122 108 -14 202 208 6
Source: DISE raw data, from www.dise.in
Note: Note: *Andhra Pradesh here includes Telengana for 2015-16, in order to permit comparison with 2010-11. Thus the reduction in govt. school enrolment in Andhra Pradesh by
2015-16 here is not due to the removal of Telengana. The increase in private school enrolments does not exactly mirror the decrease in govt. school enrolment because children may
also shift to aided schools and because the child population of elementary school age increased in many states. Over the 5 year period 2010-2015, the average size of govt. schools
fell by 12 %; the average size of private schools rose by 3%, despite the large increase in the number of private schools.
16
Table 6
Emptying of government schools over time in India
(The phenomenon of small and tiny government schools, and changes in it, over time) Govt. schools
with total pupil
enrolment of:
Number of
Govt.
Schools
Number of
Teachers in
Govt. Schools
Total
Enrolment in
Govt. Schools
Average
pupils per
school
Pupil
teacher
ratio
Teacher
Salary
Expenditure
(Rs. Crores)
Govt. Annual
Per-pupil
Salary Exp.
(Rupees)
Govt. Monthly
Per-pupil
salary Exp.
(Rupees)
2010-11
Zero 4,435 14,304 0 0 0 486 --- ---
5 or Less 8,675 21,277 15,333 1.8 0.7 724 4,71,866 39,322
10 or Less 21,008 42,843 1,18,166 5.6 2.8 1,457 1,23,288 10,274
20 or Less 71,189 1,38,033 9,20,254 12.9 6.7 4,694 51,005 4,250
50 or Less 3,13,169 6,33,323 95,10,902 30.4 15.0 21,536 22,643 1,887
All govt. sch. 10,35,602
2015-16
Zero 5,044 6,961 0 0 0 334 --- ---
5 or Less 12,196 19,419 26,186 2.1 1.3 1,016 3,87,992 32,333
10 or Less 31,963 55,822 1,90,340 6.0 3.4 2,921 1,53,441 12,787
20 or Less 1,08,183 2,08,534 13,94,126 12.9 6.7 10,910 78,260 6,522
50 or Less 4,18,825 9,23,929 11,7,43,182 28.0 12.7 48,340 41,164 3,430
All govt. sch. 10,47,895
Change between 2010 and 2015
Zero + 609 - 7,343 0 + 0.0 + 0.0 - 152 --- ---
5 or Less + 3,521 - 1,858 + 10,853 + 0.3 + 0.6 + 292 - 83,874 - 6,989
10 or Less + 10,955 + 12,979 + 72,174 + 0.4 + 0.6 + 1,464 + 30,153 +2,513
20 or Less + 36,994 + 70,501 + 4,73,872 + 0.0 + 0.0 + 6,216 + 27,255 + 2,272
50 or Less + 1,05,656 + 2,90,606 + 22,32,280 - 2.4 - 2.3 + 26,804 + 18,521 + 1,543
Source: www.statereportcards/rawdata/201011 Data here is for 20 major states (Telengana is counted as part of Andhra Pradesh, to facilitate temporal comparison). Note: In year
2010-11, 30.2% of all govt. schools were ‘small’ (had total enrolment of 50 or fewer), in 2014-15, 36.7% were ‘small’ and in 2015-16, 40.0 % were ‘small’. The quality of the 2010-
11 DISE data on the number of teachers is suspect for certain states – e.g. in Madhya Pradesh, there are too few teachers but in Jammu & Kashmir, there appear to be too many, in
the small government schools. DISE data quality has improved over time, as inconsistencies have been progressively sorted out. Data on govt. school teachers’ salary for 2014-15 is
available from Ramchandran’s Study (NUEPA, 2015), where mean govt. primary school teacher salary (averaged across all new and experienced teachers) was 40,600 per month,
but for the sake of simplicity, we took it as Rs. 40,000 per month. For 2015-16/2010-11, it has been inflated/deflated by 9%, assuming a salary inflation rate of 9% per annum. Thus,
mean teacher salary is taken as Rs. 28,337 in 2010-11 and Rs. 43,600 in 2015-16. For illustration, salary inflation in Uttar Pradesh is shown in Annex Table 2 where it is seen that
total take-home salary has increased by more than 15% each year between 2008 and 2017, or if we take only the 2010-2016 period, by 8.5% per annum.

17
Table 7
Speed of emptying of government schools, by state
(or the Speed of growth of ‘tiny’ and ‘small’ govt. schools, by state)
No. of ‘tiny’ Govt. schools (with 20 or fewer pupils) No. of ‘small’ Govt. schools (with 50 or fewer pupils)
2010-11 2015-16
Increase in number of
‘tiny’ govt. schools
2010-11 2015-16
Increase in number of
‘small’ govt. schools
Abs. increase % increase Abs. increase % increase
Andhra Pradesh* 8,594 12,359 3765 43.8 38,397 39,615 1,218 3.2
Assam 3,938 5,847 1,909 48.5 17,034 22,107 5,073 29.8
Bihar 826 12 - 814 - 98.5 1,993 1,373 - 620 -31.1
Chhattisgarh 3,757 4,832 1,075 28.6 17,608 19,736 2,128 12.1
Gujarat 1,018 1,471 453 44.5 6,845 7,710 865 12.6
Haryana 524 725 201 38.4 2,699 3,775 1,076 39.9
Himachal Pradesh 3,320 5,541 2,221 66.9 9,912 12,000 2,088 21.1
Jharkhand 782 1,807 1,025 131.1 8,212 13,432 5,220 63.6
Jammu & Kashmir 5,776 6,815 1,039 18.0 14,373 16,344 1,971 13.7
Karnataka 8,219 10,492 2,273 27.7 21,153 22,861 1,708 8.1
Kerala 208 360 152 73.1 1,011 1,396 385 38.1
Madhya Pradesh 3,577 11,625 8,048 225.0 29,936 53,856 23,920 79.9
Maharashtra 11,317 12,859 1,542 13.6 32,079 53,762 21,683 67.6
Odisha 2,817 5,113 2,296 81.5 19,163 25,387 6,224 32.5
Punjab 1,077 1,392 315 29.2 5,865 7,162 1,297 22.1
Rajasthan 3,770 7,595 3,825 101.5 26,178 29,327 3,149 12.0
Tamil Nadu 2,058 3,098 1,040 50.5 13,614 14,769 1,155 8.5
Uttarakhand 4,270 7,038 2,768 64.8 11,497 13,383 1,886 16.4
Uttar Pradesh 4,179 4,789 610 14.6 22,438 33,651 11,213 50.0
West Bengal 1,162 4,413 3,251 279.8 13,162 27,179 14,017 106.5
India (20 major states) 71,189 108,183 36,994 52.0
313,169 418,825 105,656 33.7
Note : Telengana has been included as part of Andhra Pradesh, for both 2010-11 and 2015-16, in order to aid comparison over time.
Source: DISE raw data from www.dise.in. Analysis has been done for 20 major states of India.

18
4. Fee levels of private schools What are the fee levels of private unaided schools, and can we benchmark them as ‘high’ or ‘low’? While there is no official data collected from private schools on fee levels, fortunately the questionnaire of the 71st Round National Sample Survey (NSS) of 2014-15 included – in its Section 6 – detailed questions on education expenditure on each individual person aged 5-29 years old in the sample households. The variable we take as the measure of school fee is named in the survey as: “Course fee (including tuition fee, examination fee, development fee and other compulsory payments)”. The survey also asks separately for expenditure on “books, stationery and uniform”, on “transport”, and on “private coaching”, which we have not taken into account, as we were interested in isolating only the course fee including all compulsory payments that parents pay to the school as fee. To find out the fee levels of private schools, we took the sub-set of children who report studying in private unaided schools and are aged between 6 and 14 years old, the elementary school age group. These children are of the age to which the Right to Education (RTE) Act 2009 applies, and are meant to be in classes 1 to 8. The mean and median ‘total course fee’ in private unaided schools, computed from the NSS data, are presented in Table 8, but before turning to that, it is worth noting how this total course fee is distributed. Graph 1 shows that total fee is very log-normally distributed, with a pronounced rightward skew, rather than normally distributed with the standard Gaussian bell-shape. When a quantity is log-normally distributed, the median is a better measure of central tendency than the mean since it down-weights the undue importance of the few very high values, i.e., it does not permit undue influence of the extremely high fee levels of the few children who study in the very high-fee elite schools. Hence in Table 8, although we present both private unaided schools’ mean and median fee levels, it is preferable to focus on the median fee levels. Table 8 shows that median private unaided school fee level in urban India was Rs. 500 pm and in rural India Rs. 275 pm. Taking all India (rural and urban), the median fee was Rs. 417 per month (or Rs. 5000 per annum). However, there is a great deal of inter-state variation in private school fee levels. For example, from Rs. 117 pm in rural Uttar Pradesh to Rs. 692 pm (six times higher) in rural Punjab; or from Rs. 250 pm in urban UP to Rs. 1800 pm (seven times higher), in urban Delhi. Graph 2 shows a scatter plot with states’ median rural private school fee level on the x-axis and on the y-axis a measure of the quality of rural govt. schools in the state (measured by the percentage of students of govt. schools with various given literacy and numeracy skills, from ASER data). This plot shows a positive – if somewhat concave – relationship between raw private school fee levels and govt. school quality level, suggesting that the better functioning are the government schools in a state, the less the need felt by poor parents for private education, and thus the more elite (the more high fee charging) the private schools in that state. Similarly, the worse the government school quality in a state, the greater the perceived need by even the

19
poorer families to demand private schooling of any description, leading to the higher supply of a lot of even ‘low-fee’ budget private schools.
Graph 1
Distribution of private unaided schools’ fee levels, Age 6-14, India, 2014-15
Source: Kernel density distribution produced in STATA, using NSS data 2014-15.
0
.00
00
2.0
000
4.0
000
6.0
000
8.0
001
Den
sity
0 50000 100000 150000 200000Fees of the Education Course
kernel = epanechnikov, bandwidth = 713.9107
Kernel density estimate
0
.00
00
5.0
001
.00
01
5D
en
sity
0 10000 20000 30000Fees of the Education Course
kernel = epanechnikov, bandwidth = 658.1247
Kernel density estimate
0.1
.2.3
.4
Den
sity
4 6 8 10 12log_crs_fee
kernel = epanechnikov, bandwidth = 0.1358
Kernel density estimate
Graph 1a
Distribution of (annual) fee level
without constraining the fee values.
Notice that a very tiny number of
students report paying fee from
Rupees 50,000 to Rupees 2 lakh per
annum (above about Rs. 4000 pm).
Graph 1b
Distribution of (annual) fee level
after constraining the fee values to be
below Rs. 30,000 pa (Rs. 2500 pm).
Even here, it is visible that only a
very small number of students pay
fees above around Rs. 12,000 pa or
Rs. 1000 pm.
Graph 1c
This shows the distribution of log of
course fee, rather than of the course
fee. It is apparent that this is much
more normally distributed (much
closer to the bell-shaped ‘Gaussian’
distribution) than graphs 1a and 1b.

20
0.0
50.0
100.0
0 500 1000
% Children in Std II who can recognize …
% Children inStd II who canrecognizenumbers 1-9and more
0.0
50.0
100.0
0 500 1000
% Children in Std III who can read at least
Words
% Children inStd III who canread at leastWords
0.0
100.0
0 500 1000
% Children in Std IV who can
do at least subtraction
% Children inStd IV who cando at leastsubtraction
0.0
50.0
100.0
0 500 1000
% Children in Std IV who can read at …
% Children inStd IV whocan read atleast Std I text
0.0
50.0
100.0
0 500 1000
% Children in Std III who can recognize
numbers 10-99 and …% Children inStd III who canrecognizenumbers 10-99 and more
0.0
50.0
100.0
0 500 1000
% Children in Std II who can read at least
letters
% Children inStd II who canread at leastletters
Graph 2
Descriptive relationship between govt. school quality and private school fee levels, by state
(Govt. school quality is measured by the % of children in rural govt. schools – in given grades – who can do
simple literacy and numeracy tasks, and this is shown on the y-axis; the x-axis shows the median fee level in
rural private schools. Each point represents a major state of India)

21
Table 8
Mean and Median Fee Levels in Private Unaided Schools for Children Aged 6-14, by state, 2014-15
Annual Fee Monthly Fee
Mean
Median
Mean
Median
State Rural Urban Total
Rural Urban total
Rural Urban Total
Rural Urban Total
Andhra Pradesh 7141 10300 9398 6000 8500 8000 595 858 783 500 708 667
Assam 5513 9049 7470 4250 5700 5000 459 754 622 354 475 417
Bihar 6464 6722 6633 3600 4700 4200 539 560 553 300 392 350
Chhattisgarh 2171 8851 7667 2000 5000 4300 181 738 639 167 417 358
Delhi 9595 25180 24198 8000 21600 18750 800 2098 2017 667 1800 1563
Gujarat 7230 8512 8260 4000 5700 5400 602 709 688 333 475 450
Haryana 9431 13413 12119 8000 8500 8400 786 1118 1010 667 708 700
Himachal Pradesh 8512 9598 8859 6245 8400 6700 709 800 738 520 700 558
Jammu & Kashmir 4901 7483 6269 4000 5600 5000 408 624 522 333 467 417
Jharkhand 5681 8054 7406 2500 6800 5350 473 671 617 208 567 446
Karnataka 7940 12130 11112 7000 9000 8200 662 1011 926 583 750 683
Kerala 8829 10759 9990 7700 8938 8400 736 897 833 642 745 700
Madhya Pradesh 4259 6574 5823 3000 4500 3700 355 548 485 250 375 308
Maharashtra 9300 13594 12630 6750 9000 8000 775 1133 1053 563 750 667
Northeast States* 6157 8574 7395 4326 7190 6079 513 714 616 361 599 507
Orissa 3592 7585 6032 3000 5000 4000 299 632 503 250 417 333
Punjab 9893 11030 10589 8300 7200 7900 824 919 882 692 600 658
Rajasthan 4961 7583 6416 4000 5000 4500 413 632 535 333 417 375
Tamil Nadu 12072 12261 12197 10625 10800 10800 1006 1022 1016 885 900 900
Telengana 8176 10827 10054 7000 8500 8000 681 902 838 583 708 667
Uttar Pradesh 2264 6303 4104 1400 3000 1800 189 525 342 117 250 150
Uttarakhand 8446 9501 9219 4000 7800 7200 704 792 768 333 650 600
West Bengal 4571 16613 13482 2300 12000 7150 381 1384 1124 192 1000 596
Total (weighted mean) 5396 9611 7959 3500 6500 5000 450 801 663 292 542 417
Notes: *The average of the Northeast states; these are Arunachal Pradesh, Manipur, Meghalaya, Mizoram, Nagaland, Sikkim and Tripura.
Source: The author’s own calculations on raw data from the National Sample Survey (71st Round).

22
Table 9
% of 6-14 year old Private Unaided School attendees who pay fee below given thresholds, by state, 2014-15
State
<=100 per
month
<=200 per
month
<=500 per
month
<=750 per
month
<=1000 per
month
<=1500 per
month
<=2000 per
month
<=2500 per
month
Govt. RTE
reimburse-
ment
amount
(per month)
% pupils
whose fee level
is < RTE
reimbursement
amount
Andhra Pradesh 2.2 5.6 38.9 61.1 73.5 91.7 96.6 98.2
Assam 5.7 15.7 58.5 74.8 87.4 93.7 95.6 98.1
Bihar 7.4 21.8 68.4 76.4 85.9 93.1 95.6 96.4
Chhattisgarh 9.1 30.0 60.5 69.5 75.5 81.4 84.1 90.0
Delhi 3.4 5.5 14.3 26.5 34.9 49.2 59.7 69.3 1190.0 35.2
Gujarat 4.9 21.8 61.2 74.2 85.8 90.5 93.2 96.3
Haryana 1.6 5.1 36.6 56.4 68.6 85.9 92.2 95.1
Himachal Pradesh 2.0 6.1 46.7 66.5 78.2 90.4 97.5 99.0 1593.0 91.9
Jammu & Kashmir 3.1 12.1 71.1 85.9 92.5 96.9 98.5 99.3
Jharkhand 9.2 24.5 55.0 70.9 82.3 95.0 98.9 99.3
Karnataka 3.4 9.9 38.5 53.7 70.7 81.8 89.7 94.7 987.0 66.0
Kerala 1.7 4.6 31.7 54.6 73.5 90.6 96.3 97.5
Madhya Pradesh 9.9 27.7 70.7 81.4 90.1 95.7 97.3 98.7
Maharashtra 7.6 13.7 42.4 54.0 66.9 79.9 85.5 90.2
Northeast States* 4.1 10.5 51.1 79.8 92.5 96.9 97.7 98.0
Orissa 12.2 30.4 69.2 85.7 90.3 94.9 96.6 97.0
Punjab 2.7 7.9 40.8 57.6 71.4 84.9 90.3 95.2
Rajasthan 3.9 18.0 68.5 80.6 88.6 93.8 96.1 97.9 1383.0 92.8
Tamil Nadu 0.7 2.4 20.8 40.5 59.8 83.4 92.7 96.7
Telengana 1.0 3.6 30.5 58.5 78.0 92.3 95.2 97.6
Uttar Pradesh 32.7 61.2 83.2 88.2 91.5 95.2 96.5 97.4 450.0 80.6
Uttarakhand 2.4 14.2 43.8 62.7 81.7 87.0 92.3 98.2 860.0 71.0
West Bengal 11.7 27.4 46.3 54.9 62.0 75.1 83.7 88.6
India Total 11.4 25.1 57.3 71.4 81.5 90.7 94.2 96.4
Source: for Fee information, National Sample Survey data. Note: See Table 8 for the definition of Northeast States.
23
Table 10
Benchmarking private schools’ fee levels against (1) state per capita income, (2) Govt. funded schools’ PPE, and (3) Minimum wages
Private school fee,
annual
(2014-15)
State per capita
GDP
(2014-15)
Ratio of
private school
fee to State
per capita GDP
Per pupil expense
(PPE) in Govt.
funded schools
(2014-15)
PPE in govt.
schools as a % of
state per capita
income
Minimum Daily
wage 2014
(for MNREGA
rural workers)
Annual Private
sch median fee as
a % of the annual
minimum wage*
% rural private school
pupils whose monthly
fee is below the
Minimum Daily wage
Mean (a) Median (b) (c) (d) = (a/c)*100 (e) (f) = (e/c)*100 (g) (h) (i)
ANDHRA PRADESH 9398 8000 90517 10.4 14087 15.6 169 15.8 7.3
ASSAM 7470 5000 49480 15.1 --- --- 167 10.0 15.5
BIHAR 6633 4200 36143 18.4 5298 14.7 158 8.9 12.8
CHHATTISGARH 7667 4300 64442 11.9 16151 25.1 157 9.1 36.2
DELHI 24198 18750 251267 9.6 --- --- --- --- ---
GUJARAT 8260 5400 122658 6.7 17106 13.9 167 10.8 14.1
HARYANA 12119 8400 148563 8.2 27163 18.3 236 11.9 4.3
HIMACHAL PRADESH 8859 6700 101542 8.7 39343 38.7 --- --- ---
JHARKHAND 7406 5350 52589 14.1 8020 15.3 158 11.3 33.8
KARNATAKA 11112 8200 93703 11.9 16914 18.1 191 14.3 20.2
KERALA 9990 8400 117713 8.5 19419 16.5 212 13.2 5.3
MADHYA PRADESH 5823 3700 59770 9.7 11927 20.0 157 7.9 21.6
MAHARASHTRA 12630 8000 125833 10.0 14712 11.7 168 15.9 15.8
ODISHA 6032 4000 59229 10.2 9367 15.8 164 8.1 34.0
PUNJAB 10589 7900 101529 10.4 9142 9.0 200 13.2 5.3
RAJASTHAN 6416 4500 71537 9.0 19391 27.1 163 9.2 11.4
TAMIL NADU 12197 10800 128366 9.5 14229 11.1 167 21.6 1.6
UTTAR PRADESH 4104 1800 40373 10.2 13102 32.5 156 3.8 66.8
UTTARANCHAL 9219 7200 115632 8.0 26236 22.7 156 15.4 8.9
WEST BENGAL 13482 7150 78903 17.1 7001 8.9 169 14.1 42.9
India (Weighted Mean) 7671 5000 83,285 9.2 11523 19.4 172.2 10.2 26.5
Source: For columns (a) and (b), National Sample Survey or NSS data; for column (c) state per capita income (PCI), see http://pib.nic.in/newsite/PrintRelease.aspx?relid=123563.
For a few states, the 2014-15 state PCI was not available so it has been extrapolated from the previous two years’ trend growth rate. For Column (e), Dongre and Kapur
(2016) who report estimated per pupil expenditure (PPE) in Govt. and Aided schools, based on state budget documents and DISE data, but their PPE figures are serious
underestimates (see Annex 1). For column (g), Ministry of Rural Development eands.dacnet.nic.in/Graphs.xlsx (accessed 1.11.2016). *We assume 300 days of work a year.

24
Table 11
Private schools’ fee compared with Govt. funded schools’
per pupil expenditure (PPE) – 2014-15
Median private
school fee
(Rs. per month)
Govt. funded
schools’ PPE
(Rs. per month)
Private schools’
fee as a % of
Govt-funded
schools’ PPE
% private schools
whose fee is lower
than Govt funded
schools’ PPE
(a) (b) (c) = (a/b)*100 (d)
Andhra Pradesh 667 1174 56.8 81.1
Bihar 350 442 79.2 62.6
Chhattisgarh 358 1346 26.6 85.7
Gujarat 450 1426 31.6 89.8
Haryana 700 2264 30.9 94.2
Himachal Pradesh 558 3279 17.0 99.5
Jharkhand 446 668 66.8 65.2
Karnataka 683 1410 48.4 81.1
Kerala 700 1618 43.3 91.5
Madhya Pradesh 308 994 31.0 86.8
Maharashtra 667 1226 54.4 71.1
Orissa 333 781 42.6 86.7
Punjab 658 762 86.4 58.8
Rajasthan 375 1616 23.2 95.2
Tamil Nadu 900 1186 75.9 70.0
Uttar Pradesh 150 1092 13.7 92.9
Uttarakhand 600 2186 27.4 95.3
West Bengal 596 583 102.2 48.3
India (major states)
Weighted means 417 1091 47.4 79.4
Source: NSS (2014-15) data, for column (a) and Dongre & Kapur (2016) for column (b). Dongre & Kapur do
not report govt. PPE for Delhi, Assam and Jammu & Kashmir. Columns (c) and (d) are calculated by the
author. There is reason to believe Dongre & Kapur’s PPE figures are seriously under-estimated, see Annex 1.
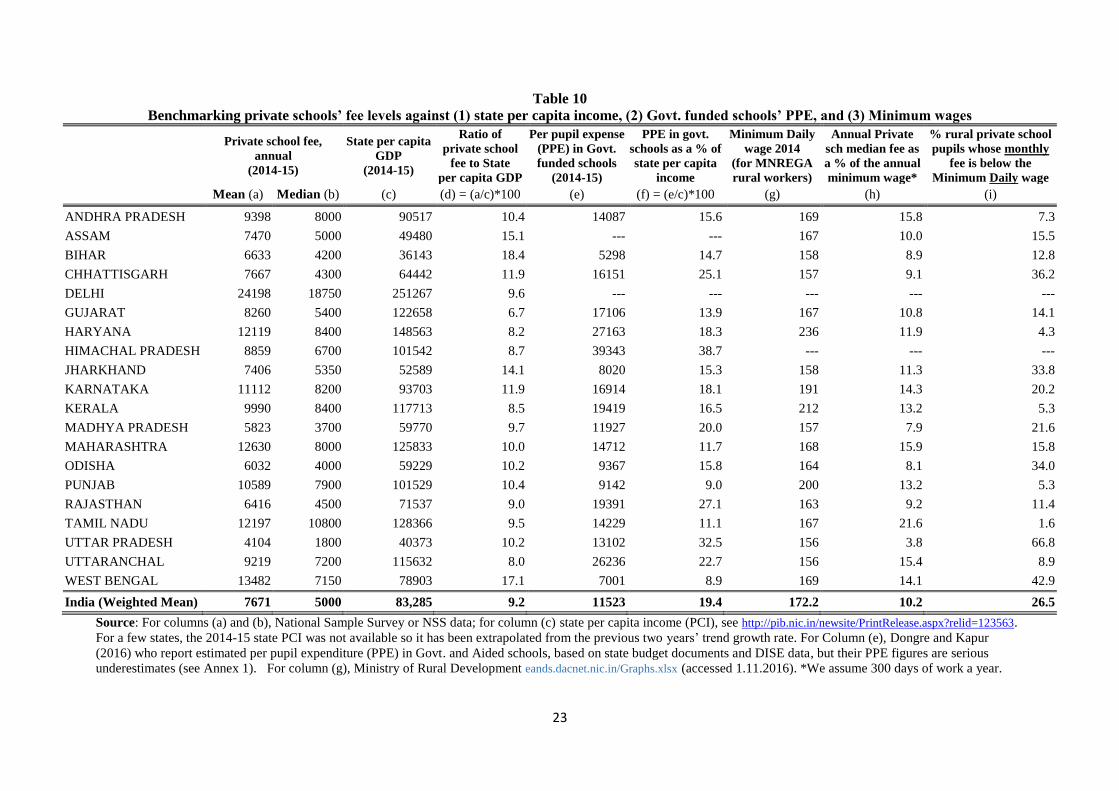
Benchmarking private school fee levels Is the private unaided schools’ fee observed in Table 8 low or high? Before turning to that, we examine what percentage of private-school students pay fee below given absolute threshold levels. This is presented in Table 9. It shows that in states such as Bihar, Madhya Pradesh, Rajasthan, Uttar Pradesh and Orissa, about 70 to 85 per cent of children studying in private unaided schools are paying fee of less than Rs. 500 per month (Rs 6000 per annum). Only a minority (15% – 30%) of private school attendees pay fees above Rs. 500 pm. Benchmarking with respect to state per capita income One way of benchmarking the size of the private school fee is to see its ratio with respect to the state per capita income. Here, since government reports mean (rather than median) per capita income, we use the mean private school fee level rather
25
than the median. Table 10 shows that nationally, private schools’ mean fee is around 9.2% of the state per capita income. Benchmarking with respect to the minimum wage of daily wage labourers A second way of benchmarking private school fee is to see to what extent the poorest paid workers can afford private school fee. The last three columns of Table 10 attempt to do that. Srivastava (2013) suggests that a useful way of defining ‘low fee’ schools is schools where the monthly fee is equal to one day’s wage of the daily wage labourers, one of the lowest paid worker groups, who get the minimum daily wage as announced annually by the Ministry of Rural Development. Column (g) of Table 10 shows the officially mandated minimum daily wage of April 2014 for each state. We take it that daily wagers work 300 days a year and thus predict the annual wage for daily-wagers. Expressing the median annual private school fee as a percentage of this annual minimum wage in column (h) shows that, on average, private schools’ median annual fee is around 10.2% of the annual minimum wage of daily wagers. Uttar Pradesh is an outlier, in that private school annual fee is only 3.8% of the annual earning of daily-wagers in the state, suggesting that even very poor people can access private schooling in Uttar Pradesh, and this is consistent with the high utilisation of private schooling in UP. Another variant for benchmarking private schools’ fee is to ask: for what percentage of rural private school pupils is their actual monthly fee below the daily minimum wage of their state. Column (i) shows that, on average, 26% of rural private school pupils’ monthly fee is below their state’s daily minimum wage. While UP is again an outlier (with 67% rural private school pupils’ monthly fee being below the minimum daily wage of UP in 2014), in states such as West Bengal, Orissa, Jharkhand and Chattisgarh, the proportion is higher than one-third; it suggests that one third or more of the private schools in these states are ‘low fee’ schools by this definition, i.e. that educate the poorest children. Benchmarking with respect to the per pupil expenditure in govt. schools A third way of benchmarking whether private school fee level in a state is ‘high’ or ‘low’, is to compare it with the state’s per pupil expenditure (PPE) in the government school system. Table 11 shows the private unaided schools’ median fee levels and also the per-pupil expenditure (PPE) in the govt. funded school system, statewise and for India as a whole9. It shows that in India as a whole, just under 80 per cent of the private-school-going children study in those private schools where the fee is below the government schools’ per pupil expenditure. In a large number of states, more than 90% of private school students paid fees lower than the estimated PPE in the govt. funded schools. The last column in Table 11 shows that – averaging across the states – private school fee is only 47% of the PPE in govt-funded schools estimated by Dongre and Kapur (2016), and that is when their calculation of govt. PPE is a serious under-estimate of the true PPE in the govt. school system (for reasons set out in Annex 1). The level of private school fee also has implications for the reimbursement from government to private schools for educating poor and
9 The weighted average across the states for which the PPE data is available. Since government provides free
books and uniform to all children attending government schools, the estimate of govt. PPE on education
includes govt. expenditure on books and uniforms, but our private school’s per pupil expenditure (proxied by
the school’s fee) does not include expenditure on books and uniforms, which undermines the ability to compare
private and public schools’ unit costs of education. However, as shown in Annex 1, the PPE estimates for public
schools presented here are likely to be serious under-estimates of the true PPE of public schools.

26
disadvantaged children under the Right to Education Act 2009. Annex 2 spells out the implications. Policy implications of this benchmarking exercise In summary, the above evidence on private unaided schools’ fee levels is surprising, and is at odds with popular perceptions, as it shows that a good proportion of private schooling caters to the really poor. The evidence suggests that most private schools in India can be considered “low fee” in the precise sense that their fee is below the government’s per pupil expenditure in its own schools. This evidence discredits the oft-repeated belief that much of private schooling in India is elite and exclusive. This realisation is significant because perceptions about the nature of private schools have important implications for the making of policy towards private schools. To take one example, the realisation that in the majority of private schools, fee levels are far lower than government schools’ per pupil expenditure draws the education policy maker’s attention to the fact that when a high proportion of the well-funded government schools themselves cannot comply with the infrastructure norms of the Right to Education (RTE) Act 200910, how can private schools do so (without public subsidy), since the majority of them run on a small fraction of the unit cost of government schools. The kind of data presented here to benchmark private school fee levels can help decision-takers to make more evidence-informed education policy that is more realistic and less wishful, and to avoid counter-productive effects such as the closure of the low-fee private schools which may be successfully imparting learning but which lack the resources to fulfil the demanding infrastructure norms11.
5. Teacher salaries in private schools The major factor behind the lower unit-cost of producing education in private than public schools is the much lower teacher salaries of private schools compared with government and aided schools. Unfortunately, there is no systematic documentation or evidence collected by any agency nationally on individual teacher salaries, either for government or private schools. One has to rely on the few sporadic small-scale surveys and studies from individual states. However, fortunately, the National University of Educational Planning and Administration (NUEPA) carried out a two year study of government school teachers across nine Indian states in 2014-15, in collaboration with the State Councils of Educational Research and Training (SCERTs) of these nine states, in which they also collected information on teacher salaries in government schools (Ramachandran, 2015). We use this study for evidence on government school teachers’ salaries. For evidence on private school teachers’ salaries, we turn to individual small-scale studies from two districts of
10 Section 18 of the RTE Act 2009 stipulates that no private unaided school can be established or continue to
function without obtaining a certificate of ‘recognition’ from the government, and section 19 lays down the
various penalties (including closure) for non-compliance with the given norms and conditions. While section
8(g) of the Act specifies as the state’s duty to ensure that govt. schools also conform to the norms of the Act,
there are no penalties if they do not and thus, de facto, there is no momentum for govt. funded schools to
comply. 11 NISA (2014) calculated that by March 2014, just under 4500 private unaided schools had closed down and
just over 15,000 had received closure notices, due to not fulfilling infrastructure norms.

27
Punjab (CCS, 2014) and extrapolate to 2014 from a 2008 survey of five districts each of Uttar Pradesh and Bihar (SchoolTELLS, 2009). Firstly, we show in Table 12 evidence on teacher salaries in govt. schools across 6 Indian states reported in Ramachandran (2015). She reports the take-home salary levels of three types of teachers in govt. schools: newly appointed teachers, teachers with 15 years’ work experience and teachers with 25 years’ experience, each at the primary level and at the secondary level. For simplification, we take the salary of a teacher with 15 years’ experience as representing the average salary of teachers in govt. schools. The teachers of junior/upper-primary – classes 6, 7 and 8 – are paid salaries equal to secondary school teachers in India, thus the salary shown for secondary teachers are also the salary-levels of the upper-primary teachers. Taking the simple average of salaries across the states, the last row of Table 12 shows that in the school year 2014-15, mean of govt. primary teachers’ salary was Rs. 40,623 per month, and the mean of upper-primary teachers’ salary was Rs. 51,595 pm, but these do not reflect the other pecuniary benefits that teachers in govt.-funded schools (i.e. govt. and aided schools) enjoy, such as pension and gratuity at the time of retirement. We present two ways of benchmarking whether this govt. school salary level is high or low: one is to compare govt. teacher salaries with teacher salaries in the private school sector and the other is to compare govt. salaries with the ‘state per capita income’ (PCI) of the respective states, and then see whether that ratio (of mean teacher salary to PCI) is higher than in other countries with which India compares itself. Benchmarking salary against state per capita income Table 13 shows that govt. primary school teacher salary is, on average, about 7 times (and govt. upper-primary teacher salary is about 9 times) the per capita income of the respective states. To simplify, one could say that in India govt. elementary school teachers’ salary is – on average – around 8 times the country’s per capita income. Table 14 (reproduced from Dreze and Sen, 2013) confirms that this ratio of 8 is very much higher than in China, Pakistan, Indonesia, Bangladesh etc. where the ratio is typically between 1 and 2. In other words, when seen in relation to the various countries’ respective per capita incomes, govt. school teachers in India are 4 to 8 times higher paid than teachers in the other shown countries, a striking finding! Benchmarking salary against private school teachers’ salary Table 15 presents the meagre evidence on private school teachers’ salaries available from various parts of India in different years. In Kansal’s study of Delhi schools in the late 1980s, the average salary of private school teachers was 47% of the average salary of govt. school teachers, i.e. just under half. In the early 1990s, it was also similar, between around 40 - 49% in Delhi, Madhya Pradesh, Tamil Nadu and Uttar Pradesh. By the early 2000s however, in Uttar Pradesh and in (20 states of) India, the ratio of private to government teachers’ salary had fallen to 20%, i.e. private school teachers were paid, on average, only one-fifth of the pay levels of government school teachers. This was largely the result of the implementation of the Fifth Pay Commission recommendations, which greatly raised the bureaucratically-set teacher salaries in govt-funded schools, but did not impact private school

28
teachers’ salaries. In Table 15, Kingdon and Banerji found that by 2008, private school teacher salaries constituted only 8% of govt. school regular teachers’ salaries, in Bihar and Uttar Pradesh. After implementation of the recommendations of the Sixth Pay Commission in 2009, government school teachers’ salaries roughly doubled in one go (see Kingdon, 2010) and, again, private school teachers’ market-determined salaries saw only incremental change. Thus, by 2014, Antony & Chaudhury (2014) report that in rural Punjab, mean private school teacher salary was Rs. 1925 per month and we know from Ramachandran (2015) – as reported in Table 13 above – that average govt. primary school teacher salary in rural Punjab in 2014 was Rs. 59,654 per month, i.e. private school teachers pay was only about 3.2% of govt. school teachers’ pay ! How can private schools can pay salaries that are this much lower than government school salaries? The reason is that whereas government teachers’ pay is a bureaucratically-set high ‘minimum wage’, which may also be influenced by political pulls and pressures and be responsive to lobbying by strong government school teacher unions, private schools generally pay their teachers the market-determined wage i.e. the wage level determined by the demand and supply of educated persons in the labour market which is characterised by an excess supply of graduates; the 10.5 per cent graduate unemployment rate in India means that many unemployed graduates are willing to take teaching jobs at low salaries in private schools, and private schools take advantage of this low market-clearing wage. To summarise, the fact that govt. school teachers are 4 to 8 times higher paid in India than in China and other countries suggests that in India, teachers must be drawn from a much higher part of the ability distribution in the population than in China and the other countries shown in Table 14. But this leads to the puzzle as to why, if teachers are substantially more able in India than in other countries, did Indian students do much worse than, for example, Chinese children in the international PISA standardized test of reading, mathematics, science, where China came 2nd and India came 73rd, out of 74 countries. Similarly, if public school teachers are paid twelve to thirty times higher than private school teachers (since 2008) as shown in Table 15, one would expect that the quality of teaching and thus children’s learning outcomes would be better in public than in private schools, but it is not so. The next section of the paper compares the relative learning achievement levels of children in private and public schools.

29
Table 12
Actual take home salaries of govt. school regular teachers, by state (Rupees per month)
State Primary Secondary
Salary of
new
appointee
Salary
after 15
years
Salary
after 25
years
Salary of
new
appointee
Salary
after 15
years
Salary
after 25
years
Tamil Nadu 15,345 28,660 50,140 26,370 48,750 84,410
Karnataka (R) 18,794 26,098 33,672 24,272 34,618 44,762
Karnataka (U) 21,814 30,198 38,892 28,102 39,978 51,622
Jharkhand (R) 28,650 39,780 44,400 37,494 57,523 78,637
Jharkhand (U) 31,600 43,260 48,100 39,208 60,160 82,247
Odisha 14,031 26,659 27,347 25,625 37,806 43,034
Rajasthan 26,013 -- -- 28,331 -- --
Mizoram 16,504 -- -- -- -- --
Uttar Pradesh 29,293 39,683 44,783 37,226 47,716 52,996
Punjab (R) 35,936 59,113 79,288 40,602 66,868 89,699
Punjab (U) 36,588 60,194 80,742 41340 68,092 91,346
Simple Average 25,922 40,623 49,653 33,578 51,595 66,793
Source: Ramachandran (2015) at the National University of Educational Planning and Administration
(NUEPA).
Note: R – Rural; U – Urban. Actual take home salary includes basic pay, grade pay, dearness allowance, House
Rent Allowance (HRA), City Compensatory Allowance (CCA), and other benefits and deductions (if any).
Table 13
Govt. primary school teachers’ mean salary as a multiple of
state per capita GDP, 2014-15
Govt. Primary school Govt. Junior school
State
Domestic
Product
per capita
(2014-15)
Primary
teacher
salary as a
multiple of
state per
capita
income
Junior
teacher
salary as a
multiple of
state per
capita
income
State
Take home
salary
per month
July 2014
Take home
salary
per annum
July 2014
Take home
salary
per month
July 2014
Take home
salary
per annum
July 2014
(a) (b) (c) (d) (e) (f) = b / e (g) = d / e
Tamil Nadu 28,660 343920 48,750 585000 128366 2.7 4.6
Karnataka 28,148 337776 37,298 447576 101594 3.3 4.4
Jharkhand 41,520 498240 58,842 706104 52147 9.6 13.5
Odisha 26,659 319908 37,806 453672 59229 5.4 7.7
Uttar Pradesh 39,683 476196 47,716 572592 40373 11.8 14.2
Punjab 59,654 715848 67,480 809760 99578 7.2 8.1
Simple mean 6.7 8.7
Source: For teacher salary data, Table 6.3 in Vimala Ramachandran, 2015, NUEPA. We have taken teacher
salary after 15 years’ experience as the ‘mean teacher salary’. For state per capita SDP, Ministry of Statistics
and Programme Implementation, see http://statisticstimes.com/economy/gdp-capita-of-indian-states.php
accessed on 27 Nov 2015.

30
Table 14
Estimates of primary-school teacher salaries as a multiple of per capita GDP
Country / state Reference year Estimated ratio of teacher salary to:
Per capita GDP Per capita SDP
OECD average 2009 1.2 --
Asian countries
China 2000 0.9 --
Indonesia 2009 0.5 --
Japan 2009 1.5 --
Bangladesh 2012 ~1.0 --
Pakistan 2012 ~1.9 --
India
Nine Indian states 2004-5 3.0 4.9
Uttar Pradesh 2006 6.4 15.4
Bihar 2012 5.9 17.5
Chhattisgarh 2012 4.6 7.2
Source: Table 5.4 in Chapter 5 of Dreze, Jean and Amartya Sen (2013) “An Uncertain Glory: India and its
Contradictions”. Allen Lane, London.

31
Table 15
Teacher salary in private unaided (PUA) schools as a percentage of teacher salary in govt. and aided schools, various years
Jain
(1988)
Kansal
(1990)
Govinda &
Varghese
(1993)
Bashir
(1994)
Kingdon
(1994)
Singh &
Sridhar
(2002)
Muralidharan
& Kremer
(2006)
Kingdon &
Banerji
(2008)
Goyal and
Pandey (2009)
Antony &
Chaudhury
(2014)
Baroda
district,
Gujarat
City of
New Delhi
5 districts of
Madhya
Pradesh
Many
districts of
Tamil Nadu
Lucknow
district,
Uttar Pradesh
2 districts
of Uttar Pradesh
20 states
of India
11 districts of
Bihar & UP
(data Jan 2008)
12 districts of
Madhya Pradesh
& Uttar Pradesh
(data Jan. 2007)
2 districts
(Barnala & Mansa)
of Punjab
No. of private school
teachers sampled
NA
233
111
419
182
467
NA
734
1103
612
Private pay as a
proportion of govt.
teacher pay
0.47
0.39
0.49
0.47
0.42
0.20
0.20
0.08
0.08
0.03
Govt. school teacher
pay as multiple of
private pay
2.1
2.6
2.0
2.1
2.4
5.0
5.0
12.5
12.5
33.3
Private pay as a % of
aided salary
-
39
66
50
43
-
-
-
-
Source: Jain (1988); Kansal (1990); Govinda & Varghese (1993); Kingdon (1994); Bashir (1994); Singh & Sridhar (2002); Muralidharan and Kremer (2008); Goyal and
Pandey (2010); Kingdon & Banerji (2008); Antony & Chaudhuri (2014).

32
6. Learning outcomes in private schools While the National Council of Educational Research and Training, New Delhi (NCERT) has been carrying out large-scale surveys of children’s learning achievement levels using Item Response Theory since 2011, it conducts these only in public schools. Fortunately, it is possible to compare achievement levels in govt. and private schools in the surveys carried out for the Annual Status of Education Report (ASER, various years). Table 16 based on ASER data shows that while children’s learning levels in both private and public schools are low, they are higher in private than public schools. The ASER report presents only raw learning achievement data but, since private school students typically come from better-off and more educated homes, their achievement levels would be expected to be higher even if private schools were of no better quality than public schools. Thus comparing raw learning levels in private and public schools could lead to a potentially false inference that private schools are higher quality. Luckily, there is quite sophisticated evidence in India which compares learning levels in the two types of schools after statistically controlling for the socio-economic background of the children studying in private and public schools. The different authors have used a variety of data sources, e.g. the National Human Development Survey, the ASER survey, Young Lives survey and surveys in particular states or districts that the authors themselves conducted. The published literature published uses either simple regression analysis (Tooley and Dixon, 2005; Wadhwa, 2014), or use a variety of elaborate econometric techniques to correct for the problems of ‘selectivity’ and ‘endogeneity’, namely the problem that more able or more motivated students may self-select into private schools, techniques such as household fixed effects, village fixed effects, propensity score matching methods, panel data approach and randomised control trials. These studies are by Kingdon (1996), Desai et al (2008), Goyal (2009), French and Kingdon (2010), Chudgar and Quin (2012), Muralidharan and Sundararaman (2013), Singh (2015) and Azam et. al. (2016). This evidence shows that when students’ home background is controlled for, the large raw learning-gap between private and public schools falls but, in most studies, it does not disappear: typically an achievement advantage of 0.10 to 0.35 standard deviations remains. This literature indicates that children’s learning levels in private schools are no worse than, and in many studies better than, those in government schools, after controlling rigorously for the differing home backgrounds of the children in these two types of school. The next section puts this evidence (on the relative effectiveness of public and private schools) together with evidence on the unit costs of private and public schools, to examine the ‘value for money’ (VFM) offered to fee-paying parents by private schools and the VFM that accrues from public expenditure on education.
7. Value for Money from private schools
A study by Kingdon et. al. (2016) puts the ASER evidence on learning levels of students in public and private schools together with the evidence on per pupil

33
expenditure (PPE) in public and private schools in eight major states of India, to examine the ‘value for money’ offered by public and private schools. Table 17 shows the value for money (VFM) calculation12. While there is much inter-state variation, we illustrate the findings by looking at the example of Madhya Pradesh. Table 17 shows that annual PPE in public schools in Madhya Pradesh was Rupees 9384 and PPE in private schools was Rupees 3700 per annum, and thus the public : private PPE ratio was 2.5:1 (see row ‘g’) i.e. public schools operated at 2.5 times the per-pupil-expenditure of private schools. It also shows that the ratio of public to private students’ reading achievement levels was 0.48:1, i.e. public schools produced only 48% as much learning as private schools. Putting these two things together we find that private schools offer 5.3 times the value for money (VFM) as public schools in Madhya Pradesh. The findings are very similar for Kerala. However, there is much variation across the states. While in Bihar, Tamil Nadu, Punjab and Orissa, private schools are roughly twice as cost-effective (offer twice as much VFM) as public schools, in Gujarat, private schools offer 12 times as much VFM as public schools, and Uttar Pradesh is an outlier, with private schools there offering 29 times as much VFM as public schools – which is largely due to the very low fee levels of private schools in Uttar Pradesh, as also seen earlier in Tables 8 to 11. Kingdon et. al. (2016) also present VFM calculations using numeracy achievement levels in private and public schools and the results there are even starker, though they are not presented here for space reasons. Change over time in the ‘cost per unit of learning’ in govt. schools can also be seen in the last column of Annex Table 2. This shows that the cost per learning unit has roughly trebled in govt. schools in just the 6 year period between 2010 and 2016. This is a product of both falling learning achievement levels and strongly rising teacher salaries in govt. schools, which the table shows increased by over 15 percent per annum in the period 2008 to 2017 (the period from just before the Sixth Pay Commission to just after the Seventh Pay Commission), or increased by 8.5% per annum, if we take just the period from 2010 to 2016.
8. The Right to Education Act and its provision of Public Private Partnership
The high value for money offered by private schools is probably what led to the adoption of a kind of public private partnership (PPP) in India’s Right to Education (RTE) Act 2009, with government funding and private schools producing education. While India at the time of Independence already had an extensive PPP in education, namely the aided school system of privately managed schools funded by government, in fact, the aided schools, over time, due to centralising legislation in the early 1970s (discussed in Section 2 and footnote 3) have become virtually like govt. schools. Now, like govt. schools:
(i) they have little autonomy, since a government-appointed Service Commission recruits their teachers, and they have to charge govt. prescribed (nil) fee;
12 The govt. school PPE calculated for these eight states differs from the estimates of Dongre and Kapur (2016),
but the latter calculated PPE for govt. and aided schools. Also see Annex 1 which discusses the reasons why
Dongre & Kapur’s PPE estimates are significantly lower than the true estimates.

34
(ii) they face no competition for survival since they have guaranteed state funding, de facto irrespective of any decline in their number of students;
(iii) they are not very accountable to parents since their funding is secure irrespective of whether parents like/patronise them or not.
(iv) their teachers are not very accountable to their private management boards since their salaries are paid directly into their bank accounts from the government treasury.
However, whether PPP will solve the problems of education is thought to depend on the extent to which the system exemplifies autonomy, freedom from bureaucratic control, inter-school competition, and accountability towards parents. Perhaps that is why the Right to Education (RTE) Act 2009 brought in a new form of PPP whereby private schools (all of which are obliged to give at least 25% of their seats to disadvantaged children) get a per-student reimbursement from government. This form of PPP represents a per student grant and it effectively sets up inherently stronger incentives for schools to keep parents satisfied and give good quality education, since they would lose public funding if a child left to join another school. However, newspaper reports nationally as well as the author’s interviews with representatives of associations of private schools (National Independent Schools Alliance; Independent Schools Federation of India; Society for the Unaided Private Schools of Rajasthan, etc.) indicate that private schools, especially the high fee ones, have been resisting this form of PPP because of two major factors:
(i) firstly because state governments are mostly reimbursing them only a fraction of the amount mandated by section 12(2) of the RTE Act, and in many cases with delays of more than two years, without any compensation for delays13.
(ii) Secondly, many private schools fear corruption in official release of reimbursements and fear that, by accepting public money, they will come under the purview of the Right to Information Act and can be harassed, blackmailed and subjected to extortion by unscrupulous persons on the grounds that they do not fulfil some rule or another, from among a large number of rules, many of which are perceived to be impractical or which are mutually incompatible with other rules14.
13 When a school run by the Urn Education Society in Mumbai went to court against a threat by the state
government to shut it down due to its refusal to admit more children for free under the RTE Act because the
Maharashtra state govt. had not paid the school a reimbursement of Rs. 50 lakh (approx. Rs. 5 million) for three
years, in a judgment given out on 5th December 2016, the Bombay High Court was unsympathetic, ordering the
school to admit more children forthwith, irrespective of the large backlog of non-payment of reimbursement by
the govt. See http://indianexpress.com/article/education/admit-rte-kids-school-not-a-money-making-venture-
bombay-hc-4412651/ (accessed on 6 Dec. 2016) 14 To take one example, RTE Rules say that to gain government recognition, a school must be compliant with
the National Building Code, i.e. be made with iron-reinforced concrete. In focus group discussions with this
author, many small private schools from rural parts of Uttar Pradesh claimed that this rule is used of extort
bribes from them, while most govt. schools do not comply with this norm. To take another example from Uttar
Pradesh, the recognition rule notified in a Govt. Order dated 8 May 2013 that a private school cannot raise its
tuition fee by more than 10% once every three years, is mutually incompatible with another pre-existing UP
govt. rule from 1991 that in order to get a ‘No Objection Certificate’ of the Govt. of UP, the school has to pay
the govt.-prescribed salaries to teachers, which typically rise by about 10% per annum. No school can comply
with both these rules at the same time. There are many examples of thoughtless rules and there is anecdotal

35
Some groups15 have suggested that a way to overcome this conundrum is for government to fund private schools in this type of PPP by giving the per-child subsidy to parents as a voucher or ‘Direct Benefit Transfer’ which the parents can then use at a private school of their choice. Moreover, instead of paying for only a small proportion of disadvantaged children to attend (25% of seats in) private schools, all disadvantaged children could potentially be given school choice funded by vouchers. However, this idea has not been seriously considered. One frequent criticism of the PPP provision of the RTE Act 2009 is that it allows only a fraction of the poor and disadvantaged children to attend private schools. As per National Sample Survey (NSS, 2014-15) data, 30% of children aged 6-14 in India study in private unaided schools, so 25% or a quarter of their total capacity comes to 7.5 percent. That is, the RTE Act guarantees for 7.5% of children to study in private schools under ‘free and compulsory education’, not even for all poor/disadvantaged children, let alone for all children. The children designated in the RTE Rules as ‘disadvantaged’ (Schedule Caste, Schedule Tribe and Other Backward Caste children) alone constitute nearly 70% of the children in the country. Together with ‘economically weaker section’ children, the proportion of poor and disadvantaged children comes to easily more than 80% children of the country, but RTE provision for attendance in private schools is only for 7.5% of the children, i.e. this benefit of the RTE Act is available to less than 10% of the eligible children. Given the large demand for few private school seats, applicant children are selected for private schools on the basis of a lottery, which is also seen to raise some ethical issues. There is another source of resistance to the RTE Act from private schools. The low-fee private schools and their associations (for example, NISA16) have objected to sections 18 and 19 of the RTE Act that impinge on them adversely. Section 18 stipulates that private schools cannot be established or continue to function without obtaining a ‘certificate of recognition’ from the state government, though it does not decree the same for government schools. Section 19 taken together with the Schedule of the RTE Act, lays down the conditions a private school has to fulfil (maximum pupil-teacher-ratio norms and infrastructure norms) in order to gain government recognition, and it also specifies the penalties for violation of the recognition conditions. Many state governments have added other conditions17. While section 8(g) of the Act states that government schools shall also conform to the norms of the Schedule, they are not obliged to obtain a certificate of recognition and are not subject to penalties for non-compliance with the recognition conditions. Official DISE data show that a good proportion of government schools do not fulfil many of the recognition conditions18, but no notices are given to these schools to
evidence that some unscrupulous persons, by threatening to use the Right to Information Act 2005, exploit these
lacunae in the rules to demand bribes from private schools. 15 E.g. the Think Tank Centre for Civil Society and the National Independent Schools Alliance (NISA). 16 National Independent Schools Alliance is an association of state level associations of private schools in India. 17 E.g., in Uttar Pradesh, a Government Order dated 13 May 2013 notifies about 40 different conditions a private
school has to fulfil in order to gain recognition. 18 In reply to a parliamentary question, the Ministry for Human Resource Development stated that only 6.4% of
govt. schools in the country fulfil the recognition norms. See (accessed on 15 Jan. 2017)
http://www.newindianexpress.com/magazine/voices/2017/jan/14/six-years-on-only-64-of-govt-schools-comply-
with-rte-norms-1559014.html

36
shut down, but private schools that cannot fulfil the same norms are given closure notices. Data collated from the public domain by NISA on school closures due to the RTE Act, show that as of October 2016, 9382 private schools had received closure threat, another 7898 private schools had received actual closure notices, and a further 3332 private schools had actually closed down, (http://nisaindia.org/data-on-school-closures), based on data available from only a few states, e.g., data on actual school closures from government documents is available only from three states19. An important recognition norm specified in the state rules of the RTE Act 2009 is that the school must be a registered society, not run for private gain or profit. This stricture inconveniences the vast majority of private schools, which are low-fee and which run for the livelihoods of their founding entrepreneurs, and is also objectionable to many high-fee private school founders who seek a return on their investment. While it is likely that a small proportion of the roughly 300,000 recognised private schools in the country are run by benefactors and philanthropists who give land, buildings, furniture, etc. as charity, without expectation of profit, it is unlikely to be true of the large bulk of private schools. This impractical recognition condition renders probably most private schools illegal, while creating the myth that private schooling in India is mostly charitable in nature. In resisting sections 18 and 19 of the RTE Act 2009, the private school associations also allege that apart from being expensive and impractical, many of the recognition norms of the RTE Act prescribed for schools are not evidence based, for example, they cite research showing that a pupil teacher ratio below 30 does not consistently lead to higher student learning. Similarly, while they say it is desirable that schools have furniture for children and have a separate office room for clerical staff, boundary wall, etc., these are not necessary in order to produce good learning outcomes, and should not become the reason for closing down the lowest-fee rural private schools. In short, they state that an Act which avows to guarantee children’s right to education should not paradoxically become a means to violate that right due to school closures, in the name of some infrastructure and input norms which have no proven connection with schooling quality; instead, they argue for school recognition based on the learning levels of the school’s pupils. At the time of writing this article, National Education Policy is under formulation and India’s HRD ministry has announced that it will amend the RTE Act to include learning levels of students as a recognition norm.
9. Conclusions This paper has sought to bring together evidence on Indian private schools in one convenient place. It has some surprising and some policy-relevant findings.
19 A scan of newspaper reports of Uttar Pradesh in 2015-16 by the author showed that 960 private unrecognised
schools were either given closure notice or were actually closed down in this one year alone. In Lucknow
district, in 2015, a total of 258 schools were given show-cause notices to close down, due to not having govt.
recognition. The author also sent queries to district education officials of all 75 districts of UP, under the Right
to Information (RTI) Act, and 9 district officials replied. This revealed that in 2016, in these nine districts
(Etawah, Lakhimpur Kheri, Chitrakoot, Moradabad, Faizabad, Fatehpur, Lalitpur, and Baghpat), 255
unrecognised schools were given closure notice and 78 were actually closed down.

37
The paper shows a rapid migration of students towards private schools, and an emptying of government schools. The out-migration from govt. schools has rendered a high proportion of them economically unviable, with very high ‘per pupil expenditures’, yielding low value-for-money from public education expenditure, to the extent that three states (Rajasthan, Maharashtra and Chhattisgarh) recently closed down nearly 24,000 government schools. The abandonment of govt. schools is a longer term trend visible in DISE data from 2005, yet education policy and legislation has been ignoring this trend. For example, section 6 of the RTE Act 2009 legally obligates States to create more govt. schools – the kind the public has been deserting. An important policy lesson therefore is that decision-takers must take evidence into account before making education policy or legislation. The paper discovered that a major reason for the rapid growth of private schools is their affordability. Data showed that the vast bulk of private schools in India are ‘low’ fee schools, when benchmarked against the state per capita income and daily wagers’ incomes. From a policy maker’s angle, the fact that about 80% of private schools’ fee levels are lower than government schools’ per pupil expenditure, draws attention to the serious difficulty that such low-fee private schools must face in mustering the resources to comply with the infrastructure norms of the Right to Education (RTE) Act 2009 without public subsidy, when most of the (well-funded) government schools themselves cannot comply with these norms; not surprisingly perhaps, data suggested that many private schools have been compelled to close down due to such non-compliance. It is clearly useful if policy on how to utilise, support and regulate private schools can take into account these realities, in order to avoid unintended counterproductive effects such as the closure of the low-fee private schools which may be successfully imparting learning but which lack the resources to fulfil the demanding infrastructure and other conditions of government recognition. The third major finding in the paper is that private schools are able to run on low fee – or low per-student-cost compared to govt. schools – mainly because their teacher salaries are a small fraction of the salaries in government schools. Government teacher salaries in India are high not only in relation to private schools but also compared with those in other countries. Despite being paid at least four times the salaries of teachers in China (in terms of multiples of their respective per capita incomes), Indian teachers’ performance – judged from the learning levels of their students – has been very poor in the international PISA test, with India ranking 73rd and China ranking 2nd, out of 74 countries. This suggests the need to link future teacher salary increases to the degree of teachers’ acceptance of greater accountability, rather than across-the-board increases irrespective of performance or accountability. The paper discussed some ways of increasing accountability. The discussion on the Right to Education Act 2009 suggests that the higher-fee private schools resist the RTE Act firstly because of their fear of loss of autonomy and the potential to be blackmailed under the Right to Information Act 2005 if they accept government reimbursement money and, secondly, the very low rate of reimbursement per child by the state governments for educating poor and disadvantaged students, a rate much below the amount stipulated in the RTE Act. It shows that many low fee private schools are unable to comply with the expensive ‘recognition’ conditions, leading to their being closed down or threatened to be closed-down by the education authorities.
38
The significantly higher value-for-money offered to parents by private schools – compared to the value for money from public expenditure on government schools – suggests that a public private partnership (PPP) model would be useful, whereby the public sector funds but the private sector produces education. However, there are scores of different designs of PPPs within each of the broad types (voucher schemes, Charter schools, Concession schools) in different countries – each with its own inherent in-built incentive structures for the schools and teachers. Before choosing any particular form of educational PPP, India must study these different designs and their relevance/applicability/adaptability, and must also pilot test the chosen models before scaling up any novel interventions. As shown in section 8 above, there have been major implementation problems with the PPP legislated in India’s Right to Education Act 2009 because the stipulated form of PPP was never pilot tested in a few districts and improved, before being enacted for the entire country and given legislative force. It is hoped that this paper will assist in the formulation of more evidence-based education policy and legislation in India, rather than policy that may be formulated on hunch, ideology or expediency. The evidence presented here can assist decision-takers to craft policy based on the realities of private and public schooling in India, rather than in the absence of the knowledge of these realities.

39
Table 16
Learning achievement levels of children of Class V in public and private schools
% children in Std. V who can
do division
% children in Std. V who can
read a Std. II level text Public Private Difference Public Private Difference
2010 33.9 44.2 10.3 50.7 64.2 13.5
2011 24.5 37.7 13.2 43.8 62.7 18.9
2012 20.3 37.8 17.5 41.7 61.2 19.5
2013 20.8 38.9 18.1 41.1 63.3 22.2
2014 20.7 39.3 18.6 42.2 62.5 20.3
Source: ASER Trends over time. Pratham, 2015.
Table 17
Value for money from public expenditure on education in India
S.
No. Variables
Uttar
Pradesh Bihar Gujarat
Tamil
Nadu
Madhya
Pradesh Kerala Punjab Odisha
a. Govt. Per Pupil Expenditure
(Rupees) 23012 3105 47044 33126 9384 39267 16166 8897
b. Govt Achievement (Reading) 27 45 45 50 28 61 61 50
c. Govt Expenditure per
Achievement Unit (Rupees)
(c=a/b)
859 70 1055 664 338 641 265 178
d. Private Per Pupil
Expenditure (Rupees) 1800 4200 5400 10800 3700 8400 7900 7150
e. Private Achievement
(Reading) 61 88 64 40 58 71 74 77
f. Private Expenditure per
Achievement Unit (Rupees)
(f=d/e)
29 48 84 269 63 119 107 93
g. Govt./ Private Per Pupil
Expenditure Ratio (g=a/d) 12.8 0.7 8.7 3.1 2.5 4.7 2.0 1.2
h. Govt./ Private Numeracy
Ratio (g=b/e) 0.44 0.51 0.70 1.24 0.48 0.87 0.83 0.65
i. Private/Govt. Efficiency
Ratio ( i = c/f ) 29.3 1.5 12.5 2.5 5.3 5.4 2.5 1.9
Note: PPE in public schools in each state is calculated by taking the total elementary education expenditure of
the state plus central government’s expenditure in the state on Sarva Shiksha Abhiyan inputs (such as free
uniforms, textbooks, cash scholarships, school improvement grants etc. but not on the mid-day meals) for 2014-
15, and dividing this total public expenditure by the number of students enrolled in government elementary
schools within the state, as taken from the District Information System on Education (DISE) data for 2014-15.
These PPE estimates cannot be compared with those in Dongre and Kapur (2016) for a variety of reasons,
several of which are set out in Annex 1.

40
References
Antony, Meril and Chaudhuri, Nilanjan (2014) “Limiting Choices and Denying Opportunities? The Case of School Closures in Punjab”. New Delhi: Centre for Civil Society, 2014.
Azam, M., G. Kingdon and K. B. Wu. “The Impact of Private Secondary Schooling on
Cognitive Skills: Evidence from India”, Education Economics, 24(5), pp 465-480, 2016.
ASER (various years) Annual Status of Education Report, ASER Centre, Pratham,
New Delhi.
Bashir, Sajitha (1994) Public versus Private in Primary Education: Comparisons of School Effectiveness and Costs in Tamil Nadu, Unpublished Ph.D. thesis, London School of Economics.
Chudgar, Amita and Elizabeth Quin (2012) “Relationship between private schooling
and achievement: Results from rural and urban India”, Economics of Education Review, 31(4), p 376-90. August.
Desai, Sonalde, et. al. (2008) Desai, S., Dubey, A., Vanneman, R., and Banerji, R.
(2008), Private Schooling in India: A New Educational Landscape, India Human Development Survey, Working Paper No. 11.
Dongre, Ambrish and Avani Kapur (2016) “Trends in Public Expenditure on
Elementary Education in India”, Economic and Political Weekly. Vol. 51, Issue No. 39, 24 Sep, 2016.
Dréze, Jean and Amartya Sen (2013) “An Uncertain Glory: India and its
Contradictions”. Allen Lane, London. French, R. and Kingdon, G. (2010) “The relative effectiveness of private and
government schools in Rural India: Evidence from ASER data”, Dept. of Quantitative Social Science Working paper, 10-03. Institute of Education, University of London.
Goyal, Sangeeta (2009) “Inside the house of learning: the relative performance of
public and private schools in Orissa”, Education Economics, 17(3): p.315-27. August.
Goyal, Sangeeta and Priyanka Pandey (2010) “How do Government and Private
Schools Differ? Findings from two large Indian states”, South Asia Human Development, World Bank, Washington D.C.
Govinda, R. and N.V. Varghese (1993) Quality of Primary Schooling in India: A Case
Study of Madhya Pradesh, Paris: International Institute for Educational Planning, and New Delhi: National Institute of Educational Planning and Administration (NIEPA).
41
IMRB Surveys 2009 and 2014 Commissioned by the Ministry of Human Resource Development.
Jain, S. C. (1988) “Non-official Initiatives for Catering to the Educational Needs of the
Urban Poor: A Case Study of Baroda Slums”, Unpublished typescript, Baroda: Baroda Citizens Council.
Kansal, S. M. (1990) “Disparity in Income and Levels of Living Among Teachers in
Delhi”, Economic and Political Weekly, 25 No. 46, 17th November: 2547-2554.
Kingdon, G.G. (1996), “The Quality and Efficiency of Public and Private education: A
case study of Urban India”, Oxford Bulletin of Economics and Statistics, 58
(1), 57--82.
Kingdon, G.G. (2007) “The Progress of School Education in India”, Oxford Review of
Economic Policy, 23, No. 2: 168-195, Summer 2007.
Kingdon, G.G. (2008), “School-Sector Effects on Student Achievement in India”, in ed.
Chakrabarti, R. and Petersen, P.: School choice international: Exploring
public--private partnerships, chapter 6, Boston, MA: MIT Press.
Kingdon, G.G. (2010) “The Impact of the Sixth Pay Commission on Teacher Salaries
in India”, RECOUP Working Paper 29, Faculty of Education, University of
Cambridge, May 2010.
Kingdon, Geeta G. (1994) An Economic Evaluation of School Management-types in India: A Case Study of Uttar Pradesh, Unpublished D.Phil. thesis, Economics Department, Oxford University.
Kingdon, G. and R. Banerji (2008) SchoolTELLS Survey of Bihar and Uttar Pradesh.
Mimeo, Institute of Education, University College London. Kingdon and Muzammil (2015) “Government per pupil expenditure in Uttar Pradesh:
Implications for the reimbursement of private schools under the RTE Act”, CSAE Working Paper WPS/2015-18, Department of Economics, University of Oxford.
Kingdon, G., S. Sinha and V. Kaul, with G. Bhargava & K. Pental (2016). “Value for
money from Public Education Expenditure on Elementary Education in India”, Discussion Paper Series, Education Global Practice, South Asia Region, World Bank, New Delhi. April 2016.
Muralidharan, K. and Kremer, M. (2008), Public and Private Schools in Rural India, in
ed. Chakrabarti, R. and Petersen, P.: School choice international: Exploring public--private partnerships, Boston, MA: MIT Press.
Muralidharan, K. and V. Sundararaman (2013) “The Aggregate Effect of School
Choice: Evidence from a Two-stage Experiment in India”, NBER Working Paper No. 19441.

42
NSS (2014-15) National Sample Survey, National Sample Survey Organization. New Delhi.
Ramachandran, Vimala (2015) “Teachers in the Indian education system: Synthesis of
a nine-state study”, National University of Educational Planning and Administration, NUEPA, New Delhi. March 2015.
Singh, Abhijit (2015) “Private school effects in urban and rural India: Panel estimates
at primary and secondary school ages”, Journal of Development Economics, Vol. 113 C, pp. 16-32.
Singh, Shailendra and Kala Seetharam Sridhar (2002) “Government and Private
Schools: Trends in Enrolment and Retention”, Economic and Political Weekly, Vol. 37, No. 41, 12 October 2002.
Srivastava, Prachi (2013) “Low fee private schooling: Issues and Evidence”, Chapter
in P. Srivastava (Ed.), Low-fee Private Schooling: aggravating equity or mitigating disadvantage? Oxford Studies in Comparative Education Series. (Symposium Books, Oxford, 2013.)
Tooley, J. and Dixon, P. (2005), Private School is Good for the Poor: A Study of
Private Schools Serving the Poor in Low-Income Countries, CATO Institute,
Washington, DC.
Wadhwa, Wilima (2014) “Government vs private schools: Have things changed?”, ASER Report. http://img.asercentre.org/docs/Publications/ASER%20Reports/ASER%202014/Articles/wilimawadhwa.pdf

43
Annex 1 Reasons why the per pupil expenditure (PPE) estimates in Dongre and Kapur
(2016) are serious under-estimates of the actual PPE in the government school system
Dongre and Kapur (2016) have made a pioneering contribution by estimating per pupil expenditure in govt-funded schools (government and aided schools) across the Indian states, and they have done it for two time-periods, 2011-12 and 2014-15 so they are also able to show the temporal trends in govt. funded schools’ per pupil expenditure (PPE). They have relied on state budget documents for getting information on public education expenditure, and relied on the official District Information System on Education (DISE) for information on total elementary school enrolment in the different states. They have perforce had to live with the limitations of the state budget documents, in particular with the fact that different states follow somewhat different conventions, for example, whether to include in the state budget the Sarva Shiksha Abhiyan funds and the mid-day meal funds received from the central government. The PPEs reported in Dongre and Kapur (2016) are likely to be great under-estimates since :
1. They exclude public expenditure on govt. and aided school teachers’ pension and gratuity. This is because the state budgets do not display teachers’ pensions and gratuity under the ‘elementary education’ head. These expenses are lumped together with some other budget heads and not shown under education.
2. In many states, a high proportion of secondary schools include junior sections (classes 6, 7 and 8) and the govt. expenditure on these schools is in some states reflected in the secondary education budget, not in the elementary (or ‘prathmik) education budget, whereas their enrolments till class 8 from DISE data have been included in the denominator of the PPE calculation.
3. Many states do not include funds for education received under the free mid-day-meal scheme or under Sarva Shiksha Abhiyan from the Central govt. in their State education budget (i.e. public expenditure on free uniforms, free text-books, cash scholarships to dalit pupils, or para-teacher salaries), for example, Uttar Pradesh, so these remain excluded.
4. In their denominator of the PPE calculation, the DISE enrolment data has been used without adjusting for the (anecdotally large) over-reporting of enrolment; emptying govt-funded schools have an incentive to over-report their total enrolment to justify teacher numbers, and also so that they can get a greater quantity of grains for mid-day meals, cloth for uniforms, and money for cash scholarship to dalit children.
5. Dongre and Kapur’s estimates include expenditure on aided schools which the govt. may fund somewhat less than its own schools.
To take one example, Dongre and Kapur estimate the 2014-15 PPE in the govt-funded school system in Uttar Pradesh as Rs. 13,102 per annum (or Rs. 1092 per month), but the author’s own estimate of the PPE in the govt. schools of UP for the same 2014-15 year (in Kingdon and Muzammil, 2015) was Rs. 23,004 pa or Rs. 1917 pm, i.e. 75% higher than that estimated by Dongre and Kapur; after adjusting for inflated enrolment based on two different surveys of the extent of

44
enrolment-inflation, the estimated PPE in govt. schools of UP was Rs. 2320 per month, or Rs. 27,840 pa. Another study which estimates per pupil expenditures in the govt. school system is Kingdon, Sinha and Kaul (2016) which contains PPE estimates for 8 major states of India but, again, due to the method used for estimation, there are some significant differences between the govt. PPE estimates of Kingdon, Sinha and Kaul (2016) and Dongre and Kapur (2016); for one thing Kingdon et. al. estimate PPE in the govt. school system while Dongre and Kapur estimate PPE in the govt. and aided schools taken together, but there are several other reasons for the differences as well, some of which are listed above. Since Dongre and Kapur report PPE estimates for most Indian states using a single common methodology, we report those.
Annex 2 The RTE Act and the reimbursement of private schools
Under section 12(2) of the Right to Education Act 2009, state governments are meant to set an upper limit for their reimbursement to private schools for admitting poor children. This upper limit is mandated to equal to the amount of per pupil expenditure (PPE) that the government incurs in its own schools. In other words, state governments are meant to calculate the PPE in their govt. school system and then reimburse private schools at that rate, or reimburse the actual fee level of the school, whichever is the lower. However, to this author’s knowledge, as of 2016, no Indian state government has actually made such a calculation of PPE in the govt. school system within the state and put such calculation in the public domain. Instead several states have declared an arbitrary amount they will reimburse to private schools, which is typically very significantly lower than the PPE in the govt. school system estimated by academic researchers. For example, in Uttarakhand, the government’s reimbursement to private schools for educating poor children is fixed at Rs. 860 per month or Rs.10,320 per annum, but the 2014-15 PPE in the government-funded school system in the state was Rs. 26,236 pa (Dongre and Kapur, 2016), i.e. the reimbursement limit set by the Uttarakhand state govt. is only 40% of the govt. PPE on schools funded by it, i.e. govt. and aided schools. The columns (i) and (j) of Table 9 showed the government reimbursement to private schools in the few states for which this information is available. It is clear that in states other than Delhi, between 66% and 93% of private-school pupils’ fee is less than their respective state governments’ reimbursement rate for private schools. And that is when the reimbursement rates set by the various states are a fraction of the actual govt. school PPE For example, in Uttarakhand, 71% of private school students’ schools charge a fee that is lower than the govt. reimbursement limit of Rs. 860 per month, and this limit in turn is only about 40% of the actual PPE in the govt. school system.

45
Annex Table 1 Number and percentage of primary-age children (6 – 10 year olds)
who were Out of School in 2009 and 2014 (India and Uttar Pradesh)
India as a whole Uttar Pradesh Population
of 6-10
year olds
Number
Out of
school
%
Out of
school
Population
of 6-10
year olds
Number
Out of
school
%
Out of
school
2009 11,77,24,796 43,43,702 3.69 2,27,60,481 15,98,992 7.03
2014 12,27,71,166 33,98,338 2.77 2,45,20,823 9,40,164 3.83
Abs. change 50,46,370 -9,45,364 -0.92 17,60,342 -6,58,828 -3.8
% change 4.30 21.80 7.70 41.20
Source: IMRB Surveys 2009 and 2014 commissioned by the Ministry of Human Resource Development.
Annex Table 2
Starting salary of Primary and Junior teachers’ in govt. schools
Year Basic
Pay
(a)
Dearness
Allowance
(DA)
(b)
House Rent
Allowance
(HRA)
(c)
City Compen.
Allowance
(CCA)
(d)
Total Pay
(Rs. per
month)
(e)
Learning
levels of
pupils++
(f)
Cost per
learning
unit (Rs.)
(g) = e/f
Primary teachers
2008 4500 5422 675 -- 10597 -- --
2009* 13,500 2970 2020 360 18850 -- --
2010 13,500 4725 2020 360 20605 18.7 1102
2011 13,500 7425 2020 360 23305 12.1 1926
2012 13,500 9450 2020 360 25330 9.1 2784
2013 13,500 11475 2020 360 27355 11.2 2442
2014 13,500 13500 2020 360 29380 12.1 2428
2015 13,500 15525 2020 360 31405 -- --
2016 13,500 17550 2020 360 33430 10.4 3214
2017+ 35,400 708 2020 360 38488 -- --
Annual salary growth rate 2008 to 2017 15.4%
Annual salary growth rate 2009 to 2016 8.5%
Junior teachers
2008 5500 6627 825 --- 12952 -- --
2009* 17140 3771 2760 360 24031 -- --
2010 17140 5999 2760 360 26259 48.2 545
2011 17140 9427 2760 360 29687 -- --
2012 17140 11998 2760 360 32258 24.4 1322
2013 17140 14569 2760 360 34829 -- --
2014 17140 17140 2760 360 37400 30.5 1226
2015 17140 19711 2760 360 39971 -- --
2016 17140 22282 2760 360 42542 25.5 1668
2017+ 44900 898 2760 360 48918 -- --
Annual salary growth rate 2008 to 2017 15.9%
Annual salary growth rate 2009 to 2016 8.5%
Source: Government Orders of the Govt. of Uttar Pradesh, various years. Note: *Sixth and Seventh Pay
Commission salaries were applied in 2009 and 2017 respectively. The Dearness Allowance (DA) is intended as
inflation-proofing. It is the annual increase in Basic Pay. The cumulative DA was 22% (in 2009), 35% (2010),
55% (2011), 70% (2012), 85% (2013), 100% (2014), 115% (2015), and 130% (2016). Thus, after 2009, DA
increased by 15 percentage points every year. ++ This column shows the percentage of children in class V
(upper panel) and in class 8 (lower panel) who could do a three-digit by one-digit division sum. E.g., in 2010,
18.7% of class 5 pupils and 48.2% of class 8 pupils could do division (ASER, various years).

46