Embed Size (px)
Citation preview
GEF/C.54/11/Rev.02 June 26, 2018
54th GEF Council Meeting June 24—26, 2018 Da Nang, Viet Nam Agenda Item 13
UPDATED RESULTS ARCHITECTURE FOR GEF-7
i
Recommended Council Decision
The Council, having reviewed document GEF/C.54/11/Rev.02, Updated Results Architecture for GEF-7, notes with appreciation the proposed measures to enhance the capture, monitoring and reporting of results across the GEF portfolio.
The Council further notes that the work done through the GEF also contributes to the achievement of the Sustainable Development Goals, and the Secretariat would develop a Guidance Note related to this item for information following the 54th Council meeting.
To enable the timely operationalization of the proposed results architecture, the Council approves the monitoring and reporting requirements described in Box 2 (p. 11) of this document, effective July 1, 2018, and requests the Secretariat and the Independent Evaluation Office to include those requirements in an updated version of the 2010 Monitoring and Evaluation Policy.
ii
TABLE OF CONTENTS
Introduction .................................................................................................................................... 1
Background: Continuous Improvement Based on Experience and Evaluative Evidence ............... 2
Key Features of the GEF-7 Results Architecture ............................................................................. 4
Simplification: Fewer, More Relevant Indicators ....................................................................... 4
Setting Ambitious Targets for GEF-7 ........................................................................................... 8
Streamlined Monitoring and Reporting Requirements ............................................................ 10
Enhanced Access to Results Data and Information Through the GEF Portal ........................... 12
Capturing and Monitoring Gender Results and Socio-Economic Co-Benefits .......................... 12
Gender Equality Results ........................................................................................................ 12
Socio-Economic Co-Benefits ................................................................................................. 13
Next Steps ..................................................................................................................................... 14
Annex I: Guidelines on Core Indicators and Sub-Indicators ......................................................... 15
Annex II: Mapping of GEF-7 Core Indicators to GEF-6 Global Environment Benefit Indicators ... 40
1
INTRODUCTION
1. Participants to the seventh replenishment of the GEF Trust Fund (GEF-7) affirmed that the “GEF’s effectiveness in fulfilling its mandate is ultimately determined by the global environmental benefits delivered through the activities it funds”. In this respect, Participants welcomed “the improvements made in the GEF’s ability to capture and report on results at the project, program and portfolio levels“, and emphasized that “continuous improvement is required for the GEF to fully harness data and information on results for evidence-based decision-making and learning”.1
2. Taking into account the Secretariat’s analysis2 as well as the findings, conclusions and recommendations of the Sixth Comprehensive Evaluation of the GEF (OPS6)3, Participants requested the Secretariat, in consultation with Agencies, to present for Council consideration in June 2018 “an updated results architecture, with a view to promoting:
(a) simplification, with fewer, more relevant indicators and more streamlined reporting on project and program -level results;
(b) clear technical definitions and methodological guidance to facilitate more consistent, higher-quality monitoring and reporting across the GEF Partnership;
(c) enhanced availability, accessibility and timeliness of data and information on results for accountability, learning and decision-making;
(d) the capture and monitoring of relevant socio-economic co-benefits; and
(e) a gender-responsive approach”.4
3. In response Participants’ request, this document provides an overview of the GEF-7 results architecture, including indicators, targets, monitoring and reporting requirements, as well as associated guidelines, methodologies and tools. Pending a complete update of the 2010 Monitoring and Evaluation Policy5, which will be presented for Council consideration at its next meeting in the Fall of 2018, the document seeks Council approval of a limited number of
1 GEF/C.54/19/Rev.02, Summary of the Negotiations of the Seventh Replenishment of the GEF Trust Fund (http://www.thegef.org/sites/default/files/council-meeting-documents/EN_GEF.C.54.19.Rev_.02_Replenishment.pdf) 2 GEF/R.7/10, GEF-7 Policy Agenda: Analysis in Support of the Proposed GEF-7 Policy Recommendations (http://www.thegef.org/sites/default/files/council-meeting-documents/GEF-7%20-%20Policy%20Agenda%20-%20GEF_R.7_10.pdf) 3 Global Environment Facility Independent Evaluation Office (GEF IEO), OPS6 Report: The GEF in the Changing Environmental Finance Landscape, Washington, DC: GEF IEO, 2017 (http://www.gefieo.org/sites/default/files/ieo/evaluations/files/ops6-report-eng_1.pdf) 4 GEF/C.54/19, Summary of the Negotiations of the Seventh Replenishment of the GEF Trust Fund 5 (http://www.thegef.org/sites/default/files/documents/ME_Policy_2010_0.pdf)

2
changes to project and program -level monitoring and reporting requirements that are critical for GEF-7 readiness, as described in Box 2 on p. 11 below.
BACKGROUND: CONTINUOUS IMPROVEMENT BASED ON EXPERIENCE AND EVALUATIVE EVIDENCE
4. The need for rigorous and consistent definitions, capture, monitoring and reporting of the results of GEF projects and programs was identified at the inception of the GEF6. To address this need, the GEF has had a monitoring and evaluation function in place continuously since 19967 and an Independent Monitoring and Evaluation Unit – now the Independent Evaluation Office (IEO) – was established in 20038. During the third replenishment period (GEF-3), a tracking tool was introduced to enable a systematic tracking of the results of GEF projects and programs focusing on protected areas9, and that approach was subsequently adopted across all focal areas in the context of a unified results-based management framework10.
5. Since GEF-5, the GEF has had in place results frameworks and tracking tools for each focal area, as well as a set of corporate indicators for global environmental benefits, with associated targets for the replenishment period. In GEF-6, progress towards those targets has been tracked systematically and reported to the Council through the Corporate Scorecard11. These efforts have coincided with progressively increasing emphasis on knowledge and learning12.
6. Notwithstanding the progress made since the inception of the GEF, and particularly in recent years, there are important opportunities for improvement in GEF-7. OPS6 finds that “the GEF’s [results-based management] system has played a strong role in support of reporting, accountability, and communications”; but that “its role in supporting evidence-based decision making and learning has so far been limited”. OPS6 also points to a need to focus on a smaller number of more relevant and more impact-oriented indicators.13 In addition, analysis carried
6 UNDP, UNEP, and World Bank 1994, Independent Evaluation of the Pilot Phase (http://www.gefieo.org/sites/default/files/ieo/evaluations/ops0.pdf) 7 In October 1996, the Council approved the approved the work program and budget for a “GEF monitoring, evaluation and dissemination program” (Joint Summary of the Chairs, Eighth GEF Council Meeting, October 8–10, 1996 [http://www.thegef.org/sites/default/files/council-meeting-documents/GEF.C8.Joint_Summary_1.pdf]). 8 Terms of Reference of the Independent Monitoring and Evaluation Unit (http://www.gefieo.org/sites/default/files/ieo/ieo-documents/independent-monitoring-evaluation-unit-tor.pdf) 9 GEF/C.22/Inf.07, Measuring the Results of Biodiversity (http://www.thegef.org/sites/default/files/council-meeting-documents/C.22.Inf_.7_Measuring_the_Results_of_Biodiversity_5.pdf). 10 GEF/C.31/11, Results-based Management Framework (http://www.thegef.org/sites/default/files/council-meeting-documents/C.31.11_Results_Based_Management_Framework_4.pdf) 11 GEF/C.53/Inf.03, GEF Corporate Scorecard (http://www.thegef.org/sites/default/files/council-meeting-documents/EN_GEF.C.53.Inf_.03_Scorecard_Complete.pdf) 12 GEF/C.48/07/Rev.01, GEF Knowledge Management Approach Paper (https://www.thegef.org/sites/default/files/council-meeting-documents/EN_GEF.C.48.07.Rev_.01_KM_Approach_Paper.pdf) 13 Global Environment Facility Independent Evaluation Office (GEF IEO), OPS6 Report: The GEF in the Changing Environmental Finance Landscape, Washington, DC: GEF IEO, 2017 (http://www.gefieo.org/sites/default/files/ieo/evaluations/files/ops6-report-eng_1.pdf)
3
out by the Secretariat suggests that the GEF’s current system is not capturing the full range of global environmental benefits and socio-economic co-benefits of its projects and programs14.
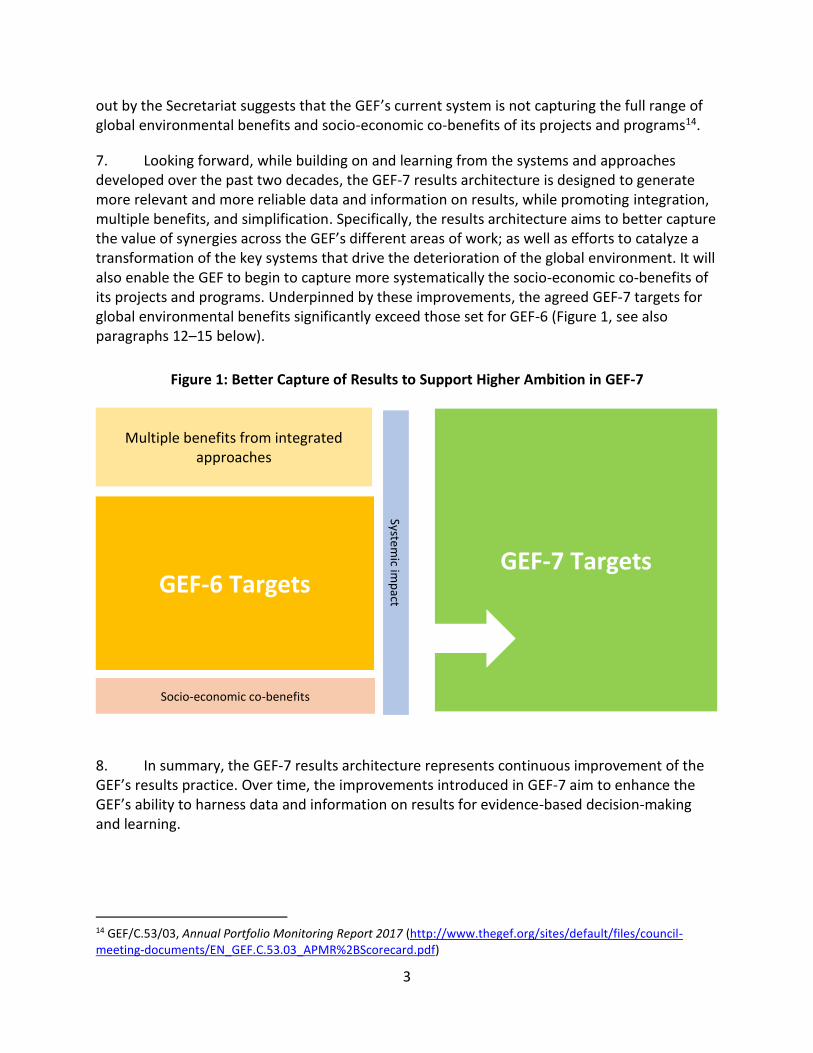
7. Looking forward, while building on and learning from the systems and approaches developed over the past two decades, the GEF-7 results architecture is designed to generate more relevant and more reliable data and information on results, while promoting integration, multiple benefits, and simplification. Specifically, the results architecture aims to better capture the value of synergies across the GEF’s different areas of work; as well as efforts to catalyze a transformation of the key systems that drive the deterioration of the global environment. It will also enable the GEF to begin to capture more systematically the socio-economic co-benefits of its projects and programs. Underpinned by these improvements, the agreed GEF-7 targets for global environmental benefits significantly exceed those set for GEF-6 (Figure 1, see also paragraphs 12–15 below).
Figure 1: Better Capture of Results to Support Higher Ambition in GEF-7
8. In summary, the GEF-7 results architecture represents continuous improvement of the GEF’s results practice. Over time, the improvements introduced in GEF-7 aim to enhance the GEF’s ability to harness data and information on results for evidence-based decision-making and learning.
14 GEF/C.53/03, Annual Portfolio Monitoring Report 2017 (http://www.thegef.org/sites/default/files/council-meeting-documents/EN_GEF.C.53.03_APMR%2BScorecard.pdf)
GEF-6 Targets GEF-7 Targets
Multiple benefits from integrated approaches
Socio-economic co-benefits
System
ic imp
act
4
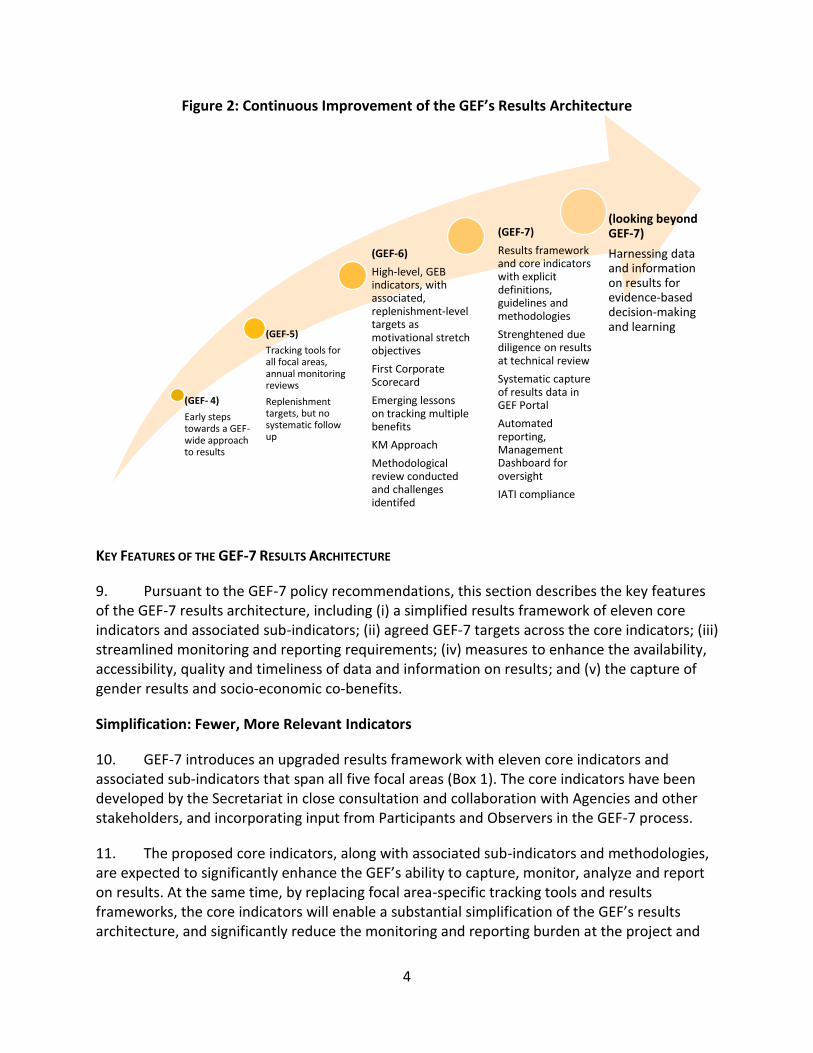
Figure 2: Continuous Improvement of the GEF’s Results Architecture
KEY FEATURES OF THE GEF-7 RESULTS ARCHITECTURE
9. Pursuant to the GEF-7 policy recommendations, this section describes the key features of the GEF-7 results architecture, including (i) a simplified results framework of eleven core indicators and associated sub-indicators; (ii) agreed GEF-7 targets across the core indicators; (iii) streamlined monitoring and reporting requirements; (iv) measures to enhance the availability, accessibility, quality and timeliness of data and information on results; and (v) the capture of gender results and socio-economic co-benefits.
Simplification: Fewer, More Relevant Indicators
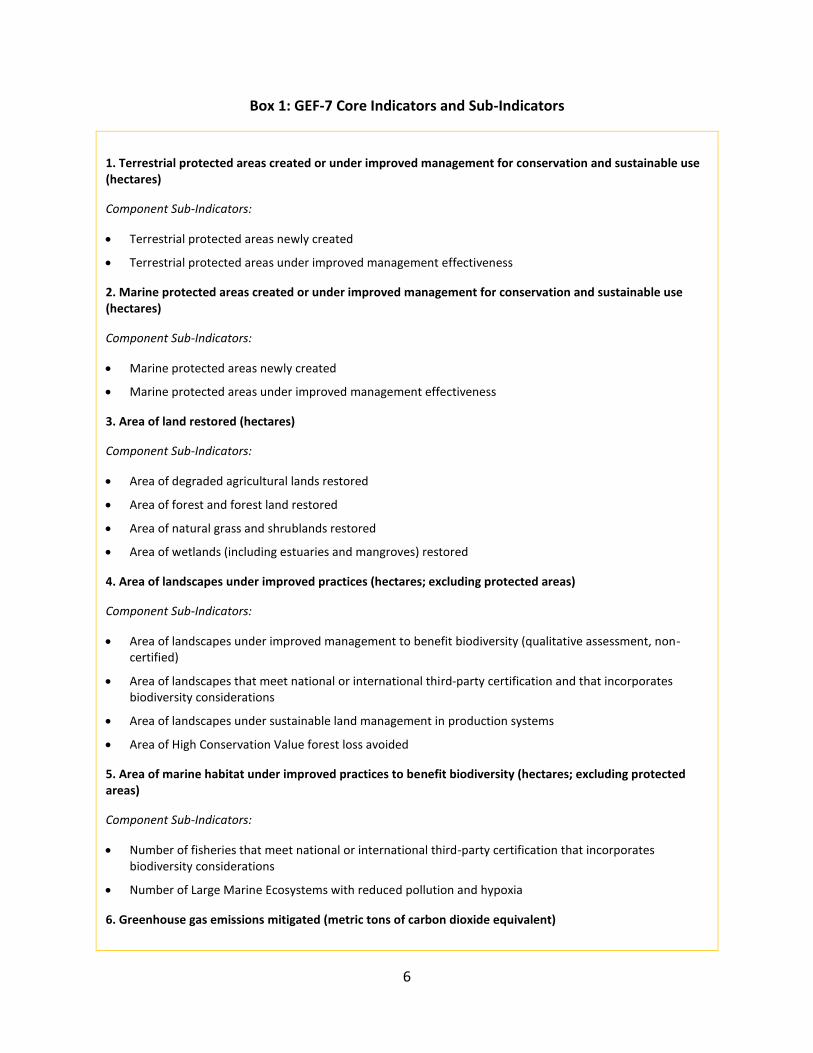
10. GEF-7 introduces an upgraded results framework with eleven core indicators and associated sub-indicators that span all five focal areas (Box 1). The core indicators have been developed by the Secretariat in close consultation and collaboration with Agencies and other stakeholders, and incorporating input from Participants and Observers in the GEF-7 process.
11. The proposed core indicators, along with associated sub-indicators and methodologies, are expected to significantly enhance the GEF’s ability to capture, monitor, analyze and report on results. At the same time, by replacing focal area-specific tracking tools and results frameworks, the core indicators will enable a substantial simplification of the GEF’s results architecture, and significantly reduce the monitoring and reporting burden at the project and
(GEF- 4)
Early steps towards a GEF-wide approach to results
(GEF-5)
Tracking tools for all focal areas, annual monitoring reviews
Replenishment targets, but no systematic follow up
(GEF-6)
High-level, GEB indicators, with associated, replenishment-level targets as motivational stretch objectives
First Corporate Scorecard
Emerging lessons on tracking multiple benefits
KM Approach
Methodological review conducted and challenges identifed
(GEF-7)
Results framework and core indicators with explicit definitions, guidelines and methodologies
Strenghtened due diligence on results at technical review
Systematic capture of results data in GEF Portal
Automated reporting, Management Dashboard for oversight
IATI compliance
(looking beyond GEF-7)
Harnessing data and information on results for evidence-based decision-making and learning
5
program levels, starting for projects approved in GEF-6. In particular, the proposed core indicators have been designed with the following objectives in mind:
(a) Greater focus on the most relevant outcomes: The core indicators are outcome-oriented to the extent possible, while being broadly applicable across a range of different types of interventions, and readily aggregable across the GEF portfolio. They are intended to cover the most crucial needs for accountability, learning and decision-making across the GEF Partnership. As such, the core indicators complement but do not replace indicators that may be more specifically tailored to the theory of change of a particular project or program.
(b) Stronger incentives, reduced transaction costs to capture, monitor and report multiple benefits: The core indicators have been designed to be applicable to integrated projects and programs that seek multiple benefits across focal areas. The GEF-7 targets across these indicators are based on the explicit expectation that GEF-7 investments will – more often than not – contribute towards global environmental benefits across multiple focal areas, and that those benefits will be captured and monitored.
(c) Clarity of definitions and methodologies: Each core indicator is accompanied by a clear technical definition and methodological guidelines to facilitate consistent application across all projects and programs (Annex I). Drawing on lessons learned from GEF-6, where definitions and methodologies were not introduced across all corporate indicators for global environmental benefits, the GEF-7 guidelines address, inter alia, definitions, units of measure, and the rationale for each indicator, with links to relevant external references.
(d) Appropriate disaggregation to support analytical needs and accountability to multi-lateral environmental agreements (MEA): Unlike the equivalent indicators in GEF-6, the core indicators include a limited number of sub-indicators that allow for an appropriate level of disaggregation of information, as well as the capture of different metrics to facilitate portfolio-level analysis and reporting to the conferences of the parties to the MEAs that the GEF serves.
6
Box 1: GEF-7 Core Indicators and Sub-Indicators
1. Terrestrial protected areas created or under improved management for conservation and sustainable use (hectares)
Component Sub-Indicators:
• Terrestrial protected areas newly created
• Terrestrial protected areas under improved management effectiveness
2. Marine protected areas created or under improved management for conservation and sustainable use (hectares)
Component Sub-Indicators:
• Marine protected areas newly created
• Marine protected areas under improved management effectiveness
3. Area of land restored (hectares)
Component Sub-Indicators:
• Area of degraded agricultural lands restored
• Area of forest and forest land restored
• Area of natural grass and shrublands restored
• Area of wetlands (including estuaries and mangroves) restored
4. Area of landscapes under improved practices (hectares; excluding protected areas)
Component Sub-Indicators:
• Area of landscapes under improved management to benefit biodiversity (qualitative assessment, non-certified)
• Area of landscapes that meet national or international third-party certification and that incorporates biodiversity considerations
• Area of landscapes under sustainable land management in production systems
• Area of High Conservation Value forest loss avoided
5. Area of marine habitat under improved practices to benefit biodiversity (hectares; excluding protected areas)
Component Sub-Indicators:
• Number of fisheries that meet national or international third-party certification that incorporates biodiversity considerations
• Number of Large Marine Ecosystems with reduced pollution and hypoxia
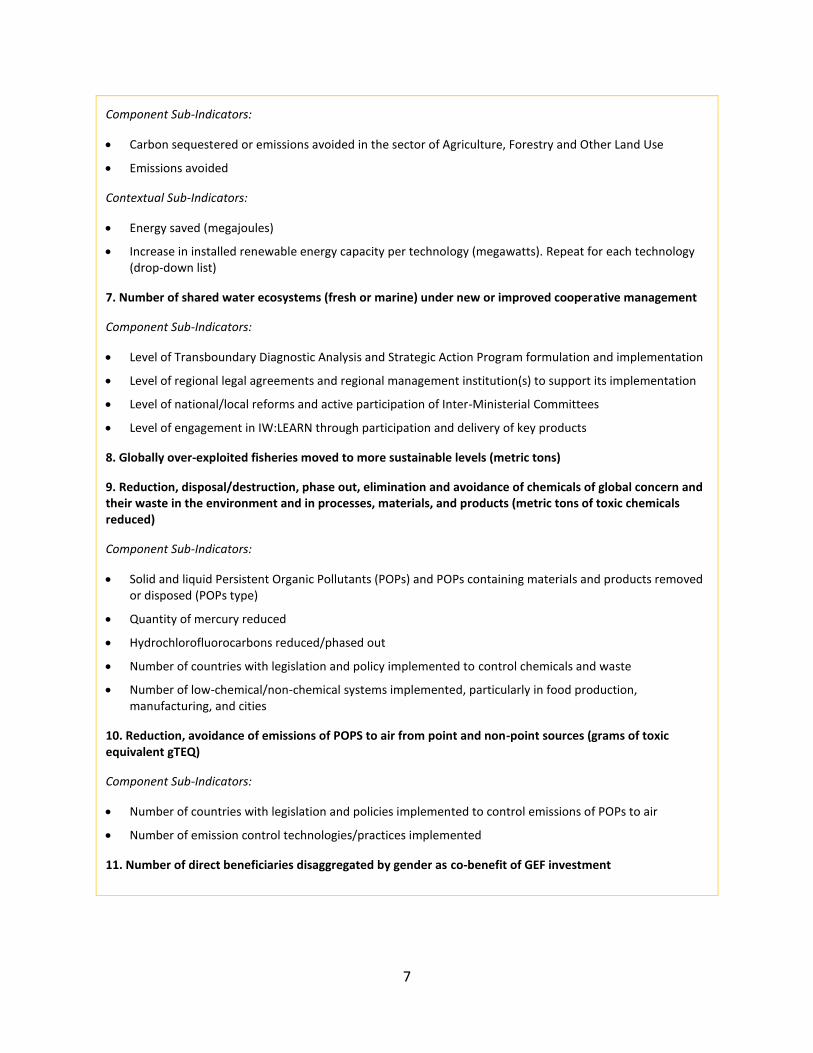
6. Greenhouse gas emissions mitigated (metric tons of carbon dioxide equivalent)
7
Component Sub-Indicators:
• Carbon sequestered or emissions avoided in the sector of Agriculture, Forestry and Other Land Use
• Emissions avoided
Contextual Sub-Indicators:
• Energy saved (megajoules)
• Increase in installed renewable energy capacity per technology (megawatts). Repeat for each technology (drop-down list)
7. Number of shared water ecosystems (fresh or marine) under new or improved cooperative management
Component Sub-Indicators:
• Level of Transboundary Diagnostic Analysis and Strategic Action Program formulation and implementation
• Level of regional legal agreements and regional management institution(s) to support its implementation
• Level of national/local reforms and active participation of Inter-Ministerial Committees
• Level of engagement in IW:LEARN through participation and delivery of key products
8. Globally over-exploited fisheries moved to more sustainable levels (metric tons)
9. Reduction, disposal/destruction, phase out, elimination and avoidance of chemicals of global concern and their waste in the environment and in processes, materials, and products (metric tons of toxic chemicals reduced)
Component Sub-Indicators:
• Solid and liquid Persistent Organic Pollutants (POPs) and POPs containing materials and products removed or disposed (POPs type)
• Quantity of mercury reduced
• Hydrochlorofluorocarbons reduced/phased out
• Number of countries with legislation and policy implemented to control chemicals and waste
• Number of low-chemical/non-chemical systems implemented, particularly in food production, manufacturing, and cities
10. Reduction, avoidance of emissions of POPS to air from point and non-point sources (grams of toxic equivalent gTEQ)
Component Sub-Indicators:
• Number of countries with legislation and policies implemented to control emissions of POPs to air
• Number of emission control technologies/practices implemented
11. Number of direct beneficiaries disaggregated by gender as co-benefit of GEF investment
8
Setting Ambitious Targets for GEF-7
12. The strategy for GEF-7 aims for greater results for the global environment. Specifically, the strategy is intended to seize opportunities for higher impact through:
(a) a sharper focus on the drivers of environmental degradation;
(b) integration to harness synergies across the GEF’s focal areas and the MEAs it serves;
(c) enhanced efforts to mobilize investments in measures to protect the global environment;
(d) stronger multi-stakeholder collaboration, particularly with the private sector;
(e) more effective portfolio oversight and incentives for faster preparation and implementation;
(f) better capture of multiple benefits; and
(g) an enhanced framework to capture expected results at approval, and the materialization of those results throughout the project life-cycle.
13. The GEF’s potential to deliver higher impact in GEF-7 is manifested in a set of ambitious targets that span ten of the eleven core indicators. These targets are informed by bottom-up assessments of the potential global environmental benefits that each GEF-7 program could achieve, based on several assumptions, including:
(a) countries’ decisions regarding the programming of their STAR country allocations;
(b) co-financing mobilized;
(c) participation of and contributions from Agencies, the private sector and other partners;
(d) within programs and participating countries, the thematic and geographic focus of child projects; and
(e) implementation of the GEF-7 policy recommendations.
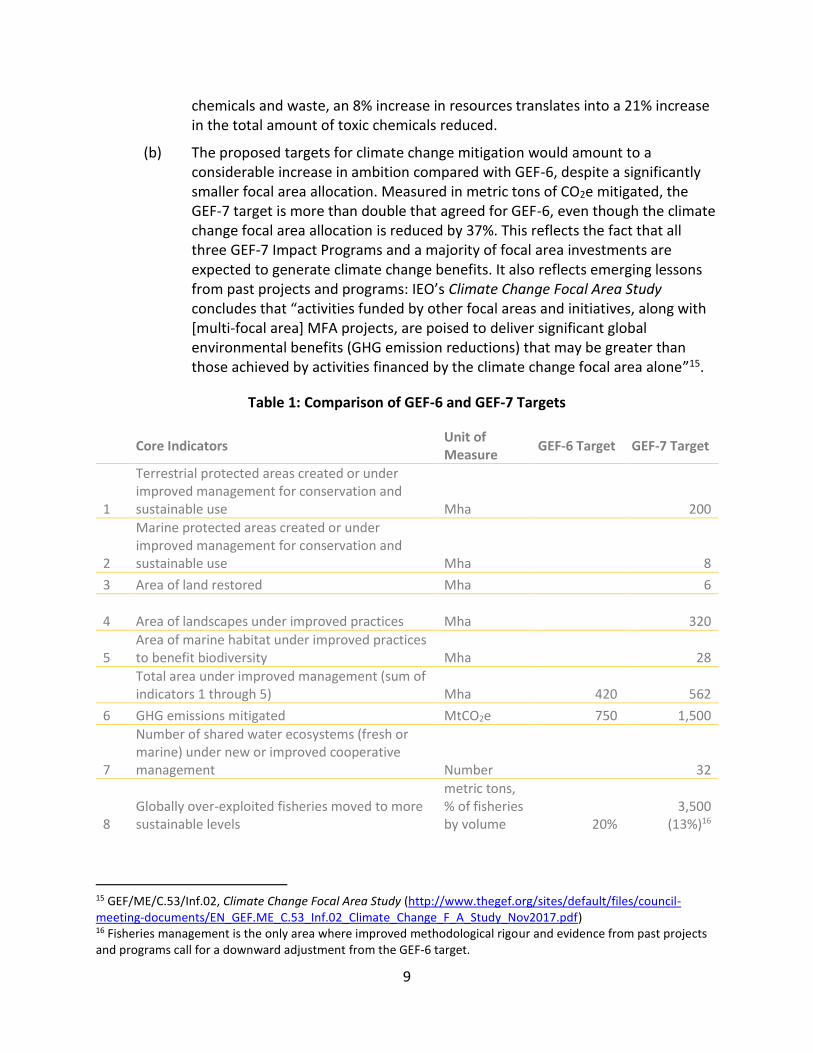
14. The agreed GEF-7 targets demonstrate a substantial increase in ambition compared with GEF-6 (Table 1). A comparison of GEF-7 targets with equivalent GEF-6 targets suggests the following:
(a) In areas of increasing emphasis, GEF-7 stands to deliver greater results and considerable improvements in value for money. A greater emphasis on biodiversity and land degradation, with a 2% increase in their combined focal area allocations, and a larger increase in terms of their share of the replenishment envelope, contributes towards a 33% increase in terms of the total area of landscapes and seascapes brought under improved management. In
9
chemicals and waste, an 8% increase in resources translates into a 21% increase in the total amount of toxic chemicals reduced.
(b) The proposed targets for climate change mitigation would amount to a considerable increase in ambition compared with GEF-6, despite a significantly smaller focal area allocation. Measured in metric tons of CO2e mitigated, the GEF-7 target is more than double that agreed for GEF-6, even though the climate change focal area allocation is reduced by 37%. This reflects the fact that all three GEF-7 Impact Programs and a majority of focal area investments are expected to generate climate change benefits. It also reflects emerging lessons from past projects and programs: IEO’s Climate Change Focal Area Study concludes that “activities funded by other focal areas and initiatives, along with [multi-focal area] MFA projects, are poised to deliver significant global environmental benefits (GHG emission reductions) that may be greater than those achieved by activities financed by the climate change focal area alone”15.
Table 1: Comparison of GEF-6 and GEF-7 Targets
Core Indicators
Unit of Measure
GEF-6 Target GEF-7 Target
1
Terrestrial protected areas created or under improved management for conservation and sustainable use Mha 200
2
Marine protected areas created or under improved management for conservation and sustainable use Mha 8
3 Area of land restored Mha 6
4 Area of landscapes under improved practices Mha 320
5 Area of marine habitat under improved practices to benefit biodiversity Mha 28
Total area under improved management (sum of indicators 1 through 5) Mha 420 562
6 GHG emissions mitigated MtCO2e 750 1,500
7
Number of shared water ecosystems (fresh or marine) under new or improved cooperative management Number 32
8 Globally over-exploited fisheries moved to more sustainable levels
metric tons, % of fisheries by volume 20%
3,500 (13%)16
15 GEF/ME/C.53/Inf.02, Climate Change Focal Area Study (http://www.thegef.org/sites/default/files/council-meeting-documents/EN_GEF.ME_C.53_Inf.02_Climate_Change_F_A_Study_Nov2017.pdf) 16 Fisheries management is the only area where improved methodological rigour and evidence from past projects and programs call for a downward adjustment from the GEF-6 target.
10
Core Indicators
Unit of Measure
GEF-6 Target GEF-7 Target
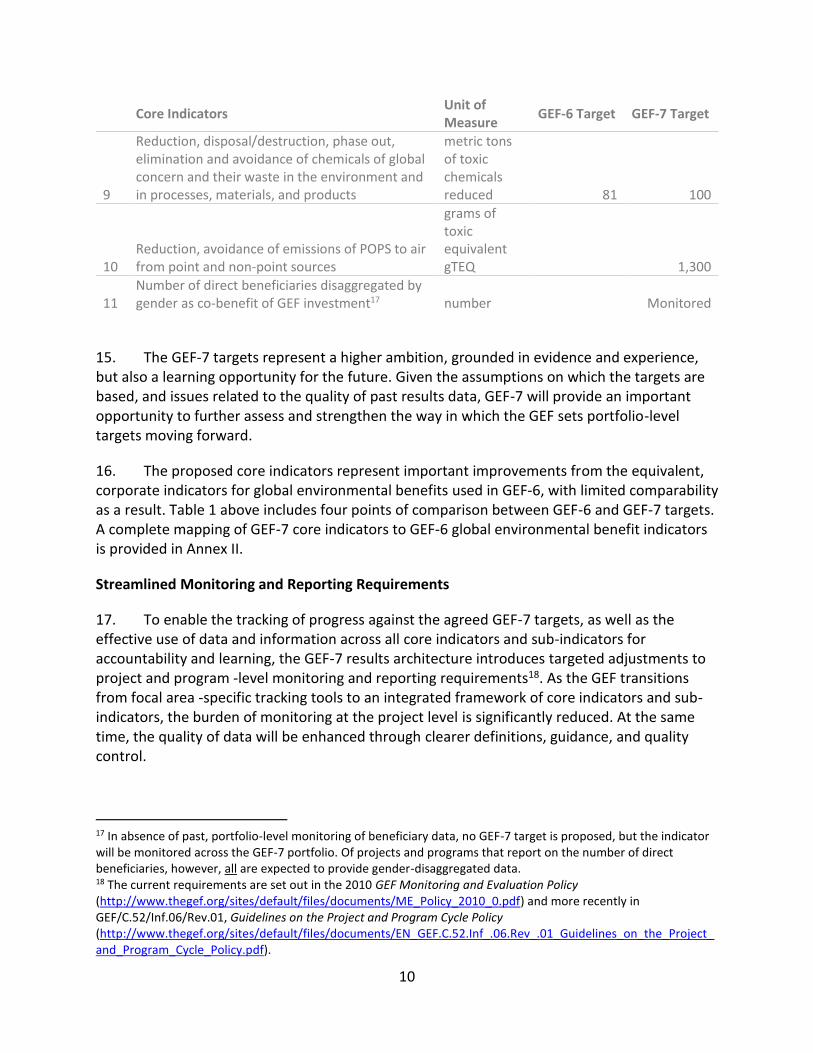
9
Reduction, disposal/destruction, phase out, elimination and avoidance of chemicals of global concern and their waste in the environment and in processes, materials, and products
metric tons of toxic chemicals reduced 81 100
10 Reduction, avoidance of emissions of POPS to air from point and non-point sources
grams of toxic equivalent gTEQ 1,300
11 Number of direct beneficiaries disaggregated by gender as co-benefit of GEF investment17 number Monitored
15. The GEF-7 targets represent a higher ambition, grounded in evidence and experience, but also a learning opportunity for the future. Given the assumptions on which the targets are based, and issues related to the quality of past results data, GEF-7 will provide an important opportunity to further assess and strengthen the way in which the GEF sets portfolio-level targets moving forward.
16. The proposed core indicators represent important improvements from the equivalent, corporate indicators for global environmental benefits used in GEF-6, with limited comparability as a result. Table 1 above includes four points of comparison between GEF-6 and GEF-7 targets. A complete mapping of GEF-7 core indicators to GEF-6 global environmental benefit indicators is provided in Annex II.
Streamlined Monitoring and Reporting Requirements
17. To enable the tracking of progress against the agreed GEF-7 targets, as well as the effective use of data and information across all core indicators and sub-indicators for accountability and learning, the GEF-7 results architecture introduces targeted adjustments to project and program -level monitoring and reporting requirements18. As the GEF transitions from focal area -specific tracking tools to an integrated framework of core indicators and sub-indicators, the burden of monitoring at the project level is significantly reduced. At the same time, the quality of data will be enhanced through clearer definitions, guidance, and quality control.
17 In absence of past, portfolio-level monitoring of beneficiary data, no GEF-7 target is proposed, but the indicator will be monitored across the GEF-7 portfolio. Of projects and programs that report on the number of direct beneficiaries, however, all are expected to provide gender-disaggregated data. 18 The current requirements are set out in the 2010 GEF Monitoring and Evaluation Policy (http://www.thegef.org/sites/default/files/documents/ME_Policy_2010_0.pdf) and more recently in GEF/C.52/Inf.06/Rev.01, Guidelines on the Project and Program Cycle Policy (http://www.thegef.org/sites/default/files/documents/EN_GEF.C.52.Inf_.06.Rev_.01_Guidelines_on_the_Project_and_Program_Cycle_Policy.pdf).
11
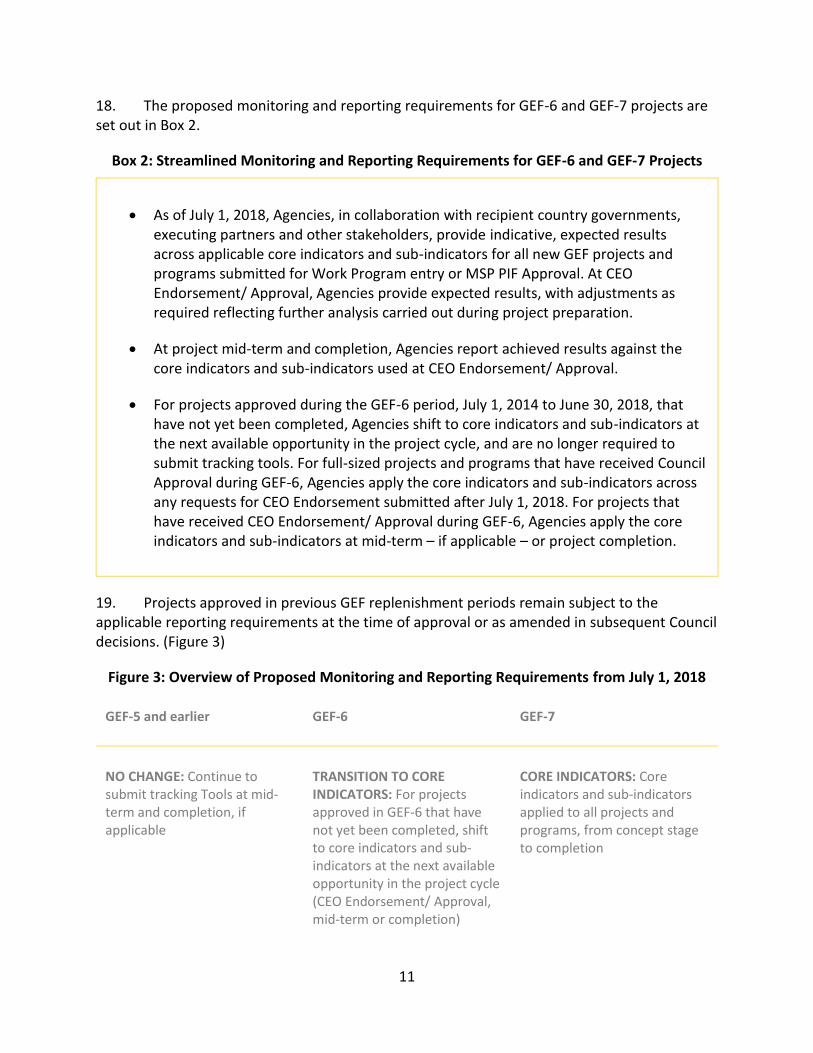
18. The proposed monitoring and reporting requirements for GEF-6 and GEF-7 projects are set out in Box 2.
Box 2: Streamlined Monitoring and Reporting Requirements for GEF-6 and GEF-7 Projects
• As of July 1, 2018, Agencies, in collaboration with recipient country governments, executing partners and other stakeholders, provide indicative, expected results across applicable core indicators and sub-indicators for all new GEF projects and programs submitted for Work Program entry or MSP PIF Approval. At CEO Endorsement/ Approval, Agencies provide expected results, with adjustments as required reflecting further analysis carried out during project preparation.
• At project mid-term and completion, Agencies report achieved results against the core indicators and sub-indicators used at CEO Endorsement/ Approval.
• For projects approved during the GEF-6 period, July 1, 2014 to June 30, 2018, that have not yet been completed, Agencies shift to core indicators and sub-indicators at the next available opportunity in the project cycle, and are no longer required to submit tracking tools. For full-sized projects and programs that have received Council Approval during GEF-6, Agencies apply the core indicators and sub-indicators across any requests for CEO Endorsement submitted after July 1, 2018. For projects that have received CEO Endorsement/ Approval during GEF-6, Agencies apply the core indicators and sub-indicators at mid-term – if applicable – or project completion.
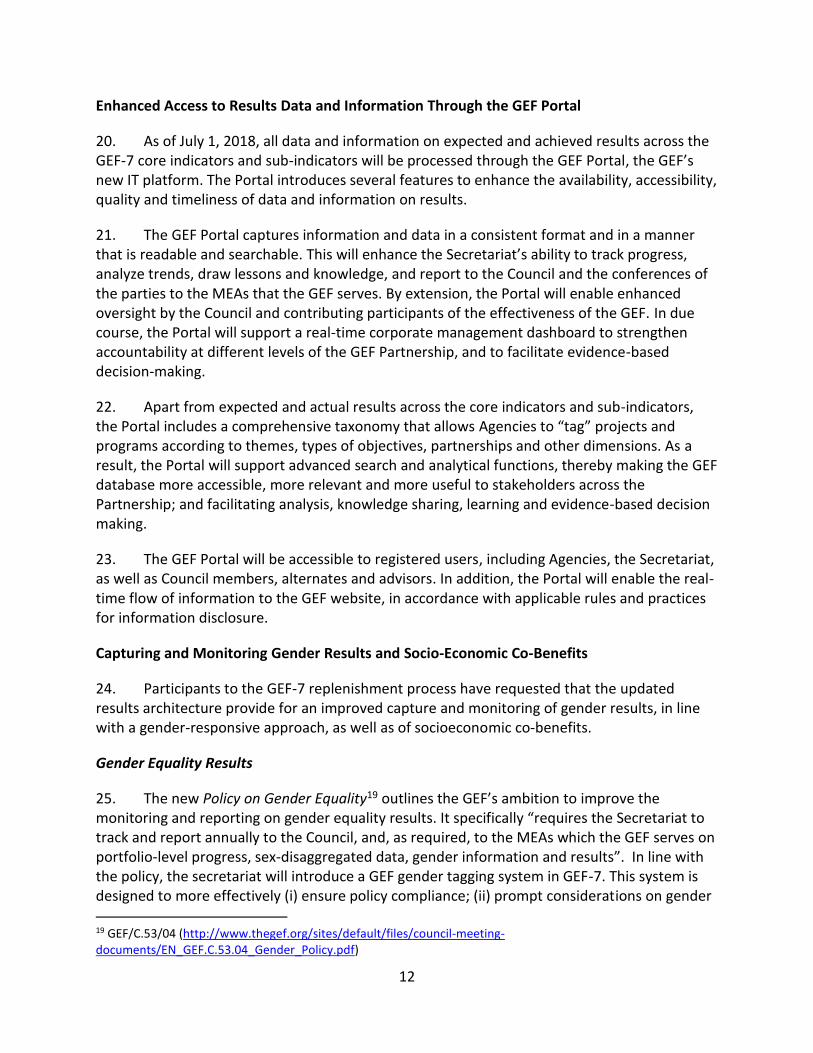
19. Projects approved in previous GEF replenishment periods remain subject to the applicable reporting requirements at the time of approval or as amended in subsequent Council decisions. (Figure 3)
Figure 3: Overview of Proposed Monitoring and Reporting Requirements from July 1, 2018
GEF-5 and earlier GEF-6 GEF-7
NO CHANGE: Continue to submit tracking Tools at mid-term and completion, if applicable
TRANSITION TO CORE INDICATORS: For projects approved in GEF-6 that have not yet been completed, shift to core indicators and sub-indicators at the next available opportunity in the project cycle (CEO Endorsement/ Approval, mid-term or completion)
CORE INDICATORS: Core indicators and sub-indicators applied to all projects and programs, from concept stage to completion
12
Enhanced Access to Results Data and Information Through the GEF Portal
20. As of July 1, 2018, all data and information on expected and achieved results across the GEF-7 core indicators and sub-indicators will be processed through the GEF Portal, the GEF’s new IT platform. The Portal introduces several features to enhance the availability, accessibility, quality and timeliness of data and information on results.
21. The GEF Portal captures information and data in a consistent format and in a manner that is readable and searchable. This will enhance the Secretariat’s ability to track progress, analyze trends, draw lessons and knowledge, and report to the Council and the conferences of the parties to the MEAs that the GEF serves. By extension, the Portal will enable enhanced oversight by the Council and contributing participants of the effectiveness of the GEF. In due course, the Portal will support a real-time corporate management dashboard to strengthen accountability at different levels of the GEF Partnership, and to facilitate evidence-based decision-making.
22. Apart from expected and actual results across the core indicators and sub-indicators, the Portal includes a comprehensive taxonomy that allows Agencies to “tag” projects and programs according to themes, types of objectives, partnerships and other dimensions. As a result, the Portal will support advanced search and analytical functions, thereby making the GEF database more accessible, more relevant and more useful to stakeholders across the Partnership; and facilitating analysis, knowledge sharing, learning and evidence-based decision making.
23. The GEF Portal will be accessible to registered users, including Agencies, the Secretariat, as well as Council members, alternates and advisors. In addition, the Portal will enable the real-time flow of information to the GEF website, in accordance with applicable rules and practices for information disclosure.
Capturing and Monitoring Gender Results and Socio-Economic Co-Benefits
24. Participants to the GEF-7 replenishment process have requested that the updated results architecture provide for an improved capture and monitoring of gender results, in line with a gender-responsive approach, as well as of socioeconomic co-benefits.
Gender Equality Results
25. The new Policy on Gender Equality19 outlines the GEF’s ambition to improve the monitoring and reporting on gender equality results. It specifically “requires the Secretariat to track and report annually to the Council, and, as required, to the MEAs which the GEF serves on portfolio-level progress, sex-disaggregated data, gender information and results”. In line with the policy, the secretariat will introduce a GEF gender tagging system in GEF-7. This system is designed to more effectively (i) ensure policy compliance; (ii) prompt considerations on gender 19 GEF/C.53/04 (http://www.thegef.org/sites/default/files/council-meeting-documents/EN_GEF.C.53.04_Gender_Policy.pdf)
13
early in the project cycle; and (iii) capture portfolio results across key dimensions of gender equality relating to GEF-7 programming directions. Specifically, the framework will enable Agencies and the Secretariat to label and track projects and programs that have:
(a) identified relevant gender differences and gaps in their analysis;
(b) addressed these differences and gaps through specific measures; and
(c) linked measures to gender-sensitive indicators in the project results frameworks.
26. While GEF programs and projects contribute to gender equality and women’s empowerment in different ways, the gender tags will focus on tracking the GEF’s contribution to narrowing three key gender gaps, namely:
(a) access to and control of natural resources;
(b) participation and decision-making;
(c) access to socio-economic benefits and services.
27. The information derived from the gender tags, combined with qualitative analysis, will be used to (i) track progress and results; (ii) compile annual reports to Council (for further information see the GEF Gender Implementation Strategy); and (iii) support learning and knowledge products.
Socio-Economic Co-Benefits
28. GEF projects and programs generate considerable socio-economic co-benefits that are often measured at the project level in project-specific result frameworks, but are not systematically captured across the GEF portfolio20. It is desirable to improve the capture of socio-economic co-benefits, but aggregation of those benefits is inherently challenging given the diversity of the GEF’s portfolio. In the GEF-7 result framework, Core Indicator 11 – “Number of direct beneficiaries disaggregated by gender” will allow a basic level of systematic capture and aggregation across the GEF’s portfolio. It will be applied to capture expected and achieved results for GEF-7 and GEF-6 projects, where the indicator is relevant. Core indicator 11 captures the number of individual people who receive targeted support from a GEF project, defined as direct assistance from the project. As such, the indicator enables the Secretariat to better identify those projects that are most likely to provide significant socio-economic co-benefits.
29. In addition to Core Indicator 11, the Secretariat will work with Agencies and relevant stakeholders across the GEF Partnership to introduce, early in GEF-7, a system to collect more disaggregated information on the most relevant types of socio-economic co-benefits associated
20 For example, IEO’s 2017 evaluation of multi-focal area projects found that 88% of projects delivered positive socio-economic outcomes. Those outcomes consisted mainly of increased income or access to capital (79%), cooperation or reduced conflict among stakeholders (33%), increased access to natural resources (30%), and gender equality (28%). (http://www.gefieo.org/sites/default/files/ieo/evaluations/files/multiple-benefits-2016.pdf)
14
with GEF projects and programs, with a view to supporting more systematic analysis and learning. This system will be complemented by qualitative portfolio reviews and consultations with Agencies. Taken together, these measures are expected to promote a more complete understanding of the extent and nature of socio-economic co-benefits across the GEF’s portfolio over the course of GEF-7, inform future adaptations of the result architecture.
NEXT STEPS
30. The Secretariat has taken the necessary steps to ensure that the GEF-7 results architecture is operational on July 1, 2018. The Secretariat will work closely with Agencies to ensure that any issues are promptly identified and addressed as the Partnership transitions to the new monitoring and reporting arrangements.
31. To ensure complete coherence of the new results architecture with existing policies, procedures and guidelines on monitoring and evaluation, the Secretariat and IEO are currently working to update the 2010 Monitoring and Evaluation Policy. An updated policy will be presented for Council review and approval at its next meeting in the Fall of 2018. At that time, the Secretariat will also propose more detailed arrangements for portfolio-level monitoring and reporting on results, and associated lessons learned, building on the experiences with the Corporate Scorecard and Annual Portfolio Monitoring Reports in GEF-6.
15
ANNEX I: GUIDELINES ON CORE INDICATORS AND SUB-INDICATORS
Introduction
1. The global Environment Facility (GEF) has had a monitoring and evaluation function in place since 199621, which has undergone continuous improvement. As part of efforts to improve the GEF’s ability to capture, monitor and report on GEF-7 results/outcomes, the GEF Secretariat, in collaboration with the GEF Agencies and other stakeholders, has developed an Updated Results Architecture.
2. The objective of these guidelines is to help ensure consistency in reporting on results across the GEF-7 core indicators and sub-indicators. The guidelines include clear technical definitions and methodological guidance for each core indicator and sub-indicator to facilitate their consistent application and reporting across all GEF projects and programs, and across the GEF Partnership.
Important Considerations
3. From July 2018, the GEF will apply a set of Core Indicators (11 Core Indicators and 29 Sub-Indicators) (Box 1) to collect data on project implementation performance and outcomes, including global environmental benefits. The following are important considerations:
(a) Only direct outputs and outcomes would be captured through Core and Sub-Indicators except for the climate change mitigation indicator (Greenhouse Gas Emissions Mitigated).
(b) There are two types of Sub-Indicators: component Sub-Indicators, which sum up to the Core Indicator, while contextual Sub-Indicators provide additional context for the Core Indicator. These are differentiated within the guidance that follows and in the GEF Portal.
(c) With one exception, expected and achieved values should be based on what is achieved by the end of the project. The only indicator for which a future value is desired is the climate change mitigation indicator (Greenhouse Gas Emissions Mitigated).
(d) Precision: GEF Agencies should use three significant figures, at most.
(e) Metric tons: Use of metric tons for Core Indicators refers to the unit that is equal to 1,000 kilograms.
4. Component Sub-Indicators are mutually exclusive, meaning that values (e.g., hectares [ha]) reported for one should be separate and different from values reported for others (e.g., Sub-Indicator 3.2, area of forest and forest land restored versus 3.3, area of natural grass and
21 UNDP, UNEP, and World Bank 1994, Independent Evaluation of the Pilot Phase (http://www.gefieo.org/sites/default/files/ieo/evaluations/ops0.pdf)
16
shrublands restored). Also, Core Indicators 5 and 7have Sub-Indicators that are partially or completely descriptive rather than additive.
Box 1: GEF-7 Core Indicators and Sub-Indicators
1. Terrestrial protected areas created or under improved management for conservation and sustainable use (hectares)
Component Sub-Indicators:
• Terrestrial protected areas newly created
• Terrestrial protected areas under improved management effectiveness
2. Marine protected areas created or under improved management for conservation and sustainable use (hectares)
Component Sub-Indicators:
• Marine protected areas newly created
• Marine protected areas under improved management effectiveness
3. Area of land restored (hectares)
Component Sub-Indicators:
• Area of degraded agricultural lands restored
• Area of forest and forest land restored
• Area of natural grass and shrublands restored
• Area of wetlands (including estuaries and mangroves) restored
4. Area of landscapes under improved practices (hectares; excluding protected areas)
Component Sub-Indicators:
• Area of landscapes under improved management to benefit biodiversity (qualitative assessment, non-certified)
• Area of landscapes that meet national or international third-party certification and that incorporates biodiversity considerations
• Area of landscapes under sustainable land management in production systems
• Area of High Conservation Value forest loss avoided
5. Area of marine habitat under improved practices to benefit biodiversity (hectares; excluding protected areas)
Component Sub-Indicators:
• Number of fisheries that meet national or international third-party certification that incorporates biodiversity considerations
17
• Number of Large Marine Ecosystems with reduced pollution and hypoxia
6. Greenhouse gas emissions mitigated (metric tons of carbon dioxide equivalent)
Component Sub-Indicators:
• Carbon sequestered or emissions avoided in the sector of Agriculture, Forestry and Other Land Use
• Emissions avoided
Contextual Sub-Indicators:
• Energy saved (megajoules)
• Increase in installed renewable energy capacity per technology (megawatts). Repeat for each technology (drop-down list)
7. Number of shared water ecosystems (fresh or marine) under new or improved cooperative management
Component Sub-Indicators:
• Level of Transboundary Diagnostic Analysis and Strategic Action Program formulation and implementation
• Level of regional legal agreements and regional management institution(s) to support its implementation
• Level of national/local reforms and active participation of Inter-Ministerial Committees
• Level of engagement in IW:LEARN through participation and delivery of key products
8. Globally over-exploited fisheries moved to more sustainable levels (metric tons)
9. Reduction, disposal/destruction, phase out, elimination and avoidance of chemicals of global concern and their waste in the environment and in processes, materials, and products (metric tons of toxic chemicals reduced)
Component Sub-Indicators:
• Solid and liquid Persistent Organic Pollutants (POPs) and POPs containing materials and products removed or disposed (POPs type)
• Quantity of mercury reduced
• Hydrochlorofluorocarbons reduced/phased out
• Number of countries with legislation and policy implemented to control chemicals and waste
• Number of low-chemical/non-chemical systems implemented, particularly in food production, manufacturing, and cities
10. Reduction, avoidance of emissions of POPS to air from point and non-point sources (grams of toxic equivalent gTEQ)
Component Sub-Indicators:
• Number of countries with legislation and policies implemented to control emissions of POPs to air
• Number of emission control technologies/practices implemented
11. Number of direct beneficiaries disaggregated by gender as co-benefit of GEF investment
18
Core and Sub-Indicators
1. Terrestrial protected areas created or under improved management for conservation and sustainable use (hectares)
This indicator will be reported as the aggregate total of two Sub-Indicators. Guidance is provided below.
1.1. Terrestrial protected areas newly created
Definition: This indicator refers to the area (ha) newly placed under legal protection status as a result of project support, and management to achieve that status.
Details: Terrestrial protected areas are defined as totally or partially protected areas that are newly designated as national parks, natural monuments, nature reserves, or wildlife sanctuaries; protected landscapes; and scientific reserves. The category includes the International Union for the Conservation of Nature’s (IUCN) protected area Categories I–VI22.
5. The intent is to capture the hectares of new protected areas resulting from project support that meet key Biodiversity Area criteria (IUCN, 2016), and which were not established before the start of the project. UN Environment World Conservation Monitoring Centre (WCMC) has also used this indicator for several years as part of the Biodiversity Indicators Partnership.23 For projects that expand current protected areas, only the new expanded hectares should be reported. Existing protected areas (i.e., established before the start of the project) in which projects increase the level of protection (e.g., a change in IUCN category) should not be included.
6. The name and size of the protected area(s) to be created should be indicated at Project Identification Form and CEO Endorsement stages. By mid-term or final evaluation, projects should indicate the IUCN protected area category (Categories I–VI),24 as well as the ID number from the World Database of Protected Areas (WDPA) (IUCN, 2018), if available. In cases where the protected area does not fit IUCN criteria (e.g., some Indigenous and Community Conserved Areas [ICCA]), “Other Category” should be selected. For new protected areas that are not captured in the WDPA, projects ideally should provide geographic information system (GIS) files depicting the extent of the protected area.
7. Protection of new areas implies improved management that accompanies the protection. To avoid double-counting, hectares reported for Sub-Indicator 1.1 should not be reported under Sub-Indicator 1.2.
22 UN Environment World Conservation Monitoring Centre, as compiled by the World Resources Institute; definition sourced from World Bank (2016). 23 https://www.bipindicators.net/indicators/protected-area-coverage-of-key-biodiversity-areas 24 Ibid.
19
Type: Outcome indicator
Unit of measurement: Area (ha)
1.2. Terrestrial protected areas under improved management effectiveness
Definition: This indicator refers to the number of hectares of protected area whose management has been improved.
Details: Terrestrial protected areas are totally or partially protected areas that are designated as national parks, natural monuments, nature reserves, or wildlife sanctuaries; protected landscapes; and scientific reserves. The category includes IUCN protected area Categories I–VI.25
8. The main data source for this indicator is the Management Effectiveness Tracking Tool (METT) score. The METT was originally developed by the World Wildlife Fund and the World Bank Forests Alliance for Forest Conservation and Sustainable Use. It has been applied as the main qualitative measure of management effectiveness at protected areas since 2001 (Protected Planet, 2014; Stolton and Dudley, 2016). If the score increases over the life of the project, the protected area hectares should be counted. Any increase in METT score will satisfy the threshold for this indicator. If the METT score does not change or decreases, then the protected area hectares should not be counted. Additional analysis of increases in METT scores could further characterize these changes. All METT files from projects should be provided to WCMC, which hosts the global database of METTs. Only the overall METT score will be required for GEF indicator reporting.
9. The name, WDPA ID, size, IUCN protected area category (Categories I–VI),26 and METT score should be indicated. The Sub-Indicator will be calculated based on the protected areas that show an increase in METT score. In cases where the protected area does not fit IUCN criteria (e.g., ICCAs), “Other Category” should be noted.
10. Where the area in question was also newly protected through project implementation, hectares should only be reported under Sub-Indicator 1.1 rather than under Sub-Indicator 1.2.
Type: Outcome indicator
Unit of measurement: Area (ha)
2. Marine protected areas created or under improved management for conservation and sustainable use (hectares)
This indicator will be reported as the aggregate total of two Sub-Indicators. Guidance is provided below.
25 Ibid. 26 Ibid.
20
2.1. Marine protected areas newly created
Definition: This indicator refers to the marine area (ha) newly placed under legal protection status as a result of project support, and the management to achieve that.
Details: Terrestrial protected areas are defined as totally or partially protected areas that are newly designated as national parks, natural monuments, nature reserves, or wildlife sanctuaries; protected landscapes; and scientific reserves. The category includes IUCN protected area categories (Categories I–VI).27
11. The intent is to capture the hectares of new protected areas resulting from project support that meet Key Biodiversity Area Criteria (IUCN, 2016), and which were not established before the start of the project. UN Environment and WCMC has also used this indicator for several years as part of their Biodiversity Indicators Partnership.28 For projects that expand current protected areas, only the new expanded hectares should be reported. Existing protected areas (i.e., established prior to the start of the project), in which projects increase the level of protection (e.g., a change in IUCN category), should not be included.
12. The name and size of the protected area(s) to be created should be indicated at the Project Identification Form and CEO Endorsement stages. By mid-term or final evaluation, projects should also indicate the IUCN protected area category (Categories I–VI)29, as well as the ID number from the WDPA (IUCN, 2018), if available. In cases where the protected area does not fit IUCN criteria (e.g., some Indigenous and ICCAs), “Other Category” should be selected. For new protected areas that are not captured in the WDPA, projects should ideally provide GIS files depicting the extent of the protected area.
13. Protection of new areas implies improved management that accompanies the protection. To avoid double-counting, hectares reported for Sub-Indicator 2.1 should not be reported under Sub-Indicator 2.2.
Type: Outcome indicator
Unit of measurement: Area (hectares)
2.2. Marine protected areas under improved management effectiveness
Definition: This indicator refers to the number of hectares of protected area whose management has improved.
Details: Marine protected areas are those of intertidal or subtidal terrain — and overlying water and associated flora, fauna, and historic and cultural features — that
27 Ibid. 28 https://www.bipindicators.net/indicators/protected-area-coverage-of-key-biodiversity-areas 29 UN Environment World Conservation Monitoring Centre, as compiled by the World Resources Institute; definition sourced from World Bank (2016)
21
have been reserved by law or other effective means to protect part or all enclosed environment.30
14. The main data source for this indicator is the METT score. The METT was originally developed by World Wildlife Fund and the World Bank Forests Alliance for Forest Conservation and Sustainable Use. It has been applied as the main qualitative measure of management effectiveness at protected areas since 2001 (Protected Planet, 2014; Stolton and Dudley, 2016). If the score increases over the life of the project, then the protected area hectares should be counted. Any increase in METT score will satisfy the threshold for this indicator. If the METT score does not change or decreases, then the protected area hectares should not be counted. Additional analysis may further characterize increases in METT scores. METT files from projects should be provided to WCMC, which hosts the global database of METTs. For GEF indicator reporting, only the overall METT score is required.
15. The name, WDPA ID, size, IUCN protected area category (Categories I–VI)31 and METT score should be indicated. The Sub-Indicator will be calculated based on the protected areas that show an increase in METT score.
16. Where the area in question was also newly protected through project implementation, hectares should only be reported under Sub-Indicator 1.1 rather than under Sub-Indicator 1.2.
Type: Outcome indicator
Unit of measurement: Area (hectares)
3. Area of land restored (hectares)
This indicator will be reported as the aggregate total of four Sub-Indicators. To avoid double-counting, the hectares reported under each Sub-Indicator should not overlap. Guidance is provided below.
Definition: This indicator captures the total area of land undergoing restoration in terms of ecosystem function and/or ecology.
Details: Restoration is defined as the process of repairing and/or assisting the recovery of land and ecosystems that have been degraded, damaged, destroyed, or modified to an extent that the land and/or ecosystem cannot fulfil its ecological functions and/or fully deliver environmental services. Activities may include (i) ecosystem restoration that reduces the causes of decline and improves basic functions; and (ii) ecological restoration that enhances native habitats, sustains ecosystem resilience, and conserves biodiversity.
30 Ibid. 31 UN Environment World Conservation Monitoring Centre, as compiled by the World Resources Institute; definition sourced from World Bank (2016).
22
3.1. Area of degraded agricultural lands restored
Definition: This indicator captures the area of agricultural land in a degraded state that is being restored through GEF-funded interventions. These interventions include restoration practices to enhance soil and water conservation, erosion control, groundwater recharge, and improved vegetative cover.
Details: Degraded lands are defined as per the United Nations Convention to Combat Desertification:32 “reduction or loss […] of the biological or economic productivity and complexity of rain-fed cropland, irrigated cropland, or range, pasture, forest, and woodlands resulting from land uses or from a process or combination of processes, including processes arising from human activities and habitation patterns…”33 While not required, projects should ideally provide GIS files showing the extent of the degraded land being restored and also to indicate the relative state of the area prior to GEF activities. In addition, restoration is defined as “the improvement of degraded land on a large scale that rebuilds ecological integrity and enhances people’s lives” (Future Terrains, 2018).
Type: Outcome indicator
Unit of measurement: Area (hectares)
3.2. Area of forest and forest land restored
Definition: This indicator captures the area of forest and forest land that is undergoing ecological restoration through GEF-funded interventions.
Details: The intent of this Sub-Indicator is to capture the area of forest and forest land in which best practices for ecological restoration are being applied. Example interventions that may be included within this indicator are the creation of corridors between protected areas, targeted eradication, management or control of Invasive Alien Species, among others.
Type: Outcome indicator
Unit of measurement: Area (hectares)
3.3. Area of natural grass and shrublands restored
Definition: This indicator captures the area of natural grass and shrublands that is undergoing ecological restoration through GEF-funded interventions.
Details: The intent of this Sub-Indicator is to capture the area of natural grass and shrublands in which best practices for ecological restoration are being applied. Example
32 See website at http://www2.unccd.int/. 33 Ibid.
23
interventions are the creation of corridors between protected areas, targeted eradication, and management or control of Invasive Alien Species, among others.
Type: Outcome indicator
Unit of measurement: Area (hectares)
3.4. Area of wetlands (including estuaries and mangroves) restored
Definition: This indicator captures the area of wetlands, including estuaries and mangroves that is undergoing ecological restoration through GEF-funded interventions.
Details: The intent of this Sub-Indicator is to capture the area of wetlands in which best practices for ecological restoration are being applied. Example interventions that may be included within this indicator are the creation of corridors between protected areas, targeted eradication, management or control of Invasive Alien Species, among others.
Type: Outcome indicator
Unit of measurement: Area (hectares)
4. Area of landscapes under improved practices (hectares; excluding protected areas)
This indicator will be reported as the aggregate total of four Sub-Indicators. To avoid double-counting, hectares reported under each Sub-Indicator must not overlap. Guidance is provided below.
Definition: This indicator captures the total area of landscapes under improved practices, including in production sectors (e.g., agriculture, rangeland, forestry, aquaculture, tourism, extractives [oil and gas]) that lead to improved environmental conditions and/or for which management plans have been prepared and endorsed and are under implementation. This indicator is directly related to Aichi Biodiversity Target 7 of the Convention on Biological Diversity, whereby areas under agriculture, aquaculture and forestry, by 2020, are managed sustainably, ensuring conservation of biodiversity (CBD, undated). It is, in addition, directly related to country Land Degradation Neutrality targets under the Convention to Combat Desertification.
4.1. Area of landscapes under improved practices to benefit biodiversity (qualitative assessment, non-certified)
Definition: This indicator captures the landscape area being managed to benefit biodiversity, but which is not certified.
Details: The project should qualitatively describe the benefit provided to biodiversity through a change in management. Additionally, while not required, projects should ideally provide GIS files showing the extent of land under this improved management (outside of protected areas).
24
Type: Outcome indicator
Unit of measurement: Area (hectares)
4.2. Area of landscapes that meets national or international third-party certification and that incorporates biodiversity considerations
Definition: This indicator captures the landscape area that achieves certification that incorporates biodiversity considerations.
Details: The project should indicate the details of third-party certification (e.g., Forest Stewardship Council, Round Table on Responsible Soy, Global Forest Alliance). See Tscharntke et al. (2014) for a review of tropical agroforestry certification schemes and UNEP-WCMC (2011) for a general review of biodiversity criteria in various standards and certifications.
17. Furthermore, while not required, it is suggested that projects provide GIS files showing the extent of the land under this improved management (outside of protected areas).
Type: Outcome indicator
Unit of measurement: Area (hectares)
4.3. Area of landscapes under sustainable land management in production systems
Definition: This indicator captures the landscape area that is in production (e.g., agriculture, rangeland, and forests) and whose soil, air, and water are managed in a sustainable manner (CIESIN, 1997−2018).
Details: The project should indicate the details of management practices. Projects should ideally provide GIS files showing the extent of the land under sustainable land management.
18. This Sub-Indicator is distinguished from Sub-Indicator 4.2 by capturing improved practices that benefit physical improvements in the environment (e.g., soil and soil carbon, nutrient recycling, diversity and functionality of vegetation cover, micro-climates, and water). Biodiversity benefits of global importance are captured by Sub-Indicator 4.2.
Type: Outcome indicator
Unit of measurement: Area (hectares)
4.4. Area of High Conservation Value forest loss avoided
Definition: This indicator captures the amount of High Conservation Value Forest (HCVF)34 that would be lost without implementation of GEF projects that achieve the
34 https://www.hcvnetwork.org/
25
conservation of these HCVF areas. This conservation is achieved through reclassification by government policy interventions or through company intervention at the site scale.
Details: Projects must first indicate the names and areas of HCVF that are targeted (GIS files depicting these areas would ideally be submitted). A counterfactual is needed to estimate or calculate the loss avoided. The counterfactual could compare to the baseline or to the “business as usual” scenario. If not already recognized by the HCV network, projects should submit documentation that the forests targeted meet one or more of the HCV criteria (HCV Resource Network, 2005−18).
Type: Outcome indicator
Unit of measurement: Area (hectares)
5. Area of marine habitat under improved practices to benefit biodiversity (hectares; excluding protected areas)
Definition: This indicator captures the area of marine habitat under improved management to benefit biodiversity and/or for which management plans have been prepared and endorsed and are under implementation.
Details: For the purpose of the indicators, the GEF defines marine area as the living resources, natural infrastructure, and a range of important habitats such as mangroves, coral reefs, seagrass beds, coastal tidal marshes, seamounts, thermal vents, and cold water corals that are crucial for human well-being and sustainable development. This indicator can include implementation of one or more of the following approaches: marine habitat under Integrated Coastal Management, Locally Managed Marine Area, Marine Spatial Plan, and/or Large Marine Ecosystem (LME). The project should also qualitatively describe the benefits provided to biodiversity through change in management. Finally, while not required, projects should ideally provide GIS files showing the extent of the ocean under this improved management.
Two additional Sub-Indicators are available to provide context in case they are relevant to the project.
Type: Outcome indicator
Unit of measurement: Area (hectares)
5.1. Number of fisheries that meet national or international third-party certification that incorporates biodiversity considerations
Definition: This indicator captures the number of fisheries that are managed to benefit biodiversity, and which are certified through a third-party.
Details: The project should indicate the names of the fisheries and the details of third-party certification (e.g., Marine Stewardship Council, Global Aquaculture Alliance)
26
(UNEP-WCMC, 2011) for a general review of biodiversity criteria in various standards and certifications.
Type: Outcome indicator
Unit of measurement: Quantity (Number of fisheries and/or aquaculture operations)
5.2. Number of Large Marine Ecosystems with reduced pollution and hypoxia
Definition: This indicator captures the total number of LMEs that have reduced pollution, including from nutrient loading that would otherwise lead to hypoxia, defined as a state in the oceans where oxygen levels are depleted to less than 2−3 parts per million (USEPA, 2017).
Details: Projects should indicate the names of the LMEs, as well as the type and extent (qualitative or quantitative) of pollution reduction achieved through policy and infrastructure investments to address point and non-point sources (STAP, 2011a, 2011b).
Type: Outcome indicator
Unit of measurement: Quantity (number LMEs)
6. Greenhouse Gas Emissions Mitigated (metric tons of carbon dioxide equivalent)
This indicator refers to the total reduction of GHG emissions and enhancement of sinks and reservoirs reported in tons of carbon dioxide equivalent (CO2e). As such, it is reported as the aggregate of the first two Sub-Indicators.
19. The mitigation of GHG emissions is defined as a human intervention to reduce the sources, or enhance the sinks, of GHG (IPCC, 2012).
20. Using the methodologies of the GEF and its Scientific and Technical Advisory Panel, noted below, three values will be reported for the Core Indicator: (i) lifetime direct project GHG emissions mitigated, (ii) lifetime direct post-project emissions mitigated, and (iii) lifetime indirect GHG emissions mitigated.
• Lifetime direct project GHG emissions mitigated are attributable to investments during the project's supervised implementation period, totaled over the respective lifetime of the investments.
• Lifetime direct post-project emissions mitigated are attributable to investments outside the project's supervised implementation period, but supported by financial facilities or regulatory interventions by the GEF project, totaled over the respective lifetime of the investments. Financial facilities such as partial credit guarantee facilities, risk mitigation facilities, or revolving funds will remain in operation after the project ends.
27
• Lifetime indirect GHG emissions mitigated are those attributable to the long-term outcomes of GEF activities that remove barriers, such as capacity building, innovation, and catalytic action for replication.
6.1. Carbon sequestered or emissions avoided in the sector of Agriculture, Forestry, and Other Land Use
Regarding the Agriculture, Forestry, and Land Use Change Lifetime, the length of time is defined as 20 years, unless an alternative number of years is deemed appropriate. For emission or removal factors (tons of CO2e per hectare per annum), the defaults to be applied are those of the Intergovernmental Panel on Climate Change (IPCC) or country-specific factors. The GEF recommends its Agencies apply the Ex-Ante Carbon-balance Tool (EX-ACT) of the Food and Agriculture Organization of the United Nations (FAO) or the GEF’s Carbon Benefits Project tools for estimating benefits. It also suggests providing strong justification on the use of an equivalent tool based on IPCC guidelines. The GEF will be further developing guidelines on methodologies for this sector.
Definition: Carbon sequestration is defined as the process of increasing the carbon content of a reservoir/pool other than the atmosphere (IPCC, 2012). Avoided emissions refers to reduced emissions due to avoided deforestation or forest degradation, sustainable forest management, and improved practices on other land uses such as in agriculture.
Details: This element requires information on the area (ha) and the quantity of carbon (tons CO2e) stored or not emitted in forests and soils as a result of the project. By definition, these benefits should be measured above a baseline value. The estimate must be based on widely recognized methodology to be clearly presented in the project document.
Type: Outcome indicator
Unit of measurement: metric tons of CO2e
6.2. Emissions avoided
Definition: This indicator captures the amount of GHG emissions expected to be avoided through the interventions of the GEF project in sectors other than the Agriculture, Forestry, and Other Land Use sector. These therefore may include GHG benefits from energy efficiency, renewable energy, transportation, and urban projects or project components. These benefits should be measured above a baseline value.
Details: Calculating GHG emissions avoided from GEF projects has several steps, depending on project complexity and the components. Some project components contain investments as an output that lead to direct GHG emission reductions. Other components (e.g., revolving funds) typically lead to both direct and indirect GHG
28
emission reductions. A third group, such as regulatory and policy reform, might lead — first and foremost if not exclusively — to indirect GHG emission reductions.
21. To calculate total emissions avoided, baseline emissions of the scenario without a GEF contribution to the project are first calculated. Subsequently, emissions for the GEF alternative are calculated, including investments that are tracked in the log frame during project implementation. The difference between this number and the baseline emissions equals the direct emission reductions of the project. If, for the post-project period, a project-sponsored (financial) mechanism will remain in place and continue to provide support for GHG-reducing investments — which would not happen in the baseline case — the direct post-project emission reductions for these investments should be calculated. Finally, for emission reductions in the post-project period that will have a causal link to GEF intervention, indirect emission reductions should be calculated.
22. Data and assumptions for this indicator are project- or component-specific. Some general assumptions, however, include the following: all analyses are in tons of CO2e; avoided emissions reported are cumulative reductions, calculated for the lifetimes of the investments; there is no discounting for future GHG emission reductions; IPCC global warming potentials of non-CO2 GHG with a 100-year horizon should be used; and emissions factors for the baseline and the GEF alternative should be as specific as possible.
23. For specific guidelines, various methodologies and manuals are available at GEF (2008); STAP (2013); and ITDP (undated).
Type: Outcome indicator
Unit of measurement: tons of CO2e
6.3. Energy saved (megajoules)
Definition: This contextual Sub-Indicator should be used if a project aims to achieve energy savings. It is calculated as the amount of energy use avoided by the intervention over the lifetime of the investment.
Details: Fuel savings should be converted to energy savings by using the net calorific value of the specific fuel. End-use electricity savings should be converted to energy savings by using the conversion factor for the specific supply and distribution system. These energy savings are then totaled over the respective lifetime of the investments (IEA, 2018).
Type: Outcome indicator
Unit of measurement: megajoule (MJ)
6.4. Increase in installed renewable energy capacity per technology (megawatts). Repeat for each technology (drop-down list)
29
Definition: This Sub-Indicator should be reported on if a project aims to increase renewable energy generation or storage capacity. It refers to the rated capacity of a heat or power generating plant or the aggregate potential output of a collection of such. The Sub-Indicator will also account for projects that increase energy storage capacity of grid power for load shifting and variable renewable energy integration or storage of self-generated renewable power for later use. Among others, energy storage capacity may refer to pumped storage; home-, commercial- or grid-scale batteries; and thermal storage.
Details: Disaggregate by type of renewable energy technology (biomass, geothermal, ocean, small hydro, solar photovoltaic, solar thermal, wind power, and storage).
Type: Outcome indicator
Unit of measurement: megawatt (MW)
7. Number of shared water ecosystems (fresh or marine) under new or improved cooperative management
Definition: This indicator captures the commitment of countries to cooperatively manage a shared water system (e.g., river, lake, groundwater, or large marine ecosystem). Projects may cover one or more shared water systems.
Details: The approach has been to count (i) foundational/first International Waters projects that provide support to catalyze a cooperative agenda; and (ii) Strategic Action Plan (SAP)/Transboundary Diagnostic Analysis (TDA) implementation projects, given the guidance on the GEF-6 template (Tables E and F). The proposed indicator in GEF-7 will span shared freshwater and coastal/marine projects. The indicator will not adequately apply to the open oceans/Areas Beyond National Jurisdiction.
The names of the shared water systems should be included as per the picklist, which is taken from UNEP-DHI and UNEP (2016).
Type: Outcome indicator
Unit of measurement: Quantity (number of shared water systems)
24. There are four additional contextual Sub-indicators for Core Indicator 7, as described below.
7.1. Level of Transboundary Diagnostic Analysis and Strategic Action Program formulation and implementation
Definition: This indicator is based on a rating for the level of TDA or SAP formulation and implementation.
Details: Projects provide a rating on a scale of 1 to 4:
30
1 = No TDA/SAP developed 2 = TDA finalized
3 = SAP ministerially endorsed
4 = SAP under implementation.
Type: Output Indicator
Unit of measurement: Rating scale
7.2. Level of Regional Legal Agreements and Regional Management Institution(s) to support its implementation
Definition: This indicator is based on a rating for the level of Regional Legal Agreements or Regional Management Institution(s) (RMI) formulation and implementation.
Details: Projects provide a rating on a scale of 1 to 4:
1 = No regional legal agreement, or neither institutional framework nor RMI in place
2 = Regional legal agreement under development
3 = Regional legal agreement signed and RMI in place
4 = Regional legal agreement ratified and RMI functional
Type: Output Indicator
Unit of measurement: Rating scale (1 to 4)
7.3. Level of national/local reforms and active participation of Inter-Ministerial Committees
Definition: This indicator is based on a rating for the level of national or local reforms and participation in inter-ministerial committees (IMC).
Details: Projects provide a rating on a scale of 1 to 4:
1 = Neither national/local reforms nor IMCs
2 = National/local reforms in preparation, IMCs functional 3 = National/local reforms and IMCs in place
4 = National/local reforms/policies implemented, supported by IMCs.
Type: Output Indicator
Unit of measurement: Rating scale (1 to 4)
31
7.4. Level of engagement in IW: Learn through participation and delivery of key products
Definition: This indicator is based on a rating for the level of engagement in International Waters Learning Exchange and Resource Network (IW:LEARN).
Details: Projects provide a rating on a scale of 1 to 4:
1 = No participation
2 = Website in line with IW:LEARN guidance active
3 = As above, plus strong participation in training/twinning events and production of at least one experience note and one results note
4 = As above, plus active participation of project staff and country representatives at International Waters conferences and the provision of spatial data and other data points via project website.
Type: Output Indicator
Unit of measurement: Rating scale
8. Globally over-exploited fisheries moved to more sustainable levels (metric tons)
Definition: This indicator refers to globally over-exploited fisheries having been moved to more sustainable levels (FAO, 2012). Overexploited (FAO, undated) is defined as follows: “The fishery is being exploited above a level that is believed to be unsustainable in the long term, with no potential room for further expansion and a higher risk of stock depletion/collapse.”
25. There is no strict relationship between Sub-Indicator 5.1 related to certified fisheries and this Core Indicator. Certification is only one of several activities that may address over-exploitation of fisheries.
Details: Based on data from FAO (2016), 31.4 percent (25.6 million metric tons) of marine capture fisheries is overexploited/overfished. GEF-7 investments plan to address at least 3.8 million tons of these fisheries.
26. The name of the fishery targeted, the source for the estimate of tonnage, and the initial justification for considering the fishery to be overexploited should be provided.
Type: Outcome Indicator
Unit of measurement: Volume (metric tons)
32
9. Reduction, disposal/destruction, phase out, elimination, and avoidance of chemicals of global concern and their waste in the environment and in processes, materials, and products (metric tons of toxic chemicals reduced)
27. This indicator will be reported as the aggregate total (in metric tons) of three Sub-Indicators (9.1, 9.2, and 9.3). Two additional Sub-Indicators (9.4 and 9.5) are available to provide additional context. Guidance is provided in Section 9.1 to Section 9.5.
9.1. Solid and liquid persistent organic pollutants (POPs) and POPs containing materials and products removed or disposed (POPs type)35
Definition: This indicator tracks the progress in the elimination or disposal of persistent organic pollutants (POP) and POP-containing materials.
Details: Projects should report the amount of POP eliminated or reduced, broken down by type of POP. For disposal projects, information on the technology for and location of disposal should also be included. Finally, project leads should provide details on the methodology used to calculate the quantities of POP.
Type: Outcome Indicator
Unit of measurement: Weight (metric tons)
9.2. Quantity of mercury reduced
Definition: This indicator captures the amount of mercury36 reduced.
Details: Projects should report the amount of mercury, together with details of the approach and the scale at which the figure is reported (e.g., project site, city, province). Project leads should provide disaggregated information on the reduced amount of emissions from different sources or activities.
Type: Outcome Indicator
Unit of measurement: Weight (metric tons)
9.3. Hydrochlorofluorocarbons reduced/phased out
Definition: This indicator captures the amount of ozone depletion potential (ODP) and hydrochlorofluorocarbons (HCFC) (SEPA, undated) reduced/phased out. The final ODP
35 For POPs, the following websites provide further information: http://web.unep.org/chemicalsandwaste/persistent-organic-pollutants-popshttp://www.who.int/ceh/capacity/POPs.pdf http://web.unep.org/chemicalsandwaste/what-we-do/science-and-knowledge/persistent-organic-pollutants-pops/pops-monitoringhttp://chm.pops.int/Convention/Media/Factsheets/tabid/527/language/en-US/Default.aspx 36 For further reference: UNEP’s global mercury assessment http://web.unep.org/chemicalsandwaste/what-we-do/technology-and-metals/mercury/global-mercury-assessment
33
(UNEP, undated) figure at project completion should be subtracted from the baseline ODP figure to determine the reduction.
Details: Project leads should report the amount of ODP HCFCs reduced/phased out, together with the details of the approach and the scale at which the figure is reported (e.g., project site, city, province). Project leads should provide disaggregated information on the amount of reduction in emissions from different sources or from various activities. Common HCFCs includes HCFC-22, HCFC-141b, HCFC-142b, HCFC-123, HCFC-124, HCFC-225ca and 225cb, and HCFC-21.
Type: Outcome Indicator
Unit of measure: Weight (metric tons)
9.4. Number of countries with legislation and policy implemented to control chemicals and waste
Definition: This indicator seeks to count the number of countries that are targeting the development of new or improved legislation and policies relating to the control of chemicals and waste because of GEF support.
Details: In projects that are developing new or improved legislation to control GEF-relevant chemicals and their waste, the project leads should indicate legislation being contemplated and its intended impact.
Type: Output Indicator
Unit of measure: Quantity (number of countries) and descriptive text on the type of legislation being developed or improved
9.5. Number of low-chemical/non-chemical systems implemented, particularly in food production, manufacturing, and cities
Definition: This indicator captures the number of low-chemical or non-chemical systems/technologies implemented as a direct result of the GEF project.
Details: In projects phasing out GEF-relevant chemicals, the project proponents will provide information on the type and number of proposed technologies in the project and the expected impact. These could include use of non-chemical or low-chemicals technologies or techniques such as replacement of POPS pesticides by integrated pesticide management or elimination of POPs by substitution by green chemicals.
Type: Output Indicator
Unit of measure: Quantity (number of systems/technologies) and a description of the technologies or techniques.
34
10. Reduction, avoidance of emissions of POPs to air from point and non-point sources (grams of toxic equivalent gTEQ)
Definition: This indicator captures the reduction in emissions of POPs to air. An estimated reduction target is required at the time the project is proposed. The target is based on the baseline calculation of the emissions against the expected reductions that will result from the implementation of the project. At project completion, a final emissions number — in grams of toxic equivalent (gTEQ) — should be subtracted from the baseline emissions number to determine the reduction.
Details: Projects should report the amount of emissions of POPs to air, together with details of the approach used to calculate the figure and the scale at which the figure is reported (e.g., project site, city, province). Project leads should provide information on the amount of emissions from different chemicals listed in Annex C of the Stockholm Convention, as well as an aggregate figure of overall POPs gTEQ reduced.
28. Note that two additional Sub-Indicators are available to provide context in case they are relevant to the project.
Type: Outcome Indicator
Unit of measurement: Weight (grams of toxic equivalent [gTEQ])
10.1. Number of countries with legislation and policy implemented to control emissions of POPs to air
Definition: This indicator captures the number of countries targeted in the project that have legislation and policies implemented to control emissions of POPs to air.
Details: In projects that are developing new or improved legislation to control POPs emissions to air from unintentional sources, the project leads should indicate legislation being contemplated and its intended impact.
Type: Output Indicator
Unit of measure: Quantity (number of countries) and description of the legislation.
10.2. Number of emission control technologies/practices implemented
Definition: This indicator captures the number of emission control technologies or practices implemented as a direct result of the GEF project.
Details: In projects that are reducing POPS emissions to air through implementation of best available techniques (BAT)/best environmental practices (BEP), the project proponents will provide information on the type and number of these technologies or practices proposed in the project and the expected impact.
35
Type: Output Indicator
Unit of measure: Quantity (number of technologies or practices) and description of the technologies or practices.
11. Number of direct beneficiaries disaggregated by gender as co-benefit of GEF investment
Definition: This indicator captures the total number of direct beneficiaries including the proportion of women beneficiaries.
Details: This indicator captures the number of individual people who receive targeted support from a given GEF project/activity and/or who use the specific resources that the project maintains or enhances. Support is defined as direct assistance from the project/activity. Direct beneficiaries are all individuals receiving targeted support from a given project. Targeted support is the intentional and direct assistance of a project to individuals or groups of individuals who are aware that they are receiving that support and/or who use the specific resources.
29. Examples in the GEF context include:
• A project facilitates access to credit to fund operations of organic coffee farmers: support targets participating farmers, who are direct beneficiaries.
• A protected area (PA) project strengthens institutional capacity of a national PA system, improving human resource management, creating incentive mechanisms for staff and ensuring adequate budget for operation: support is targeted at all relevant staff within the PA agency, who are direct beneficiaries.
• A project facilitates transition to low carbon urban development through capacity building of municipality managers and workers, as well as improving access to innovative finance options for participating municipalities: staff participating in
Beneficiaries may receive monetary and nonmonetary benefits. Examples of monetary benefits may include, but are not limited to, increased income due to government policies relating to climate change mitigation, such as tax benefits or access to loans, payments for avoided emissions or carbon sequestration, job creation, and payment by local governments for other ecosystem services that also achieve climate change mitigation results (e.g., implementation of a specific activity). Examples of nonmonetary benefits may include, but are not limited to, access to programs, services, or education; infrastructure development; health benefits; access to markets; preferential investment or finance terms; land titling or registration; increased access to environmental services; newly defined rights or authorities; protection of traditional livelihoods and customary rights; and environmental and other benefits from avoided deforestation and degradation, improved afforestation, or increased productivity from climate-smart agricultural practices. Individuals receiving benefits from more than one sustainable landscapes activity, or receiving multiple benefits from a single activity, should be counted once per fiscal year.
36
training within the municipal agency and end users who benefit from a lower utility bill are direct beneficiaries.
Gender: Reporting disaggregated by sex (male, female) is mandatory. This may be estimated using the best available data on the composition of sex for the relevant population.
Type: Cumulative, annual in-year total number of beneficiaries summed to total over the project/program implementation period.
Unit of measure: The indicator is expressed in absolute numbers of direct beneficiaries.
37
References
BRACED (Building Resilience and Adaptation to Climate Extremes and Disasters). Undated. “Building Resilience and Adaptation to Climate Extremes and Disasters (BRACED) Programme.” London: BRACED. Available at https://assets.publishing.service.gov.uk/government/uploads/system/uploads/attachment_data/file/251942/guidance-definition-direct-beneficiaries.pdf.
CBD (Convention on Biological Diversity). Undated. “Aichi Biodiversity Targets”. (Online.)
Montreal: CBD. Available at www.cbd.int/sp/targets. CEISIN (Center for International Earth Science Information Network). 1997−2018. “What Is
Sustainable Land Management?” New York: Earth Institute at Columbia University. Available at www.ciesin.org/lw-kmn/slm/slm.html.
FAO (Food and Agriculture Organization of the United Nations). Undated. “General Situation of
World Fish Stocks.” Brief. Rome: FAO. Available at www.fao.org/newsroom/common/ecg/1000505/en/stocks.pdf.
_____. 2012. State of the World Fisheries and Aquaculture. Rome: FAO. Available at
www.fao.org/3/a-i2727e.pdf. _____. 2016. The State of World Fisheries and Aquaculture. Rome: FAO. Available at
www.fao.org/3/a-i5555e.pdf. Future Terrains. 2018. “What is Landscape Restoration? (Online.) Available at
https://futureterrains.org/what-is-landscape-restoration. GEF (Global Environment Facility). 2008. “Manual for Calculating GHG Benefits of GEF Projects:
Energy Efficiency and Renewable Energy Projects.” GEF/C.33/Inf.18. Washington, DC: GEF Council. Available at www.thegef.org/sites/default/files/council-meeting-documents/C.33.Inf_.18_Climate_Manual_1.pdf.
_____. 2010. The GEF Monitoring and Evaluation Policy 2010. Washington, DC: GEF. Available at
www.thegef.org/sites/default/files/documents/ME_Policy_2010_0.pdf. _____. 2015. Instrument for the Establishment of the Restructured Global Environment Facility.
Washington, DC: GEF. Available at www.thegef.org/sites/default/files/publications/GEF_Instrument-Interior-March23.2015_1.pdf.
_____. 2017. “Guidelines for Project and Program Cycle Policy.” GEF/C.52/Inf.06/Rev.01. 52nd
GEF Council Meeting, held on May 23−25, 2017, in Washington, DC. Available at
38
www.thegef.org/sites/default/files/documents/EN_GEF.C.52.Inf_.06.Rev_.01_Guidelines_on_the_Project_and_Program_Cycle_Policy.pdf.
GEF-IEO. 2017. Review of Results-Based Management in the GEF. Washington, DC: Global
Environment Facility Independent Evaluation Office. Available at www.gefieo.org/sites/default/files/ieo/evaluations/files/rbm-study-2017_2.pdf.
HCV Resource Network. 2005−18. “What are High Conservation Values?” (Online.) Oxford,
United Kingdom: HCV Resource Network. Available at www.hcvnetwork.org/contact . IEA (International Energy Agency). 2018. Statistics Database (online). Paris: IEA. Available at
www.iea.org/statistics/statisticssearch/. IPCC (Intergovernmental Panel on Climate Change). 2012. ITDP (Institute for Transportation and Development Policy). Undated. Manual for Calculating
Greenhouse Gas Benefits of Global Environment Facility Transportation Projects. New York: ITDP. Available at www.climate-eval.org/sites/default/files/blogs/GEF_TEEMP%20Manual_GHGbenefits_Final.pdf
IUCN (International Union for Conservation of Nature). 2018. “World Database on Protected
Areas.” (Online Database.) Gland, Switzerland: IUCN. Available at www.iucn.org/theme/protected-areas/our-work/world-database-protected-areas.
_____. 2016. A Global Standard for the Identification of Key Biodiversity Areas. Version 1.0.
Gland, Switzerland: IUCN. Available at https://portals.iucn.org/library/sites/library/files/documents/2016-048.pdf.
Protected Planet. 2014−2018. “Management Effectiveness Tracking Tool (METT).” (Online.)
Available at www.protectedplanet.net/c/protected-areas-management-effectiveness-pame/management-effectiveness-tracking-tool.
SEPA (Scottish Environment Protection Agency). Undated. “Hydrochlorofluorocarbons
(HCFCs).” (Online.) Available at http://apps.sepa.org.uk/spripa/Pages/SubstanceInformation.aspx?pid=120
STAP (Scientific and Technical Advisory Panel). 2011a. Hypoxia and Nutrient Reduction in the
Coastal Zone. Advice for Prevention, Remediation and Research. A STAP Advisory Document. Washington, DC: Global Environment Facility. Available at www.stapgef.org/sites/default/files/stap/wp-content/uploads/2013/05/Hypoxia-and-Nutrient-Reduction.pdf.
_____. 2011b. Marine Debris as a Global Environmental Problem: Introducing a Solutions Based
Framework Focused on Plastic. A STAP Advisory Document. Washington, DC: Global
39
Environment Facility. Available at www.thegef.org/sites/default/files/publications/STAP_MarineDebris_-_website_1.pdf.
_____. 2013. Calculating Greenhouse Gas Benefits of the Global Environment Facility Energy
Efficiency Projects. Version 1.0. Washington, DC: Global Environment Facility. Available at www.thegef.org/sites/default/files/publications/GEF_EE_Methodology_v1.0_2.pdf
Stolton, S. and N. Dudley. 2016. METT Handbook: A Guide to Using the Management
Effectiveness Tracking Tool (METT. Woking, United Kingdom: World Wildlife Fund. Available at www.protectedplanet.net/system/comfy/cms/files/files/000/000/045/original/WWF_METT_Handbook_2016_FINAL.pdf.
Teja Tscharntke et al. 2014. “Conserving Biodiversity Through Certification of Tropical
Agroforestry Crops at Local and Landscape Scales”. Vol. *(1): 1−13. Wiley Online Library. Available at https://onlinelibrary.wiley.com/doi/full/10.1111/conl.12110.
UNEP (United Nations Environment Programme (now UN Environment)). Undated. “Ozone
Depleting Potential (ODP) of Refrigerants: Which Particular Values are Used?” Ozonaction Fact Sheet OZFS/16/4-2. Nairobi: UN Environment.
UNEP-DHI and UNEP (UN Environment and DHI Group). 2016. Transboundary River Basins:
Status and Trends. Nairobi: UN Environment. Available at http://twap-rivers.org/assets/GEF_TWAPRB_FullTechnicalReport.pdf.
UNEP-WCMC (UN Environment World Conservation Monitoring Centre). 2011. Review of the
Biodiversity Requirements of Standards and Certification Schemes: A Snapshot of Current Practice. CBD Technical Series No. 63. (Online.) Montreal: Secretariat of the Convention on Biological Diversity World Trade Centre. Available at www.unep-wcmc.org/system/dataset_file_fields/files/000/000/086/original/rep_cbd-ts-63-en.pdf?1398440307.
USEPA (United States Environmental Protection Agency). 2017. “Hypoxia 101: What is Hypoxia
and What Causes It?” Mississippi River/Gulf of Mexico Hypoxia Task Force. Washington, DC: USEPA. Available at https://www.epa.gov/ms-htf/hypoxia-101.
World Bank. 2016. The Little Green Data Book.Washington, DC: World Bank. Available at
https://openknowledge.worldbank.org/bitstream/handle/10986/24543/9781464809286.pdf.
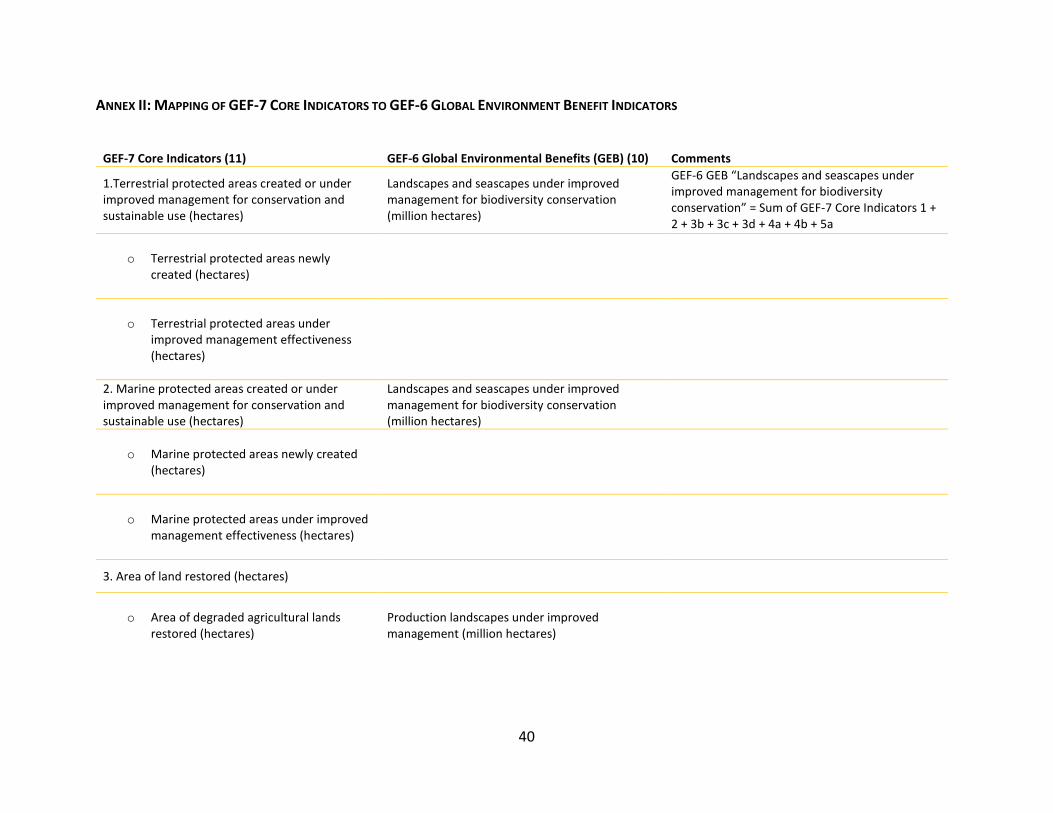
40
ANNEX II: MAPPING OF GEF-7 CORE INDICATORS TO GEF-6 GLOBAL ENVIRONMENT BENEFIT INDICATORS
GEF-7 Core Indicators (11) GEF-6 Global Environmental Benefits (GEB) (10) Comments
1.Terrestrial protected areas created or under improved management for conservation and sustainable use (hectares)
Landscapes and seascapes under improved management for biodiversity conservation (million hectares)
GEF-6 GEB “Landscapes and seascapes under improved management for biodiversity conservation” = Sum of GEF-7 Core Indicators 1 + 2 + 3b + 3c + 3d + 4a + 4b + 5a
o Terrestrial protected areas newly created (hectares)
o Terrestrial protected areas under improved management effectiveness (hectares)
2. Marine protected areas created or under improved management for conservation and sustainable use (hectares)
Landscapes and seascapes under improved management for biodiversity conservation (million hectares)
o Marine protected areas newly created (hectares)
o Marine protected areas under improved management effectiveness (hectares)
3. Area of land restored (hectares)
o Area of degraded agricultural lands restored (hectares)
Production landscapes under improved management (million hectares)
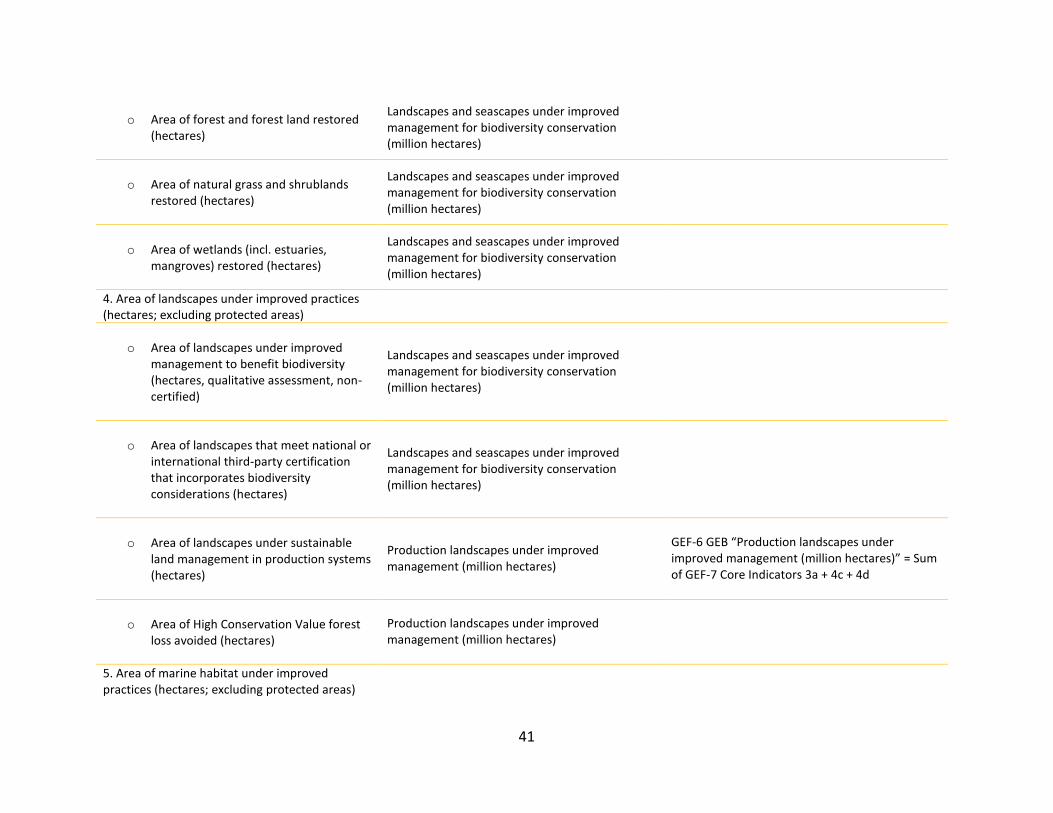
41
o Area of forest and forest land restored (hectares)
Landscapes and seascapes under improved management for biodiversity conservation (million hectares)
o Area of natural grass and shrublands restored (hectares)
Landscapes and seascapes under improved management for biodiversity conservation (million hectares)
o Area of wetlands (incl. estuaries, mangroves) restored (hectares)
Landscapes and seascapes under improved management for biodiversity conservation (million hectares)
4. Area of landscapes under improved practices (hectares; excluding protected areas)
o Area of landscapes under improved management to benefit biodiversity (hectares, qualitative assessment, non-certified)
Landscapes and seascapes under improved management for biodiversity conservation (million hectares)
o Area of landscapes that meet national or international third-party certification that incorporates biodiversity considerations (hectares)
Landscapes and seascapes under improved management for biodiversity conservation (million hectares)
o Area of landscapes under sustainable land management in production systems (hectares)
Production landscapes under improved management (million hectares)
GEF-6 GEB “Production landscapes under improved management (million hectares)” = Sum of GEF-7 Core Indicators 3a + 4c + 4d
o Area of High Conservation Value forest loss avoided (hectares)
Production landscapes under improved management (million hectares)
5. Area of marine habitat under improved practices (hectares; excluding protected areas)
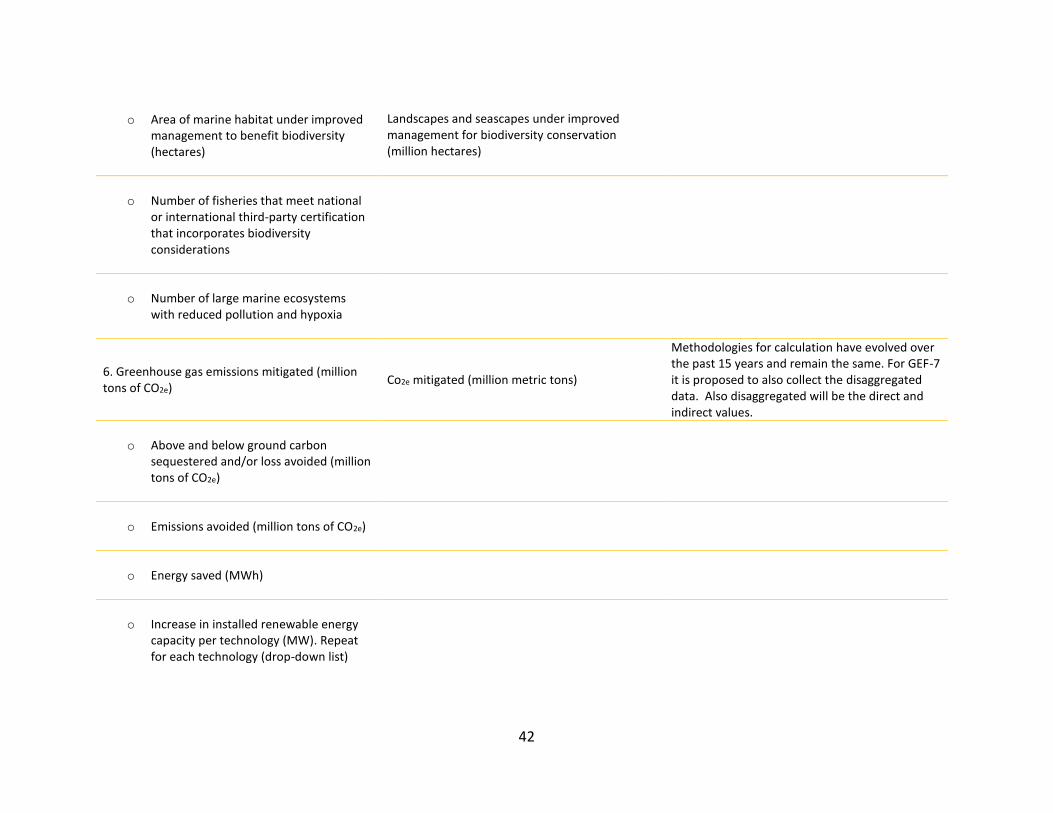
42
o Area of marine habitat under improved management to benefit biodiversity (hectares)
Landscapes and seascapes under improved management for biodiversity conservation (million hectares)
o Number of fisheries that meet national or international third-party certification that incorporates biodiversity considerations
o Number of large marine ecosystems with reduced pollution and hypoxia
6. Greenhouse gas emissions mitigated (million tons of CO2e)
Co2e mitigated (million metric tons)
Methodologies for calculation have evolved over the past 15 years and remain the same. For GEF-7 it is proposed to also collect the disaggregated data. Also disaggregated will be the direct and indirect values.
o Above and below ground carbon sequestered and/or loss avoided (million tons of CO2e)
o Emissions avoided (million tons of CO2e)
o Energy saved (MWh)
o Increase in installed renewable energy capacity per technology (MW). Repeat for each technology (drop-down list)
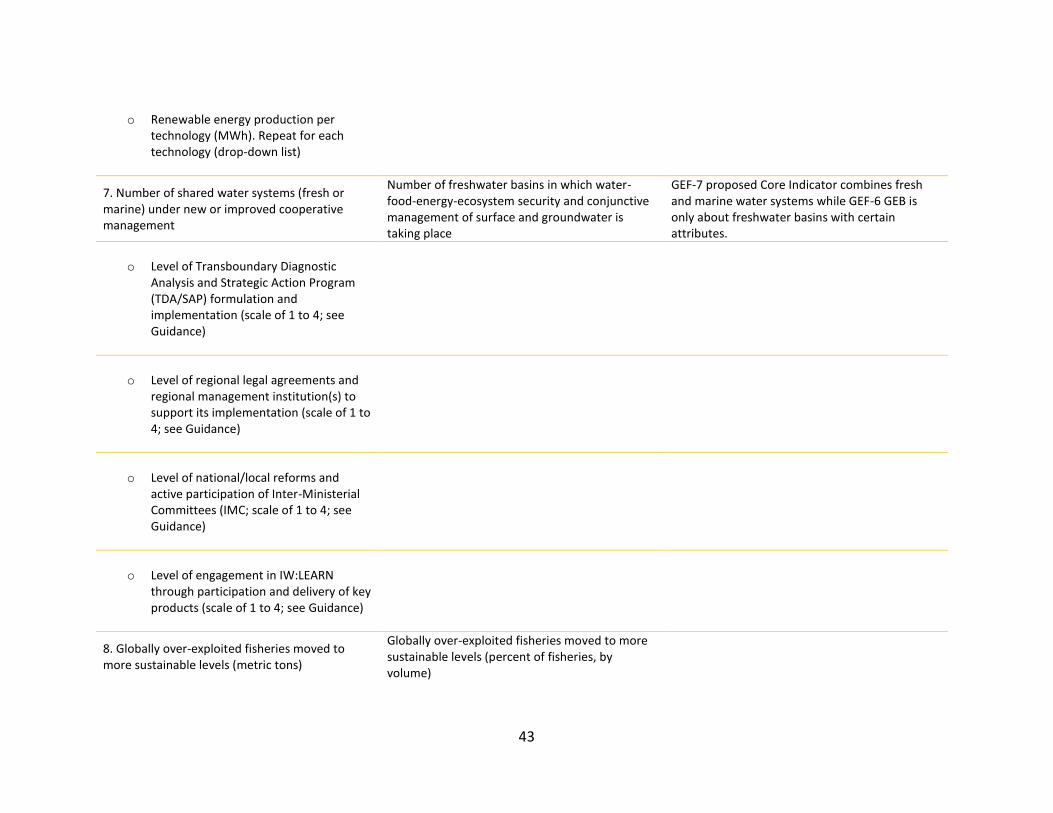
43
o Renewable energy production per technology (MWh). Repeat for each technology (drop-down list)
7. Number of shared water systems (fresh or marine) under new or improved cooperative management
Number of freshwater basins in which water-food-energy-ecosystem security and conjunctive management of surface and groundwater is taking place
GEF-7 proposed Core Indicator combines fresh and marine water systems while GEF-6 GEB is only about freshwater basins with certain attributes.
o Level of Transboundary Diagnostic Analysis and Strategic Action Program (TDA/SAP) formulation and implementation (scale of 1 to 4; see Guidance)
o Level of regional legal agreements and regional management institution(s) to support its implementation (scale of 1 to 4; see Guidance)
o Level of national/local reforms and active participation of Inter-Ministerial Committees (IMC; scale of 1 to 4; see Guidance)
o Level of engagement in IW:LEARN through participation and delivery of key products (scale of 1 to 4; see Guidance)
8. Globally over-exploited fisheries moved to more sustainable levels (metric tons)
Globally over-exploited fisheries moved to more sustainable levels (percent of fisheries, by volume)
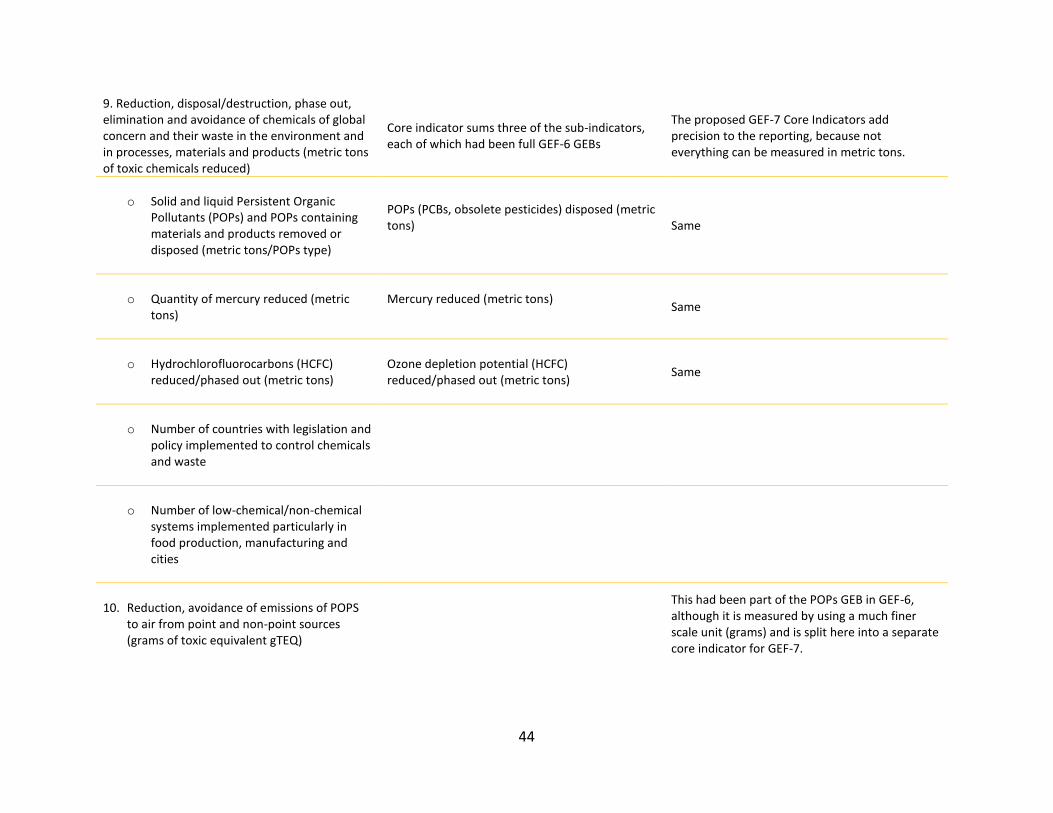
44
9. Reduction, disposal/destruction, phase out, elimination and avoidance of chemicals of global concern and their waste in the environment and in processes, materials and products (metric tons of toxic chemicals reduced)
Core indicator sums three of the sub-indicators, each of which had been full GEF-6 GEBs
The proposed GEF-7 Core Indicators add precision to the reporting, because not everything can be measured in metric tons.
o Solid and liquid Persistent Organic Pollutants (POPs) and POPs containing materials and products removed or disposed (metric tons/POPs type)
POPs (PCBs, obsolete pesticides) disposed (metric tons)
Same
o Quantity of mercury reduced (metric tons)
Mercury reduced (metric tons)
Same
o Hydrochlorofluorocarbons (HCFC) reduced/phased out (metric tons)
Ozone depletion potential (HCFC) reduced/phased out (metric tons)
Same
o Number of countries with legislation and policy implemented to control chemicals and waste
o Number of low-chemical/non-chemical systems implemented particularly in food production, manufacturing and cities
10. Reduction, avoidance of emissions of POPS to air from point and non-point sources (grams of toxic equivalent gTEQ)
This had been part of the POPs GEB in GEF-6, although it is measured by using a much finer scale unit (grams) and is split here into a separate core indicator for GEF-7.
45
o Number of countries with legislation and policy implemented to control emissions of POPs to air
o Number of emission control technologies/practices implemented
11. Number of direct beneficiaries disaggregated by gender as co-benefit of GEF investment