Embed Size (px)
Citation preview
GENDER EQUALITY GLOBAL REPORT & RANKING 2018 EDITION

2GENDER EQUALITY GLOBAL REPORT & RANKING - 2018 EDITION
WHY RANKING COMPANIES IS IMPORTANT
Measuring how well companies do in offering equal opportunities to both genders is an important way to tackle global poverty and inequality.
Women and girls do not receive the same life chances as men and boys, often excluded from education, unable to obtain the health care they need, and in many countries still denied political and legal rights. Gender discrimination remains one of the prime causes of economic marginalisation.
An important part of overcoming these obstacles is to ensure that women share fairly in the economic life of a country by taking part in the workforce on a more equal footing with men, and at the same rates of pay. Moving towards this will play a vital role in helping the world achieve the UN’s Sustainable Development Goals by 2030, reducing poverty in every nation, and improving life for women, for their families, communities and countries.
INTRODUCTION...................................4
KEY FINDINGS............................................5
2018 EQUILEAP RANKING TOP 200....7
INSIGHTS PER COUNTRY..............................15
TOP 10 COMPANIES PER COUNTRY...............17
INSIGHTS PER REGION...........................................20
INSIGHTS PER SECTOR................................................22
METHODOLOGY...................................................................25
SCORECARD.................................................................................28
ABOUT EQUILEAP...........................................................................29
ACKNOWLEDGMENTS......................................................................30
CONTENTS
Th
is r
ep
ort
is
pri
nte
d o
n 1
00
% r
ecyc
led
fib
re.
Partners using Equileap’s data:

4GENDER EQUALITY GLOBAL REPORT & RANKING - 2018 EDITION
INTRODUCTION
The past year has been one of those pivotal moments that don’t come often in a lifetime, when genuine social change seems to be underway in how women are regarded and treated at work. The #MeToo and Times Up movements, and the UK’s efforts to make its “obscene” gender pay gap transparent, have all had an impact.
The headline from this year’s edition is that we have been able to track some positive changes in the data, but progress is patchy. At present, advances are limited largely to com-panies like those in Equileap’s Top 200 that choose to be world leaders in this field. There are not many signs that change is being em-bedded in global corporate culture across all sectors and countries.
It is Equileap’s mission to accelerate gender equality in the workplace as a powerful and under-used way of tackling poverty and ine-quality. Economic justice for women underlies the achievement of the UN’s Sustainable De-velopment Goals, the universal call to action for governments, corporations and civil so-ciety to end poverty and protect the planet.
Equileap assesses how good intentions in the corporate sector translate into action. It measures which companies are making a real difference in gender balance, gaining from the ‘gender dividend’ - the positive impact identified by independent research showing that gender diverse companies tend to pro-duce above trend returns, have lower risks and better safety records.
The Top 200 companies are responding to the challenge posed by the powerful advoca-cy campaigns and the growing awareness of the economic injustice facing women. We see the impact of this in sectors such as Technolo-gy where there has been a leap in scores, and in countries such as Australia, where clear re-
porting regulations are making a measurable difference to overall corporate performance.
This year the highest scoring companies in the world have increased their grade to a B+ from a B in 2017, with the highest ranking companies now scoring 71% of the maximum points, up from 63% last year. The average score of all companies in the Top 200 is up from 50% last year, to 53% this year. We are also seeing a better gender balance in board and senior executive teams. However, every company in the world still has a great deal of ground to make up.
Equileap is the global leader in providing data and insights on gender equality in public companies, and this data is making an im-pact. There is now USD 600m in investment funds powered by our data, and our research is being used to add a broad and deep gen-der lens to sustainable and responsible in-vestments around the world.
We are proud to present the second edition of this global report and we hope companies, employees, investors and policy makers will make use of the extensive data that under-lies this report so that they can be part of a strategy of change to accelerate gender pa-rity worldwide.
DIANA VAN MAASDIJK
Chief Executive and Co-Founder
JO ANDREWSDirector of Social
Impact and Co-Founder
Grade
C C+ B- B B+0
20
40
60
80
100
120
B+A+AA- B B- C+ C
0 0 0
77
60
38
17
8
0
10
20
30
40
50
60
70
80
5GENDER EQUALITY GLOBAL REPORT & RANKING - 2018 EDITION
INTRODUCTION KEY FINDINGS
OVERALL SCORES
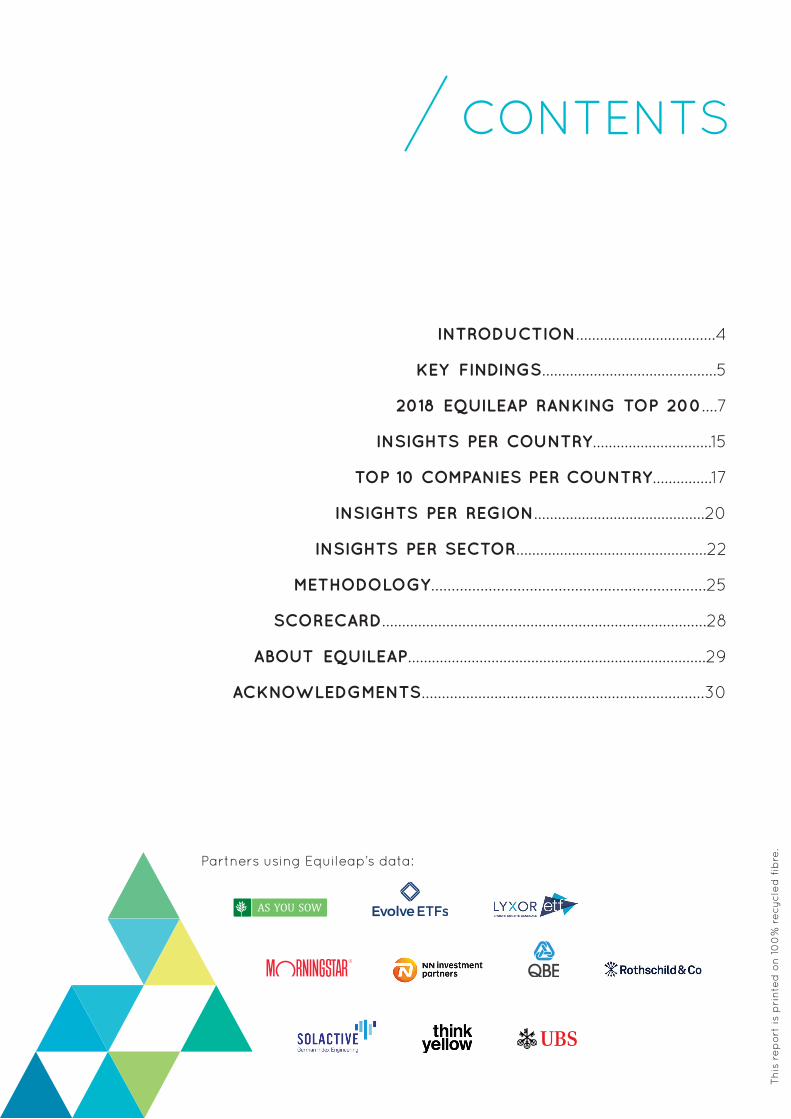
There has been an overall improvement in performance amongst companies ranked in Equileap’s Global Top 200 in 2018 compared to 2017 (See graph 1).
The top score in this year’s Gender Equality Global Report and Ranking is 71%, compared to 63% last year. There are now 8 companies graded with a B+, whereas in 2017 the highest grade was a B.
COMPARISON OF TOP 200 GRADES 2017 AND 2018 Graph 1
2018 TOP 200 / NUMBER OF COMPANIES BY GRADEGraph 2
2017
2018
The average grade for Top 200 companies has increased from C to C+ and the average score from 50% to 53%.
The data shows that the number of companies with policies in place to combat sexual harassment has increased, particularly in North American companies, suggesting that recent publicity and advocacy is having an impact and that more firms are beginning to address gender based violence at work.
Graph 2 shows the breakdown of companies’ grades in the Top 200 with the lowest grade standing at C.
However, looking at the overall data sample researched in depth this year, (the best one third of companies out of a universe of 3,206) the lowest score was 26%, or Grade E. This shows you how much every large company in the world still has to gain from gender diversity to reap the benefit of the ‘gender dividend’ – the opportunity to achieve above trend rates of return, with lower levels of risk.
GENDER BALANCE AT ALL LEVELS
Top 200 companies have a significantly better gender balance at all levels compared to the rest of those researched.
TOP 200 % COM-PARISONS
BOARD EXECU-TIVES
SENIOR MANAGE-
MENT
WORK-FORCE
Top 200 34.3 25.6 31.9 41.7
Data sample*
27.5 16.3 22.4 37.7
TOTAL SAMPLE
28.7 18.0 25.2 38.5
* Excluding Top 200
6GENDER EQUALITY GLOBAL REPORT & RANKING - 2018 EDITION
There has been a jump in the proportion of women holding board and executive roles in Top 200 companies. On average 34% of board roles are now held by women in these companies, compared to 30% in the Top 200 last year, and 26% of executive roles, up from 20% in 2017.
The three companies from the data sample that have the greatest levels of gender balance are: Tele2, Glaxosmithkline, and Rea, all of which scored 93% of available marks for the category: Gender Balance in the Leadership and Workforce. However, not a single company in the data sample managed to achieve a gender balance (between 40% and 60% of each gender) at every level of the company from board-room to shop-floor.
PAY PARITY AND PARENTAL LEAVE
Only 5 companies in the full data sample published specific data showing that they have achieved equal pay in each of at least 3 bands across the company, and 27 companies published data showing no overall gender pay gap in their organisations. Only 2 companies, General Motors and Starhub reported that they could do both (See page 14). 132 companies in the Top 200 reach
the International Labour Organisation’s recommendation of providing at least 14 weeks of paid parental leave to primary carers. The average paid leave provided by all Top 200 companies for primary carers is 15.2 weeks compared to 11.2 weeks in the data sample.
118 companies in the Top 200, give a minimum of 2 weeks paid parental leave to secondary carers. The average paid leave for secondary carers across Top 200 companies is 5 weeks, compared to an average of 1.9 weeks in the rest of the data-sample.
INSIGHTS PER COUNTRY
The best performing countries are Norway, 43% of Norwegian companies in the data sample ranked in the Top 200, followed by Israel with 40%, Belgium with 38% and Australia with 36% of companies.
By comparison, Hong Kong had only 2% of eligible companies from the data sample reaching the Top 200, Canada 9% and Denmark 10%.
Austria, Japan and Ireland are the only countries amongst the 23 researched with NO companies in the Top 200. Ireland is alone in having NO companies performing well enough to be included in the full data sample in 2018.
INSIGHTS PER SECTOR
The top 3 performing sectors are Communications - with 32% of companies from the data sample reaching the Top 200 - Financial with 27% and Utilities with 21%. This is the same order as last year. Technology companies are doing better
than last year with 14% of eligible companies now reaching the Top 200, an improvement of 11 percentage points.
The 3 lowest performing sectors are Energy, with 6% of companies from the data sample reaching the Top 200, Industrial with 9% and Consumer Cyclical with 11%.
It’s not just good for society though, companies embracing equality tend to perform better too.
Clarisse Djabbari, Deputy Head of Lyxor ETFs & Indexes
MA
KIN
G P
ROGRESS TOWARD
S
2018GENDER EQUALIT
Y
7GENDER EQUALITY GLOBAL REPORT & RANKING - 2018 EDITION
The Equileap Ranking is unique in assessing the progress of public companies towards gender equality based on 19
criteria. This year Equileap re-searched and ranked all public com-
panies with a market capitalisation of more than USD 2 billion in 23 developed countries as of January 2018 - 3,206 companies in to-tal, which make up the current Equileap Uni-verse.
Each company was put through Equileap’sresearch process in a series of stages, first-ly a primary ranking was created using a li-mited number of criteria. The best one third of the companies from this step were then researched in depth by Equileap’s team, to compile the 2018 Equileap Top 200 ranking (See Methodology pages 25-27).
All data is drawn from publicly available ma-terial. We strongly believe that transparency is a vital first step to achieving greater gen-der equality, but it will only help change be-haviour if employees, investors and govern-
Gender equality is more than a goal in itself, it is a pre-condition for meeting the challenge of reducing poverty, promoting sustainable development and building good governance.
Kofi Annan, 7th Secretary-General of the United Nations
ments use this information to hold companies to account. Equileap’s methodology creates a benchmark and makes it possible to compare the performance of public companies across all sectors and in all the countries researched.
Here is the 2018 Equileap’s Top 200 ranking of companies that lead the way globally in reaching gender equality. It is a considerable achievement to be ranked here - and this is usually the result of many years of focus, rather than a sudden decision to tick boxes. We congratulate each of them, while noting that even the very best still has a great deal more to gain from the gender dividend.
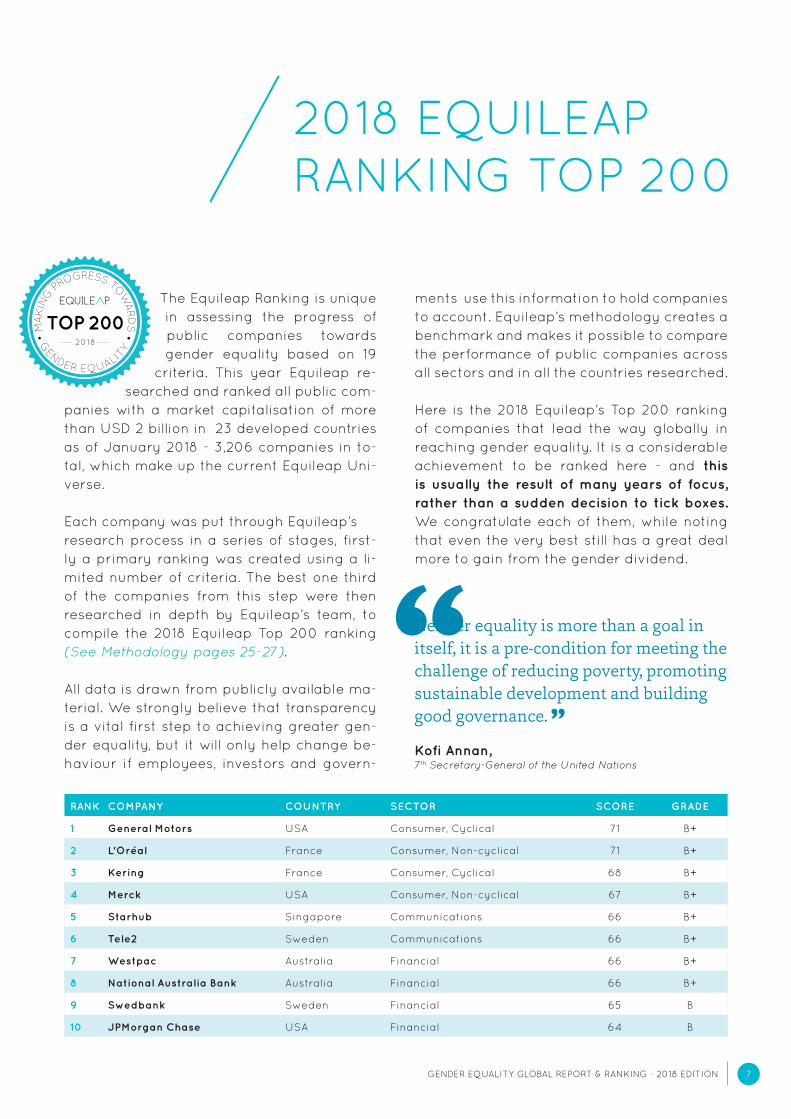
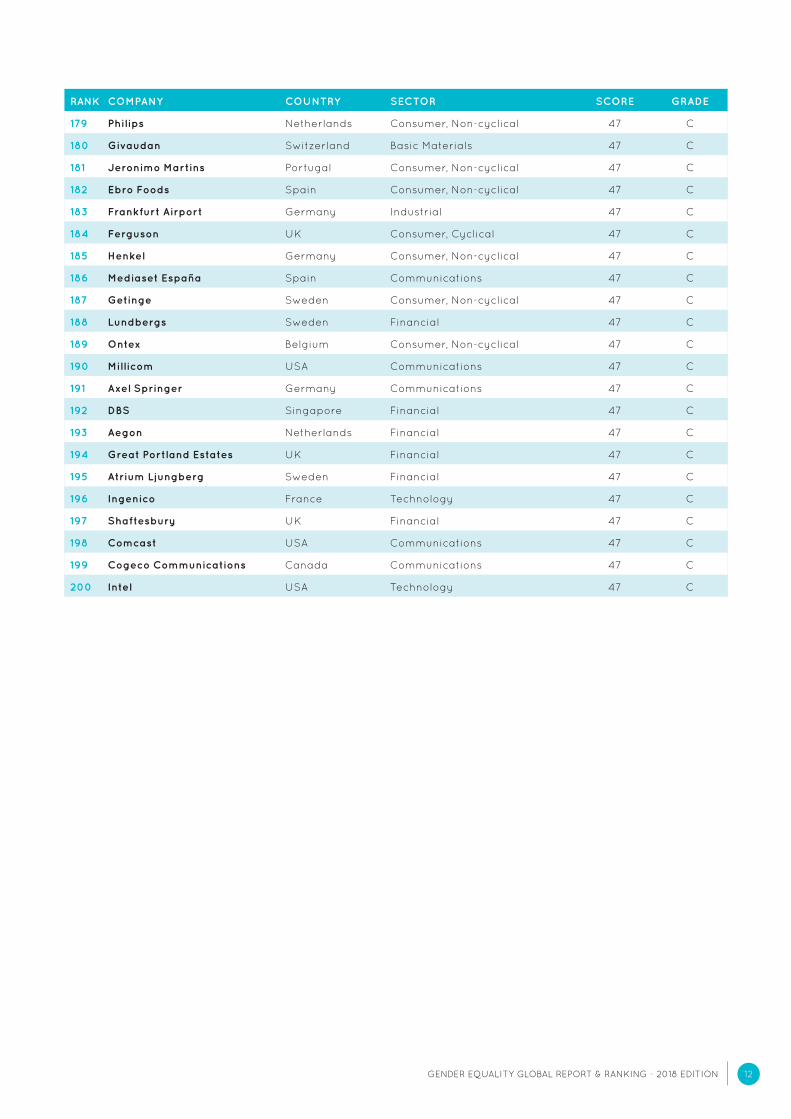
2018 EQUILEAP RANKING TOP 200
RANK COMPANY COUNTRY SECTOR SCORE GRADE
1 General Motors USA Consumer, Cyclical 71 B+
2 L'Oréal France Consumer, Non-cyclical 71 B+
3 Kering France Consumer, Cyclical 68 B+
4 Merck USA Consumer, Non-cyclical 67 B+
5 Starhub Singapore Communications 66 B+
6 Tele2 Sweden Communications 66 B+
7 Westpac Australia Financial 66 B+
8 National Australia Bank Australia Financial 66 B+
9 Swedbank Sweden Financial 65 B
10 JPMorgan Chase USA Financial 64 B

8GENDER EQUALITY GLOBAL REPORT & RANKING - 2018 EDITION
RANK COMPANY COUNTRY SECTOR SCORE GRADE
11 Diageo UK Consumer, Non-cyclical 64 B
12 Stora Enso Finland Basic Materials 63 B
13 Stockland Australia Financial 63 B
14 Société Générale France Financial 63 B
15 Schneider Electric France Industrial 63 B
16 Citigroup USA Financial 62 B
17 WPP UK Communications 62 B
18 UBS Switzerland Financial 61 B
19 Gjensidige Forsikring Norway Financial 61 B
20 Television Francaise France Communications 61 B
21 Tieto Finland Technology 60 B
22 Commonwealth Bank Of Australia
Australia Financial 60 B
23 Bank Of America USA Financial 60 B
24 TD Bank Canada Financial 60 B
25 American Express USA Financial 60 B
26 Standard Chartered UK Financial 59 B-
27 Investec UK Financial 59 B-
28 Glaxosmithkline UK Consumer, Non-cyclical 59 B-
29 Woolworths Australia Consumer, Non-cyclical 59 B-
30 Gap USA Consumer, Cyclical 59 B-
31 Mirvac Australia Financial 58 B-
32 Enagas Spain Utilities 58 B-
33 Intesa Sanpaolo Italy Financial 58 B-
34 Telenet Belgium Communications 58 B-
35 Origin Energy Australia Utilities 58 B-
36 Vicinity Centres Australia Financial 58 B-
37 Caltex Australia Australia Energy 58 B-
38 Axa France Financial 58 B-
39 Iberdrola Spain Utilities 58 B-
40 Verizon Communications USA Communications 58 B-
41 Unilever Netherlands Consumer, Non-cyclical 58 B-
42 Sodexo France Consumer, Cyclical 58 B-
43 Relx Netherlands Consumer, Non-cyclical 57 B-
44 Castellum Sweden Financial 57 B-
45 Mastercard USA Financial 56 B-
46 Whitbread UK Consumer, Cyclical 56 B-
47 Cisco USA Communications 56 B-
48 Rea Australia Financial 56 B-
49 Elisa Finland Communications 55 B-
50 Fortum Finland Utilities 55 B-
51 Sanofi France Consumer, Non-cyclical 55 B-
52 Transurban Australia Consumer, Non-cyclical 55 B-
9GENDER EQUALITY GLOBAL REPORT & RANKING - 2018 EDITION
RANK COMPANY COUNTRY SECTOR SCORE GRADE
53 Svenska Handelsbanken Sweden Financial 55 B-
54 KPN Netherlands Communications 55 B-
55 Agilent USA Industrial 55 B-
56 Telia Sweden Communications 55 B-
57 Enel Italy Utilities 55 B-
58 Lendlease Australia Industrial 55 B-
59 3I UK Financial 55 B-
60 Engie France Utilities 55 B-
61 ANZ Australia Financial 55 B-
62 Telstra Australia Communications 55 B-
63 Ericsson Sweden Communications 55 B-
64 Salesforce USA Technology 55 C+
65 American Water Works USA Utilities 55 C+
66 Eli Lilly USA Consumer, Non-cyclical 55 C+
67 Qantas Australia Consumer, Cyclical 55 C+
68 IBM USA Technology 55 C+
69 Iron Mountain USA Financial 55 C+
70 Sempra Energy USA Utilities 55 C+
71 Orange France Communications 55 C+
72 Campbell Soup USA Consumer, Non-cyclical 55 C+
73 Proximus Belgium Communications 54 C+
74 Marks & Spencer UK Consumer, Cyclical 54 C+
75 Johnson Matthey UK Basic Materials 54 C+
76 CNP Assurances France Financial 54 C+
77 Pearson UK Communications 54 C+
78 Microsoft USA Technology 54 C+
79 BASF Germany Basic Materials 53 C+
80 Bank Of New York Mellon USA Financial 53 C+
81 Land Securities UK Financial 53 C+
82 Relx UK Consumer, Non-cyclical 53 C+
83 Amundi France Financial 53 C+
84 Peugeot France Consumer, Cyclical 53 C+
85 Redrow UK Consumer, Cyclical 53 C+
86 Meridian Energy New Zealand Utilities 53 C+
87 AGL Energy Australia Utilities 53 C+
88 Dexus Australia Financial 53 C+
89 Skandinaviska Enskilda Sweden Financial 53 C+
90 Severn Trent UK Utilities 53 C+
91 ASX Australia Financial 52 C+
92 Royal Mail UK Industrial 52 C+
93 Fabege Sweden Financial 52 C+
94 Assa Abloy Sweden Industrial 52 C+

10GENDER EQUALITY GLOBAL REPORT & RANKING - 2018 EDITION
RANK COMPANY COUNTRY SECTOR SCORE GRADE
95 GPT Australia Financial 52 C+
96 Suncorp Australia Financial 52 C+
97 DNB Norway Financial 52 C+
98 Rentokil Initial UK Consumer, Non-cyclical 52 C+
99 Intu UK Financial 52 C+
100 Bank Leumi Israel Financial 52 C+
101 DSM Netherlands Basic Materials 52 C+
102 Teleperformance France Technology 52 C+
103 Bayer Germany Consumer, Non-cyclical 52 C+
104 Caixabank Spain Financial 52 C+
105 BNP Paribas France Financial 52 C+
106 Royal Bank Of Canada Canada Financial 52 C+
107 Schibsted Norway Communications 52 C+
108 Standard Life Aberdeen UK Financial 51 C+
109 Norsk Hydro Norway Basic Materials 51 C+
110 BTG UK Consumer, Non-cyclical 51 C+
111 Barclays UK Financial 51 C+
112 Aviva UK Financial 51 C+
113 Bankinter Spain Financial 51 C+
114 Bank Hapoalim Israel Financial 51 C+
115 Shire UK Consumer, Non-cyclical 51 C+
116 Royal Bank Of Scotland UK Financial 51 C+
117 Resmed USA Consumer, Non-cyclical 51 C+
118 Capital & Counties UK Financial 51 C+
119 Astrazeneca UK Consumer, Non-cyclical 51 C+
120 Burberry UK Consumer, Cyclical 51 C+
121 National Grid UK Utilities 51 C+
122 Saint Gobain France Industrial 50 C+
123 Aareal Bank Germany Financial 50 C+
124 Genmab Denmark Consumer, Non-cyclical 50 C
125 Oil Search Australia Energy 50 C
126 Klepierre France Financial 50 C
127 Biomerieux France Consumer, Non-cyclical 50 C
128 Red Electrica Spain Utilities 50 C
129 Boliden Sweden Basic Materials 50 C
130 Kongsberg Norway Industrial 50 C
131 Duluxgroup Australia Basic Materials 50 C
132 State Street USA Financial 50 C
133 Nordea Bank Sweden Financial 50 C
134 Deutsche Post Germany Industrial 50 C
135 South32 Australia Basic Materials 50 C
136 Sonova Switzerland Consumer, Non-cyclical 50 C
11GENDER EQUALITY GLOBAL REPORT & RANKING - 2018 EDITION
RANK COMPANY COUNTRY SECTOR SCORE GRADE
137 Legrand France Industrial 50 C
138 Publicis France Communications 50 C
139 Telenor Norway Communications 50 C
140 Investa Australia Financial 50 C
141 Allstate USA Financial 50 C
142 Snam Italy Utilities 50 C
143 Continental Germany Consumer, Cyclical 50 C
144 Fortescue Metals Australia Basic Materials 50 C
145 Axis Communications Sweden Industrial 50 C
146 Deutsche Telekom Germany Communications 50 C
147 Singapore Telecommunications
Singapore Communications 50 C
148 QBE Australia Financial 50 C
149 Roche Switzerland Consumer, Non-cyclical 50 C
150 Michelin France Consumer, Cyclical 50 C
151 NCC Sweden Industrial 50 C
152 SEB France Consumer, Cyclical 50 C
153 CA USA Technology 50 C
154 Chr Hansen Denmark Consumer, Non-cyclical 50 C
155 PNC Financial Services USA Financial 50 C
156 Zurich Insurance Switzerland Financial 50 C
157 Li & Fung Hong Kong Consumer, Cyclical 50 C
158 Hershey USA Consumer, Non-cyclical 50 C
159 Air Canada Canada Consumer, Cyclical 50 C
160 Molson Coors Brewing USA Consumer, Non-cyclical 49 C
161 BBVA Spain Financial 49 C
162 Virgin Money UK Financial 49 C
163 Vodafone UK Communications 49 C
164 Royal Dutch Shell UK Energy 48 C
165 Lloyds Bank UK Financial 48 C
166 Auto Trader UK Communications 48 C
167 BHP Billiton Australia Basic Materials 48 C
168 Merck Germany Consumer, Non-cyclical 48 C
169 ING Netherlands Financial 48 C
170 Fonciere Des Regions France Financial 47 C
171 Link Administration Australia Financial 47 C
172 Intact Insurance Canada Financial 47 C
173 Sydney Airport Australia Industrial 47 C
174 Mercury NZ New Zealand Utilities 47 C
175 Altarea France Financial 47 C
176 Tarkett France Industrial 47 C
177 Ica Gruppen Sweden Consumer, Non-cyclical 47 C
178 Macquarie Australia Financial 47 C
12GENDER EQUALITY GLOBAL REPORT & RANKING - 2018 EDITION
RANK COMPANY COUNTRY SECTOR SCORE GRADE
179 Philips Netherlands Consumer, Non-cyclical 47 C
180 Givaudan Switzerland Basic Materials 47 C
181 Jeronimo Martins Portugal Consumer, Non-cyclical 47 C
182 Ebro Foods Spain Consumer, Non-cyclical 47 C
183 Frankfurt Airport Germany Industrial 47 C
184 Ferguson UK Consumer, Cyclical 47 C
185 Henkel Germany Consumer, Non-cyclical 47 C
186 Mediaset España Spain Communications 47 C
187 Getinge Sweden Consumer, Non-cyclical 47 C
188 Lundbergs Sweden Financial 47 C
189 Ontex Belgium Consumer, Non-cyclical 47 C
190 Millicom USA Communications 47 C
191 Axel Springer Germany Communications 47 C
192 DBS Singapore Financial 47 C
193 Aegon Netherlands Financial 47 C
194 Great Portland Estates UK Financial 47 C
195 Atrium Ljungberg Sweden Financial 47 C
196 Ingenico France Technology 47 C
197 Shaftesbury UK Financial 47 C
198 Comcast USA Communications 47 C
199 Cogeco Communications Canada Communications 47 C
200 Intel USA Technology 47 C
13GENDER EQUALITY GLOBAL REPORT & RANKING - 2018 EDITION
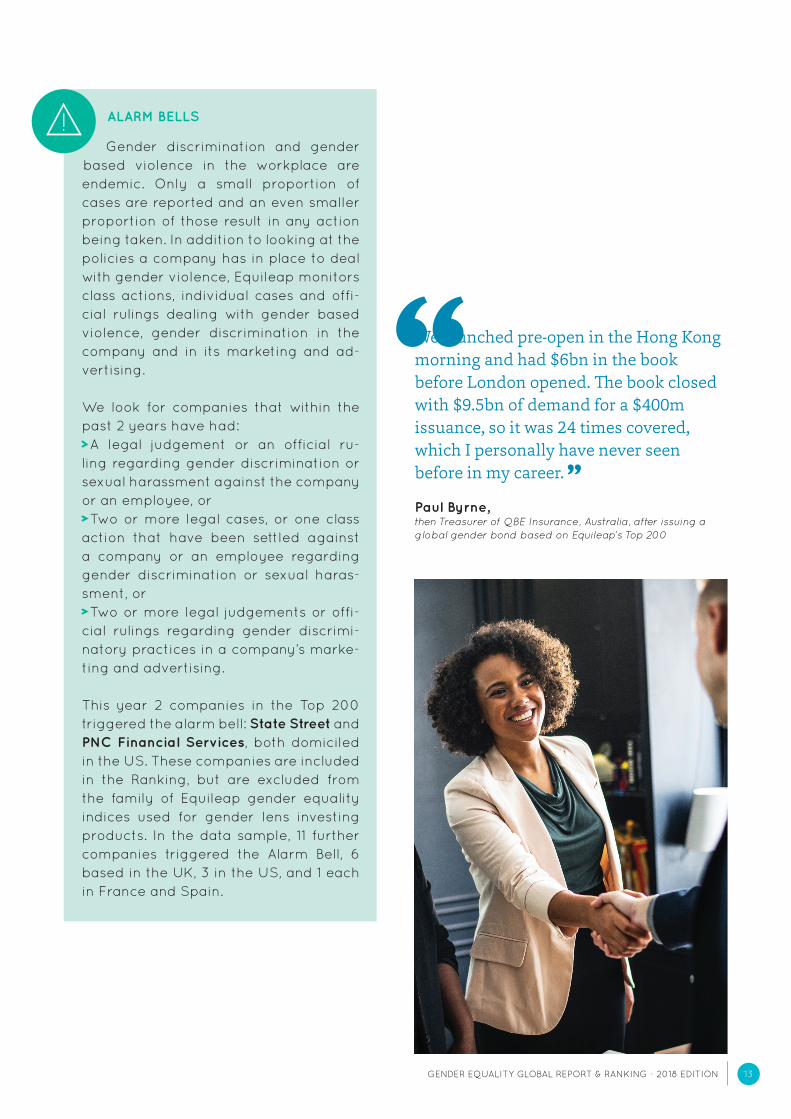
We launched pre-open in the Hong Kong morning and had $6bn in the book before London opened. The book closed with $9.5bn of demand for a $400m issuance, so it was 24 times covered, which I personally have never seen before in my career.
Paul Byrne, then Treasurer of QBE Insurance, Australia, after issuing a global gender bond based on Equileap’s Top 200
ALARM BELLS
Gender discrimination and gender based violence in the workplace are endemic. Only a small proportion of cases are reported and an even smaller proportion of those result in any action being taken. In addition to looking at the policies a company has in place to deal with gender violence, Equileap monitors class actions, individual cases and offi-cial rulings dealing with gender based violence, gender discrimination in the company and in its marketing and ad-vertising. We look for companies that within the past 2 years have had: A legal judgement or an official ru-
ling regarding gender discrimination or sexual harassment against the company or an employee, or Two or more legal cases, or one class
action that have been settled against a company or an employee regarding gender discrimination or sexual haras-sment, or Two or more legal judgements or offi-
cial rulings regarding gender discrimi-natory practices in a company’s marke-ting and advertising. This year 2 companies in the Top 200 triggered the alarm bell: State Street and PNC Financial Services, both domiciled in the US. These companies are included in the Ranking, but are excluded from the family of Equileap gender equality indices used for gender lens investing products. In the data sample, 11 further companies triggered the Alarm Bell, 6 based in the UK, 3 in the US, and 1 each in France and Spain.

CLOSING GENDER PAY GAPS
Equileap has focused strongly on equal pay and the gender pay gap this year as some of the most important indicators of economic equality. The reality of what the British Prime Minister called an ’obscene’ gender pay gap was exposed in the UK when it became the first country globally to introduce gender pay gap reporting for all organisations with more than 250 employees.
But this is just a start; will the companies act to close the large gaps revealed to a standard that bears scrutiny? We found many companies make claims of pay parity or closing the gender pay gap without backing this up with specific data.
Two important ways to measure how far a company has moved towards closing the gender pay gap are firstly, to test gender pay equality in different pay bands throughout the company, these are usually decided by occupational category, and secondly, to ask about the overall pay gap, which reveals whether one gender disproportionately occupies higher paying jobs in an organisation.
Equileap looks for published data showing a mean gender pay gap of +/- 3% in the company’s country of incorporation.
This year 5 companies in the data sample published information showing gender pay equality in each of at least 3 pay bands (See chart below).
GENDER EQUALITY IN PAY BANDS
COMPANY COUNTRY
Agilent USA
Enbridge Canada
General Motors USA
Link Administration Australia
Starhub Singapore
COMPANY COUNTRY
Air New Zealand New Zealand
Ashtead Group UK
Caltex Australia Australia
Cochlear Australia
Ebay USA
Enel Italy
Ferguson UK
Fortum Finland
General Motors USA
Givaudan Switzerland
Greene King UK
Keysight Technologies USA
KPN Netherlands
Meridian Energy New Zealand
NMC UK
Ocado UK
Origin Energy Australia
Red Electrica Spain
Redrow UK
Rentokil Initial UK
Royal Mail UK
Severn Trent UK
Starhub Singapore
Stora Enso Finland
Taylor Wimpey UK
Unilever Netherlands
Victrex UK
Vmware USA
between the average salary for women and for men across the company, regardless of pay and job title.
NO OVERALL GENDER PAY GAP
Only two companies, General Motors and Starhub, achieved both measures, which is the ultimate goal towards which companies interested in closing gender pay gaps should work.
41% of the companies showing no overall gender pay gap are located in the UK, showing the positive impact of the UK’s new gender pay gap legislation, obliging them to be transparent about their pay gaps.
27 companies in the data sample published figures showing a mean overall gender pay gap of less than or equal to 3%. This applies to employees only in the company’s country of incorporation. This measures the difference
0
10
20
30
40
50
15GENDER EQUALITY GLOBAL REPORT & RANKING - 2018 EDITION
INSIGHTS PER COUNTRY
A company’s country of domicile is one of the most important factors influencing its ranking, with startling differences between similar companies in different countries. Norway retains its lead this year with the highest proportion of companies reaching the Top 200, the result of a long held culture of equal participation in all sectors of Norwegian life. Australia has recorded an improvement in its performance, due, in large part, to effective legislation which has improved transparency and is compelling companies to address their performance on gender balance.
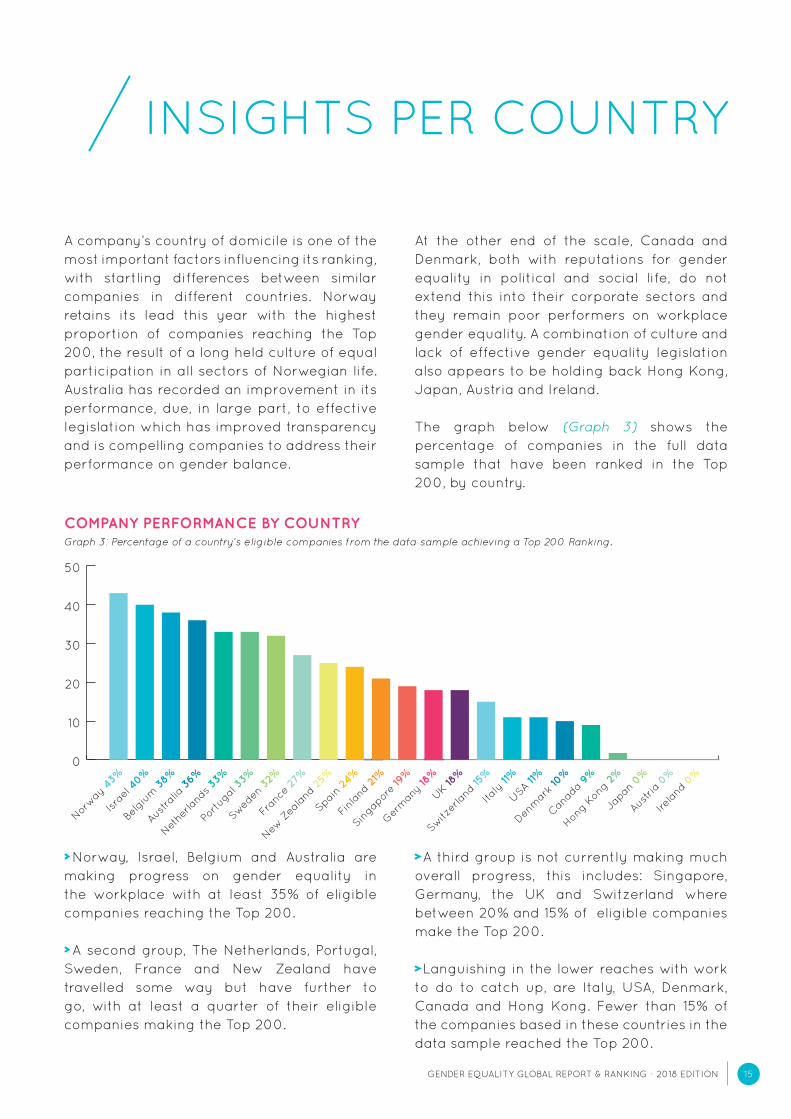
COMPANY PERFORMANCE BY COUNTRY Graph 3: Percentage of a country’s eligible companies from the data sample achieving a Top 200 Ranking.
Norway
43%
Switz
erla
nd 15
%
Nethe
rland
s 33%
Canad
a 9%
Spain
24%
Israe
l 40%
Italy
11%
Portug
al 3
3%
Hong K
ong 2
%
Finl
and 2
1%
Belg
ium
38%
USA 11
%
Swed
en 3
2%
Japan
0%
Singap
ore
19%
Austra
lia 3
6%
Denm
ark
10%
New Z
eala
nd 2
5%
Irela
nd 0
%
Fran
ce 2
7%
Austria
0%
Ger
man
y 18
%
UK 18%
At the other end of the scale, Canada and Denmark, both with reputations for gender equality in political and social life, do not extend this into their corporate sectors and they remain poor performers on workplace gender equality. A combination of culture and lack of effective gender equality legislation also appears to be holding back Hong Kong, Japan, Austria and Ireland.
The graph below (Graph 3) shows the percentage of companies in the full data sample that have been ranked in the Top 200, by country.
Norway, Israel, Belgium and Australia are making progress on gender equality in the workplace with at least 35% of eligible companies reaching the Top 200.
A second group, The Netherlands, Portugal, Sweden, France and New Zealand have travelled some way but have further to go, with at least a quarter of their eligible companies making the Top 200.
A third group is not currently making much overall progress, this includes: Singapore, Germany, the UK and Switzerland where between 20% and 15% of eligible companies make the Top 200.
Languishing in the lower reaches with work to do to catch up, are Italy, USA, Denmark, Canada and Hong Kong. Fewer than 15% of the companies based in these countries in the data sample reached the Top 200.

0
10
20
30
40
50
Israe
l 48%
Switz
erla
nd 3
7%
Austra
lia 4
4%
Canad
a 34
%
Finl
and 4
1%
Belg
ium
44%
UK 37%
Portug
al 4
4%
New Z
eala
nd 3
3%
Singap
ore
40%
Norway
44%
Austria
36%
Swed
en 4
3%
Japan
32%
Ger
man
y 40%
Nethe
rland
s 44%
USA 3
6%
Fran
ce 4
2%
Irela
nd 0
%
Spain
42%
Hong K
ong 3
0%
Italy
39%
Denm
ark
37%
16GENDER EQUALITY GLOBAL REPORT & RANKING - 2018 EDITION
Bottom of the class: Austria and Japan where no eligible companies reach the Top 200, and last of all is Ireland, where no companies were
ranked highly enough to be included in the data sample.
COUNTRY AVERAGE Graph 4: Average score per country (data sample).
The graph above shows the average scores of companies from each country in the data sample enabling us to see some clear differences. These are the better performing large companies on gender equality in each of the 23 countries.
All average scores are below 50% - demonstrating the size of the gap to be made up to bring about gender parity in the workplace in every one of these countries.
A group of countries including Canada, New Zealand Japan and Hong Kong have average scores of below 35%.
Israeli companies in the full data-set did, on average, better on gender equality than the companies of any other country, although there are only 5 Israeli companies in the entire data sample.
17GENDER EQUALITY GLOBAL REPORT & RANKING - 2018 EDITION
TOP 10 COMPANIES PER COUNTRY
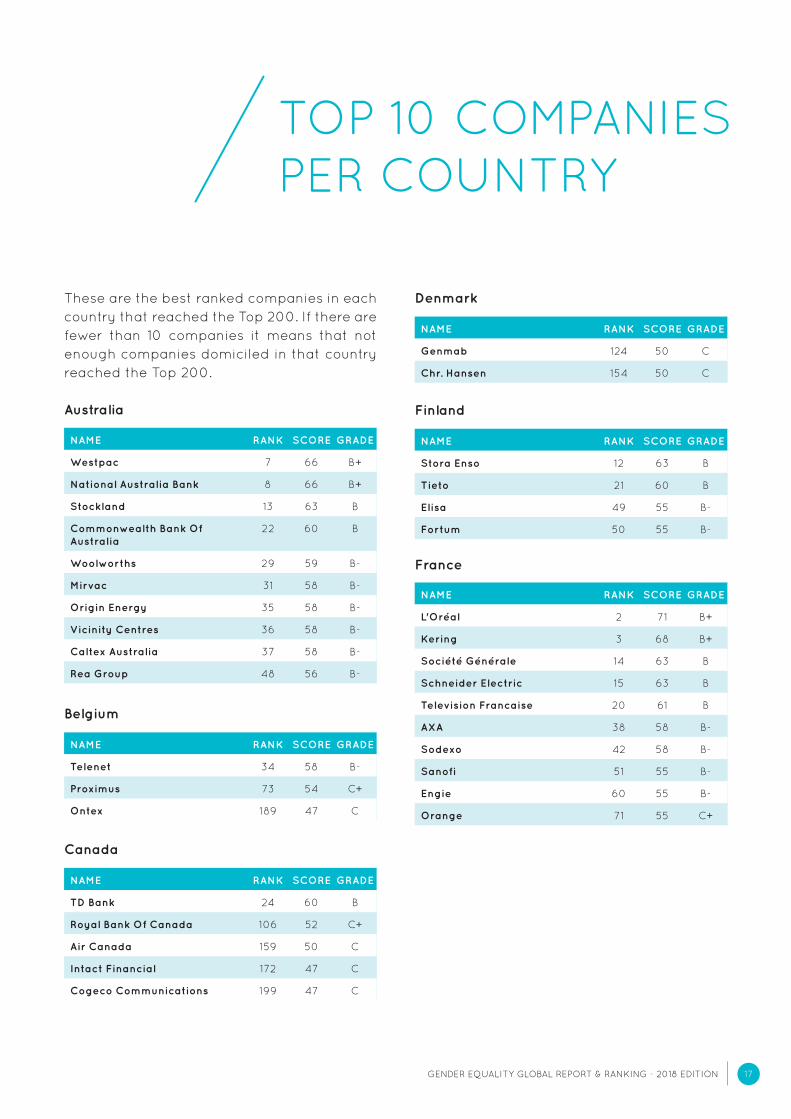
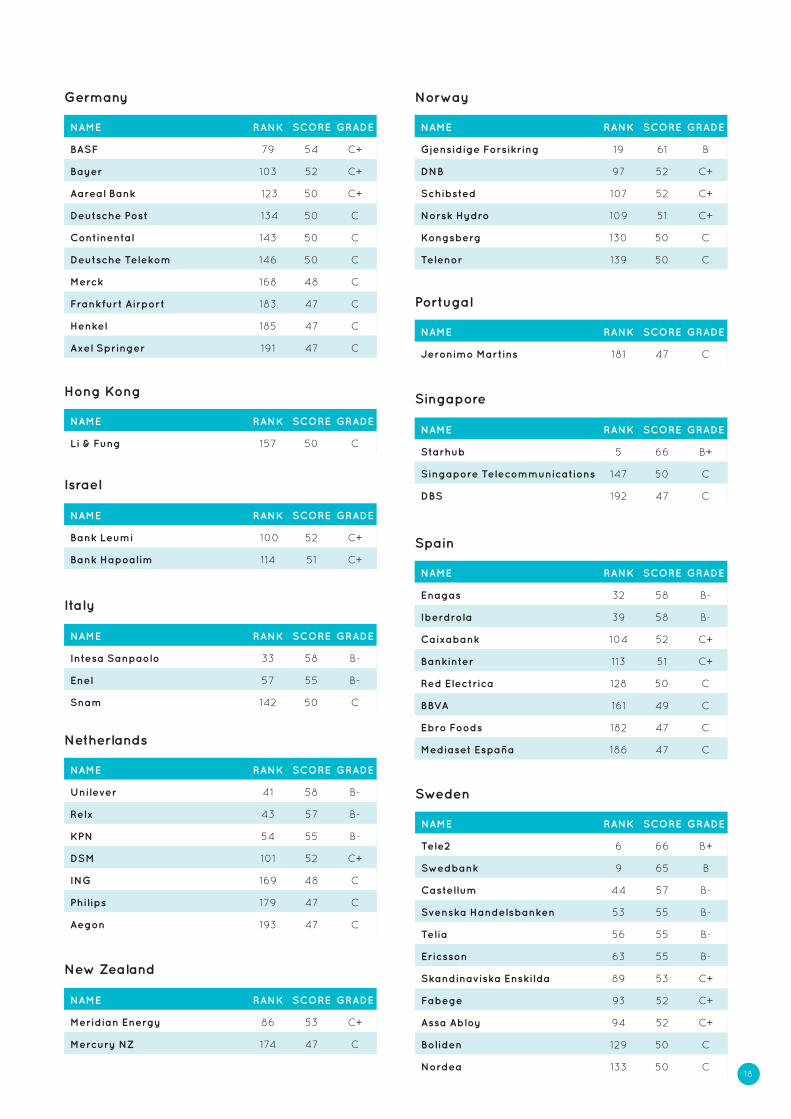
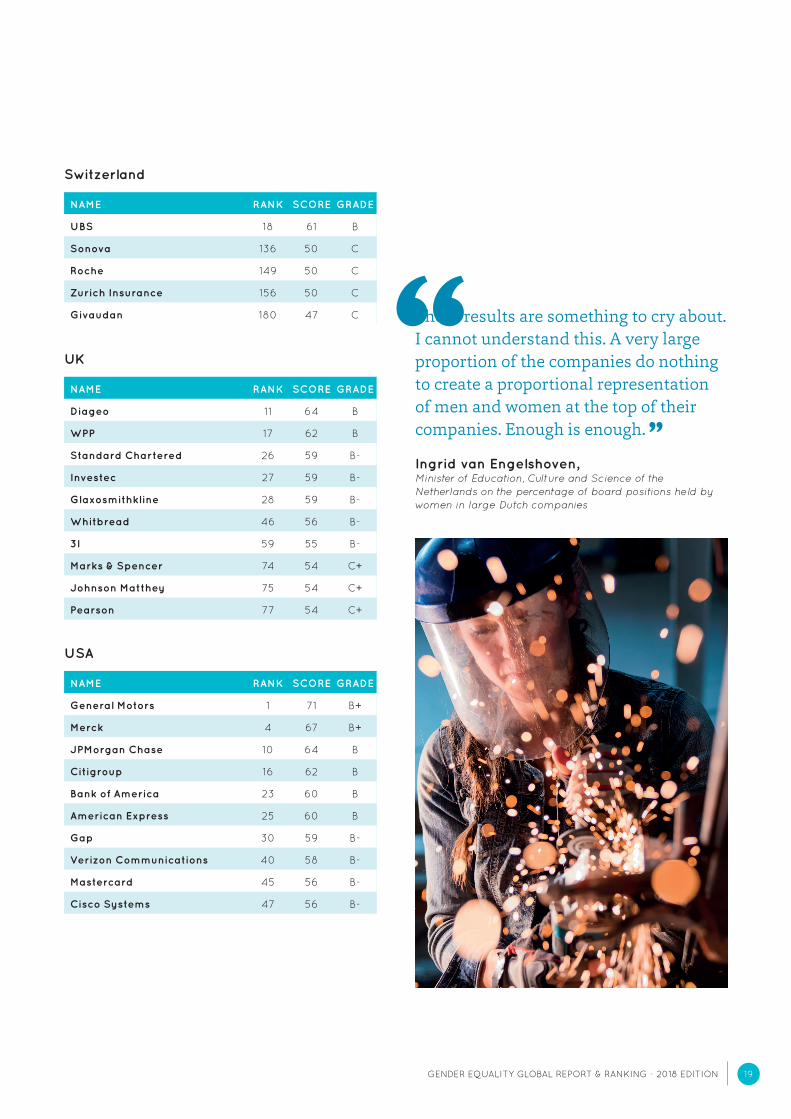
These are the best ranked companies in each country that reached the Top 200. If there are fewer than 10 companies it means that not enough companies domiciled in that country reached the Top 200.
Australia
NAME RANK SCORE GRADE
Westpac 7 66 B+
National Australia Bank 8 66 B+
Stockland 13 63 B
Commonwealth Bank Of Australia
22 60 B
Woolworths 29 59 B-
Mirvac 31 58 B-
Origin Energy 35 58 B-
Vicinity Centres 36 58 B-
Caltex Australia 37 58 B-
Rea Group 48 56 B-
NAME RANK SCORE GRADE
L'Oréal 2 71 B+
Kering 3 68 B+
Société Générale 14 63 B
Schneider Electric 15 63 B
Television Francaise 20 61 B
AXA 38 58 B-
Sodexo 42 58 B-
Sanofi 51 55 B-
Engie 60 55 B-
Orange 71 55 C+
NAME RANK SCORE GRADE
Telenet 34 58 B-
Proximus 73 54 C+
Ontex 189 47 C
NAME RANK SCORE GRADE
TD Bank 24 60 B
Royal Bank Of Canada 106 52 C+
Air Canada 159 50 C
Intact Financial 172 47 C
Cogeco Communications 199 47 C
Belgium
Canada
NAME RANK SCORE GRADE
Genmab 124 50 C
Chr. Hansen 154 50 C
NAME RANK SCORE GRADE
Stora Enso 12 63 B
Tieto 21 60 B
Elisa 49 55 B-
Fortum 50 55 B-
Denmark
Finland
France
18GENDER EQUALITY GLOBAL REPORT & RANKING - 2018 EDITION
NAME RANK SCORE GRADE
BASF 79 54 C+
Bayer 103 52 C+
Aareal Bank 123 50 C+
Deutsche Post 134 50 C
Continental 143 50 C
Deutsche Telekom 146 50 C
Merck 168 48 C
Frankfurt Airport 183 47 C
Henkel 185 47 C
Axel Springer 191 47 C
NAME RANK SCORE GRADE
Enagas 32 58 B-
Iberdrola 39 58 B-
Caixabank 104 52 C+
Bankinter 113 51 C+
Red Electrica 128 50 C
BBVA 161 49 C
Ebro Foods 182 47 C
Mediaset España 186 47 C
NAME RANK SCORE GRADE
Unilever 41 58 B-
Relx 43 57 B-
KPN 54 55 B-
DSM 101 52 C+
ING 169 48 C
Philips 179 47 C
Aegon 193 47 C
NAME RANK SCORE GRADE
Li & Fung 157 50 C
NAME RANK SCORE GRADE
Jeronimo Martins 181 47 C
Germany
Spain
Netherlands
Hong Kong
Portugal
NAME RANK SCORE GRADE
Bank Leumi 100 52 C+
Bank Hapoalim 114 51 C+
NAME RANK SCORE GRADE
Meridian Energy 86 53 C+
Mercury NZ 174 47 C
Israel
New Zealand
NAME RANK SCORE GRADE
Intesa Sanpaolo 33 58 B-
Enel 57 55 B-
Snam 142 50 C
NAME RANK SCORE GRADE
Starhub 5 66 B+
Singapore Telecommunications 147 50 C
DBS 192 47 C
Italy
Singapore
NAME RANK SCORE GRADE
Gjensidige Forsikring 19 61 B
DNB 97 52 C+
Schibsted 107 52 C+
Norsk Hydro 109 51 C+
Kongsberg 130 50 C
Telenor 139 50 C
Norway
NAME RANK SCORE GRADE
Tele2 6 66 B+
Swedbank 9 65 B
Castellum 44 57 B-
Svenska Handelsbanken 53 55 B-
Telia 56 55 B-
Ericsson 63 55 B-
Skandinaviska Enskilda 89 53 C+
Fabege 93 52 C+
Assa Abloy 94 52 C+
Boliden 129 50 C
Nordea 133 50 C
Sweden
19GENDER EQUALITY GLOBAL REPORT & RANKING - 2018 EDITION
NAME RANK SCORE GRADE
UBS 18 61 B
Sonova 136 50 C
Roche 149 50 C
Zurich Insurance 156 50 C
Givaudan 180 47 C
Switzerland
NAME RANK SCORE GRADE
Diageo 11 64 B
WPP 17 62 B
Standard Chartered 26 59 B-
Investec 27 59 B-
Glaxosmithkline 28 59 B-
Whitbread 46 56 B-
3I 59 55 B-
Marks & Spencer 74 54 C+
Johnson Matthey 75 54 C+
Pearson 77 54 C+
NAME RANK SCORE GRADE
General Motors 1 71 B+
Merck 4 67 B+
JPMorgan Chase 10 64 B
Citigroup 16 62 B
Bank of America 23 60 B
American Express 25 60 B
Gap 30 59 B-
Verizon Communications 40 58 B-
Mastercard 45 56 B-
Cisco Systems 47 56 B-
UK
USA
These results are something to cry about. I cannot understand this. A very large proportion of the companies do nothing to create a proportional representation of men and women at the top of their companies. Enough is enough.
Ingrid van Engelshoven, Minister of Education, Culture and Science of the Netherlands on the percentage of board positions held by women in large Dutch companies
0
10
20
30
40
50
60
0
10
20
30
40
50
60
20GENDER EQUALITY GLOBAL REPORT & RANKING - 2018 EDITION
INSIGHTS PER REGION
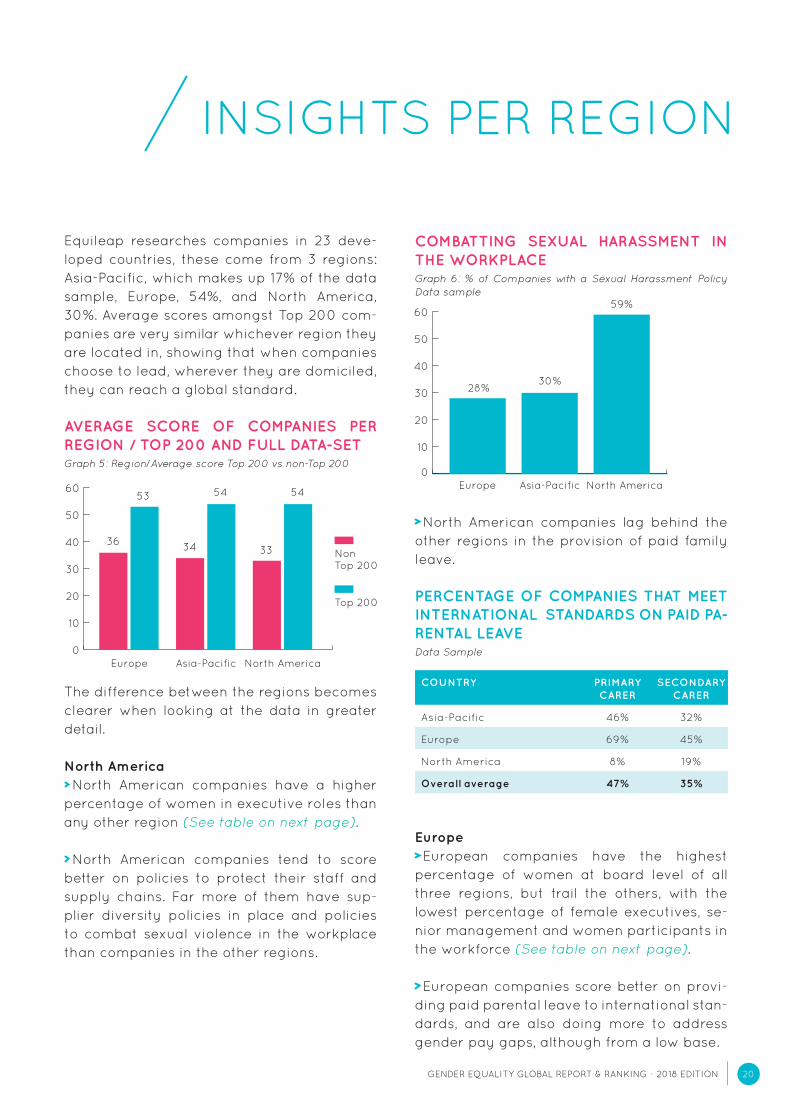
Equileap researches companies in 23 deve-loped countries, these come from 3 regions: Asia-Pacific, which makes up 17% of the data sample, Europe, 54%, and North America, 30%. Average scores amongst Top 200 com-panies are very similar whichever region they are located in, showing that when companies choose to lead, wherever they are domiciled, they can reach a global standard.
AVERAGE SCORE OF COMPANIES PER REGION / TOP 200 AND FULL DATA-SETGraph 5: Region/Average score Top 200 vs non-Top 200
COMBATTING SEXUAL HARASSMENT IN THE WORKPLACEGraph 6: % of Companies with a Sexual Harassment Policy Data sample
The difference between the regions becomes clearer when looking at the data in greater detail.
North America North American companies have a higher
percentage of women in executive roles than any other region (See table on next page).
North American companies tend to score better on policies to protect their staff and supply chains. Far more of them have sup-plier diversity policies in place and policies to combat sexual violence in the workplace than companies in the other regions.
Europe
Europe
36
53
28%30%
59%
34
54
33
54
Asia-Pacific
Asia-Pacific
North America
North America
Non Top 200
Top 200
North American companies lag behind the other regions in the provision of paid family leave.
PERCENTAGE OF COMPANIES THAT MEET INTERNATIONAL STANDARDS ON PAID PA-RENTAL LEAVE Data Sample
Europe European companies have the highest
percentage of women at board level of all three regions, but trail the others, with the lowest percentage of female executives, se-nior management and women participants in the workforce (See table on next page).
European companies score better on provi-ding paid parental leave to international stan-dards, and are also doing more to address gender pay gaps, although from a low base.
COUNTRY PRIMARY CARER
SECONDARY CARER
Asia-Pacific 46% 32%
Europe 69% 45%
North America 8% 19%
Overall average 47% 35%
21GENDER EQUALITY GLOBAL REPORT & RANKING - 2018 EDITION
European companies are less likely than those in the other regions to have policies in place to combat sexual harassment and gen-der based violence in the workplace.
Asia-Pacific Asia-Pacific companies have more women in
senior management and in their workforces than the other two regions.
They score better in providing flexible work options.
Asia Pacific companies lag behind the other two in paying fair wages and in having poli-cies to protect their supply chains or human rights policies.
AVERAGE % OF WOMEN AT EACH LEVEL Data Sample
REGION BOARD EXECUTIVES SENIOR MANAGEMENT WORKFORCE
Asia-Pacific 23.9 19.2 28.8 41.3
Europe 31.5 15.6 23.7 37.8
North America 26.4 21.5 26.5 38.1
Total sample 28.7 18.0 25.2 38.5

05
1015
20253035
05
1015
2025303540
22GENDER EQUALITY GLOBAL REPORT & RANKING - 2018 EDITION
INSIGHTS PER SECTOR
AVERAGE SCORES BY SECTORGraph 8: Average score per sector (data sample).
The sectors with a highest proportion of companies ranked in the Top 200 are the same as last year, Communications with 32%, Financial with 27% and Utilities with 21%.
Compared to 2017 there has been a significant improvement in the proportion of Technology companies reaching the Top 200, up 11 percentage points to 14%. We will watch to see if this improves over time, spurred on by the advocacy campaigns to involve more women in tech in many countries, which has resulted in some action on pay and conditions for women and greater transparency in these companies (See page 24).
COMPANY PERFORMANCE BY SECTORGraph 7: Percentage of a sector’s eligible companies achie-ving a Top 200 Ranking.
Comm
unic
atio
ns 3
2%
Fina
ncia
l 27%
Util
ities
21%
Consu
mer
, Non
-cyc
lical
16%
Basic
mat
eria
ls 15
%
Tech
nolo
gy 14
%
Consu
mer
, Cyc
lical
11%
Indus
trial
9%
Ener
gy 6%
Diver
sifie
d 0%
At the other end of the scale the small Diversi-fied sector has no companies in the Top 200, although 6 in the overall data set, and only 6% of Energy sector companies, 9% of Indus-trial sector companies and 11% of Consumer Cyclical companies reached the Top 200. All these sectors clearly have work to do to be-nefit more fully from gender diversity.
Fina
ncia
l 40%
Comm
unic
atio
ns 4
0%
Util
ities
38%
Consu
mer
, Non
-cyc
lical
38%
Tech
nolo
gy 37
%
Basic
mat
eria
ls 37
%
Consu
mer
, Cyc
lical
37%
Ener
gy 37
%
Indus
trial
36%
Diver
sifie
d 33%
The graph above (Graph 8) shows average scores per sector across the full data set, with companies in the Financial, Communica-tions and Utilities sectors showing that if they choose to lead the way then they score well compared to other sectors.
23GENDER EQUALITY GLOBAL REPORT & RANKING - 2018 EDITION
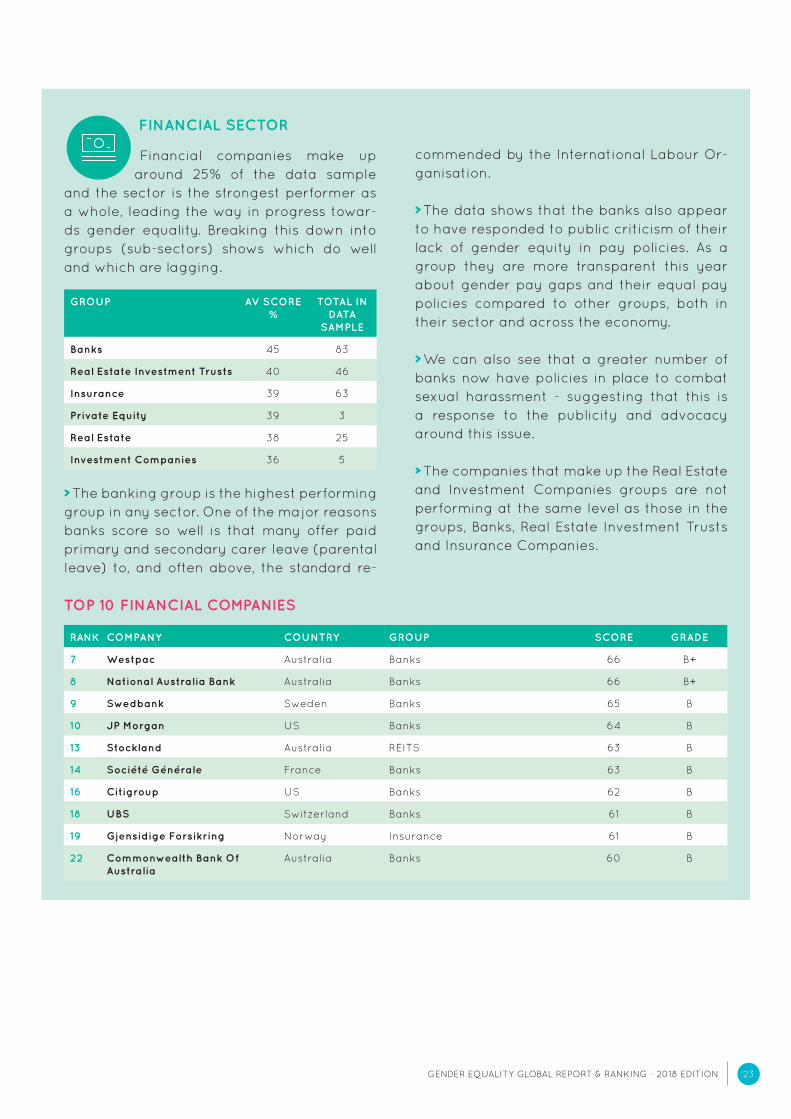
FINANCIAL SECTOR
Financial companies make up around 25% of the data sample
and the sector is the strongest performer as a whole, leading the way in progress towar-ds gender equality. Breaking this down into groups (sub-sectors) shows which do well and which are lagging.
GROUP AV SCORE %
TOTAL IN DATA
SAMPLE
Banks 45 83
Real Estate Investment Trusts 40 46
Insurance 39 63
Private Equity 39 3
Real Estate 38 25
Investment Companies 36 5
commended by the International Labour Or-ganisation.
The data shows that the banks also appear to have responded to public criticism of their lack of gender equity in pay policies. As a group they are more transparent this year about gender pay gaps and their equal pay policies compared to other groups, both in their sector and across the economy.
We can also see that a greater number of banks now have policies in place to combat sexual harassment - suggesting that this is a response to the publicity and advocacy around this issue.
The companies that make up the Real Estate and Investment Companies groups are not performing at the same level as those in the groups, Banks, Real Estate Investment Trusts and Insurance Companies.
The banking group is the highest performing group in any sector. One of the major reasons banks score so well is that many offer paid primary and secondary carer leave (parental leave) to, and often above, the standard re-
RANK COMPANY COUNTRY GROUP SCORE GRADE
7 Westpac Australia Banks 66 B+
8 National Australia Bank Australia Banks 66 B+
9 Swedbank Sweden Banks 65 B
10 JP Morgan US Banks 64 B
13 Stockland Australia REITS 63 B
14 Société Générale France Banks 63 B
16 Citigroup US Banks 62 B
18 UBS Switzerland Banks 61 B
19 Gjensidige Forsikring Norway Insurance 61 B
22 Commonwealth Bank Of Australia
Australia Banks 60 B
TOP 10 FINANCIAL COMPANIES

24GENDER EQUALITY GLOBAL REPORT & RANKING - 2018 EDITION
TECHNOLOGY SECTOR
This is the most improved sec-tor compared to 2017. 14% of the
companies in the data sample reached the Top 200 this year, compared to 3% last year. There is still no technology company ranked in the top 20, but Tieto – a Finnish company - is knocking on the door, ranked at 21.
TOP TECHNOLOGY COMPANIES
GROUP AV SCORE %
TOTAL IN DATA SAM-
PLE
Office/Business Equip 39 3
Computers 38 20
Software 37 21
Semiconductors 35 13
RANK COMPANY COUNTRY GROUP SCORE GRADE
21 Tieto Finland Computers 60 B
64 Salesforce US Software 50 C+
68 IBM US Computers 55 C+
78 Microsoft US Software 54 C+
102 Teleperformance France Computers 52 C+
153 CA US Software 50 C
196 Ingenico France Computers 47 C
200 Intel US Semi-Conductors 47 C
WHERE HAVE TECHNOLOGY COMPANIES DONE BETTER?
The greatest improvements have come in the provision of paid primary and seconda-ry carer leave (parental leave), in the gender balance on the boards and in the senior exe-cutives of these companies. More technology companies have policies in place to combat sexual violence, suggesting that these com-
panies too are beginning to think about how to address this issue in the workplace.
But there is still a long way for this sector to travel, with its average scores well below those in the Financial sector. Areas where companies need to improve to compete with the best are in being more transparent about gender pay gaps and doing more to address them, and in improving the gender balance of their workforces.
1. Most women don’t want the hassle or pressure of sitting on a board.
2. Shareholders just aren’t interested in the make-up of the board, so why should we be?
3. My other board colleagues wouldn’t want to appoint a woman on our board.
4. All the ‘good’ women have already been snapped up.
5. We have one woman already on the board, so we are done - it is someone else’s turn.
Excuses given by British Companies for not appointing a women to the board. Hampton Alexander Review, May 2018.
25GENDER EQUALITY GLOBAL REPORT & RANKING - 2018 EDITION
METHODOLOGY
EQUILEAP DATABASE
Equileap has created a unique database that collects data about publicly listed companies on their gender balance and their commit-ment to gender equity. The current Equileap database includes 3,206 public companies: that is all companies with a primary listing on a stock exchange in one of 23 developed eco-nomies around the world and a market capi-talisation above USD 2 billion. The database was created by collecting publicly available information as reported by the companies themselves in their most recent company re-ports, filings and other reports. The research was carried out by Equileap’s research team, with the collaboration of the Business and Hu-man Rights Resource Centre on the alarm bell data. The database is the largest and most wide-ranging on gender in the corporate sec-tor and it lies at the heart of Equileap’s work.
DATA COLLECTION
Equileap takes a great deal of effort to ensure the accuracy of data and every company in the data sample was sent a questionnaire in-viting them to send their data. If an error has been made, companies are invited to submit information or request a correction by e-mai-ling [email protected]. New data will be added provided companies show proof of their policies and practices. The database is continuously updated as new research and data is made available. Rankings are updated annually.
SCORING METHODOLOGY: EQUILEAP GENDER SCORECARD
To assess a company’s commitment to gen-der equality, Equileap has developed the EquileapTM Gender Scorecard, inspired by the UN’s Women’s Empowerment Principles. The
Scorecard allows Equileap to collect infor-mation methodically about the companies in its database, based on a set of pre-identified criteria. The Equileap scoring methodology is one of the most comprehensive ranking sys-tems available to measure a company’s pro-gress towards gender equality.
The EquileapTM Gender Scorecard current-ly includes 19 data clusters divided into 4 categories that measure a) gender balance in the overall leadership, management and workforce of a company, b) equal compen-sation and work life balance, c) policies pro-moting gender equality and d) commitment to women’s empowerment, transparency and accountability.
Equileap scores and ranks each company’s commitment to gender equality. The metho-dology has been peer reviewed by experts in finance, business, economics, and gender.
THE EQUILEAP GENDER EQUALITY RANKING
The Equileap Gender Equality Ranking is de-veloped using a four-stage gender equality approach and an ESG Exclusion Screen.
First Stage- Primary CRITERIA
The first stage measures 12 criteria against independently collected and publicly avai-lable data. These are: Gender balance at the non-executive,
executive, senior management and in the workforce, Promotion and career development oppor-
tunities, and Seven different types of policies in the work-
place that promote equal treatment and op-portunities for men and women.
26GENDER EQUALITY GLOBAL REPORT & RANKING - 2018 EDITION
All the 3,206 companies in the Equileap Uni-verse have been researched on this basis. The companies are then ranked in a Primary Equileap Gender Equality Ranking.
At this stage all the companies listed on one of the four independently identified ESG ex-clusion lists below are removed from the Gen-der Equality Ranking.
Environmental, Social & Governance exclu-sions for our annual Gender Equality Global Ranking: Norwegian Ethics Council List Bloomberg ESG: Weapons List Bloomberg ESG: Gambling List Bloomberg ESG: Tobacco List
Second Stage – Deep Dive Criteria
For this Edition, the top 1000 companies from the primary ranking, plus a further 107 companies, were further researched. These 1107 companies are the 2018 Equileap data sample for this ranking. Each of these compa-nies was sent a questionnaire asking them to contribute transparent evidence of their per-formance on all the primary criteria, plus an additional 7 criteria relating to:
Parental leave policies for primary and se-condary carers Flexible work schedules Equal pay and the gender pay gap Combatting sexual harassment in the work-
place Supplier diversity including procurement
from women owned or led companies Endorsement of the Women’s Empowerment
Principles, and Independent gender audits
At the same time Equileap’s research team looked for data on all of the criteria. At the end of this process the Secondary Equileap Gender Equality Ranking was carried out.
Third stage - Weighting and Grading In-formation
Companies are awarded points on a scale of 0-100. The first and second stages may pro-duce a series of groups within which com-panies have the same total score. The final ranking is based on which companies in each group perform best on Criterion 5: Promotion and Career Development, and then, if neces-sary, Criteria 4, 3, 2, 1, in that order.
Companies in the data sample have been ordered using all three stages to produce the overall 2018 Equileap Gender Equality Ranking.
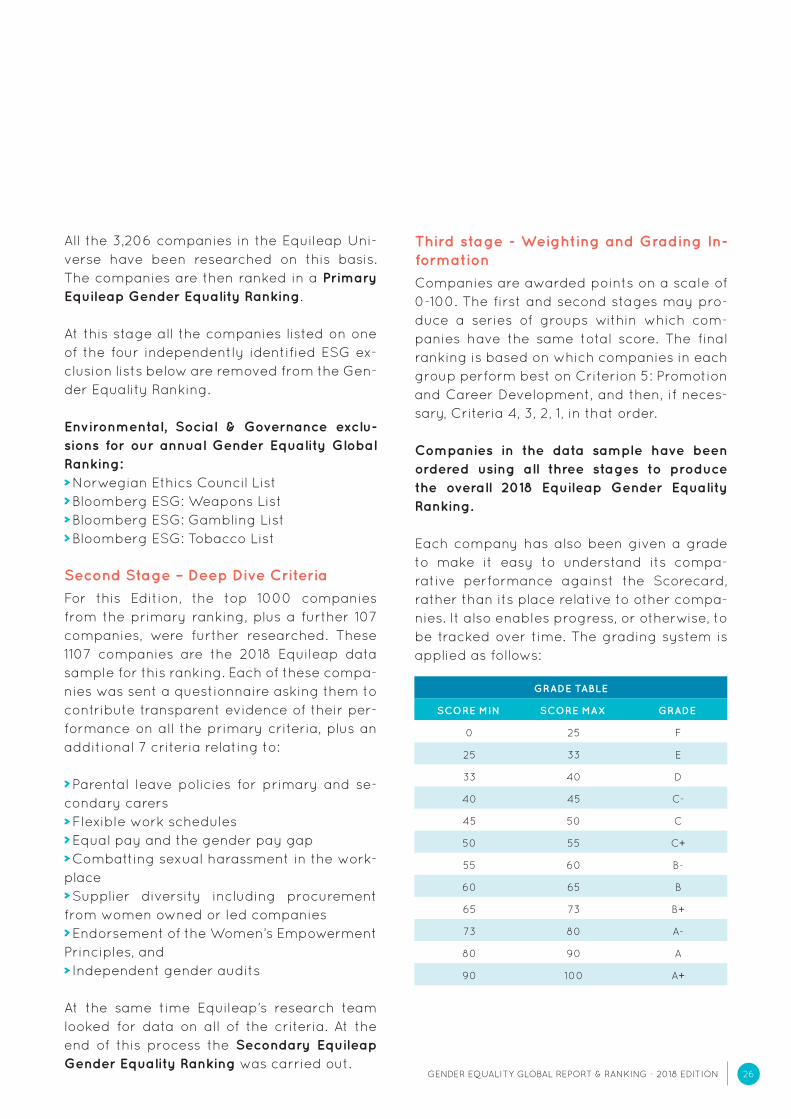
Each company has also been given a grade to make it easy to understand its compa-rative performance against the Scorecard, rather than its place relative to other compa-nies. It also enables progress, or otherwise, to be tracked over time. The grading system is applied as follows:
GRADE TABLE
SCORE MIN SCORE MAX GRADE
0 25 F
25 33 E
33 40 D
40 45 C-
45 50 C
50 55 C+
55 60 B-
60 65 B
65 73 B+
73 80 A-
80 90 A
90 100 A+
27GENDER EQUALITY GLOBAL REPORT & RANKING - 2018 EDITION
Fourth stage - Alarm Bell Process
In collaboration with the Business and Human Rights Resource Centre in London, Equileap also carries out research under its alarm bell methodology. We look for companies that within the past 2 years have had:
a) A legal judgement or an official ruling re-garding gender discrimination or sexual harassment against the company or an employee, or
b) Two or more legal cases, or one class action that have been settled against a company or an employee regarding gender discrimination or sexual harass-ment, or
c) Two or more legal judgements or official rulings regarding gender discriminatory practices in a company’s marketing and advertising.
Companies that trigger the alarm are in-cluded in the ranking marked with an alarm, however they are excluded from the family of Equileap gender equality indices used as un-derlyings for investment products (See page 13 for further details).
This year, the research data was locked on June 30th 2018.
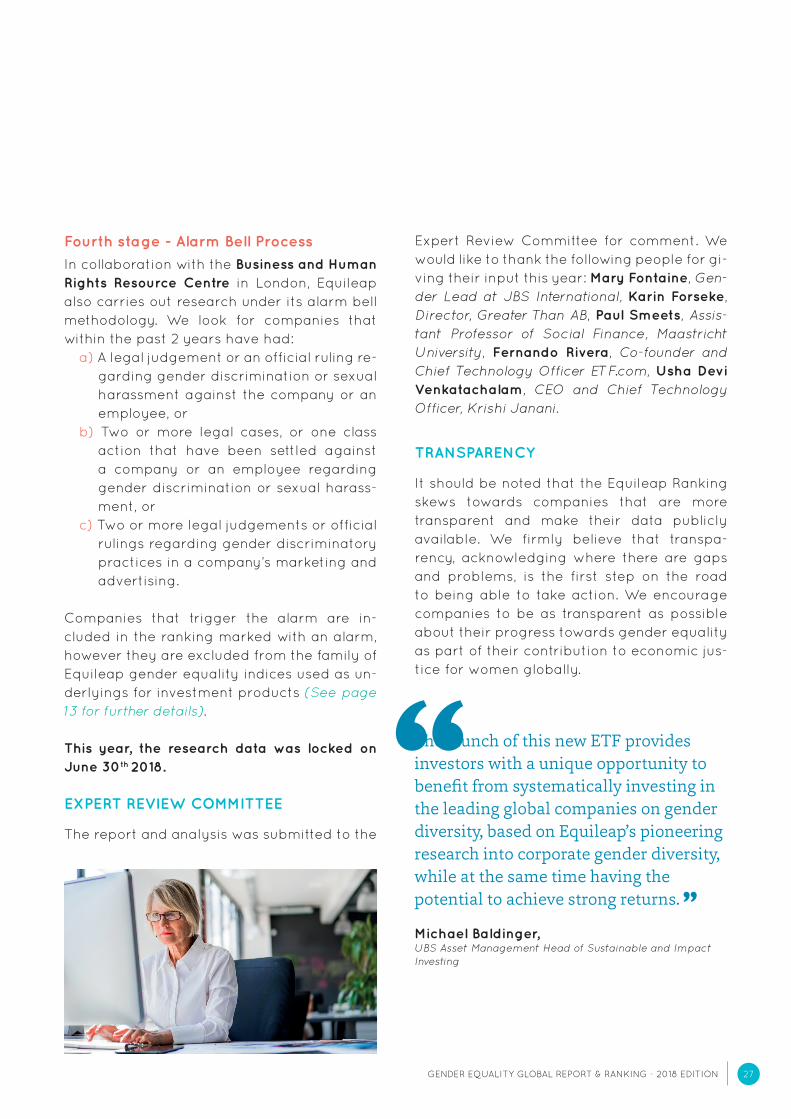
EXPERT REVIEW COMMITTEE
The report and analysis was submitted to the
Expert Review Committee for comment. We would like to thank the following people for gi-ving their input this year: Mary Fontaine, Gen-der Lead at JBS International, Karin Forseke, Director, Greater Than AB, Paul Smeets, Assis-tant Professor of Social Finance, Maastricht University, Fernando Rivera, Co-founder and Chief Technology Officer ETF.com, Usha Devi Venkatachalam, CEO and Chief Technology Officer, Krishi Janani.
TRANSPARENCY
It should be noted that the Equileap Ranking skews towards companies that are more transparent and make their data publicly available. We firmly believe that transpa-rency, acknowledging where there are gaps and problems, is the first step on the road to being able to take action. We encourage companies to be as transparent as possible about their progress towards gender equality as part of their contribution to economic jus-tice for women globally.
The launch of this new ETF provides investors with a unique opportunity to benefit from systematically investing in the leading global companies on gender diversity, based on Equileap’s pioneering research into corporate gender diversity, while at the same time having the potential to achieve strong returns.
Michael Baldinger, UBS Asset Management Head of Sustainable and Impact Investing
28GENDER EQUALITY GLOBAL REPORT & RANKING - 2018 EDITION
2018 SCORECARD
EQUILEAP CRITERIA DEFINITION
A GENDER BALANCE IN LEADERSHIP & WORKFORCE
1 Board of Directors Gender balance of the company’s board of directors/non-executive board (or supervisory board)
2 Executives Gender balance of the company’s executives / executive board
3 Senior Management Gender balance of the company’s senior management
4 Workforce Gender balance of the company’s total employee workforce
5 Promotion & Career Development Opportunities
Ratio of each gender in senior management compared to ratio of each gender in the workforce
B EQUAL COMPENSATION & WORK LIFE BALANCE
6 Fair Remuneration Commitment to pay a fair wage to all employees, even in those countries that do not legally require a minimum wage
7 Gender Pay Gap and Equal Pay Transparency regarding comparable wages for comparable work and commitment to close the gender pay gap
8 Parental Leave Paid leave programmes to both women and men (primary and secondary carers) in country of incorporation
9 Flexible Work Options Option to employees to control and or vary the start and end times of the work day, and or vary the location from which employees work
C POLICIES PROMOTING GENDER EQUALITY
10 Training and Career Development Commitment to ensure equal access to training and career development to both men and women, at all levels of the company
11 Recruitment Strategy Commitment to ensure non-discrimination against any type of demographic group including women
12 Freedom from Violence, Abuse and Sexual Harassment
Prohibits all forms of violence in the work place, including verbal, physical and sexual harassment
13 Safety at Work Commitment to the safety of employees in the workplace, in travel to and from the workplace and on company related business, and ensure the safety of vendors in the workplace
14 Human Rights Commitment to ensure the protection of human rights, including employees’ rights to participate in legal, civic and political affairs
15 Social Supply Chain Commitment to reduce social risks in its supply chain such as forbid business related activities that condone, support, or otherwise participate in trafficking, including for labour or sexual exploitation
16 Supplier Diversity Commitment to ensure diversity in its supply chain, including procurement from women owned / women-led businesses
17 Employee Protection Systems and policies for the reporting of internal ethical compliance complaints without retaliation or retribution, such as access to confidential third-party ethics hotlines or systems for confidential written complaints
D COMMITMENT, TRANSPARENCY & ACCOUNTABILITY
18 Commitment to Women’s Empowerment Signatory of the Women’s Empowerment Principles
19 Audit Awarded an independent gender audit certificate by an Equileap recognised body
E ALARM BELLS
Companies are also monitored for unethical business practices. We register if a company has a record of any of the following: A legal judgement or official ruling regarding gender discrimination or sexual harassment against the company or an employee Two or more legal cases, or one class action that have been settled against a company or an employee regarding gender discrimination or sexual harassment Two or more legal judgements or official rulings regarding gender discriminatory practices in a company’s marketing and advertising
=
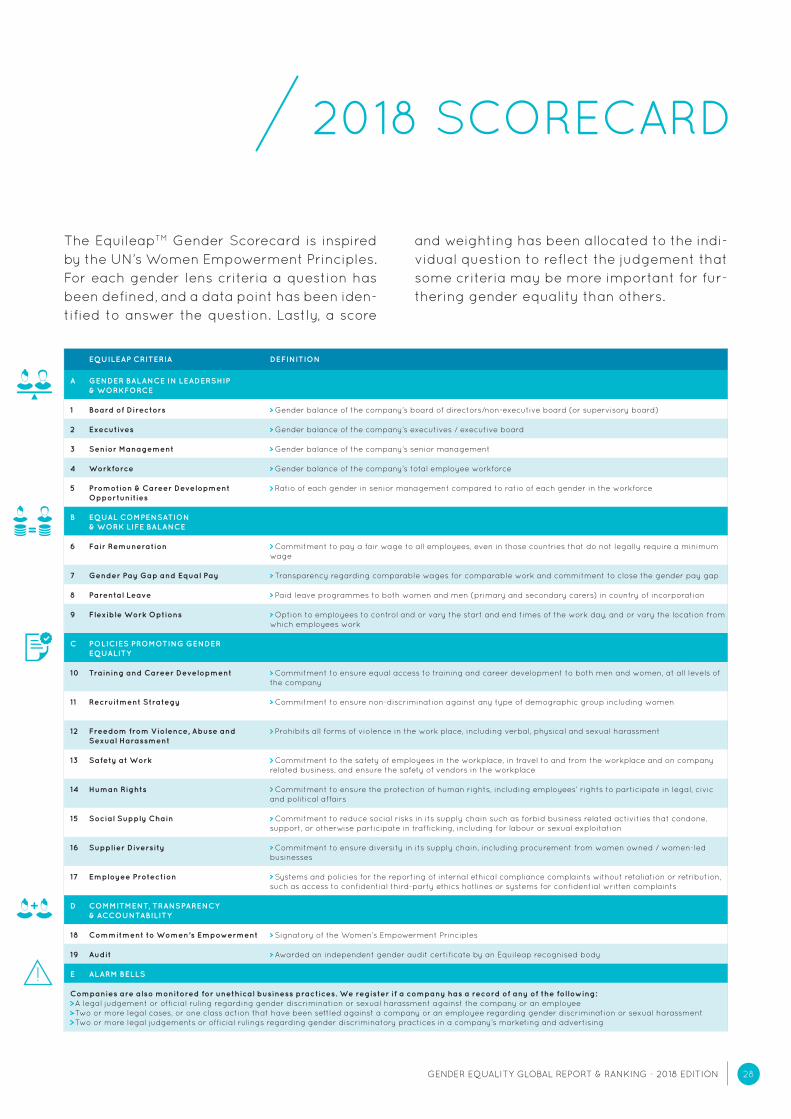
The EquileapTM Gender Scorecard is inspired by the UN’s Women Empowerment Principles. For each gender lens criteria a question has been defined, and a data point has been iden-tified to answer the question. Lastly, a score
and weighting has been allocated to the indi-vidual question to reflect the judgement that some criteria may be more important for fur-thering gender equality than others.
29GENDER EQUALITY GLOBAL REPORT & RANKING - 2018 EDITION
2018 SCORECARD ABOUT EQUILEAP
MISSION & GOALS
Equileap is a social venture that aims to accelerate progress towards gender equality in the workplace as a vital lever in reducing poverty and inequality.
Equileap tackles its mission by collecting and checking data, carrying out research, and ranking and rating companies on their gender equality performance. It supports investors to deploy their capital with a gender lens, companies to improve their performance, and policy makers to bring in effective frameworks to increase gender equality at work.
EQUILEAP TOOL-KIT
Equileap Gender Database – Equileap has built the most comprehensive database on gender equality in corporations, investigating manually and in-depth 3206 publicly-traded companies with a market capitalisation above USD 2 billion in 23 developed countries.
Individual Company Reports - Detailed documents with an in-depth analysis of each company’s performance compared to its sector, country and competitors. The reports enable a company to understand where they do well and how they can make more progress towards gender equality.
Gender Equality Indices – A family of indices (Global, North America, US and European) designed to track companies leading the field in terms of gender equality. These indices can be used as benchmarks or underlyings of financial products. Initial back-testing shows that the gender indices have outperformed their respective benchmark, including the S&P500 and MSCI World.
Equileap Research - Specialist research reports based on Equileap data, focusing on areas of specific interest. This year’s report, issued in April, is Bridging the Gap – How Governments Companies and Investors Can Tackle Gender Pay Inequality. Next year’s report will be on gender violence in the workplace. Bespoke research reports can also be carried out at request.
Equileap Projects - We carry out a number of specialist research projects looking at gender equality in different markets, and can evaluate existing investment portfolios against the Equileap Scorecard.
Equileap Foundation - Equileap is a social enterprise, any net profits it generates will pass to the Equileap Foundation to make loans and grant to support women overcome the obstacles they face in obtaining good employment at a fair wage.
APPEALS PROCESS
Equileap works hard with its partners to ensure the information in the Ranking is accurate but, if an error has been made, or com-panies have not published their gender data or policies in their own reports, or if they did not re-ply to Equileap’s inquiries, they are invited to submit information now, and request that their entry and data is corrected. Please e-mail [email protected].
30GENDER EQUALITY GLOBAL REPORT & RANKING - 2018 EDITION
ACKNOWLEDGMENTS
Equileap would not exist without the support and help of several organisations and indivi-duals, some prefer to remain anonymous. We
Disclaimer
The information contained in this report has been prepared by
Stichting Equileap Foundation in collaboration with Equileap Investment
Services Support (together “Equileap”). No part of this report may be
reproduced in any manner without the prior written permission of
Equileap.
This report is intended for general information purposes only and is
not intended as promotional material in any respect. The report does
not constitute, or form part of, any offer to sell or issue, or invitation
to purchase or subscribe for, any financial instrument. Nor shall the
information contained in this report or any part of it, or the fact
of its existence or distribution, form the basis of, or be relied on in
connection with, any contract or investment decision, nor does it
constitute a recommendation regarding financial instruments.
The report should not be treated as giving accounting, legal,
regulatory, tax, research or investment advice or recommendations,
and should not be relied upon as a representation of any matter that a
potential investor should consider when evaluating an investment. The
information contained in this report does not take into account the
objectives, financial situation or needs of any person, and independent
personal advice should be obtained. Recipients of this report
should inform themselves about and observe any applicable legal
requirements in their jurisdiction. In particular, the distribution of this
report may be restricted by law in certain jurisdictions. Accordingly,
recipients represent that they are able to receive this report without
contravention of any applicable legal or regulatory restrictions in the
jurisdiction in with they reside or conduct business.
Any views expressed in this report represent the views of Equileap only.
The information and opinions contained in this report are provided
as of this date and are subject to change without notice and as such
may change materially. The statements, findings, interpretations,
opinions and conclusions expressed in this report are developed in
accordance with Equileap’s professional standards and the information
used has been obtained from sources which we believe to be reliable
but none of Equileap nor any of its agents, representatives, advisers,
affiliates, directors, officers or employees («Representatives»)
accept any responsibility for or make any representation, warranty,
guarantee or undertaking (either express or implied) as to the truth,
accuracy, reliability, correctness or completeness of the information
and opinions contained in this report or any other information made
available in connection with this report. Neither Equileap nor any of
its Representatives undertake any obligation to provide the recipients
of this report with additional information or to update the information
contained therein or to correct any inaccuracies which may become
apparent.
To the maximum extent permitted by law any responsibility or liability
for this report or any related material is expressly disclaimed. Neither
Equileap nor its Representatives accept or assume any liability,
responsibility or duty of care for any consequences of any person
acting, or refraining to act, in reliance on the information contained in
this report or any decision based on it.
Any disputes, claims or proceedings in connection with or arising in
relation to this report will be governed by and construed in accordance
with Dutch law and submitted to the exclusive jurisdiction of the courts
in The Netherlands.
Attribution
This work is owned by the Stichting Equileap Foundation, which is
registered by the fiscal authorities of The Kingdom of The Netherlands
as a tax exempt Algemeen Nut Beogende Instelling (ANBI), RSIN/
Fiscaal Identificatie Nummer 8560 58 88.
This work is licensed under a Creative Commons Attribution-
NonCommercial-NoDerivatives 4.0 International Licence https://creativecommons.org/licences/by-nc-nd/4.0/. You are free to copy
and redistribute this work in any medium or format provided that you
give credit to Equileap Foundation and that you do not alter, transform,
translate of otherwise modify the content in any way. Any commercial use of this material or any part of it will require a licence. Those wishing to commercialise the use should contact Equileap at [email protected].
would like to thank all of them for their input, which has been crucial.

ACKNOWLEDGMENTS
[email protected] 31 6 2818 1219www.equileap.org
@equileap
www.google+/equileap
www.linkedin.com/company/equileap


![C C!C!C B]B B¥BlB·BrB¢B®B B¤B~B B BdB·B - Fujitsu...C C!C!C B]B B¥BlB·BrB¢B®B1.3. B 4?" B 1 !ªB1 2 ¸ {AîBpB·B Bt / 0 C C!C!C Ñ!ª(*B1 Ñ " H 0 B BpB·B Bt Ñ!ª o 0](https://img.pdfslide.net/doc/110x75/60a9b5ef1dcf032ca5305f6d/c-ccc-bb-bblbbrbbb-bbb-b-bdbb-fujitsu-c-ccc-bb-bblbbrbbb13.jpg)


![& c & D & B] ffi 0](https://img.pdfslide.net/doc/110x75/625d7955937ddb24e8191ec0/amp-c-amp-d-amp-b-ffi-0.jpg)