Embed Size (px)
Citation preview
Workplace Gender Equality Agency | Gender pay gap statistics | www.wgea.gov.au 1
August 2014
Gender pay gap statistics
Contents Gender pay gap statistics .................................................................................................... 1
About this fact sheet ......................................................................................................... 2
National ............................................................................................................................ 2
State and territory ............................................................................................................. 3
Equal pay day ................................................................................................................... 4
Industry ............................................................................................................................. 4
Occupation ....................................................................................................................... 6
Private and public sector .................................................................................................. 7
Age group ......................................................................................................................... 8
Method of setting pay ....................................................................................................... 8
Organisational gender pay gap analysis ........................................................................... 9
Workplace Gender Equality Agency | Gender pay gap statistics | www.wgea.gov.au 2
About this fact sheet The gender pay gap is the difference between women’s and men’s average weekly full-time equivalent
earnings, expressed as a percentage of men’s earnings. The Agency calculates the national gender pay gap
using Australian Bureau of Statistics' Average Weekly Full-Time Earnings data (cat. no. 6302.0). The
national gender pay gap is currently 18.2%1 and has hovered between 15% and 18% for the past two
decades.
The gender pay gap is influenced by a number of interrelated work, family and societal factors, including
stereotypes about the work women and men ‘should’ do, and the way women and men ‘should’ engage in
the workforce. Other factors that contribute to the gender pay gap include:
women and men working in different industries (industrial segregation) and different jobs (occupational
segregation). Historically, female-dominated industries and jobs have attracted lower wages than male-dominated industries and jobs
a lack of women in senior positions, and a lack of part-time or flexible senior roles. Women are more likely
than men to work part-time or flexibly because they still undertake most of society’s unpaid caring work and may find it difficult to access senior roles
women’s more precarious attachment to the workforce (largely due to their unpaid caring responsibilities)
differences in education, work experience and seniority
discrimination, both direct and indirect.
This fact sheet details the gender pay gap by states and territories, industries, occupations, sectors, age
groups and methods of pay. The data were sourced primarily from the Australian Bureau of Statistics’ (ABS)
Average Weekly Earnings dataset,2 which calculates the average full-time weekly earnings before tax,
excluding factors such as overtime and pay that is salary sacrificed. Where data were unavailable from
average weekly earnings (such as by occupation category), these data were sourced from the ABS
Employee Earnings, Benefits and Trade Union Membership survey3 and the ABS Employee Earnings and
Hours survey.4 Information about whether organisations have conducted or plan to conduct a gender pay
gap analysis is derived from the Agency’s voluntary telephone survey conducted in the 2012-13 reporting
period.5
For more information on how the gender pay gap is measured and interpreted refer to the Gender Pay Gap
Taskforce Report.
National In May 2014, the gender pay gap stood at 18.2%.
6
The average weekly ordinary time earnings of women working full-time were $1,275.90 per week,
compared to men who earned an average weekly wage of $1,559.10 per week, making women’s average earnings $283.20 per week less than men.
There has been an increase of over half a percentage point (+0.7 pp) in the gender pay gap since May
2013. Since May 1995, the gender pay gap has increased slightly by nearly two percentage points (+1.7 pp).
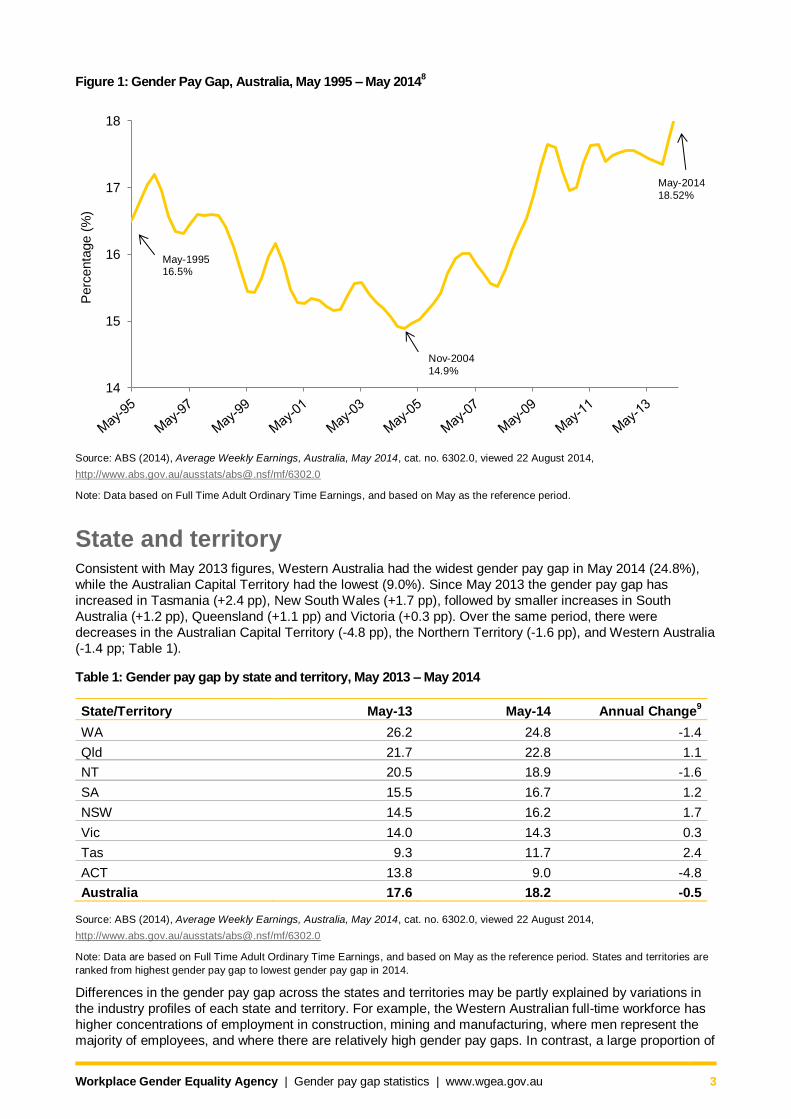
Over this 19 year period the gender pay gap was lowest in November 2004, at 14.9% (Figure 1). While a
number of factors contribute to changes in the gender pay gap, including major changes in Government
policy,7 no causal links have been found to adequately explain the 2004 dip in the gender pay gap, or its
subsequent steep rise.
Workplace Gender Equality Agency | Gender pay gap statistics | www.wgea.gov.au 3
Figure 1: Gender Pay Gap, Australia, May 1995 – May 20148
Source: ABS (2014), Average Weekly Earnings, Australia, May 2014, cat. no. 6302.0, viewed 22 August 2014,
http://www.abs.gov.au/ausstats/[email protected]/mf/6302.0
Note: Data based on Full Time Adult Ordinary Time Earnings, and based on May as the reference period.
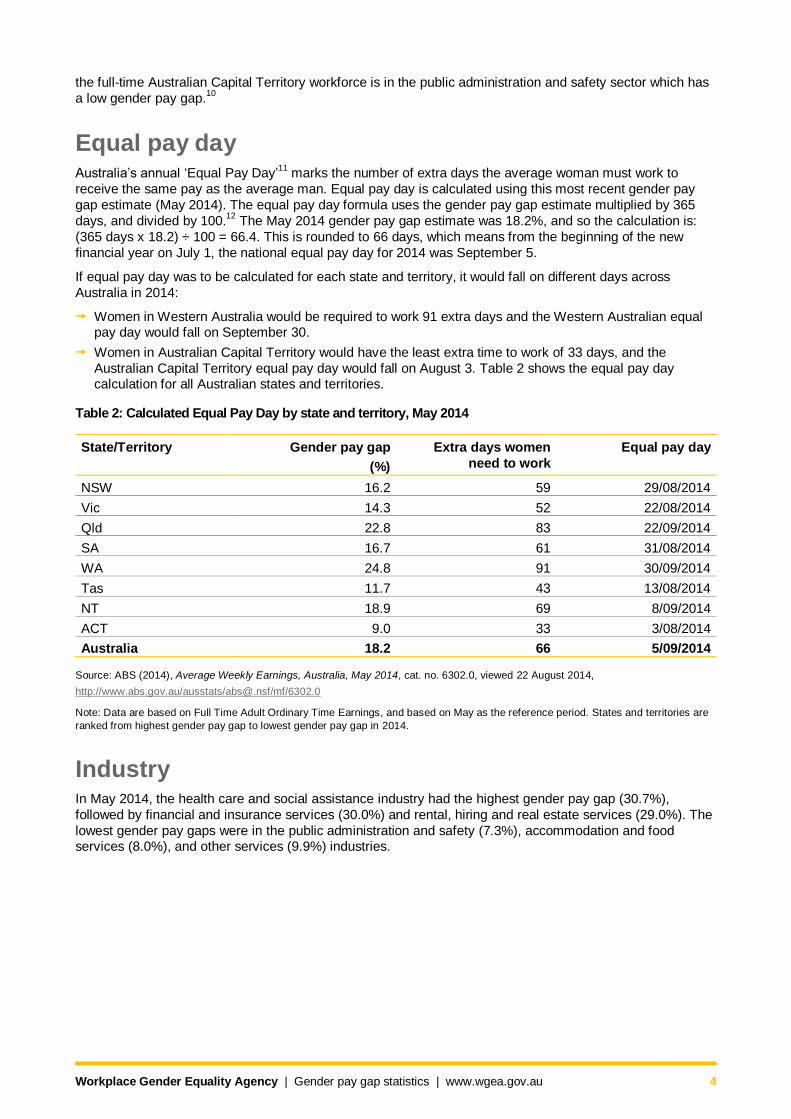
State and territory Consistent with May 2013 figures, Western Australia had the widest gender pay gap in May 2014 (24.8%),
while the Australian Capital Territory had the lowest (9.0%). Since May 2013 the gender pay gap has
increased in Tasmania (+2.4 pp), New South Wales (+1.7 pp), followed by smaller increases in South
Australia (+1.2 pp), Queensland (+1.1 pp) and Victoria (+0.3 pp). Over the same period, there were
decreases in the Australian Capital Territory (-4.8 pp), the Northern Territory (-1.6 pp), and Western Australia
(-1.4 pp; Table 1).
Table 1: Gender pay gap by state and territory, May 2013 – May 2014
State/Territory May-13 May-14 Annual Change9
WA 26.2 24.8 -1.4
Qld 21.7 22.8 1.1
NT 20.5 18.9 -1.6
SA 15.5 16.7 1.2
NSW 14.5 16.2 1.7
Vic 14.0 14.3 0.3
Tas 9.3 11.7 2.4
ACT 13.8 9.0 -4.8
Australia 17.6 18.2 -0.5
Source: ABS (2014), Average Weekly Earnings, Australia, May 2014, cat. no. 6302.0, viewed 22 August 2014,
http://www.abs.gov.au/ausstats/[email protected]/mf/6302.0
Note: Data are based on Full Time Adult Ordinary Time Earnings, and based on May as the reference period. States and territories are
ranked from highest gender pay gap to lowest gender pay gap in 2014.
Differences in the gender pay gap across the states and territories may be partly explained by variations in
the industry profiles of each state and territory. For example, the Western Australian full-time workforce has
higher concentrations of employment in construction, mining and manufacturing, where men represent the
majority of employees, and where there are relatively high gender pay gaps. In contrast, a large proportion of
14
15
16
17
18
Perc
enta
ge (
%)
Nov-2004
14.9%
May-2014
18.52%
May-1995 16.5%
Workplace Gender Equality Agency | Gender pay gap statistics | www.wgea.gov.au 4
the full-time Australian Capital Territory workforce is in the public administration and safety sector which has
a low gender pay gap.10
Equal pay day Australia’s annual ‘Equal Pay Day’
11 marks the number of extra days the average woman must work to
receive the same pay as the average man. Equal pay day is calculated using this most recent gender pay
gap estimate (May 2014). The equal pay day formula uses the gender pay gap estimate multiplied by 365
days, and divided by 100.12
The May 2014 gender pay gap estimate was 18.2%, and so the calculation is:
(365 days x 18.2) ÷ 100 = 66.4. This is rounded to 66 days, which means from the beginning of the new
financial year on July 1, the national equal pay day for 2014 was September 5.
If equal pay day was to be calculated for each state and territory, it would fall on different days across
Australia in 2014:
Women in Western Australia would be required to work 91 extra days and the Western Australian equal pay day would fall on September 30.
Women in Australian Capital Territory would have the least extra time to work of 33 days, and the
Australian Capital Territory equal pay day would fall on August 3. Table 2 shows the equal pay day calculation for all Australian states and territories.
Table 2: Calculated Equal Pay Day by state and territory, May 2014
State/Territory Gender pay gap
(%)
Extra days women
need to work
Equal pay day
NSW 16.2 59 29/08/2014
Vic 14.3 52 22/08/2014
Qld 22.8 83 22/09/2014
SA 16.7 61 31/08/2014
WA 24.8 91 30/09/2014
Tas 11.7 43 13/08/2014
NT 18.9 69 8/09/2014
ACT 9.0 33 3/08/2014
Australia 18.2 66 5/09/2014
Source: ABS (2014), Average Weekly Earnings, Australia, May 2014, cat. no. 6302.0, viewed 22 August 2014,
http://www.abs.gov.au/ausstats/[email protected]/mf/6302.0
Note: Data are based on Full Time Adult Ordinary Time Earnings, and based on May as the reference period. States and territories are
ranked from highest gender pay gap to lowest gender pay gap in 2014.
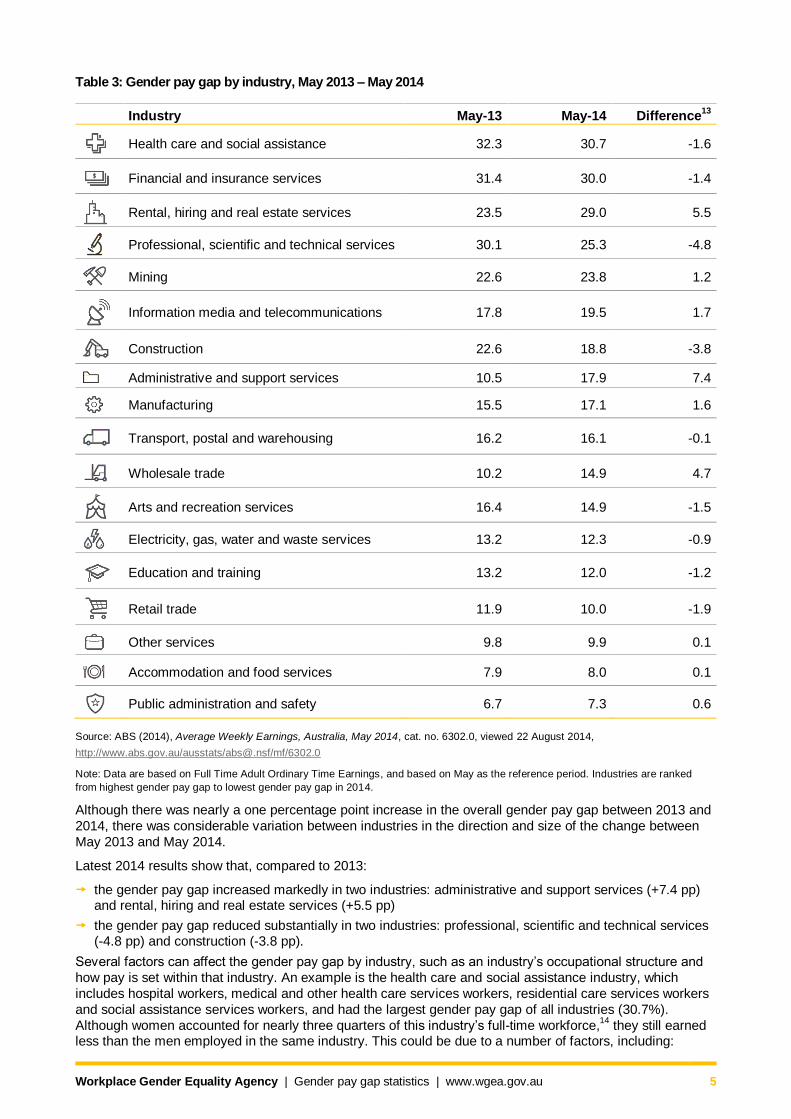
Industry In May 2014, the health care and social assistance industry had the highest gender pay gap (30.7%),
followed by financial and insurance services (30.0%) and rental, hiring and real estate services (29.0%). The
lowest gender pay gaps were in the public administration and safety (7.3%), accommodation and food services (8.0%), and other services (9.9%) industries.
Workplace Gender Equality Agency | Gender pay gap statistics | www.wgea.gov.au 5
Table 3: Gender pay gap by industry, May 2013 – May 2014
Industry May-13 May-14 Difference13
Health care and social assistance 32.3 30.7 -1.6
Financial and insurance services 31.4 30.0 -1.4
Rental, hiring and real estate services 23.5 29.0 5.5
Professional, scientific and technical services 30.1 25.3 -4.8
Mining 22.6 23.8 1.2
Information media and telecommunications 17.8 19.5 1.7
Construction 22.6 18.8 -3.8
Administrative and support services 10.5 17.9 7.4
Manufacturing 15.5 17.1 1.6
Transport, postal and warehousing 16.2 16.1 -0.1
Wholesale trade 10.2 14.9 4.7
Arts and recreation services 16.4 14.9 -1.5
Electricity, gas, water and waste services 13.2 12.3 -0.9
Education and training 13.2 12.0 -1.2
Retail trade 11.9 10.0 -1.9
Other services 9.8 9.9 0.1
Accommodation and food services 7.9 8.0 0.1
Public administration and safety 6.7 7.3 0.6
Source: ABS (2014), Average Weekly Earnings, Australia, May 2014, cat. no. 6302.0, viewed 22 August 2014,
http://www.abs.gov.au/ausstats/[email protected]/mf/6302.0
Note: Data are based on Full Time Adult Ordinary Time Earnings, and based on May as the reference period. Industries are ranked
from highest gender pay gap to lowest gender pay gap in 2014.
Although there was nearly a one percentage point increase in the overall gender pay gap between 2013 and
2014, there was considerable variation between industries in the direction and size of the change between
May 2013 and May 2014.
Latest 2014 results show that, compared to 2013:
the gender pay gap increased markedly in two industries: administrative and support services (+7.4 pp) and rental, hiring and real estate services (+5.5 pp)
the gender pay gap reduced substantially in two industries: professional, scientific and technical services (-4.8 pp) and construction (-3.8 pp).
Several factors can affect the gender pay gap by industry, such as an industry’s occupational structure and
how pay is set within that industry. An example is the health care and social assistance industry, which
includes hospital workers, medical and other health care services workers, residential care services workers
and social assistance services workers, and had the largest gender pay gap of all industries (30.7%).
Although women accounted for nearly three quarters of this industry’s full-time workforce,14
they still earned less than the men employed in the same industry. This could be due to a number of factors, including:
Workplace Gender Equality Agency | Gender pay gap statistics | www.wgea.gov.au 6
Two in five general practitioners were women and one in three medical specialists were women (medical specialists are usually higher paid than general practitioners).
15
The vast majority of surgeons were men,16
and overall, male doctors earned more than female doctors.17
Women in this industry were predominantly employed in caring roles (e.g. residential care services and social assistance services), which have historically been undervalued and underpaid.
18
A large share (43.4%) of male employees had their pay set by individual arrangement, while a large share (45.9%) of women had their pay set by collective agreement.
19
Men represented the vast majority (86%) of CEOs within this industry.20
For more information on specific industries, refer to the ‘all industries snapshot’, the ‘gender diversity by
industry spreadsheet’ and the interactive data centre dashboards on the WGEA website.
Occupation The ABS average weekly earnings dataset does not include data on average weekly earnings by occupation.
The most recent data providing this information is the ABS Employee Earnings, Benefits and Trade Union
Membership survey, released in June 2014. Using this dataset, the overall gender pay gap for women and
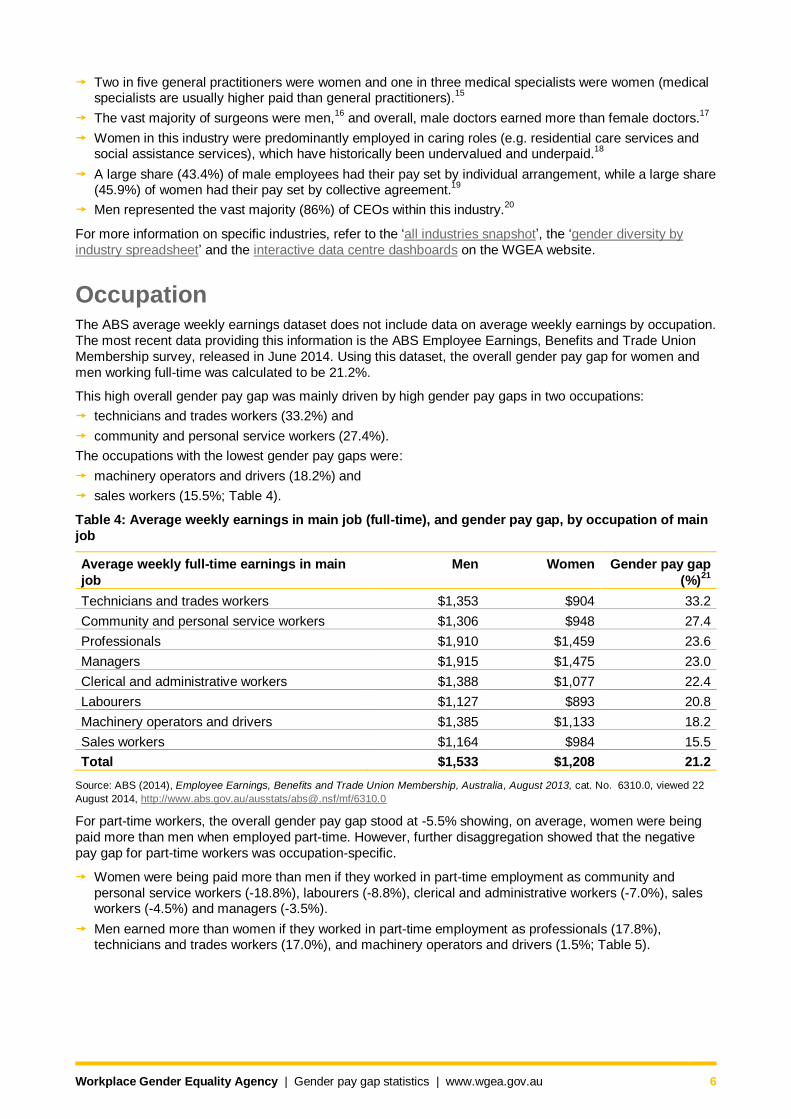
men working full-time was calculated to be 21.2%.
This high overall gender pay gap was mainly driven by high gender pay gaps in two occupations:
technicians and trades workers (33.2%) and
community and personal service workers (27.4%).
The occupations with the lowest gender pay gaps were:
machinery operators and drivers (18.2%) and
sales workers (15.5%; Table 4).
Table 4: Average weekly earnings in main job (full-time), and gender pay gap, by occupation of main
job
Average weekly full-time earnings in main
job
Men Women Gender pay gap
(%)21
Technicians and trades workers $1,353 $904 33.2
Community and personal service workers $1,306 $948 27.4
Professionals $1,910 $1,459 23.6
Managers $1,915 $1,475 23.0
Clerical and administrative workers $1,388 $1,077 22.4
Labourers $1,127 $893 20.8
Machinery operators and drivers $1,385 $1,133 18.2
Sales workers $1,164 $984 15.5
Total $1,533 $1,208 21.2
Source: ABS (2014), Employee Earnings, Benefits and Trade Union Membership, Australia, August 2013, cat. No. 6310.0, viewed 22
August 2014, http://www.abs.gov.au/ausstats/[email protected]/mf/6310.0
For part-time workers, the overall gender pay gap stood at -5.5% showing, on average, women were being
paid more than men when employed part-time. However, further disaggregation showed that the negative
pay gap for part-time workers was occupation-specific.
Women were being paid more than men if they worked in part-time employment as community and
personal service workers (-18.8%), labourers (-8.8%), clerical and administrative workers (-7.0%), sales workers (-4.5%) and managers (-3.5%).
Men earned more than women if they worked in part-time employment as professionals (17.8%), technicians and trades workers (17.0%), and machinery operators and drivers (1.5%; Table 5).
Workplace Gender Equality Agency | Gender pay gap statistics | www.wgea.gov.au 7
Table 5: Average weekly earnings in main job (part-time), and gender pay gap, by occupation and main job
Average weekly part-time earnings in main
job
Men Women Gender pay gap
(%)22
Professionals $969 $797 17.8
Technicians and trades workers $578 $480 17.0
Machinery operators and drivers $525 $517 1.5
Managers $839 $868 -3.5
Sales workers $310 $324 -4.5
Clerical and administrative workers $554 $593 -7.0
Labourers $340 $370 -8.8
Community and personal service workers $400 $475 -18.8
Total $507 $535 -5.5
Source: ABS (2014), Employee Earnings, Benefits and Trade Union Membership, Australia, August 2013, cat. No. 6310.0, viewed 22
August 2014, http://www.abs.gov.au/ausstats/[email protected]/mf/6310.0
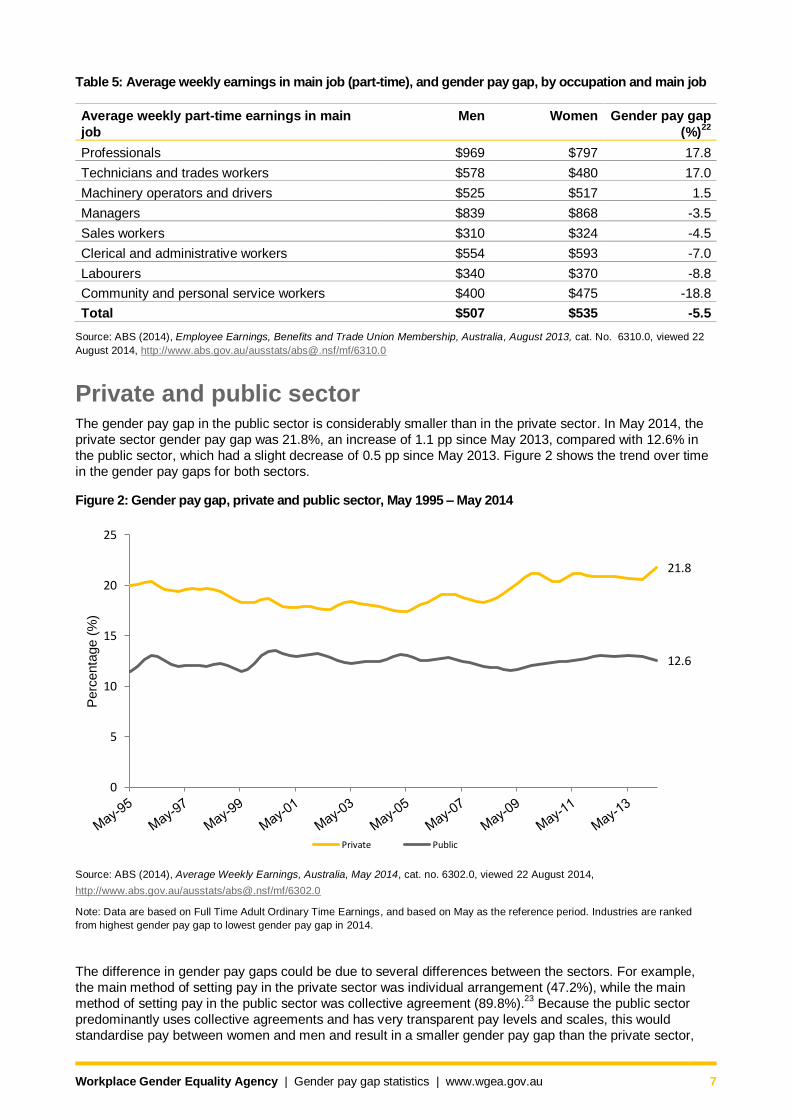
Private and public sector The gender pay gap in the public sector is considerably smaller than in the private sector. In May 2014, the
private sector gender pay gap was 21.8%, an increase of 1.1 pp since May 2013, compared with 12.6% in
the public sector, which had a slight decrease of 0.5 pp since May 2013. Figure 2 shows the trend over time
in the gender pay gaps for both sectors.
Figure 2: Gender pay gap, private and public sector, May 1995 – May 2014
Source: ABS (2014), Average Weekly Earnings, Australia, May 2014, cat. no. 6302.0, viewed 22 August 2014,
http://www.abs.gov.au/ausstats/[email protected]/mf/6302.0
Note: Data are based on Full Time Adult Ordinary Time Earnings, and based on May as the reference period. Industries are ranked
from highest gender pay gap to lowest gender pay gap in 2014.
The difference in gender pay gaps could be due to several differences between the sectors. For example,
the main method of setting pay in the private sector was individual arrangement (47.2%), while the main
method of setting pay in the public sector was collective agreement (89.8%).23
Because the public sector
predominantly uses collective agreements and has very transparent pay levels and scales, this would
standardise pay between women and men and result in a smaller gender pay gap than the private sector,
21.8
12.6
0
5
10
15
20
25
Perc
enta
ge (
%)
Private Public
Workplace Gender Equality Agency | Gender pay gap statistics | www.wgea.gov.au 8
where individual agreements are common and likely to result in large pay differences between women and
men.24
Other factors that could contribute to the difference between the gender pay gaps by sector include:25
the public sector is situated in a politically-driven environment, while the private sector resides in a market-driven environment
differences in the levels of occupational integration (balanced proportion of women and men in an occupation)
differences in the implementation of anti-discrimination legislation
differences in the size of establishments
differences in the education and qualifications of workers.
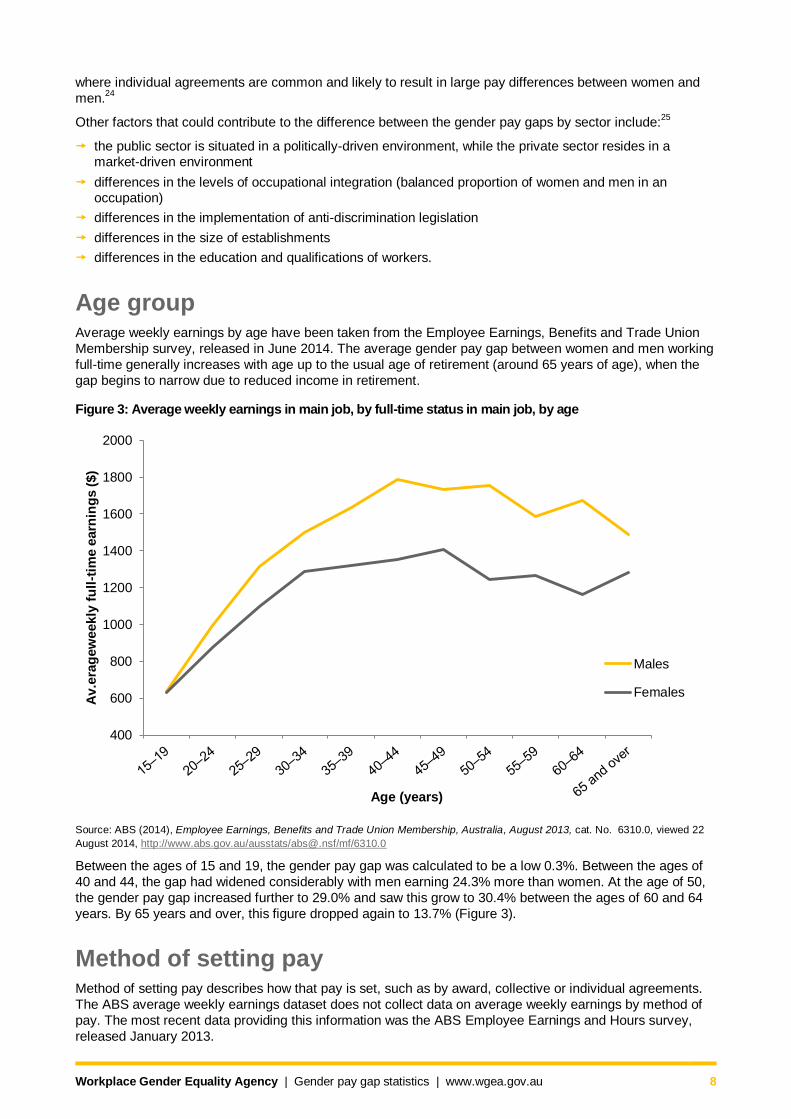
Age group Average weekly earnings by age have been taken from the Employee Earnings, Benefits and Trade Union
Membership survey, released in June 2014. The average gender pay gap between women and men working
full-time generally increases with age up to the usual age of retirement (around 65 years of age), when the
gap begins to narrow due to reduced income in retirement.
Figure 3: Average weekly earnings in main job, by full-time status in main job, by age
Source: ABS (2014), Employee Earnings, Benefits and Trade Union Membership, Australia, August 2013, cat. No. 6310.0, viewed 22
August 2014, http://www.abs.gov.au/ausstats/[email protected]/mf/6310.0
Between the ages of 15 and 19, the gender pay gap was calculated to be a low 0.3%. Between the ages of
40 and 44, the gap had widened considerably with men earning 24.3% more than women. At the age of 50,
the gender pay gap increased further to 29.0% and saw this grow to 30.4% between the ages of 60 and 64
years. By 65 years and over, this figure dropped again to 13.7% (Figure 3).
Method of setting pay Method of setting pay describes how that pay is set, such as by award, collective or individual agreements.
The ABS average weekly earnings dataset does not collect data on average weekly earnings by method of
pay. The most recent data providing this information was the ABS Employee Earnings and Hours survey,
released January 2013.
400
600
800
1000
1200
1400
1600
1800
2000
Av.e
rag
ew
eekly
fu
ll-t
ime e
arn
ing
s (
$)
Age (years)
Males
Females
Workplace Gender Equality Agency | Gender pay gap statistics | www.wgea.gov.au 9
Table 6: Average weekly earnings (full-time) and gender pay gap, by method of setting pay
Method of setting pay Men Women Gender pay gap
(%)26
Award only $923 $947 -2.5
Collective agreement $1,634 $1,357 16.9
Individual arrangement $1,625 $1,290 20.6
Overall $1,558 $1,278 18.0
Source: ABS (2013), Employee Earnings and Hours, Australia, May 2012, cat. no. 6306.0, viewed 22 August 2014,
http://www.abs.gov.au/AUSSTATS/[email protected]/mf/6306.0
Among full-time employees:
the average weekly total cash earnings for those who had their pay set by individual agreement were substantially higher for men than women, resulting in a gender pay gap of 20.6%
the average weekly total cash earnings for those who had their pay set by collective agreement were also higher for men than women
the difference in full-time earnings was much smaller for those whose pay was set by award only, where women earned slightly more than men (Table 6).
This indicates that there is a more equal distribution of pay between women and men when pay is set by
federal or state industrial authorities, than when it is set by agreements made collectively between
employees and their employer or by individual agreement with the employer.
Organisational gender pay gap analysis An organisational gender pay gap analysis compares the remuneration data for women and men to identify
gaps based on full-time equivalent annualised average salaries. It then investigates the causes of any
identified gaps to determine which ones are justifiable (i.e. clearly free of gender bias) and which ones are
not and therefore need action to address them.
The Agency’s 2013 annual voluntary telephone survey included questions on whether reporting
organisations have conducted a gender pay gap analysis of employee salaries, and if there are plans to do
so in the 12 months following the survey. No clear relationship has been identified between the gender pay
gap and the likelihood of reporting organisations in a particular industry conducting or planning to conduct a
gender pay gap analysis.
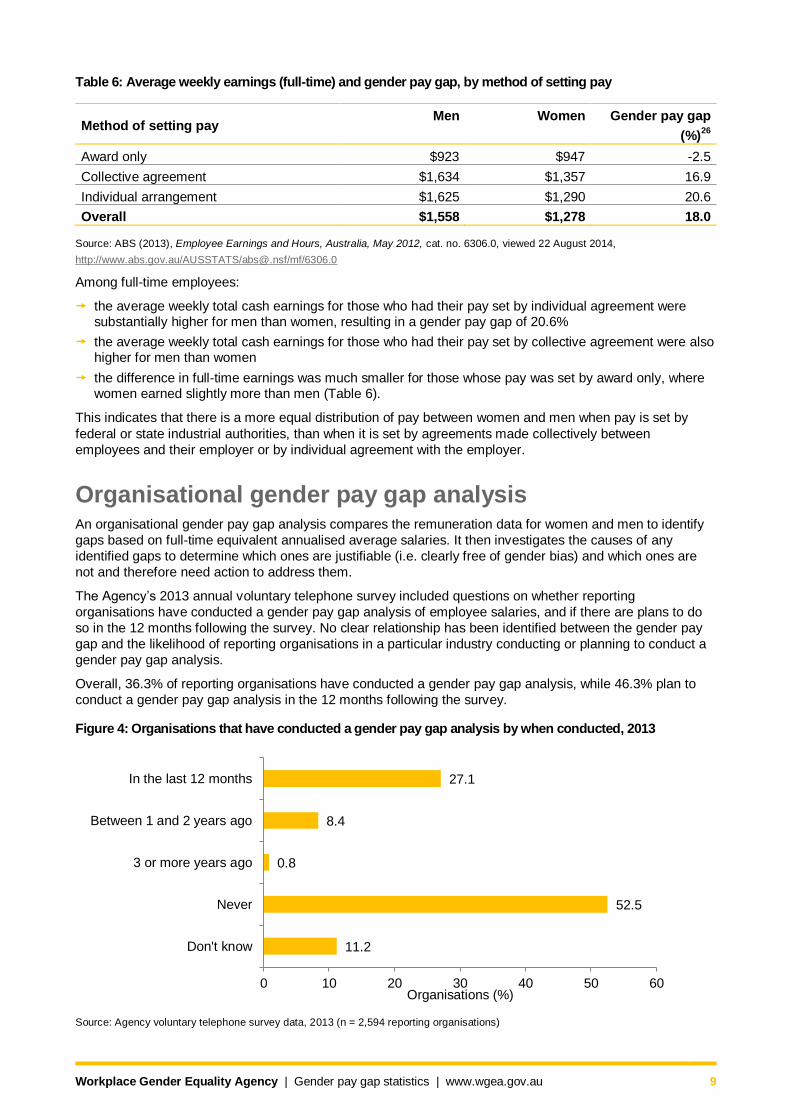
Overall, 36.3% of reporting organisations have conducted a gender pay gap analysis, while 46.3% plan to
conduct a gender pay gap analysis in the 12 months following the survey.
Figure 4: Organisations that have conducted a gender pay gap analysis by when conducted, 2013
Source: Agency voluntary telephone survey data, 2013 (n = 2,594 reporting organisations)
11.2
52.5
0.8
8.4
27.1
0 10 20 30 40 50 60
Don't know
Never
3 or more years ago
Between 1 and 2 years ago
In the last 12 months
Organisations (%)
Workplace Gender Equality Agency | Gender pay gap statistics | www.wgea.gov.au 10
Based on the timeframe during which reporting organisations conducted a gender pay gap analysis:
the majority of reporting organisations that undertook a gender pay gap analysis did so in the last 12 months (27.1%)
a further 8.4% conducted a gender pay gap analysis in the past one to two years, while 0.8% conducted a gender pay gap analysis in the past three or more years
over half of reporting organisations have never conducted a gender pay gap analysis (52.5%), and one in 10 reporting organisations replied ‘don’t know’ to the question (11.2%).
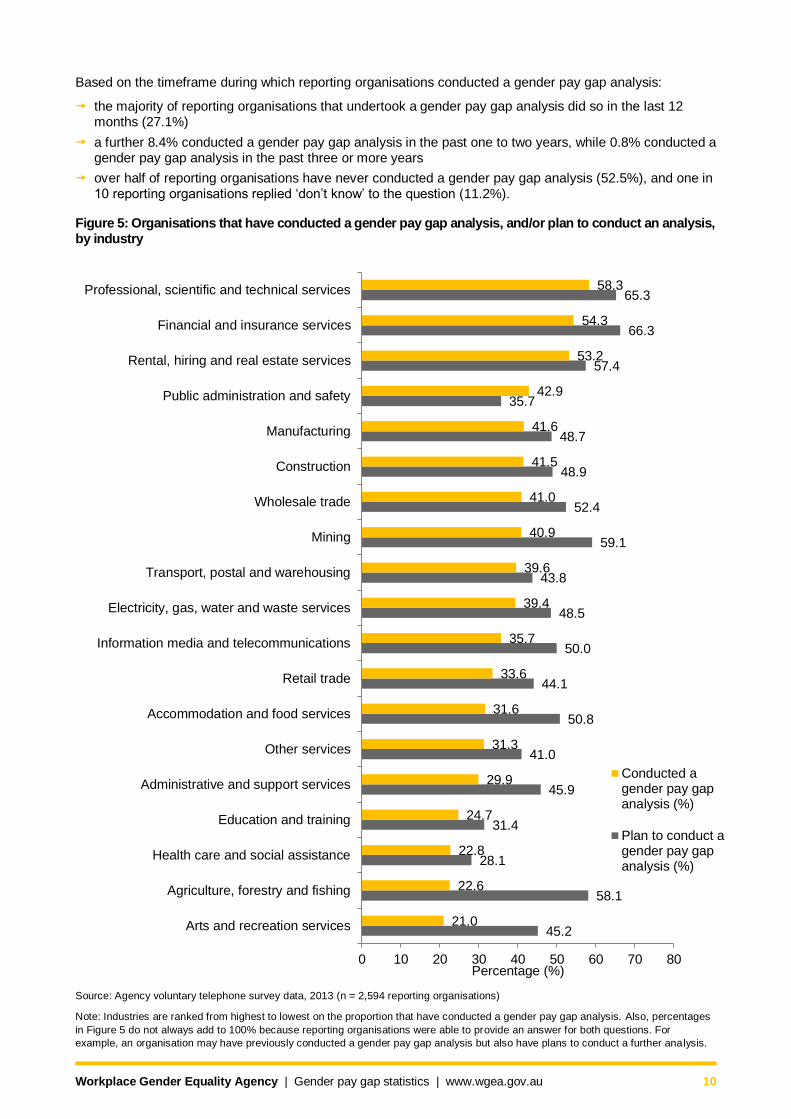
Figure 5: Organisations that have conducted a gender pay gap analysis, and/or plan to conduct an analysis, by industry
Source: Agency voluntary telephone survey data, 2013 (n = 2,594 reporting organisations)
Note: Industries are ranked from highest to lowest on the proportion that have conducted a gender pay gap analysis. Also, percentages
in Figure 5 do not always add to 100% because reporting organisations were able to provide an answer for both questions. For
example, an organisation may have previously conducted a gender pay gap analysis but also have plans to conduct a further analysis.
45.2
58.1
28.1
31.4
45.9
41.0
50.8
44.1
50.0
48.5
43.8
59.1
52.4
48.9
48.7
35.7
57.4
66.3
65.3
21.0
22.6
22.8
24.7
29.9
31.3
31.6
33.6
35.7
39.4
39.6
40.9
41.0
41.5
41.6
42.9
53.2
54.3
58.3
0 10 20 30 40 50 60 70 80
Arts and recreation services
Agriculture, forestry and fishing
Health care and social assistance
Education and training
Administrative and support services
Other services
Accommodation and food services
Retail trade
Information media and telecommunications
Electricity, gas, water and waste services
Transport, postal and warehousing
Mining
Wholesale trade
Construction
Manufacturing
Public administration and safety
Rental, hiring and real estate services
Financial and insurance services
Professional, scientific and technical services
Percentage (%)
Conducted agender pay gapanalysis (%)
Plan to conduct agender pay gapanalysis (%)
Workplace Gender Equality Agency | Gender pay gap statistics | www.wgea.gov.au 11
The data collected from reporting organisations that conducted an analysis showed that:
professional, scientific and technical services has the largest proportion of reporting organisations that
have conducted a gender pay gap analysis (58.3%). This industry had the fourth-largest gender pay gap of industries (25.3%) in May 2014
the industries with the second- and third-largest proportions of reporting organisations that have
conducted a gender pay gap analysis are financial and insurance services (54.3%) and rental, hiring and
real estate services (53.2%), in which over half of reporting organisations have conducted a gender pay
gap analysis. These industries respectively had the second-largest (30.0%) and third-largest (29.0%) gender pay gaps of industries in May 2014
arts and recreation services had the lowest proportion, with only one in five organisations conducting a
gender pay gap analysis (21.0%). This industry had the twelfth-largest gender pay gap of industries (14.9%) in May 2014.
Based on organisations that plan on conducting a gender pay gap analysis in the following year, the survey
showed:
financial and insurance services organisations are the most likely to have plans to conduct a gender pay gap analysis in the next 12 months (66.3%)
organisations in the professional, scientific and technical services industry are the second-most likely employers to conduct a gender pay gap analysis in the next 12 months (65.3%)
relatively few organisations in agriculture, forestry and fishing have conducted a gender pay gap analysis (22.6%), but there are high intentions to do so among organisations (58.1%; Figure 5).
For more information on specific industries, refer to the ‘all industries snapshot’, the ‘gender diversity by
industry spreadsheet’ and the interactive data centre dashboards on the WGEA website.
1 ABS (2014), Average Weekly Earnings, Australia, May 2014, cat.no. 6302.0, viewed 22 August 2014,
http://www.abs.gov.au/ausstats/[email protected]/mf/6302.0
2 Ibid.
3 ABS (2014), Employee Earnings, Benefits and Trade Union Membership, Australia, August 2013, cat. No. 6310.0, viewed 22 August
2014, http://www.abs.gov.au/ausstats/[email protected]/mf/6310.0
4 ABS (2013), Employee Earnings and Hours, Australia, May 2012, cat. no. 6306.0, viewed 22 August 2014,
http://www.abs.gov.au/AUSSTATS/[email protected]/mf/6306.0
5 Since 2001, the Agency has conducted annual voluntary telephone surveys of reporting organisations. The 2013 survey focused on
paid maternity/primary carer’s leave and paid paternity/secondary carer’s leave, and whether organisations had conducted a gender pay
gap analysis, or if there were plans to do so in the next 12 months. The 2013 survey participation rate was 65.4%. In late 2014 new data
will be available based on the new online reporting system.
6 Unless otherwise stated, all measures of the gender pay gap are expressed as a percentage (%) based on average weekly ordinary
time earnings for full-time employees (trend data), with changes over time provided as the percentage point (pp) difference.
7 Government policies such as Baby Bonus (Maternity payment) and Work Choices.
8 The release frequency changed from quarterly to bi-annual in November 2012.
9 A minus sign indicates that the gender pay gap has decreased from the previous period.
10 ABS (2014), Labour Force, Australia, Detailed, Quarterly, May 2014, cat. no. 6291.0.55.003, viewed 22 August 2014,
http://www.abs.gov.au/ausstats/[email protected]/mf/6291.0.55.003
11 http://www.equalpayday.com.au/
12 Equal pay day calculation: 365*GPG/100
13 A minus sign indicates that the gender pay gap has decreased from the previous period.
14 ABS (2014), Labour Force, Australia, Detailed, Quarterly, May 2014, cat. no. 6291.0.55.003, viewed 22 August 2014,
http://www.abs.gov.au/ausstats/[email protected]/mf/6291.0.55.003
15 ABS (2013), Australian Social Trends, April 2013, cat. no. 4102.0, viewed 22 August 2014,
http://www.abs.gov.au/AUSSTATS/[email protected]/Lookup/4102.0Main+Features20April+2013#p2
16 Ibid.
17 ABS (2013), Employee Earnings and Hours, Australia, May 2012, cat. no. 6306.0, viewed 22 August 2014,
http://www.abs.gov.au/AUSSTATS/[email protected]/mf/6306.0
Workplace Gender Equality Agency | Gender pay gap statistics | www.wgea.gov.au 12
18
WACOSS (2009), Close the Gender Pay Gap: Value Community Services, Research Paper, Western Australian Council of Social
Services Inc, March 2009.
19 ABS (2013), Employee Earnings and Hours, Australia, May 2012, cat. no. 6306.0, viewed 22 August 2014,
http://www.abs.gov.au/AUSSTATS/[email protected]/mf/6306.0
20 Workplace Gender Equality Agency (2013), “Gender equality – industry benchmarking spreadsheet”, Sydney, Workplace Gender
Equality Agency.
21 A minus sign indicates that the average weekly earnings for women is greater than that for men.
22 A minus sign indicates that the average weekly earnings for women is greater than that for men.
23 ABS (2013), Employee Earnings and Hours, Australia, May 2012, cat. no. 6306.0, viewed 22 August 2014,
http://www.abs.gov.au/AUSSTATS/[email protected]/mf/6306.0
24 Ibid.
25 Baron J.D. & Cobb-Clark D.A. (2010), Occupational Segregation and the Gender Wage Gap in Private- and Public-Sector
Employment: A Distributional Analysis. The Economic Society of Australia, The Economic Record, Vol. 86, No. 273, June 2010, pp
337-246.
26 A minus sign indicates that the average weekly earnings for women is greater than that for men.