Embed Size (px)
Citation preview
1
GENDER SYSTEM EFFECTS ON FERTILITY BEHAVIOUR OF FAMILY IN SIXTEEN COUNTRIES: AN EXPERIMENT IN JOINING INTERNATIONAL
DEMOGRAPHIC AND HEALTH SURVEY DATA
NURDAN ÜNALAN Middle East Technical University
Ankara 06531 Turkey [email protected]
15 August 2002
* This paper which is prepared for the International Conference in Economics VI., ERC-METU, Ankara, Turkey, 11-14 September 2002 is a modification of the thesis submitted for partial fulfillment of requirements for the M. A. degree in the Economic and Social Demography to the Hacettepe Institute of Population Studies in September 2001.
2
ABSTRACT The role distribution of man and women in a society (the gender structure) which is shaped by socio-economic and cultural structure of that society, is one of the important factors affecting fertility behaviour. This gender structure shows differences between developed and developing countries; i.e. each member of these groups have similar charteristics depending on the classification. According to the research results in literature, being man and woman leads to diversities in educational and working statuses of sexes in any community, however this variance of sexes can be seen sharply when developed and developing countries are compared. It has been tried to found out how it affects the fertility outcomes in different patterns of it. The aim of this experimental study is to present the effect of gender structure on fertility behaviour of family in developing countries. To achieve this, the Demographic and Health Survey (DHS) data of 16 developing countries, representing all continents, have been chosen by preferring survey dates and survey models used which show closeness. Collected data of the following 16 countries having time intervals in 1992-1997 have been fulfiling the criteria. These countires are Bangladesh, Bolivia, Brazil, Egypt, Ghana, India, Indonesia, Kazakhstan, Kenya, Pakistan, Peru, Philippines, Senegal, Tanzania, Turkey, Uzbekistan, Zimbabwe. It is clear that these countries have different socio-cultural and economic structures. Because of the feature of experimental studies, variables such as cultural factors and religion which might affect the fertility trends would be held constant. Gender system would be analysed by looking at the patterns of socio-economic levels or categories (place of residence, level of education, current working status -labour force participation rate- and occupation type) for men and women (in this study, for women and her husband -DHS data include only education and occupation related variables for both of them-). In the literature, it has been usually assigned to woman (the wife), however, the study results show that the education levels and labour force participation rates of husband are also low in developing countries. The fertility rates of women and their husband are quite higher compared to the data of European Union countries which are given as examples to developed countries in the study. The differences between the fertility rates of hypothetical countries confirm the hypotheses of the study. If the level of education and labour force participation increases, and if education required jobs are carried out, the fertility rates decrease in these countries. According to the study results, the fertility rate in developing countries is determined not only by the socio-economic status (S.E.S) of women but also by the socio-economic status of men. Husbands also live in the same or similar socio-economic conditions and cultural envirement. These results are also identical in the developed Europian countries; however, women and men have higher S.E.S levels. It has also been observed that socio-economic state of women and husband cannot be seperated. Thus, if empowerment of women in developing countries is required, husbands of these women would also be empowered. In general, if the point is to explain the fertility trends and factors, family, as a result, should not be separeted into two.
3
1. INTRODUCTION
In literature, gender has definitions in sociological and psychological terms. In this study, these explanations are not discussed but the definitions used in demography literature have been presented.
“Gender System is that the socially-constructed expectations for male and female behaviour that are found (in variable forms) in every known human society.” Its expectations “prescribe a division of labour and responsibilities between men and women and grand different rights and obligations to them” (Mason, 1995). It creates inequality between sexes in power, autonomy, and well being.
“Although the literature frequently refers to such terms as gender roles, female empowerment, women’s autonomy and women’s status, the term gender system is preferable because it comprises the entire complex of roles rights and statuses that surround being male versus female in a given society or culture. It should be recognised, however, that gender systems have distinct sub-components. For example, they prescribe both a division of labour (gender roles) and create institutionalised inequality between male and female members of society (gender stratification). Because gender stratification typically involves greater social control of females than of males, the term female empowerment refers to a reduction in one dimension of gender stratification, namely, the power dimension. Women’s autonomy is also an aspect of this power dimension; it refers to women’s freedom to act as they choose, rather than, as others would have them to act. Women’s status has a variety of meanings (Mason, 1984, 1986), but often refers to dimensions of gender stratification such as control of material resources or command of social honour or prestige.” (Mason, 1995).
Gender system shows different patterns in developed and developing countries. Women and men have better socio-economic conditions in the developed countries. They are more empowered and have more autonomy. In the former one, education levels and labour force participation rates are higher than the second one, (Eurostat Yearbooks, 1997, 2000 and Human Development Report 1999).
“The importance of society’s gender organisation for demographic change has been recognised widely only since the 1980’s. John Caldwell (1982) and Nancy Falbre (1983) first described how patriarchal family act to maintain high fertility. In recent, it’s beginning to be understood how to conduct high quality research.” (Mason, 1995) Mason says if female empowerment helps to lower fertility, it logically must do so because it rises the age of initiating sexual activity, increases the prevalence and duration of intensity of breastfeeding, or increases the use of contraception or abortion.
Fertility behaviour also shows different patterns according to the gender structures of countries. Fertility levels, age at first marriage and first birth are different in developed and developing countries. In developing countries, fertility levels are higher than those of developed countries because of low socio-economic levels, (Eurostat Yearbooks 1997, 2000 and Human Development Report 1999).
Gender is evaluated as a system and this topic has been evaluated from the same perspective in this study. Gender structure is determined by economic and
4
social structure of any society or by nature and the like. It could not be shown in here with very limited data. Gender system, gender structure or gender roles, whatever the terminology (or operational definition) is, it has to be explained for both sexes, that’s to say, male and female. Because the term ‘gender’ contains being man and being woman in the same conditions and time. It is believed that demographic studies should also explain fertility determinants in terms of gender structure of a society or a country by analyzing male and female data. Most researchers examine the case from the aspect of women of any country. It could lead to shortcomings to compare them with this method. If so, researcher has to assume that he/she has an empowered and autonomuos man/husband, or a mobile one that can only be seen in developed countries not in less developed or under developed countries. Those studies also compare women within themselves in any country. Generalizations about gender system and fertility behaviour by analyzing only women data bring weakness to the results and discussions. One can say that doing this gives similar results, for instance, high status of women leads to low fertility rates. However, it could be observed or real determinants of it could be drawn by looking at the entire part, and more valid implications could also be made.
The aim of this study is to examine the effects of gender system on fertility
behaviour of families in developing countries accepting them as one country by an experimental study. It is assumed that the total population of the world contains the population of developed and developing countries. The world population has been divided into two: developed and developing countries. This categorization shows differences in different sources or institutions and also differs according to the criteria which they use. Published survey results from different sources have been represented here for the comparison of developed and developing countries. In this study, Demographic and Health Surveys (DHS) categorization is accepted. That is to say, as it is described in one of the DHS mission (“building data collection systems in developing countries through formal and on-the-job training in research design and implementation, sampling, data processing, analysis, and dissemination”, (DHS web page, http://www.measuredhs.com), it is accepted that the countries where DHS program is conducted are developing ones and all other countries are developed ones. The United Nations’ classification for countires would not be used, because survey datasets of DHS have been used.
According to the research results in literature, being man and woman leads to
diversities in educational and working statuses of sexes in any community, however this variance can be seen sharply when developed and developing countries are compared. It has been tried to found out how it affects the fertility outcomes in different patterns of it. The subject of this study is not the evaluation of gender system effects on fertility behaviour of married couples in different countries, but mainly making an experiment in joining international demographic and health survey data with reference to gender system effects on fertility behaviour of family in developing countries.
However, there are no data including the whole variables related with the
subject as mentioned in the words of Mason above. After deciding to use the DHS in the study, surveys which are conducted in developing countries are examined and discovered. There are diversities in terms of DHS models and time intervals. Because of few surveys conducted at the same time, the countries are near to each other in terms of time interval and having same DHS models which are selected as study
5
sample. Also, it is paid attention for the representation of countries from all continents or regions. The following 16 countries have been fulfiling the criterias and having time intervals in 1992-1997: Bangladesh, Bolivia, Brazil, Egypt, Ghana, India, Indonesia, Kazakhstan, Kenya, Pakistan, Peru, Philippines, Senegal, Tanzania, Turkey, Uzbekistan, Zimbabwe, (Table 1, represented by bold characters). It is clear that these countries have different socio-cultural and economic structures. As it is an experimental study, cultural factors and religion which affect the fertility trends will be held constant. In the ‘Reproductive Behaviour in Muslim Countries’ study, Karim says “there are no apriori reasons for fertility to be higher among Muslims are scattered across 50 countries, predominantly in Asia and Africa” which developing countries are placed. The gender system patterns of the whole world will not be drawn. Again, there are not all the variables to measure or analize countries’ gender systems, or empowerment, autonomy, freedom of men and women. Gender system will be analysed by looking at the patterns of socio-economic levels or categories (place of residence, level of education, current working status-labour force participation rate- and occupation type) for men and women, in this study, for women and her husband. DHS include only education and occupation categories for both of them. The residence of husband will be computed from the variable ‘ husband lives together’, and also a new variable will be defined about ‘working status of husband’ - labour force participation rate of him, by grouping ‘occupation type variable’ as not working and others-working.
In the study, women and husband will be compared in terms of socio-economic
levels using birth history data of wife. Also, decision making process (discussed number of children, fertility preferences, contraception usage) would show or gives an idea about gender roles, and autonomy and study will examine age at first birth, age at first marriage to evaluate fertility trends.
2. LITERATURE
One of the issues of demography is to measure and explain fertility behaviour, which is affected by many social, economic, and cultural factors. It is known from sociological and psychological knowledge that gender system is one of the facts, which is also determined by social, economic, and cultural structure of a society. Mason (1995) defines gender system, which is the socially constructed expectation for male and female behaviour that is found (in variable forms) in every known human society. “A gender system’s expectations prescribe a division of labour and responsibilities between women and men and grant different rights and obligations to them. Gender system comprises the entire complex of roles, rights and statuses that surround being male or female in a given society or culture “, (Mason, 1995). It has distinct sub-components: Gender roles (division of labour) and gender stratification (institutionalised inequality between male and female members of society created by the former one). “Role expectations can be very powerful and frequently they constitute an important way in which groups exert strong effects upon their members”, (Baron and Byrne, 1987). A man or a woman learns those roles and develops attitudes, beliefs and makes attributions and behaves being a man or a woman, being a wife or a husband, also being a father or a mother, and so on. There are growing scientific studies (sociological and social psychological) which point out that gender
6
roles, gender stratification, beliefs, attitudes, and intentions affect the fertility behaviour of partners. But data were limited for women and men.
In Turkey, there is no study, which covers entire of the subject to explain changes in fertility behaviour depending on the gender system of Turkish society. In demography literature, gender roles, empowerment of women, autonomy concepts evaluated by comparing women with man. Researchers talked about inferiority of women with reference to man. Also, the same concepts were examined at the international conferences, especially in U.N’s meetings (Sadik, 1989). There were international agreements about the empowerment of women and reproductive health. Some credit programs were applied in developing countries to make women more empowered. When the literature has been examined with regard to the study topic, studies could be divided into two. First, researchers tried to show the effects of those applications results believing the inferiority of women according to men. Therefore they showed that women were more empowered than before.
The following studies have been given to exemplify the first group ones:
Schuler and Hashemi was studied in 1994, how effects the women’ fertility to participation of credit programs designed by Grameel Bank (in Bangladesh) and Bangladesh Rural Advancement Committee. Women level of empowerment was defined as a function of her relative physical mobility, economic security, ability to make various purchases on her own, freedom from domination and violence within her family, political and legal awareness and participation in public protests and political campaigning. In the beginning, they have third group of sample, two of them from members of project, one of them from those villages eligible women to join the program but not selected, and one group were also added consisting of non-members of program’s villages. Total number of women was 1305 married women younger than 50. Researchers evaluated the results that “from the ethnographic study it appeared that if credit programs were affecting contraceptive use, they were doing so partly by strengthening women’ economic roles and contributing to their empowerment and partly by promoting family planning directly and so doing influencing community norms”.
Researchers Dyson and Moore studied the gender relations and demographic variations in India looking at kinship structures and female autonomy in terms of culture, (1983). They showed the differences between south and north India according to population, sex ratio, child-women ratio, total fertility rate, total marital fertility rate, aged first marriage, child mortality. Those demographic indicators had better meanings in South India than North India. Scientists explained that situation because of different kinship structures and female autonomy in north and south. “In the north system, soused must be unrelated in kinship reckoning and often too by place of birth and/or residence. Marriage rules are exogamic. Males tend to corporate with and receive and help from other males to whom they are related by blood, frequently their adult brothers. Women generally don’t inherit property for their own use nor do they act as links through which major property rights are transferred to offspring. In the south system, there exists preferred forms of marriage often; the ideal marriage is between cross cousins. The descent group is endogamous. Males are at least as likely to enter into social, economic and political relations with other males with whom they are related by marriage (i.e.,
7
affined) as they are with males with whom they are related by blood (i.e., by descent). Women may sometimes inherit and/or transfer property rights.”
They said, “So whatever the ultimate economic and historical factors shaping culture, it is more safer and more realistic to take culture as the primary determining factor for the purpose of the present study”. They found as expected women used with greater degree of health service and family planning living in the south. Also female labour force participation rate and percentage of literate women in south were higher than north’s percentages. Dyson and Moore added to the explanation of differing degrees to which the two socio-cultural systems permit innovative action, which in that context means fertility control of some kind within marriage. Finally they said that “female social status was probably the single most important element in comprehending India’s demographic situation”, and suggested “to increase the autonomous social and political capacity of groups of females - both as an end in itself and as a means to facilitate reduce birth and death rates”.
Researchers didn’t prefer to say that South Indian women have higher social status because they thought it didn’t evoke the idea of esteem. They discussed the concept of female autonomy, and defined it as the capacity to manipulate one’s personal environment. “Autonomy indicates the ability - technical, social and psychological - to obtain information and to use it as the basis for making decisions about one’s private concerns and those of one’s intimates. Thus, equality of autonomy between the sexes in the present sense equals decision-making ability with regard to personal affairs. In agrarian societies most major personal decisions are strongly influenced and constrained by kinship family and marriage relations. Societies in which females have high personal autonomy to males are typically characterized by several of following features: freedom of movement and association of adolescent and adult females; post-marital residence patterns and behavioural norms that don’t rapture or severely constraint social intercourse between bride and her natal kin; the ability of females to inherit or otherwise acquire, retain and dispose of property; and some independent control by females of their own sexuality - for example in the from of choice of marriage partners. It is emphasized that these features are simply test of relative female autonomy. High autonomy in the present sense implies an ability to influence and make decision covering the full range of personal and household affairs.”
Coltrane and Isii-Kuntz (1992) made a study using married couples with children in US to explore how the timing of transition to parenthood was associated with later divisions of domestic labour. They found that time availability and wife’s ideology were consistent predictors of husbands’ sharing more of the routine housework in both early and delayed couples (having a child before and after age of 28), husbands ideology and his time availability were found to have a significantly greater effect on delayed husbands’ housework contribution than for early-timed husbands. Men’ own attitudes about gender and family roles did not significantly influence the division of household labour in early-timed families.
According to Mason (1995), it is difficult to make causal inferences about gender system and demographic change because of aggregated nature of demographic change. She continues that “demographic change occurs across cohorts, the processes that result in change occur at least one part through changes in individual behaviour. A study to demonstrate this must be measure over
8
successive cohort, contain the individual experiences in particular gender conditions turn into displayed forms of demographic behaviour and control other confounding variables. It is complex and expensive.” “Cross sectional studies which collecting the information for women and men living in communities having distinct gender system was subjected to multi level analyses that incorporates both individual and community level information. World Fertility Surveys and Demographic Health Surveys contain valuable information on demographic variables. They were not designed to measure gender system; nor to permit comparison across them; information must be measured on individual measures. Much of the literature on gender and demographic change has focused on gender stratification or its sub-components such as female autonomy (Dyson and Moore, 1983), women’s empowerment (Schuler and Hashemi, 1994), women’s control of material resources (Coin, et al., 1979), or their freedom of movement. They were manifested at the individual or household level. There were little aggregated studies to higher levels to estimate community or country in gender”.
In Turkey, there were many studies trying to search social and economic factors affect fertility. One of them was ‘The Value of Children: Some Social-Psychological Determinants of Fertility in Turkey ‘ by Çiğdem Kağıtçıbaşı, in between 1974-75. She found that “the value of children was complex and could not be viewed in economic terms: with increasing socio-economic development of the area of residence, increased mobility, increased education, higher income and better jobs for women, the utilitarian value of children decreased, but their psychological value increased”. There were differences about desired number of children (men wanted more children than women), and sex preferences.
Baran Tuncer, in 1972, discussed the effects of social and economic determinants on fertility, such as income, literacy and education, urbanisation and regional differences, labour-force participation, family structures, marriage patterns and mortality rates. He suggested that studies must include additional variables to have a more complex picture and intervening variable’s operation on fertility must be shown.
In 1992, State Institute of Statistics conducted a study called ‘ Turkish Family Structure Study’. They asked 125 questions only to head of the household, which was most of them males in Turkey. Some of the questions were related with attitudes, values and beliefs about marriage, marriage relations, communication between spouses, household distribution, ideal number and sex of the children, and decision making. According to the research results, there were urban -rural differences. When the education level increased sharing of household works of males increased. Ideal number of children was found 2 for 56% of the head, and 3 for 32% percent of them.
Işık Kulu-Glasgow (1993) studied the role of husbands in fertility related behaviour in her doctorate thesis. She discussed that “there was differences in historical, social and economic background of different regions forming the different norms and behaviour were determined, and traditional values about gender roles played an important role in decision making in the family. While husbands in less developed areas hold more traditional values both in terms of gender roles and fertility, and play an important role in decision-making in the family, in more developed parts of country, more westernised patterns of behaviour and attitudes
9
prevail.”
Ergöçmen (1997), said that status was not a unidimentional concept and since it is difficult to classify as a single item index, women’s status must be regarded as a multiple or complex array of the different components which vary from one society to another. She stressed the importance of women’s status, which plays a very important role in the demographic transition of Turkey. “According to the results of this analysis, not all indicators of women’s status are significant determinants of fertility. However, having the education above five years, having a job with social security, having initiative in the marriage arrangement, and increased age at marriage are found to be the factors that reduce fertility. The coexistence of modern and traditional attitudes and behaviour is the prevalent pattern in the social and cultural life of Turkey. The findings of this support the heterogeneity of Turkish social and cultural life with reference to women’s status and fertility. There are substantial differences in the indicators of women’s status between regions, most notably the West and East Regions. The West region is the most socio-economically developed representing a relative modernity, while the East Region is the least developed representing the least modern. Also, there exits notable differentiation between urban and rural settings. Also, there exists notable differentiation between urban and rural settlements. The major policy implication of this study has been the importance of female education and employment to improve the women’s status, which will ultimately have an impact on fertility behaviour. The results of the analysis confirm the importance of education and economic power in evaluating women’s status. However, programs inclined to raise the status of women should recognize the fact that there still exits important differentials in social, economic and cultural backgrounds of different regions and settlements in the country.”
Ergöçmen (1997) also suggested that: “Finally, an analysis of women’s status from a standardized large-scale demographic survey is expected to have some shortcomings, since the structure of this type of survey is considered to be irrelevant for measuring the multidimensional nature of women’s status. However, these additional questions of the TDHS have been useful in examining the mechanisms through which women’s status influences fertility. Thus, it can be concluded that incorporating relevant new questions in between the existing standard questions of the survey, and having a supplementary sub-module covering various aspects of women’s status can bring valuable insight to the understanding of demographic phenomena.”
Those studies would be examined according to two features of them. First, they are only exploring subject from point of women. Second, most of them don’t consider socio-economic determinant’s differentiations in gender structures, empowerment, and autonomy.
Second type of studies, discuses the first group studies and researchers suggests the solution of man’s problems related with fertility behaviours, and also stresses the importance of participation of men into fertility decisions and importance and necessity of men support to women. Again it is understood that those researchers also believes the inferiority of women not men. And they examine the fertility related topics in terms ‘interpersonal relationships’ between women and her husband.
Linda Moyoux, in 1998, discussed the micro-finance program’s problems and suggested solutions to those limitations. But, she has not talked about the husband of
10
women who got the loan. These women are poor, but about their husband? It’s not clear in those programs.
As an example to discussion of action programs, Berer (1996), in his paper, believes the indivuality of fertility related behaviours and problems. However, he/she discussed the situation from the point of ‘interpersonal relationships’, althouh it was asked ‘which men’. It’s not clear, author accepts that whether the men are more empowered when compared to women. He/she believed that men should support women.
Martin and Juarez (1994) suggest that ‘poor educated women have fertility levels typical of pretransitional societies in the range of 6-7 children, white better educated women in developed world, in the rande of 2-3 children in their study which cover the Latin American countries.
3. METHODOLOGY and the DATA
a. Assumptions An assumption is a statement of relationship, which is assumed to be true and
has not been tested. For example, when it is said all educational levels are equal in all societies, it is assumed that there is no difference between the structures of education in all levels of it.
If one says that there are no regional differences in different countries, he/she
assumes that there is no difference between regions in terms of their characteristics in those countries. In this study, there are following assumptions: 1. ‘Gender’ term covers both sexes: man and woman. 2. Gender system of a society is shaped by socio-economic and cultural structure of
that country. 3. In developed countries, gender structures of both show similar patterns. 4. In developing countries gender structures of both show similar patterns. 5. Socio-economic statuses (S.E.S) are assumed to be equal in all developing
countries and they are also assumed to be equal in international joined data for age of women and husbands, type of place of residence.
6. It is assumed that women and men have equal levels of education and labour force participation rates.
7. Women and their husbands are assumed to be in the same age group. 8. Age and regional differences do not affect age specific marital fertility rates and
other fertility measures- ‘Age is assumed as intervening variable (having an influence on another variable, leads difference in expected behaviour) but it affects also socio-economic variables’ (Karadayı, 1971).
Control variables are place of residence, age of the respondent and husband.
b. Hypotheses Based on the previous assumptions, hypotheses are developed. If S.E.S. level
is high for men and women in any country, fertility rates will decrease in that one. Developed countries’ women and men have high S.E.S levels and they have low fertility patterns when compared to those of developing countries. S.E.S also affect proximate determinants of fertility as defined in Bongarts model. High S.E.S increase contraceptive usage, and decrease fertility levels; education increases age at first
11
marriage, age at first birth, and it decreases fertility levels, because women and men enter lately into fertility period of them.
There are two hypotheses: First, it is hypothesised that education levels (or categories) and labour force
participation rates (LFPR) show differences in developed and developing countries, and in different place of residence, and in all age groups.
Second, it is hypothesised that age specific marital fertility rates (ASMFR) and mean number of children ever born (mean CEB) will decrease if socio-economic determinant levels, that is to say, education and LFPR are high for women and husbands. a. ASMFR and mean CEB will decrease if educational levels of women and husbands increase. b. ASMFR and mean CEB will decrease if labour force participation rates of women and men increase. c. High levels of education and LFPR decrease the median age at first marriage. d. High levels of education and LFPR decrease the median age at first birth.
c. Data Sources And Properties
Demographic and Health Survey’s (DHS) of Bangladesh, Bolivia, Brazil, Egypt, Ghana, India, Indonesia, Kazakhstan, Kenya, Peru, Philippines, Senegal, Sudan, Tanzania, Turkey, Uzbekistan, and Zimbabwe conducted between 1992-1997 will be used as research data.
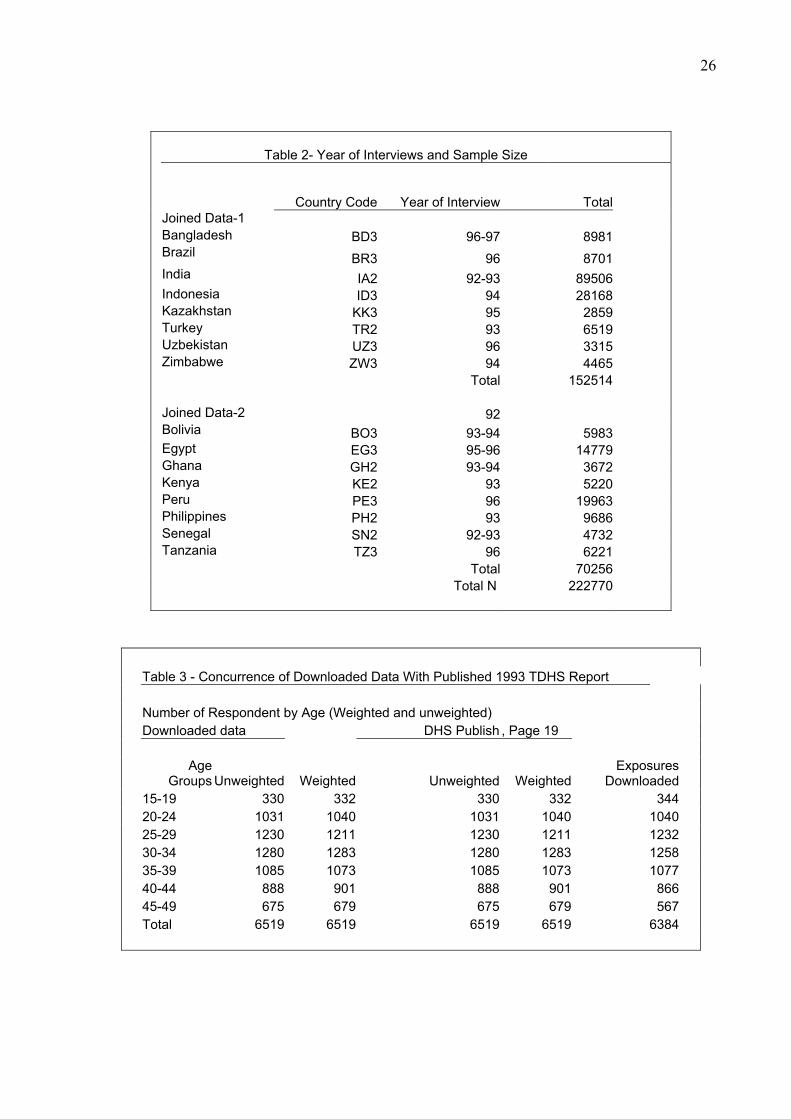
When study structure has been profiled, birth history data of developing countries have been needed. DHS, which are conducted by Macro International Inc. in most developing countries, also include birth history data. For this study Macro International Inc. has given authority to use those data. Surveys have been grouped according to the type of DHS survey (I, II, III), which are used. It has been decided to take the countries for sample study including smaller time difference between conducted surveys, and representing all continents. Time range of surveys in the study sample is between 1992-1997, (Table 2). They have individual rectangular recoded data files (DHS III Version 1.1, 2000).
Information about DHS taken from most of the DHS writings of the Macro
International Inc. and also from their web page is given in the following: “The standard DHS collect information on family planning, maternal and child health, child survival, AIDS, educational attainment, and household composition and characteristics. For some topics (e.g., AIDS), information may be collected through the standard questionnaire as well as through modules of questions that can be added to obtain more detailed information.” “Questionnaire Content The standard DHS survey consists of a household schedule and a women’s questionnaire. A nationally representative sample of women aged 15-49 is interviewed. The women’s questionnaire contains information on the following topics: Background characteristics; Lifetime reproduction, Contraceptive knowledge and use, Maternity and breastfeeding; Immunization of children, Diarrhoea, fever and cough in children, Height and weight of children, Marriage, Fertility preferences, Husband’s background; Woman’s work status. Additional modules used in some surveys include:
12
Natural family planning, Social marketing, Sterilization, Pill compliance, Woman’s employment, Maternal mortality, Causes of death, AIDS.”
“Data are currently available for 51 countries and more are being added as additional surveys are completed. Analysts and policy-makers use DHS data worldwide.”
“For each country several datasets are usually available: Individual women’s data (standard DHS survey); Household data; Male or husband’s data (for some countries); Couple’s data (some countries); Children’s data (some countries); Service availability/facility data (for some countries), For a few countries additional datasets are available: Experimental survey data; In-depth survey data.”
Creation of International DHS Joined Data Files: After selecting the countries in the joined data, variables related with the survey
topic have been selected from individual rectangular data files. Include files have been created for every country. Moreover, country. system files have been formed using Statistical Package for Social Sciences Software (SPSS, Windows version 8.0). Descriptive statistics have been calculated for all variables including the minimum and maximum values of them. The aim of that was to eliminate miss coded cases or values, if so, to recode those ones or extract it from the country’s data. For concurrence of downloaded data, Turkey 1993 DHS were chosen as a control data, and numbers of age groups were calculated. Then results had been compared with Turkey 1993 DHS Report results. It is clear that there was no error occurred during downloading process (Table 3). Also, every country’s sample size (here number of women) had been checked with individual recode documentation’s of each country. There were no differences between them.
To generalize results of analyses, every country should be represented in the
survey sample proportional to the size of its population. Selected developing country’s sample sizes are different. That’s why; every country’s data have been weighted by weight variable (v005) diving by 1000000.
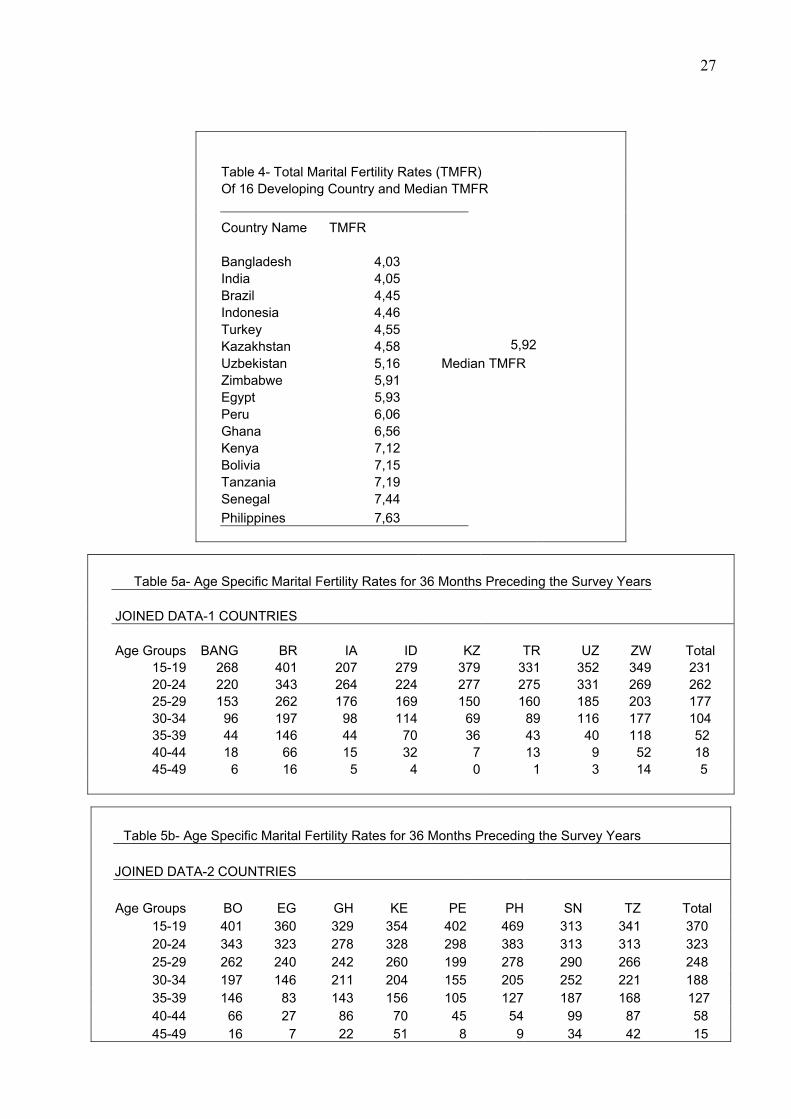
Moreover, TMFR’s have been calculated for every country, (Table 4). As it is
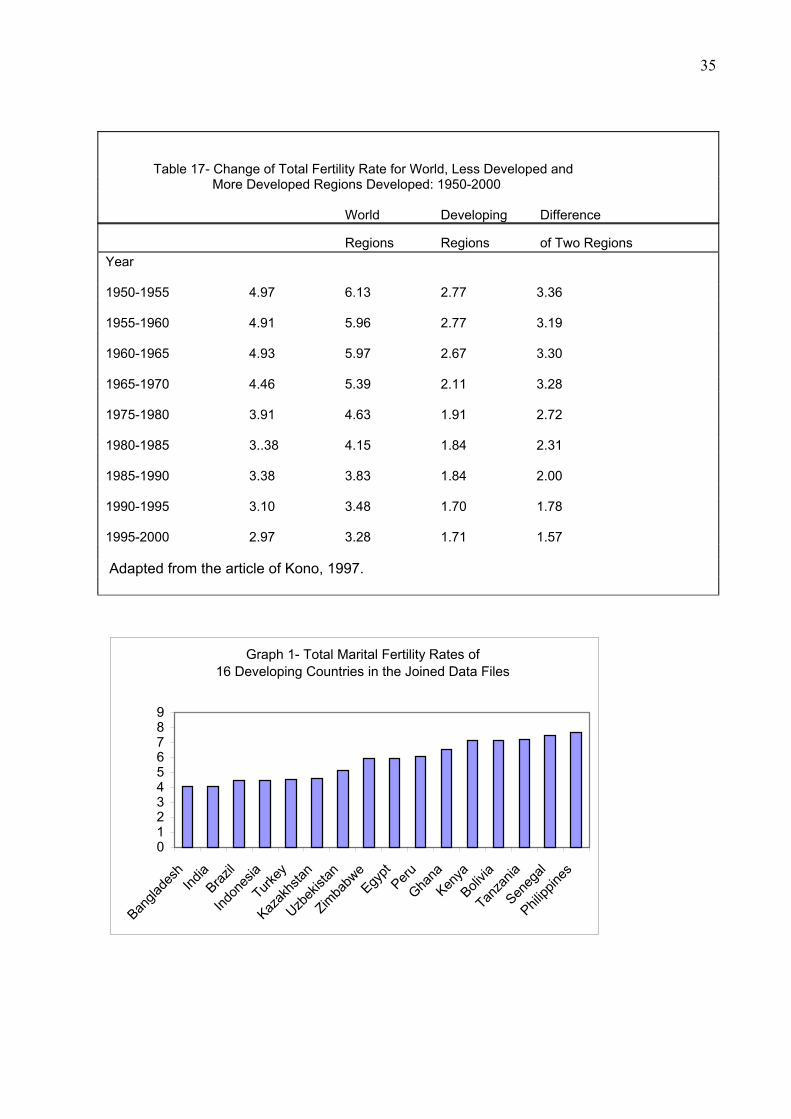
seen in the table, there is no breaking point of TMFR of developing countries. There is no need to group countries because there is not a structure, which increases the heterogeneity of groups.
It is kept in mind, this is an experimental study and that developing countries
are thought as one country. There is no breaking point of the homogeneity of all groups. It could not be observed a structure that leads heterogeneity between groups, (Graph 1). But it is decided to divide those countries into two groups to make a trial by using the median of TMFR’s. The median is 5.92. Then, two joined data files have been created using again SPSS, country. system files have been merged together. The data, which have been constituted from the countries below the median, are as following countries: D3, IA2, BR3, ID3, TR2, KK3, UZ3 ZW3 (here represented with country codes and type of the DHS). And, second joined data file, which has above the median TMFR covers the countries EG3, PE3, GH2, KE2, BO3, TZ3, SN2, PH2.
V303, V375, v615, v620 variables (DHS III Version 1.1, 2000) have not matched in variable list of the other countries except for the data of Ghana, India, Philippines, Kenya, Senegal and Turkey. By joining data, the women of developing
13
countries not the countries have been merged. That’s why; those variables have also been added to the sample data. SPSS have been used for all analyses and Microsoft Office package programs have also been used for writing the text and creating tables in the study.
Age variable was recoded by deleting the cases for 0-14 age group women.
Sample covers women who are in the 15-49 ages. During the analysis, ever-married (currently and formerly) women and their husbands have been selected. Some variable’s values have been recoded as system missing for the following ones: V701-value 4, v705-value 10, and v717-value 10 and 90, v360- value 15.
Two variables have been recoded into different variables: Age at first birth
grouped and age at first marriage grouped. d. Methods Of Analysis Study will be done with two joined data from 16 countries covering variables
related with birth history (reproduction knowledge), age, place of residence, educational and working history of respondents and their husbands First, gender structure of samples will be shown by analysing both sexes’ level in terms of S.E.S.
Socio-economic variables representing the gender structure have been used which are urban-rural residence, education, current employment status (LFPR), respondent and husband’s occupation type. Two fertility measures to examine fertility levels are used:
Estimation of Fertility Rates: 1. Age specific marital fertility rates (ASFMR) and their summation is total marital fertility rates (TMFR): ASFMR’s are calculated from the birth histories by dividing the number of births to married women in a specific age group, during a specific period, by the number of women years of exposure during the same period. It is derived under the assumption that ever-married women are continuously married from the date of first marriage. This measure is not accurate as one based on a complete marital history. An include file will be used to calculate ASMFR proposed by Macro International Inc. for the data analysis (Appendix D). Interview month, birth month of the respondent in Century Month Code (CMC), the vector of birth months in CMC of children, marital status, and the CMC of first marriage variables are being used in calculations. 2. Mean number of children ever born- mean CEB (completed fertility measure). “Each measure has different strengths and weaknesses. (It is thought that they have different meanings and they are assumed to be different indicators of fertility measures.) The TFR is widely used measure that adjusts for differences due to age distributions. However, its relative sampling error is large when some age groups include only a small number of women. Both the TFR and the GFR are synthetic cohort measures representing the current situations. In contrast, mean CEB to women 40-49 represents the childbearing experience of a real age cohort and reflects both current and past fertility behaviour”, (Mboup and Saha, 1998). Moreover, other demographic indicators, which will be analysed, are age at first marriage and median age at first birth.
Hypothesis Testing:
14
Following calculations will be made for hypothesis testing: a. Comparison of ASMFR’s, TMFR’s, and mean CEB of low educated versus high-educated groups, b. Comparison of ASMFR’s, TMFR’s, and mean CEB of working versus non-working groups.
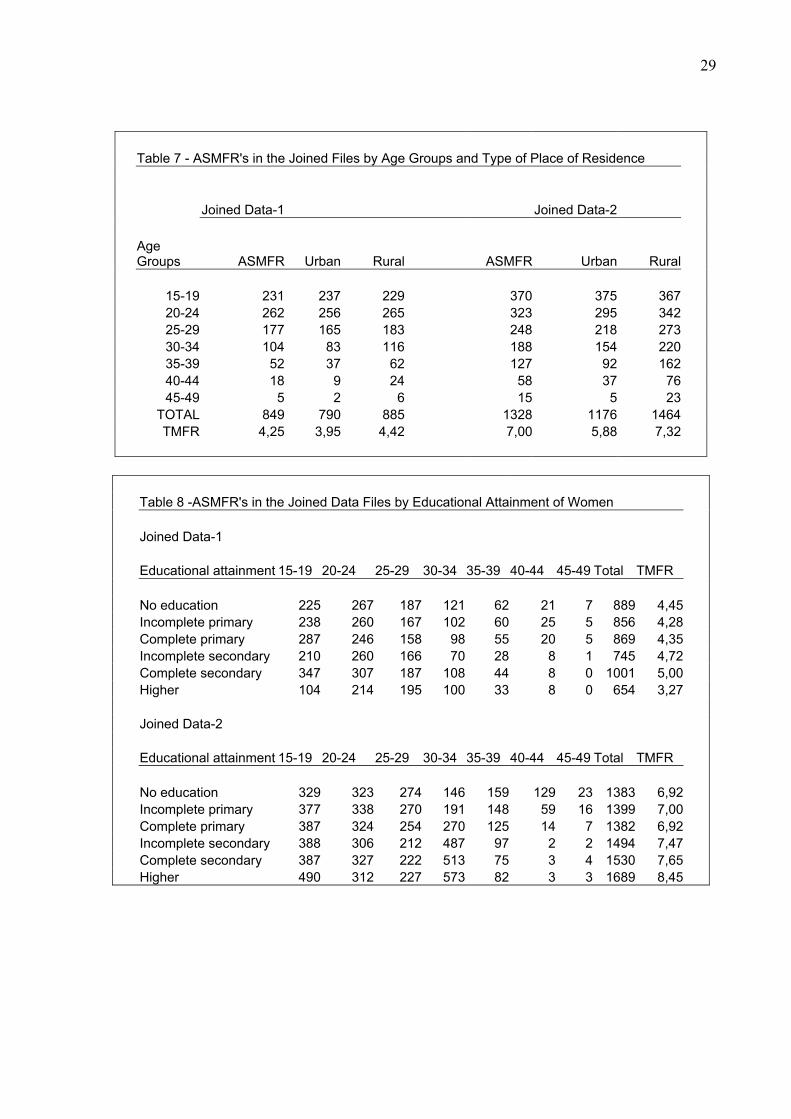
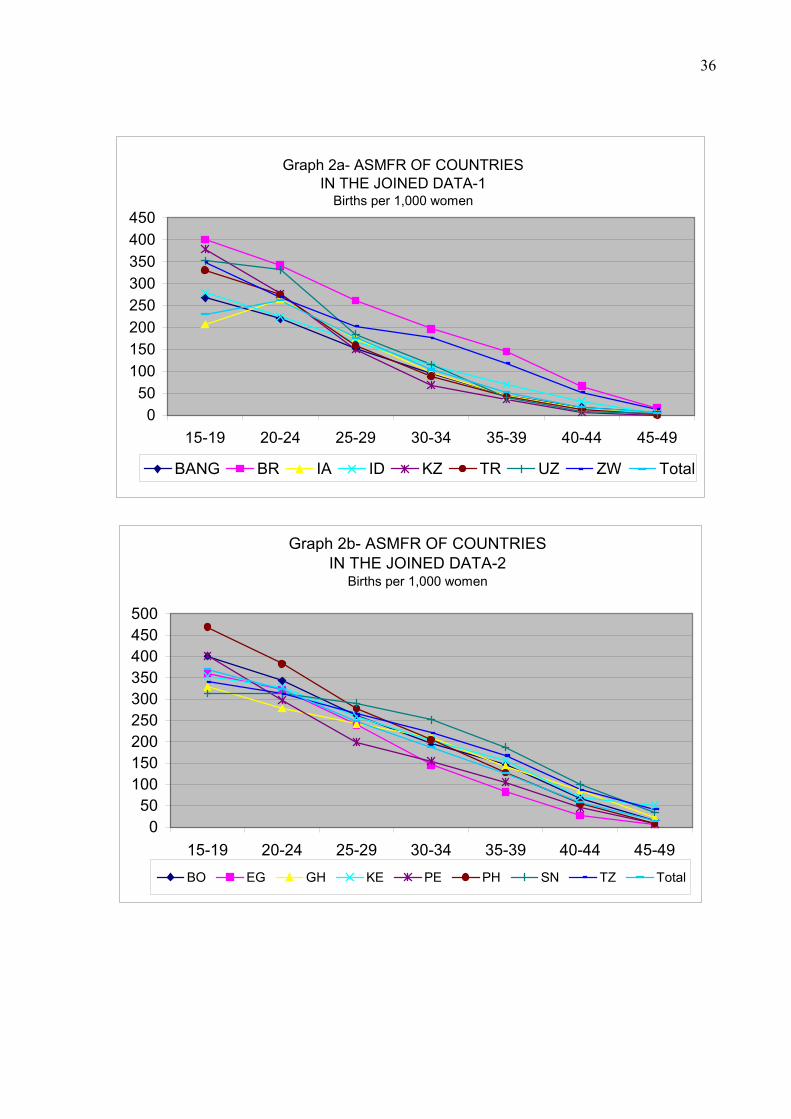
Before calculating the current fertility rates of joined data sets, ASFMR’s of every country in the data sets had been calculated by 5-year age groups to see whether there are different fertility patterns and levels between countries. They were represented in Table 5a, Table 5b and Graph 2a, Graph 2b. In two groups, it seems that countries have similar fertility patterns (except India), but levels show differences. Another finding in this study is that married women distributions in the 15-19 age group are not equally distributed to the single ages within this age group. Women in the younger ages are few and women in the older ages are high in those distributions. That may be the reason for not observing fertility patterns similar to fecundity patterns (it is expected that lower fertility trends in 15-19 age group than 20-24 age group). The similar finding had been observed for fertility patterns of married women of the same age groups in 1983 Turkish Population and Health Survey results (Turkish Population and Health Survey, 1983). The ASMFR at the 15-19 age group was 0.332284 and it was 0.35144 at the 20-24 age group, the fertility rates were slowing down in the older ages as expected. Indian marital fertiliy pattern seems to be a dominant pattern in the merged data. This is because of the size of the Indian sample (Table 7).
4. ANALYSIS AND FINDINGS
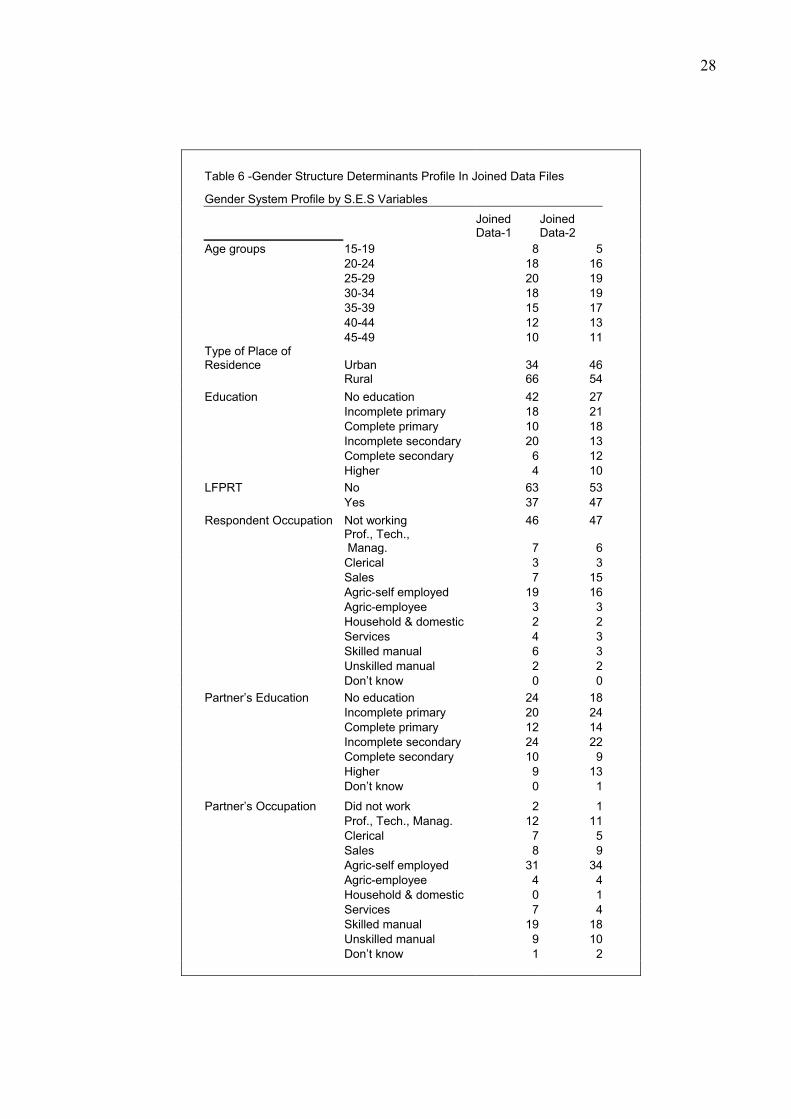
a. Gender System Profile of International Joined Data by Socio-Economic Variables Total size of the first joined file is 152514 and second joined file’s sample size is
70256 (Table 2). Gender system profile of women and her husband by socio-economic variables (type of place of residence, LFPR, women education and occupation, her husband education and occupation) is represented in Table 6. In the joined data-1, the percentage of women living in rural area is greater than that of urban area (66% versus 34%). In the joined data-2, percentages are approximately equal to each other (46% versus 54%). Percentages of uneducated women are more in the first group than the second one. In the first group, percentage of incomplete secondary school is higher than the second one, while completed secondary school and higher education levels percentages are greater than that in the joined data-2. In the two joined data file, husbands are more educated when compared to women. However, uneducated husband rate is also high, and men have higher education levels. It shows that women and husband are less educated. L.F.P.R. ‘s are not much but, it is greater in the second joined data (47% versus 37). There is no information about the current working status of husband, it has been tried to compute a new variable using ‘not working’ percentage of man by ‘partner’s occupation’ variable, but it would not be meaningful for the analysis. In the two joined data, percentage of not working women greater when compared to man. But, husbands work mostly in their own land also in unskilled occupations, having professional, technical and managerial occupations are less for both sexes, but the percentages are greater for the husband
15
side. Having skilled type of occupation of women is very much lower than husband’s (6%-3% versus 19%-18%).
b. Current Fertility Rates
Current fertility rates have been represented by age specific marital fertility rates and total marital fertility rates (TMFR) in this study. ASMFR’s have been calculated for 0-36 months period preceeding the survey, (Table 7). As expected, they are higher in young ages than late ones. There are skewed distribution towards the younger ages The highest fertility rates are observed for the age group 20-24 for the joined data-1 and in the age group 15-19 for the joined data-2. After the age 34, fertility declines for in both of them. Total marital fertility rates are 4.25 in the first joined data and 7 in the second joined data. Women in rural areas have 1 more child than those in urban ares. But the gap between urban and rural ares is not as great as expected.
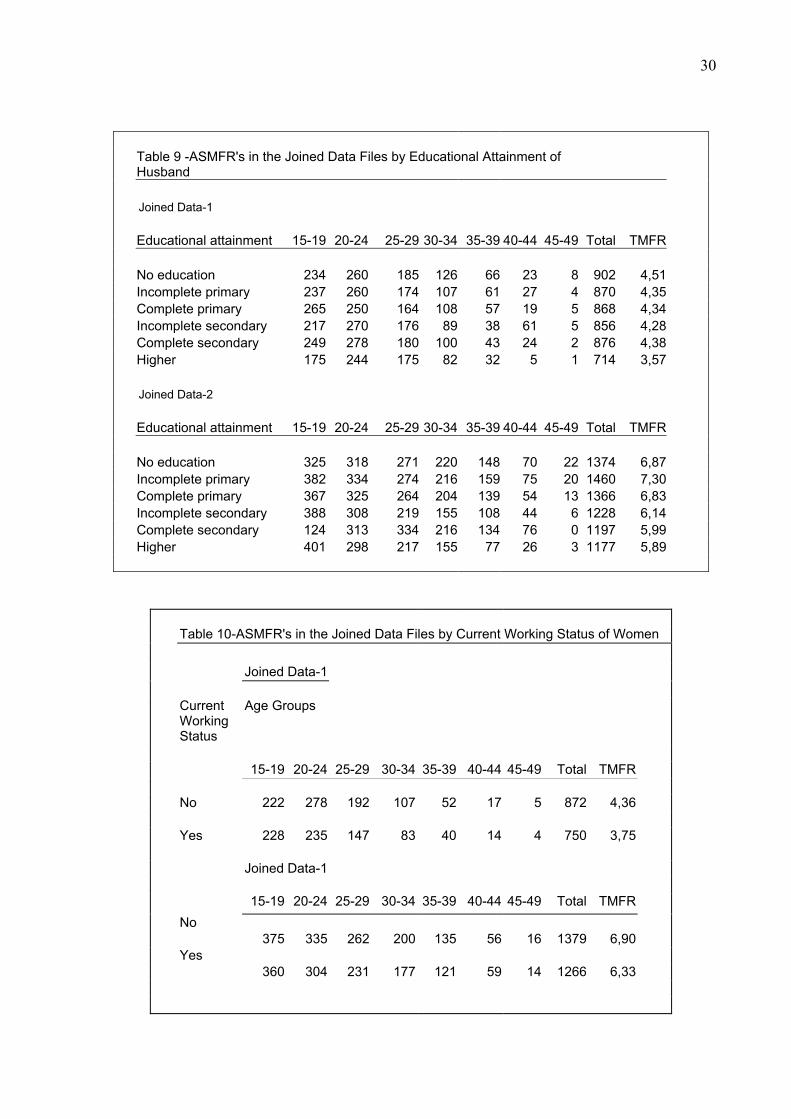
ASMFR’s have not show great differences in terms of levels of education. They are very high for all education levels (Table 8). Women who completed secondary school have more children than uneducated women Husbands show the same fertility pattern in these education levels (Table 9). No educated husband have 1 more child than higher educated husband (4.51-3.57 versus 6.87-5.89).
TMFR’s have not changed by the current working status for the first data set,
but it decreases 1 child when women have been working in the joined data-1. ASMFR’s are greater at younger ages for the levels of current working status than those of older ages (Table 10).
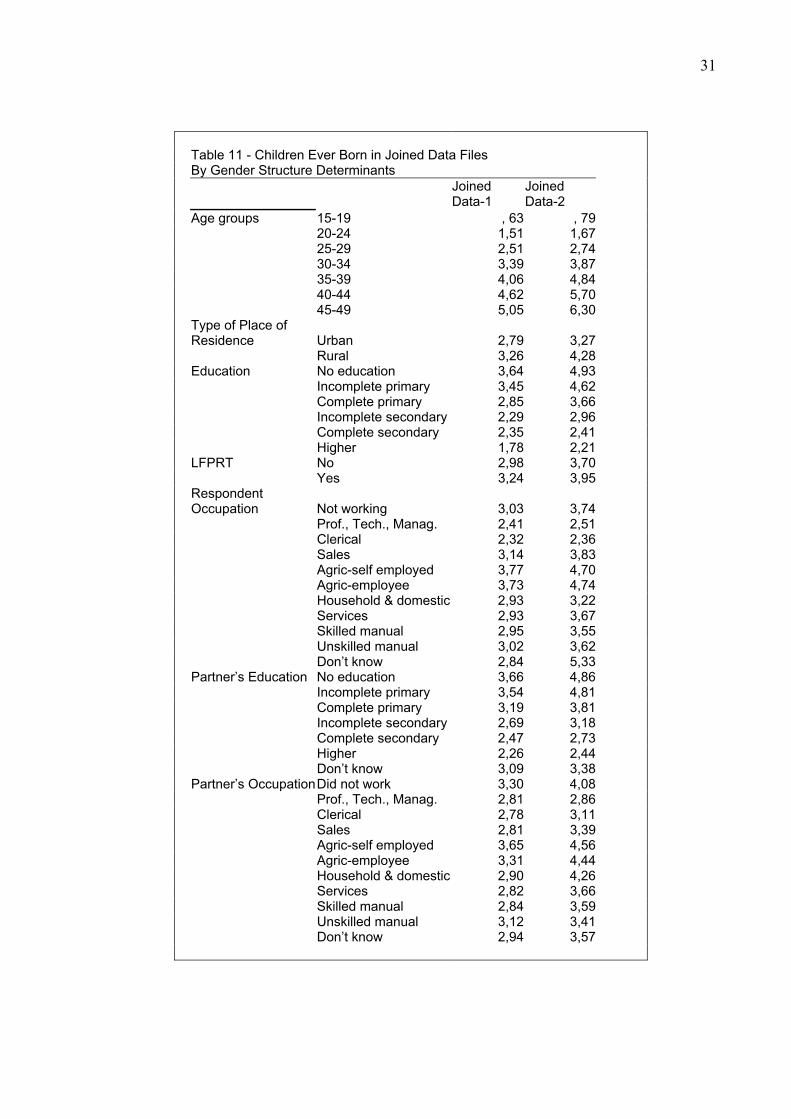
c. Children Ever Born and Children Living Mean number of children ever born represents the completed fertility rates of
women in 40-49 ages. Fertility trends show differnces for the past fertility experience according to gender structure of both data sets (Table 11). If women and husband are more educated mean CEB decrease approximately 2 children for both groups. Women and husband who are employed in the self agriculture have more children. At the end of the fertility period women have approximately 5 children in the joined data-1, and have 6 children in the joined data-2.
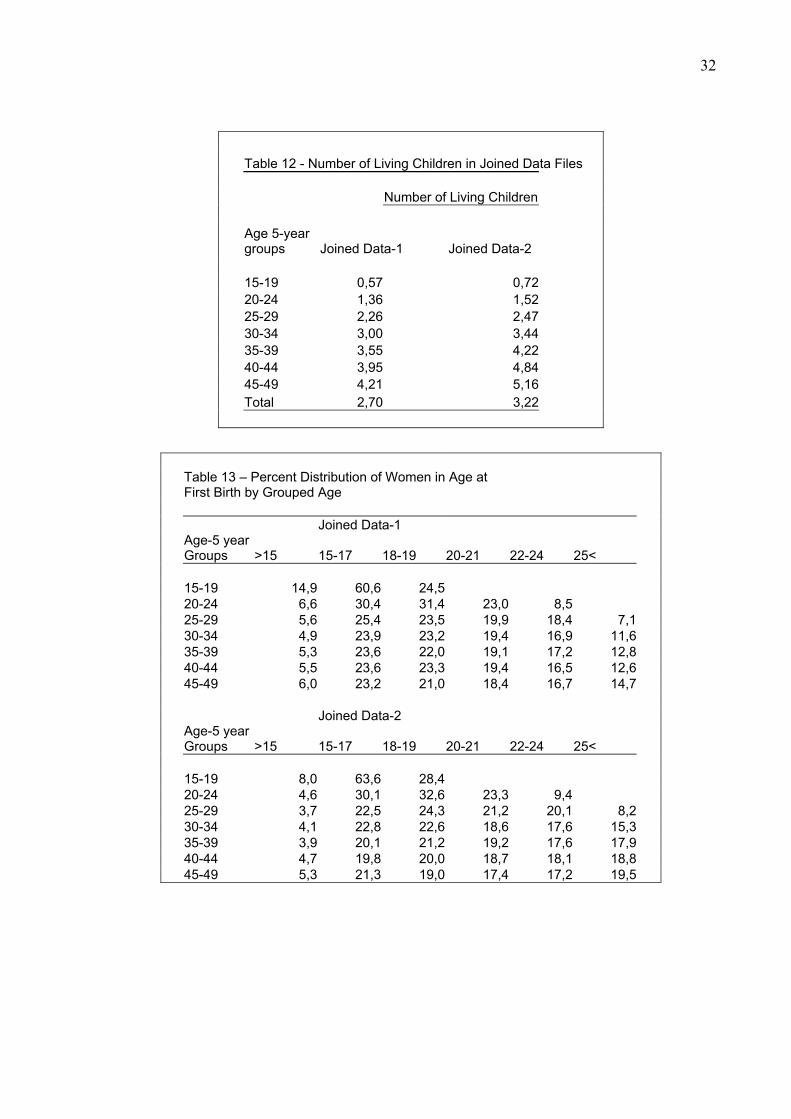
In Table 12, mean number of living children is shown. Mean CEB is bigger than mean number of living child as expected. Mean number of living children with compared mean CEB can lead an evaluation of survival status of children. In the two joined data sets 1 child could not survive for at the end of the completed fertility period ages. (5-6 versus 4-5).
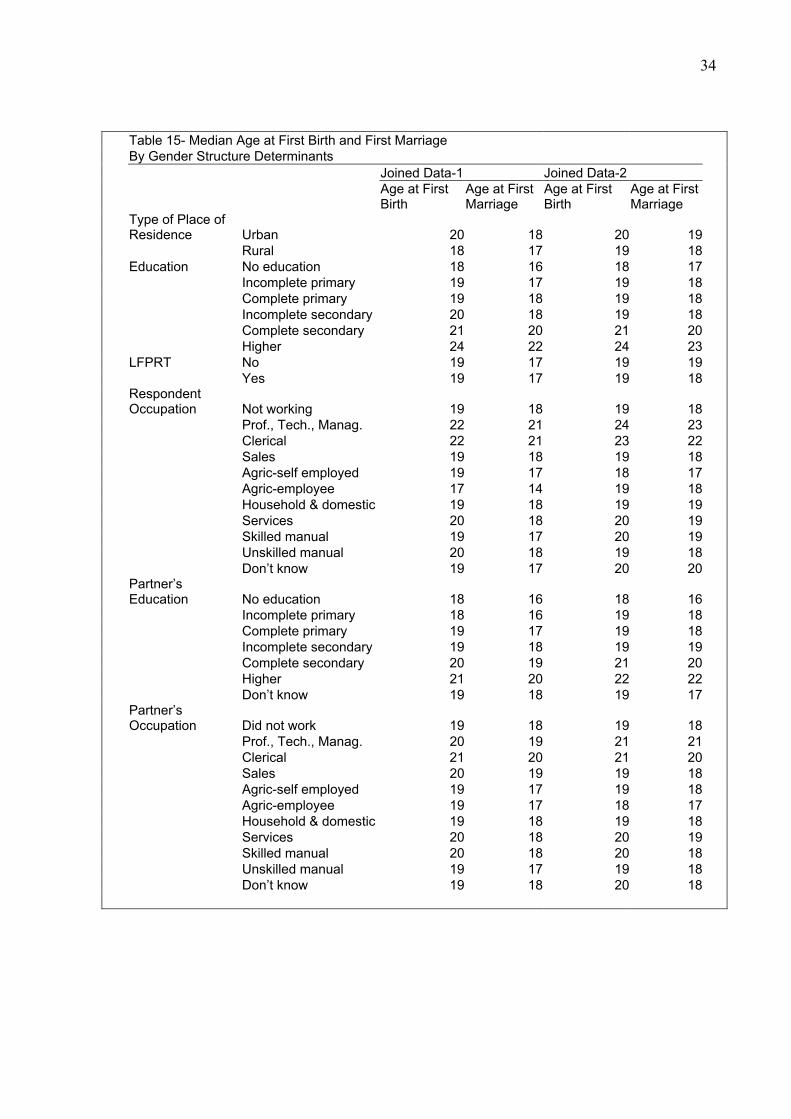
d. Age At First Birth and First Marriage In Table 13 and Table 14, proportion of women who give their first birth and age
at first marriage by age groups have been represented. Age at first birh which is the begining of childbearing has important effects on fertility levels. “In many countries, postponement of first births, reflecting on increase in the age at marriage has contributed greatly to overall fertility decline”, (Toros, 1993). Women in the two data sets give births at the earlier ages.
In general, in the data sets, women marry at younger ages, but women of second data set marry at the ages of 15-24 is much greater than the first group.
16
Median age at first birth is same in urban areas for the two data sets (20), and
age at first marriage is 19 in the joined data-2 (Table 15). The first group marries one 1 year earlier in the same area. Women live in rural area marry and give their first birth during the adolescent period (17-18).
In addition, age at first birth and age at first marrige show differences in diffrent
educational levels. Uneducated women’s age at first marriage and age at first birth is lower than the more educated women’s age for the joined data set, as expected.
Current working status of women do not effect age at firsh birth and first marriage in the joined data-1. Working women’s age at first marriage, 1 year greater than non-working women in the second data set. Again, as it is expected, professional, tecnical, menagerial, clerical, services positions worker’s age at first marriage and first birth is higher than other levels for women and husbands in two joined data sets. Moreover, both of the fertility determinants are positively related with the socio-economic status of husband.
e. Contraceptive Usage-Fertility Preference and Decision Making In the Table 16, respondent’s contraceptive usage and fertility prefence related
attitudes have been represented. Although, most women know a modern method, approximately, 39% of women never used any method in both data set. Usage of any modern method is near to 50% for both of them. 23% of women do not know a source for any method. 34.5 % of women want another child in the two group even though the great percent of them have expressed the ideal number of children beetween 2-3 during the surveys’ dates.
5. CONCLUSION AND POLICY RECOMMENDATIONS
According to the experimental study results, and also comparison of these
results with European Union countries’ fertility trends, hypothesises were true. It is shown that fertility rates differentiate by socio-economic status- education level, current working status, and type of occupation of women and of her husbands.
First of all, 60% of women in the first joined data set, 48% of women in the
second joined data set have no education and did not complete the primary school, their husbands have values for those levels as 44% and 42%. The total marital fertility rate (TMFR) of joined samples is 4,25 and 7. It is observed in urban and rural as 4-5 versus 7-8. High-educated women give birth less than no educated women at the end of their fertility period. The results have not different from the side of husband in terms of his education levels. As expected, high-educated husband have less children. Also if women do not work, she has more children than working women in both data sets (3,75-4,36 versus 6,33-6,89).
At the end of the fertility period women have 5 and 6 children in two data sets (at the same order). Age at first marriage is very important for the postponing of age at first birth. There is a sharp difference in ages of these two variables when the education levels have compared them. Both differ 6 years for no-educated and high-educated women.
Therefore, 39% of women have never used contraceptives. They have said the
ideal number of children is 2-3.
17
When developed countries’- European Union countries in this study (Appendix
A), socio-economic structures have been analysed, it can be seen that education levels and working population are higher than those of developing countries. The Labour Force Participation Rate for men is 66.7% and 44.8% for women in 1994. In addition, unemployment rate, in 1995, is 9.5% for men and 12.5% for women. When the total employment population is examined according to the activity sector, 9.5% is in agriculture, forestry, and fishing, 30.6% is in industry, and 63.9% is in services, (Eurostat Yearbooks 1997, 2000).
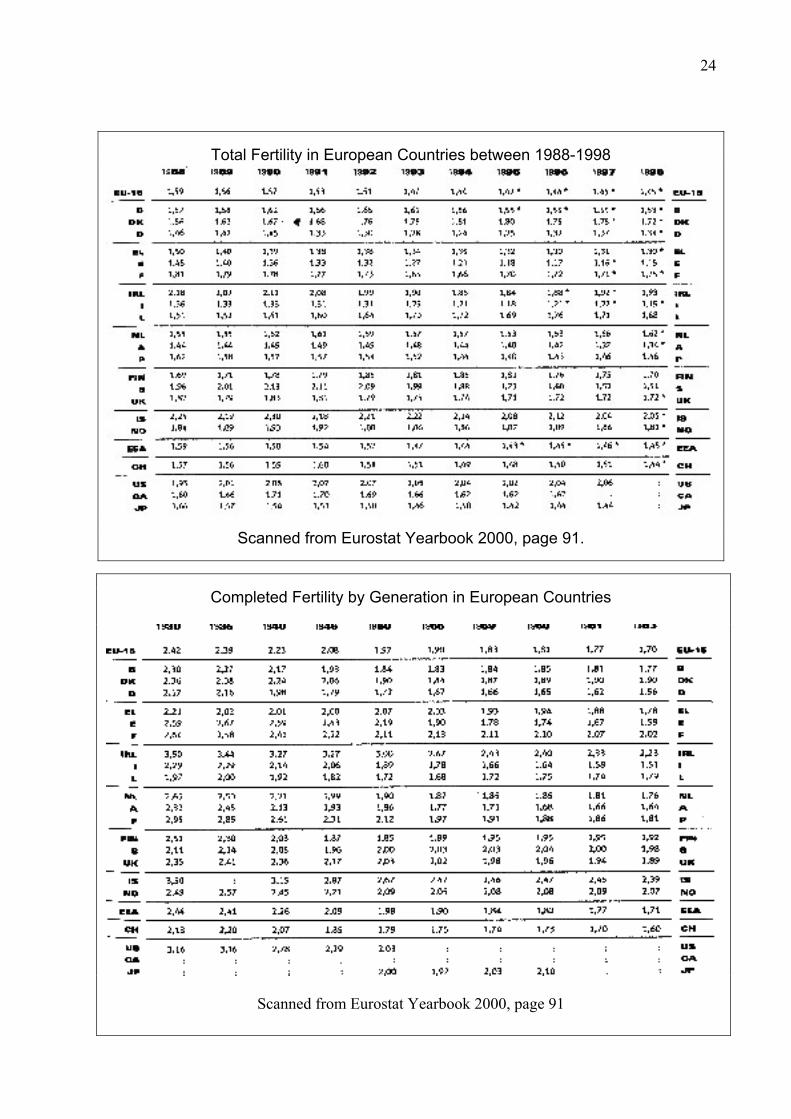
Age at first marriage is 28 for men, 25.6 for women in 1993. Total Fertility
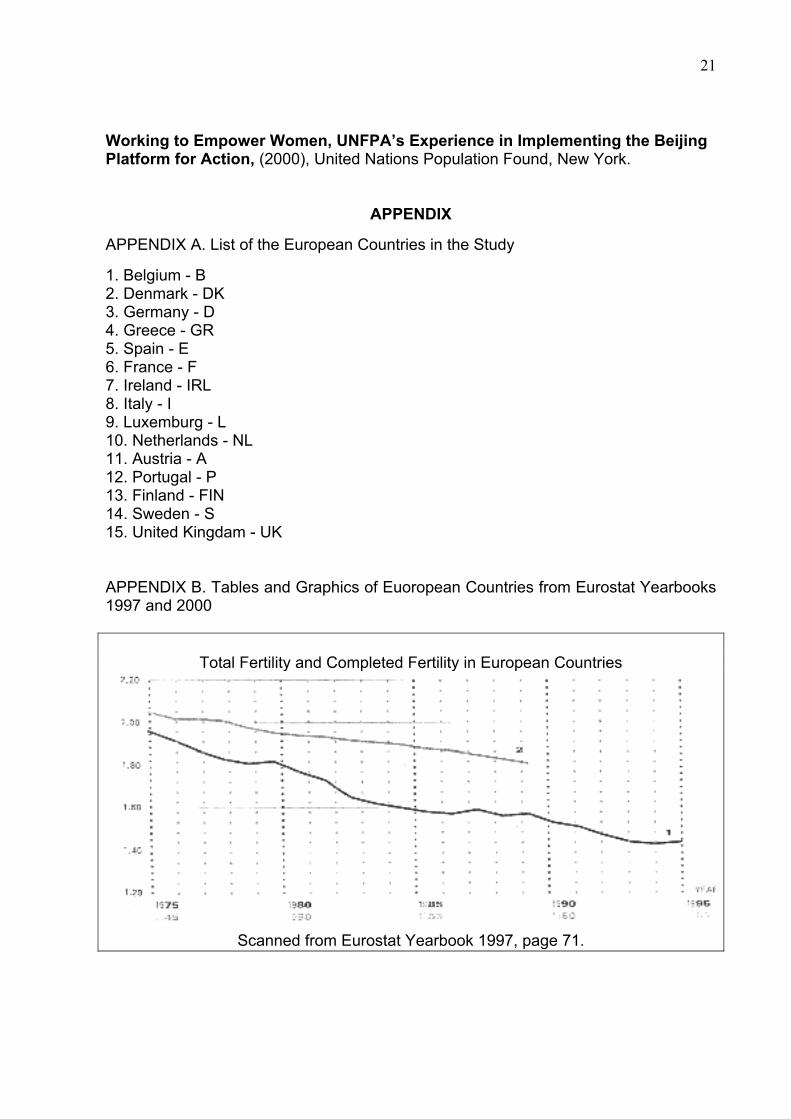
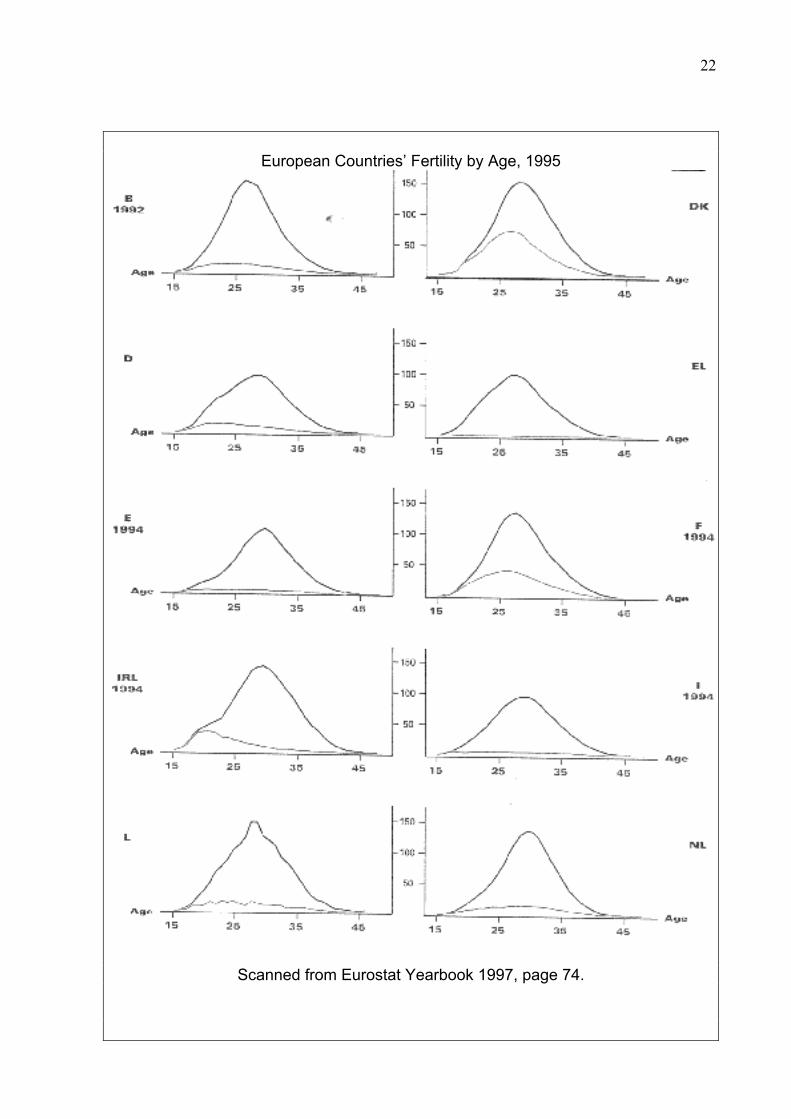
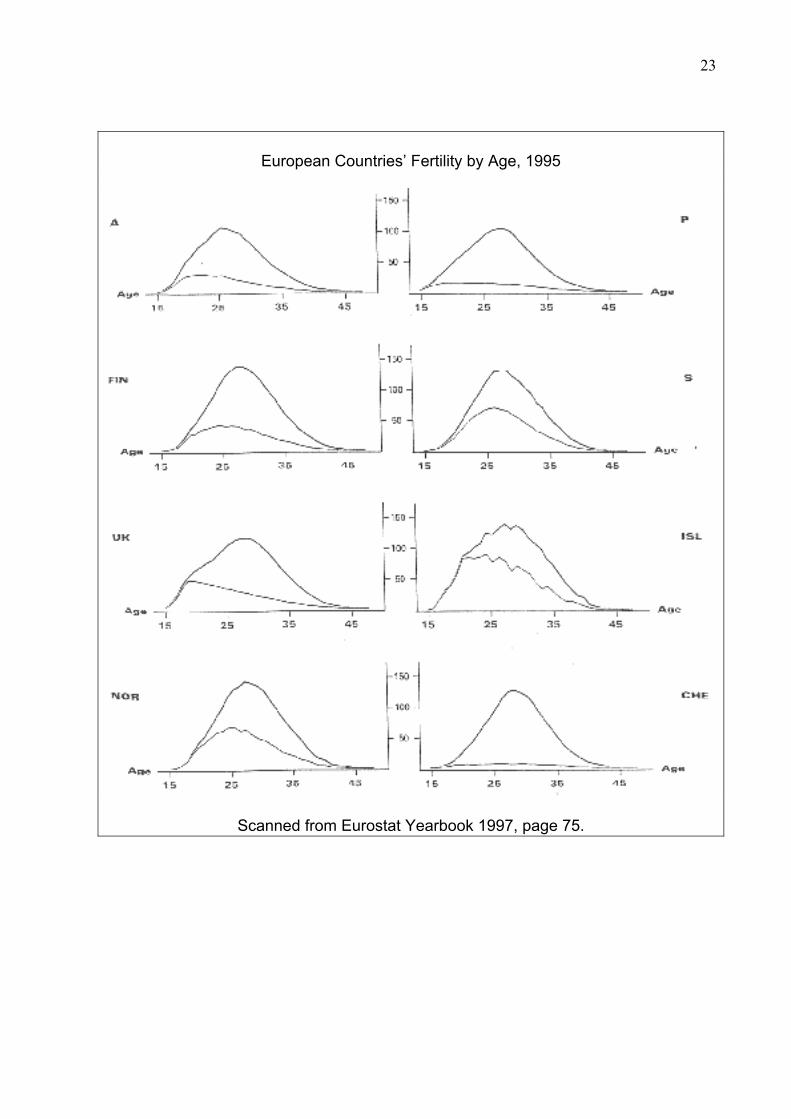
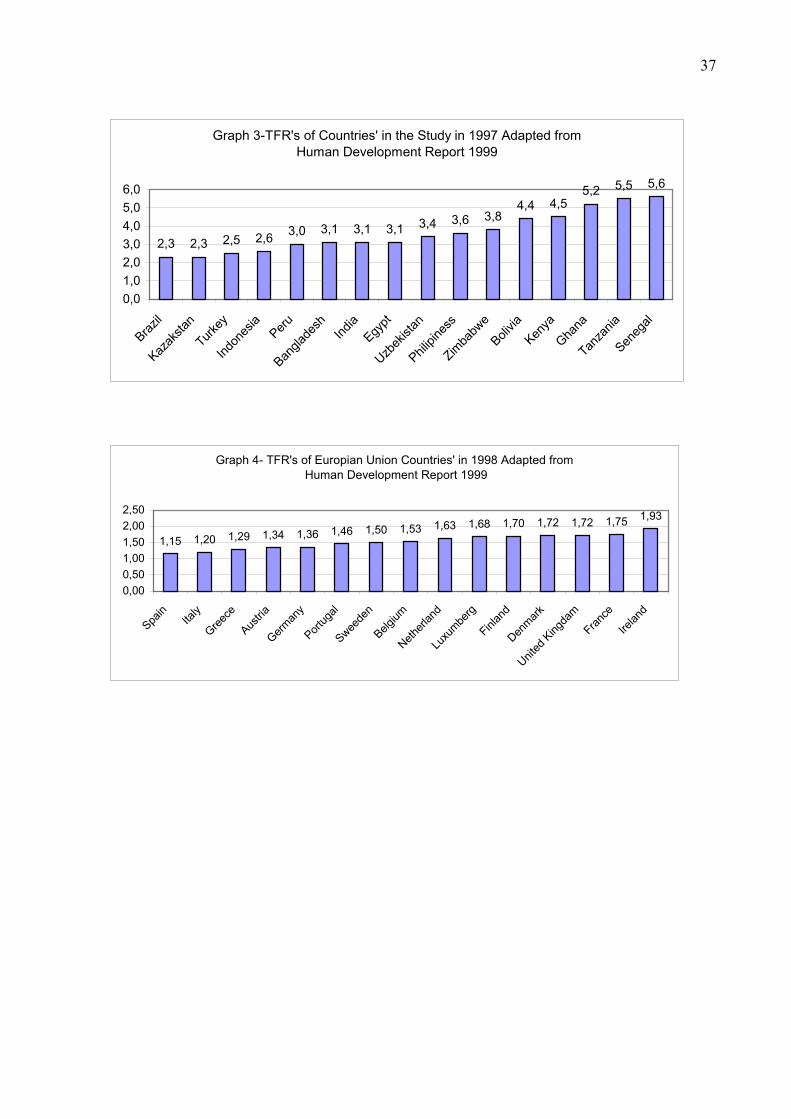
Rate’s (TFR) of European Union countries’ change between 1.2 and 1.93 in 1998, (Human Development Report 1999). This range is very smaller than the range of fertility rates of developing countries in this study, which is 2.3-5.6 according to the same source in 1997. (Graph 3 and Graph 4). ASMFR’s in 1995 and in 1997 show the similar age patterns for all countries in the European Union. Women give births mostly their 25-35 ages. Again, TFR of those countries have decreased in ten years from 1.59 to 1.45 between 1988 and 1998. ‘Percentage of population aged 25-29 having completed education at least upper secondary education for women and men’ is 88% in 1996, and is 59.9% in 1998 (Appendix B).
Gender Development Index (GDI) also gives an idea for comparing the countries in terms of “the average achievement of each country in life expectancy, educational attainment and income in accordance with the disparity in achievement between women and men”. “For comparison among countries the Gender Development Index, and the Gender Empowerment Measure are limited to widely available in the international data sets”, (Human Development Report, 1999). In the Report, countries have been divided by the gender related development index into three categories: high, medium and low developed countries. European countries have been assigned to the category of highly developed, whereas 14 of the countries in the study have been assigned to the category of medium developed, and the other two countries (Bangladesh and Tanzania) have been assigned to the category of low developed.
There are lack of data and variable limitations to test hypothesise and to profile the gender structure of whole world. Demographic and Health Surveys has been required to include more men related questions and data for all countries, and also include the questions which allow to examine with socio-economic status of family in terms of gender structure of any society on a scale. A new part might be added to survey questionnaire to predict the socio-economic status of family instead of the every researcher’s calculations in their own study. It brings also standardization to the analysis and evaluations. DHS has the following questions (DHS web, page, http://measuredhs.com) in the survey questionnaire:
“Husband's background: Currently married women are asked about the age, education, and occupation of their husbands. Status of women: The questionnaire asks about various aspects of women's empowerment, including decision-making and autonomy, and about attitudes about domestic violence.” The women's questionnaire contains information on the following topics:
18
“Gender is a fundamental dimension of societal stratification. The MEASURE program underscores the importance of providing accurate and useful data on gender relations and emphasizes the need to identify and develop meaningful indicators of women's empowerment. As a result, questions on gender roles and issues including the status of women, domestic violence, and female genital cutting have been integrated into the DHS+ questionnaire. Comparable data on gender relations will now be available for all countries where surveys are implemented. For countries interested in in-depth data on status and gender roles, additional questionnaire modules are available.” There are some suggested questions for adding to the survey questionnaires:
For man: fertility preferences related questions as it is in women’ questions, contraceptive usage of man.
For both sex: source of income, income and expense rates, insurance and health insurance (and for their child), ownership of any property (home, land, goods, etc), how many times in a year they leave their current residence and why, how far their home is near to hospital and school, etc. For example, in DHS’s asking these questions increase the survey expenses, but there are also some not applicable (NA) questions for most of the countries, which might be extracted from the survey questionnaires. If these and other questions are added, a scale will be developed to measure socio-economic status and also to profile gender structure of a society. Then analysing fertility levels or trends gives more concrete results. In addition, a researcher has to consider the cultural structure of that society.
Fertility is related for both sexes, in terms of decision-making about fertility with spouse, contraceptive usage, age at first birth, helping of men to women during delivery, and soon. According to the recent comparative research results, by holding the cultural factors constantly, same socio- economic structures show similar fertility patterns (Mboup and Saha, 1998). Taking into consideration of those results: First, it is also essential to consider man’s socio economic levels into fertility trends. Second, it is important to compare fertility levels between developed and non-developed countries.
As it is seen in Table 17 (Kono,1997), the difference between the TFR’s of developed and developing coutries is 1.57 in 1995-2000 according to the projection results. TFR’s are related with the whole development of countries not only related with the empowerment of women in any society.
As it was offered to improve the quality of life for all people in the 16th chapter
of Program of Action (UNFPA, 2000), development programs attach importance to ‘global economic and human development’. The action programs referring to gender quality and man were also defined in those programs. But, all programs sould look at the situation in terms of the necessity of empowerment of man that is to say for both sexes which gender term covers.
According to the study results, the fertility rate in developing countries is determined not only by the socio-economic status (S.E.S) of women but also by the socio-economic status of men. Husbands also live in the same or similar socio-economic conditions and cultural envirement. These results are also identical in the developed Europian countries; however, women and men have higher S.E.S levels. It has also been observed that socio-economic state of women and husband cannot be
19
seperated. Thus, if empowerment of women in developing countries is required, husbands of these women would also be empowered. In general, if the point is to explain the fertility trends and factors, family, as a result, should not be separeted into two.
Therefore, efforts aimed to empowerment of women in the frame of population policy applications are not convincing. Instead, studies ‘empowerment of family’ should be conducted. When the number of people living in the developing countries (5/6 of the world population ) taken into consideration, the importance of this effort cannot be denied.
6. REFERENCES Baron, R.A. and Byrne, D. (1987), Social psychology: Understanding human interaction, 5 th ed. Maryland. Berer, M. (1996), ”Men”, Journal of Reproductive Health Matters, 48: 36-42 Coin, M., Kharim, S.R. and Nahar, S. (1979). “Class, Patriarchy and Women’s Work in Bangladesh”, Population Studies: A Journal of Demograpy, 48(1): 21-45 Coltrane, S. and Ishıı-Kuntz, M. (1992), "Men's housework: A life course perspective", Journal of Marriage and Family, 54: 43-57. Devlet İstatistik Enstitüsü, (1992), Türk Aile Yapısı Araştırması, Ankara. Dyson, T. and Moore, M. (1983). “Kinship structure, female autonomy and demographic behaviour in India”, Population and Development Review, 5(3): 405-438. Ergöçmen, (1997), ‘Women’s Status’ and Fertility in Turkey’. In: Fertility Trends, Women’s Status, and Reproductive Expectations in Turkey, Hancıoğlu, A., Ergöçmen, B. A., Ünalan, T., Hacettepe Institute of Population Studies and Macro International Inc. Calverton, Maryland, 79-102.
Eurostat, (1996), 1996 Facts through Figures- A Statistical Portrait of the Europian Union 1996, Brusels-Luxemburg. Eurostat, (1997), Eurostat Yearbook ’99, A Statistical Eye on Europe 1986-1996, Luxemburg. Eurostat, (2000), Eurostat Yearbook ’99, A Statistical Eye on Europe 1988-1998, Luxemburg. Eurostat, (2000), Theme 1, General Statistics Europian Communitie, Luxemburg. Hacettepe University Institute of Population Studies, (1987), 1983 Turkish Population and Demographic Survey, Ankara. Heilig, K. G. (2000), DemoGraphics’96, (CD), Population Education Developed for United Nations Population Fund and the Netherlands Interdisciplinary Demographic Institute.
20
Kağtçıbaşı, Ç. (1979). The Value of Children: Some Social-Psychological Determinants of Fertility in Turkey, in Demographic Taransition and Social-Development, Precedings of the United States/UNPA Expert Group Meeting, İstanbul, 27 April-4 May 1977, New York, 140-152 Karadayı, F. (1972). “Socio-Economic Correlates of Fertility Behaviour and Attitudes in Turkey”, Ms.Thesis, Hacettepe University Institute of Population Studies, Ankara. Karim, M.S. (1997). Reproductive Behaviour in Muslim Countries, Demographic and Health Surveys Working Papers, No.23, Macro International Inc., Maryland. Kono, S. (1997) “World Population in Population and Food Strategy for 21st Century- Asia and World”, in the Asian Population and Development Association, Tokyo, Japon. Kulu-Glasgow, I. (1993), Role of Husbands in Fertility Related Behaviour: A Study on the Comparision of Husband-Wife Attitutes and Determination of Family Size in Turkey Ph.D. Thesis. Hacettepe University Institute of Population Studies, Ankara. Macro International Inc., (2002), DHS III Version 1.1 (with differences from DHS II). Calverton, Maryland. Martin, T.S. and Juarez, F. (1994), Women’s Education and Fertility in Latin America: Exploring the Significance of Education for Women’s Lives, Demographic and Health Surveys Working Papers, No.10, Macro International Inc., Maryland. Mason, C.O. (1995), Gender and Demographic Change: What Do We Know?, International Union for the Scientific Study of Population, Belgique. Mboup, G. and Saha T. (1998) , Fertility Levels, Trends, and Diffrencials, Demographic and Health Surveys Comparative Studies, No.28, Macro International Inc. Calverton, Maryland. Sadik, Nafis, (1989). “Population and Development - towards the 21st Century”, Presented at the School of Public Health, John Hopkins University, Baltimore, Maryland. Schular, S.R. and Hashemi, S.M. (1994). “Credit Programs, Women’s Empowerment and Contraceptive Use in Rural Bangladesh”, “Studies in Family Planning”, 25(2): 96-110. Toros, A. (1993), Fertility, in 1993 Turkish Demographic and Health Survey, Chapter 3, Hacettepe University Institute of Population Studies and Macro International Inc. , Ankara, 25-32. Tuncer, B. (1979). A Survey of Economic and Social Correlates of Turkish Fertility, in Demographic Transition and Social-Development, Precedings of the United States/UNPA Expert Group Meeting, İstanbul, 27 April-4 May 1977, New York, 135-149. United Nations Development Program, (1999), Human Development Report 1999, Oxford University Press Inc., New York.
21
Working to Empower Women, UNFPA’s Experience in Implementing the Beijing Platform for Action, (2000), United Nations Population Found, New York.
APPENDIX
APPENDIX A. List of the European Countries in the Study 1. Belgium - B 2. Denmark - DK 3. Germany - D 4. Greece - GR 5. Spain - E 6. France - F 7. Ireland - IRL 8. Italy - I 9. Luxemburg - L 10. Netherlands - NL 11. Austria - A 12. Portugal - P 13. Finland - FIN 14. Sweden - S 15. United Kingdam - UK APPENDIX B. Tables and Graphics of Euoropean Countries from Eurostat Yearbooks 1997 and 2000
Total Fertility and Completed Fertility in European Countries
Scanned from Eurostat Yearbook 1997, page 71.
22
European Countries’ Fertility by Age, 1995
Scanned from Eurostat Yearbook 1997, page 74.
23
European Countries’ Fertility by Age, 1995
Scanned from Eurostat Yearbook 1997, page 75.
24
Total Fertility in European Countries between 1988-1998
Scanned from Eurostat Yearbook 2000, page 91.
Completed Fertility by Generation in European Countries
Scanned from Eurostat Yearbook 2000, page 91
25
Table 1- Survey Datasets
Sub-Saharan Africa
Benin Botswana Burkina Faso Burundi Cameroon CAR Chad Comoros
Cote d'Ivoire Eritrea Ethiopia Ghana Guinea Kenya Liberia Madagascar
Malawi Mali Mauritania MozambiqueNamibia Niger Nigeria Rwanda
Senegal Sudan Tanzania Togo Uganda Zambia Zimbabwe
North Africa/West Asia/Europe
+ Egypt Jordan
Morocco Tunisia
Turkey Yemen
Central Asia
Kazakhstan Kyrgyz Republic Uzbekistan
South & Southeast Asia
Bangladesh India
Indonesia Nepal
Pakistan Philippines
Sri Lanka Thailand
Latin America & Caribbean
Bolivia Brazil Colombia Dominican Republic
Ecuador El Salvador Guatemala Haiti
Mexico Nicaragua Paraguay Peru
Trinidad & Tobago
Bold Fonts Indicate Countries Included in The Study. Adapted from Macro International Inc.Web Site-http://www.dhsmeasure.com
26
Table 2- Year of Interviews and Sample Size
Country Code Year of Interview Total Joined Data-1 Bangladesh BD3 96-97 8981 Brazil BR3 96 8701 India IA2 92-93 89506 Indonesia ID3 94 28168 Kazakhstan KK3 95 2859 Turkey TR2 93 6519 Uzbekistan UZ3 96 3315 Zimbabwe ZW3 94 4465 Total 152514 Joined Data-2 92 Bolivia BO3 93-94 5983 Egypt EG3 95-96 14779 Ghana GH2 93-94 3672 Kenya KE2 93 5220 Peru PE3 96 19963 Philippines PH2 93 9686 Senegal SN2 92-93 4732 Tanzania TZ3 96 6221 Total 70256 Total N 222770
Table 3 - Concurrence of Downloaded Data With Published 1993 TDHS Report Number of Respondent by Age (Weighted and unweighted) Downloaded data DHS Publish , Page 19
Age
Groups Unweighted Weighted Unweighted Weighted Exposures
Downloaded 15-19 330 332 330 332 344 20-24 1031 1040 1031 1040 1040 25-29 1230 1211 1230 1211 1232 30-34 1280 1283 1280 1283 1258 35-39 1085 1073 1085 1073 1077 40-44 888 901 888 901 866 45-49 675 679 675 679 567 Total 6519 6519 6519 6519 6384
27
Table 4- Total Marital Fertility Rates (TMFR) Of 16 Developing Country and Median TMFR
Country Name TMFR Bangladesh 4,03 India 4,05 Brazil 4,45 Indonesia 4,46 Turkey 4,55 Kazakhstan 4,58 5,92 Uzbekistan 5,16 Median TMFR Zimbabwe 5,91 Egypt 5,93 Peru 6,06 Ghana 6,56 Kenya 7,12 Bolivia 7,15 Tanzania 7,19 Senegal 7,44 Philippines 7,63
Table 5a- Age Specific Marital Fertility Rates for 36 Months Preceding the Survey Years
JOINED DATA-1 COUNTRIES
Age Groups BANG BR IA ID KZ TR UZ ZW Total 15-19 268 401 207 279 379 331 352 349 231 20-24 220 343 264 224 277 275 331 269 262 25-29 153 262 176 169 150 160 185 203 177 30-34 96 197 98 114 69 89 116 177 104 35-39 44 146 44 70 36 43 40 118 52 40-44 18 66 15 32 7 13 9 52 18 45-49 6 16 5 4 0 1 3 14 5
Table 5b- Age Specific Marital Fertility Rates for 36 Months Preceding the Survey Years JOINED DATA-2 COUNTRIES Age Groups BO EG GH KE PE PH SN TZ Total 15-19 401 360 329 354 402 469 313 341 370 20-24 343 323 278 328 298 383 313 313 323 25-29 262 240 242 260 199 278 290 266 248 30-34 197 146 211 204 155 205 252 221 188 35-39 146 83 143 156 105 127 187 168 127 40-44 66 27 86 70 45 54 99 87 58 45-49 16 7 22 51 8 9 34 42 15
28
Table 6 -Gender Structure Determinants Profile In Joined Data Files
Gender System Profile by S.E.S Variables
Joined Data-1
Joined Data-2
Age groups 15-19 8 5 20-24 18 16 25-29 20 19 30-34 18 19 35-39 15 17 40-44 12 13 45-49 10 11
Type of Place of Residence Urban 34 46
Rural 66 54 Education No education 42 27 Incomplete primary 18 21 Complete primary 10 18 Incomplete secondary 20 13 Complete secondary 6 12 Higher 4 10 LFPRT No 63 53 Yes 37 47 Respondent Occupation Not working 46 47
Prof., Tech., Manag. 7 6
Clerical 3 3 Sales 7 15 Agric-self employed 19 16 Agric-employee 3 3 Household & domestic 2 2 Services 4 3 Skilled manual 6 3 Unskilled manual 2 2 Don’t know 0 0 Partner’s Education No education 24 18 Incomplete primary 20 24 Complete primary 12 14 Incomplete secondary 24 22 Complete secondary 10 9 Higher 9 13 Don’t know 0 1 Partner’s Occupation Did not work 2 1 Prof., Tech., Manag. 12 11 Clerical 7 5 Sales 8 9 Agric-self employed 31 34 Agric-employee 4 4 Household & domestic 0 1 Services 7 4 Skilled manual 19 18 Unskilled manual 9 10 Don’t know 1 2
29
Table 7 - ASMFR's in the Joined Files by Age Groups and Type of Place of Residence Joined Data-1 Joined Data-2
Age Groups ASMFR Urban Rural ASMFR Urban Rural
15-19 231 237 229 370 375 367 20-24 262 256 265 323 295 342 25-29 177 165 183 248 218 273 30-34 104 83 116 188 154 220 35-39 52 37 62 127 92 162 40-44 18 9 24 58 37 76 45-49 5 2 6 15 5 23 TOTAL 849 790 885 1328 1176 1464 TMFR 4,25 3,95 4,42 7,00 5,88 7,32
Table 8 -ASMFR's in the Joined Data Files by Educational Attainment of Women Joined Data-1 Educational attainment 15-19 20-24 25-29 30-34 35-39 40-44 45-49 Total TMFR No education 225 267 187 121 62 21 7 889 4,45 Incomplete primary 238 260 167 102 60 25 5 856 4,28 Complete primary 287 246 158 98 55 20 5 869 4,35 Incomplete secondary 210 260 166 70 28 8 1 745 4,72 Complete secondary 347 307 187 108 44 8 0 1001 5,00 Higher 104 214 195 100 33 8 0 654 3,27 Joined Data-2 Educational attainment 15-19 20-24 25-29 30-34 35-39 40-44 45-49 Total TMFR No education 329 323 274 146 159 129 23 1383 6,92 Incomplete primary 377 338 270 191 148 59 16 1399 7,00 Complete primary 387 324 254 270 125 14 7 1382 6,92 Incomplete secondary 388 306 212 487 97 2 2 1494 7,47 Complete secondary 387 327 222 513 75 3 4 1530 7,65 Higher 490 312 227 573 82 3 3 1689 8,45
30
Table 9 -ASMFR's in the Joined Data Files by Educational Attainment of Husband
Joined Data-1 Educational attainment 15-19 20-24 25-29 30-34 35-39 40-44 45-49 Total TMFR No education 234 260 185 126 66 23 8 902 4,51 Incomplete primary 237 260 174 107 61 27 4 870 4,35 Complete primary 265 250 164 108 57 19 5 868 4,34 Incomplete secondary 217 270 176 89 38 61 5 856 4,28 Complete secondary 249 278 180 100 43 24 2 876 4,38 Higher 175 244 175 82 32 5 1 714 3,57 Joined Data-2 Educational attainment 15-19 20-24 25-29 30-34 35-39 40-44 45-49 Total TMFR No education 325 318 271 220 148 70 22 1374 6,87 Incomplete primary 382 334 274 216 159 75 20 1460 7,30 Complete primary 367 325 264 204 139 54 13 1366 6,83 Incomplete secondary 388 308 219 155 108 44 6 1228 6,14 Complete secondary 124 313 334 216 134 76 0 1197 5,99 Higher 401 298 217 155 77 26 3 1177 5,89
Table 10-ASMFR's in the Joined Data Files by Current Working Status of Women Joined Data-1 Current Working Status
Age Groups
15-19 20-24 25-29 30-34 35-39 40-44 45-49 Total TMFR No 222 278 192 107 52 17 5 872 4,36 Yes 228 235 147 83 40 14 4 750 3,75 Joined Data-1 15-19 20-24 25-29 30-34 35-39 40-44 45-49 Total TMFR No 375 335 262 200 135 56 16 1379 6,90 Yes 360 304 231 177 121 59 14 1266 6,33
31
Table 11 - Children Ever Born in Joined Data Files By Gender Structure Determinants
Joined Data-1
Joined Data-2
Age groups 15-19 , 63 , 79 20-24 1,51 1,67 25-29 2,51 2,74 30-34 3,39 3,87 35-39 4,06 4,84 40-44 4,62 5,70 45-49 5,05 6,30
Type of Place of Residence Urban 2,79 3,27
Rural 3,26 4,28 Education No education 3,64 4,93 Incomplete primary 3,45 4,62 Complete primary 2,85 3,66 Incomplete secondary 2,29 2,96 Complete secondary 2,35 2,41 Higher 1,78 2,21 LFPRT No 2,98 3,70 Yes 3,24 3,95
Respondent Occupation Not working 3,03 3,74
Prof., Tech., Manag. 2,41 2,51 Clerical 2,32 2,36 Sales 3,14 3,83 Agric-self employed 3,77 4,70 Agric-employee 3,73 4,74 Household & domestic 2,93 3,22 Services 2,93 3,67 Skilled manual 2,95 3,55 Unskilled manual 3,02 3,62 Don’t know 2,84 5,33 Partner’s Education No education 3,66 4,86 Incomplete primary 3,54 4,81 Complete primary 3,19 3,81 Incomplete secondary 2,69 3,18 Complete secondary 2,47 2,73 Higher 2,26 2,44 Don’t know 3,09 3,38 Partner’s Occupation Did not work 3,30 4,08 Prof., Tech., Manag. 2,81 2,86 Clerical 2,78 3,11 Sales 2,81 3,39 Agric-self employed 3,65 4,56 Agric-employee 3,31 4,44 Household & domestic 2,90 4,26 Services 2,82 3,66 Skilled manual 2,84 3,59 Unskilled manual 3,12 3,41 Don’t know 2,94 3,57
32
Table 12 - Number of Living Children in Joined Data Files Number of Living Children
Age 5-year groups Joined Data-1 Joined Data-2
15-19 0,57 0,72 20-24 1,36 1,52 25-29 2,26 2,47 30-34 3,00 3,44 35-39 3,55 4,22 40-44 3,95 4,84 45-49 4,21 5,16 Total 2,70 3,22
Table 13 – Percent Distribution of Women in Age at First Birth by Grouped Age
Joined Data-1
Age-5 year Groups >15 15-17 18-19 20-21 22-24 25<
15-19 14,9 60,6 24,5 20-24 6,6 30,4 31,4 23,0 8,5 25-29 5,6 25,4 23,5 19,9 18,4 7,1 30-34 4,9 23,9 23,2 19,4 16,9 11,6 35-39 5,3 23,6 22,0 19,1 17,2 12,8 40-44 5,5 23,6 23,3 19,4 16,5 12,6 45-49 6,0 23,2 21,0 18,4 16,7 14,7 Joined Data-2
Age-5 year Groups >15 15-17 18-19 20-21 22-24 25<
15-19 8,0 63,6 28,4 20-24 4,6 30,1 32,6 23,3 9,4 25-29 3,7 22,5 24,3 21,2 20,1 8,2 30-34 4,1 22,8 22,6 18,6 17,6 15,3 35-39 3,9 20,1 21,2 19,2 17,6 17,9 40-44 4,7 19,8 20,0 18,7 18,1 18,8 45-49 5,3 21,3 19,0 17,4 17,2 19,5

33
Table 14- Percent Distribution of Women in Age at
First Marriage by Grouped Age Joined Data-1
Age-5 year
Groups >15 15-17 18-19 20-21 22-24 25< 15-19 29,7 55,1 15,2 20-24 17,7 35,1 26,9 15,0 5,4 25-29 17,6 31,0 19,9 14,3 12,4 4,8 30-34 17,1 31,8 19,4 13,5 10,8 7,4 35-39 18,4 31,9 18,8 13,1 9,9 7,9 40-44 20,3 32,3 18,5 12,7 8,9 7,3 45-49 21,7 31,4 17,9 12,0 9,3 7,8 Joined Data-2
Age-5 year
Groups >15 15-17 18-19 20-21 22-24 25< 15-19 18,5 63,5 17,9 20-24 10,2 36,1 28,3 18,2 7,2 25-29 9,2 28,1 21,4 17,6 16,8 6,9 30-34 9,9 27,9 19,6 14,8 14,4 13,5 35-39 9,8 27,2 19,1 14,8 14,2 14,9 40-44 10,6 27,2 18,4 13,8 14,5 15,5 45-49 12,9 26,9 17,6 13,9 13,0 15,7
34
Table 15- Median Age at First Birth and First Marriage By Gender Structure Determinants Joined Data-1 Joined Data-2
Age at First Birth
Age at First Marriage
Age at First Birth
Age at First Marriage
Type of Place of Residence Urban 20 18 20 19
Rural 18 17 19 18 Education No education 18 16 18 17 Incomplete primary 19 17 19 18 Complete primary 19 18 19 18 Incomplete secondary 20 18 19 18 Complete secondary 21 20 21 20 Higher 24 22 24 23 LFPRT No 19 17 19 19 Yes 19 17 19 18
Respondent Occupation Not working 19 18 19 18
Prof., Tech., Manag. 22 21 24 23 Clerical 22 21 23 22 Sales 19 18 19 18 Agric-self employed 19 17 18 17 Agric-employee 17 14 19 18 Household & domestic 19 18 19 19 Services 20 18 20 19 Skilled manual 19 17 20 19 Unskilled manual 20 18 19 18 Don’t know 19 17 20 20
Partner’s Education No education 18 16 18 16
Incomplete primary 18 16 19 18 Complete primary 19 17 19 18 Incomplete secondary 19 18 19 19 Complete secondary 20 19 21 20 Higher 21 20 22 22 Don’t know 19 18 19 17
Partner’s Occupation Did not work 19 18 19 18
Prof., Tech., Manag. 20 19 21 21 Clerical 21 20 21 20 Sales 20 19 19 18 Agric-self employed 19 17 19 18 Agric-employee 19 17 18 17 Household & domestic 19 18 19 18 Services 20 18 20 19 Skilled manual 20 18 20 18 Unskilled manual 19 17 19 18 Don’t know 19 18 20 18
35
Table 17- Change of Total Fertility Rate for World, Less Developed and
More Developed Regions Developed: 1950-2000 World Developing Difference
Regions Regions of Two Regions Year 1950-1955 4.97 6.13 2.77 3.36 1955-1960 4.91 5.96 2.77 3.19 1960-1965 4.93 5.97 2.67 3.30 1965-1970 4.46 5.39 2.11 3.28 1975-1980 3.91 4.63 1.91 2.72 1980-1985 3..38 4.15 1.84 2.31 1985-1990 3.38 3.83 1.84 2.00 1990-1995 3.10 3.48 1.70 1.78 1995-2000 2.97 3.28 1.71 1.57 Adapted from the article of Kono, 1997.
Graph 1- Total Marital Fertility Rates of 16 Developing Countries in the Joined Data Files
0123456789
Bangla
desh
India
Brazil
Indon
esia
Turkey
Kazak
hstan
Uzbek
istan
Zimba
bweEgy
ptPeru
Ghana
Kenya
Bolivia
Tanza
nia
Seneg
al
Philipp
ines
36
050
100150200250300350400450
15-19 20-24 25-29 30-34 35-39 40-44 45-49
BANG BR IA ID KZ TR UZ ZW Total
Graph 2a- ASMFR OF COUNTRIES IN THE JOINED DATA-1
Births per 1,000 women
050
100150200250300350400450500
15-19 20-24 25-29 30-34 35-39 40-44 45-49BO EG GH KE PE PH SN TZ Total
Graph 2b- ASMFR OF COUNTRIES IN THE JOINED DATA-2
Births per 1,000 women
37
Graph 4- TFR's of Europian Union Countries' in 1998 Adapted from Human Development Report 1999
1,15 1,20 1,29 1,34 1,36 1,46 1,50 1,53 1,63 1,68 1,70 1,72 1,72 1,75 1,93
0,000,501,001,502,002,50
Spain
Italy
Greece
Austria
German
y
Portug
al
Sweede
n
Belgium
Netherl
and
Luxu
mberg
Finlan
d
Denmark
United
Kingda
mFran
ce
Irelan
d
Graph 3-TFR's of Countries' in the Study in 1997 Adapted from Human Development Report 1999
2,3 2,3 2,5 2,6 3,0 3,1 3,1 3,1 3,4 3,6 3,84,4 4,5
5,2 5,5 5,6
0,01,02,03,04,05,06,0
Brazil
Kazak
stan
Turkey
Indon
esia
Peru
Bangla
desh
India
Egypt
Uzbek
istan
Philipi
ness
Zimba
bwe
Bolivia
Kenya
Ghana
Tanza
nia
Seneg
al