Embed Size (px)
Citation preview

GENDER DIFFERENCES IN DEMAND FOR INDEX-BASED LIVESTOCK INSURANCE
ABSTRACT
Risk management plays a role in avoiding and escaping chronic poverty throughout the world,
particularly for women, who are disproportionately negatively affected by shocks. Using three years of
household survey data, administrative records and qualitative interviews, this paper examines the
relationship between gender and demand for index-based livestock insurance (IBLI) among pastoralists in
southern Ethiopia. Though IBLI appears to be equitably accessed by men and women alike, demand is
gender-differentiated along two dimensions: risk aversion and informal insurance. We also find modest
differences associated with age and share of income from livestock.

INTRODUCTION
Multiple studies demonstrate how, in the developing world, women and their children are
disproportionately negatively affected by household-level shocks (Dercon and Krishnan, 2000;
Hoddinott, 2006; Hoddinott and Kinsey, 2000; Dercon and Hoddinott, 2005; Behrman, 1988; Rose,
1999). As a result, women are overrepresented among the world’s poor and vulnerable and therefore may
benefit disproportionately from improved risk management (Banthia et al., 2009). The social norms and
institutions that render women’s physical, social and economic vulnerabilities different than those of men
may, at the same time, impact their access to innovative products intended to mitigate the long-term
detrimental effects of shocks. This may be especially true in very poor, traditional, rural communities
such as the pastoral areas of the Horn of Africa where climate variability compels reliance on extensive
grazing as the dominant livelihood strategy, but a heavily male-dominated one.
Index-based livestock insurance (IBLI), a product specifically designed to protect against
catastrophic livestock loss due to drought in the rangelands of northern Kenya and southern Ethiopia, is
one such product. Understanding what determines access to IBLI by gender can help shape strategies to
equitably provide access to this and other innovative risk management products.
Unlike standard insurance, index insurance contracts are not designed around policyholders’
actual losses, but around an exogenous index that is highly correlated with policyholders’ losses. In the
case of IBLI, the index was originally designed for pilot implementation in a neighbouring area of
northern Kenya using longitudinal data on herd mortality statistically fit to remote-sensing data known as
Normalized Differenced Vegetation Index (NDVI), which depicts the vegetative conditions (specifically,
greenness) in these difficult-to-reach areas (Chantarat et al., 2013).
1 Insurance payouts are triggered when the cumulative deviation of NDVI from mean levels predicts
livestock mortality rates beyond a given threshold. IBLI was subsequently adapted to southern Ethiopia’s
Borana Zone, the focus of this paper.
Such Index-based products are particularly appealing in developing country settings where
insured amounts tend to be small relative to the transactions costs associated with executing a contract in
1
a limited infrastructure environment. Information asymmetries that plague insurance products (that is,
moral hazard, adverse selection) may be more likely to exist in remote parts of the developing world due
to poor infrastructure and monitoring capacity. Despite its potential to overcome difficulties associated
with more standard insurance products, demand for IBLI and similar products has been weaker than
expected (Jensen, et al., 2014).
Theory and prior empirical work suggest that other primary determinants of demand for index-
based products include price, trust, credit constraints, understanding of the product and the consumer’s
attitude toward risk (Hill et al., 2011; Giné et al., 2008). A willingness to pay field experiment and ex ante
simulation of IBLI performance suggests that the availability of coping strategies, a household’s
expectation of loss and herd size are key determinants of demand for IBLI specifically (Chantarat, 2009).
To the best of our knowledge, no previous studies focus specifically on gender and demand for
index insurance products, though Norton et al. (2014) offer suggestive evidence that women in Tigray
may prefer more expensive, high-frequency payout index insurance over index insurance that costs less
but pays out less frequency. In northern Kenya in 2010, 62 per cent of IBLI purchases were made by
women, while female-headed households made up only 37 per cent of the study sample, yet Jensen et al.
(2014) find no significant gender effect on demand. In Ethiopia, roughly 20 per cent of purchasers are
women, which corresponds to the proportion of households that are female-headed. Takahashi et al.
(2016) find that being female is associated with a greater likelihood of IBLI purchase, but a lower total
insured herd value. Given these ambiguous findings, and the pastoralist environments in question, where
men have higher financial literacy, greater control over assets, more education and access to information,
one might expect differential access to innovative risk management products between men and women.
This study explores determinants of IBLI demand that may vary by gender using administrative
and household-level panel data from southern Ethiopia informed by a series of qualitative interviews.
Building on previous empirical findings, we posit that risk aversion, informal insurance, product
education and female-held assets are particularly relevant to women’s demand for IBLI. We find no
gender difference in overall demand for IBLI, but that there are subtle differences in drivers of demand by
2

gender with respect to informal insurance. Older age of female household heads is associated with
slightly lower demand by women, while women’s smaller share of livestock income is associated with
higher demand. Finally, we find qualitative evidence of gender influencing IBLI purchase through means
not captured in the econometric model, which may indicate women’s vulnerability to pressure by sales
agents.
These findings have broader relevance beyond the IBLI project area. Especially with climate
change seeming to pose greater threats of extreme weather events in poor areas, particularly in the arid
and semi-arid tropics, development practitioners are focusing more than ever on facilitating improved risk
management. At the same time, although women’s empowerment is a widespread rallying cry in
development circles, new products – such as index insurance – are commonly developed in a gender blind
manner. In settings like the one we study, where climate variability and livelihood change come together
in a deeply traditional and paternalistic culture, more focused attention to the gendered nature of new
product development and diffusion can help ensure effective and inclusive development.
KEY ELEMENTS OF INSURANCE DEMAND AND GENDER
Risk aversion
A consumer’s attitude toward risk should be a key determinant of his or her willingness to pay
(WTP) for insurance. However, in the case of index insurance, the presence of basis risk, or the mismatch
between index predictions and purchasers’ experience on the ground, may confound the theoretically
positive relationship. If the factors that drive IBLI’s basis risk have a gender dimension, then we could
expect to see gender-differentiated responses to equal levels of risk aversion.
Much empirical and experimental work has attempted to determine whether there is a relationship
between gender and risk aversion and, if so, what the underlying mechanisms of the relationship are. In a
review of the topic, Eckel and Grossman (2008) note that many studies on gender and risk aversion lack
rigor and fail to control for difficult-to-measure traits like confidence, or even measurable ones such as
3
income or wealth. Furthermore, measures of risk aversion and its associated characteristics, such as
perceptions of risk, are likely highly sensitive to context and risk domains (Weber et al., 2002).
One study of risk aversion in the Ethiopian highlands found no difference in risk preferences
between men and women (Yesuf and Bluffstone, 2009), though these results may not be generalizable to
pastoralist Ethiopia given the substantial difference between the two settings. In the context of index
insurance, Giné et al. (2008) find no relationship between demand and gender, but they suggest an
interaction effect between risk aversion and knowledge in that risk averse individuals with little
knowledge of the product are less likely to purchase than those with greater knowledge. In cases where
women’s knowledge of the product is systematically lower, this could translate to a gender effect
associated with risk aversion. Similarly, a gender difference in perceived risk of drought could translate to
a gender effect on demand operating through risk aversion. Given the lack of consistent, generalizable
findings on gender and risk aversion, the relationship between gender, risk aversion and demand for
livestock insurance remains an empirical question. We can expect the effect of risk aversion on IBLI
uptake to vary by gender, but the direction of the effect remains ambiguous.
Informal insurance
Informal risk management institutions exist in virtually every society and include kin networks
based on reciprocity, indigenous lending organizations and similar arrangements designed to mitigate the
impact of shocks, either ex ante or ex post. Studies on the coverage of informal risk management
institutions, both aggregate and differentiated by income, have repeatedly shown that informal insurance
falls short of fully protecting households against covariate shocks and performs only slightly better in
protecting against idiosyncratic shocks (see Morduch, 1999; Bhattamishra and Barrett, 2010 for reviews),
but whether informal insurance is a substitute for or a complement to index insurance is unclear. Where
index insurance protects households against covariate shocks, it may serve as a complement to informal
mechanisms that protect against idiosyncratic shocks and a substitute for informal mechanisms, such as
remittances, that protect against covariate shocks.
4

Lybbert et al. (2004) suggest that idiosyncratic risk dominates among these pastoralists and that
livestock transfers offer only limited insurance coverage. In the same context, Santos and Barrett (2011)
find that that informal cattle loans function as a safety net rather than as insurance in that loans are given
contingent on the borrower’s expected gains rather than the borrower having experienced a shock. Both
cases suggest that informal mechanisms weakly, if at all, insure pastoralists against idiosyncratic or
covariate risk. Mobarak and Rosenzweig (2013) find that where basis risk driven by idiosyncratic risk is
high, index-based products complement informal insurance participation, but where basis risk is low
informal risk sharing has no effect on demand. If idiosyncratic risk is poorly covered by informal
mechanisms IBLI is unlikely to complement informal insurance. If that is the case, then informal
insurance should have a negative or no effect on demand for IBLI.
While none of the above findings pertain specifically to gender, women’s risk might be less
covered by informal institutions than that of men, due to differences in wealth or social connectedness.
Even if IBLI were to cover covariate shocks perfectly over a given index area, women’s experience may
be more or less like the average of the index area. If gender is correlated with something that makes
women different from the average, such as social connectedness, this could drive levels of idiosyncratic
losses.
Additionally, access to informal groups and networks is not exogenously determined and thus the
most vulnerable might be excluded from some informal insurance arrangements due to their inability to
keep up with reciprocity arrangements or pay entry costs (Santos and Barrett, 2011; Cohen and Sebstad,
2005; Bhattamishra and Barrett, 2010). A gender effect operating through variation in wealth or social
networks may emerge in econometric analysis if adequate measures of these attributes are not included.
IBLI product education
Marketing and education of a sophisticated insurance product in remote communities with high
illiteracy and limited prior exposure is as difficult as it is important. When information channels are male-
dominated and women are difficult to reach, gender sensitivity in marketing and education matters for
5
uptake by women (Banthia et al., 2009). Anecdotal evidence suggests that women do not have access to
the information they want about IBLI, but it is not clear whether this is a gender-specific phenomenon.
Women’s community involvement and market participation is clearly on the rise in Borana (Hertkorn,
2013; McPeak et al., 2011), suggesting that the extent to which women are able to access information
channels may also be in flux. The successful education of women about IBLI hinges upon effective
strategies for accessing women. We would expect that education through female-accessible channels
would have a stronger positive association with IBLI uptake by women relative to men.
Female assets and bargaining power
Asset holdings have implications for avoiding chronic poverty and, worldwide, women tend to
command fewer assets than men (Deere and Doss, 2006). Livestock is the primary asset in pastoralist
Ethiopia, but intra-household ownership arrangements are complex. Previous work investigating gender
and livestock ownership focuses almost exclusively on household-level livestock ownership in relation to
the gender of the household head rather than intra-household ownership arrangements.
In pastoralist Ethiopia, ownership is not clearly articulated, however women hold special rights
over animals that are lactating, because milk production and caring for young animals falls squarely into
the female domain in these societies (Coppock, 1994; McPeak et al., 2011). Lactating animals thus
generate a large portion of the female income stream and lactation rates themselves are sensitive to
drought. Given these factors, one would expect women to have greater incentive to insure when there are
many lactating animals in the household herd. At the same time, a woman’s control over lactating animals
and associated income might increase her capacity to self-insure and lower her WTP for IBLI. Therefore,
the relationship between such assets and IBLI uptake remains ambiguous.
Asset ownership can also increase a woman’s intra-household bargaining power, which is
important in non-unitary households whose members do not share identical preferences (see Chiappori
and Donni, 2009 and Alderman et al., 1995 for discussions of the unitary model). McPeak and Doss
(2006) demonstrate contested decision-making processes in milk marketing decisions in northern Kenya,
6

supporting the conclusion that preferences are likely different among household members. In the context
of non-identical preferences, one of the factors that shapes an individual’s bargaining position within a
household is her defection point, or what she can expect to walk away with if bargaining fails and the
household dissolves. The control a woman exerts over household assets such as livestock influences her
defection point. Women’s incentive to insure could be positively correlated with the size of her
endowment, which would in turn be positively correlated with bargaining power, suggesting potential for
a positive relationship between female assets and female IBLI purchase. Bargaining factors lead us to
expect that female assets have a stronger positive effect on IBLI uptake by women than by men, but
considering the ambiguity of the relationship between wealth and IBLI uptake mentioned above, the
overall effect is ambiguous.
In light of the four elements of gender and microinsurance demand discussed above—risk
aversion, informal insurance, product education and female assets—the remainder of this analysis
considers demand for IBLI for an individual i at time t, as
Y ¿=f (Gi , Ri , I ¿ , K ¿ , A ¿ , P¿ , V ¿−1 , X¿)+ε¿
where Gi represents gender, Ri represents an individual’s time-invariant risk aversion, I ¿ represents
informal insurance coverage, K ¿ represents product education and A¿ represents female assets.
Additionally, P¿, V ¿−1, and X ¿ represent, respectively, price, current IBLI coverage and a host of
demographic and insurance-related controls. Finally, ε ¿ represents a disturbance term. Before formally
specifying the model and hypotheses, we turn to discussion of the setting, data and key variables.
7

SETTING AND DATA
The International Livestock Research Institute (ILRI), Cornell University, and the Oromia
Insurance Company (OIC), in collaboration with local government agents, and collaborating researchers,
introduced the IBLI product in the southernmost part, Borana Zone, of the Oromia Regional State of
Ethiopia in August 2012, following the successful piloting of a similar product Kenya from January 2010.
OIC sells IBLI policies twice a year, in August/September and January/February, which correspond to the
ends of the dry seasons of the region’s bimodal rainfall pattern. The product is commercially marketed
throughout Borana Zone. Contracts cover a one-year period, with payouts at the typical end of either dry
season. Individuals choose the number of animals they insure. IBLI is priced by geographic region and
species, according to drought risk. Insurance premiums range from 7.5-11 per cent of the estimated value
of the animal.
This analysis takes advantage of three sources of data. As part of the design and launch of the
IBLI product, the team implemented an impact evaluation research design involving collection of annual
household survey data and several experimental features, all of which were designed specifically to
encourage IBLI uptake and facilitate analysis of demand and impacts within the survey sample
population. We validate key aspects of the survey data using OIC administrative sales records. Informed
by initial exploration of two rounds of survey data, we implemented a complementary qualitative data
collection tool in April 2014 with the express purpose of addressing gaps in the survey data and
enhancing understanding of key concepts relating to IBLI uptake and gender.
Survey and Administrative Data
The survey sample was selected prior to public announcement and commercial implementation of
IBLI, based on a random household sample stratified so as to capture geographic, agro-ecological and
livelihood variation in the eight southernmost woredas of the Oromia Regional State – the Borana Zone –
where IBLI would be offered. The survey was conducted annually in March, 2012-2014, among 515
households. Though data are collected annually, the monthly and seasonal recall structure of many survey
8

modules allows for analysis using two periods within each year that correspond to the twice-yearly IBLI
sales period and bimodal rainfall pattern, as depicted in Figure 1.2 After accounting for attrition and
missing data, 456 out of 515 households are retained for analysis.3 We supplemented these data designed
to evaluate the uptake and impact of IBLI generally with data collected specifically to explore the gender
questions at the heart of this paper.
To encourage uptake and inform about the effects of liquidity constraints on insurance purchase,
discount coupons were randomly distributed to 80 per cent of sample households. Discounts ranged from
10-80 per cent for purchase of up to 15 tropical livestock units (TLU) of livestock.4 The remaining 20 per
cent of households received no coupon.5 Due to imperfect recall, we use assignment data that was cross-
validated against OIC records. Specifically for the purposes of this study, the 2014 survey data collection
validated previously collected marital status information for female-headed households and collected
information on the endowment of livestock brought to the household by brides and grooms at marriage, as
well as information on current stocks and recent flows of such animals.
During the period we study, range conditions remained reasonably good and IBLI never paid out.
Subjective well-being data nonetheless indicate that IBLI purchase caused a statistically significant
improvement in policyholders’ welfare (Tafere et al. 2015). IBLI did yield indemnity payments in
October 2014 and again in October 2015 as range conditions deteriorated significantly.
Qualitative Data
Following Patton (2002) the qualitative sample is stratified along the key dimensions of IBLI
purchase history, gender of household head and female household heads marital status, creating eight
unique categories from which we intended to sample two households at specific points along the
distribution of wealth.6 Based on this sample, qualitative interview data were collected from 15 survey
households in April 2014. The interview guide was designed after preliminary analysis of the first two
rounds of survey data in order to complement survey data in testing the four conceptual hypotheses
outlined above.
9

In particular, the qualitative interviews explored the nature and extent of informal insurance
coverage in Borana and perceptions of differences in coverage between men, women and people of
different marital statuses. Interviews also elicited preferences surrounding sources of information about
IBLI. Ultimately, the qualitative data validated survey data to improve the identification and
understanding of measurement error in key variables, thus informing variable construction, econometric
model specification and interpretation of econometric results. The most salient qualitative findings are
reported throughout the following discussion of variable construction and, later, in the interpretation and
discussion of econometric findings.
KEY VARIABLES
IBLI purchase and TLU insured
We found significant error in reported IBLI purchase when implementing qualitative interviews.
When compared against administrative data, only 87% of respondents correctly identified their recent
purchase behavior. Eighty per cent of misreported purchases were false positives while only 20 per cent
were false negatives. The majority of false positives were households that had purchased IBLI at least
once in previous years, but appeared to misunderstand the reference period of the survey question, while
others were households that failed to make the distinction between purchasing the IBLI product and being
part of the survey sample. A majority of households (73%) in our qualitative sample conflated the ILRI
survey or visits by OIC and ILRI staff with the IBLI product at least once in the interview when asked
about insuraansii horrii, suggesting that people understand the term in a variety of ways. Given the non-
random nature of the measurement error in reported IBLI purchase, and its centrality to this analysis, for
the main analysis we use OIC administrative IBLI purchase data as the dependent variable, rather than
reported IBLI purchase.7
Gender of IBLI purchaser
10

The gender of the household head is highly correlated with the gender of the person named on the
insurance contract (bivariate correlation coefficient of 0.94). Furthermore, in the limited cases where the
head was not the purchaser, one might assume that the household head influences the purchase decision in
some way and, indeed, this dominates in the qualitative data on decision making. Being the household
head was cited as the reason the respondent had the most influence over a livestock or budget allocation
decision in 67% of households.
Risk aversion
The baseline household survey included a risk preference experiment in which the respondent
chooses from a set of six gambles where risk and expected outcome are positively correlated (ILRI,
2014). Using these data, we create a set of binary variables by combining the two lowest, middle and
highest levels of risk aversion.
Informal insurance coverage
As an indicator of informal insurance coverage, prior studies use informal cash and in-kind
transfers between households and network group participation as measures of informal insurance
coverage (Lybbert, 2004; Jensen et al., 2014), which motivated qualitative data collection tailored to
explore the extent to which groups and transfers serve an informal insurance function in the Borana
context. It appears that network groups and transfers capture participation in institutions that may function
as informal insurance, but not all groups and not all transfers are insurance.
The network groups captured in the ILRI survey provide extremely limited idiosyncratic
insurance coverage and are not a meaningful measure of informal insurance. While all but one group
allowed members to take out loans when facing a shock, the five respondents stated that such groups
helped them minimally or not at all, while six were unwilling to say the group had no benefits but at the
same time were unable to articulate benefits they experienced.8
11

With respect to transfers, qualitative respondents all stated that the decision to give a transfer was
determined by the normative belief that one is obligated to help those who are most in need, regardless of
transfer history. The second consideration is the giver’s recollection or expectation of reciprocity by the
receiver, which was stated directly by 60 per cent of qualitative respondents. Qualitative validation of 58
specific transfers recorded in the survey data suggested that nearly half of transfers may be insurance-
related in that they provide one of several overlapping types of coverage described by McPeak (2006) in
the form of ex ante investment in future incoming transfers from recipients (50%), ex ante preparation for
the receiver in anticipation of a planned expense such as a birth or marriage (34%) and/or ex post coping
for the receiver after an idiosyncratic shock (42%). In light of qualitative findings, informal insurance is
represented using the total of the absolute values of monthly cash and in-kind transfers received and given
by the household in order to capture not only the insurance a household experiences in the form of a
transfer receipt, but also the insurance a household experiences when they engage in ex ante insurance
behaviors by giving to others with the expectation of reciprocity.
Product education
The survey captures the IBLI education experience of the household based on 14 specific
questions about sources of information through which the household learned about IBLI. Qualitative
interviews highlight the issue of whether people consider the difference between the IBLI product and
participation in the IBLI survey sample. When asked about learning about insuraansi horrii, nearly half
(46%) of respondents focused initially on ‘learning’ that they should stay home and wait for the IBLI
survey enumerator or similar administrative. During the interviews, we took care to clarify the focus of
our interest, but it is unlikely that enumerators did so during survey data collection. While all respondents
—male and female—indicated that they prefer to be taught about the IBLI product in their homes for such
reasons as convenience, reducing distractions and increased opportunity to ask questions, one might
expect that this is more important for women whose domestic responsibilities, such as caring for children,
cooking and looking after lactating and newborn animals, limit their mobility. Additionally, only two
12

women attended community meetings where IBLI was discussed, and both opted to listen and let others
ask questions.
The survey data do not capture the intensity of information or the type of information received
through these sources, so simply using the number of information sources fails to disentangle IBLI
product-focused information itself from information about the implementation of the survey or the
presence of OIC sales agents in the community. Alternately, one could use survey data on the ‘most
important source’ of IBLI information, however qualitative data completely contradicted patterns in the
survey data.9 Another approach is to use only information sources that are explicitly product-focused such
as radio, posters and OIC extension agents, but this fails to account for the unanimous sense among
women that learning is more difficult in away-from-home settings. A woman may learn less from a
product-focused information session at a community meeting and more from an incidental conversation
about IBLI with a health worker performing a home visit. Coincidentally, home-centered and product
focused information channels are nearly mutually exclusive (Table 1). Thus, in the variable construction
decision there is a tradeoff between different types of measurement error associated with product-focused
channels versus home-centered channels. Home-centered channels may be biased upward from
information ‘learned’ related to implementation that is reported as IBLI product information, while
product-focused channels may present information focused on the IBLI product directly, but without
capturing the level of learning that took place. Given the importance of home-centered information to
women, we structure the variable as the proportion of total information sources that are home-centered.10
Female assets
A good proxy for intra-household bargaining power will be correlated with a woman’s bargaining
power, but not endogenous to her decision to purchase IBLI. Commonly used proxies for bargaining
power include women’s inherited assets, women’s current assets, women’s income shares, unearned
income and assets, and human capital brought to marriage (Quisumbing and Maluccio, 2003; Hoddinott
13

and Haddad, 1995; Schultz, 1990; Thomas, 1990). We propose two different context-appropriate
measures of female-controlled assets as proxies for bargaining power.
In the process of marriage in Boran culture, the bride and groom bring livestock gifted from their
family members to the newly-formed household herd. Cattle from the bride’s father are known as horrii
siiqqee (HS). Qualitative work suggests that while everyone considers all animals to belong to the
household, HS cattle and their descendants are identifiable by all as part of the wife’s endowment and that
there may be subtle restrictions on what can be done with these animals (for example, selling,
slaughtering, gifting) without the wife’s consent. Importantly, the wife retains these cattle in the rare, but
possible, event of a divorce. Quisumbing and Maluccio (2003) suggest that virtually all proxies for
bargaining are vulnerable to endogeneity, but that a strength of using assets brought to marriage is that,
unlike current asset holdings, it is unaffected by endogenous decision-making processes within the
marriage. HS animals are expressed as a percentage of original herd at marriage. In addition, milking and
milk products represent the female contribution to the economy of the household (Coppock, 1994;
Hertkorn, 2013) and therefore we use the proportion of lactating animals in the household herd as an
alternate proxy for bargaining power.
RESULTS
Summary Statistics
As summarized in Table 2, panel households are 21 per cent female-headed, a majority of whom
are widows. In terms of female headship, the sample is consistent with other estimates of the prevalence
of female headship in Ethiopia which range from 9 per cent of married households countrywide
(Fafchamps and Quisumbing, 2002) to 29 per cent of households in southern Ethiopia specifically
(McPeak et al., 2011). Ethnically, households were overwhelmingly Boran and practiced traditional forms
of religion. More than three quarters of households are fully settled and few households remain nomadic.
Table 3 shows the overall means for the full sample as well as means for male and female-headed
households and differences. Detailed information on the construction of all variables is located in
14
Appendix A. Households in the sample have, on average, 19 TLU of livestock. Total income is, on
average, equivalent to $190 USD per household per month, only about $18 of which is cash earnings.
Given the average household size of 7.3 individuals, this implies an average income of roughly $0.86 per
day, 90 per cent of which is in-kind, highlighting widespread poverty and the subsistence economy in the
region. Male-headed households (MHHs) have per-person income of $0.89 per day while female-headed
households have a per-person income of $0.68. Other statistically significant differences between male
and female-headed households suggest potential for gender-differentiated IBLI demand. Female-headed
households (FHHs) have, on average, smaller herds, lower total income, and lower participation in
transfers and network groups. FHHs’ reliance on livestock income is 14 percentage points lower than
men. Between male- and female-headed households there is no difference in highest educational
attainment of any household member, but female households heads have significantly lower personal
educational attainment than male household heads and also scored lower on a financial literacy test
conducted at baseline. There are no differences in risk aversion or expectations of upcoming rangeland
conditions. Female household heads are, on average, older than male household heads, probably due to
widows and longer female life expectancy. Members of FHHs also participate in fewer network groups.
With respect to IBLI, FHHs have fewer sources of IBLI information, yet this is not reflected in a lower
score on a series of questions designed to test an individual’s knowledge of IBLI. The rate of IBLI
purchase does not differ by gender of household head. FHHs that insure animals, insure fewer animals,
though the percentage of herd insured is not significantly different between household types.
These means tests demonstrate multiple pathways in which demand could shift for women. To
the extent that income and wealth impact demand, one might expect lower demand for IBLI in female-
headed households due to smaller herd sizes and lower incomes, or, conversely, if income increases the
capacity to self-insure, one might see higher demand among lower-income groups such as women.
Gender differences in the proportion of income from livestock could also shift demand in either direction,
depending on whether reliance on livestock income provides an incentive to insure or, given that it is
largely in-kind, constrains liquidity with which to purchase insurance. Gender differences in education
15

and financial literacy have the potential to impact demand for any financial product, yet this would likely
operate through their understanding of the product which appears to be similar in this case. If there is an
age dimension to the adoption of new financial products, female-headed households, being older on
average, may exhibit differential demand. These possibilities will be further explored through regression
analysis.
Econometric Strategy and Challenges
The econometric approach to estimating gender-differentiated demand for IBLI involves
estimating determinants of an individual’s propensity to insure as well as the level of coverage purchased
by that individual. The binary purchase decision can be expressed as:
Pr (Purchase¿¿¿=1)=Φ ¿¿
+δ1 R i+δ2 I ¿+δ3 K ¿+δ4 A ¿+η V ¿−1+φ P¿+νZ¿+ζ X¿+μi+ε¿¿(1)
in which the purchase decision, Purchase¿ , by individual i in period t is regressed on gender, Gi, where
Gi=1 represents a female-headed household, as well as interactions of Gi with the variables of interest
described in detail. Ri is a vector of dummy variables representing three levels of risk aversion, I ¿
represents informal insurance coverage in the form of cash and in-kind transfers, while K ¿ represents
home-centered sources of information about IBLI and A¿ represents female assets. We include the first-
order interacted variables and controls for price (P¿¿, current coverage (V ¿−1 ¿, and household
characteristics (X ¿¿ .We also include Zi t, binary indicator of receipt of the randomly assigned discount
coupon, independent of the discount received, which is incorporated into the regression as part of P¿. The
composite error term consists, of μi, the unobserved individual effect, and ε ¿, the idiosyncratic error with
zero mean, finite variance σ ε2 and distributed i.i.d over all observations. Probit regression of equation (1)
16

allows us to estimate the average marginal effects (AME) of the variables of interest on the probability of
IBLI purchase, allowing for the possibility that they might vary by gender.
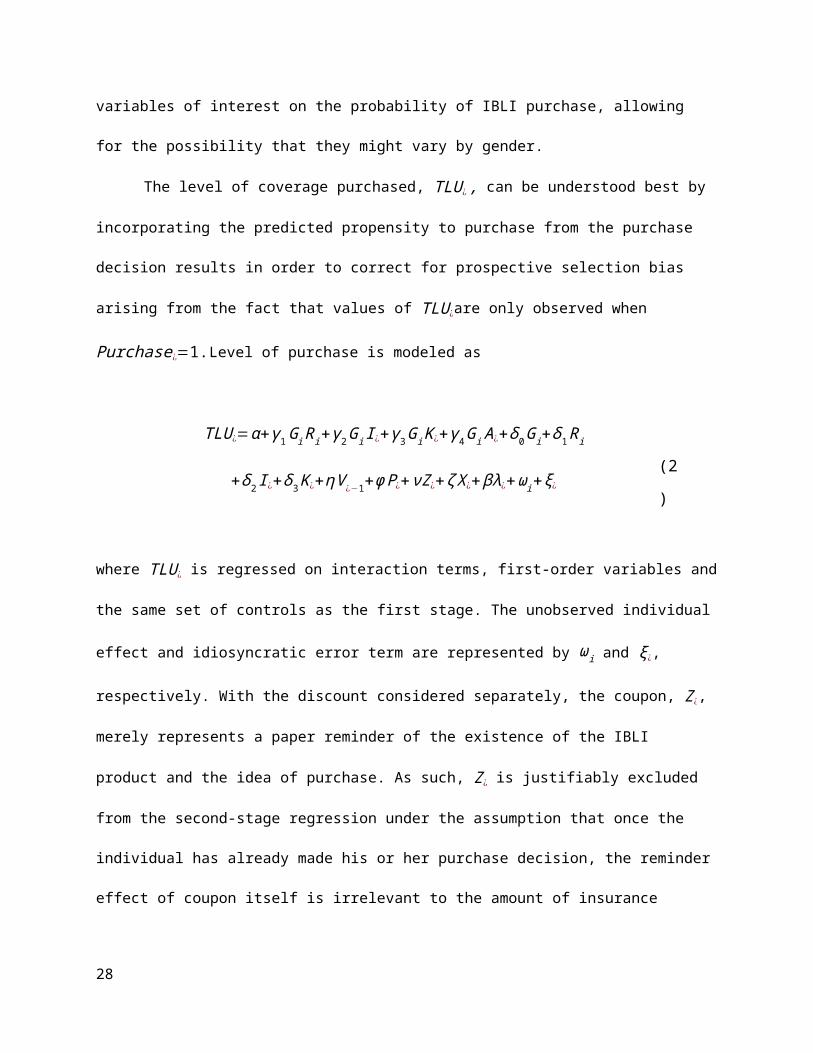
The level of coverage purchased, TLU ¿ , can be understood best by incorporating the predicted
propensity to purchase from the purchase decision results in order to correct for prospective selection bias
arising from the fact that values of TLU ¿are only observed when Purchase¿=1.Level of purchase is
modeled as
TLU ¿=α+γ 1Gi R i+γ2 Gi I ¿+γ3 Gi K¿+γ 4 Gi A ¿+δ 0Gi+δ1 R i
+δ2 I ¿+δ3 K ¿+η V ¿−1+φ P¿+νZ¿+ζ X¿+ βλ¿+ωi+ξ¿(2)
where TLU ¿ is regressed on interaction terms, first-order variables and the same set of controls as the first
stage. The unobserved individual effect and idiosyncratic error term are represented by ωi and ξ¿,
respectively. With the discount considered separately, the coupon, Z¿, merely represents a paper reminder
of the existence of the IBLI product and the idea of purchase. As such, Z¿ is justifiably excluded from the
second-stage regression under the assumption that once the individual has already made his or her
purchase decision, the reminder effect of coupon itself is irrelevant to the amount of insurance coverage
purchased. Following Heckman’s (1979) approach to correcting selection bias, we incorporate the inverse
Mills ratio.
λ¿=ϕ ( p̂urchase¿)Φ( p̂urchase¿)
(3)
When λ¿ is calculated as a function of the same set of covariates in the first stage regression as is used in
the second stage, selection is theoretically accounted for, but in practice the process is strengthened by the
17
inclusion Z¿, the exogenous instrument in the first stage that predicts selection that has no relevance to the
second stage dependent variable.
Recall that in both equations, the composite error term consists of the unobserved individual fixed
effect and the idiosyncratic error. The unobserved individual fixed effect is likely to induce bias if a
pooled estimator is used. A fixed-effects estimator is tempting, but the probit regression is then subject to
the incidental parameters problem in estimations where the number of observations is large relative to the
number of time periods, as is the case here. Furthermore, we are most interested in time-invariant
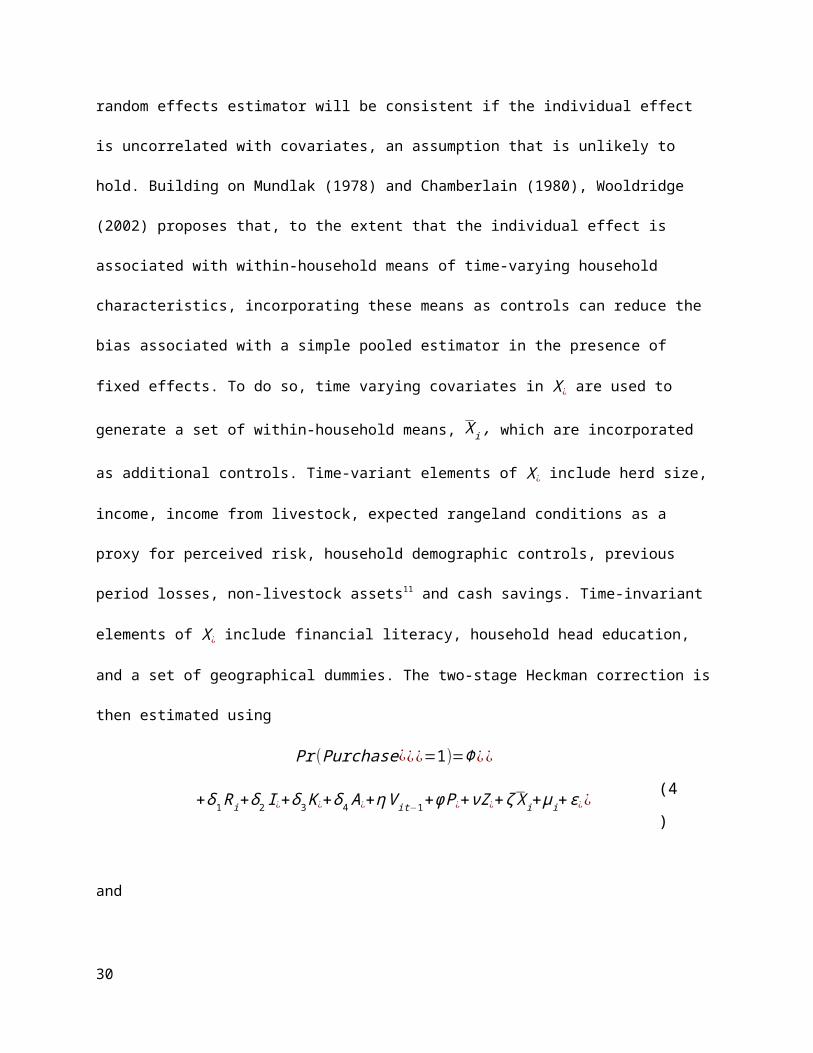
household characteristics, which would wash out in a fixed-effects estimator. A random effects estimator
will be consistent if the individual effect is uncorrelated with covariates, an assumption that is unlikely to
hold. Building on Mundlak (1978) and Chamberlain (1980), Wooldridge (2002) proposes that, to the
extent that the individual effect is associated with within-household means of time-varying household
characteristics, incorporating these means as controls can reduce the bias associated with a simple pooled
estimator in the presence of fixed effects. To do so, time varying covariates in X ¿ are used to generate a
set of within-household means, X i , which are incorporated as additional controls. Time-variant elements
of X ¿ include herd size, income, income from livestock, expected rangeland conditions as a proxy for
perceived risk, household demographic controls, previous period losses, non-livestock assets11 and cash
savings. Time-invariant elements of X ¿ include financial literacy, household head education, and a set of
geographical dummies. The two-stage Heckman correction is then estimated using
Pr (Purchase¿¿¿=1)=Φ ¿¿
+δ1 R i+δ2 I ¿+δ3 K ¿+δ4 A¿+η V i t−1+φ P¿+νZ¿+ζ X i+μ i+ε¿¿(4)
and
18

TLU ¿=α+γ 1Gi R i+γ2 Gi I ¿+γ3 Gi K¿+γ 4 Gi A ¿+δ 0Gi+δ1 R i
+δ2 I ¿+δ3 K¿+η V ¿−1+φ P ¿+ζ 0 X ¿+ζ 1 X i+βλ¿+ωi+ξ ¿(5)
to formally test the following four hypotheses:
1. The effect of risk aversion (Ri ¿ on IBLI uptake is invariant with respect to gender (Gi ¿.
H0: γ1=0
2. The effect of informal insurance (I ¿¿ on IBLI uptake is invariant with respect to gender (Gi ¿.
H0: γ2=0
3. The effect of product education (K ¿¿ on IBLI uptake is invariant with respect to gender (Gi ).
H0: γ3=0
4. The effect of female assets ( A¿¿¿)¿ on IBLI uptake is invariant with respect to gender (Gi ).
H0: γ4=0
Econometric Challenges
Simultaneity between an individual’s knowledge or understanding of the IBLI product and their
decision to purchase may leave the knowledge variable correlated with the idiosyncratic error term over
time. The most logical potential instruments for the knowledge variable are two randomly assigned
educational treatments implemented in the initial rollout of IBLI in Ethiopia. Preliminary analysis found
these two variables to be only weakly correlated with households’ understanding of the IBLI product over
the time period in question for this study.12 To the extent that households adjust informal insurance
behaviours based on whether they have purchased IBLI or not, or their level of coverage, the informal
insurance variable will also be correlated with the error term. The lagged dependent variable,V ¿−1,
representing previous period IBLI purchase, or, put otherwise, whether an individual is covered in the
current period, is likely correlated with household unobservable characteristics that impact the current
19
purchase decision. Given the lack of suitable instruments to address these endogenous variables, results
should be interpreted as associations between the variables but without any clear causal link. Other
potentially endogenous variables include herd size and income, because income is primarily composed of
herd-related income. The extent to which these related variables are endogenous depends on the ways in
which households adjust their herding practices in response to being insured and differences in effects of
drought on herd size between those who purchased IBLI and those who did not. As of data collection in
March 2014, no Ethiopian households had received an IBLI indemnity payout. One might expect the
credibility of the product and subsequent likelihood of detectable behavioural and herd size effects to
develop substantially after a payout, but not before.13
Econometric Results
Purchase decision
Marginal effects from the first-stage probit regression of the IBLI purchase decision are presented
in Table 4. We begin with a brief discussion of overall demand patterns that appear consistently across all
models.14 We then turn to the gender-specific results associated with the above hypotheses. The
relationship between IBLI uptake and price is statistically significant, but modest, with a decrease in
probability of purchase of 0.1 per cent for every 1 per cent increase in price. Where included in the
model, previous period purchase reduces the probability of purchase by 8.6 per cent, which is sensible,
given that the purchaser is covered in the current period by the 12-month contract purchased in the
previous period. Coupon assignment increases the probability of purchase by 4.4 per cent, consistent with
the assumptions that underpin its use as an instrument in the selection equation. Expectation of lower-
than-normal rangeland conditions in the coming months is associated with a 3.5 per cent increase in the
probability of IBLI purchase and high livestock mortality in the previous period is associated with a 3.5
per cent decrease in the probability of purchase. In a society where livestock sales are a main source of
liquidity, the latter points to liquidity constraints on IBLI demand.
20

Moving now to gender-specific results, column (1) represents a restricted regression that excludes
all characteristics that vary visibly by gender in Table 4, as well as any characteristics that have the
potential to vary systematically by gender. The average marginal effect (AME) of female-headed
household in this restricted regression is not statistically significantly different from zero. This
specification implicitly assumes that characteristics such as financial literacy, education or others that are
excluded from this regression have no effect on the probability of IBLI purchase, so if there is any
correlation between such variables and gender and the exclusionary assumption is false, the coefficient
estimate on the gender variable would be biased. What this regression tells us is that when we include all
of the various gender-related factors, whether mediated by other (currently omitted) characteristics or not,
there is no variation in IBLI demand by gender. This is consistent with the proportionality of IBLI
purchase by female-headed households to the number of female-headed households in the population.
Even if women’s overall demand for IBLI is neither higher nor lower than men’s, it is still
possible that women’s demand is driven at least partially by a different set of factors. Therefore, model
(2) incorporates characteristics that we might expect to vary by gender and to influence IBLI uptake,
either by shifting slopes or intercepts for women. Similarly, the percentage of income from livestock
(scaled from 0-100) indicates that for every point increase in the share of income from livestock, the
probability of purchasing IBLI decreases by a modest 0.1 per cent. The more livestock income one has,
the less likely one is to purchase IBLI. This contradicts the idea that those who are more dependent on
livestock income are more vulnerable to drought and would have higher demand for IBLI. This may
reflect the superior self-insurance capacity of those with the largest herds; they do not need insurance the
way those with small or moderate herd sizes do. The statistical differences in mean shares of livestock
income by gender (Table 3) could translate to a systematically lower likelihood of IBLI purchase by
women driven by these initial differences, something we will explore briefly in the next section.
In model (2), we see no significant coefficient estimates on the interaction terms relating to
product education, informal insurance and risk aversion and therefore fail to reject the null hypotheses
that the average marginal effects are equal for men and women along these dimensions. However, the
21

significant coefficient estimate on female-headed household suggests that there may be more to the story
than is captured by our model. Simply being a female-headed household is associated with a 31.7 per cent
increase in the probability of IBLI purchase, conditional on all observable factors that may differentially
affect demand. An optimistic explanation is that women’s sensitivity to risk, informal insurance and
product education experiences are not fully captured by the variables included in the model, leaving
women’s perception of IBLI’s risk reduction potential captured in the coefficient on female-headed
household. A less optimistic, but perhaps more likely explanation is that, in a context where IBLI sales
agents are paid on commission and all sales agents are men, women are more easily pressured to
purchase.
Models (3) and (4) use a sub-sample of two decision maker households to test for a bargaining
effect associated with female assets in the form of HS animals at marriage and current lactating herd
proportion. We fail to reject the null that the average marginal effects of female asset holdings on IBLI
uptake are equal for men and women. A modest, but statistically significant gender difference in the
marginal effects of total cash and in-kind transfers on the probability of IBLI uptake of 0.4% is identified,
suggesting that the relationship between informal insurance and IBLI may indeed differ between men and
women. Either women are covered differently than men in ways that are not captured by the transfers
variable, or women respond differently to informal insurance coverage than men do. The effect of
transfers on men’s demand for IBLI is very modestly negative and not statistically significantly different
from zero. For women, informal transfers appear to reduce demand for IBLI in a way that they do not for
men.
Level of purchase results
Table 5 presents the effects of a range of factors on the level of IBLI coverage purchased,
conditional on the inverse Mills ratio to control for prospective selection effects. Independent of gender,
several general demand findings are worth mentioning. IBLI demand is price inelastic, with estimated
elasticities in the range of -0.33 to -0.46, consistent with IBLI price elasticities in neighbouring Marsabit,
22

Kenya (Jensen et al., 2014). Age of household head is negatively associated with the level of purchase.
There appears to be no gender variation in IBLI demand as indicated by the lack of significant coefficient
on female-headed household in model (1).
As with the purchase decision estimation, model (2) incorporates all variables that potentially
shift slopes or intercepts by gender. Here we do not see a significant marginal effect on female-headed
household, suggesting that any effect related to sales agent pressure might be restricted to the decision to
purchase and other factors drive the chosen level of coverage. These results are consistent with Takahashi
et al. (2016) whose gender control variables suggest that being female increases the likelihood of
purchase, but not the level of coverage purchased. Interestingly, the relationship between the education
level of the household head and the level of IBLI purchase is negative, suggesting that each additional
year of education is associated with a 5.1 per cent decrease in the TLU insured. If education and social
status are correlated, this is consistent with the idea that lower status may result in vulnerability to
pressure by educated, commission-motivated sales agents. This may reflect the gap between sales agents’
education and household heads, both male and female, in Borana. However, it is not clear why this effect
would exist only for the level of purchase estimations.
When gender is interacted with variables of interest in models (2) and (3), we fail to reject the
hypotheses that there are no gender differences in the relationships between IBLI demand and cash and
in-kind transfers. Female asset holdings in the form of HS animals appear to have no gender-
differentiated effect in model (3), unlike current lactating herd proportion in model (4) ,which suggests
that women in two-decision-maker households with more lactating animals have less incentive to insure,
perhaps due to the increased ability to self-insure, combined with a better bargaining position. We do,
however, reject the null that the average marginal effect of high risk aversion differs between men and
women. The effect of high risk aversion on males, represented by the coefficient on high risk aversion
alone, is positive but not statistically significantly different from zero. High risk aversion increases
women’s purchase of IBLI by 36 per cent compared to an equally risk averse man, consistent with
insurance demand theory. This effect disappears when we control for female assets brought into the
23
marriage in model (3). Gender and moderate risk aversion appear to have a similar, but opposite effect in
model (4), but again only weakly and in one specification. Lastly, in model (3) we fail to reject the null
that the effect of home-cantered information sources varies by gender.
Discussion
Neither the IBLI purchase decision nor the level of IBLI coverage chosen demonstrate gender-
differentiated demand when tested using the restricted regressions discussed above. Yet further analysis
suggests that there are pathways for gender-differentiated drivers of demand for IBLI, even if they do not
amount to differences in demand outcomes. We first discuss gender differences in average marginal
effects, and then discuss how differences in initial conditions may shape demand for women in relation to
men.
Risk aversion appears to have an appreciably different effect on IBLI demand for women than for
men, but the direction of the effect is ambiguous in the measures we use. Future work should incorporate
risk aversion measures that are appropriate to the context and decision-making domain. Better
understanding of gender and the perceived risks associated with IBLI specifically is also essential.
Qualitative respondents, who were mostly women, appeared to accept IBLI’s risk-reducing claims at face
value, while simultaneously maintaining a wait-and-see attitude toward initial or further purchase.
Perceptions of IBLI as helpful were overwhelmingly positive (86%), despite no one having received an
insurance payout. Some degree of response bias is likely, given that IBLI staff were involved in
qualitative data collection. As individuals learn about IBLI from experience such as witnessing payouts or
lack of payouts to themselves or their neighbours, understanding of the risks and benefits of the product
will further develop, laying groundwork for post-payout demand analysis.
For women, informal insurance has a negative effect on the IBLI purchase decision that is
modestly different from the effect for men with equal informal insurance coverage, as we have measured
it. The nature and extent of coverage by informal risk management underpins the perceived benefits of
IBLI relative to other risk management approaches and using total transfers may not adequately capture
24

gender differences informal insurance coverage. Qualitative respondents stated unanimously that access
to basic levels of informal risk management is driven by need rather than social connectedness or wealth.
If need is defined by the household’s material and labour resources, then it is captured in our model
through herd size, income, assets and dependency ratio controls. However, respondents described the
extent of informal coverage as a function of an individual’s pro-social behaviours, encompassing all
manners of helping others to the best of one’s ability given one’s material and labour resources. Data
collection designed specifically for such purposes will contribute to future understanding of any the
relationship between formal and informal risk management as well as gender-differentiated effects.
I also find contradicting evidence of an intra-household bargaining effect associated with female
assets — lactating animals and horrii siiqqee — despite the latter’s local relevance. Though we cannot
know for sure, the significance of lactating animals for women may be less indicative of bargaining than
of capacity to self-insure. If bargaining is not taking place around IBLI, this implies that gender-based
targeting in two-adult households is not relevant to increasing women’s demand for IBLI in this context.
However, given a significant body of evidence that contradicts the presence of identical preferences
among household members, these findings point to a need for further exploration of intra-household
decision making in Borana.15
Even where AMEs do not differ, gender differences in averages of key characteristics (Table 3)
may also play a role in gender-differentiated IBLI demand patterns. Proportion of income from livestock
and age are, on average, lower and higher, respectively for women relative to men. Multiplying the
statistically significant AMEs from Tables 4 and 5, we see that average differences in proportion of
income from livestock translate to a 2.8 per cent increased likelihood of IBLI purchase by women, while
age differences account for a modest 0.5 per cent decrease in the same.
CONCLUSION
This paper provides an initial perspective on dimensions of demand for index based livestock
insurance that might vary by gender, using a carefully conceptualized combination of data from a
25

household survey, administrative records and structured qualitative interviews. Female-headed
households purchase IBLI at the same rate as men, relative to their share of the population, yet the factors
that drive women’s demand appear to diverge slightly from men’s. Econometrically, we reject the null
hypothesis that the AMEs of risk aversion and informal insurance are equal to zero for the level of
purchase and purchase decision models, respectively. The estimated average marginal effects of high risk
aversion and informal insurance coverage have, respectively, positive and negative associations with IBLI
demand by women. We fail to reject the null that home-based product education has no gender-
differentiated effect, and find that women are more responsive to home-based product education than
men. We fail to reject the null that female HS assets have no gender-differentiated effects, a finding that
contradicts much empirical evidence on intrahousehold bargaining. At the same time, we reject the null
that female assets in the form of lactating animals have a gender-differentiated effect, which we interpret
as a result of women’s increased capacity to self-insure. We find that women’s demand differs from
men’s due to differences in household head age and income shares from livestock. The largest gender-
differentiated demand effects likely relate to women’s lower social status, which is positively associated
with the decision to purchase IBLI, possibly through women’s vulnerability to pressure by sales agents.
In addition to aiding in econometric specification and interpretation, qualitative data suggest that
variables used to understand information sources and informal insurance may not capture these concepts
precisely. Specifically, differences in informal insurance coverage and access may be driven by omitted
variables reflecting pro-social behaviours and confusion in terminology surrounding the IBLI product
generate considerable noise in variables relating to the marketing experience of the household, such as
IBLI information sources. A case is made for further investigation of the topic using data that captures
difficult-to-observe dynamics that may underpin locally defined behavioural aspects of informal
insurance access and gender differences in perceptions of IBLI’s risk reduction potential, as well as
ongoing reduction of measurement error in key variables such as IBLI information sources. Future
findings can be leveraged to develop tools and strategies for ensuring that access to and benefits from
innovative financial products are equitably distributed across the population.
26

Lastly, the negative effect of education on IBLI uptake, along with the strong and positive effect
of being female, merits a closer look at IBLI marketing and sales processes in order to understand
whether the methods and strategies used to encourage IBLI purchase induce a gender or other effect that
inflates IBLI purchase based on social pressure rather than the product’s potential to reduce risk and limit
the effects of catastrophic drought. Employing sales strategies that encourage information-based choice to
purchase IBLI will contribute to sustainable demand over the long term.
27
REFERENCES
Alderman, H., Chiappori, P.-A., Haddad, L., Hoddinott, J., & Kanbur, R. (1995). Unitary versus collective models of the household: is it time to shift the burden of proof? World Bank Research Observer, 10, 1–19. doi:10.1093/wbro/10.1.1
Banthia, A., Johnson, S., McCord, M. J., & Mathews, B. (2009). Microinsurance that works for women: making gender-sensitive microinsurance programs. ILO Microinsurance Innovation Facility.
Behrman, J. R. (1988). Intrahousehold Allocation of Nutrients in Rural India: Are Boys Favored? Do Parents Exhibit Inequality Aversion? Oxford Economic Papers, 40, 32–54.
Bhattamishra, R., & Barrett, C. B. (2010). Community-Based Risk Management Arrangements: A Review. World Development, 38(7), 923–932. doi:10.1016/j.worlddev.2009.12.017
Chamberlain, G. (1980). Analysis of Covariance with Qualitative Data. The Review of Economic Studies, 47, 225–238.
Chantarat, S., Mude, A. G., Barrett, C. B., & Carter, M. R. (2012). Designing Index-Based Livestock Insurance for Managing Asset Risk in Northern Kenya. Journal of Risk and Insurance, 80, 205–237. doi:10.1111/j.1539-6975.2012.01463.x
Chantarat, S., Mude, A., Barrett, C., & Turvey, C. (2009). The performance of index based livestock insurance: ex ante assessment in the presence of a poverty trap. Available at SSRN 1844751.
Chiappori, P. A., & Donni, O. (2009). Non-unitary models of household behavior: A survey of the literature (IZA Discussion Paper No. 4603). Institute for the Study of Labor (IZA)
Cohen, M., & Sebstad, J. (2005). Reducing vulnerability: the demand for microinsurance. Journal of International Development, 17, 397–474. doi:10.1002/jid.1193
Coppock, D. L. (1994). The Borana Plateau of Southern Ethiopia: Synthesis of pastoral research, development and change 1980-1991. Addis Ababa: ILCA (International Livestock Centre for Africa).
Deere, C. D., & Doss, C. R. (2006). The Gender Asset Gap: What do we know and why does it matter? Feminist Economics, 12(1), 1–50. doi:10.1080/13545700500508056
Dercon, S., & Hoddinott, J. (2005). Health, Shocks and Poverty Persistence. In S. Dercon (Ed.), Insurance Against Poverty (pp. 124–136). Oxford: Oxford University Press. doi:10.1080/00220380412331322581
Dercon, S., & Krishnan, P. (2000). In Sickness and in Health: Risk Sharing within Households in Rural Ethiopia. Journal of Political Economy, 108, 688–727. doi:10.1086/316098
Eckel, C. C., & Grossman, P. J. (2008). Men, Women and Risk Aversion: Experimental Evidence. In C.R. Plott & V.L. Smith (Eds.), Handbook of Experimental Economics Results (pp. 1061–1073). Elsevier. doi:10.1016/S1574-0722(07)00113-8
Fafchamps, M., & Quisumbing, A. R. (2002). Control and ownership of assets within rural Ethiopian households. Journal of Development Studies, 38, 47–82.
28

Gine, X., Townsend, R., & Vickery, J. (2008). Patterns of Rainfall Insurance Participation in Rural India. World Bank Economic Review, 22, 539–566. doi:10.1093/wber/lhn015
Hertkorn, M.-L. (2013). Borana Women in Livestock Management: The work of wives, girls, and widows, their perceptions and recent changes (Unpublished B.Sc. thesis). University of Kassel, Germany.
Hill, R. V., Hoddinott, J., & Kumar, N. (2011). Adoption of Weather Index Insurance: Learning from Willingness to Pay Among a Panel of Households in Rural Ethiopia (ESSP II Working Paper no. 27). Retrieved from International Food Policy Research E-brary: http://ebrary.ifpri.org/cdm/ref/collection/p15738coll2/id/124856 doi:10.2139/ssrn.1799565
Hoddinott, J. (2006). Shocks and their consequences across and within households in Rural Zimbabwe. Journal of Development Studies, 42, 301–321. doi:10.1080/00220380500405501
Hoddinott, J., & Haddad, L. (1995). Does female income share influence household expenditures? Evidence from Côte d'Ivoire. Oxford Bulletin of Economics and Statistics, 57, 77–96. doi:10.1111/j.1468-0084.1995.tb00028.x
Hoddinott, J., & Kinsey, B. (2003). Adult health in the time of drought. In Quisumbing, A (Ed.) Household decisions, gender, and development: a synthesis of recent research (pp.131-138). Washington D.C.: International Food Policy Research Institute (IFPRI)
Ikegami, M. & Sheahan, M. (2015). Index Based Livestock Insurance (IBLI) Borena Household Survey Codebook. Retrieved from International Livestock Research Institute Data Portal: http://data.ilri.org/.
Jensen, N. D., Mude, A. G., & Barrett, C. B. (2014). How basis risk and spatiotemporal adverse selection influence demand for index insurance: evidence from Northern Kenya. Working paper. Retrieved from: http://barrett.dyson.cornell.edu/files/papers/JensenMudeBarrettDemandDec2014.pdf
Lasage, R., Seifu, A., Hoogland, M., & de Vries, A. (2010). Report on General Characteristics of the Borana Zone, Ethiopia (pp. 1–36). Amsterdam: Institute for Environmental Studies.
Lybbert, T. J., Barrett, C. B., Desta, S., & Layne Coppock, D. (2004). Stochastic wealth dynamics and risk management among a poor population. Economic Journal, 114, 750–777. doi:10.1111/j.1468-0297.2004.00242.x
McPeak, J. (2006). Confronting the risk of asset loss: What role do livestock transfers in northern Kenya play? Journal of Development Economics, 81(2), 415–437. doi:10.1016/j.jdeveco.2005.06.010
McPeak, J. G., & Doss, C. (2006). Are household production decisions cooperative? Evidence on pastoral migration and milk sales from Northern Kenya. American Journal of Agricultural Economics, 88, 525–541. doi:10.1111/j.1467-8276.2006.00877.x
McPeak, J., Little, P. D., & Doss, C. R. (2011). Risk and Social Change in an African Rural Economy: Livelihoods in pastoralist communities. New York: Routledge.
Mobarak, A. M., & Rosenzweig, M. R. (2013). Informal Risk Sharing, Index Insurance, and Risk Taking in Developing Countries. American Economic Review, 103, 375–380. doi:10.1257/aer.103.3.375
29
Morduch, J. (1999). Between the State and the Market: Can Informal Insurance Patch the Safety Net? World Bank Research Observer, 14, 187–207. doi:10.1093/wbro/14.2.187
Mundlak, Y. (1978). On the pooling of time series and cross section data. Econometrica, 46, 69–85.
Patton, M. (2002). Qualitative evaluation and research methods, 1–39. Newbury Park: SAGE Publications
Quisumbing, A. R., & Maluccio, J. A. (2003). Resources at Marriage and Intrahousehold Allocation: Evidence from Bangladesh, Ethiopia, Indonesia, and South Africa. Oxford Bulletin of Economics and Statistics, 65, 283–327. doi:10.1111/1468-0084.t01-1-00052
Rose, E. (1999). Consumption smoothing and excess female mortality in rural India. Review of Economics and Statistics, 81, 41–49.
Santos, P., & Barrett, C. B. (2011). Persistent poverty and informal credit. Journal of Development Economics, 96(2), 337–347. doi:10.1016/j.jdeveco.2010.08.017
Tafere, K.H., Barrett, C.B., Lentz, E.C. & Tadesse, B. (2015). The Subjective Well-being Effects of Imperfect Insurance that Doesn’t Pay Out. Cornell University working paper.
Takahashi, K., Ikegami, M., Sheahan, M., & Barrett, C. B. (2016). Experimental Evidence on the Drivers of Index-Based Livestock Insurance Demand in Southern Ethiopia, World Development, 78, 324–340. doi:10.1016/j.worlddev.2015.10.039
Thomas, D. (1990). Intra-household resource allocation: An inferential approach. Journal of Human Resources, 25, 635–664. doi:10.2307/145670
Weber, E. U., Blais, A.-R. E., & Betz, N. E. (2002). A domain-specific risk-attitude scale: measuring risk perceptions and risk behaviors. Journal of Behavioral Decision Making, 15, 263–290. doi:10.1002/bdm.414
Wooldridge, J. M. (2002). Econometric Analysis of Cross Section and Panel Data. Cambridge, Mass: MIT Press.
Yesuf, M., & Bluffstone, R. A. (2009). Poverty, Risk Aversion, and Path Dependence in Low-Income Countries: Experimental Evidence from Ethiopia. American Journal of Agricultural Economics, 91, 1022–1037. doi:10.1111/j.1467-8276.2009.01307.x
30

31

TABLES AND FIGURES
Table 1: IBLI Information Sources
Product-focused channels Home-cantered channels NeitherPrevalence (%)
OIC staff 11.8%Television 1.2%Posters 4.6%Cooperatives/Network Groups 3.7%Community meetings 49.2%Radio Radio 4.3%DAs (cartoon/tape) DAs (cartoon/tape) 37.1%
ILRI household survey 76.2%NGOs 1.6%Neighbors, friends and relatives 52.9%
Discount coupon distribution 50.1%DAs (non-cartoon/tape) 64.8%
32

Table 2: Panel Household Characteristics
Frequency Per centHead Gender Female Head 97 20.9
Male Head 367 79.1Total 464 100.0
Marital Status of Female Heads
Never married 2 2.1Married 19 19.6Divorced/separated 8 8.2Widowed 68 70.1Total 97 100.0
Ethnic Group Borana 427 92.0Guji 36 7.8Gabra 1 0.2Total 464 100.0
Religion Traditional 385 83.0Muslim 18 3.9Orthodox 1 0.2Protestant 42 9.1Catholic 7 1.5Other Christian 11 2.4Total 464 100.0
Settlement Status Fully Settled 356 76.7Partially Settled 72 15.5Nomadic 36 7.8Total 464 100.0
33

Table 3: Panel Household Characteristics Disaggregated by Gender of Household Head (R3)
Aggregate Male Head Female Head Differences Mean SD Mean SD Mean SD Male-Fem (t-stat)
Herd size (TLU) 18.43 25.87 20.63 27.61 10.00 15.08 10.6*** (5.22) Total Income (ETB) 3,750.00 5,853.00 4,122.00 6,233.00 2,328.00 3,780.00 1794.2*** (3.68) Cash Income (ETB) 357.40 3,397.00 361.70 3,677.00 340.80 2,009.00 20.9 (0.077) Proportion of income from livestock 81.82 28.93 84.71 25.73 70.77 36.93 13.9*** (3.61) Cash Savings (ETB) 1,493.00 9,791.00 1,709.00 10,802.00 669.40 3,986.00 1039.8 (1.55) Asset Index 0.00 1.00 0.04 1.04 (0.15) 0.83 0.19 (1.91) All Transfers 237.80 317.30 257.20 341.60 163.70 181.60 93.5*** (3.76) Network Groups 0.96 0.93 1.05 0.95 0.62 0.77 0.42*** (4.74) Education 3.29 3.13 3.32 3.16 3.16 3.04 0.16 (0.45) Household Head Education 0.52 1.84 0.62 2.02 0.15 0.85 0.47*** (3.46) Financial Literacy 4.16 1.27 4.26 1.19 3.78 1.50 0.48** (2.98) Age of Head 51.78 17.96 50.81 17.72 55.53 18.48 -4.72* (-2.32) Household Size 7.28 2.81 7.69 2.83 5.70 2.11 1.99*** (7.88) Dependency ratio 1.39 0.87 1.35 0.74 1.54 1.24 -0.20 (-1.53) Low risk aversion 0.39 0.49 0.39 0.49 0.41 0.49 -0.019 (-0.36) Moderate risk aversion 0.43 0.50 0.43 0.50 0.45 0.50 -0.020 (-0.37) High risk aversion 0.18 0.38 0.19 0.39 0.15 0.35 0.040 (0.99) Expected rangeland below normal 0.46 0.50 0.45 0.50 0.49 0.50 -0.031 (-0.56) Expected rangeland normal 0.30 0.46 0.30 0.46 0.30 0.46 -0.0040 (-0.079) Expected rangeland above normal 0.24 0.43 0.25 0.43 0.21 0.41 0.035 (0.76) Home-Centered Info Sources 37.22 20.00 37.59 19.67 35.81 21.26 1.78 (0.77) IBLI Knowledge 4.91 1.80 4.96 1.82 4.73 1.72 0.23 (1.21) Effective price per TLU 280.00 134.00 281.60 132.10 273.60 141.40 8.00 (0.52) IBLI Purchase --Reported 0.30 0.46 0.30 0.46 0.30 0.46 -0.0015 (-0.029) IBLI Purchase--OIC 0.08 0.27 0.08 0.27 0.08 0.27 -0.0015 (-0.051) TLU Insured—Reported (n=149) 2.49 5.07 2.87 5.62 1.05 0.99 1.19 (1.79) TLU Insured--OIC (n=38) 4.41 6.26 4.96 6.49 2.33 5.16 2.64 (1.06) Percent herd insured--Reported (n=149) 0.03 0.14 0.03 0.16 0.03 0.09 0.00006 (0.0021) Percent herd insured--OIC (n=38) 0.28 0.42 0.28 0.45 0.29 0.33 -0.0124 (-0.0072) Observations 497 394 103 497 * p<0.05, ** p<0.01, *** p<0.001
34

Table 4: IBLI Purchase Decision(1) (2) (3) (4)
Female headed household 0.069 0.317*** 0.552** 0.481**(0.159) (0.123) (0.223) (0.207)
Female Head X HS at marriage -0.127(0.086)
HS at marriage 0.015(0.021)
Female Head X Lactating herd -0.083(0.093)
ln Lactating herd proportion -0.021(0.020)
Female Head X Home info -0.0002 0.001 0.001(0.0007) (0.001) (0.001)
Home-cantered information 0.0004 0.001 0.001(0.0005) (0.001) (0.001)
Female Head X Transfers -0.001 -0.043** -0.042**(0.009) (0.021) (0.021)
ln Transfers -0.006 -0.005 -0.005(0.005) (0.005) (0.005)
Female Head X Moderate risk aversion -0.019 -0.060 -0.027(0.030) (0.060) (0.059)
Moderate risk aversion 0.007 0.007 0.007(0.015) (0.015) (0.015)
Female Head X High risk aversion -0.046 -0.021 -0.157(0.050) (0.155) (0.156)
High risk aversion 0.004 -0.111 -0.113(0.684) (0.704) (0.698)
ln Effective price per TLU -0.117*** -0.086*** -0.093*** -0.091***(0.017) (0.013) (0.015) (0.015)
Lagged IBLI purchase -0.191*** -0.179*** -0.181***(0.024) (0.026) (0.026)
Dependency ratio 0.005 -0.012 -0.047** -0.046**(0.009) (0.016) (0.023) (0.023)
Expected rangeland below normal 0.069** 0.035* 0.026 0.028(0.029) (0.020) (0.023) (0.022)
ln Previous period losses (TLU) -0.016 -0.035*** -0.042*** -0.043***(0.016) (0.014) (0.015) (0.015)
Assigned coupon 0.063** 0.044** 0.031 0.032(0.030) (0.021) (0.022) (0.022)
Age of household head -0.061*** -0.060** -0.058**(0.019) (0.023) (0.023)
Age squared 0.0004*** 0.0004** 0.0004**(0.00016) (0.00019) (0.00019)
Proportion of income from livestock -0.001*** -0.001** -0.001**(0.000) (0.000) (0.000)
Household Average Controls HAC1 HAC2 HAC2 HAC2
Observations 1,824 1,824 1,510 1,526LR Chi2 252.93 706.9 703.71 709.26Prob > Chi2 0.000 0.000 0.000 0.000
35

Standard errors in parentheses. *** p<0.01, ** p<0.05, * p<0.1. The following coefficients are non-significant and not reported: Savings, non-livestock assets, income, herd size, head education, financial literacy, IBLI knowledge and expected rangeland above normal. HAC1 includes dependency ratio, expected rangeland conditions and effective price. HAC2 contains head age and age-squared, non-livestock assets, income, proportion of income from livestock, cash savings, previous period purchase, effective price, IBLI knowledge and all HAC1.
36
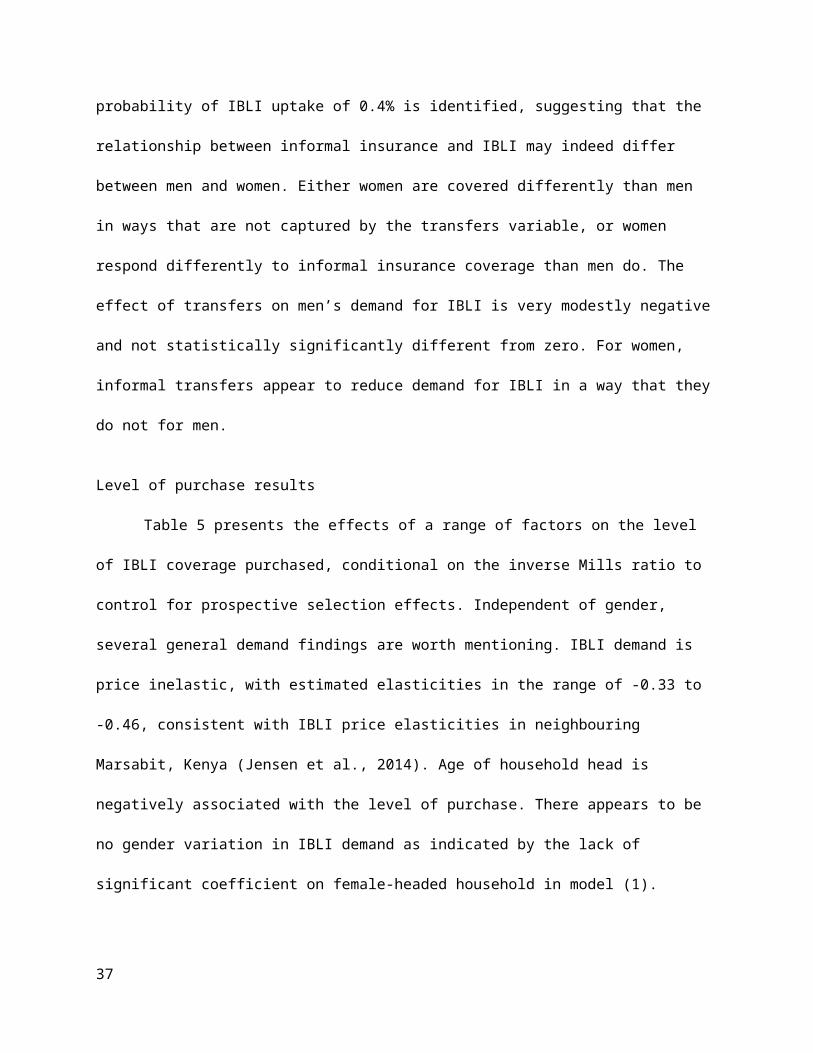
Table 5: Level of IBLI Purchase(1) (2) (3) (4)
Female headed household 0.100 0.144 -0.057 0.233(0.408) (0.454) (0.731) (0.676)
Female Head X HS at marriage 0.286(0.364)
HS at marriage -0.038(0.070)
Female Head X Lactating herd -0.710*(0.408)
ln Lactating herd proportion 0.169**(0.077)
Female Head X Home info -0.003 0.002 0.003(0.003) (0.007) (0.007)
Home-centered information 0.003 0.004* 0.003(0.002) (0.002) (0.002)
Female Head X Transfers -0.015 0.001 0.013(0.037) (0.071) (0.070)
ln Transfers 0.024 0.020 0.020(0.021) (0.022) (0.021)
Female Head X Moderate risk aversion -0.104 -0.287 -0.407*(0.128) (0.236) (0.225)
Moderate risk aversion -0.021 -0.035 -0.034(0.058) (0.058) (0.057)
Female Head X High risk aversion 0.358* -0.566 -0.104(0.208) (0.784) (0.493)
High risk aversion 0.138 1.234 1.002(2.914) (2.932) (2.884)
IBLI knowledge 0.041* 0.048* 0.042(0.025) (0.027) (0.027)
Head Education -0.051*** -0.056*** -0.051***(0.016) (0.017) (0.017)
ln Effective price per TLU -0.463*** -0.327*** -0.347*** -0.350***(0.072) (0.035) (0.032) (0.032)
Lagged IBLI purchase 0.015 -0.024 -0.035(0.095) (0.092) (0.091)
Age of household head -0.005 -0.073 -0.148*(0.067) (0.086) (0.087)
Age squared 0.0002 0.001 0.001*(0.001) (0.001) (0.001)
Asset Index -0.139* -0.188** -0.165**(0.076) (0.079) (0.078)
lambda 0.341 -0.134 -0.09 -0.091(0.219) (0.084) (0.067) (0.065)
Constant 3.008*** 3.330*** 3.421*** 3.640***(0.217) (0.545) (0.592) (0.589)
Household Average Controls HAC1 HAC2 HAC2 HAC2
Observations 1,824 1,824 1,510 1,526Chi2 328.7 861.7 855.6 888.8Prob >Chi2 0.000 0.000 0.000 0.000Standard errors in parentheses. *** p<0.01, ** p<0.05, * p<0.1. The following coefficients are non-significant and not reported: Financial literacy, expected rangeland conditions, previous period losses, proportion of income from livestock,(ln) herd size, dependency ratio, cash savings, (ln) income. HAC1 includes dependency ratio, expected rangeland conditions and effective price. HAC2 contains head age and age-squared, non-livestock assets, income, proportion of income from livestock, cash savings, previous period purchase, effective price, IBLI knowledge and all HAC1.
37

1 NDVI images used in the construction of the IBLI contract has resolution of 8km2 and is taken every 10 days from a U.S. National Oceanic and Atmospheric Association satellite used largely for weather forecasting (Chantarat et al., 2013). 2 Five relevant variables cannot be imputed for the periods between survey rounds: expected rangeland conditions, assets, savings, IBLI knowledge and financial literacy. The outcome variables as well as key determinants of demand (price, herd size, previous losses, income, etc) vary across the interim periods. Estimation using only the rounds for which we can measure these five variables is underpowered and infeasible. Rainfall data for Figure 1 from Lasage et al. (2010).3 See Appendix A for further details on panel construction. See Appendix B for complete attrition analysis. 4 TLU, or tropical livestock units, are calculated based on metabolic weight. 1 TLU = 1 cattle = 0.7 camel = 10 sheep/goats. Cattle are the dominant species in Borana, 77% of the animals in our sample. Women are more likely to own goats than men, but once herd size, income, savings and marital status are accounted for there is no statistically significant gender difference in herd composition.5 The only exception was for 20 participants in a separate, annual herd migration survey, who had a 50 per cent chance of receiving a 100 per cent voucher for IBLI purchase up to 15 TLU in a given sales period.6 Complete qualitative methodology available upon request.7 Results using reported purchase only and the 87% of cases where reported purchase matched OIC records can be found in the online appendix.8 Four respondents had no household members participating in groups.9 According to the survey data, the most important information sources for both male- and female-headed households were community meetings and NGOs, followed by the insurance company and informal conversations with friends and family. Qualitative data contradict this. All respondents who attended community meetings where IBLI was discussed reported not effectively learning about the IBLI product at community meetings. No one reported community meetings as a preferred channel, though for many people they were the only product-focused channel, which may explain why this was chosen as ‘most important’ in the survey data. No one indicated that they learned about the IBLI product from informal conversations with friends and family. The category ‘NGO’ meant different things to different people, including ILRI, OIC or anyone who comes to the community in a car. 10 Estimates using alternative formulations of the IBLI information source variable yield the same (lack of) gender differentiation along this dimension of demand.11 The effective price of IBLI per TLU of coverage, accounts for discount coupons received in addition to spatial and temporal price variations. However, IBLI is priced by species, not TLU. Therefore, the price facing each individual depends on the animals they choose to insure. For simplicity, we have calculated the effective TLU price as the price of insuring one cow rather than using the actual prices paid for the diverse combinations of animals individuals chose to insure. The latter method makes it difficult to define a price for those who chose not to purchase IBLI.12 Non-livestock assets are compiled using principal components analysis using a host of durable goods (Appendix A). The choice of assets is challenging in a context where people own little other than livestock. Our results, however, are robust to inclusion or exclusion of the asset index, underscoring their relative unimportance in this context.13 First-stage regressions of IBLI knowledge on assigned cartoon and assigned tape for the time period used in this study yield p-values ranging from 0.05-0.88, depending on the specification. In their study of IBLI demand using the same data, but only the first two sales periods, Takahashi et al (2016) instrument for IBLI knowledge using the educational treatments. Their first-stage regressions suggest that the instrument is weak in the first purchase period, but acceptable in the second. Given that these interventions were only used in the first year of IBLI implementation, it makes sense that their influence on knowledge wanes over time and is not visible in the third and fourth purchase periods.14 The first indemnity payments under the IBLI contracts were made in November 2014, outside the time span of the data analyzed here.15 These results are consistent across all specifications, including those using reported IBLI purchase rather than OIC record of purchase. Those results can be found in Appendix C.