Embed Size (px)
Citation preview
Gendering the Job: Networks and Recruitment at a Call Center
Roberto M. Fernandez
Lourdes Sosa
MIT Sloan School of Management
June, 2003
Paper to be presented at the 2003 annual meetings of the American Sociological Association. Support for this research was provided by the Russell Sage Foundation. Jill Stasz Harris and Patrick Behar provided excellent research assistance on this project. We would like to thank Lotte Bailyn, Peter Bearman, John Carroll, Tiziana Casciaro, Emilio Castilla, Adair Crosley, Paula England, Christopher Jencks, Joe Galaskiewicz, Isabel Fernandez-Mateo, Monica Higgins, Paul Osterman, Devah Pager, Damon Phillips, Brian Rubineau, Michele Williams, and seminar participants at Harvard, MIT Sloan and Wharton for their helpful comments and suggestions. Jesper Sorensen particularly helped us by patiently (even cheerfully) enduring our interrupting him with our many ill-defined questions and premature ideas.
Copyright June, 2003
Gendering the Job: Networks and Recruitment at a Call Center
Abstract
Gender segregation of jobs plays a central role in current research on gender and
labor markets, and understanding the mechanisms driving the gender segregation has
become a key focus of study. While the literature on gender segregation of jobs often
invoke gender sorting mechanisms that operate pre-hire, the data that are used to
empirically examine these processes are almost always collected on post-hire
populations. In this paper, we explore the workings of pre-hire mechanisms that are
alleged to sort men and women into different jobs. We study a research setting that is
unusually well suited for identifying and empirically isolating these social processes: we
analyze unique data on the recruitment and hiring process starting with the pool of
applicants for an entry-level customer service representative (CSR) job at a telephone
customer service center of a large bank. We find that all of the factors we examined—
pre-application choices, pre-application gender homophily of networks, and screeners’
choices--played significant and distinct roles in the gender segregation of the CSR job.
We conclude with a discussion of the theoretical and methodological implications of our
findings.
Gender segregation of jobs plays a central role in current research on gender and
labor markets. Gender segregation of jobs is pervasive, and many studies have appeared
documenting the patterns and trends of gender segregation across jobs (e.g., Jacobs
1989a; Jacobsen 1994; Tomaskovic-Devey 1993b; Tomaskovic-Devey et al. 1996). In
addition, numerous studies have found that men earn more than women, even after
controlling for human capital factors (England et al. 1994; Tomaskovic-Devey 1993a;
Tomaskovic-Devey et al. 1996). This earnings gap, however, virtually disappears when
men and women do the same job (Kilbourne et al. 1994; Petersen and Morgan 1995;
Reskin and Padavic 1994; Tomaskovic-Devey 1993a; 1993b). For this reason,
understanding the mechanisms driving gender segregation of jobs has become a key
focus of research on gender inequality.
Virtually all research on gender segregation of jobs begins with data on job
incumbents, i.e., people who have already been hired into a job.1 Such post-hire data,
however, are limited in their ability to distinguish among various gender sorting
mechanisms that are alleged to work prior to being hired. For example, arguments that
men and women pursue different types of jobs because of gender differences in
socialization (Subich et al. 1989) or shared gender role stereotypes (Reskin and McBrier
2000) both imply that men and women self-select into gender-typical jobs during job
search. Others emphasize the role of employers’ preferences and biases during pre-hire
screening as the reason that men and women work in sex segregated jobs (e.g., Reskin
and Roos [1990] on labor queues). Still other theories focus on gender differences in
1 Noteworthy exceptions are Petersen, Saporta and Seidel (2000) who study applicants to a high technology firm, and Skuratowicz and Hunter (2002) who study the reassignment of people to jobs in a bank reorganization.
1
social networks that serve to direct men and women to different job openings (e.g.,
Drentea 1998).
In this paper, we explore the workings of these pre-hire mechanisms that are
alleged to sort men and women into different jobs. We study a research setting that is
unusually well suited for identifying and empirically isolating these social processes.
Within this setting, we analyze unique data on the recruitment and hiring process starting
with the pool of applicants for an entry-level job at a telephone customer service center of
a large bank. We focus attention on a single entry-level job title—customer service
representative (CSR)—that has remained constant in this setting over the period of our
study, 1995-1996. While the duties and label of the CSR job remained constant, the
gender distribution of job incumbents changed over this relatively short period. Although
female-dominated at the start of our study (65.7 percent of CSR were women as of
December 31, 1994), the CSR job became even more female over this two year period:
by the end of 1996, the percentage of women employed in the CSR job had increased to
72.5 percent. Our goal in this paper is to shed light on how various pre-hire processes
contribute to the growing feminization of this job in this setting.
Gender and Job Segregation
At the most general level, theoretical accounts of gender segregation of jobs can
be grouped into two sets: theories emphasizing labor supply factors, and theories
stressing features of the demand side of the labor market. Supply side accounts argue that
for various reasons men and women have different preferences, and consequently choose
to work at different kinds of jobs (e.g., Polachek 1981). Some scholars have argued that
men and women have different preferences for jobs due to gender differences in
2
socialization (Betz and O’Connell 1989; Marini and Brinton 1984; Marini, Fan and
Fenley 1996; O’Leary 1974; Subich et al. 1989)2 or shared gender stereotypes (Reskin
and McBrier 2000). Others emphasize differential constraints due to gender differences in
family roles. For example, Becker (1981; 1985) argues that the gendered division of
household labor leads women to be less committed to working outside the home than are
men, resulting in poorer relative labor market performance (but see Bielby and Bielby
1984; 1988). Mincer and Polachek (1974; also see Polachek 1975a, 1975b, 1979) argue
that the intermittent participation of women in the labor force (due to duties such as child
rearing) make it rational for them to choose jobs whose skills do not “atrophy” over time.
Based on this same need for intermittent labor force participation, Zellner (1975)
proposed that this same need for intermittent labor force participation leads women to
choose jobs that allow them to earn better wages in the short run, although these jobs
might offer worse prospects in the long term. England (1982; 1984) has challenged this
line of reasoning. She showed empirical evidence that even in the short-run, women
would still be better off in male-dominated jobs; thus, women’s (alleged) needs for
intermittent labor force participation could not explain away job sex segregation.
Another set of supply side theories attempting to explain the gender segregation
of jobs emphasize the role played by gender differences in social networks. A number of
studies have appeared which show gender segregation of networks (e.g., Brass 1985;
Campbell 1988; Ibarra 1992; Lincoln and Miller 1979; Marsden 1987; 1988; Moore
1990). A number of scholars (e.g., Granovetter 1995) have argued that personal networks
play an important role in job finding, so that gender homophily (i.e., the tendency for
people to associate with same sex others; see McPherson, Smith-Lovin and Cook 2 For a contrary view, see Jacobs (1989b).
3
2001:422-424) serves to channel men and women into different jobs during job search
(Berger 1995; Corcoran et al. 1980; Drentea 1998; Hanson and Pratt 1991; 1995;
Mencken and Winfield 1999; Reskin and Padavic 1994).
In addition to the supply-side approaches, several theories of gender segregation
focus on the demand side of the labor market, specifically, employer’s actions during
screening. In particular, some demand side theories stress the gender biasing effects of
screeners’ preferences. For example, Reskin and Roos’ (1990) queuing theory posits that
employers have definite preferences for men. Some have argued that discriminatory
attitudes—whether conscious or unconscious—presumably affect employer screening,
and the gender composition of candidates as they pass through the stages of the hiring
process (Glick, Zion and Nelson 1988; Heilman 1980; 1984; Marini 1989).
Another demand side mechanism focuses on how network factors affect
screening. It is common for employers to use the networks of their current employees as
part of their recruitment strategies, and many employers prefer to hire employee referrals
(for a review, see Fernandez, Castilla and Moore 2000). To the extent that such networks
are gender biased, then employers’ preferences for employee referrals can also have
gendering effects (e.g., Berger 1995; Reskin and Padavic 1994; Roos and Reskin 1984).3
For our purposes, these theories of gender job segregation have one crucial
feature in common: for all of them, the gender sorting actions are taking place prior to
hire. Theories which emphasize men and women’s differential job choices—whether they
be due to gendered constraints or preferences—both result in a self-selected pool of
applicants for jobs. This is also true for supply side network theories, where women and
3 It is worth noting, however, that the only extant empirical study directed at this question (Petersen, Saporta and Seidel 2000) found no evidence that their employer’s preference for employee referrals affected the gender composition of candidates as they progress through the hiring process.
4
men are channeled to different jobs through job contacts. Similarly, for demand side
theories of employers’ preferences—whether the bias be for one gender over another, or
for networked candidates—the gender sorting processes work during pre-hire screening.
Since all these theories are designed to explain the same outcome—the post-hire
gender segregation of jobs—research strategies based on post-hire data alone will be
over-determined, and are not likely to be able to distinguish among these different gender
sorting mechanisms. However, virtually all of the empirical research to date on the
gender segregation of jobs is based on job incumbents, i.e., people who have already
found jobs.
In this paper, we take a fresh approach to the study of gender based job
segregation by studying a research setting that is unusually well suited to the task of
identifying and empirically isolating the social processes alleged to be at work in the
gender sorting of jobs. We open up the “black box” of pre-hire sorting processes by
examining unique data on pre-hire recruitment and screening for an entry-level job at a
telephone customer service center of a large bank. In order to control for the possibility
that job titles are being defined on the basis of gender (e.g., Baron and Bielby 1986;
Jacobs 1992), we focus attention on a single entry-level job title, the customer service
representative (CSR).
Our strategy is to document the gender composition of the applicant pool, and
examine how supply-side pre-hire network factors affect the gender composition of the
pool. By tracing the connections between referral applicants and the people who referred
them, we study how gender homophily contributes to the gendering of the pool of
candidates. In order to address theories about the role of screeners in the job gendering
5
process, we track how the gender mix of candidates changes as they progress through the
hiring pipeline. In addition, we engage the supply-side network theory that employers’
bias in favor of referrals might account for job segregation by studying the ways in which
screeners’ preferences for referrals affects the progression of men and women through the
screening process. We conclude with a discussion of the theoretical and methodological
implications of our findings.
Data
We studied the hiring process for an entry-level position at a phone center, within
a large, globally diversified financial service institution. The job we study is the
Customer Service Representative (CSR), which is a full-time, hourly position, paying a
starting hourly wage of $8.25, and whose duties consist of answering telephone inquiries
about customers’ credit card accounts. New hires into this position are given two months
of classroom and on-the-job training before being assigned to work on the phone. CSRs
are trained in balancing the etiquette of customer service interactions with accuracy,
speed and efficiency while processing phone calls. CSRs handle up to 5,000 phone calls
per month; these calls are often monitored by managers to insure that courtesy and
accuracy goals are being met. For more details on the setting and the data collected, see
Fernandez, Castilla and Moore (2000).
The phone center offers a number of practical advantages for this research. The
human resources department keeps virtually complete databases on recruitment for CSR
jobs, which has allowed us to track applicants’ movement through every phase of the
hiring process. In addition to these computer databases, the human resources department
keeps paper files on each applicant, including a standardized application form. From
6
these paper files, we coded crucial data on applicants’ education, work history, and other
human capital characteristics. Particularly important for us is that, because we had access
to the name and the handwritten signature of the applicant on the form, we were able to
code the gender of the applicant for virtually all (i.e., 99.3 percent) of the cases.
We constructed a database of the hiring pipeline (i.e., application, interview,
offer, and hire) for all 4,316 applications for the CSR job during 1995-1996.4 Note that
the unit of analysis here is the application, and that some people applied multiple times
during the period of our study. The maximum number of applications from individuals is
three. Of the original 4,316 employment inquiries, 416 (9.6 percent) were from
individuals who had applied twice, and only 15 (0.3 percent) applied three times.5 60.7
percent (i.e., 2,618) of the 4,316 applications resulted in an interview with hiring
managers; only 9.4 percent (406) of the applications led to the offer of a job, and 8.7
percent (376) of the original applications ended in a hire.
One of the most unique features of these data is the fact that we have been able to
link referrers with their referrals at the application phase. Unlike past research where data
on the characteristics of the job contact are observed only among hires (e.g., Corcoran et
al. 1980), we are able to link referrers to job applicants. Thus, for each external applicant,
we are able to identify the presence or absence of a referral tie, as well as the gender of
the referrer. There is a line on the employment application that explicitly asks the
applicant to list the name of the referrer. Referring employees are paid $10 if the people 4 We have grouped the applicants into three recruitment sources: external non-referral (e.g., newspaper advertisements), external applicants who were referred by employees (hereafter, employee referrals) and candidates for internal transfers. Although this latter category is relatively small in number (N=151), such internals applicants are an interesting comparison group since they are more likely than externals to be familiar with the CSR job. We will note the results for internals at the appropriate points in the analysis. 5 In the predictive models we present below, we include a dummy variable to distinguish repeat applicants from first time applicants (1 for repeat applicants, and 0 otherwise; for a similar procedure, see Fernandez and Weinberg 1997).
7
they refer are interviewed, and $250 if the referral is hired and survives a 30-day
probation period. This creates an important incentive for referring employees to ensure
that applicants list them accurately as their referrer. As we discuss in Fernandez, Castilla
and Moore (2000), this referral bonus also constitutes the firm’s social capital investment
in the social networks of their employees.
More than one-third of the applications (35.8 percent, or 1,546) were external
referrals, and slightly less than two-thirds were non-referrals (63.6 percent, or 2,745).6
1,223 referrers produced 1,539 referrals.7 From company data sources, we located
employment records for 97.5 percent (1,192) of the referrers who were identified. It is
from these records that we coded the gender of the referrer. There were no limits on the
number of applicants a person could refer, and the number of referrals per referrer varied
between 1 and 6 (although 79.7 percent referred only one, and 15.8 percent referred two
applicants).
Lastly, these data allow us to address gender differences in networking activities
that lead people to apply. By comparing the gender distribution of those who refer
applicants (i.e., the originators of network ties) to the gender distribution of the
population of employees of the phone center (i.e., those at risk of referring), we can
assess whether there are gender differences in the propensity to produce referral
applications. We assemble data on all workers employed at the site over the period of the
study, and identify whether they participated in the company’s referral program for
customer service representatives. We were successful in coding such background data for
6 Note that we could not identify the recruitment source for 25 applications. 7 Seven of the applications indicated that they were referred, but did not name an individual referrer.
8
96.4 percent (3,968 of 4,114) of the workers employed at the phone center (for additional
details of the employee data, see Fernandez and Castilla 2001).
Although it is our sense that the firm is not particularly distinctive in its hiring
practices (see Fernandez, Castilla and Moore 2000), in light of our decision to study only
one firm, we can make no claims regarding generalizability. Our main goal in adopting
this empirically grounded, case-study approach is to elucidate the workings of the pre-
hire mechanisms that are alleged to sort men and women into different jobs. Thus, our
strategy has been to trade broad data across many settings, for the very deep knowledge
of this particular case. While we would expect that there will be some contingency in the
ways the pre-hire processes contribute to gender segregation of jobs in different settings,
it is impossible to distinguish among the different pre-hire mechanisms which might
produce gender sorting without the unique, fine-grained data we analyze here. The need
for this kind of detailed data is made even more acute when one realizes that for many of
these pre-hire mechanisms, no empirical evidence at all has ever been offered. The
theoretical significance of this case is that it provides a window through which one can
view the operations of a set of processes that are normally hidden from view. Thus, the
insights gleaned from this case study can be used to guide broader-gauge research
designed to represent wider populations of organizations.
Analyses
At the most general level, theoretical accounts of gender segregation of jobs can
be grouped into two sets: theories emphasizing labor supply factors, and theories
stressing features of the demand side of the labor market.
9
Supply Side Processes: Choice and Constraint
Supply side accounts of gender segregation argue that men and women have
distinct preferences for different kinds of jobs due to gender differences in socialization
(O’Leary 1974; Subich et al. 1989), shared gender stereotypes (Reskin and McBrier
2000), differential constraints due to gender differences in family roles (Zellner 1975).
From the perspective of our study, all of these theories share a common prediction: pre-
hire processes should result in a gender biased application pool. Indeed, the pool of
applications over 1995-1996 for the CSR job is not gender neutral: 67.0 percent of the
4,286 applications for which we could code gender and were received over this period are
from females. While this certainly departs from the 50/50 population sex ratio, it is
interesting to compare this percentage against several other baselines.
A first baseline of comparison is the percentage of females employed at the call
center just prior to the start of our study. As of the day prior to the start of the hiring
window (i.e., December 31, 1994), 65.7 percent (69 of 105) of workers employed in the
CSR position were women. Whatever processes were at work prior to our study, the net
effect of these processes was to produce a female dominated CSR job. Thus, the gender
distribution of job incumbents at the beginning of the study closely matches the gender
distribution of the pool of applicants obtained for this job over the subsequent two-year
period (65.7 vs. 67.0 percent female).
There were, however, some interesting changes in the call center over the period
of our study. During 1995-1996, the call center expanded its operations so that the
number of CSRs would grow substantially (from 105 to 280). Most important for our
purposes, this expansion corresponded to an increase in the representation of women in
10
the CSR job during this time: the percentage of CSRs that were women increased from
65.7 percent female before the study, to 72.5 percent female the day after the close of our
hiring window (i.e., as of January 1, 1997).8 Compared to this baseline, an application
pool that is 67.0 percent underrepresents the gender composition of the CSR job at time
2. This suggests that women are more likely than men to survive the screening process
and be hired (see below).
In addition to comparisons to incumbents of the CSR job, we also considered
some sources of data that might reflect the larger labor market in which the call center
was located as a baseline. Specifically, we sought to check whether the disproportionate
number of women applying for this job could be due to a shortage of men seeking work,
rather than gender differences in the attractiveness of the CSR job. While neither of the
data sources we located is ideal, the available information suggests that this is unlikely to
be the case.
From the Current Population Survey (CPS), we identified data showing the
unemployment rate at the state level. In 1995-1996, the unemployment rate was well
under 4 percent, and these rates did not differ by gender. Specifically, the unemployment
rate for men was 3.0 and 3.2 percent for 1995 and 1996, respectively. This is compared to
figures of 2.9 and 3.2 for women. For both men and women, the differences are well
within 90 percent confidence intervals (e.g., for men in 1995, the range is 2.4-3.5
8 As we describe below, the percentage of females hired into the CSR job during our study is even higher, with 77.7 percent of the people hired during our study being female. Our data come from two sources that we cannot directly combine: applicants to the job, and a company database of incumbents of jobs. The incumbents’ database is anonymous, and we cannot reconcile these data with our hiring data, which we constructed ourselves with full access to the information on hires. The difference between 77.7 percent of CSR hires between time 1 and 2 being women, and 72.5 percent of CSR incumbents being female at time 2 is due to turnover, which we cannot study for incumbents. Due to these limitations, we only use the incumbents’ database for the descriptive purpose of defining the population of CSR job incumbents for the before and after baselines of comparison.
11
percent). At least at the state level, there appears to be no shortage of men looking for
work.
We were also able to locate some relevant data at the local level. The state
government runs a free job-matching program in the local SMSA, and keeps aggregate
statistics on job seekers who register to look for work through them. While having the
virtue of focusing on job-seekers in the local SMSA, the fact that these data come from a
state-run job matching service introduces its own biases. It is worth noting, however, that
the service does send applicants to entry-level jobs at call centers, which are relatively
low wage jobs. Unfortunately, information on where job service clients are sent is not
kept systematically. The public employment service data show that for the period July,
1995 to June, 1996 (the earliest time for which they keep data), 53 percent of job-seekers
were male. Here, too, these data suggest that a shortage of men seeking employment is
unlikely to account for the gender skew of the applicants in our study.
Finally, it is important to consider that the 67.0 figure above combines
applications from all sources. However, if there are gender differentiated network
processes (e.g., gender differences in job information; see Campbell 1988) that also serve
to bias the pool of applicants (see below), then external referral applications would be
affected by both the pre-hire preferences or constraints of the candidates, as well as these
network processes. It is also likely that internals would have better information about the
nature of the job than external candidates. To the extent that the job has characteristics
that are differentially attractive for men and women, the gender distribution of internal
candidates might differ from that of external candidates.
12
Table 1 shows that there is a significant relationship between the gender
distribution of applications and recruitment source (p < .001, LR Chi-square 14.258, with
2 d.f.). The percentage of women is highest for internal candidates (74.2 percent),
intermediate for referrals (69.9 percent), and lowest for external non-referrals (65.0
percent). Since internals are likely to be well informed about the nature of the job, such a
pattern is consistent with the idea that the CSR job becomes more attractive to women
than men as more information is made available about the job. Although a similar process
could be at work for referrals if referrers were to be passing on information about the
CSR job, results reported in our previous work show little support for the idea that
referrals have “extra information” compared with external non-referrals at this phone
center (see Fernandez, Castilla and Moore’s [2000:1314-1322] tests of hypothesis 3). The
results do suggest, however, that other network-related processes serve to raise the
proportion of women who apply to this job via referrals. We examine these processes in
detail below.
The analyses up to this point have been aimed at understanding the gender
composition of the application pool for the CSR job. We have yet to address possible
gender differences in the quality of the applicants. We interviewed the call center
recruiters about the criteria they used to judge applicant quality (for details, see
Fernandez, Castilla and Moore 2000:1302-1305). They said that they look for evidence of
basic keyboarding and computer skills on the application form. In addition, they also
place relatively high weight on an applicant’s job history when screening applications. In
light of the customer service aspects of the job, screeners also look for people with prior
customer service experience. Recruiters said they are also quite concerned about work
13
attitudes, and tend to look for applicants who they think will be reliable employees. This
leads them to prefer applicants who are currently employed, and who have had some
previous work experience. Because they are quite concerned about the cost of turnover,
recruiters tend to avoid people who have changed jobs a lot during their work histories.
Recruiters are also concerned about applicants who are “overqualified” for this entry-
level position, so that candidates who report significantly higher wages in their previous
job than the starting wage at the phone center ($8.25) are looked upon with some
skepticism. Compared with work experience, the recruiters said that they place less
weight on formal education for the entry-level CSR job. Recruiters are concerned,
however, that highly educated people might be using these jobs as a platform to look for
better employment and, consequently, that highly educated workers are more likely to
turn over. Similar to our past research (Fernandez and Weinberg 1997), the call center
screeners consider very highly educated applicants as overqualified for the CSR job.9
We coded background information from the original application forms to reflect
these concerns. We coded each applicant’s years of education, experience in the financial
services industry, employment experience outside the banking industry, and customer
service experience. We also coded a dummy variable for whether the person was
employed at application, as well as the number of previous jobs listed on the application,
years of tenure with the last firm, and wages of the last job. We looked for evidence of
computer experience among the application materials, and created a dummy variable for 9 There is one criterion that absolutely disqualifies applicants, however. The application form asks whether the applicant has ever been convicted of a “breach of trust;” applicants responding ‘yes’ are eliminated from further consideration since regulatory agencies will not allow banks to hire such people into CSR positions. Breaches of trust include shoplifting, embezzlement, forgery, fraud, and writing checks with insufficient funds. All hires are required to undergo expensive fingerprinting and background checks. If these tests come back showing a conviction, the call center is required by law to let the new hire go. Only 0.6 percent (11 males and 14 females) of applications from all sources (external non-referrals, external referrals, and internals) indicated a breach of trust.
14
the presence of these skills (the applications had a line specifically asking for such
information). Similarly, based on the information provided on a line on the application
form soliciting such information, we also created a dummy variable for evidence of
foreign language skills. In order to address the recruiters’ concerns about possible over-
qualification for the CSR job, we distinguished applications from people with more than
a college degree (i.e., greater than 16 years of education) with a dummy variable. For
similar reasons, we coded a dummy variable for whether the applicant reported a wage on
their last job as being greater than or equal to the starting wage for CSRs at the call
center, $8.25 per hour.
Table 2 shows descriptive information on a number of background characteristics
of the applicant pool by gender. In order to control for the network and information
processes we address below, we focus here on the pool of non-referral applicants. We
begin with tests of gender differences in individual variables. Univariate F tests show that
male and female applications are not significantly different with respect to a number of
background factors: computer and foreign language skills, number of previous jobs,
whether the applicant was employed, and tenure on the last job. Female applications
show superior qualifications compared to males with respect to customer service and
financial services experience. Males have more experience in jobs outside the financial
services arena, and contain higher proportions of overqualified applicants than females.
Although the median years of education are identical for males and females (i.e., 14
years), the proportion of applicants with greater than 16 years of education is
significantly higher for males.
15
The percentage of applications overqualified by virtue of past wages that are
greater than the starting wage for the CSR job (i.e., $8.25 per hour) is also significantly
higher for males than females (37.0 vs. 21.7 percent; p < .001). Male applicants also
earned higher wages on their last job than females when the difference is measured at the
mean ($8.15 vs. $6.80; p < .001) or the median ($7.25 vs. $6.33). Indeed, with the
exception of minimum wage applicants (i.e., $4.25), male applicants have higher past
wages than female applicants at every percentile point in the distribution. This is seen
clearly in Figure 1, which plots the percentile distribution of wages on last job for
females against the percentile distribution for males. The 45-degree line shows a baseline
of what the plot would look like if females and males were to have identical wage
distributions. With the exception of the 5th percentile and below which consists of
minimum wage applicants, the line for the observed data is always above the 45-degree
line, showing that males had higher wages than females over virtually all of the
distribution.
Similar to our past research (Fernandez, Castilla and Moore 2000; Fernandez and
Weinberg 1997), we checked whether applications could be classified into distinct
profiles. While the univariate F-tests are informative for looking at gender differences for
each of the background variables, examining each variable separately is inconsistent with
the notion of a profile. Table 2 reports the multivariate test of whether gender is
statistically independent of the joint distribution of the 10 measures of applicant quality.
We find strong evidence that gender distinguishes applicants’ profiles (p < .0001; Wilks’
Lambda = .935, F-test = 13.327, d.f. = [10, 1,929]). In terms of the criteria that recruiters
are seeking, on the whole, females are more qualified than males at application.
16
These latter findings suggest that the pool might be even more female if we were
to adjust the pool of applicants by eliminating candidates who are not desirable according
to the screeners.10 For example, eliminating from consideration “overeducated” and
“overpaid” applicants—who tend to be male—increases the percentage of females in the
remaining pool to 70.1 percent (1,177 of the surviving 1,668 candidates). Similarly,
applying absolute cutoffs to eliminate candidates based on any of the criteria in Table 2
on which women are superior to men (e.g., customer service experience) would serve to
increase the proportion of women in the adjusted pool. On the other hand, establishing a
threshold for factors on which males dominate (e.g., months of non-bank experience)
would decrease the percentage of women in the adjusted pool.
We have good reasons to think that recruiters do not rigidly apply such single-
variable thresholds, however.11 While we study screeners’ actual interview and offer
decisions in detail below, we can get a rough estimate of what the gender composition of
the non-referral applicant pool would look like if we were to statistically adjust for
gender differences across all the qualities that recruiters screen for at this call center. We
estimated a linear probability model distinguishing the gender of the applicant using the
10 Human resource professionals refer to this as an “adjusted” application pool. Screeners often form adjusted pools as a way of judging how well they have targeted their recruitment effort. Screening from a pool which is composed of very few hirable people results in higher screening costs relative to a “richer pool” of applicants (see Fernandez, Castilla and Moore 2000). 11 In our interviews, recruiters described the screening criteria as “things to look for” and “things to avoid.” Moreover, analyzing the outcomes of their actual screening decisions shows that, with the exception of the “breaches of trust” mentioned above, they clearly did not apply any of these criteria as absolute “must haves” in their screening decisions, but rather allowed trade-offs among multiple factors. For example, among interviewees, the person with the highest hourly wage in their last job was $40.00, the same as it is in the original application pool. Thus, if $40.00 is being used as a cutoff, it is a criterion that excludes no one from the interview stage. Indeed, even among hires, only 0.6 percent of applicants would be excluded by applying the criterion of the highest paid person to hired ($22.49) as a cutoff. By way of contrast, none of the 25 applications that cited a breach of trust were interviewed, offered the job, or hired.
17
background variables presented in Table 2.12 We then used the coefficients of the model
(see column 1 of Appendix Table A1) and the means of the background factors by gender
(Table 2) to calculate what the proportion female would be for applicants with different
levels of background characteristics.13
Since males tend to have lower mean values on most of the desirable background
characteristics, then selecting an adjusted pool of people who are low on those values
would boost the percentage of males. Indeed, if we were to construct the adjusted pool in
such a way that the average person looked like the average male across the background
factors, the simulation predicts that the percentage female in the application pool would
drop 4.2 percent to 60.8 percent. On the other hand, since females tend to have higher
mean values on the desirable background characteristics, then selecting an adjusted pool
of people who are high on those values would boost the percentage of females. Here, the
simulation exercise estimates that the percentage of women would rise 2.3 percent to 67.3
percent if the adjusted pool were to be composed of people with the same average
background characteristics as the average female. Interestingly, all of this boost can be
traced to the role of one variable: over-qualification due to high past wages. The
predicted percentage female for an adjusted pool which is composed of people with the
male mean on over-qualification due to high wages, but the female means on all the other
background factors, is 64.7 percent. In light of the evidence presented in Figure 1 that
12 See Appendix Table A1 for the coefficients of the model. We also estimated more complicated models (specifically, probit models and discriminant functions analyses) and obtained very similar results. We opt for the linear probability model for its ease of exposition, and because the main drawback of the model (i.e., predicted values outside the 0-1 range) has minimal impact on these estimates (only 4 of the 1,940 cases lie outside the 0-1 interval). 13 Of course, we do not have data on people who chose not to apply to the company. The exercise that follows, then, is predicated on the assumption that the gender differences in the supply of people who would apply when we change the criteria is not very different from the realized sample of those who did apply.
18
males have higher past wages than females across virtually the entire distribution, the
policy of having a fixed wage offer of $8.25 per hour and avoiding highly paid workers is
likely to skew the applicant pool in favor of females.14
Supply Side Processes: Networks
Another set of supply side theories attempting to explain the gender segregation
of jobs emphasize the role played by gender differences in social networks. A number of
scholars have argued that gender segregation of networks leads men and women into
different jobs (Corcoran et al. 1980; Drentea 1998; Hanson and Pratt 1991; 1995;
Mencken and Winfield 1999; Reskin and Padavic 1994). As noted above, all of this
research, is based on job incumbents, i.e., people who have already found jobs. Thus,
these studies cannot address the pre-hire network processes which are alleged to direct
men and women to different jobs.15 Here, we specifically focus on the pre-hire network
factors that might differentially direct men and women to the CSR job.
In the context of our study, such network factors would manifest themselves by
employee referral applicants being even more gender biased than the pool of non-referral 14 As we noted above (see note 13), this exercise assumes that the marginal applicant that is being induced to apply by the changing criteria is not very different from the people who have actually applied. Although the data are far from ideal, we were able to locate some relevant data from the open labor market to check the assumption for the most important driver of the results in this exercise, i.e., males’ relative over-qualification by virtue of high wages. For the non-referral applicant pool, the female median wage for past wages is 88% of the male median wage. For the most comparable data we could locate during the period of our study (i.e., weekly earnings for full-time, full-year workers in the state in which the call center is located), the female median wage was 70.9 percent of the male median. While far from directly comparable, these data do suggest that males are likely to earn more than females in the open labor market as well. 15 We know of only one exception here. Petersen, Saporta and Seidel (2000) provide an important study of the impact of employee referrals, gender and race in the pool of applicants for employment at a high tech firm over a ten year period. They found no evidence of females being disadvantaged as applicants progressed through the hiring process. From the perspective of our goals here, their study has two limitations. First, the firm they studied did not distinguish jobs or occupations, but instead hired people into broad functional areas (Petersen, Saporta and Seidel 2000:774-775). For this reason, their study cannot, as we do, address the gender composition of a specific job, but only the gender composition of the firm as a whole. Second, they do not have access to the originators of the referral tie, i.e., they cannot identify who referred the applicant. Thus, they cannot address questions related to gender differences in the referring, or the gender homophily of the referral ties. We will examine both these issues below.
19
applicants. As we showed in our discussion of Table 1 above, the data show just this
pattern: 69.9 percent of referral applications are from women compared with 65.0 of non-
referrals. The gender difference between the referral and non-referral application pools is
statistically reliable (p < .001, LR Chi-square 10.529, with 1 d.f.). Thus, the net impact of
the network processes that produce applications16 to this call center result in an applicant
pool that is more female than the non-referral pool.
As with non-referrals, we explored whether there are gender differences in
applicant quality among referrals (see Table 3). The univariate F tests show that results
for referrals are similar to those for non-referrals (c.f. Tables 2 and 3). The only
difference in the pattern of results is that for referrals, males and females do not differ
with respect to years of experience in financial services, whereas females show
significantly more financial services experience than males among non-referrals. Here
too, we find strong evidence that gender distinguishes applicants’ profiles (p < .0001;
Wilks’ Lambda = .936, F-test = 7.506, d.f. = [10, 1,104]). Overall, the results for referrals
are very similar to what we found for non-referrals: women are better qualified than
males at application.
As was the case for non-referrals, the male application pool also contains a higher
proportion of overqualified applicants—both by virtue of education level and hourly
wages on the last job—than the female application pool. A plot of the percentile
distribution of wages on the last job for referrals shows that males had higher wages than
females over virtually the entire distribution (see Figure 2). This suggests that the referral
pool might be even more female if we were to adjust the pool of applicants by
16 Note that we do not directly observe referrer’s recruitment efforts in these data. Because we only observe recruitment attempts where the referral actually applies to the call center, we say “produce applications.”
20
eliminating candidates who are overqualified with respect to past wages. Here, the
“adjusted pool” simulation exercise (available on request) estimates that the percentage
of women in the referral pool would rise from 69.9 to 71.6 percent if the adjusted pool
were to be composed of people with the average last wage of females in the referral
application pool. As with non-referrals, virtually all of the gain is due to over-
qualification with respect to past wages: the predicted percentage female for an adjusted
pool which is composed of people with the male mean on over qualification due to high
wages, but the female means on all the other background factors is 69.7 percent. Since
this pattern emerges within the population of referrals as well, the policy of having a
fixed wage offer of $8.25 per hour and avoiding highly paid workers does not account for
the observed referral/non-referral difference in the percentage of women.
Who Refers?
At the beginning of the chain of the network processes leading people to apply to
the CSR job are the call center employees, who form the pool of potential referrers. We
assembled a dataset on all workers who were employed at the call center at any time
during the two-year window of our study, and therefore, were at risk of referring CSR
applicants. A total of 4,114 workers worked at the call center at some time during 1995-
1996, and virtually all of these workers were eligible to refer someone.17 Women were
17 While the referral bonus program was widely available to employees working at the firm, a few (less than 10) of the 4,114 people employed at the phone center were barred from participating in the program. Managers who have hiring authority cannot claim a referral bonus for someone who winds up working for them (they could, however, refer people to other shifts or supervisors). Second, human resources personnel who screen applicants for the job cannot participate in the referral program. Due to data limitations, we could not identify these workers in order to exclude them from the set of people at risk for referring.
21
much more prevalent than men among employees of the call center: women constitute
69.7 percent of workers.18
We next examined whether there are significant gender differences in the
propensity to produce referral candidates to the CSR job. A little less than a quarter of the
workers (i.e., 1,005) produced at least one referral applicant for the CSR job. 25.7 percent
of women originated at least one referral, compared to 21.4 percent of men (p < .003, LR
Chi-square 8.753, with 1 d.f.). Thus, not only are women overrepresented among call
center workers, they are also more prevalent among referring workers than are men: 73.4
percent of the referrers are women compared with 68.5 percent of non-referrers. Women
also showed a higher “out-degree” than men (recall that there was no limit to the number
of people that employees could refer): women produced an average of .371 referrals
compared with an average of .308 referrals for men (p < .012, F-test 6.32 with 1 and
4,112 d.f.).19
Who is Referred?
Thus far we have shown that women are more prevalent than men at the call
center, and that women are more likely to produce referral applications than men. Taken
alone or in concert, these factors could account for the observed results where there are
more females among referral than non-referral applicants. However, the question of the 18 There are slight gender differences in turnover among employees that make the 69.7 percent number a slight underestimate of the percent female at risk of referring. This is because 42.6 percent of the 4,114 workers were employed at the call center less than the entire two-year period of the study. If we limit attention to the 57.4 percent of people who were employed the entire two years, the percent female rises to 70.2. If we weight the cases by the amount of time they are exposed to the risk of referring (this is equivalent to conceiving of the unit of analysis as person-days employed over the two-year hiring window), females account for 70.1 percent of the population of potential referrers. The predictive models we present below include corrections for heterogeneity in exposure (see Table 5). 19 Recall that the vast majority of referrers (79.7 percent) produced only one referral candidate. We examined gender differences in producing multiple referrals among those who referred at least one candidate. The gender difference in the average number of referrals for this subset is negligible (women, 1.44 and men, 1.43). Therefore, the gender difference in out-degree is driven by differences in the propensity to refer one candidate.
22
target of referring remains. Specifically, we examine the data to see whether there is
evidence of gender homophily for the referral applicants. As we noted above, a number
of scholars assert that gender homophily is an important factor in job finding networks
(e.g., Berger 1995; Reskin and Padavic 1994). To our knowledge, with only the exception
of Fernandez, Castilla and Moore (2000), the evidence for gender homophily has been
based on the job incumbents, and not on pre-hire data such as those we study here.
Table 4 tabulates the gender of the originator of the referral tie by the gender of
the referral applicant. The correlation between the gender of the referrer and the gender
of the referral is small (Pearson’s correlation = .174), but statistically significant. Three
quarters (75.1 percent) of the referral applications produced by female referrers are from
women. What is interesting, however, is that the majority of referral applications
produced by male referrers are also to women (56.3 percent).
We examined whether these results change after controlling for a number of
facets of employee background. We include among the predictors two variables that
measure knowledge of the job and referral practices at the company, i.e., dummy
variables for whether the person had ever worked as a CSR at the company (1=yes) and
whether the person was him- or herself hired as an employee referral (1=yes). In addition,
we control for worker’s age (in years), tenure (in years) with the firm, and annual salary
(in thousands of dollars) at the start of the study (January 1, 1995).20 From the
employment records, we also code separate dummy variables for having a BA (1=yes)
and an MA degree (1=yes).
20 If the worker was hired after the start of the study, tenure is coded zero, and the salary is their starting salary with the company.
23
Table 5 presents negative binomial regression analyses modeling the count of
referrals made by each worker over the period of the study.21 The first column shows the
model predicting the number of referrals made by employees, irrespective of the gender
of the target. As might be expected, controlling other factors, having been hired as an
employee referral is strongly associated with producing referral applicants: the marginal
effect shows that referrals have a conditional mean on referring that is .083 higher than
non-referrals. Similarly, employees who have previously (or currently) worked as a CSR
at the company produce substantially more referrals than non-CSRs (the marginal effect
of CSR background on the conditional mean of referring is .100). Employee’s tenure is a
significant negative predictor of referring: longer-term employees produce fewer referrals
compared with people hired during the period of the study (i.e., those hired most
recently). Controlling tenure, older workers are also less likely to participate in referring
than younger employees. The remaining control variables (salary, BA, and MA degrees)
are also negatively associated with referring, although, with the exception of the dummy
variable for having a BA degree, these effects are only significant at the .10 level.
Most important for our purposes, while the zero-order data showed that women
tend to produce more referral applicants than men (the average number of referrals for
females is .371 compared with .308 for males), this gender difference is explained by the
other background factors. After controlling for other variables that are associated with
referring, the gender difference is small and not statistically reliable.22 After controls, the
21 Note that we parameterized the count models to correct for differential exposure to the risk of referring associated with time employed during the hiring window. For all three models presented in Table 5, there is evidence of overdispersion, i.e., that the variance of the dependent variable is greater than the mean. Thus, we opt for the negative binomial regression model, which corrects for the overdispersion when modeling the counts (Cameron and Trivedi 1998). 22 We found a similar result in Fernandez and Castilla (2001) using a much more complicated model of the referring process, i.e., an event history model with time-varying covariates and repeated events.
24
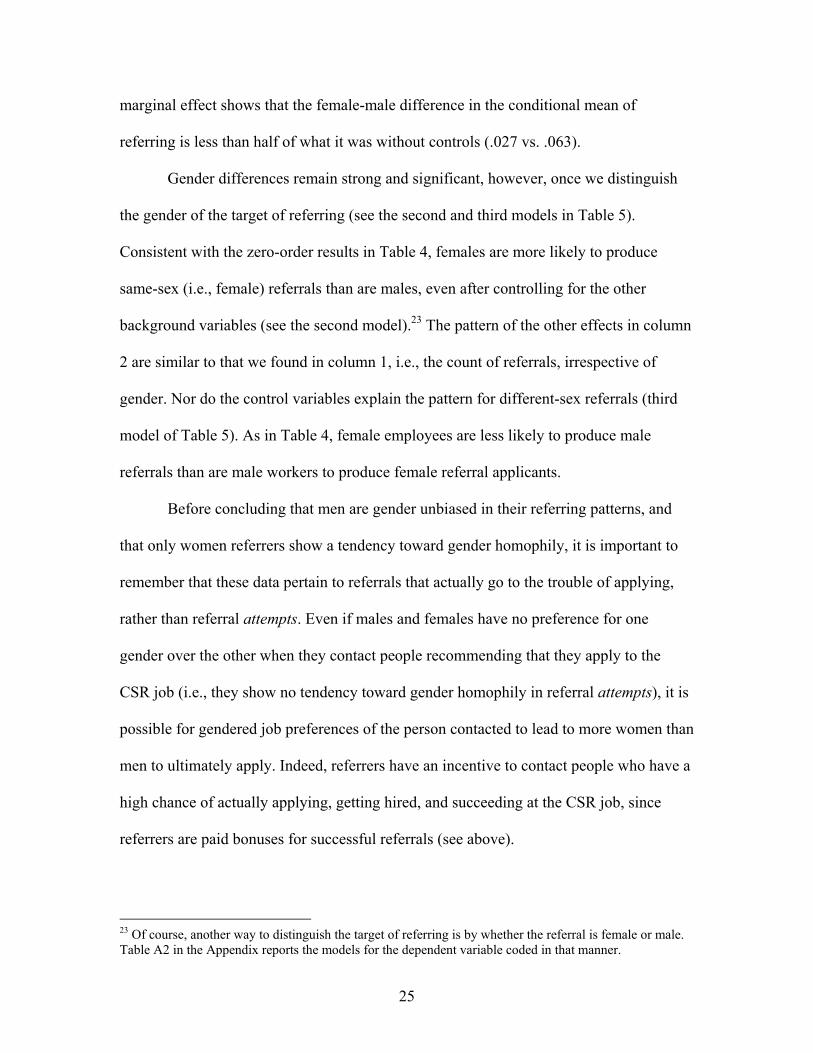
marginal effect shows that the female-male difference in the conditional mean of
referring is less than half of what it was without controls (.027 vs. .063).
Gender differences remain strong and significant, however, once we distinguish
the gender of the target of referring (see the second and third models in Table 5).
Consistent with the zero-order results in Table 4, females are more likely to produce
same-sex (i.e., female) referrals than are males, even after controlling for the other
background variables (see the second model).23 The pattern of the other effects in column
2 are similar to that we found in column 1, i.e., the count of referrals, irrespective of
gender. Nor do the control variables explain the pattern for different-sex referrals (third
model of Table 5). As in Table 4, female employees are less likely to produce male
referrals than are male workers to produce female referral applicants.
Before concluding that men are gender unbiased in their referring patterns, and
that only women referrers show a tendency toward gender homophily, it is important to
remember that these data pertain to referrals that actually go to the trouble of applying,
rather than referral attempts. Even if males and females have no preference for one
gender over the other when they contact people recommending that they apply to the
CSR job (i.e., they show no tendency toward gender homophily in referral attempts), it is
possible for gendered job preferences of the person contacted to lead to more women than
men to ultimately apply. Indeed, referrers have an incentive to contact people who have a
high chance of actually applying, getting hired, and succeeding at the CSR job, since
referrers are paid bonuses for successful referrals (see above).
23 Of course, another way to distinguish the target of referring is by whether the referral is female or male. Table A2 in the Appendix reports the models for the dependent variable coded in that manner.
25
Although we only observe the gender of referrals who wind up applying, we can
make an educated guess as to the size of the gender biasing effect of referring per se by
comparing the referrer-referral gender homophily data in Table 4 to what the gender
distribution of applications would be in the absence of referring, i.e., for the pool of
external non-referral applicants. Female referrers produce applications that are about 10
percent more female than the external non-referral application pool (75.1 vs. 65.0
percent). A nearly similar biasing effect is evident for male referrers: males produce a
referral application pool that is 8.7 percent more male than non-referrals (43.7 vs. 35.0
percent). When considered against the baseline of external non-referrals then, both male
and female referrers do appear to produce referral applications from people of the same
gender as themselves.24
Demand Side Processes: Screening
The net effect of the supply side processes discussed above is to deliver an
application pool that is two-thirds female into the hiring pipeline. Several theories of
gender segregation focus on how it is that male and female candidates differentially
progress through the hiring pipeline. In particular, some demand side theories stress the
gender biasing effects of screeners’ preferences (e.g., Reskin and Roos’ [1990] queuing
theory). Others argue specifically that conscious or unconscious discriminatory attitudes
affect employer screening, and thus the gender composition of candidates as they pass
24 In Fernandez, Castilla and Moore (2000:1309-1314) we tested whether the gendered job preferences of the person contacted alone could account for the observed degree of referrer-referral gender homophily. If gendered attraction to the job alone is leading to a spurious correlation between the gender of referrers and referrals, then gender homophily should also be observed when we randomly match referrers and referrals, and when referrers are randomly paired with non-referrals. The simulated data never met or exceeded the observed levels of gender homophily in 1,000 random pairings of each type (i.e., referrer-referral, and referrer-non-referral). Gendered attraction to the job alone cannot account for this result: the link between specific referrers and referrals needs to be maintained in order to reproduce the observed level of gender homophily.
26
through the stages of the hiring pipeline (Glick, Zion and Nelson 1988; Heilman 1980;
1984).25 With the data available here, we cannot directly distinguish among the various
attitudinal and psychological processes at work in screeners’ minds which might affect
the ways men and women are selected to move on through the hiring pipeline.26 We can,
however, observe the impact of those decisions on the gender composition of candidates
at each stage of hiring, and isolate where it is in the process that gendering is taking place
in the hiring pipeline.
Table 6 shows the gender composition of candidates as they move through the
hiring process by recruitment source. Considering first the data for all recruitment
sources combined (see the fourth row of Table 6), we see that the percentage of women
increases with each successive step in the process, i.e., from 67.1 percent for applicants to
77.7 percent of hires. The biggest jump in the percentage female occurs at the step
between interview and offer (69.2 vs. 77.0 percent). Although we have not controlled for
any background factors on which men and women might differ (see below), this suggests
that the screeners—and especially the hiring managers—are choosing women over men.
One possible explanation for this pattern of findings is that, for a variety of
reasons, employers have a preference for hiring referrals (e.g., Mencken and Winfield
1999; Miller and Rosenbaum 1997; for a concise review, see Fernandez, Castilla and
25 Note that virtually all these studies of discrimination and prejudice are done in simulated or laboratory settings (for a meta-analysis, see Olian, Schwab and Haberfeld 1988). 26 Simply put, we only have data on who is interviewed by the hiring managers, who is offered the job (no one is ever offered a job without being interviewed by a hiring manager), and who accepts the job offer. Moreover, we have only limited information on the characteristics of the specific people involved in screening. We know that decisions on who should be brought in for an interview with hiring managers are based on a screen of the paper applications, and a brief interview, either in person or by telephone. This stage of the process is handled by one of three human resources staff (we cannot identify who), all of whom are women. Applicants who survive this phase of the screening are then sent on for another interview with two hiring managers, who have the final say about extending the candidate a job offer. We cannot identify which particular managers performed these interviews, although we know that they are a mixed gender group.
27
Moore 2000:1290-1298), who in this setting, are more likely to be females. Indeed, such
an explanation is plausible: the percentage of referrals increases with each step in the
process from 36.0 percent of applications, to 38.3 percent of interviewees, to 45.3 percent
of offers, to 45.7 percent of hires.
The differential gender composition of the referral and non-referral pools,
however, does not explain the tendency for females to progress in greater proportion
through the screening steps. Table 6 shows that, with only the exception of internals at
the interview step, the female composition of candidates increases at each stage even
within categories of recruitment source. Except for the slight decline in female
representation for internals (73.7 vs. 74.2), increases in the percentage female are modest
(i.e., 1-3 percent) when moving from the application to interview stage. As we mentioned
above (see note 26), the screening decisions for granting an interview are controlled by
the human resources staff, all of whom are women. However, irrespective of recruitment
source, a larger boost in the percentage female (5-9 percent) occurs at the next step of the
process, where hiring managers extend job offers to interviewees. The vast majority of
these offers are accepted, regardless of recruitment source (acceptance rates are 90
percent for referrals, 94 percent for non-referrals, and 100 percent for internal
candidates). The gendering effect is again small (between 0-1 percent) at this last stage of
the hiring process. This would seem to indicate that the men and women who have
survived to this late phase of the recruitment process do not differ very much in their
level of interest in the job, or the external options these job seekers might be considering.
A suggestion of this latter point comes from the fact that the internal candidates, who are
28
most likely to be limiting their job search to within the firm, accept 100 percent of the
offers, regardless of gender.
A similar conclusion regarding gender differences in applicant’s job alternatives
or level of interest in the job is suggested by the limited data on applicant withdrawals at
earlier stages in the hiring process.27 The gender difference in the rate of application
withdrawal prior to the offer stage is trivial (4.0 percent of females [116 cases] versus 3.8
percent of males [45 cases]) and not statistically reliable (p < .156; LR Chi-square 2.012,
with 1 d.f.). None of the internal candidates withdraw from the application process.
The analyses to this point, however, do not adjust for any background factors on
which men and women might differ, and that could form the basis of screeners’
judgments. In order to control for such background factors, we developed a set of
predictive models of the interview and job offer stages of the hiring process. Table 7
shows the means and standard deviations of the background variables for the interview
and job offer analyses. As we discussed above (see pp. 10-14), we coded the background
27 In contrast to the situation with rejected job offers, there is some ambiguity about how to interpret withdrawn applications. Although we cannot be sure, we suspect that the majority of these withdrawals occurred when the screener called up the applicant to arrange an interview with the hiring manager. Screeners told us that it is very rare for applicants to call asking to have their names removed from consideration. The fact that none of the withdrawals were interviewed by hiring managers is also consistent with this scenario. If we are correct in our suspicion, then it is likely that there are many “undiscovered” withdrawals in the pool of people who the screener did not call up to offer an interview. This suggests that the pool of withdrawals does not simply reflect applicant’s self-selected choices, but is biased by the actions of the screeners. Removing the small group of withdrawals (161) does not change any of the substantive results in Table 6: the corresponding percentages female are 64.8 percent for non-referrals, 69.6 percent for referrals, 74.2 for internals, and 67.0 percent overall. Because we have no way of identifying the “undiscovered” withdrawals, and the “discovered” withdrawals might be endogenous with respect to the interview decision, we have chosen to combine withdrawals and non-withdrawals in the analyses predicting interview (Table 8, and the selection stage of the offer model in Table 9). Here too, the results do not change if we exclude the withdrawals.
29
information from the original application forms, making sure to include the criteria that
the call center screeners look for when reviewing applications.28
In Table 8, we present predictive models of the interview stage of the hiring
process. Model 1 shows that women are 6.2 percent more likely to be granted an
interview than are men (see the marginal effect in column 3). Model 2 introduces the
control variables into the model predicting interview. A number of these factors are
significantly related to being granted an interview. Controlling the other factors,
applicants with computer experience are more likely to be interviewed than applicants
without such experience, while foreign language experience is negatively related to being
interviewed. This latter effect could be due to screeners avoiding applicants with accents.
However, contrary to what we would expect in light of our interviews with
screeners, overeducated applicants are more likely to be interviewed, although the effect
is not statistically reliable.29 Applicants with more customer service experience and more
non-bank experience are more likely to be interviewed than candidates without such
experience. As predicted by human capital theory, the squared term on non-bank
experience is negative indicating that screeners place less value on very high levels of
28 In addition to the variables described above, we included a squared term for non-bank experience in order to capture decay in the value of work experience over time (see Mincer 1974). In preliminary analyses, we examined a number of specifications of the experience variables and found no evidence of diminishing returns to months of banking or customer service experience. Because the unit of analysis is the application (see above) and some people applied multiple times, we also coded a dummy variable to distinguish repeat applicants from first time applicants (1 for repeat applicants, and 0 otherwise). We also control for the state of the market in these analyses by including the number of job openings and the number of applications on the date the candidate applied. Finally, as we mentioned above (see note 9), 25 cases indicated they had been convicted of a breach of trust. None of these cases were ever interviewed or offered a job. Since it is impossible for these people to get hired at the company, we have deleted them from the predictive models. 29 In preliminary analyses, we found that years of education is a positive and statistically significant predictor of being interviewed. Contrary to interviewer’s stated concerns about overeducated candidates (see above), we could find no statistically reliable evidence of highly educated candidates being avoided by screeners (for a similar result, see Fernandez, Castilla and Moore 2000:1325, note 29). Replacing the overeducation dummy variable with a continuous measure of education does not change the other substantive results.
30
labor market experience when making decisions about who to interview. Consistent with
our expectations, applicants who are employed at the time of application, and candidates
who have longer tenures on their last job are significantly more likely to be interviewed
than unemployed applicants or people with shorter tenure on their last job. Screeners are
less likely, however, to grant interviews to candidates with high wages on their last job.30
The state of the market also affects the propensity of the candidate to be interviewed.
Although the number of applications received on the same day as the candidate applied is
not a significant predictor of being interviewed, candidates applying when there are many
openings are more likely to be interviewed.
For our purposes, the most important finding is that, even after controlling for this
impressive array of background factors, the coefficient for gender is strong and
statistically reliable in Model 2. After controls, women are 4.7 percent more likely to be
interviewed than are males. This 4.7 percent figure is 76 percent of the 6.2 percent
advantage that females enjoy before controls are added. Thus, only a small part of the
preference that recruiters demonstrate for females is explained by the background factors
in model 2.
Nor does recruitment source account for the advantage that females have in being
granted interviews. Model 3 adds dummy variables distinguishing external referrals and
internals from external non-referrals. Controlling other factors, referrals are 7 percent
more likely to advance to the interview phase than are non-referrals (for a detailed
analysis of referral advantages in screening, see Fernandez, Castilla and Moore 2000).
While substantial, the apparent preference that recruiters give to internals is more than
30 Entering the last wage variable as a continuous variable measured in dollars shows a significant negative effect on the chances of being interviewed. Here, too, the substantive results do not change if we substitute the continuous measure of wage for the high wage dummy variable.
31
double the referral advantage: internal candidates are 17.8 percent more likely to be
granted interviews than external non-referrals. Although women are overrepresented
among applicants from both these recruitment sources (see Table 6), the results of model
3 show that females are 4.6 percent more likely to advance to the interview stage even
after controlling for recruitment source.31
Table 9 presents the models for the job offer stage. Since no one was ever hired
without an interview, it is possible that selection bias may affect our estimates of the job
offer stage model. For this reason, we control for selection bias using a bivariate probit
model with selection, which is the appropriate statistical procedure when both the
ultimate dependent variable (job offer) and the selection criterion (interview) are
dichotomous (see Fernandez and Weinberg 1997).32
Model 1 presents the results of a bivariate probit model which includes all the
regressors from the interview stage (Table 8, Model 3) in the interview selection step, and
just the dummy variable for gender in the equation predicting job offer. As would be
expected, the results of the interview selection step are very similar to those in Table 8. 31 We examined whether there were interactions between gender and recruitment source. We found no such interactions with respect to referrals: gender and referral effects worked in an additive fashion. With respect to internals, the story is more complicated. Adding gender x internal and gender x referral interaction terms to model 3 shows no significant effect for gender x referral, but a significant negative effect for gender x internal. Further inspection of the data showed, however, that this effect is not substantive and is entirely accounted for by the changing of the case base due to listwise deletion of missing cases (see Appendix Table A3). The top panel of the table shows no evidence of a significant gender x internal interaction when the entire sample is used. In Panel B, which shows the analyses for the subset of cases that are left after listwise deletion of missing cases from the models estimated in Table 8, the gender x internal interaction effect is strong and significant (Z-value of -2.14). In contrast, the missing data mechanism does not substantively affect the results with respect to the other two recruitment sources (c.f. Panels A and B of Table A3). 32 As we discuss in Fernandez, Castilla and Moore (2000), the hiring process at the phone center is organized in such a way to make it very difficult to identify selection bias. To the extent that recruiters are successful in mimicking the behavior of the hiring managers, the recruiters’ actions become indistinguishable from those of the hiring managers. In the limit, one can consider them becoming hiring managers. Indeed, recruiters were granted such hiring authority after our field period ended. Our main strategy for addressing the challenge of selection bias in this setting is to define instrumental variables for the analyses (see note 33 below). The net result of these analyses, however, is that our central findings are robust to whether or not we control for selection bias.
32
The rho parameter—the correlation between the errors of the two stages—is statistically
significant, indicating that there is evidence of selection bias. Even after controlling for
the interview selection factors, however, the marginal effect for gender in the offer stage
shows that females are 4.9 percent more likely to be offered a job than are males.
Model 2 adds a number of regressors to the offer stage of the model. Comparing
the log likelihoods (c.f. Models 1 and 2) shows that adding these factors significantly
improve the fit of the model (p < .01, LR X 2 = 26.686, with 12 d.f.). Also, the rho
parameter is no longer significant. Most important for our purposes, however, females
appear to be preferred over males, even after controlling for other factors on which hiring
managers are screening (marginal effect 5.9 percent).
Model 3 adds dummy variables for recruitment source to the offer stage of the
equation.33 Here, too, rho is not significantly different from zero indicating little evidence
of selection bias. The log-likelihoods (c.f. Models 2 and 3) show that adding these
dummy variables improves the fit of the model over and above the other background
factors (p < .0001, LR X 2 = 58.850, with 2 d.f.). The marginal effects for recruitment
source show an interesting pattern. Hiring managers and HR recruiters express roughly
similar degrees of preference for referrals over non-referrals. Recruiters show a 7.0
percent marginal effect for referrals at the interview stage, while the hiring managers’
preference for referrals at the job offer step is 7.7 percent. The contrast between the
recruiters’ and the hiring managers’ behavior with respect to internal candidates is huge, 33 Note that we have excluded the application behavior variables (number of applications and number of job openings) from the offer stage of Models 2 and 3 in Table 9. In so doing, we are treating these variables as instruments—variables that, by assumption, affect the selection stage, but not the substantive stage. Without instruments, the bivariate probit model with selection is only weakly-identified off of the non-linearity of the selection effect. In this setting, this is tantamount to arguing that the recruiters worry about the state of the market when deciding who to interview, but that line managers have delegated concerns about the state of the market to the HR department when deciding job offers. Relaxing this assumption (see Appendix B) does not change our central conclusions with respect to gender.
33
however. Controlling other factors, internals are 17.6 percent more likely than external
non-referrals to be sent on for an interview with hiring managers. However, the marginal
effect for internals at the job offer stage is more than double this rate: hiring managers are
37.2 percent more likely to extend job offers to internals than external non-referrals.
None of these factors, however, explain the tendency for more females than males to
advance through the hiring stages. Consistent with the descriptive analyses in Table 6,
hiring managers’ preference for females is over and above their bias in favor of referrals
and internals: females are 4.2 percent more likely to be offered jobs than are males even
after controlling applicant background factors and recruitment source.34
The final step of the hiring process is offer acceptance (see last column of Table
6). In contrast to the interview and offer decisions which are made by company
personnel, the decision to accept or reject the offer is made by the candidate. Since wage
offers are constant,35 gender differences at this final stage are more likely to reflect
candidates’ feelings of fit for the job or other employment options than screeners’
preferences for one gender over another. Unfortunately, we are at the limits of our data in
this case. Due to the small number of cases that have survived to this stage, we lack
sufficient statistical power to say anything about gender differences in offer acceptance
rates. In preliminary analyses, we found that none of these differences are statistically
reliable.36
34 Here, too, we found no evidence of interactions between gender and recruitment source. 35 The company has a policy of not negotiating wage offers for the CSR job. For all candidates, the wage being offered is a constant $8.25 per hour. 36 Overall, females show a higher acceptance rate of offers: 93.6 percent for females vs. 89.4 for males, but this difference is not statistically reliable (p = .170, LR X 2 = 1.887, with 1 d.f.). Looking within recruitment source, we find that, regardless of gender, 100 percent of the offers to internals (10 males and 39 females) were accepted. For external non-referrals, the gender difference in acceptance rates is only one percentage point (89.4 percent of males and 90.4 percent of females accept the job). The largest gender difference in the rate of offer acceptance is for the external referrals, where 95.2 percent of females and 88.9 percent of
34
Discussion
Although we can never be certain that we have controlled for all the relevant
gender differences in background factors, the analyses in the previous section suggest
that in this setting recruiters’ and hiring managers’ preferences—perhaps unconscious—
significantly contribute to the gendering of the CSR job. In this respect, the latter findings
are consistent with statistical discrimination mechanisms (e.g., Phelps 1972; Aigner and
Cain 1977). In the absence of cheaply available information about the quality of the
person being screened, statistically discriminating employers treat each applicant like the
average applicant from their gender or race group. While we think this process may well
be going on, it is also possible that these screening decisions may reflect gender
differences in CSR performance. In order to check for this possibility, we examined
whether there are gender differences in post-hire data on employee performance.
While exceptionally accurate and objective performance measures are kept for
CSRs at the phone center,37 there is no evidence of significant male-female differences in
the key performance measures used at the phone center (see Castilla 2002). While the
small number of cases (N=290) for whom these various measures are available for study
males accept offers. But this difference, too, is not statistically significant (p = .182, LR X 2 = 1.780, with 1 d.f.). The lack of significant gender differences also does not appear to be due to suppressor effects of other control variables. We estimated a series of predictive models of offer acceptance using various combinations of the variables listed in Table 7. Gender is never significant in any of these predictive models; for that matter, neither are any of the control variables. 37 CSRs receive up to 5,000 customer inquiries from incoming phone calls per month, and a computer system randomly routes these phone calls to the next available CSR. This latter feature of the system means that the difficulty of the inquiries has been randomized across CSRs. Supervisors often monitor employee’s phone conversations in order to ensure that courtesy and accuracy goals are being met. In addition, the computer system automatically records extensive information on each CSR’s “handletime,” i.e., how much time a CSR takes to complete each phone call. Conditional on a sufficient level of accuracy and courtesy, in this setting, employees who can get off the phone more quickly (i.e., have lower average handletimes) are more productive than CSRs who dispatch customers more slowly. This is because the longer the handletime, the fewer calls the CSR is available to receive, the more staff is required to handle a given volume of phone calls, and the more time customers will be made to wait on hold. For more detail about the performance measurement system at the phone center, see Castilla (2002).
35
might be hindering this assessment, there is no reliable evidence of gender differences in
the performance measures they collect in these analyses.38 The insignificant differences
that do appear (e.g., 0.5 calls per hour against a mean of 20 calls per hour) virtually
always favor males over females. At least by these relatively objective criteria, we cannot
explain the preference that screeners in this setting show for females by a simple appeal
to females’ performance advantages in this job.
We explicitly asked HR screeners and hiring managers whether men or women
are better suited to the CSR job. Although their responses might be constrained by
desirability bias, they all claimed that both men and women do equally good jobs as
CSRs. These people would often provide anecdotal examples of good male and female
CSRs. We pointed out that there were a lot of women employed as CSRs; the supervisor
of the screeners responded that she had noticed that, and she hoped that we would be able
to shed some light on why this is the case.
Although we can only speculate, our fieldwork in the call center has led us to
think that the observed preference for females that we have documented might have its
roots in subtle processes of the gender encoding of what screeners think of as good job
performance for customer service interactions (for a review of the role of gender in
service delivery, see Gutek, Cherry and Groth 1999). When we asked the call center
managers who they considered ideal performers on the job, they suggested that we
monitor the phone calls of “two of their best CSRs,” who they described as “both
38 Specifically, Castilla (2002) reports analyses of both raw and quality adjusted handletime, and turnover. He presents numerous models predicting various aspects of performance, including initial performance after the two-month training period, initial performance controlling for selection, turnover during training, post-training turnover, performance growth, and performance growth controlling for selection due to turnover. Gender is never significant in any of these models.
36
excellent, but for different reasons.” With the workers’ permission, we listened in on
several calls handled by each of these workers.
These workers—one male and one female—had dramatically contrasting styles of
interaction on the phone. While both workers spoke very clearly and succinctly, the male
CSR spoke very quickly. Although he was polite in his interactions (e.g., not interrupting
the customer as they spoke), his quick, focused responses left the impression that he was
a very busy person, and did not have time to waste. At least in our reading of these
interactions, while this CSR did not go to the point of seeming impatient with customers,
he was definitely leaning in that direction. Customers appeared to pick up on these cues,
and seemed to speak more quickly themselves over the course of their phone calls. The
net result appeared to us to be a series of clear, efficient, but somewhat curt interactions.
In contrast, the female CSR spoke much more slowly, and we did not sense the
customer speeding up as her calls progressed. She spoke distinctly, and precisely, but was
relatively leisurely in her style. Customers seemed to sense her as a warm person, and
would often open ancillary lines of discussion that were not immediately relevant to the
topic at hand. In a particularly dramatic example of this, one female customer who had
recently been widowed and was calling to clear up questions about her husband’s
financial affairs, felt comfortable enough to confide her feelings of despair and loneliness
to the female CSR. Her reaction to this customer was to be kind and gentle in her tone of
speaking. She went further to encourage the customer to place her faith in God, that He
would help her through this trying time.
The call center managers were certainly aware of this dramatic contrast in styles,
and indeed, were ambivalent about which was the superior style between them. They said
37
that the ideal CSR was a combination of these two, but they recognized that they were
probably impossible to combine. They described the male CSR as having an excellent
handletime, while still meeting or exceeding the phone center’s customer courtesy and
accuracy goals. While the managers were concerned that the female CSR’s handletime
was not as fast as they would like, they praised her for being someone who could foster
customer loyalty, even within the difficult limits of a fleeting call center interaction. The
managers saw that the emotional work that the female CSR was doing was a key part of
customer courtesy, and that was likely to take time. In contrast, the “on-the-edge-of-
impatient” style of the male CSR might run the risk of seeming officious to customers.
We suspect that managers are correct in this interpretation: we do not imagine that the
same widow, who felt so comfortable with the female CSR, would even be tempted to
open up to the male CSR in the same way.39
As much research has shown (Hochschild 1983; Leidner 1991, 1993), the contrast
in the emotional work between the two styles typified by these two CSRs evoke sex-role
stereotypes that spillover from domains other than work. Another factor that would serve
to invite such spillovers is that there is considerable uncertainty with respect to how to
screen for these workers. Indeed, the screeners freely admitted to us that they found it
quite difficult to discern who is likely to be a good CSR. To work at a phone center,
fielding up to 5,000 phone calls a month in a high-pressure, highly-structured
environment where work is closely scrutinized, demands a set of skills for which it is
39 In this setting, the entry-level CSRs we have studied are exclusively assigned to inbound calls, and cannot dial phone calls out. Consequently, they have no way of reestablishing a contact with a specific client. Nor do customers have any way of asking to be served by a specific CSR. In Gutek et al.’s (2000) useful terms, these features of the technology make these customer service interactions much closer to “encounters” than “relationships.” Seen in this light, the male CSR’s style is much closer to an encounter, while the female CSR stretches toward the relationship end of the continuum (in Gutek et al. [2000] vocabulary, a “pseudo-relationship”) despite the strictures of the technology.
38
relatively difficult to screen. As we reported in Fernandez, Castilla and Moore (2000),
one of the recruiters put it this way:
If you look at the paper requirements to do this job, they are not heavy. You don’t need a degree to do this job. This job can be done by people with average intelligence. People rarely leave because they can’t do the job. The real question is are you going to be able to deal with the work environment. Much research shows that in the face of uncertainty, stereotypes become more
salient in decisionmaking (e.g., Fiske and Taylor 1991; Hilton and von Hippel 1996). The
screeners at the firm seem unlikely to be immune to the gender stereotype of the
“nurturing” female (see Glick and Fiske [2001] on benevolent sexism). The fact that the
interviewing process seems to produce the largest boost in the percentage of women is
consistent with the idea that it is the interaction with the candidate that seems to activate
the stereotypical conception of gender (Ridgeway 1997). If we are correct in these
speculations, then it is not simple coincidence that the CSRs we were directed to monitor
as exemplars of the two ways of being excellent CSRs were of different genders. While
they may feel genuinely ambivalent about choosing between the efficient (“male”) and
supportive (“female”) styles, our findings suggest that, on the ground, they may in fact be
shading their choices toward the more supportive definition of CSR performance.40 With
these actions, they have subtly, and probably unwittingly, contributed to the gendering of
the CSR job in this setting.
Summary and Conclusions
40 If this interpretation is right, then screeners would have to be deemphasizing the importance of handletime “efficiency” at the margin as they screen candidates. Although the differences are never statistically significant, the fact that the handletime performance measures were generally better for males, is consistent with the idea that the handletime constraint might be being relaxed for females during screening. In so doing, they would be giving the benefit of the doubt to female candidates, who they view as more likely to deliver on the more difficult to measure dimension of performance.
39
The patterns we have documented here have several important implications for
our understanding of the gender segregation of jobs. This work is unusual in its ability to
distinguish among various gender segregating processes that are alleged to occur in the
hiring pipeline. Starting with the pre-application phase, while we cannot rule out that
gender differences in tastes may be playing some part in the skewed nature of the initial
application pool, our analyses suggest that gender wage inequality in the open labor
market is likely to be a contributing factor. The male distribution of applicants’ past
wages dominates the female distribution over virtually the entire range (Figures 1 and 2).
The “adjusted pool” simulations suggest that the firm’s policy of offering a fixed wage of
$8.25 per hour likely has the effect of attracting proportionately more women than men to
apply. Moreover, the multivariate analyses show that screeners’ disfavoring of people
who are coming from jobs where they are paid more than the offered wage of $8.25 has
the effect of screening out more men than women as they progress though the hiring
pipeline.
We also found stark evidence that clearly supports arguments that pre-hire
network processes contribute to the gender skewing of jobs. In these data, the pool of
employee referral applicants is even more female than the pool of non-referrals.
Examining the origins of these ties, we found that women are overrepresented among the
potential initiators of referral ties (i.e., employees working at the call center), as well as
the population originating referral applications to the CSR job. Moreover, we found clear
evidence of gender homophily in the referring process: referrers of both genders tend to
produce same sex referrals.
40
While these network factors certainly contributed to the gendering of the early
phase of the recruitment process (specifically, the formation of the application pool), the
network mechanisms cannot provide a complete explanation of the gendering of the CSR
job. In order to complete the picture, we need to consider the behavior of the actors on
the demand side of this market interface. We found that in making their screening
decisions, screeners and hiring managers appeared to prefer internals and employee
referrals, categories which were both composed of a higher proportion of women than
external non-referrals. Even within categories of recruitment source, females seem to
have been given the benefit of the doubt in screening decisions, resulting in a further
skewing of the population of candidates toward females. Apparently, being a referral did
not substitute for whatever advantages screeners were attributing to females in this
setting: on the contrary, referral background and the screens combined additively, such
that among hires, the highest percentage of females is found among referrals (81.4
percent). As a final point, although we can only speculate, our interviews with screeners
suggest to us that managers at the company might have been enacting gendered notions
of what makes for good customer service interactions when making these screening
decisions.
As we see it, our study has important methodological implications for studies of
gender based job segregation. While the literature on gender segregation of jobs often
invokes gender sorting mechanisms that operate pre-hire, the data that are used to
empirically examine these processes are almost always collected on post-hire
populations. Consequently, it has been difficult to distinguish the various processes that
may be at work in producing gender segregation. Simply put, this lack of fit between
41
theory and data make it dangerous to conclude anything about the presence or absence of
pre-hire gender sorting mechanisms on the basis of post-hire data, which reflect the net
effects of various pre-hire processes.
As an illustration, we offer Table 10, which is a cross-tabulation of the gender of
referrers and referrals based solely on post-hire data. In sharp contrast to Table 4, where
we saw ample evidence of one of the key network mechanisms that is cited as a source of
gender segregation of jobs—gender homophily in the employee referral process—Table
10 shows no evidence whatsoever in support of gender homophily. Although gender
homophily in the referral process has clearly contributed to the early stages of the process
by which this job has become gender segregated, a research strategy which starts with
hires (e.g., Leicht and Marx 1997; Mencken and Winfield 2000; Neckerman and
Fernandez 1997), would miss this fact in this setting. Since it is quite common for
researchers to invoke gender homophily of job finding networks as an explanation for
gender segregation, the comparison of Tables 4 and 10 should strike a cautionary note for
researchers in this area.
As a final consideration, we see this paper as contributing in significant ways to
the conceptual grounding and clarification of the theoretical mechanisms at work in
theories of job segregation by gender. The story we have told is necessarily multifaceted,
and in this respect, bears some resemblance to the dénouement of the murder mystery
novel Murder on the Orient Express where all the suspects did it. In this setting, we can
say with assurance that all of the factors we examined—pre-application choices, pre-
application gender homophily of networks, and screeners’ actions—played a significant
role in the gender segregation of the CSR job in this setting. Not only have we been able
42
to isolate the processes, but close analyses of these very special data have yielded
important insights on how these factors have interacted in the many links in the hiring
process. Especially in light of the complicated and overlapping nature of the predictions
of theories of job segregation by gender, our ability to empirically distinguish among
these mechanisms constitutes an important step forward for this literature. If we are to
attain a deep understanding of the social processes that sort men and women into distinct
jobs, we suggest that future research in this area needs to move beyond the post-hire,
“black box” treatment of the core processes that produce the gender segregation of jobs.
In our view, we are unlikely to make much progress in this important field without the
kind of close analyses of carefully designed and collected data such as those we have
offered here.
43
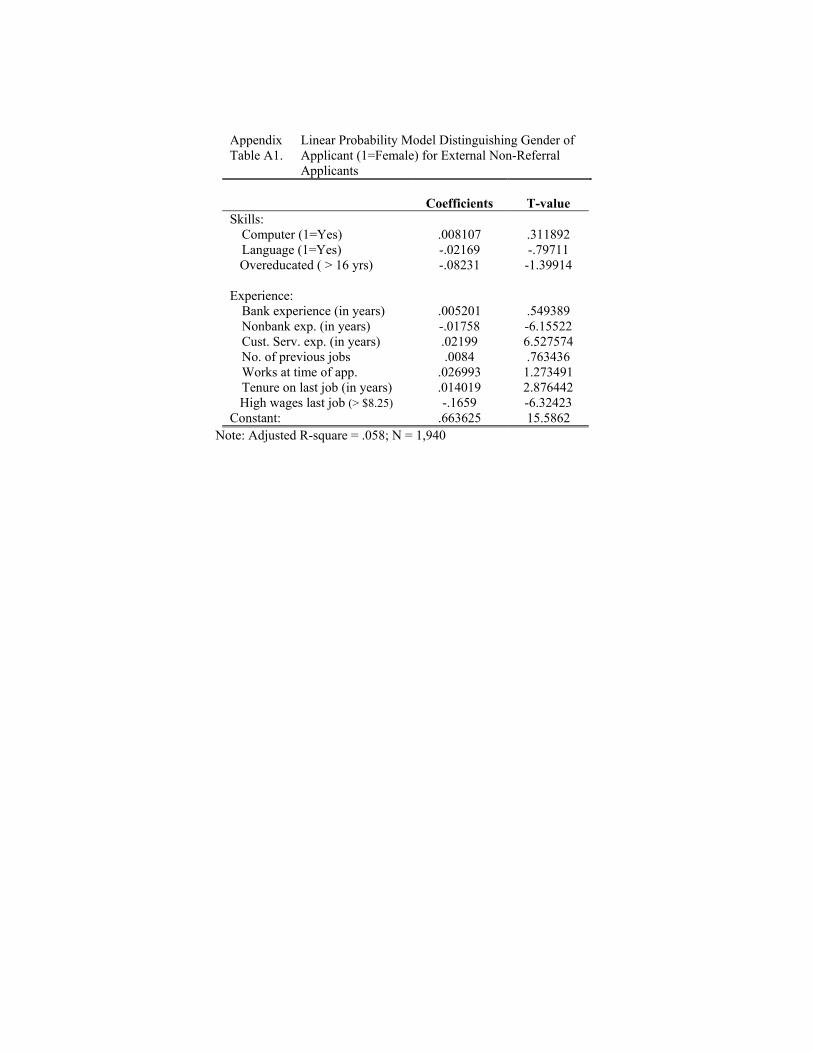
Appendix Table A1.
Linear Probability Model Distinguishing Gender of Applicant (1=Female) for External Non-Referral Applicants
Coefficients T-value Skills:
Computer (1=Yes) .008107 .311892 Language (1=Yes) -.02169 -.79711
Overeducated ( > 16 yrs) -.08231 -1.39914 Experience:
Bank experience (in years) .005201 .549389 Nonbank exp. (in years) -.01758 -6.15522 Cust. Serv. exp. (in years) .02199 6.527574 No. of previous jobs .0084 .763436 Works at time of app. .026993 1.273491 Tenure on last job (in years) .014019 2.876442
High wages last job (> $8.25) -.1659 -6.32423 Constant: .663625 15.5862
Note: Adjusted R-square = .058; N = 1,940
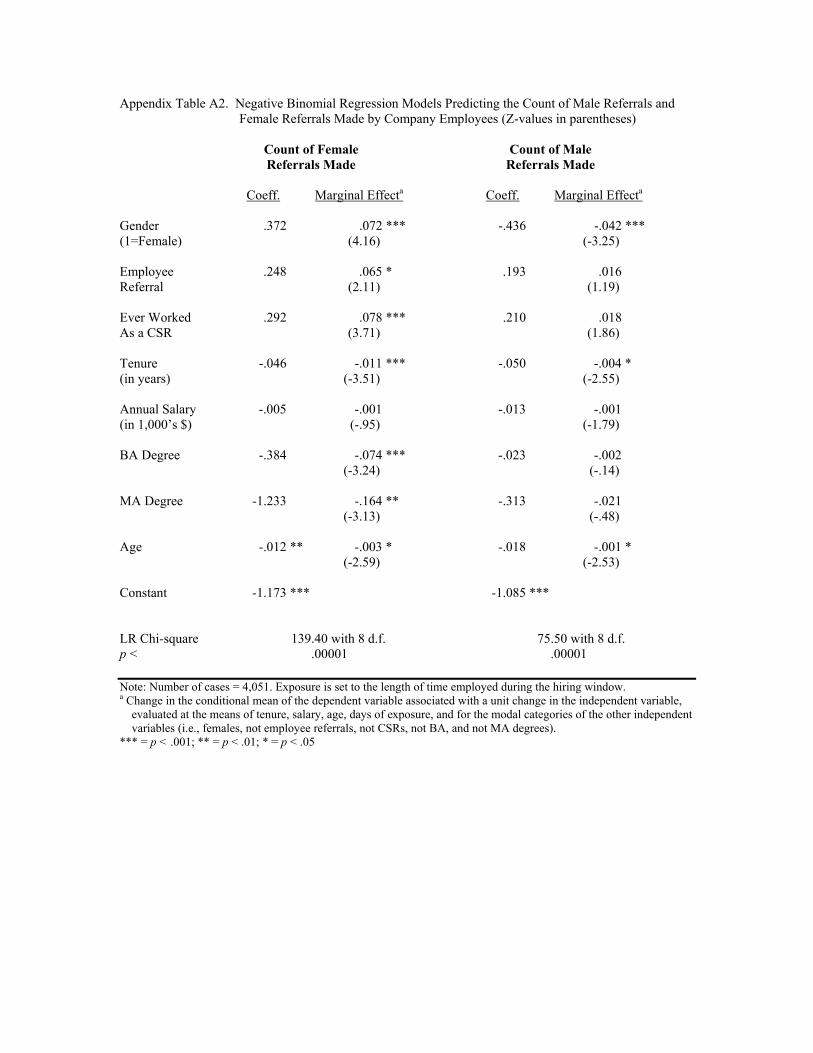
Appendix Table A2. Negative Binomial Regression Models Predicting the Count of Male Referrals and Female Referrals Made by Company Employees (Z-values in parentheses)
Count of Female Count of Male Referrals Made Referrals Made Coeff. Marginal Effecta Coeff. Marginal Effecta Gender .372 .072 *** -.436 -.042 *** (1=Female) (4.16) (-3.25) Employee .248 .065 * .193 .016 Referral (2.11) (1.19) Ever Worked .292 .078 *** .210 .018 As a CSR (3.71) (1.86) Tenure -.046 -.011 *** -.050 -.004 * (in years) (-3.51) (-2.55) Annual Salary -.005 -.001 -.013 -.001 (in 1,000’s $) (-.95) (-1.79) BA Degree -.384 -.074 *** -.023 -.002 (-3.24) (-.14) MA Degree -1.233 -.164 ** -.313 -.021 (-3.13) (-.48) Age -.012 ** -.003 * -.018 -.001 * (-2.59) (-2.53) Constant -1.173 *** -1.085 *** LR Chi-square 139.40 with 8 d.f. 75.50 with 8 d.f. p < .00001 .00001 Note: Number of cases = 4,051. Exposure is set to the length of time employed during the hiring window. a Change in the conditional mean of the dependent variable associated with a unit change in the independent variable,
evaluated at the means of tenure, salary, age, days of exposure, and for the modal categories of the other independent variables (i.e., females, not employee referrals, not CSRs, not BA, and not MA degrees).
*** = p < .001; ** = p < .01; * = p < .05
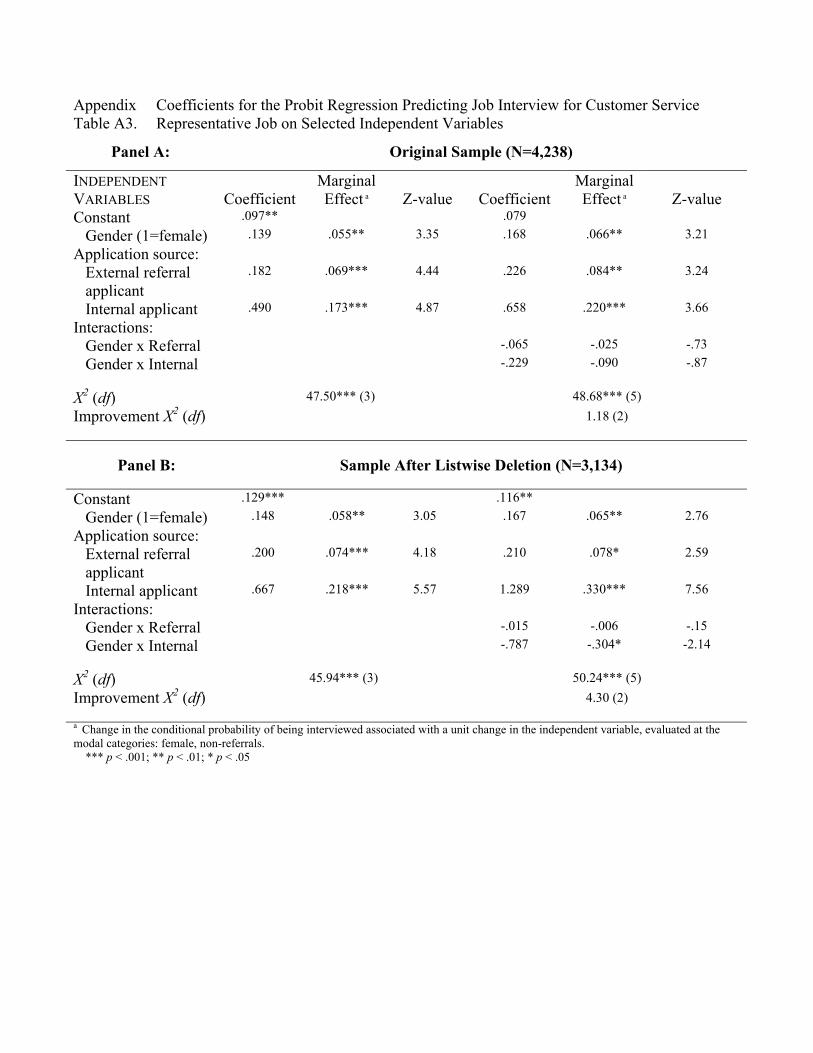
Appendix Table A3.
Coefficients for the Probit Regression Predicting Job Interview for Customer Service Representative Job on Selected Independent Variables
Panel A: Original Sample (N=4,238)
INDEPENDENT VARIABLES Coefficient
Marginal Effect a Z-value Coefficient
Marginal Effect a Z-value
Constant .097** .079 Gender (1=female) .139 .055** 3.35 .168 .066** 3.21
Application source: External referral applicant
.182 .069*** 4.44 .226 .084** 3.24
Internal applicant .490 .173*** 4.87 .658 .220*** 3.66 Interactions:
Gender x Referral -.065 -.025 -.73 Gender x Internal -.229 -.090 -.87
X2 (df) 47.50*** (3) 48.68*** (5) Improvement X2 (df) 1.18 (2)
Panel B: Sample After Listwise Deletion (N=3,134)
Constant .129*** .116** Gender (1=female) .148 .058** 3.05 .167 .065** 2.76
Application source: External referral applicant
.200 .074*** 4.18 .210 .078* 2.59
Internal applicant .667 .218*** 5.57 1.289 .330*** 7.56 Interactions:
Gender x Referral -.015 -.006 -.15 Gender x Internal -.787 -.304* -2.14
X2 (df) 45.94*** (3) 50.24*** (5) Improvement X2 (df) 4.30 (2)
a Change in the conditional probability of being interviewed associated with a unit change in the independent variable, evaluated at the modal categories: female, non-referrals. *** p < .001; ** p < .01; * p < .05
Appendix B: Models Without Instruments
We explored whether we could obtain estimates of the bivariate probit model of
job offer without assuming that screeners only take the number of job openings and the
number of applicants into account at the interview stage. Model 2 in Appendix Table B1
shows the estimates when working with the full model where all of the variables in
Model 3 of Tables 7 are included in both the interview and job offer equations.
Comparing the log likelihoods for Model 2 in Table B1 with Model 3 in Table 8 yields a
chi-square below the critical value for statistical significance (p < .055, LR X 2 = 5.808,
with 2 d.f.) Thus, the addition of the two instruments does not significantly improve the
fit of the model. Moreover, this model of the process shows a very similar pattern of
relationships between the independent variables and job offer as that produced by a probit
regression which ignores selection (c.f. the marginal effects of Model 1 and Model 2 in
Table B1). In this case, however, very few of the offer stage variables are statistically
reliable. This lack of significance is due to collinearity between the two stages. Although
the parameters are not very different between Models 1 and 2 in Table B1, introducing
the selection correction substantially increases the standard errors, and thus reduces the
Z-values. Note that the rho parameter is not statistically different from zero, indicating
that selection effects are not significant in Model 2 of Table B1.
Irrespective of whether we correct for selection, the parameter for gender is
statistically reliable in Table B1. Thus, the conclusion that hiring managers appear to
prefer women to men is robust to whether or not we control for selection bias, and to our
assumptions about instruments.
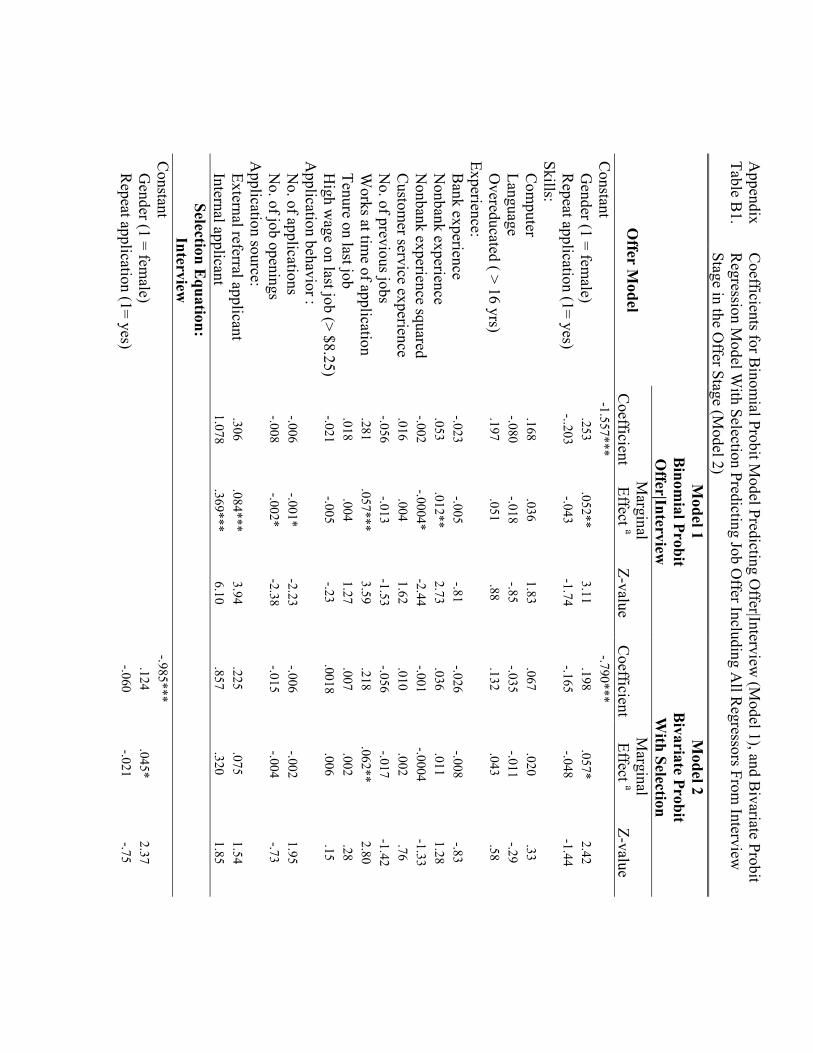
Appendix
Table B1.
Coefficients for B
inomial Probit M
odel Predicting Offer|Interview
(Model 1), and B
ivariate Probit R
egression Model W
ith Selection Predicting Job Offer Including A
ll Regressors From
Interview
Stage in the Offer Stage (M
odel 2)
Model 1
Binom
ial Probit O
ffer|Interview
Model 2
Bivariate Probit
With Selection
Offer M
odel C
oefficient M
arginal Effect a
Z-value C
oefficient M
arginal Effect a
Z-value
Constant
-1.557***
-.790***
G
ender (1 = female)
.253
.052**3.11
.198.057*
2.42R
epeat application (1= yes) -..203
-.043-1.74
-.165-.048
-1.44Skills:
C
omputer
.168.036
1.83.067
.020.33
Language -.080
-.018-.85
-.035-.011
-.29O
vereducated ( > 16 yrs) .197
.051.88
.132.043
.58Experience:
B
ank experience -.023
-.005-.81
-.026-.008
-.83N
onbank experience .053
.012**2.73
.036.011
1.28N
onbank experience squared -.002
-.0004*-2.44
-.001-.0004
-1.33C
ustomer service experience
.016.004
1.62.010
.002.76
No. of previous jobs
-.056-.013
-1.53-.056
-.017-1.42
Works at tim
e of application .281
.057***3.59
.218.062**
2.80Tenure on last job
.018.004
1.27.007
.002.28
High w
age on last job (> $8.25) -.021
-.005-.23
.0018.006
.15A
pplication behavior : N
o. of applications -.006
-.001*-2.23
-.006-.002
1.95N
o. of job openings -.008
-.002*-2.38
-.015-.004
-.73A
pplication source:
External referral applicant .306
.084***3.94
.225.075
1.54Internal applicant
1.078.369***
6.10.857
.3201.85
Selection Equation:
Interview
Constant
-.985***G
ender (1 = female)
.124.045*
2.37R
epeat application (1= yes) -.060
-.021-.75
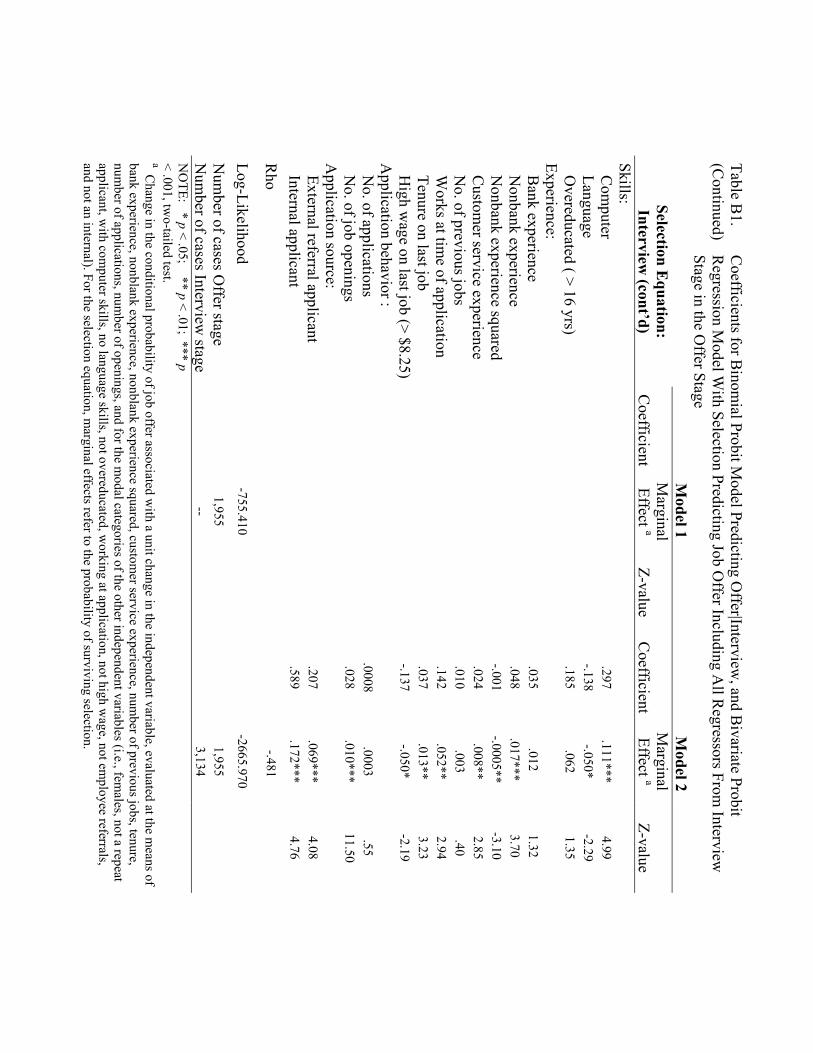
Table B
1. (C
ontinued) C
oefficients for Binom
ial Probit Model Predicting O
ffer|Interview, and B
ivariate Probit R
egression Model W
ith Selection Predicting Job Offer Including A
ll Regressors From
Interview
Stage in the Offer Stage
M
odel 1 M
odel 2 Selection E
quation: Interview
(cont’d) C
oefficient M
arginal Effect a
Z-value C
oefficientM
arginal Effect a
Z-value
Skills:
C
omputer
.297.111***
4.99Language
-.138-.050*
-2.29O
vereducated ( > 16 yrs) .185
.0621.35
Experience: B
ank experience .035
.0121.32
Nonbank experience
.048.017***
3.70N
onbank experience squared -.001
-.0005**-3.10
Custom
er service experience .024
.008**2.85
No. of previous jobs
.010.003
.40W
orks at time of application
.142.052**
2.94Tenure on last job
.037.013**
3.23H
igh wage on last job (> $8.25)
-.137-.050*
-2.19A
pplication behavior :
No. of applications
.0008.0003
.55N
o. of job openings .028
.010***11.50
Application source: External referral applicant
.207.069***
4.08Internal applicant
.589.172***
4.76
Rho
-.481
Log-Likelihood -755.410
-2665.970
Num
ber of cases Offer stage
1,9551,955
Num
ber of cases Interview stage
--3,134
NO
TE: * p < .05; ** p < .01; *** p < .001, tw
o-tailed test.
a Change in the conditional probability of job offer associated w
ith a unit change in the independent variable, evaluated at the means of
bank experience, nonblank experience, nonblank experience squared, customer service experience, num
ber of previous jobs, tenure, num
ber of applications, number of openings, and for the m
odal categories of the other independent variables (i.e., females, not a repeat
applicant, with com
puter skills, no language skills, not overeducated, working at application, not high w
age, not employee referrals,
and not an internal). For the selection equation, marginal effects refer to the probability of surviving selection.
References
Aigner, Dennis and Glen Cain. 1977. “Statistical Theories of Discrimination in Labor Markets.” Industrial and Labor Relations Review 30:175-87.
Baron, James N. and William T. Bielby. 1986. “The proliferation of job titles in
organizations.” Administrative Science Quarterly 31:561-86. Becker, Gary S. 1981. A Treatise on the Family. Cambridge, MA: Harvard University
Press. __________. 1985. “Human capital, effort, and the sexual division of labor.” Journal of
Labor Economics 3:33-58. Berger, Jacqueline. 1995. “Were you referred by a man or a woman? gender of contacts
and labor market outcomes.” Working Paper #353, Industrial Relations Section, Princeton University.
Betz, Michael and Lenahan O’Connell. 1989. “Work orientations of males and females:
exploring the gender socialization approach.” Sociological Inquiry 59:318-30. Bielby, Denise D. and William T. Bielby. 1984. “Work commitment, sex-role attitudes,
and women’s employment.” American Sociological Review 49:234-47. __________. 1988. “She works hard for the money: household responsibilities and the
allocation of work effort.” American Journal of Sociology 93:1031-59. Brass, Daniel J. 1985. “Men’s and women’s networks: a study of interaction patterns and
influence in an organization.” Academy of Management Journal 28:327-43. Cameron, A. Colin and Pravin K. Trivedi. 1998. Regression Analysis of Count Data.
New York: Cambridge University Press. Campbell, Karen E. 1988. “Gender differences in job-related networks.” Work and
Occupations 15:179-200. Castilla, Emilio J. 2002. “Social Networks and Employee Performance.” Ph.D.
Dissertation. Department of Sociology, Stanford University. Corcoran, Mary, Linda Datcher, and Greg J. Duncan. 1980. “Information and influence
networks in labor markets.” Pp. 1-37 in Greg J. Duncan and James N. Morgan (eds.), Five Thousand American Families: Patterns of Economic Progress. Institute for Social Research, University of Michigan.
Drentea, Patricia. 1998. “Consequences of women’s formal and informal job search methods for employment in female-dominated jobs.” Gender and Society 12:331-38.
England, Paula. 1982. “The failure of human capital theory to explain occupational sex
segregation.” The Journal of Human Resources 17 (3):359-70. __________. 1984. “Wage appreciation and depreciation: a test of neoclassical economic
explanations of occupational sex segregation.” Social Forces 62 (3):726-49. England, Paula, Melissa Herbert, Barbara Stanek Kilbourne, Lori Reid and Lori
McCreary Megdal. 1994. “The gendered valuation of occupation and skills: earnings in the 1980 Census occupations.” Social Forces 73:65-98.
Fernandez, Roberto M. and Emilio Castilla. 2001. “How much is that network worth?
Social Capital in Employee Referral Networks.” Pp. 85-104 in Nan Lin, Karen Cook and Ron Burt (eds.), Social Capital: Theory and Research. Chicago: Aldine de Gruyter.
Fernandez, Roberto M., Emilio J. Castilla and Paul Moore. 2000. “Social capital at work:
network and employment at a phone center.” American Journal of Sociology 105:1288-1356.
Fernandez, Roberto M. and Nancy Weinberg. 1997. “Sifting and sorting: personal
contacts and hiring in a retail bank.” American Sociological Review 62:883-902. Fiske, Susan T. and Shelley Taylor. 1991. Social Cognition. New York: McGraw-Hill. Glick, Peter and Susan T. Fiske. 2001. “An ambivalent alliance: Hostile and benevolent
sexism as complementary justifications.” American Psychologist 56:109-18. Glick, Peter, Cari Zion and Cynthia Nelson. 1988. “What mediates sex discrimination in
hiring decisions?” Journal of Personality and Social Psychology 55:178-86. Granovetter, Mark. 1995. Getting a Job: A Study in Contacts and Careers. Second
Edition. Chicago: University of Chicago Press. Gutek, Barbara A., Bennett Cherry, and Markus Groth. 1999. “Gender and service
delivery.” Pp. 47-68 in Gary N. Powell (ed.), Handbook of Gender and Work. Thousand Oaks, CA: Sage Publications.
Gutek, B.A., Bennett Cherry, A.D. Bhappu, A.D., S. Schneider, and L. Woolf. 2000.
“Features of service relationships and encounters.” Work and Occupations, 27:319-52.
Hanson, Susan and Geraldine Pratt. 1991. “Job search and the occupational segregation of women.” Annals of the Association of American Geographers 81 (2):229-53.
__________. 1995. Gender, Work, and Space. London: Routledge. Heilman, Madeline E. 1980. “The impact of situational factors on personnel decisions
concerning women: Varying the sex composition of the applicant pool.” Organization Behavior and Human Performance 26:386-95.
__________. 1984. “Information as a deterrent against sex discrimination: the effects of
applicant sex and information type on preliminary employment decisions.” Organizational Behavior and Human Performance 33:174-86.
Hilton, James L. and William von Hippel. 1996. “Stereotypes.” Annual Review of
Psychology 47:237-71. Hochschild, Arlie. 1983. The Managed Heart. Berkeley: University of California Press. Ibarra, Herminia. 1992. “Homophily and differential returns: sex differences in network
structure and access in an advertising firm.” Administrative Science Quarterly 37:422-47.
Jacobs, Jerry A. 1989a. “Long-term trends in occupational segregation by sex.” American
Journal of Sociology 95:160-73. __________. 1989b. Revolving Doors: Sex Segregation and Women’s Careers. Palo
Alto, CA: Stanford University Press. __________. 1992. “Women’s entry into management: Trends in earnings, authority and
values among salaried managers.” Administrative Science Quarterly 37:282-301. Jacobsen, Joyce P. 1994. “Sex segregation at work.” The Social Science Journal 31:153-
69. Kilbourne, Barbara Stanek, Paula England, George Farkas, Kurt Beron, and Dorothea
Weir. 1994. “Returns to skill, compensating differentials, and gender bias: effects of occupational characteristics on the wages of white women and men.” American Journal of Sociology 100:689-719.
Leicht, Kevin T. and Jonathan Marx. 1997. “The consequences of informal job finding
for men and women.” Academy of Management Journal 40:967-87. Leidner, Robin. 1991. “Serving hamburgers and selling insurance: Gender, work and
identity in interactive service jobs.” Gender and Society 5:154-77.
__________. 1993. Fast Food, Fast Talk: Service Work and the Routinization of Everyday Life. Berkeley: University of California Press.
Lincoln, James and Jon Miller. 1979. “Work and friendship ties in organizations: a
comparative analysis of relational networks.” Administrative Science Quarterly 24:181-99.
Marini, Margaret Mooney. 1989. “Sex difference in earnings in the United States.”
Annual Review of Sociology 18:348-80. Marini Margaret M. and Mary Brinton. 1984. “Sex typing in occupational socialization.”
Pp. 192-232 in Barbara F. Reskin (ed.), Sex Segregation in the Workplace: Trends, Explanations, Remedies. Washington, D.C.: National Academy Press.
Marini, Margaret Mooney, Pi-Ling Fan, and Erica Finley. 1996. “Gender and job values.”
Sociology of Education 69:49-65. Marsden, Peter V. 1987. “Core discussion networks of Americans.” American
Sociological Review 52:122-31. __________. 1988. “Homogeneity in confiding relations.” Social Networks 10:57-76. McPherson, Miller, Lynn Smith-Lovin and James M. Cook. 2001. “Birds of a feather:
homophily in social networks.” Annual Review of Sociology 27:415-44. Mencken, F. Carson and Idee Winfield. 1999. “Employer recruiting and the gender
composition of the job.” Sociological Focus 33:201-20. __________. 2000. “Job search and sex segregation: does sex of social contact matter?”
Sex Roles 42:847-64. Miller, Shazia Rafiullah and James E. Rosenbaum. 1997. “Hiring in a Hobbesian world:
social infrastructure and employers’ use of information.” Work and Occupations 24:498-523.
Mincer, Jacob. 1974. Schooling, Experience, and Earnings. New York: National Bureau
for Economic Research and Columbia University Press. Mincer, Jacob and Solomon Polachek. 1974. “Family investments in human capital:
earnings of women.” Journal of Political Economy 82:S76-S108. Moore, Gwen. 1990. “Structural determinants of men’s and women’s personal networks.”
American Sociological Review 55:726-35.
Neckerman, Kathryn and Roberto M. Fernandez. 1997. “Recruitment Practices and Turnover: Are Network Hires Better Matched to Their Jobs?” Paper presented at the annual meetings of the American Sociological Association in Toronto.
Olian, Judy D., Donald P. Schwab and Yitchak Haberfeld. 1988. “The impact of
applicant gender compared to qualifications on hiring recommendations – A meta-analysis of experimental studies.” Organizational Behavior and Human Decision Processes 41:180-95.
O’Leary, V.E. 1974. “Some attitudinal barriers to occupational aspirations in women.”
Psychological Bulletin 81:809-26. Petersen, Trond and Laurie A. Morgan. 1995. “Separate and unequal: occupation-
establishment sex segregation and the gender wage gap.” American Journal of Sociology 101 (2):329-65.
Petersen, Trond, Ishak Saporta and Marc-David L. Seidel. 2000. “Offering a job:
meritocracy and social networks.” American Journal of Sociology 106 (3):763-816.
Phelps, Edwin. 1972. “A Statistical Theory of Racism and Sexism.” American Economic
Review 62:659-61. Polachek, Solomon. 1975a. “Differences in expected post-school investment as a
determinant of market wage differentials.” International Economic Review 16:451-70.
__________. 1975b. “Occupational segregation among women: a human capital
approach.” Paper presented at the Third World Congress of the Econometric Society.
__________. 1979. “Occupational segregation among women: theory, evidence and
prognosis.” Pp. 137-57 in Lloyd, Andrews and Gilroy (eds.), Women in the Labor Market. New York: Columbia University Press.
__________. 1981. “Occupational self-selection: a human capital approach to sex
differences in occupational structure.” Review of Economics and Statistics 63:60-69.
Reskin, Barbara F. and Debra Branch McBrier. 2000. “Why not ascription?
organizations’ employment of male and female managers.” American Sociological Review 65:210-33.
Reskin, Barbara F. and Irene Padavic. 1994. Women and Men at Work. Thousand Oaks:
Pine Forge Press.
Reskin, Barbara F. and Patricia A. Roos. 1990. Job Queues, Gender Queues: Explaining Women’s Inroads Into Male Occupations. Philadelphia: Temple University Press.
Ridgeway, Cecilia L. 1997. “Interaction and the conservation of gender inequality:
considering employment.” American Sociological Review 62:218-35. Roos, Patricia A. and Barbara F. Reskin. 1984. “Institutional factors contributing to sex
segregation in the workplace.” Pp. 235-60 in Barbara F. Reskin (ed.), Sex Segregation in the Workplace: Trends, Explanations, Remedies. Washington, D.C.: National Academy Press.
Skuratowicz, Eva and Larry W. Hunter. 2002. “Where do women’s jobs come from? job
resegregation in an American bank.” Working Paper. Subich, Linda M., Gerald Barrett, Dennis Doverspike, and Ralph Alexander. 1989. “The
effects of sex-role-related factors on occupational choice and salary.” Pp. 91-104 in Robert T. Michael, Heidi Hartmann, and Brigid O’Farrell (eds.), Pay Equity: Empirical Inquiries. Washington, D.C.: National Academy Press.
Tomaskovic-Devey, Donald. 1993a. “The gender and race composition of jobs and the
male/female, white/black pay gaps.” Social Forces 72:45-76. __________. 1993b. Gender and Racial Inequality at Work: The Sources and
Consequences of Job Segregation. Ithaca, New York: Cornell ILR Press. Tomaskovic-Devey, Donald, Arne Kalleberg, and Peter Marsden. 1996. “Organizational
patterns of gender segregation.” Pp. 276-301 in Arne Kalleberg, Peter Marsden, Joe Spaeth, and David Knoke (eds.), Organizations in America: Analyzing Their Structures and Human Resource Practices. Beverly Hills, CA: Sage Press.
Zellner, Harriet. 1975. “The determinants of occupational segregation.” Pp. 125-45 in
Cynthia Lloyd (ed.), Sex, Discrimination, and the Division of Labor. New York: Columbia University Press.
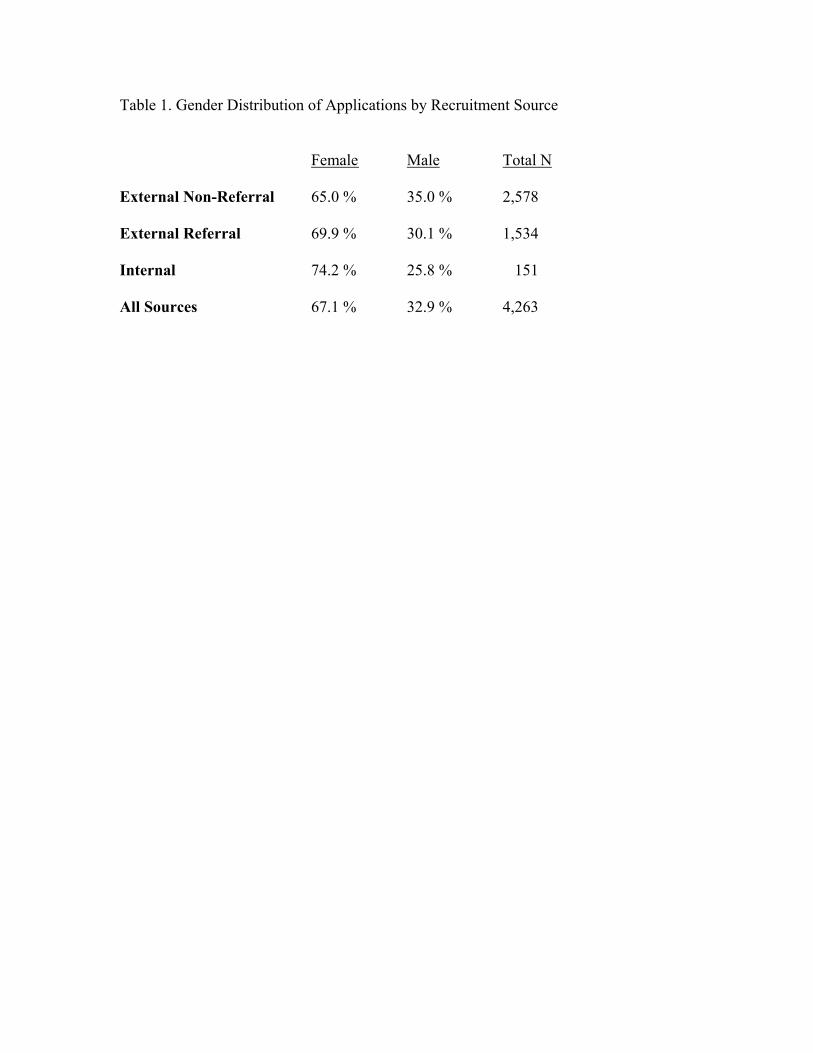
Table 1. Gender Distribution of Applications by Recruitment Source Female Male Total N External Non-Referral 65.0 % 35.0 % 2,578 External Referral 69.9 % 30.1 % 1,534 Internal 74.2 % 25.8 % 151 All Sources 67.1 % 32.9 % 4,263
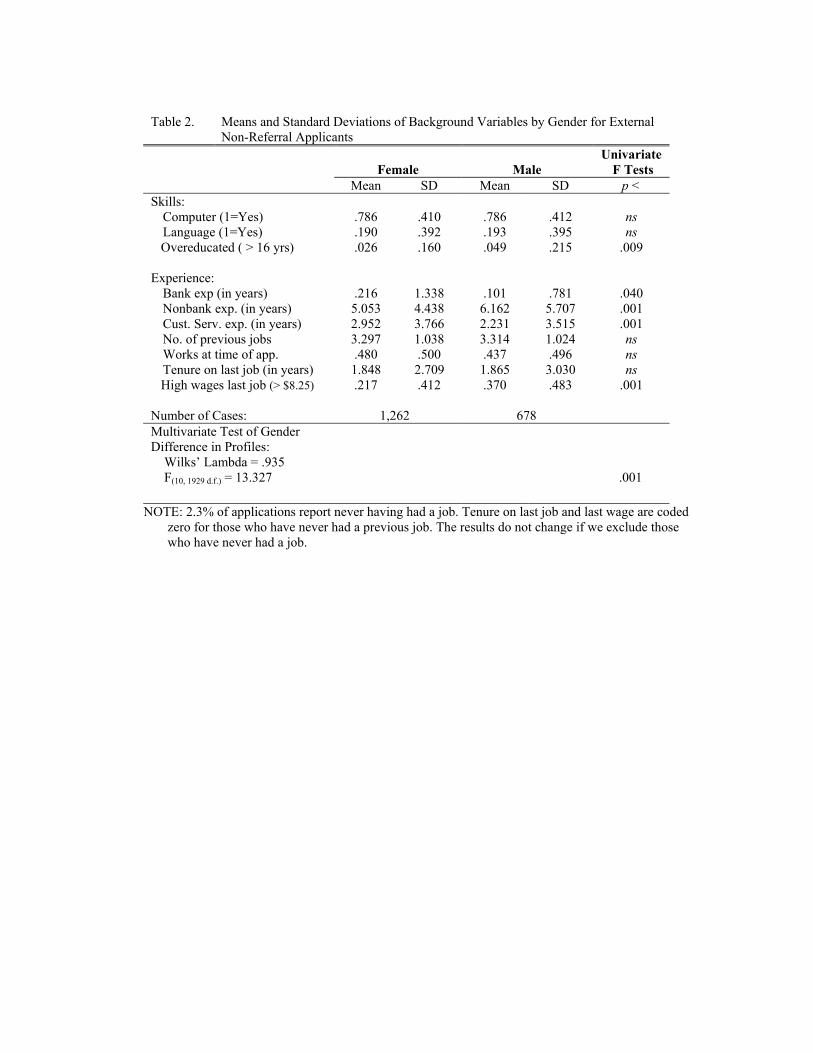
Table 2. Means and Standard Deviations of Background Variables by Gender for External
Non-Referral Applicants
Female Male Univariate
F Tests Mean SD Mean SD p < Skills:
Computer (1=Yes) .786 .410 .786 .412 ns Language (1=Yes) .190 .392 .193 .395 ns
Overeducated ( > 16 yrs) .026 .160 .049 .215 .009 Experience:
Bank exp (in years) .216 1.338 .101 .781 .040 Nonbank exp. (in years) 5.053 4.438 6.162 5.707 .001 Cust. Serv. exp. (in years) 2.952 3.766 2.231 3.515 .001 No. of previous jobs 3.297 1.038 3.314 1.024 ns Works at time of app. .480 .500 .437 .496 ns Tenure on last job (in years) 1.848 2.709 1.865 3.030 ns
High wages last job (> $8.25) .217 .412 .370 .483 .001 Number of Cases: 1,262 678 Multivariate Test of Gender Difference in Profiles: Wilks’ Lambda = .935
F(10, 1929 d.f.) = 13.327 .001
NOTE: 2.3% of applications report never having had a job. Tenure on last job and last wage are coded zero for those who have never had a previous job. The results do not change if we exclude those who have never had a job.
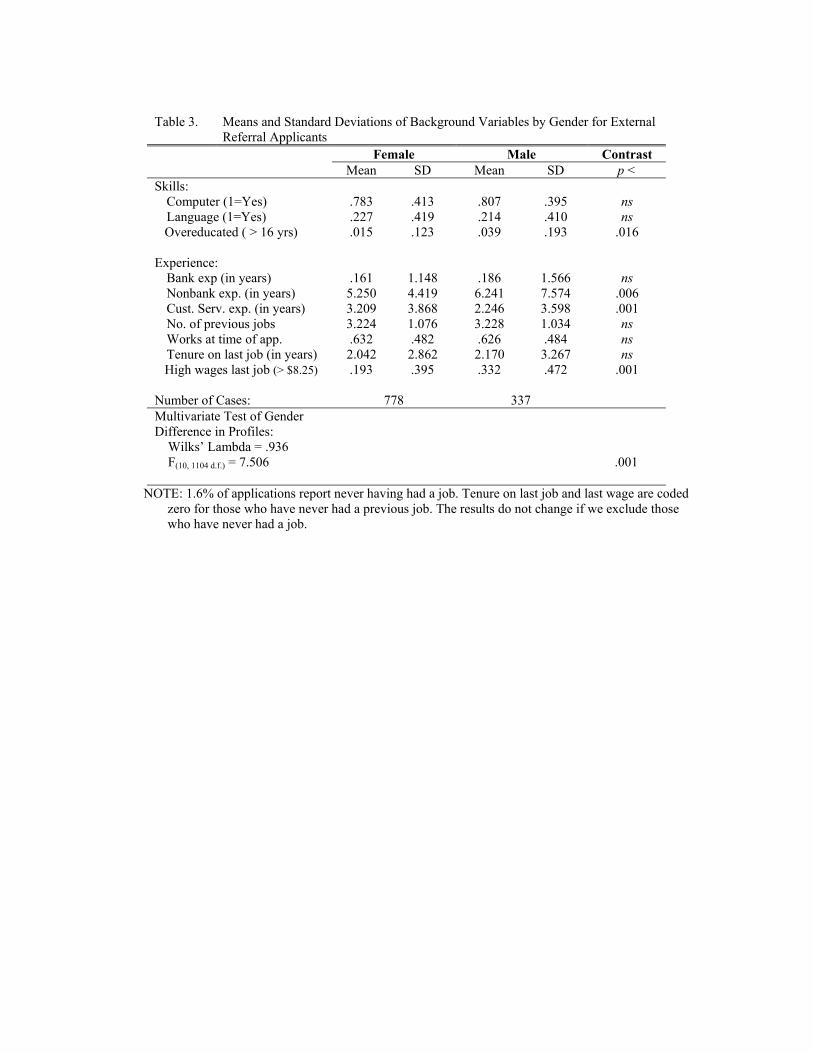
Table 3. Means and Standard Deviations of Background Variables by Gender for External
Referral Applicants Female Male Contrast Mean SD Mean SD p < Skills:
Computer (1=Yes) .783 .413 .807 .395 ns Language (1=Yes) .227 .419 .214 .410 ns
Overeducated ( > 16 yrs) .015 .123 .039 .193 .016 Experience:
Bank exp (in years) .161 1.148 .186 1.566 ns Nonbank exp. (in years) 5.250 4.419 6.241 7.574 .006 Cust. Serv. exp. (in years) 3.209 3.868 2.246 3.598 .001 No. of previous jobs 3.224 1.076 3.228 1.034 ns Works at time of app. .632 .482 .626 .484 ns Tenure on last job (in years) 2.042 2.862 2.170 3.267 ns
High wages last job (> $8.25) .193 .395 .332 .472 .001 Number of Cases: 778 337 Multivariate Test of Gender Difference in Profiles: Wilks’ Lambda = .936
F(10, 1104 d.f.) = 7.506 .001
NOTE: 1.6% of applications report never having had a job. Tenure on last job and last wage are coded zero for those who have never had a previous job. The results do not change if we exclude those who have never had a job.
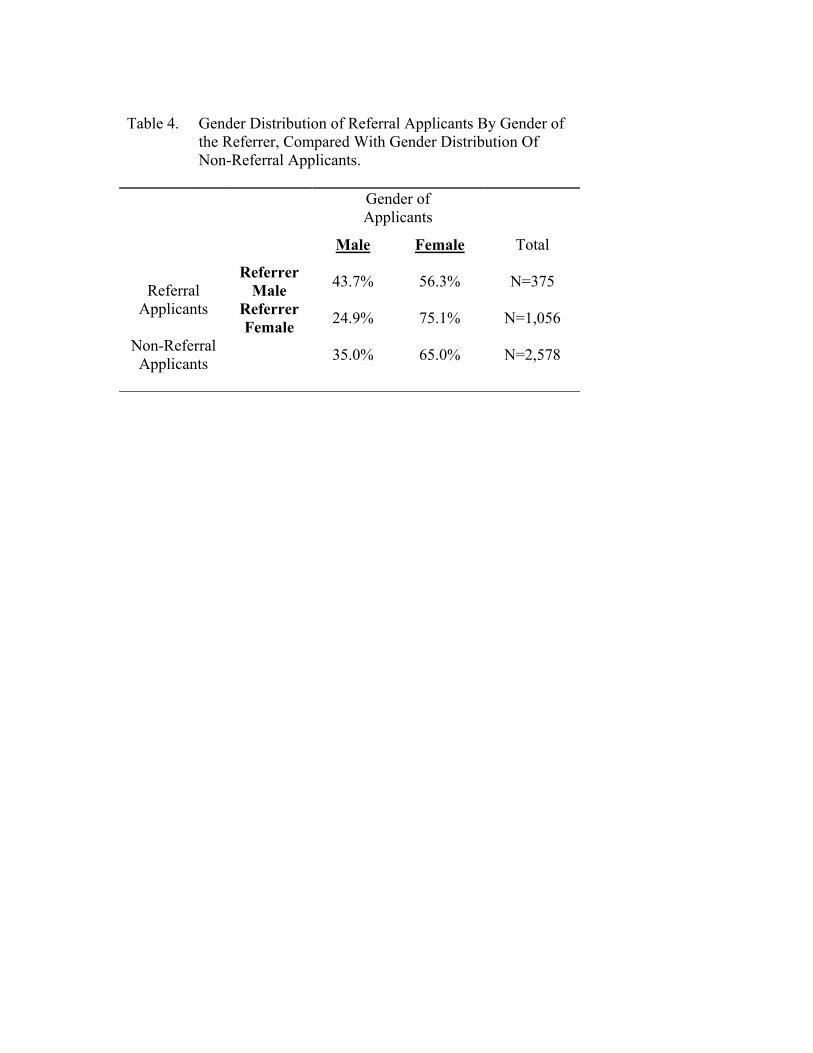
Table 4. Gender Distribution of Referral Applicants By Gender of
the Referrer, Compared With Gender Distribution Of Non-Referral Applicants.
Gender of Applicants
Male Female Total
Referrer Male 43.7% 56.3% N=375 Referral
Applicants Referrer Female 24.9% 75.1% N=1,056
Non-Referral Applicants 35.0% 65.0% N=2,578
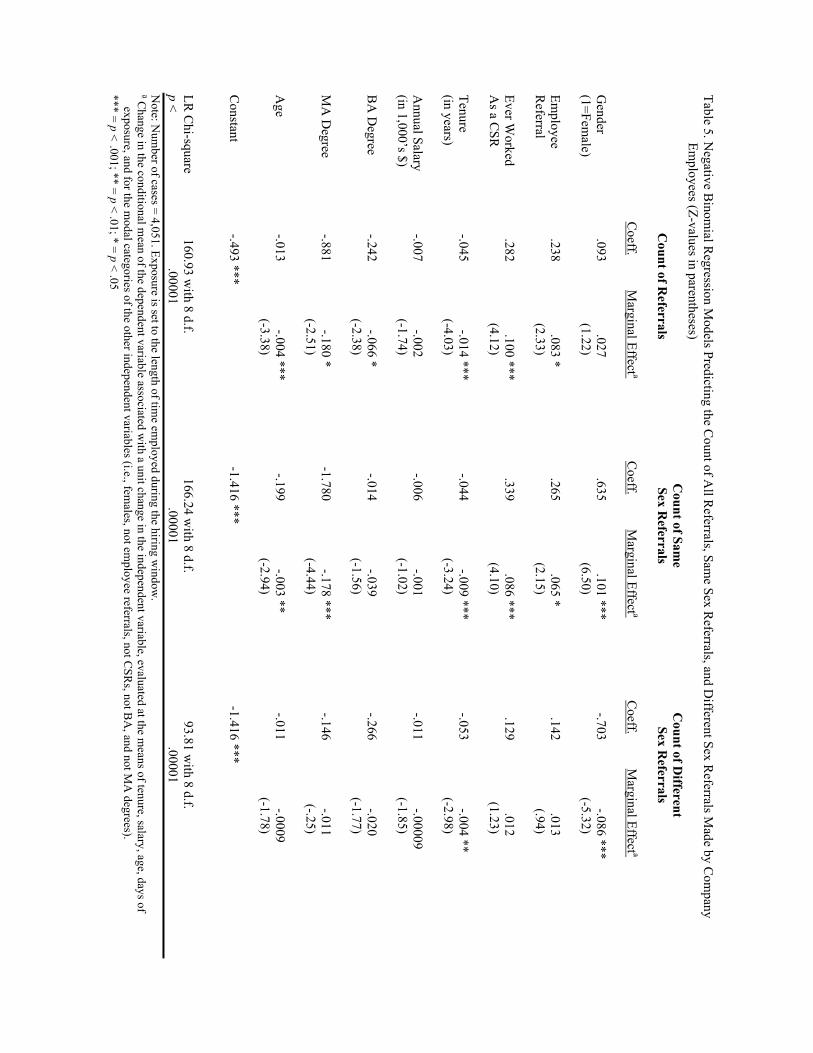
Table 5. Negative B
inomial R
egression Models Predicting the C
ount of All R
eferrals, Same Sex R
eferrals, and Different Sex R
eferrals Made by C
ompany
Employees (Z-values in parentheses)
C
ount of Same
Count of D
ifferent
C
ount of Referrals
Sex Referrals
Sex Referrals
C
oeff. M
arginal Effect a C
oeff. M
arginal Effect a C
oeff. M
arginal Effect a G
ender .093
.027 .635
.101 *** -.703
-.086 *** (1=Fem
ale)
(1.22)
(6.50)
(-5.32)
Em
ployee .238
.083 * .265
.065 * .142
.013 R
eferral
(2.33)
(2.15)
(.94)
Ever W
orked .282
.100 *** .339
.086 *** .129
.012 A
s a CSR
(4.12)
(4.10)
(1.23)
Tenure
-.045 -.014 ***
-.044 -.009 ***
-.053 -.004 **
(in years)
(-4.03)
(-3.24)
(-2.98)
A
nnual Salary -.007
-.002 -.006
-.001 -.011
-.00009 (in 1,000’s $)
(-1.74)
(-1.02)
(-1.85)
BA
Degree
-.242 -.066 *
-.014 -.039
-.266 -.020
(-2.38)
(-1.56)
(-1.77)
M
A D
egree -.881
-.180 * -1.780
-.178 *** -.146
-.011
(-2.51)
(-4.44)
(-.25)
Age
-.013 -.004 ***
-.199 -.003 **
-.011 -.0009
(-3.38)
(-2.94)
(-1.78) C
onstant -.493 ***
-1.416 ***
-1.416 ***
LR C
hi-square 160.93 w
ith 8 d.f. 166.24 w
ith 8 d.f. 93.81 w
ith 8 d.f. p <
.00001
.00001 .00001
Note: N
umber of cases = 4,051. Exposure is set to the length of tim
e employed during the hiring w
indow.
a Change in the conditional m
ean of the dependent variable associated with a unit change in the independent variable, evaluated at the m
eans of tenure, salary, age, days of exposure, and for the m
odal categories of the other independent variables (i.e., females, not em
ployee referrals, not CSR
s, not BA
, and not MA
degrees). *** = p <
.001; ** = p < .01; * = p < .05
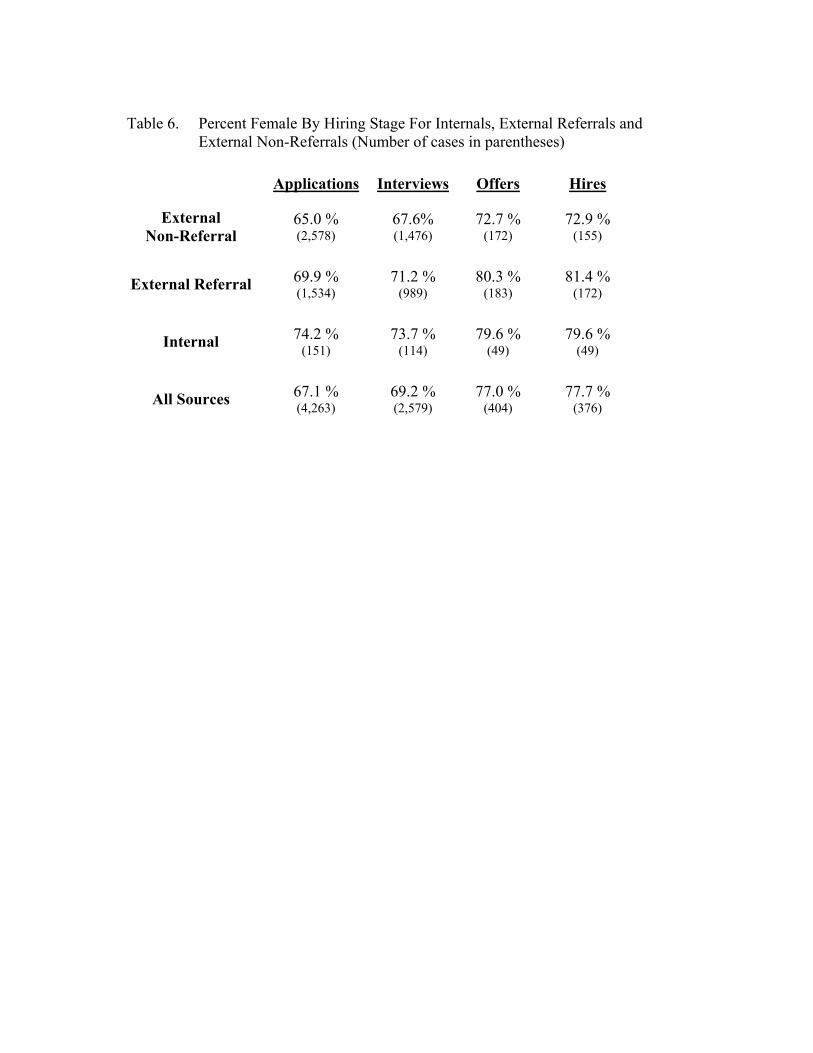
Table 6. Percent Female By Hiring Stage For Internals, External Referrals and
External Non-Referrals (Number of cases in parentheses)
Applications Interviews Offers Hires
External Non-Referral
65.0 % (2,578)
67.6% (1,476)
72.7 % (172)
72.9 % (155)
External Referral 69.9 % (1,534)
71.2 % (989)
80.3 % (183)
81.4 % (172)
Internal 74.2 % (151)
73.7 % (114)
79.6 % (49)
79.6 % (49)
All Sources 67.1 % (4,263)
69.2 % (2,579)
77.0 % (404)
77.7 % (376)
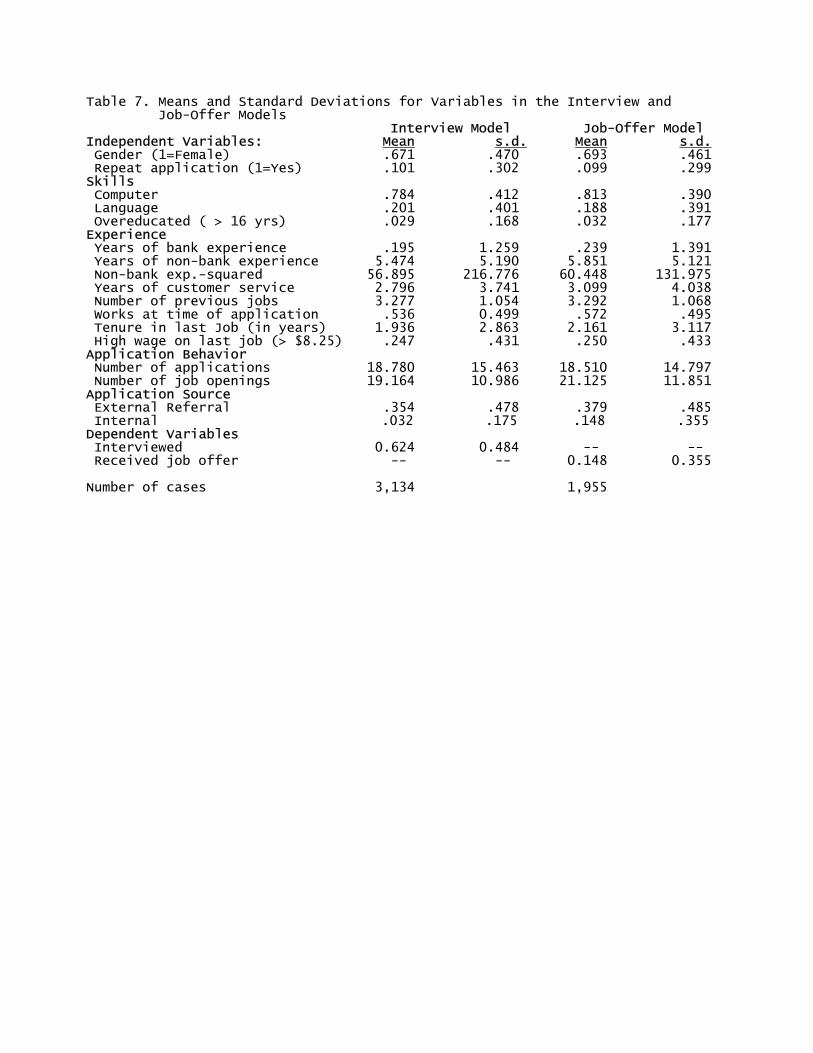
Table 7. Means and Standard Deviations for Variables in the Interview and Job-Offer Models Interview Model Job-Offer Model Independent Variables: Mean s.d. Mean s.d. Gender (1=Female) .671 .470 .693 .461 Repeat application (1=Yes) .101 .302 .099 .299 Skills Computer .784 .412 .813 .390 Language .201 .401 .188 .391 Overeducated ( > 16 yrs) .029 .168 .032 .177 Experience Years of bank experience .195 1.259 .239 1.391 Years of non-bank experience 5.474 5.190 5.851 5.121 Non-bank exp.-squared 56.895 216.776 60.448 131.975 Years of customer service 2.796 3.741 3.099 4.038 Number of previous jobs 3.277 1.054 3.292 1.068 Works at time of application .536 0.499 .572 .495 Tenure in last Job (in years) 1.936 2.863 2.161 3.117 High wage on last job (> $8.25) .247 .431 .250 .433 Application Behavior Number of applications 18.780 15.463 18.510 14.797 Number of job openings 19.164 10.986 21.125 11.851 Application Source External Referral .354 .478 .379 .485 Internal .032 .175 .148 .355 Dependent Variables Interviewed 0.624 0.484 -- -- Received job offer -- -- 0.148 0.355 Number of cases 3,134 1,955
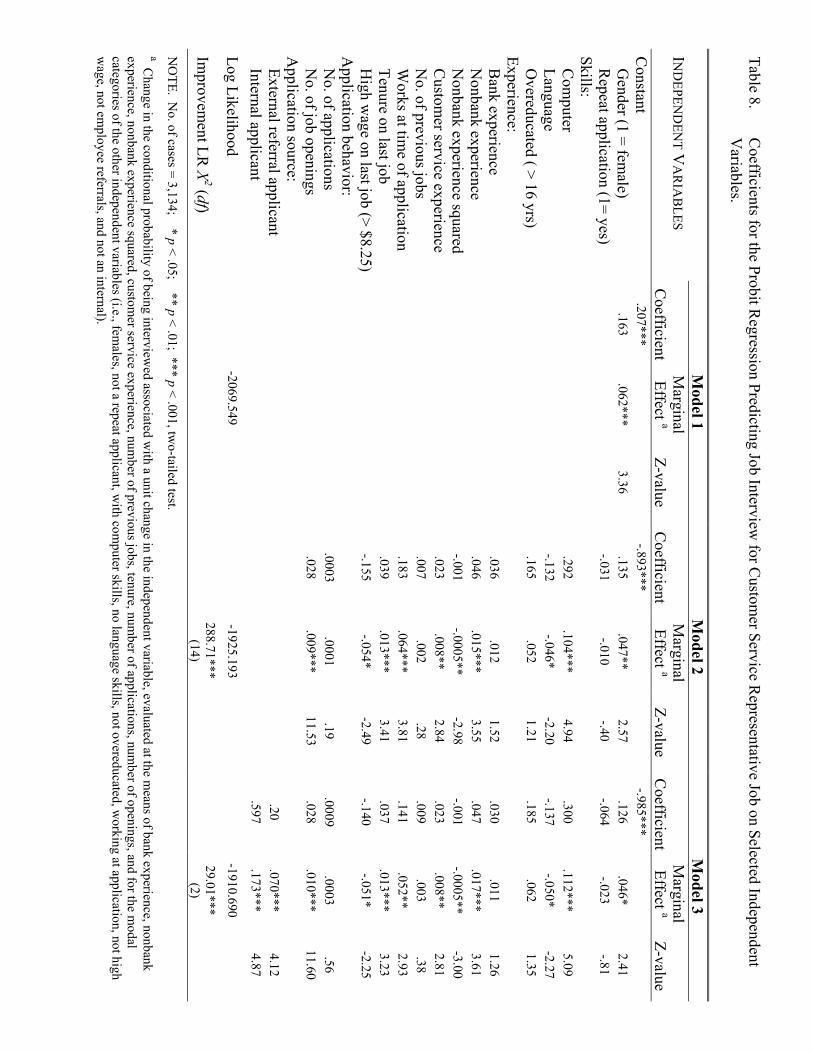
Table 8. C
oefficients for the Probit Regression Predicting Job Interview
for Custom
er Service Representative Job on Selected Independent
Variables.
Model 1
Model 2
Model 3
IND
EPEND
ENT V
AR
IAB
LES C
oefficientM
arginal Effect a
Z-valueC
oefficientM
arginal Effect a
Z-value C
oefficient M
arginal Effect a
Z-valueC
onstant .207***
-.893***
-.985***
Gender (1 = fem
ale) .163
.062***3.36
.135.047**
2.57.126
.046*2.41
Repeat application (1= yes)
-.031
-.010-.40
-.064-.023
-.81Skills:
C
omputer
.292.104***
4.94.300
.112***5.09
Language -.132
-.046*-2.20
-.137-.050*
-2.27O
vereducated ( > 16 yrs) .165
.052
1.21.185
.0621.35
Experience:
Bank experience
.036.012
1.52.030
.0111.26
Nonbank experience
.046.015***
3.55.047
.017***3.61
Nonbank experience squared
-.001-.0005**
-2.98-.001
-.0005** -3.00
Custom
er service experience .023
.008**2.84
.023.008**
2.81N
o. of previous jobs .007
.002.28
.009.003
.38W
orks at time of application
.183.064***
3.81.141
.052**2.93
Tenure on last job .039
.013***3.41
.037.013***
3.23H
igh wage on last job (> $8.25)
-.155
-.054*-2.49
-.140-.051*
-2.25A
pplication behavior:
No. of applications
.0003.0001
.19.0009
.0003.56
No. of job openings
.028
.009***11.53
.028.010***
11.60A
pplication source:
External referral applicant
.20.070***
4.12Internal applicant
.597.173***
4.87
Log Likelihood -2069.549
-1925.193-1910.690
Improvem
ent LR X2 (df)
288.71*** (14)
29.01*** (2)
NO
TE. No. of cases = 3,134; * p < .05; ** p < .01; *** p < .001, tw
o-tailed test. a C
hange in the conditional probability of being interviewed associated w
ith a unit change in the independent variable, evaluated at the means of bank experience, nonbank
experience, nonbank experience squared, customer service experience, num
ber of previous jobs, tenure, number of applications, num
ber of openings, and for the modal
categories of the other independent variables (i.e., females, not a repeat applicant, w
ith computer skills, no language skills, not overeducated, w
orking at application, not high w
age, not employee referrals, and not an internal).
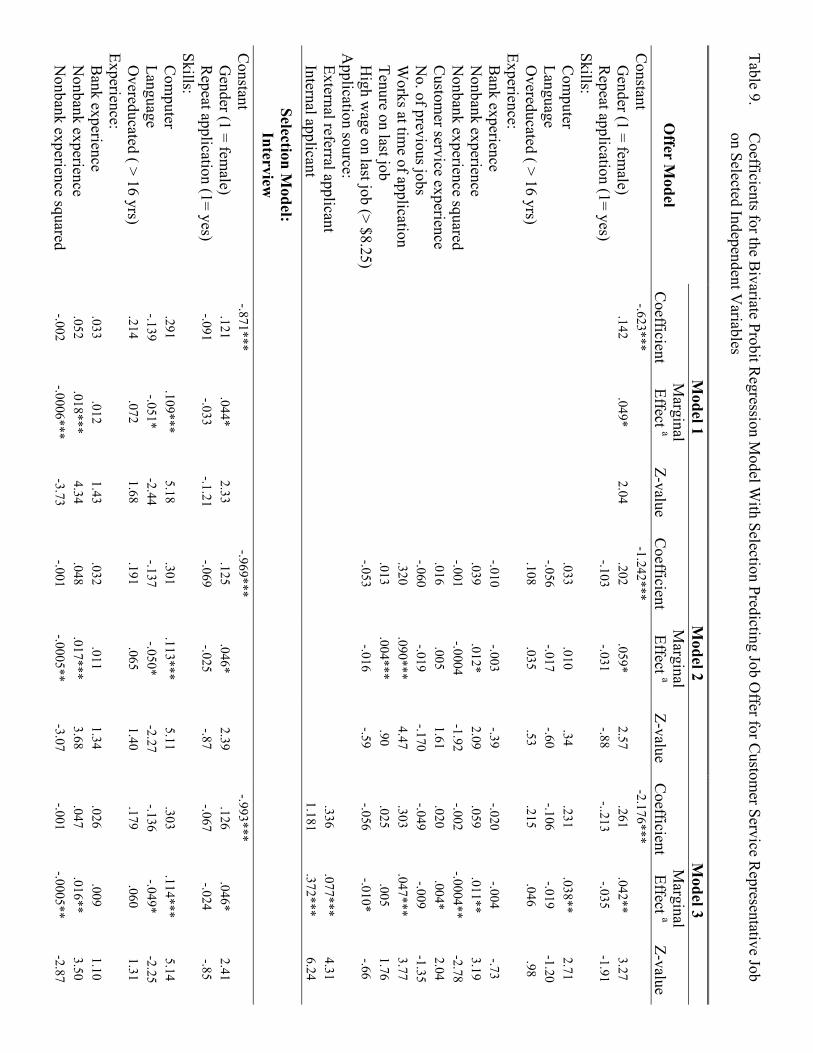
Table 9. C
oefficients for the Bivariate Probit R
egression Model W
ith Selection Predicting Job Offer for C
ustomer Service R
epresentative Job on Selected Independent V
ariables
M
odel 1 M
odel 2 M
odel 3
Offer M
odel C
oefficient M
arginal Effect a
Z-valueC
oefficientM
arginal Effect a
Z-value C
oefficientM
arginal Effect a
Z-valueC
onstant -.623***
-1.242***
-2.176***
G
ender (1 = female)
.142
.049*2.04
.202.059*
2.57.261
.042**3.27
Repeat application (1= yes)
-.103
-.031-.88
-..213-.035
-1.91Skills:
C
omputer
.033
.010.34
.231.038**
2.71Language
-.056-.017
-.60-.106
-.019-1.20
Overeducated ( > 16 yrs)
.108
.035.53
.215.046
.98Experience:
B
ank experience
-.010-.003
-.39-.020
-.004-.73
Nonbank experience
.039.012*
2.09.059
.011**3.19
Nonbank experience squared
-.001-.0004
-1.92-.002
-.0004**
-2.78
Custom
er service experience .016
.0051.61
.020.004*
2.04N
o. of previous jobs -.060
-.019-.170
-.049-.009
-1.35W
orks at time of application
.320.090***
4.47.303
.047*** 3.77
Tenure on last job .013
.004***.90
.025.005
1.76H
igh wage on last job (> $8.25)
-.053
-.016-.59
-.056-.010*
-.66A
pplication source:
External referral applicant
.336.077***
4.31Internal applicant
1.181 .372***
6.24
Selection Model:
Interview
Constant
-.871***
-.969***
-.993***G
ender (1 = female)
.121
.044*2.33
.125.046*
2.39.126
.046*2.41
Repeat application (1= yes)
-.091-.033
-.1.21-.069
-.025
-.87-.067
-.024-.85
Skills:
Com
puter .291
.109***5.18
.301.113***
5.11.303
.114***5.14
Language -.139
-.051*-2.44
-.137-.050*
-2.27-.136
-.049*-2.25
Overeducated ( > 16 yrs)
.214.072
1.68.191
.0651.40
.179.060
1.31Experience: B
ank experience .033
.0121.43
.032.011
1.34.026
.0091.10
Nonbank experience
.052.018***
4.34.048
.017***3.68
.047.016**
3.50N
onbank experience squared -.002
-.0006***-3.73
-.001-.0005**
-3.07-.001
-.0005**-2.87
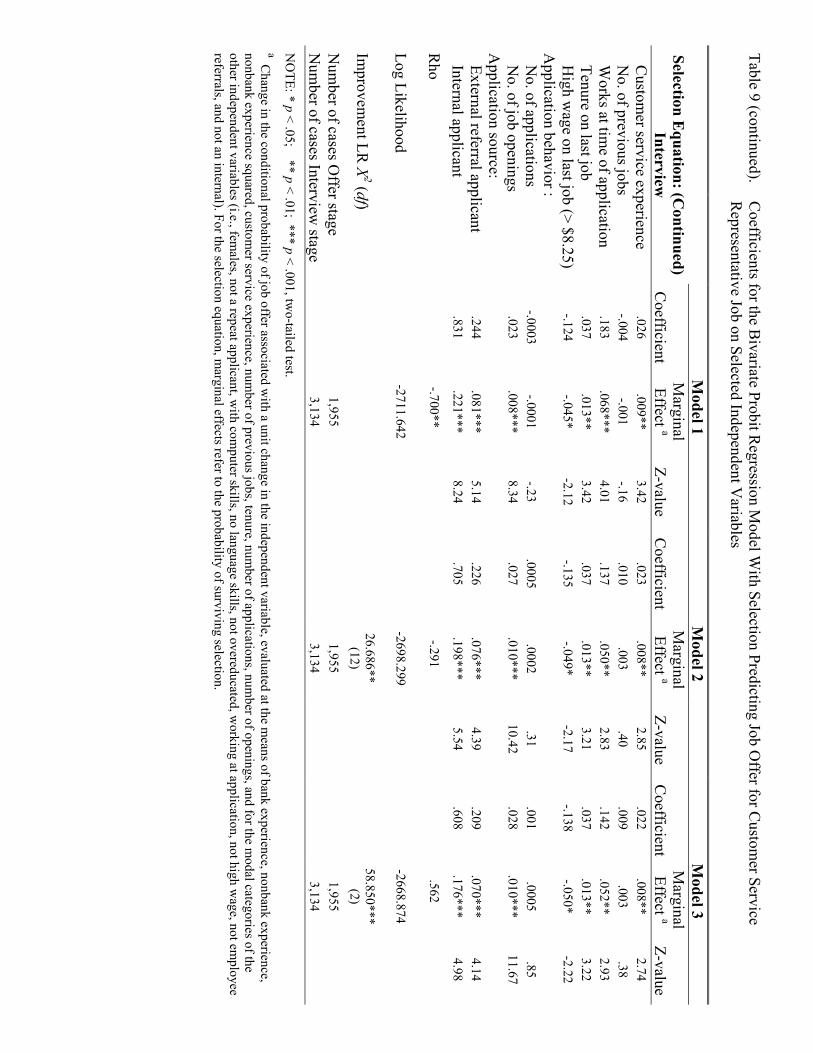
Table 9 (continued). C
oefficients for the Bivariate Probit R
egression Model W
ith Selection Predicting Job Offer for C
ustomer Service
Representative Job on Selected Independent V
ariables
M
odel 1 M
odel 2 M
odel 3 Selection E
quation: (Continued)
Interview
Coefficient
Marginal
Effect a
Z-value
Coefficient
Marginal
Effect a Z-value
Coefficient
Marginal
Effect aZ-value
Custom
er service experience .026
.009**
3.42.023
.008**2.85
.022 .008**
2.74N
o. of previous jobs -.004
-.001-.16
.010.003
.40.009
.003.38
Works at tim
e of application .183
.068***4.01
.137.050**
2.83.142
.052**2.93
Tenure on last job .037
.013**3.42
.037.013**
3.21.037
.013**3.22
High w
age on last job (> $8.25) -.124
-.045*-2.12
-.135-.049*
-2.17-.138
-.050*-2.22
Application behavior : N
o. of applications -.0003
-.0001-.23
.0005.0002
.31.001
.0005.85
No. of job openings
.023.008***
8.34.027
.010***10.42
.028.010***
11.67A
pplication source: External referral applicant
.244.081***
5.14.226
.076***4.39
.209.070***
4.14Internal applicant
.831.221***
8.24.705
.198***5.54
.608.176***
4.98
Rho
-.700**-.291
.562
Log Likelihood -2711.642
-2698.299-2668.874
Improvem
ent LR X2 (df)
26.686** (12)
58.850*** (2)
Num
ber of cases Offer stage
1,9551,955
1,955
Num
ber of cases Interview stage
3,1343,134
3,134
NO
TE: * p < .05; ** p < .01; *** p < .001, two-tailed test.
a Change in the conditional probability of job offer associated w
ith a unit change in the independent variable, evaluated at the means of bank experience, nonbank experience,
nonbank experience squared, customer service experience, num
ber of previous jobs, tenure, number of applications, num
ber of openings, and for the modal categories of the
other independent variables (i.e., females, not a repeat applicant, w
ith computer skills, no language skills, not overeducated, w
orking at application, not high wage, not em
ployee referrals, and not an internal). For the selection equation, m
arginal effects refer to the probability of surviving selection.
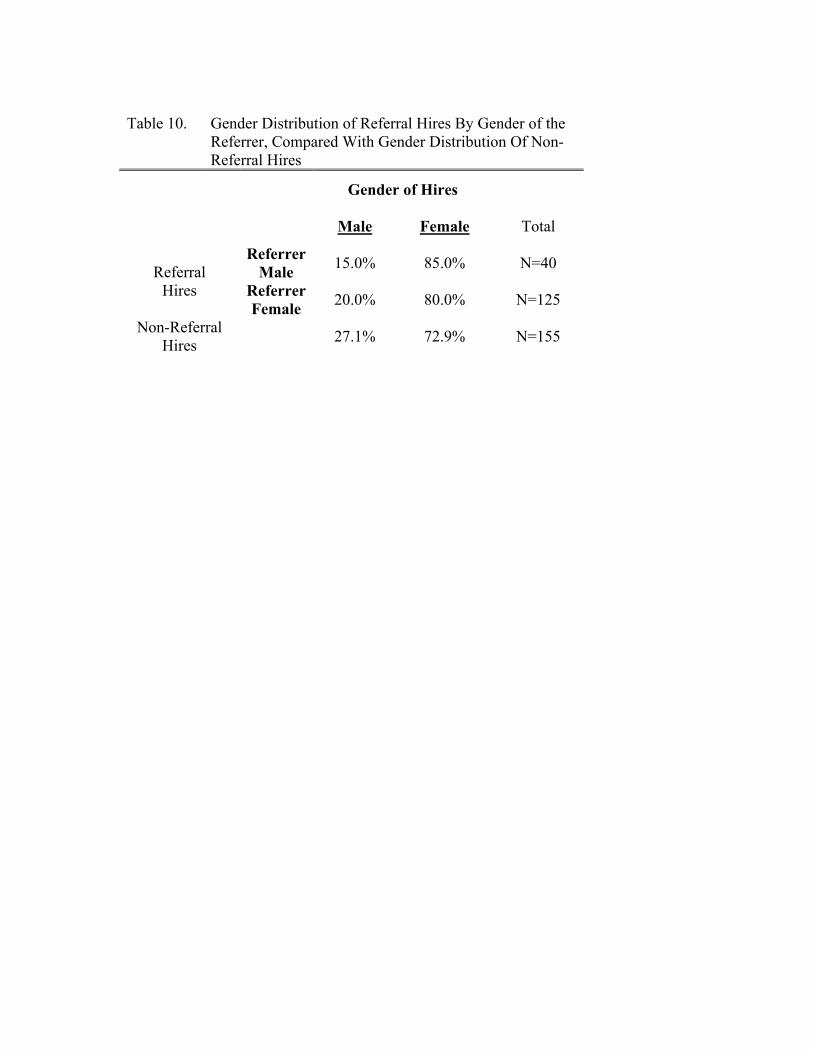
Table 10. Gender Distribution of Referral Hires By Gender of the
Referrer, Compared With Gender Distribution Of Non-Referral Hires
Gender of Hires
Male Female Total
Referrer Male 15.0% 85.0% N=40 Referral
Hires Referrer Female 20.0% 80.0% N=125
Non-Referral Hires 27.1% 72.9% N=155
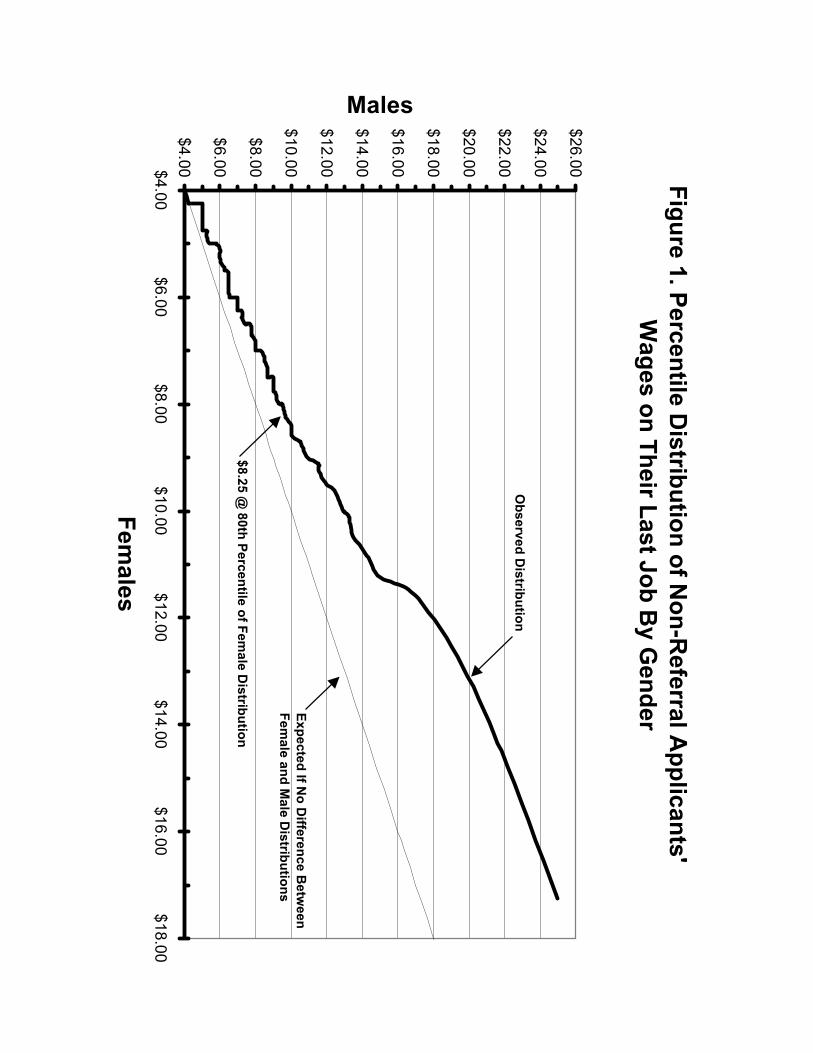
Figure 1. Percentile Distribution of N
on-Referral A
pplicants' W
ages on Their Last Job By G
ender
$4.00
$6.00
$8.00
$10.00
$12.00
$14.00
$16.00
$18.00
$20.00
$22.00
$24.00
$26.00$4.00$6.00
$8.00$10.00
$12.00$14.00
$16.00$18.00
Females
Males
Expected If No D
ifference Betw
een Fem
ale and Male D
istributions
Observed D
istribution
$8.25 @ 80th Percentile of Fem
ale Distribution
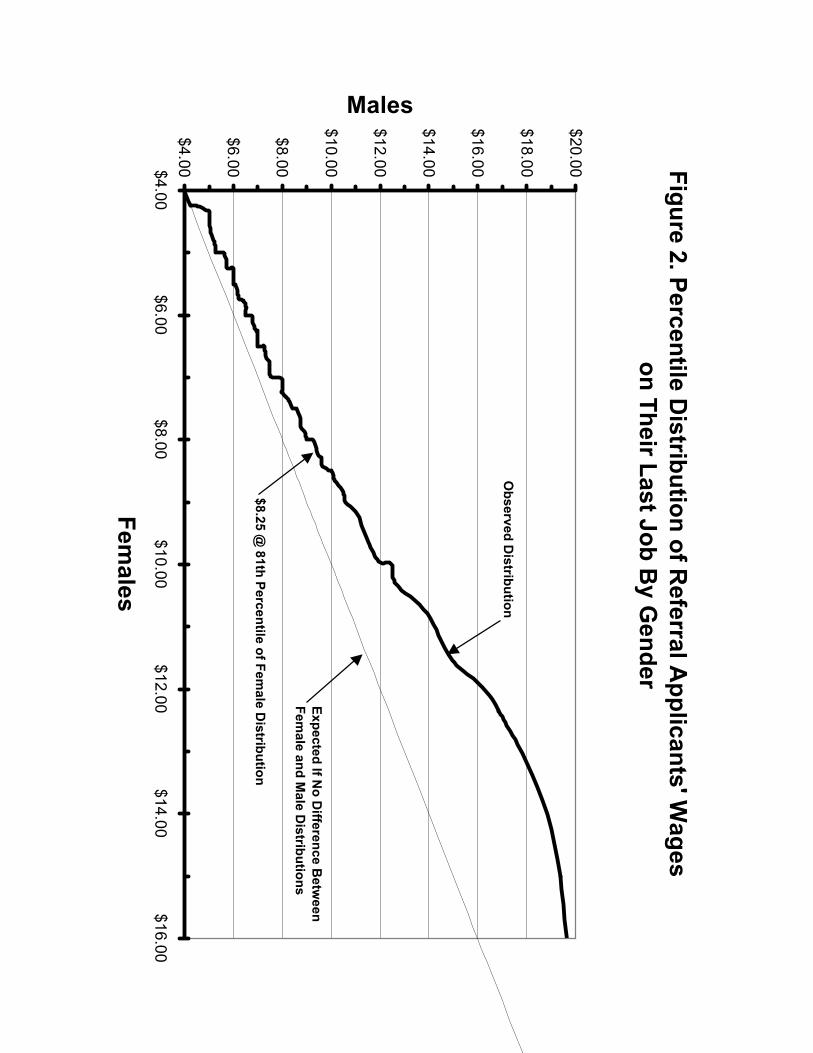
Figure 2. Percentile Distribution of R
eferral Applicants' W
ages on Their Last Job B
y Gender
$4.00
$6.00
$8.00
$10.00
$12.00
$14.00
$16.00
$18.00
$20.00$4.00$6.00
$8.00$10.00
$12.00$14.00
$16.00
Females
Males
Expected If No D
ifference Betw
een Fem
ale and Male D
istributions
Observed D
istribution
$8.25 @ 81th Percentile of Fem
ale Distribution