Embed Size (px)
Citation preview
Gendering Urban Development
Darshini MahadeviaSchool of Planning
CEPT University, Ahmedabad
Copy right Darshini Mahadevia, CEPT
Urban Development Status - 1
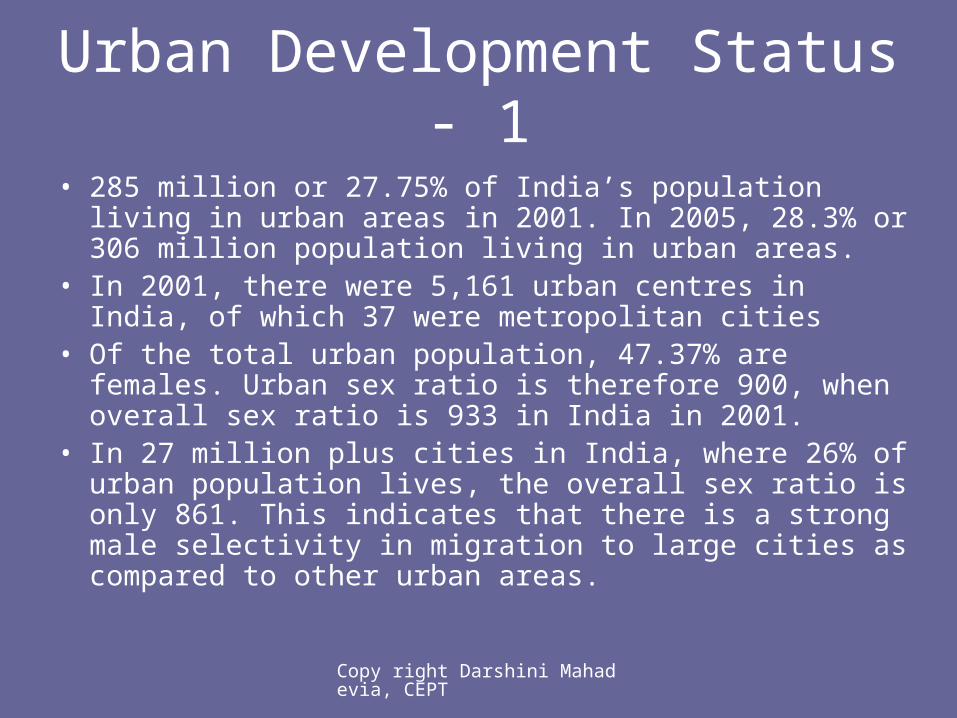
• 285 million or 27.75% of India’s population living in urban areas in 2001. In 2005, 28.3% or 306 million population living in urban areas.
• In 2001, there were 5,161 urban centres in India, of which 37 were metropolitan cities
• Of the total urban population, 47.37% are females. Urban sex ratio is therefore 900, when overall sex ratio is 933 in India in 2001.
• In 27 million plus cities in India, where 26% of urban population lives, the overall sex ratio is only 861. This indicates that there is a strong male selectivity in migration to large cities as compared to other urban areas.
Copy right Darshini Mahadevia, CEPT
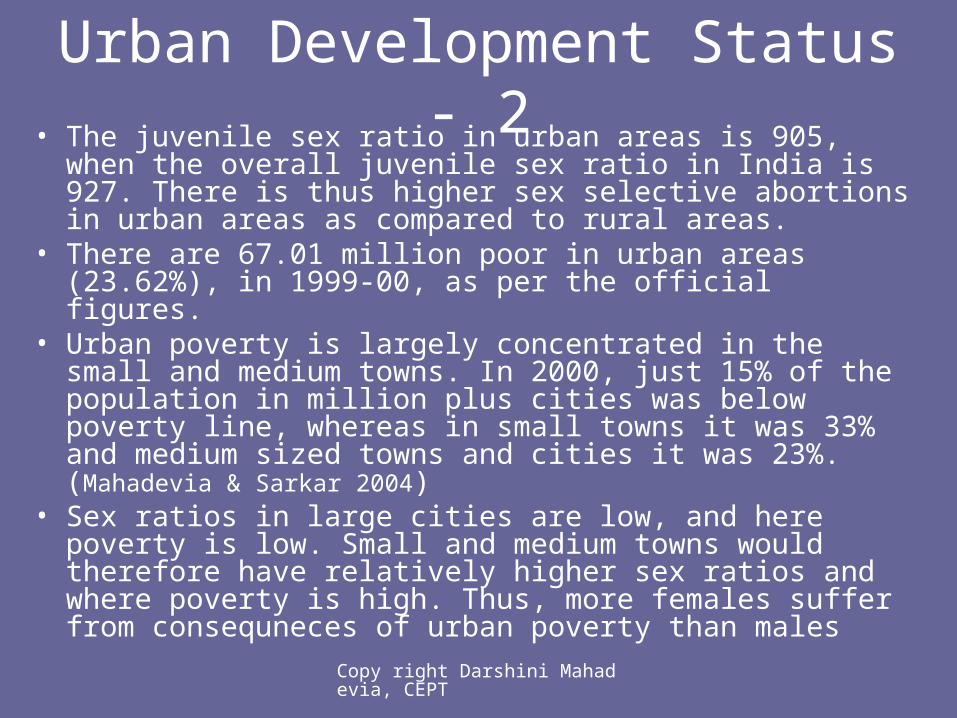
Urban Development Status - 2• The juvenile sex ratio in urban areas is 905, when the
overall juvenile sex ratio in India is 927. There is thus higher sex selective abortions in urban areas as compared to rural areas.
• There are 67.01 million poor in urban areas (23.62%), in 1999-00, as per the official figures.
• Urban poverty is largely concentrated in the small and medium towns. In 2000, just 15% of the population in million plus cities was below poverty line, whereas in small towns it was 33% and medium sized towns and cities it was 23%. (Mahadevia & Sarkar 2004)
• Sex ratios in large cities are low, and here poverty is low. Small and medium towns would therefore have relatively higher sex ratios and where poverty is high. Thus, more females suffer from consequneces of urban poverty than males
Copy right Darshini Mahadevia, CEPT
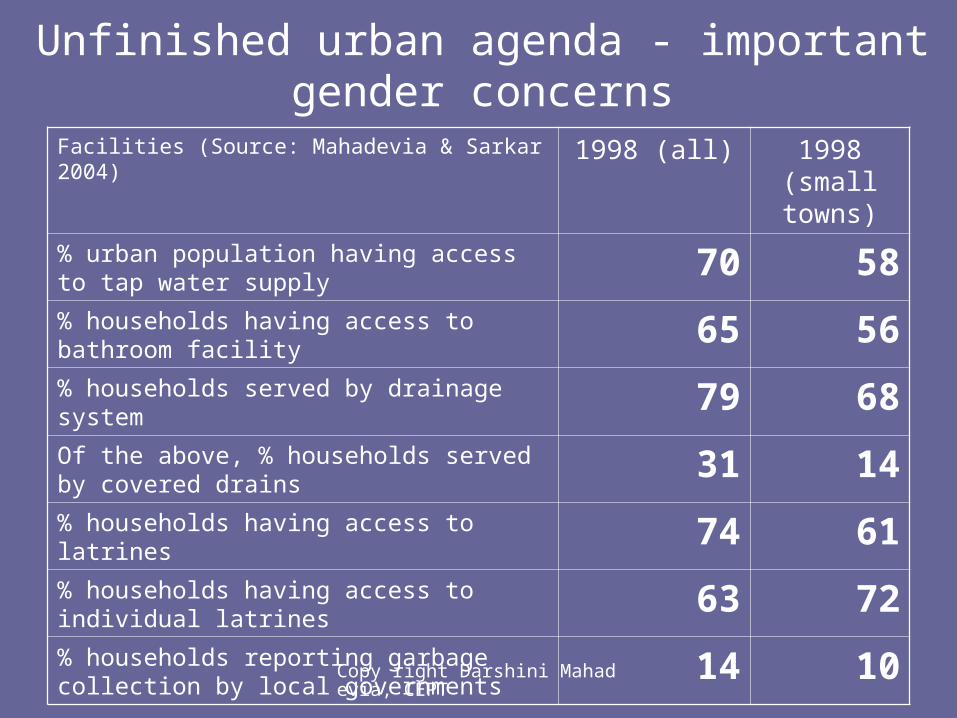
Unfinished urban agenda - important gender concerns
Facilities (Source: Mahadevia & Sarkar 2004) 1998 (all) 1998 (small towns)
% urban population having access to tap water supply
70 58
% households having access to bathroom facility
65 56
% households served by drainage system 79 68Of the above, % households served by covered drains
31 14
% households having access to latrines 74 61% households having access to individual latrines
63 72
% households reporting garbage collection by local governments
14 10

Copy right Darshini Mahadevia, CEPT
Unfinished agenda - 2
• Lack of services is more a phenomenon of small and medium towns than of metropolitan cities.
• 26% of urban population lives in small towns below population 50,000 and another 24% live in medium sized towns with population between 50,000 and 200,000. (Mahadevia & sarkar 2004)
• Within the urban sector, attention to urban centres below 200,000 population is essential, where sex ratios are higher than metros, to reach to women.
Copy right Darshini Mahadevia, CEPT
Urban financing• Urban development is a state subject• There are a few centrally supported urban programmes.
But, by and large urban development is funded through the efforts of state government.
• State government delegates some functions to the city governments. In some states, all functions are delegated to the city governments, such as Maharashtra and Gujarat and in some states only some functions are delegated. For example, Karnataka, AP, TN, water supply and sanitation, urban transport are not delegated to the city governments.
• We need to look at budgets of each of the urban centres.• In most states, there are state government supported
parastatals are there to finance the urban function which is their mandate and hence, the expenditure pattern and cost recovery mechanisms need to be looked at.
Copy right Darshini Mahadevia, CEPT
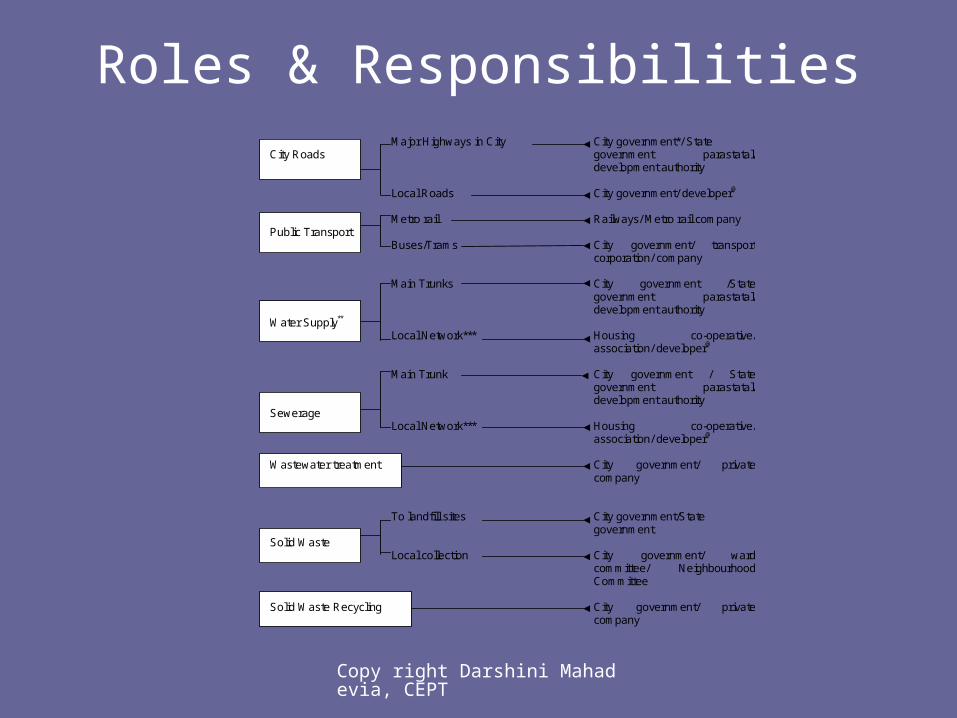
Roles & Responsibilities
Major Highways in City City government*/ State City Roads government parastatal/
development authority Local Roads City government/ developer@ Metro rail Railways/ Metro rail company Public Transport
Buses/Trams City government/ transport corporation/ company
Main Trunks City government /State
government parastatal/ development authority
Water Supply** Local Network*** Housing co-operative/
association/ developer@
Main Trunk City government / State government parastatal/ development authority
Sewerage Local Network*** Housing co-operative/
association/ developer@ Wastewater treatment City government/ private
company To landfill sites City government/State government Solid Waste
Local collection City government/ ward committee/ Neighbourhood Committee
Solid Waste Recycling City government/ private
company
Copy right Darshini Mahadevia, CEPT
Urban expenditures for womenPro-women urban expenditures• Water supply• Sanitation – Sewerage and storm water drain• Low cost Public transport (bus transit in the first phase
more than metro rails wherever feasible as Geetam Tiwari of IIT Delhi argues)
• Solid waste management• Urban poverty alleviation• Slum development• Education• Health careWomen-specific urban expenditures• Feminist services
Copy right Darshini Mahadevia, CEPT
Capturing spatial inequalities
• Most Indian cities, particularly large cities are segmented by class and some are segmented by social groups.
• For example, east Mumbai, and west Mumbai, South Mumbai and suburban Mumbai; east Ahmedabad and west Ahmedabad; South and east Bangalore and North and west Bangalore
• Expenditures need to be analysed spatially• 74th Amendment has made it possible to observe
expenditures and benefits of public expenditure by wards.
• A ward in metros like Mumbai is a city by itself.
Copy right Darshini Mahadevia, CEPT
Central schemes• National Urban Renewal Mission – 60 cities including 7 mega cities.
For infrastructure upgradation. Rs. 10,000 crores p.a. over five years. Fund in support of urban reforms. Largely metro cities (million plus), capital city in all states and other cities of historical importance. Central grant or assistance to leverage more funds on its own. Cost receovery to the extent possible and even privatisation of basic services form an important component of the NURM
• Mega City Scheme – only seven cities (Delhi, Greater Mumbai, Ahmedabad, Bangalore, Chennai, Kolkata and Hyderabad). 50% government contribution, (25% central & 25% state) and 50% of ULB raised through financial institutions or market. Government share to be given to the nodal agency as revolving fund, of which 75% to be recovered from the ULB. Only 12.5% comes to the ULB as grant.
• 12th Finance Commission grant of Rs. 5,000 crores of which 50% to be spent on Solid Waste Management that is in dismal situation now.
• In first year, NURM allocation of Rs. 5,500 crores of which Rs. 2,000 crores (36%) for urban poverty programmes and remaining for other infrastructural programmes
Copy right Darshini Mahadevia, CEPT
Considerations for engenderingFor Mega City and NURM• Public hearings and discussions on use of funds for
setting priorities of the city. Not much happening now except public hearings of municipal budget in Bangalore.
• Need for public awarness, information & consultation• Rather than a business plan for the city need for basic
services plan (in the first phase of city development), to reach out with full coverage of lacking services
• In five year plan, first years, emphasis on basic services coverage than infrastructures such as highways within the city.
• Cost recovery mechanisms for basic services to be based on intensive studies of affordability of the poorest households and poorest women.
• Systemmatic Benefit incidence analysis
Copy right Darshini Mahadevia, CEPT
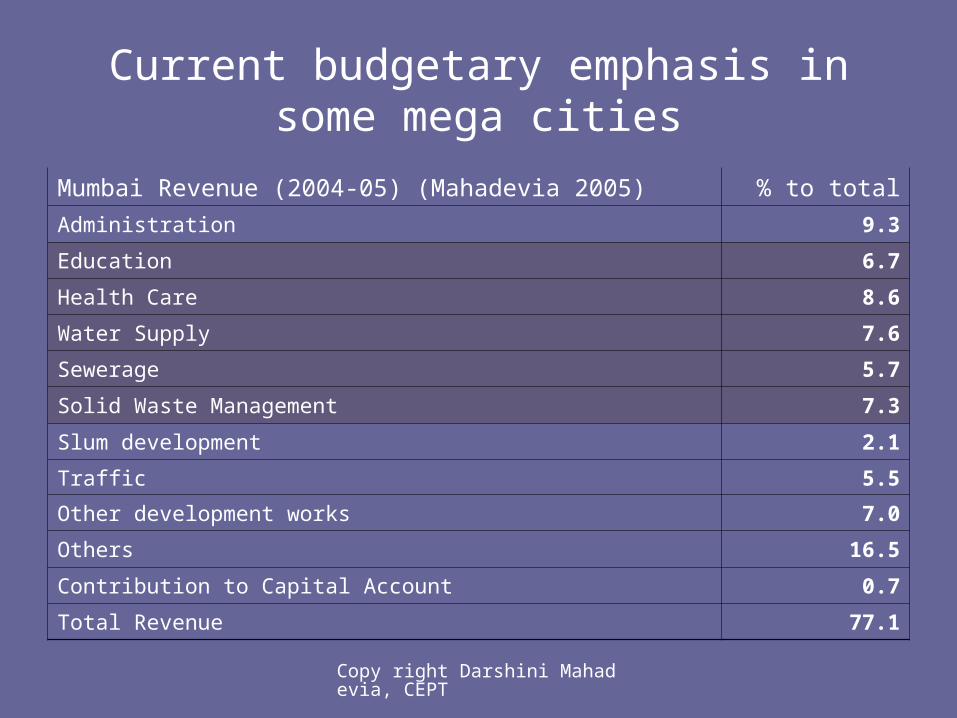
Current budgetary emphasis in some mega cities
Mumbai Revenue (2004-05) (Mahadevia 2005) % to total
Administration 9.3
Education 6.7
Health Care 8.6
Water Supply 7.6
Sewerage 5.7
Solid Waste Management 7.3
Slum development 2.1
Traffic 5.5
Other development works 7.0
Others 16.5
Contribution to Capital Account 0.7
Total Revenue 77.1
Copy right Darshini Mahadevia, CEPT
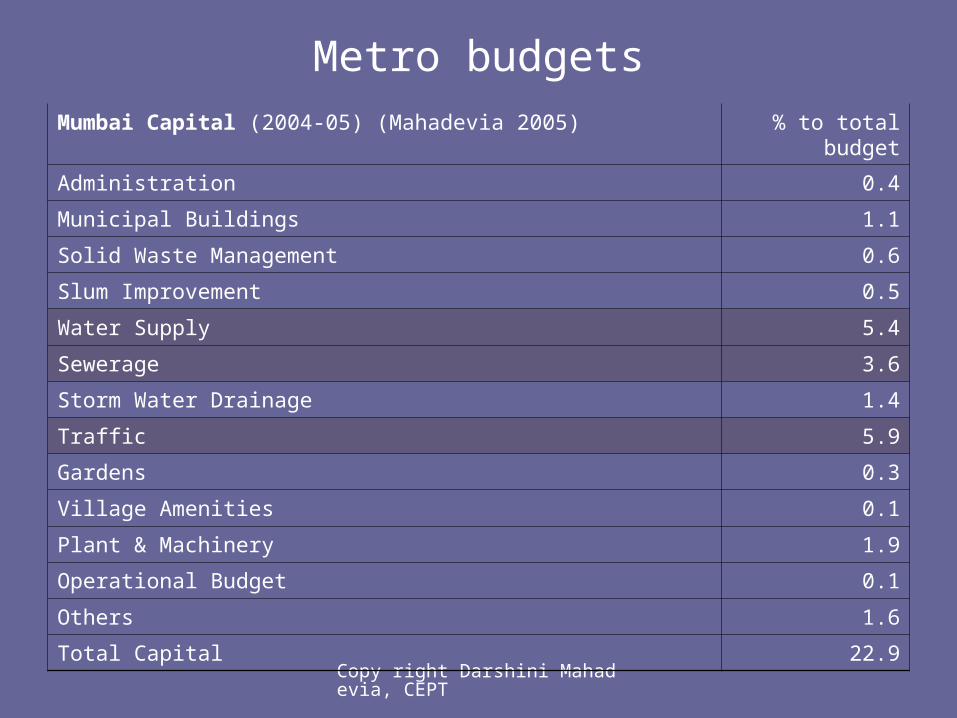
Metro budgetsMumbai Capital (2004-05) (Mahadevia 2005) % to total budget
Administration 0.4
Municipal Buildings 1.1
Solid Waste Management 0.6
Slum Improvement 0.5
Water Supply 5.4
Sewerage 3.6
Storm Water Drainage 1.4
Traffic 5.9
Gardens 0.3
Village Amenities 0.1
Plant & Machinery 1.9
Operational Budget 0.1
Others 1.6
Total Capital 22.9
Copy right Darshini Mahadevia, CEPT
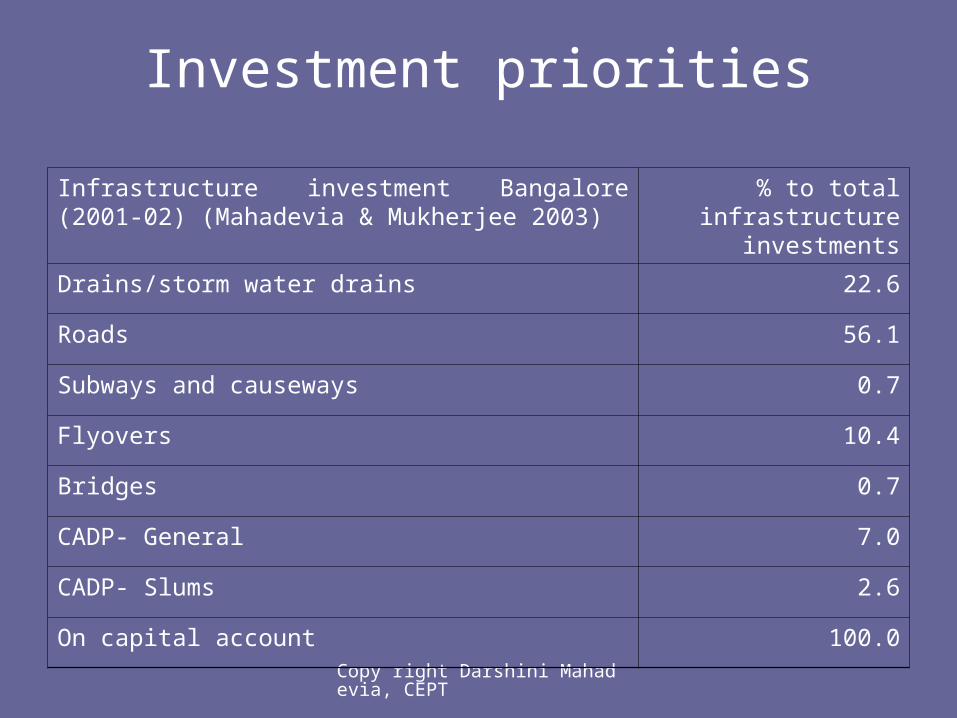
Investment priorities
Infrastructure investment Bangalore (2001-02) (Mahadevia & Mukherjee 2003)
% to total infrastructure investments
Drains/storm water drains 22.6
Roads 56.1
Subways and causeways 0.7
Flyovers 10.4
Bridges 0.7
CADP- General 7.0
CADP- Slums 2.6
On capital account 100.0

Copy right Darshini Mahadevia, CEPT
Different priorities & capabilities of cities
Per capita expenditures on water supply & sanitation (Mahadevia & Mukherjee 2003)
1997-98 1998-99 1999-00
BWSSB* 443 667 791
AMC** 150 143 200
Copy right Darshini Mahadevia, CEPT
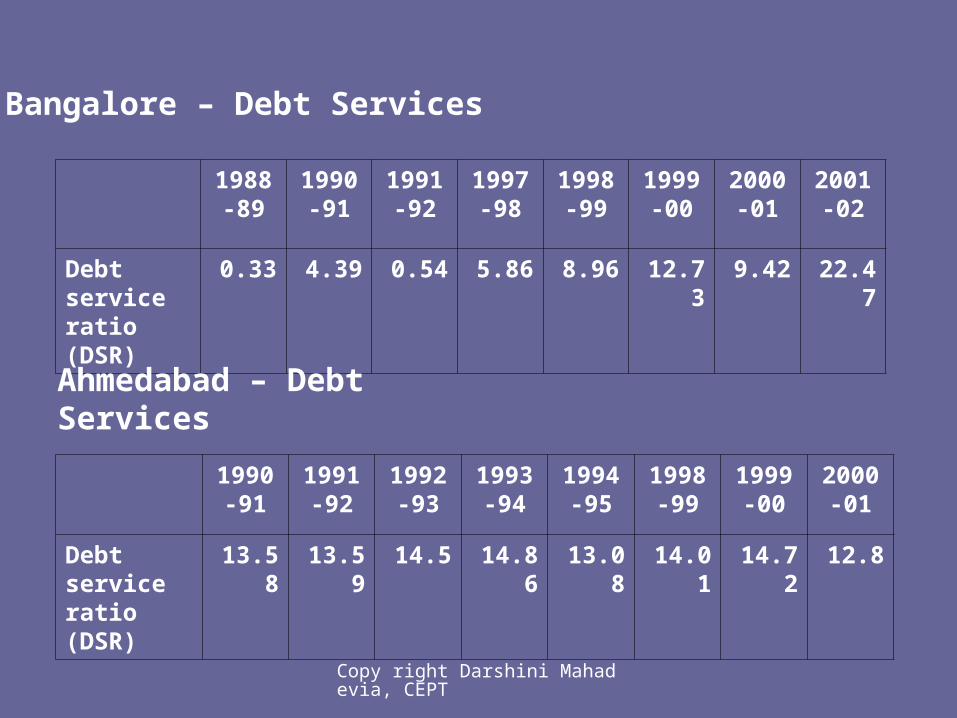
Bangalore – Debt Services
1988-89
1990-91
1991-92
1997-98
1998-99
1999-00
2000-01
2001-02
Debt service ratio (DSR)
0.33 4.39 0.54 5.86 8.96 12.73 9.42 22.47
Ahmedabad – Debt Services
1990-
911991-
921992-
931993-
941994-
951998-
991999-
002000-
01
Debt service ratio (DSR)
13.58 13.59 14.5 14.86 13.08 14.01 14.72 12.8
Copy right Darshini Mahadevia, CEPT
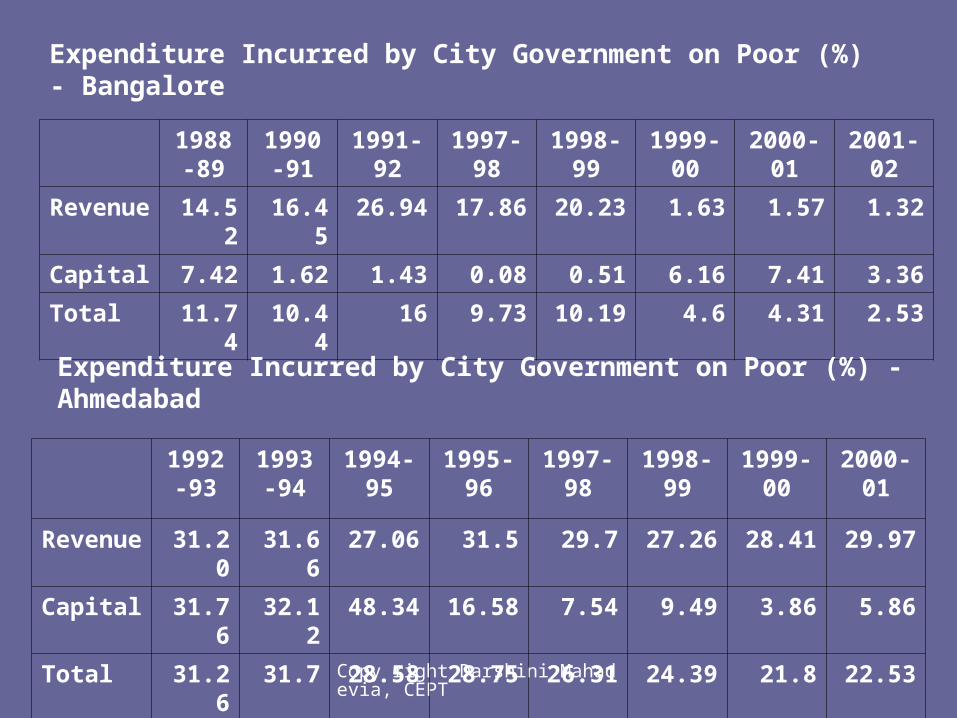
Expenditure Incurred by City Government on Poor (%) - Bangalore
1988-89
1990-91
1991-92
1997-98
1998-99
1999-00
2000-01
2001-02
Revenue 14.52 16.45 26.94 17.86 20.23 1.63 1.57 1.32
Capital 7.42 1.62 1.43 0.08 0.51 6.16 7.41 3.36
Total 11.74 10.44 16 9.73 10.19 4.6 4.31 2.53
Expenditure Incurred by City Government on Poor (%) - Ahmedabad
1992-
931993-
941994-
951995-
961997-
981998-
991999-
002000-
01
Revenue 31.20 31.66 27.06 31.5 29.7 27.26 28.41 29.97
Capital 31.76 32.12 48.34 16.58 7.54 9.49 3.86 5.86
Total 31.26 31.7 28.58 28.75 26.31 24.39 21.8 22.53
Copy right Darshini Mahadevia, CEPT
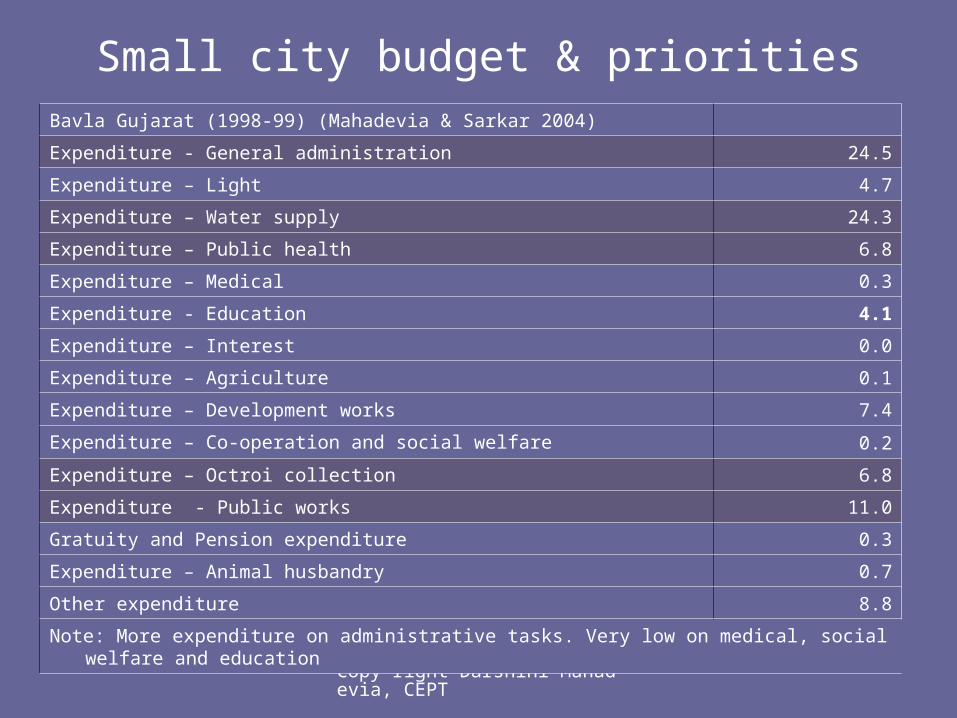
Small city budget & prioritiesBavla Gujarat (1998-99) (Mahadevia & Sarkar 2004)
Expenditure - General administration 24.5
Expenditure – Light 4.7
Expenditure – Water supply 24.3
Expenditure – Public health 6.8
Expenditure – Medical 0.3
Expenditure - Education 4.1
Expenditure – Interest 0.0
Expenditure – Agriculture 0.1
Expenditure – Development works 7.4
Expenditure – Co-operation and social welfare 0.2
Expenditure – Octroi collection 6.8
Expenditure - Public works 11.0
Gratuity and Pension expenditure 0.3
Expenditure – Animal husbandry 0.7
Other expenditure 8.8
Note: More expenditure on administrative tasks. Very low on medical, social welfare and education
Copy right Darshini Mahadevia, CEPT
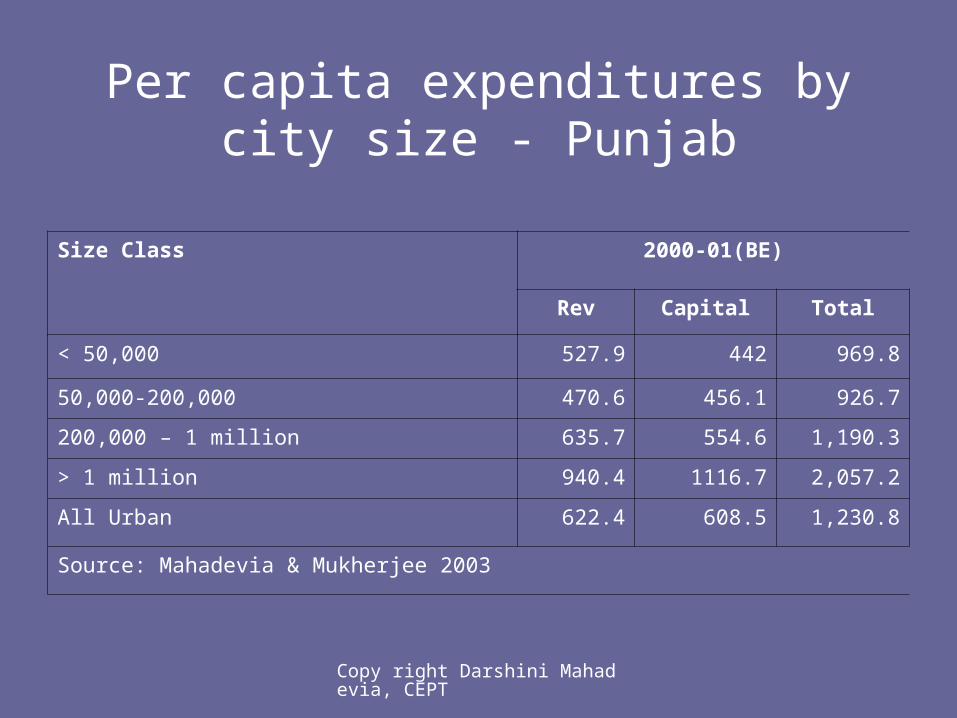
Per capita expenditures by city size - Punjab
Size Class 2000-01(BE)
Rev Capital Total
< 50,000 527.9 442 969.8
50,000-200,000 470.6 456.1 926.7
200,000 – 1 million 635.7 554.6 1,190.3
> 1 million 940.4 1116.7 2,057.2
All Urban 622.4 608.5 1,230.8
Source: Mahadevia & Mukherjee 2003

Copy right Darshini Mahadevia, CEPT
Expenditure priorities by size class - PunjabSize Class 2000-01(BE)
General Service
< 50,000 25.1
> 1 million 5.9
All Urban 12.7
Social Service
< 50,000 16.1
> 1 million 15.4
All Urban 19.5
Economic Service
< 50,000 15.6
> 1 million 28.1
All Urban 22.8
Housing and Community Service
< 50,000 39.2
> 1 million 48.4
All Urban 42.5
Debt Services
< 50,000 4
> 1 million 2.2
All Urban 2.4
Source: Mahadevia & Mukherjee (2003)
Copy right Darshini Mahadevia, CEPT
Action Points for Schemes in small cities
• Increase in efficiency of the small ULBs• Participatory need assessment and
prioritisation• Since these towns have higher sex ratio
and more poverty, reaching to women through the list of services listed earlier is easier.
• More emphasis and financial allocation to the small towns.