Embed Size (px)
Citation preview
fpls-07-01433 September 20, 2016 Time: 13:22 # 1
ORIGINAL RESEARCHpublished: 22 September 2016doi: 10.3389/fpls.2016.01433
Edited by:Jun Yu,
Beijing Institute of Genomics, China
Reviewed by:James D. Higgins,
University of Leicester, UKLongjiang Fan,
Zhejiang University, China
*Correspondence:Joann Mudge
Specialty section:This article was submitted to
Plant Genetics and Genomics,a section of the journal
Frontiers in Plant Science
Received: 20 July 2016Accepted: 08 September 2016Published: 22 September 2016
Citation:Sundararajan A, Dukowic-Schulze S,
Kwicklis M, Engstrom K, Garcia N,Oviedo OJ, Ramaraj T,
Gonzales MD, He Y, Wang M,Sun Q, Pillardy J, Kianian SF,
Pawlowski WP, Chen C andMudge J (2016) Gene Evolutionary
Trajectories and GC Patterns Drivenby Recombination in Zea mays.
Front. Plant Sci. 7:1433.doi: 10.3389/fpls.2016.01433
Gene Evolutionary Trajectories andGC Patterns Driven byRecombination in Zea maysAnitha Sundararajan1, Stefanie Dukowic-Schulze2, Madeline Kwicklis1, Kayla Engstrom1,Nathan Garcia1, Oliver J. Oviedo1, Thiruvarangan Ramaraj1, Michael D. Gonzales1,Yan He3, Minghui Wang3,4, Qi Sun4, Jaroslaw Pillardy4, Shahryar F. Kianian5,Wojciech P. Pawlowski3, Changbin Chen2 and Joann Mudge1*
1 National Center for Genome Resources, Santa Fe, NM, USA, 2 Department of Horticultural Science, University ofMinnesota, St. Paul, MN, USA, 3 Section of Plant Biology, School of Integrative Plant Science, Cornell University, Ithaca, NY,USA, 4 Biotechnology Resource Center Bioinformatics Facility, Cornell University, Ithaca, NY, USA, 5 Cereal DiseaseLaboratory, United States Department of Agriculture – Agricultural Research Service, St. Paul, MN, USA
Recombination occurring during meiosis is critical for creating genetic variation andplays an essential role in plant evolution. In addition to creating novel gene combinations,recombination can affect genome structure through altering GC patterns. In maize (Zeamays) and other grasses, another intriguing GC pattern exists. Maize genes show abimodal GC content distribution that has been attributed to nucleotide bias in the third,or wobble, position of the codon. Recombination may be an underlying driving forcegiven that recombination sites are often associated with high GC content. Here weexplore the relationship between recombination and genomic GC patterns by comparingGC gene content at each of the three codon positions (GC1, GC2, and GC3, collectivelytermed GCx) to instances of a variable GC-rich motif that underlies double strand break(DSB) hotspots and to meiocyte-specific gene expression. Surprisingly, GCx bimodalityin maize cannot be fully explained by the codon wobble hypothesis. High GCx genesshow a strong overlap with the DSB hotspot motif, possibly providing a mechanismfor the high evolutionary rates seen in these genes. On the other hand, genes thatare turned on in meiosis (early prophase I) are biased against both high GCx genesand genes with the DSB hotspot motif, possibly allowing important meiotic genes toavoid DSBs. Our data suggests a strong link between the GC-rich motif underlying DSBhotspots and high GCx genes.
Keywords: recombination, GC, meiosis, meiocytes, maize, codon usage, wobble, gene expression
INTRODUCTION
In eukaryotes, meiotic exchange of genetic information, or recombination, between homologouschromosomes is a critical step in generating genetic diversity required for adaptation.Recombination is also a crucial tool in plant improvement efforts. Local genome architecture issculpted by the recombination process, and genome architecture, in turn, drives recombination.This interplay helps to create variability in genomic space, defining relatively stable and plasticgenomic regions. This fluctuation in genomic stability is critical for balancing adaptation andstability on the phenotypic level.
Frontiers in Plant Science | www.frontiersin.org 1 September 2016 | Volume 7 | Article 1433
fpls-07-01433 September 20, 2016 Time: 13:22 # 2
Sundararajan et al. Gene Evolutionary Trajectories and GC Patterns
Recombination has direct implications for GC patterns andvice versa. GC content refers to the percentage of guanine andcytosine bases in a DNA sequence, as opposed to adenine andthymidine bases. There have been many studies substantiatingthe positive correlation between recombination and GC content(Ikemura and Wada, 1991; Eyre-Walker, 1993; Fullerton et al.,2001; Galtier et al., 2001; Marais et al., 2001; Duret and Arndt,2008; Haudry et al., 2008; Escobar et al., 2010; Muyle et al.,2011). Crossovers have been found to be correlated with highGC content in rat, mouse, human, zebrafish, bee, and maize ata broad scale (Jensen-Seaman et al., 2004; Beye et al., 2006; Goreet al., 2009; Backstrom et al., 2010; Giraut et al., 2011), while otherstudies detected strong correlation only at a fine scale (∼5 kbfor yeast, ∼15–128 kb for human) and rather weak correlationat a broad scale (∼30 kb for yeast, ∼1 Mb for human; Gertonet al., 2000; Myers et al., 2006; Marsolier-Kergoat and Yeramian,2009).
In plants, correlation of recombination and GC content hasbeen demonstrated in multiple species (Haudry et al., 2008;Escobar et al., 2010; Muyle et al., 2011). A study examiningthree different grasses (rice, maize, and Brachypodium) revealedsignificant correlation of the local recombination rate with highGC content, especially in the wobble codon position (thirdposition in the codon; Serres-Giardi et al., 2012). This wasin contrast to prior studies performed with lower levels ofresolution, which found only weak correlation in maize and nonein rice or Brachypodium (Gore et al., 2009; Tian et al., 2009; Huoet al., 2011). However, negative correlation between crossoversand high GC content was reported for Arabidopsis (Drouaudet al., 2006) in spite of the fact that a crossover motif hasbeen identified that has high GC content every third nucleotide(Wijnker et al., 2013).
While most studies agreed on a positive correlation betweenrecombination and high GC content, the cause for this hasbeen disputed (Duret and Arndt, 2008; Marsolier-Kergoat andYeramian, 2009; Giraut et al., 2011). Possible reasons suggestedfor the high GC/crossover correlation include selection on codonusage, mutational bias, or GC-biased gene conversion (Eyre-Walker and Hurst, 2001; Duret and Galtier, 2009). The latteris seen as the most likely cause for GC enrichment (Figure 1),and has been suggested for diverse organisms such as yeast,mammals, and birds (Webster et al., 2006; Duret and Arndt,2008; Mancera et al., 2008; Nabholz et al., 2011). A study byBirdsell (2002) presented compelling evidence demonstratinga highly significant positive correlation between GC in thewobble position and recombination within 6,143 ORFs analyzedin the yeast (Saccharomyces cerevisiae) genome. This studyalso showed a significant correlation between recombinationand the mean GC content of the first and second codonand recombination, but not to the same extent as withthe GC content in the third, or wobble, position (Birdsell,2002).
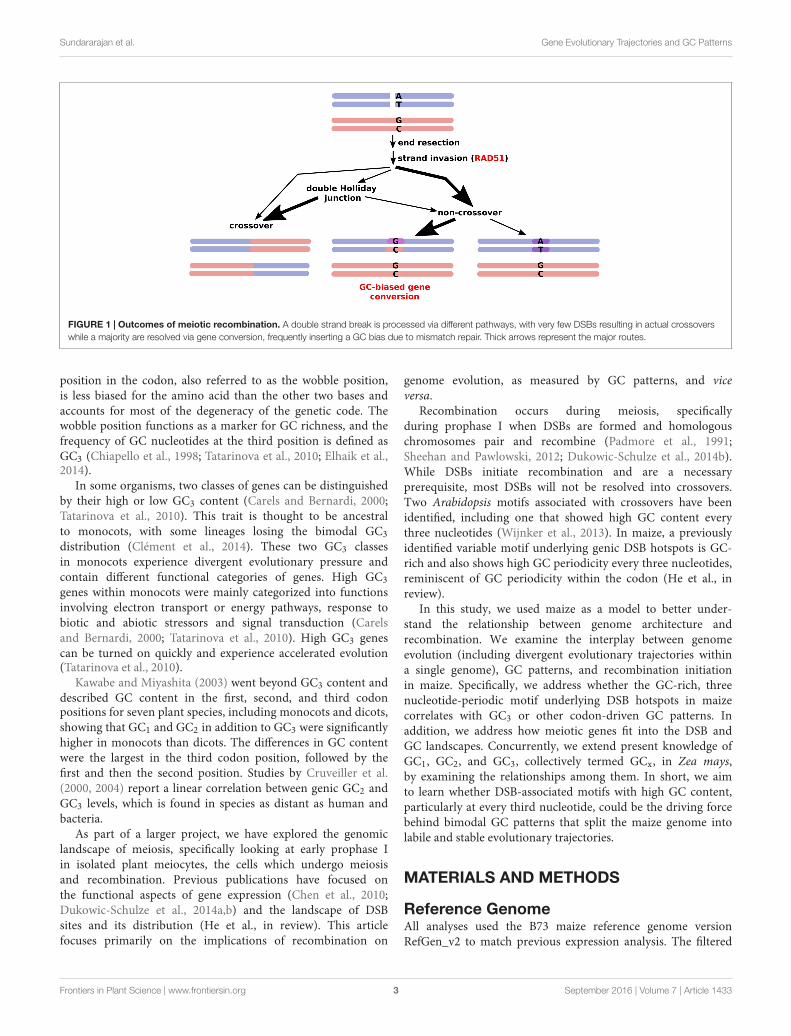
In biased gene conversion, repair tracts at recombination sitesthat are not necessarily resolved into crossovers favor changes toGC over AT (Eyre-Walker, 1993; Birdsell, 2002). This can occursimply by using the mismatch repair machinery (Marais, 2003)or by repair of double strand breaks (DSBs) in GC-poor alleles
with GC rich ones, which occurs in human but not in yeast(Duret and Arndt, 2008; Marsolier-Kergoat and Yeramian, 2009;Marsolier-Kergoat, 2011). In yeast, GC-biased gene conversionwas found specifically at crossovers, not at DSBs that did notinvolve gene conversion and did not result in a crossover, andwas shown to be due to mismatch repair rather than base excisionrepair or DSB repair (Lesecque et al., 2013). Even within-speciesvariation in GC content is partly related to recombination, beingcorrelated in mammals, birds, and yeast (Birdsell, 2002; Duretand Arndt, 2008; Nabholz et al., 2011). Notably, it has beenproposed for angiosperms, that recombination and GC-biasedgene conversion drives gene GC content patterns, even forming a5′–3′ gradient along many genes (Glémin et al., 2014). However,GC-biased gene conversion might be attenuated in inbreedingspecies such as selfing grasses leading to no apparent correlation(Giraut et al., 2011).
Triplets of the four major nucleotide bases (guanine, cytosine,adenine, and thymine/uracil) can be combined in 64 (43) differentways but encode for only 20 amino acids and the stop codon.Thus, there is redundancy in the genetic code, resulting intriplets (codons) that differ but are synonymous concerningtheir matching amino acid. GC content, mutations, and selectionpressure are critical for the evolution of heterogeneity in codonusage (Sharp et al., 1988; Sharp and Matassi, 1994; Karlinand Mrazek, 1996; Sueoka and Kawanishi, 2000). By now,it has been well documented that synonymous codon usagevaries significantly among genomes and, in addition, amongdifferent genes within any given genome (Grantham et al., 1980;Sharp et al., 1988; Wang and Hickey, 2007). One implicationof higher GC content from silent codon positions can be ageneral increased expression due to higher stability of mRNA, asdemonstrated in mammals (Kudla et al., 2006). Intra- and inter-genomic deviations in codon usage can be attributed to manyfactors. In the case of prokaryotes and unicellular organisms, it isthought to be a result of natural selection during which proteinproduction is optimized (Gouy and Gautier, 1982; Sharp andLi, 1986; Shields et al., 1988; Sharp et al., 2005). Likewise, insome higher eukaryotes, there is also evidence that codon biasmay occur due to selection for translational efficiency (Shieldset al., 1988; Stenico et al., 1994). Particularly, there is a positivecorrelation between the complementarity of the codons in highlyexpressed genes and the anticodons of the most abundant tRNAs(Ikemura, 1981; Moriyama and Powell, 1997; Kanaya et al.,1999).
Numerous studies have been conducted on codon usage inplant species including the model plants Arabidopsis (Arabidopsisthaliana), rice (Oryza sativa), and a moss (Physcomitrella patens),as well as in poplar, citrus and true grass (Poaceae/Gramineae)species (Chiapello et al., 1998; Liu et al., 2003; Guo et al.,2007; Ingvarsson, 2008; Xu et al., 2013). In addition to thereported factors involved in codon usage bias, higher averageGC content in monocot compared to dicot genomes plays animportant role in dictating codon usage differences between thetwo groups of plants (Fennoy and Bailey-Serres, 1993; Carels andBernardi, 2000). These compositional variations are illustratedby an abundance of genes with high GC levels in the thirdcodon position in monocots (Matassi et al., 1989). The third
Frontiers in Plant Science | www.frontiersin.org 2 September 2016 | Volume 7 | Article 1433
fpls-07-01433 September 20, 2016 Time: 13:22 # 3
Sundararajan et al. Gene Evolutionary Trajectories and GC Patterns
FIGURE 1 | Outcomes of meiotic recombination. A double strand break is processed via different pathways, with very few DSBs resulting in actual crossoverswhile a majority are resolved via gene conversion, frequently inserting a GC bias due to mismatch repair. Thick arrows represent the major routes.
position in the codon, also referred to as the wobble position,is less biased for the amino acid than the other two bases andaccounts for most of the degeneracy of the genetic code. Thewobble position functions as a marker for GC richness, and thefrequency of GC nucleotides at the third position is defined asGC3 (Chiapello et al., 1998; Tatarinova et al., 2010; Elhaik et al.,2014).
In some organisms, two classes of genes can be distinguishedby their high or low GC3 content (Carels and Bernardi, 2000;Tatarinova et al., 2010). This trait is thought to be ancestralto monocots, with some lineages losing the bimodal GC3distribution (Clément et al., 2014). These two GC3 classesin monocots experience divergent evolutionary pressure andcontain different functional categories of genes. High GC3genes within monocots were mainly categorized into functionsinvolving electron transport or energy pathways, response tobiotic and abiotic stressors and signal transduction (Carelsand Bernardi, 2000; Tatarinova et al., 2010). High GC3 genescan be turned on quickly and experience accelerated evolution(Tatarinova et al., 2010).
Kawabe and Miyashita (2003) went beyond GC3 content anddescribed GC content in the first, second, and third codonpositions for seven plant species, including monocots and dicots,showing that GC1 and GC2 in addition to GC3 were significantlyhigher in monocots than dicots. The differences in GC contentwere the largest in the third codon position, followed by thefirst and then the second position. Studies by Cruveiller et al.(2000, 2004) report a linear correlation between genic GC2 andGC3 levels, which is found in species as distant as human andbacteria.
As part of a larger project, we have explored the genomiclandscape of meiosis, specifically looking at early prophase Iin isolated plant meiocytes, the cells which undergo meiosisand recombination. Previous publications have focused onthe functional aspects of gene expression (Chen et al., 2010;Dukowic-Schulze et al., 2014a,b) and the landscape of DSBsites and its distribution (He et al., in review). This articlefocuses primarily on the implications of recombination on
genome evolution, as measured by GC patterns, and viceversa.
Recombination occurs during meiosis, specificallyduring prophase I when DSBs are formed and homologouschromosomes pair and recombine (Padmore et al., 1991;Sheehan and Pawlowski, 2012; Dukowic-Schulze et al., 2014b).While DSBs initiate recombination and are a necessaryprerequisite, most DSBs will not be resolved into crossovers.Two Arabidopsis motifs associated with crossovers have beenidentified, including one that showed high GC content everythree nucleotides (Wijnker et al., 2013). In maize, a previouslyidentified variable motif underlying genic DSB hotspots is GC-rich and also shows high GC periodicity every three nucleotides,reminiscent of GC periodicity within the codon (He et al., inreview).
In this study, we used maize as a model to better under-stand the relationship between genome architecture andrecombination. We examine the interplay between genomeevolution (including divergent evolutionary trajectories withina single genome), GC patterns, and recombination initiationin maize. Specifically, we address whether the GC-rich, threenucleotide-periodic motif underlying DSB hotspots in maizecorrelates with GC3 or other codon-driven GC patterns. Inaddition, we address how meiotic genes fit into the DSB andGC landscapes. Concurrently, we extend present knowledge ofGC1, GC2, and GC3, collectively termed GCx, in Zea mays,by examining the relationships among them. In short, we aimto learn whether DSB-associated motifs with high GC content,particularly at every third nucleotide, could be the driving forcebehind bimodal GC patterns that split the maize genome intolabile and stable evolutionary trajectories.
MATERIALS AND METHODS
Reference GenomeAll analyses used the B73 maize reference genome versionRefGen_v2 to match previous expression analysis. The filtered
Frontiers in Plant Science | www.frontiersin.org 3 September 2016 | Volume 7 | Article 1433
fpls-07-01433 September 20, 2016 Time: 13:22 # 4
Sundararajan et al. Gene Evolutionary Trajectories and GC Patterns
gene set (annotation set 5b, gff format) was used for geneannotation.
Differential Expression AnalysisSamples, sequence, and differential expression analyses aredescribed in Dukowic-Schulze et al. (2014a,b,c). For this analysis,a less stringent dataset was used with a significance cutoff forcalling differential expression increased from p= 0.01 to p= 0.05.
Double Strand Break HotspotsUsing ChIP-seq with antibodies against the RAD51 proteinas described in He et al. (2013), the DSB hotspot motif wasidentified with the sequence GVSGRSGNSGRSGVSGRSG (Heet al., in review). The motif was identified from ∼900 genichotspot regions that did not contain transposable elements.Copies of the motif were identified using the rGADEM package(Li, 2009) to re-scan these genic hotspot regions for matchesto the position weight matrix of the motif using a stringencyof 80%.
GC CalculationsGC, GC1, GC2, and GC3 were calculated using custom Perlscripts. For GC1, GC2, and GC3, calculations for each genewere performed on the sequence that contributes to the protein(coding domain sequences (CDSs), and redundancies removedwhere CDSs overlapped. The phase of each CDS, defined as thenumber of nucleotides that need be removed from the beginningof the CDS to find the first base of the next codon, was taken intoaccount. GC1 represents the GC content of the first nucleotides,GC2 the content of the second nucleotides, and GC3 the contentof the third nucleotides of all codons in a gene. Genic GC wascalculated for exons only (CDSs) as well as for exons togetherwith introns in the pre-mRNA.
Pathway Enrichment AnalysisagriGO was used to perform gene ontology (GO) enrichmentstudies (Du et al., 2010) using singular enrichment analysisto identify enrichment compared to the Z. mays reference.Advanced statistical options include Fisher’s exact test and,in order to perform multi-comparison adjustment with thelarge input dataset, the Benjamini–Hochberg correction method(Benjamini and Hochberg, 1995). A significance value of 0.05 wasused to obtain lists of enriched GO terms unless the input gene listwas large, in which case we focused on the most significant terms(p= 0.01). This did not alter the nature of the functionalities thatwere enriched for within the analyses. In order to consolidatethe large list of GO terms, REVIGO was used (Supek et al.,2011). REVIGO uses a simple hierarchical clustering procedure toremove redundant terms, summarize related terms, and visualizethe final set of GO terms.
Plotting and Statistical AnalysesPlotting was done in R Statistical Package 3.2.0 and two-sided chi-square tests performed in Microsoft Excel v14.6.4.
RESULTS
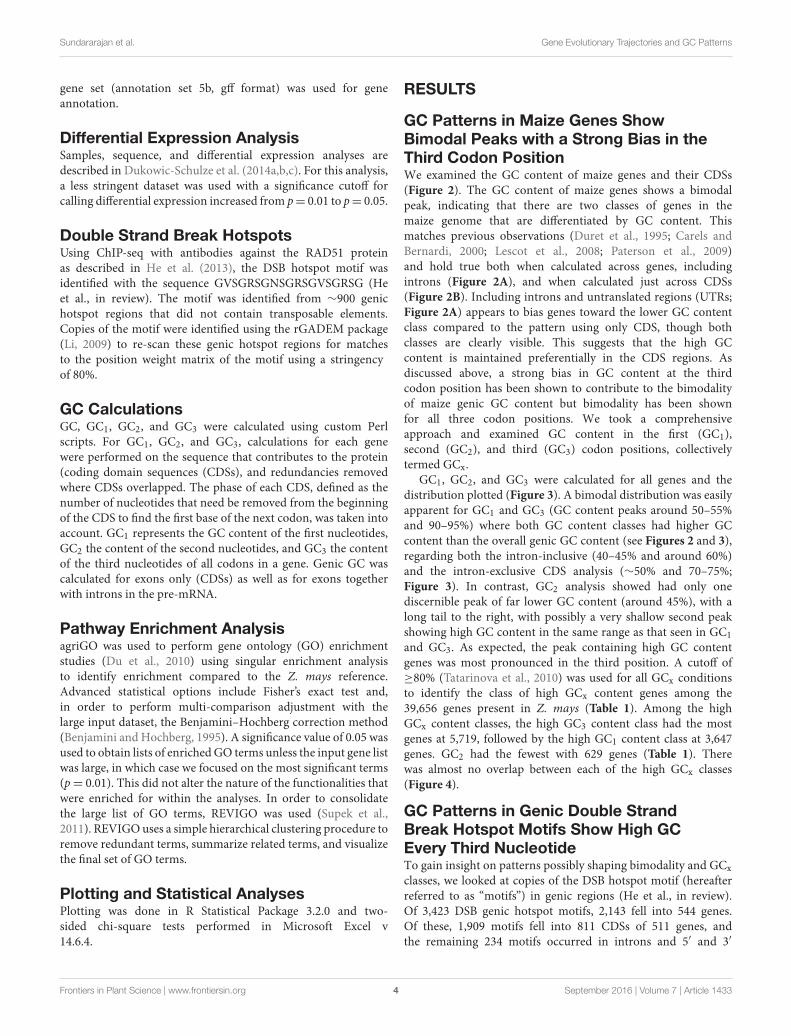
GC Patterns in Maize Genes ShowBimodal Peaks with a Strong Bias in theThird Codon PositionWe examined the GC content of maize genes and their CDSs(Figure 2). The GC content of maize genes shows a bimodalpeak, indicating that there are two classes of genes in themaize genome that are differentiated by GC content. Thismatches previous observations (Duret et al., 1995; Carels andBernardi, 2000; Lescot et al., 2008; Paterson et al., 2009)and hold true both when calculated across genes, includingintrons (Figure 2A), and when calculated just across CDSs(Figure 2B). Including introns and untranslated regions (UTRs;Figure 2A) appears to bias genes toward the lower GC contentclass compared to the pattern using only CDS, though bothclasses are clearly visible. This suggests that the high GCcontent is maintained preferentially in the CDS regions. Asdiscussed above, a strong bias in GC content at the thirdcodon position has been shown to contribute to the bimodalityof maize genic GC content but bimodality has been shownfor all three codon positions. We took a comprehensiveapproach and examined GC content in the first (GC1),second (GC2), and third (GC3) codon positions, collectivelytermed GCx.
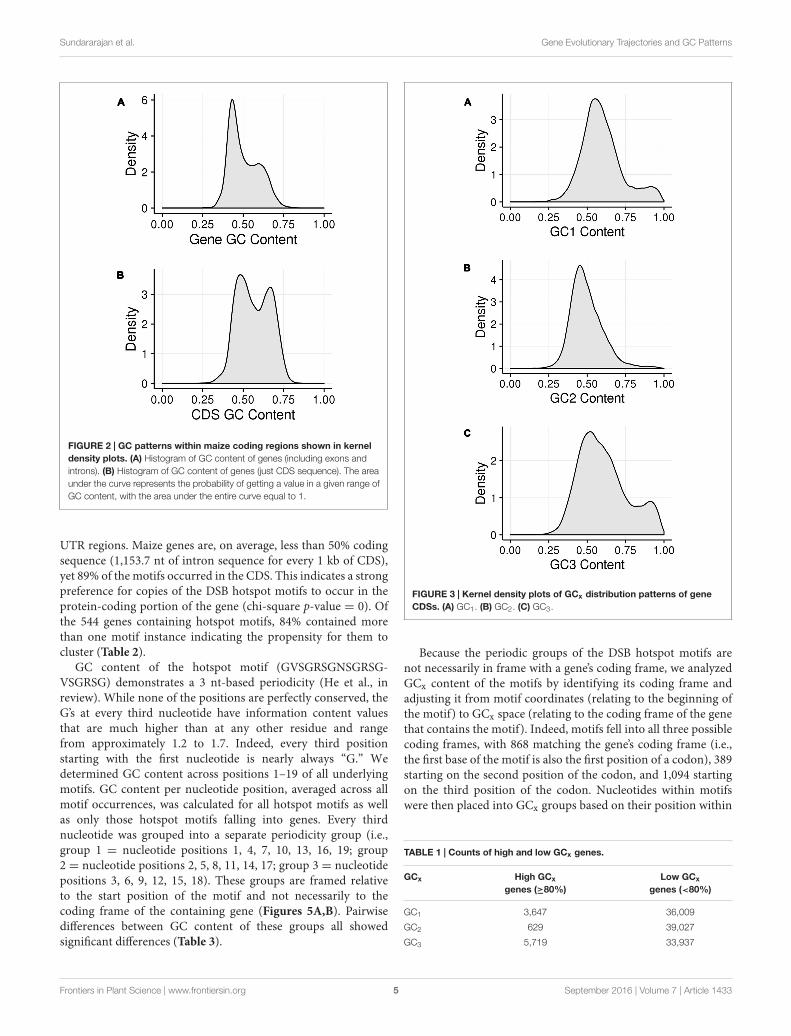
GC1, GC2, and GC3 were calculated for all genes and thedistribution plotted (Figure 3). A bimodal distribution was easilyapparent for GC1 and GC3 (GC content peaks around 50–55%and 90–95%) where both GC content classes had higher GCcontent than the overall genic GC content (see Figures 2 and 3),regarding both the intron-inclusive (40–45% and around 60%)and the intron-exclusive CDS analysis (∼50% and 70–75%;Figure 3). In contrast, GC2 analysis showed had only onediscernible peak of far lower GC content (around 45%), with along tail to the right, with possibly a very shallow second peakshowing high GC content in the same range as that seen in GC1and GC3. As expected, the peak containing high GC contentgenes was most pronounced in the third position. A cutoff of≥80% (Tatarinova et al., 2010) was used for all GCx conditionsto identify the class of high GCx content genes among the39,656 genes present in Z. mays (Table 1). Among the highGCx content classes, the high GC3 content class had the mostgenes at 5,719, followed by the high GC1 content class at 3,647genes. GC2 had the fewest with 629 genes (Table 1). Therewas almost no overlap between each of the high GCx classes(Figure 4).
GC Patterns in Genic Double StrandBreak Hotspot Motifs Show High GCEvery Third NucleotideTo gain insight on patterns possibly shaping bimodality and GCxclasses, we looked at copies of the DSB hotspot motif (hereafterreferred to as “motifs”) in genic regions (He et al., in review).Of 3,423 DSB genic hotspot motifs, 2,143 fell into 544 genes.Of these, 1,909 motifs fell into 811 CDSs of 511 genes, andthe remaining 234 motifs occurred in introns and 5′ and 3′
Frontiers in Plant Science | www.frontiersin.org 4 September 2016 | Volume 7 | Article 1433
fpls-07-01433 September 20, 2016 Time: 13:22 # 5
Sundararajan et al. Gene Evolutionary Trajectories and GC Patterns
FIGURE 2 | GC patterns within maize coding regions shown in kerneldensity plots. (A) Histogram of GC content of genes (including exons andintrons). (B) Histogram of GC content of genes (just CDS sequence). The areaunder the curve represents the probability of getting a value in a given range ofGC content, with the area under the entire curve equal to 1.
UTR regions. Maize genes are, on average, less than 50% codingsequence (1,153.7 nt of intron sequence for every 1 kb of CDS),yet 89% of the motifs occurred in the CDS. This indicates a strongpreference for copies of the DSB hotspot motifs to occur in theprotein-coding portion of the gene (chi-square p-value = 0). Ofthe 544 genes containing hotspot motifs, 84% contained morethan one motif instance indicating the propensity for them tocluster (Table 2).
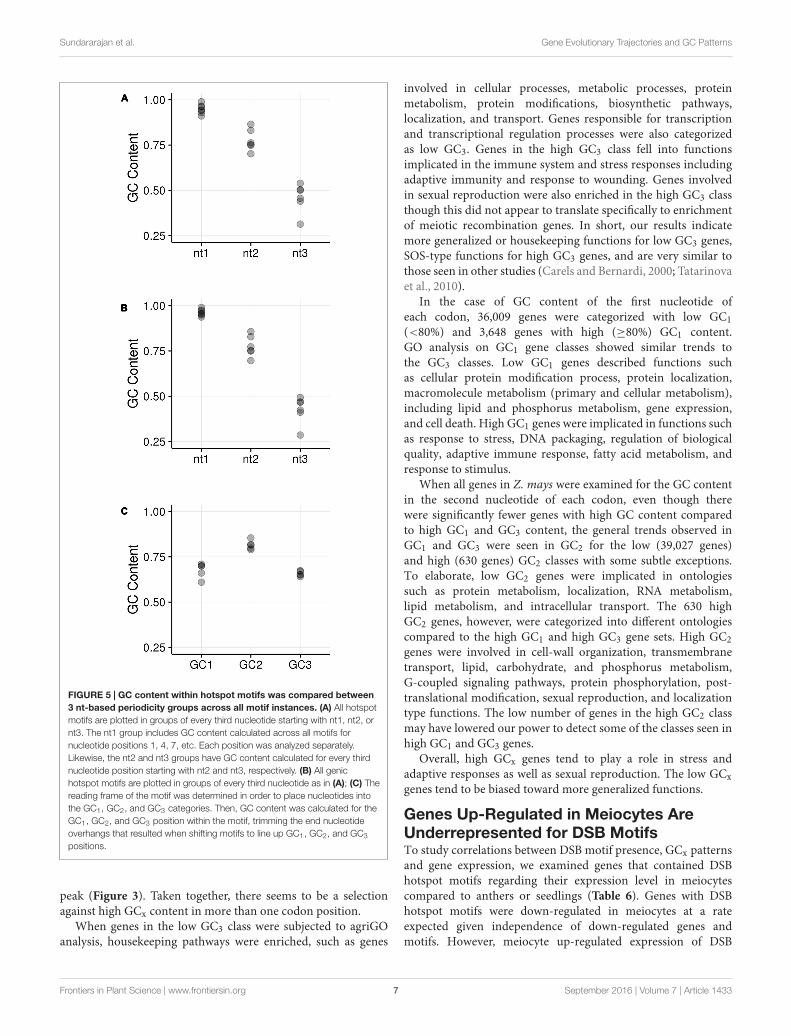
GC content of the hotspot motif (GVSGRSGNSGRSG-VSGRSG) demonstrates a 3 nt-based periodicity (He et al., inreview). While none of the positions are perfectly conserved, theG’s at every third nucleotide have information content valuesthat are much higher than at any other residue and rangefrom approximately 1.2 to 1.7. Indeed, every third positionstarting with the first nucleotide is nearly always “G.” Wedetermined GC content across positions 1–19 of all underlyingmotifs. GC content per nucleotide position, averaged across allmotif occurrences, was calculated for all hotspot motifs as wellas only those hotspot motifs falling into genes. Every thirdnucleotide was grouped into a separate periodicity group (i.e.,group 1 = nucleotide positions 1, 4, 7, 10, 13, 16, 19; group2 = nucleotide positions 2, 5, 8, 11, 14, 17; group 3 = nucleotidepositions 3, 6, 9, 12, 15, 18). These groups are framed relativeto the start position of the motif and not necessarily to thecoding frame of the containing gene (Figures 5A,B). Pairwisedifferences between GC content of these groups all showedsignificant differences (Table 3).
FIGURE 3 | Kernel density plots of GCx distribution patterns of geneCDSs. (A) GC1. (B) GC2. (C) GC3.
Because the periodic groups of the DSB hotspot motifs arenot necessarily in frame with a gene’s coding frame, we analyzedGCx content of the motifs by identifying its coding frame andadjusting it from motif coordinates (relating to the beginning ofthe motif) to GCx space (relating to the coding frame of the genethat contains the motif). Indeed, motifs fell into all three possiblecoding frames, with 868 matching the gene’s coding frame (i.e.,the first base of the motif is also the first position of a codon), 389starting on the second position of the codon, and 1,094 startingon the third position of the codon. Nucleotides within motifswere then placed into GCx groups based on their position within
TABLE 1 | Counts of high and low GCx genes.
GCx High GCx
genes (≥80%)Low GCx
genes (<80%)
GC1 3,647 36,009
GC2 629 39,027
GC3 5,719 33,937
Frontiers in Plant Science | www.frontiersin.org 5 September 2016 | Volume 7 | Article 1433
fpls-07-01433 September 20, 2016 Time: 13:22 # 6
Sundararajan et al. Gene Evolutionary Trajectories and GC Patterns
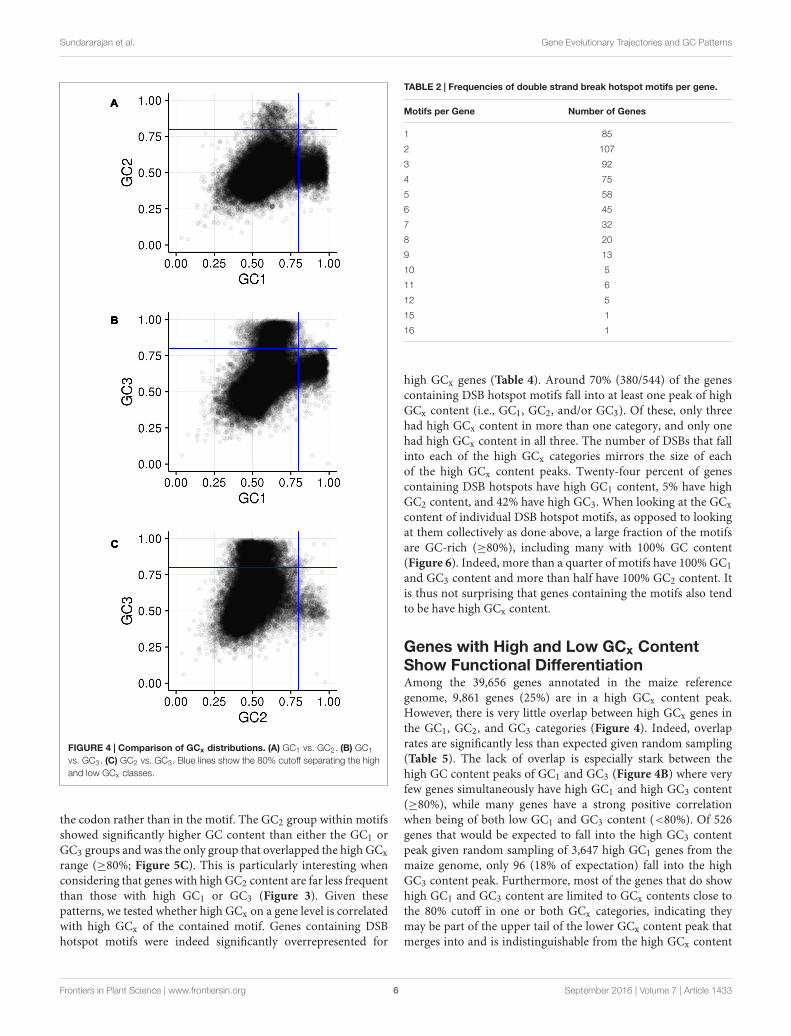
FIGURE 4 | Comparison of GCx distributions. (A) GC1 vs. GC2. (B) GC1
vs. GC3. (C) GC2 vs. GC3. Blue lines show the 80% cutoff separating the highand low GCx classes.
the codon rather than in the motif. The GC2 group within motifsshowed significantly higher GC content than either the GC1 orGC3 groups and was the only group that overlapped the high GCxrange (≥80%; Figure 5C). This is particularly interesting whenconsidering that genes with high GC2 content are far less frequentthan those with high GC1 or GC3 (Figure 3). Given thesepatterns, we tested whether high GCx on a gene level is correlatedwith high GCx of the contained motif. Genes containing DSBhotspot motifs were indeed significantly overrepresented for
TABLE 2 | Frequencies of double strand break hotspot motifs per gene.
Motifs per Gene Number of Genes
1 85
2 107
3 92
4 75
5 58
6 45
7 32
8 20
9 13
10 5
11 6
12 5
15 1
16 1
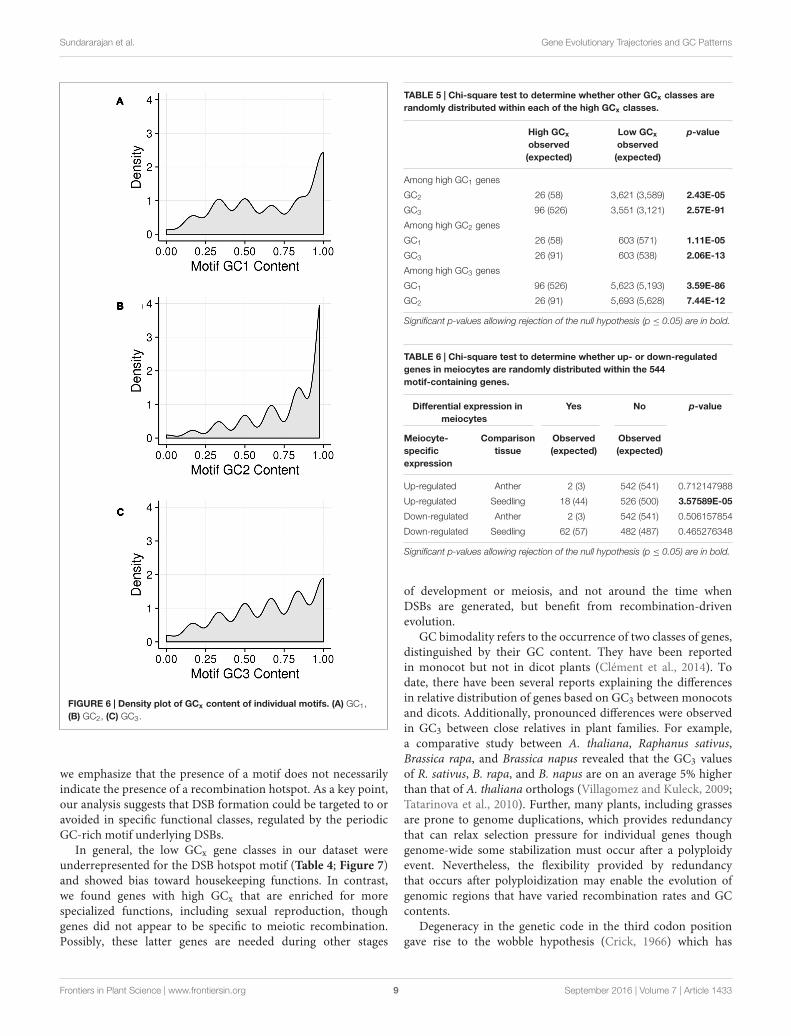
high GCx genes (Table 4). Around 70% (380/544) of the genescontaining DSB hotspot motifs fall into at least one peak of highGCx content (i.e., GC1, GC2, and/or GC3). Of these, only threehad high GCx content in more than one category, and only onehad high GCx content in all three. The number of DSBs that fallinto each of the high GCx categories mirrors the size of eachof the high GCx content peaks. Twenty-four percent of genescontaining DSB hotspots have high GC1 content, 5% have highGC2 content, and 42% have high GC3. When looking at the GCxcontent of individual DSB hotspot motifs, as opposed to lookingat them collectively as done above, a large fraction of the motifsare GC-rich (≥80%), including many with 100% GC content(Figure 6). Indeed, more than a quarter of motifs have 100% GC1and GC3 content and more than half have 100% GC2 content. Itis thus not surprising that genes containing the motifs also tendto be have high GCx content.
Genes with High and Low GCx ContentShow Functional DifferentiationAmong the 39,656 genes annotated in the maize referencegenome, 9,861 genes (25%) are in a high GCx content peak.However, there is very little overlap between high GCx genes inthe GC1, GC2, and GC3 categories (Figure 4). Indeed, overlaprates are significantly less than expected given random sampling(Table 5). The lack of overlap is especially stark between thehigh GC content peaks of GC1 and GC3 (Figure 4B) where veryfew genes simultaneously have high GC1 and high GC3 content(≥80%), while many genes have a strong positive correlationwhen being of both low GC1 and GC3 content (<80%). Of 526genes that would be expected to fall into the high GC3 contentpeak given random sampling of 3,647 high GC1 genes from themaize genome, only 96 (18% of expectation) fall into the highGC3 content peak. Furthermore, most of the genes that do showhigh GC1 and GC3 content are limited to GCx contents close tothe 80% cutoff in one or both GCx categories, indicating theymay be part of the upper tail of the lower GCx content peak thatmerges into and is indistinguishable from the high GCx content
Frontiers in Plant Science | www.frontiersin.org 6 September 2016 | Volume 7 | Article 1433
fpls-07-01433 September 20, 2016 Time: 13:22 # 7
Sundararajan et al. Gene Evolutionary Trajectories and GC Patterns
FIGURE 5 | GC content within hotspot motifs was compared between3 nt-based periodicity groups across all motif instances. (A) All hotspotmotifs are plotted in groups of every third nucleotide starting with nt1, nt2, ornt3. The nt1 group includes GC content calculated across all motifs fornucleotide positions 1, 4, 7, etc. Each position was analyzed separately.Likewise, the nt2 and nt3 groups have GC content calculated for every thirdnucleotide position starting with nt2 and nt3, respectively. (B) All genichotspot motifs are plotted in groups of every third nucleotide as in (A); (C) Thereading frame of the motif was determined in order to place nucleotides intothe GC1, GC2, and GC3 categories. Then, GC content was calculated for theGC1, GC2, and GC3 position within the motif, trimming the end nucleotideoverhangs that resulted when shifting motifs to line up GC1, GC2, and GC3
positions.
peak (Figure 3). Taken together, there seems to be a selectionagainst high GCx content in more than one codon position.
When genes in the low GC3 class were subjected to agriGOanalysis, housekeeping pathways were enriched, such as genes
involved in cellular processes, metabolic processes, proteinmetabolism, protein modifications, biosynthetic pathways,localization, and transport. Genes responsible for transcriptionand transcriptional regulation processes were also categorizedas low GC3. Genes in the high GC3 class fell into functionsimplicated in the immune system and stress responses includingadaptive immunity and response to wounding. Genes involvedin sexual reproduction were also enriched in the high GC3 classthough this did not appear to translate specifically to enrichmentof meiotic recombination genes. In short, our results indicatemore generalized or housekeeping functions for low GC3 genes,SOS-type functions for high GC3 genes, and are very similar tothose seen in other studies (Carels and Bernardi, 2000; Tatarinovaet al., 2010).
In the case of GC content of the first nucleotide ofeach codon, 36,009 genes were categorized with low GC1(<80%) and 3,648 genes with high (≥80%) GC1 content.GO analysis on GC1 gene classes showed similar trends tothe GC3 classes. Low GC1 genes described functions suchas cellular protein modification process, protein localization,macromolecule metabolism (primary and cellular metabolism),including lipid and phosphorus metabolism, gene expression,and cell death. High GC1 genes were implicated in functions suchas response to stress, DNA packaging, regulation of biologicalquality, adaptive immune response, fatty acid metabolism, andresponse to stimulus.
When all genes in Z. mays were examined for the GC contentin the second nucleotide of each codon, even though therewere significantly fewer genes with high GC content comparedto high GC1 and GC3 content, the general trends observed inGC1 and GC3 were seen in GC2 for the low (39,027 genes)and high (630 genes) GC2 classes with some subtle exceptions.To elaborate, low GC2 genes were implicated in ontologiessuch as protein metabolism, localization, RNA metabolism,lipid metabolism, and intracellular transport. The 630 highGC2 genes, however, were categorized into different ontologiescompared to the high GC1 and high GC3 gene sets. High GC2genes were involved in cell-wall organization, transmembranetransport, lipid, carbohydrate, and phosphorus metabolism,G-coupled signaling pathways, protein phosphorylation, post-translational modification, sexual reproduction, and localizationtype functions. The low number of genes in the high GC2 classmay have lowered our power to detect some of the classes seen inhigh GC1 and GC3 genes.
Overall, high GCx genes tend to play a role in stress andadaptive responses as well as sexual reproduction. The low GCxgenes tend to be biased toward more generalized functions.
Genes Up-Regulated in Meiocytes AreUnderrepresented for DSB MotifsTo study correlations between DSB motif presence, GCx patternsand gene expression, we examined genes that contained DSBhotspot motifs regarding their expression level in meiocytescompared to anthers or seedlings (Table 6). Genes with DSBhotspot motifs were down-regulated in meiocytes at a rateexpected given independence of down-regulated genes andmotifs. However, meiocyte up-regulated expression of DSB
Frontiers in Plant Science | www.frontiersin.org 7 September 2016 | Volume 7 | Article 1433
fpls-07-01433 September 20, 2016 Time: 13:22 # 8
Sundararajan et al. Gene Evolutionary Trajectories and GC Patterns
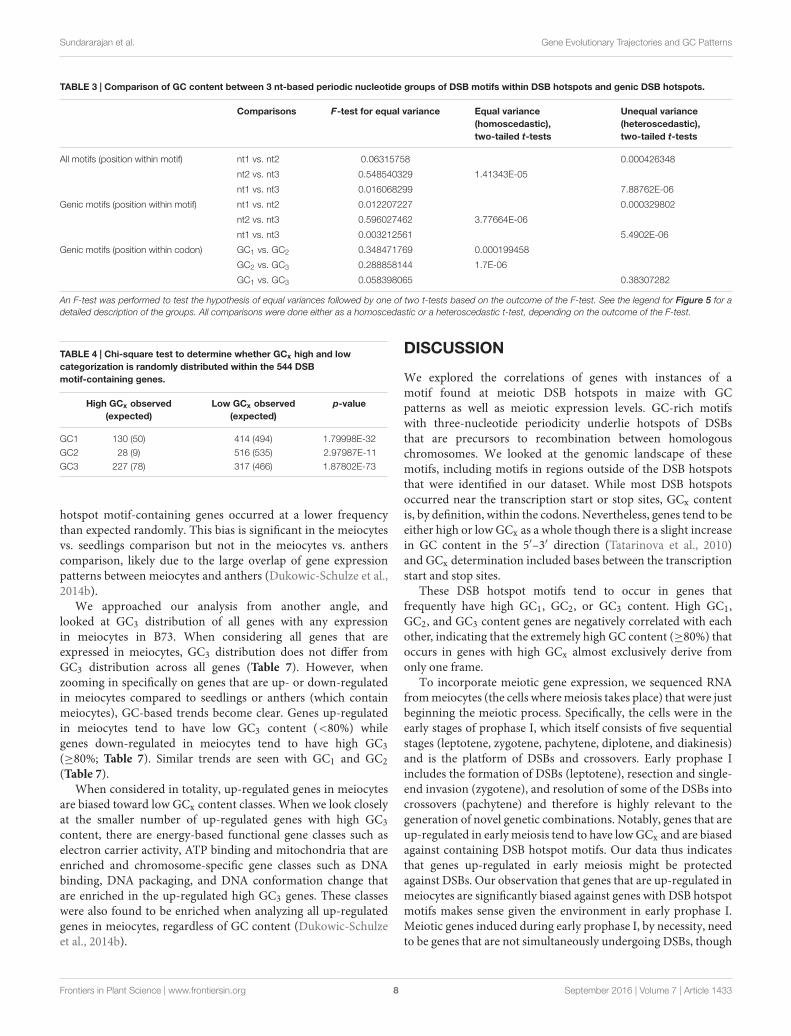
TABLE 3 | Comparison of GC content between 3 nt-based periodic nucleotide groups of DSB motifs within DSB hotspots and genic DSB hotspots.
Comparisons F-test for equal variance Equal variance(homoscedastic),two-tailed t-tests
Unequal variance(heteroscedastic),two-tailed t-tests
All motifs (position within motif) nt1 vs. nt2 0.06315758 0.000426348
nt2 vs. nt3 0.548540329 1.41343E-05
nt1 vs. nt3 0.016068299 7.88762E-06
Genic motifs (position within motif) nt1 vs. nt2 0.012207227 0.000329802
nt2 vs. nt3 0.596027462 3.77664E-06
nt1 vs. nt3 0.003212561 5.4902E-06
Genic motifs (position within codon) GC1 vs. GC2 0.348471769 0.000199458
GC2 vs. GC3 0.288858144 1.7E-06
GC1 vs. GC3 0.058398065 0.38307282
An F-test was performed to test the hypothesis of equal variances followed by one of two t-tests based on the outcome of the F-test. See the legend for Figure 5 for adetailed description of the groups. All comparisons were done either as a homoscedastic or a heteroscedastic t-test, depending on the outcome of the F-test.
TABLE 4 | Chi-square test to determine whether GCx high and lowcategorization is randomly distributed within the 544 DSBmotif-containing genes.
High GCx observed(expected)
Low GCx observed(expected)
p-value
GC1 130 (50) 414 (494) 1.79998E-32
GC2 28 (9) 516 (535) 2.97987E-11
GC3 227 (78) 317 (466) 1.87802E-73
hotspot motif-containing genes occurred at a lower frequencythan expected randomly. This bias is significant in the meiocytesvs. seedlings comparison but not in the meiocytes vs. antherscomparison, likely due to the large overlap of gene expressionpatterns between meiocytes and anthers (Dukowic-Schulze et al.,2014b).
We approached our analysis from another angle, andlooked at GC3 distribution of all genes with any expressionin meiocytes in B73. When considering all genes that areexpressed in meiocytes, GC3 distribution does not differ fromGC3 distribution across all genes (Table 7). However, whenzooming in specifically on genes that are up- or down-regulatedin meiocytes compared to seedlings or anthers (which containmeiocytes), GC-based trends become clear. Genes up-regulatedin meiocytes tend to have low GC3 content (<80%) whilegenes down-regulated in meiocytes tend to have high GC3(≥80%; Table 7). Similar trends are seen with GC1 and GC2(Table 7).
When considered in totality, up-regulated genes in meiocytesare biased toward low GCx content classes. When we look closelyat the smaller number of up-regulated genes with high GC3content, there are energy-based functional gene classes such aselectron carrier activity, ATP binding and mitochondria that areenriched and chromosome-specific gene classes such as DNAbinding, DNA packaging, and DNA conformation change thatare enriched in the up-regulated high GC3 genes. These classeswere also found to be enriched when analyzing all up-regulatedgenes in meiocytes, regardless of GC content (Dukowic-Schulzeet al., 2014b).
DISCUSSION
We explored the correlations of genes with instances of amotif found at meiotic DSB hotspots in maize with GCpatterns as well as meiotic expression levels. GC-rich motifswith three-nucleotide periodicity underlie hotspots of DSBsthat are precursors to recombination between homologouschromosomes. We looked at the genomic landscape of thesemotifs, including motifs in regions outside of the DSB hotspotsthat were identified in our dataset. While most DSB hotspotsoccurred near the transcription start or stop sites, GCx contentis, by definition, within the codons. Nevertheless, genes tend to beeither high or low GCx as a whole though there is a slight increasein GC content in the 5′–3′ direction (Tatarinova et al., 2010)and GCx determination included bases between the transcriptionstart and stop sites.
These DSB hotspot motifs tend to occur in genes thatfrequently have high GC1, GC2, or GC3 content. High GC1,GC2, and GC3 content genes are negatively correlated with eachother, indicating that the extremely high GC content (≥80%) thatoccurs in genes with high GCx almost exclusively derive fromonly one frame.
To incorporate meiotic gene expression, we sequenced RNAfrom meiocytes (the cells where meiosis takes place) that were justbeginning the meiotic process. Specifically, the cells were in theearly stages of prophase I, which itself consists of five sequentialstages (leptotene, zygotene, pachytene, diplotene, and diakinesis)and is the platform of DSBs and crossovers. Early prophase Iincludes the formation of DSBs (leptotene), resection and single-end invasion (zygotene), and resolution of some of the DSBs intocrossovers (pachytene) and therefore is highly relevant to thegeneration of novel genetic combinations. Notably, genes that areup-regulated in early meiosis tend to have low GCx and are biasedagainst containing DSB hotspot motifs. Our data thus indicatesthat genes up-regulated in early meiosis might be protectedagainst DSBs. Our observation that genes that are up-regulated inmeiocytes are significantly biased against genes with DSB hotspotmotifs makes sense given the environment in early prophase I.Meiotic genes induced during early prophase I, by necessity, needto be genes that are not simultaneously undergoing DSBs, though
Frontiers in Plant Science | www.frontiersin.org 8 September 2016 | Volume 7 | Article 1433
fpls-07-01433 September 20, 2016 Time: 13:22 # 9
Sundararajan et al. Gene Evolutionary Trajectories and GC Patterns
FIGURE 6 | Density plot of GCx content of individual motifs. (A) GC1,(B) GC2, (C) GC3.
we emphasize that the presence of a motif does not necessarilyindicate the presence of a recombination hotspot. As a key point,our analysis suggests that DSB formation could be targeted to oravoided in specific functional classes, regulated by the periodicGC-rich motif underlying DSBs.
In general, the low GCx gene classes in our dataset wereunderrepresented for the DSB hotspot motif (Table 4; Figure 7)and showed bias toward housekeeping functions. In contrast,we found genes with high GCx that are enriched for morespecialized functions, including sexual reproduction, thoughgenes did not appear to be specific to meiotic recombination.Possibly, these latter genes are needed during other stages
TABLE 5 | Chi-square test to determine whether other GCx classes arerandomly distributed within each of the high GCx classes.
High GCx
observed(expected)
Low GCx
observed(expected)
p-value
Among high GC1 genes
GC2 26 (58) 3,621 (3,589) 2.43E-05
GC3 96 (526) 3,551 (3,121) 2.57E-91
Among high GC2 genes
GC1 26 (58) 603 (571) 1.11E-05
GC3 26 (91) 603 (538) 2.06E-13
Among high GC3 genes
GC1 96 (526) 5,623 (5,193) 3.59E-86
GC2 26 (91) 5,693 (5,628) 7.44E-12
Significant p-values allowing rejection of the null hypothesis (p ≤ 0.05) are in bold.
TABLE 6 | Chi-square test to determine whether up- or down-regulatedgenes in meiocytes are randomly distributed within the 544motif-containing genes.
Differential expression inmeiocytes
Yes No p-value
Meiocyte-specificexpression
Comparisontissue
Observed(expected)
Observed(expected)
Up-regulated Anther 2 (3) 542 (541) 0.712147988
Up-regulated Seedling 18 (44) 526 (500) 3.57589E-05
Down-regulated Anther 2 (3) 542 (541) 0.506157854
Down-regulated Seedling 62 (57) 482 (487) 0.465276348
Significant p-values allowing rejection of the null hypothesis (p ≤ 0.05) are in bold.
of development or meiosis, and not around the time whenDSBs are generated, but benefit from recombination-drivenevolution.
GC bimodality refers to the occurrence of two classes of genes,distinguished by their GC content. They have been reportedin monocot but not in dicot plants (Clément et al., 2014). Todate, there have been several reports explaining the differencesin relative distribution of genes based on GC3 between monocotsand dicots. Additionally, pronounced differences were observedin GC3 between close relatives in plant families. For example,a comparative study between A. thaliana, Raphanus sativus,Brassica rapa, and Brassica napus revealed that the GC3 valuesof R. sativus, B. rapa, and B. napus are on an average 5% higherthan that of A. thaliana orthologs (Villagomez and Kuleck, 2009;Tatarinova et al., 2010). Further, many plants, including grassesare prone to genome duplications, which provides redundancythat can relax selection pressure for individual genes thoughgenome-wide some stabilization must occur after a polyploidyevent. Nevertheless, the flexibility provided by redundancythat occurs after polyploidization may enable the evolution ofgenomic regions that have varied recombination rates and GCcontents.
Degeneracy in the genetic code in the third codon positiongave rise to the wobble hypothesis (Crick, 1966) which has
Frontiers in Plant Science | www.frontiersin.org 9 September 2016 | Volume 7 | Article 1433
fpls-07-01433 September 20, 2016 Time: 13:22 # 10
Sundararajan et al. Gene Evolutionary Trajectories and GC Patterns
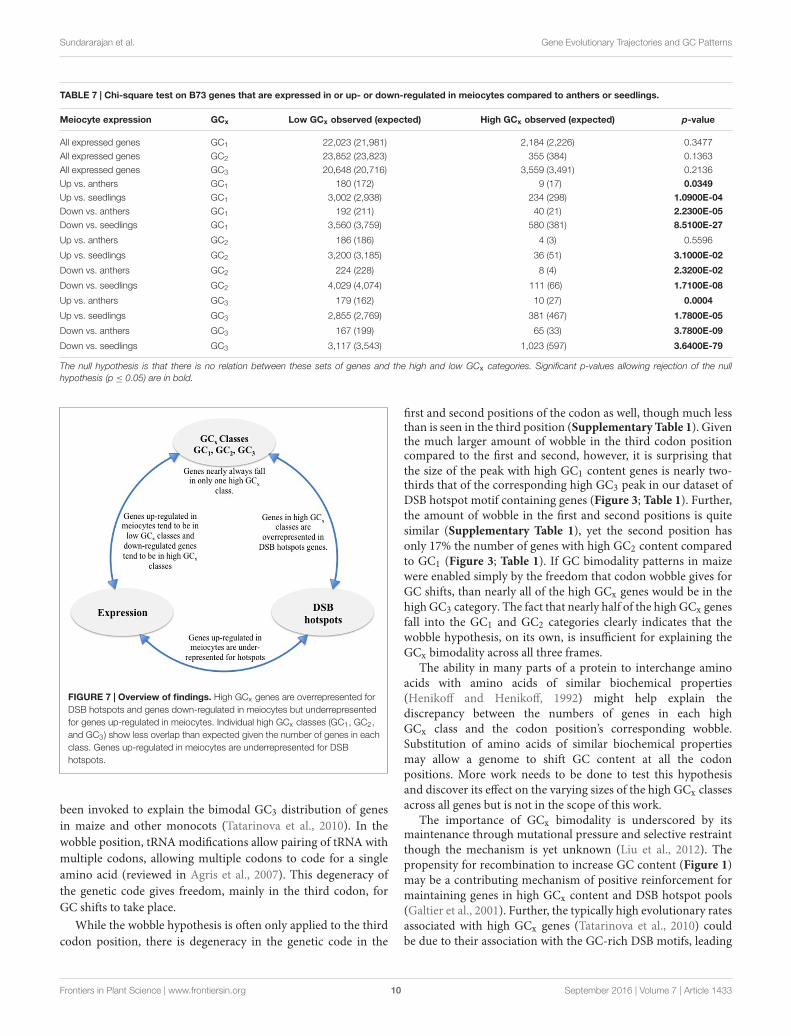
TABLE 7 | Chi-square test on B73 genes that are expressed in or up- or down-regulated in meiocytes compared to anthers or seedlings.
Meiocyte expression GCx Low GCx observed (expected) High GCx observed (expected) p-value
All expressed genes GC1 22,023 (21,981) 2,184 (2,226) 0.3477
All expressed genes GC2 23,852 (23,823) 355 (384) 0.1363
All expressed genes GC3 20,648 (20,716) 3,559 (3,491) 0.2136
Up vs. anthers GC1 180 (172) 9 (17) 0.0349Up vs. seedlings GC1 3,002 (2,938) 234 (298) 1.0900E-04Down vs. anthers GC1 192 (211) 40 (21) 2.2300E-05Down vs. seedlings GC1 3,560 (3,759) 580 (381) 8.5100E-27
Up vs. anthers GC2 186 (186) 4 (3) 0.5596
Up vs. seedlings GC2 3,200 (3,185) 36 (51) 3.1000E-02
Down vs. anthers GC2 224 (228) 8 (4) 2.3200E-02
Down vs. seedlings GC2 4,029 (4,074) 111 (66) 1.7100E-08
Up vs. anthers GC3 179 (162) 10 (27) 0.0004
Up vs. seedlings GC3 2,855 (2,769) 381 (467) 1.7800E-05
Down vs. anthers GC3 167 (199) 65 (33) 3.7800E-09
Down vs. seedlings GC3 3,117 (3,543) 1,023 (597) 3.6400E-79
The null hypothesis is that there is no relation between these sets of genes and the high and low GCx categories. Significant p-values allowing rejection of the nullhypothesis (p ≤ 0.05) are in bold.
FIGURE 7 | Overview of findings. High GCx genes are overrepresented forDSB hotspots and genes down-regulated in meiocytes but underrepresentedfor genes up-regulated in meiocytes. Individual high GCx classes (GC1, GC2,and GC3) show less overlap than expected given the number of genes in eachclass. Genes up-regulated in meiocytes are underrepresented for DSBhotspots.
been invoked to explain the bimodal GC3 distribution of genesin maize and other monocots (Tatarinova et al., 2010). In thewobble position, tRNA modifications allow pairing of tRNA withmultiple codons, allowing multiple codons to code for a singleamino acid (reviewed in Agris et al., 2007). This degeneracy ofthe genetic code gives freedom, mainly in the third codon, forGC shifts to take place.
While the wobble hypothesis is often only applied to the thirdcodon position, there is degeneracy in the genetic code in the
first and second positions of the codon as well, though much lessthan is seen in the third position (Supplementary Table 1). Giventhe much larger amount of wobble in the third codon positioncompared to the first and second, however, it is surprising thatthe size of the peak with high GC1 content genes is nearly two-thirds that of the corresponding high GC3 peak in our dataset ofDSB hotspot motif containing genes (Figure 3; Table 1). Further,the amount of wobble in the first and second positions is quitesimilar (Supplementary Table 1), yet the second position hasonly 17% the number of genes with high GC2 content comparedto GC1 (Figure 3; Table 1). If GC bimodality patterns in maizewere enabled simply by the freedom that codon wobble gives forGC shifts, than nearly all of the high GCx genes would be in thehigh GC3 category. The fact that nearly half of the high GCx genesfall into the GC1 and GC2 categories clearly indicates that thewobble hypothesis, on its own, is insufficient for explaining theGCx bimodality across all three frames.
The ability in many parts of a protein to interchange aminoacids with amino acids of similar biochemical properties(Henikoff and Henikoff, 1992) might help explain thediscrepancy between the numbers of genes in each highGCx class and the codon position’s corresponding wobble.Substitution of amino acids of similar biochemical propertiesmay allow a genome to shift GC content at all the codonpositions. More work needs to be done to test this hypothesisand discover its effect on the varying sizes of the high GCx classesacross all genes but is not in the scope of this work.
The importance of GCx bimodality is underscored by itsmaintenance through mutational pressure and selective restraintthough the mechanism is yet unknown (Liu et al., 2012). Thepropensity for recombination to increase GC content (Figure 1)may be a contributing mechanism of positive reinforcement formaintaining genes in high GCx content and DSB hotspot pools(Galtier et al., 2001). Further, the typically high evolutionary ratesassociated with high GCx genes (Tatarinova et al., 2010) couldbe due to their association with the GC-rich DSB motifs, leading
Frontiers in Plant Science | www.frontiersin.org 10 September 2016 | Volume 7 | Article 1433
fpls-07-01433 September 20, 2016 Time: 13:22 # 11
Sundararajan et al. Gene Evolutionary Trajectories and GC Patterns
to increased rates of recombination. Genetic recombination iscrucial to an organism’s ability to survive, adapt, and evolve.Genetic recombination occurs through crossing over duringmeiosis and, furthermore, gene conversion occurs with a frequentGC bias in the case of non-crossovers.
DSBs were assayed using ChIP-seq targeting the RAD51 gene(He et al., 2013), which binds to DSBs during zygotene, resultingin the discovery of a maize DSB hotspot motif (He et al., inreview). Given the three nucleotide-based GC periodicity foundin the DSB hotspot motifs and the documented GC3 bias foundin maize, it was natural to look for correlations between thetwo. High correlation was found between genes containing DSBhotspot motifs and GC3 levels, both of the motif itself and thecontaining gene. Interestingly, similar correlations were foundfor GC1 and GC2 levels. Indeed, 70% of all genic DSB hotspotsfall into high GCx genes, a remarkable and significant proportiongiven that only one-quarter of genes overall fall into the high GCxcategory. Even more intriguingly, genes with high GC2 motifsmake the biggest contribution, although high GC2 genes are farless prevalent than GC1 or GC3 genes (Figures 5C and 6B).Further work needs to be done in order to determine whetherthere is a direct or secondary relationship between copies of themotif, double-strand breaks, and, by extension, recombination.Nevertheless, this data suggests intriguing hypotheses thatimply a role for recombination in maintaining bimodal GCxdistributions that cannot fully be explained by the wobblehypothesis.
CONCLUSION
Sexual reproduction coupled with meiotic recombination is animportant evolutionary strategy for generating genetic diversitycrucial to adaptation and evolution of species. As the precursorsto crossovers and non-crossovers, DSBs and their locations arecritical to understanding recombination processes and biases.Here we showed that DSB hotspot motifs have a strong tendencyto occur in genes with high GCx content. These genes haveextremely high GC content in one frame, have high evolutionaryrates, and are biased toward SOS-functional classes, implicatingsupport for adaptation in these genes. Further, genes up-regulated
in meiocytes have a strong bias against high GCx classes andDSB motifs, indicating the importance of these genes and theiracquisition of protective strategies against DSBs. Intriguingly,wobble bases and degeneracy in the genetic code are not sufficientfor explaining the high GCx classes and their sizes across allthree frames. The presence of the three nucleotide-based periodicGC-rich motifs underlying double strand hotspot motifs mayprovide a first glimpse at additional selection pressure drivingthe generation of functionally biased high GCx classes in maizeand related organisms. More work needs to be done to determinewhether the motif provides recognition for the DSB machinery,thus providing a possible mechanism promoting high GCxcontent.
AUTHOR CONTRIBUTIONS
AS, SD-S, and JM analyzed the data and wrote the manuscript.MK, KE, OO, NG, TR, and MG helped with data analysis. MW,YH, QS, and WP performed experiments to identify DSB hotspotmotifs and provided data. WP and CC edited the manuscript.WP, CC, SK, JP and JM are investigators on the NSF IOS-1025881grant of which this manuscript is a part.
FUNDING
This research was supported by the United States NationalScience Foundation grant IOS-1025881 and by an InstitutionalDevelopment Award (IDeA) from the National Institute ofGeneral Medical Sciences of the National Institutes of Healthunder grant number P20GM103451.
SUPPLEMENTARY MATERIAL
The Supplementary Material for this article can be found onlineat: http://journal.frontiersin.org/article/10.3389/fpls.2016.01433
SUPPLEMENTAL TABLE 1 | Degeneracy of the genetic code in the firstand second codon positions.
REFERENCESAgris, P. F., Vendeix, F. A., and Graham, W. D. (2007). tRNA’s wobble decoding
of the genome: 40 years of modification. J. Mol. Biol. 366, 1–13. doi:10.1016/j.jmb.2006.11.046
Backstrom, N., Forstmeier, W., Schielzeth, H., Mellenius, H., Nam, K., Bolund, E.,et al. (2010). The recombination landscape of the zebra finch Taeniopygiaguttata genome. Genome Res. 20, 485–495. doi: 10.1101/gr.101410.109
Benjamini, Y., and Hochberg, Y. (1995). Controlling the fasle discovery rate: apractical and powerful approach to multiple testing. J. R. Stat. Soc. 57, 289–300.
Beye, M., Gattermeier, I., Hasselmann, M., Gempe, T., Schioett, M., Baines, J. F.,et al. (2006). Exceptionally high levels of recombination across the honey beegenome. Genome Res. 16, 1339–1344. doi: 10.1101/gr.5680406
Birdsell, J. A. (2002). Integrating genomics, bioinformatics, and classical geneticsto study the effects of recombination on genome evolution. Mol. Biol. Evol. 19,1181–1197. doi: 10.1093/oxfordjournals.molbev.a004176
Carels, N., and Bernardi, G. (2000). Two classes of genes in plants. Genetics 154,1819–1825.
Chen, C., Farmer, A. D., Langley, R. J., Mudge, J., Crow, J. A., May, G. D., et al.(2010). Meiosis-specific gene discovery in plants: RNA-Seq applied to isolatedArabidopsis male meiocytes. BMC Plant Biol. 10:280. doi: 10.1186/1471-2229-10-280
Chiapello, H., Lisacek, F., Caboche, M., and Henaut, A. (1998). Codon usageand gene function are related in sequences of Arabidopsis thaliana. Gene 209,GC1-GC38. doi: 10.1016/s0378-1119(97)00671-9
Clément, Y., Fustier, M.-A., Nabholz, B., and Glémin, S. (2014). The bimodaldistribution of genic GC content is ancestral to Monocot species. Genome Biol.Evol. 7, 336–348. doi: 10.1093/gbe/evu278
Crick, F. H. (1966). Codon–anticodon pairing: the wobble hypothesis. J. Mol. Biol.19, 548–555. doi: 10.1016/S0022-2836(66)80022-0
Cruveiller, S., D’Onofrio, G., and Bernardi, G. (2000). The compositionaltransition between the genomes of cold- and warm-blooded vertebrates:
Frontiers in Plant Science | www.frontiersin.org 11 September 2016 | Volume 7 | Article 1433
fpls-07-01433 September 20, 2016 Time: 13:22 # 12
Sundararajan et al. Gene Evolutionary Trajectories and GC Patterns
codon frequencies in orthologous genes. Gene 261, 71–83. doi: 10.1016/S0378-1119(00)00520-5
Cruveiller, S., Jabbari, K., Clay, O., and Bernardi, G. (2004). Compositional genelandscapes in vertebrates. Genome Res. 14, 886–892. doi: 10.1101/gr.2246704
Drouaud, J., Camilleri, C., Bourguignon, P. Y., Canaguier, A., Berard, A.,Vezon, D., et al. (2006). Variation in crossing-over rates across chromosome4 of Arabidopsis thaliana reveals the presence of meiotic recombination “hotspots.” Genome Res. 16, 106–114. doi: 10.1101/gr.4319006
Du, Z., Zhou, X., Ling, Y., Zhang, Z., and Su, Z. (2010). agriGO: a GO analysistoolkit for the agricultural community. Nucleic Acids Res. 38, W64–W70. doi:10.1093/nar/gkq310
Dukowic-Schulze, S., Harris, A., Li, J., Sundararajan, A., Mudge, J., Retzel, E. F.,et al. (2014a). Comparative transcriptomics of early meiosis in Arabidopsis andmaize. J. Genet. Genomics 41, 139–152. doi: 10.1016/j.jgg.2013.11.007
Dukowic-Schulze, S., Sundararajan, A., Mudge, J., Ramaraj, T., Farmer, A. D.,Wang, M., et al. (2014b). The transcriptome landscape of early maize meiosis.BMC Plant Biol. 14:118. doi: 10.1186/1471-2229-14-118
Dukowic-Schulze, S., Sundararajan, A., Ramaraj, T., Mudge, J., and Chen, C.(2014c). Sequencing-based large-scale genomics approaches with smallnumbers of isolated maize meiocytes. Front. Plant Sci. 5:57. doi:10.3389/fpls.2014.00057
Duret, L., and Arndt, P. F. (2008). The impact of recombination onnucleotide substitutions in the human genome. PLoS Genet. 4:e1000071. doi:10.1371/journal.pgen.1000071
Duret, L., and Galtier, N. (2009). Biased gene conversion and the evolutionof mammalian genomic landscapes. Annu. Rev. Genomics Hum. Genet. 10,285–311. doi: 10.1146/annurev-genom-082908-150001
Duret, L., Mouchiroud, D., and Gautier, C. (1995). Statistical analysis of vertebratesequences reveals that long genes are scarce in GC-rich isochores. J. Mol. Evol.40, 308–317. doi: 10.1007/BF00163235
Elhaik, E., Pellegrini, M., and Tatarinova, T. V. (2014). Gene expression andnucleotide composition are associated with genic methylation level in Oryzasativa. BMC Bioinformatics 15:23. doi: 10.1186/1471-2105-15-23
Escobar, J. S., Cenci, A., Bolognini, J., Haudry, A., Laurent, S., David, J., et al. (2010).An integrative test of the dead-end hypothesis of selfing evolution in Triticeae(Poaceae). Evolution 64, 2855–2872. doi: 10.1111/j.1558-5646.2010.01045.x
Eyre-Walker, A. (1993). Recombination and mammalian genome evolution. Proc.Biol. Sci. 252, 237–243. doi: 10.1098/rspb.1993.0071
Eyre-Walker, A., and Hurst, L. D. (2001). The evolution of isochores. Nat. Rev.Genet. 2, 549–555. doi: 10.1038/35080577
Fennoy, S. L., and Bailey-Serres, J. (1993). Synonymous codon usage in Zea mays L.nuclear genes is varied by levels of C and G-ending codons. Nucleic Acids Res.21, 5294–5300. doi: 10.1093/nar/21.23.5294
Fullerton, S. M., Bernardo Carvalho, A., and Clark, A. G. (2001). Local rates ofrecombination are positively correlated with GC content in the human genome.Mol. Biol. Evol. 18, 1139–1142. doi: 10.1093/oxfordjournals.molbev.a003886
Galtier, N., Piganeau, G., Mouchiroud, D., and Duret, L. (2001). GC-contentevolution in mammalian genomes: the biased gene conversion hypothesis.Genetics 159, 907–911.
Gerton, J. L., DeRisi, J., Shroff, R., Lichten, M., Brown, P. O., and Petes, T. D. (2000).Global mapping of meiotic recombination hotspots and coldspots in the yeastSaccharomyces cerevisiae. Proc. Natl. Acad. Sci. U.S.A. 97, 11383–11390. doi:10.1073/pnas.97.21.11383
Giraut, L., Falque, M., Drouaud, J., Pereira, L., Martin, O. C., and Mezard, C.(2011). Genome-wide crossover distribution in Arabidopsis thaliana meiosisreveals sex-specific patterns along chromosomes. PLoS Genet. 7:e1002354. doi:10.1371/journal.pgen.1002354
Glémin, S., Clément, Y., David, J., and Ressayre, A. (2014). GC content evolutionin coding regions of angiosperm genomes: a unifying hypothesis. Trends Genet.30, 263–270. doi: 10.1016/j.tig.2014.05.002
Gore, M. A., Chia, J. M., Elshire, R. J., Sun, Q., Ersoz, E. S., Hurwitz, B. L., et al.(2009). A first-generation haplotype map of maize. Science 326, 1115–1117. doi:10.1126/science.1177837
Gouy, M., and Gautier, C. (1982). Codon usage in bacteria: correlation with geneexpressivity. Nucleic Acids Res. 10, 7055–7074. doi: 10.1093/nar/10.22.7055
Grantham, R., Gautier, C., and Gouy, M. (1980). Codon frequencies in 119individual genes confirm consistent choices of degenerate bases according togenome type. Nucleic Acids Res. 8, 1893–1912. doi: 10.1093/nar/8.9.1893
Guo, X., Bao, J., and Fan, L. (2007). Evidence of selectively driven codon usage inrice: implications for GC content evolution of Gramineae genes. FEBS Lett. 581,1015–1021. doi: 10.1016/j.febslet.2007.01.088
Haudry, A., Cenci, A., Guilhaumon, C., Paux, E., Poirier, S., Santoni, S., et al. (2008).Mating system and recombination affect molecular evolution in four Triticeaespecies. Genet. Res. (Camb.) 90, 97–109. doi: 10.1017/S0016672307009032
He, Y., Sidhu, G., and Pawlowski, W. P. (2013). Chromatin immunoprecipitationfor studying chromosomal localization of meiotic proteins in maize. MethodsMol. Biol. 990, 191–201. doi: 10.1007/978-1-62703-333-6_19
Henikoff, S., and Henikoff, J. G. (1992). Amino acid substitution matricesfrom protein blocks. Proc. Natl. Acad. Sci. U.S.A. 89, 10915–10919. doi:10.1073/pnas.89.22.10915
Huo, N., Garvin, D. F., You, F. M., McMahon, S., Luo, M. C., Gu, Y. Q., et al.(2011). Comparison of a high-density genetic linkage map to genome featuresin the model grass Brachypodium distachyon. Theor. Appl. Genet. 123, 455–464.doi: 10.1007/s00122-011-1598-4
Ikemura, T. (1981). Correlation between the abundance of Escherichia coli transferRNAs and the occurrence of the respective codons in its protein genes. J. Mol.Biol. 146, 1–21. doi: 10.1016/0022-2836(81)90363-6
Ikemura, T., and Wada, K. (1991). Evident diversity of codon usage patterns ofhuman genes with respect to chromosome banding patterns and chromosomenumbers; relation between nucleotide sequence data and cytogenetic data.Nucleic Acids Res. 19, 4333–4339. doi: 10.1093/nar/19.16.4333
Ingvarsson, P. K. (2008). Molecular evolution of synonymous codon usage inPopulus. BMC Evol. Biol. 8:307. doi: 10.1186/1471-2148-8-307
Jensen-Seaman, M. I., Furey, T. S., Payseur, B. A., Lu, Y., Roskin, K. M., Chen, C. F.,et al. (2004). Comparative recombination rates in the rat, mouse, and humangenomes. Genome Res. 14, 528–538. doi: 10.1101/gr.1970304
Kanaya, S., Yamada, Y., Kudo, Y., and Ikemura, T. (1999). Studies of codon usageand tRNA genes of 18 unicellular organisms and quantification of Bacillussubtilis tRNAs: gene expression level and species-specific diversity of codonusage based on multivariate analysis. Gene 238, 143–155. doi: 10.1016/S0378-1119(99)00225-5
Karlin, S., and Mrazek, J. (1996). What drives codon choices in human genes?J. Mol. Biol. 262, 459–472. doi: 10.1006/jmbi.1996.0528
Kawabe, A., and Miyashita, N. T. (2003). Patterns of codon usage bias in threedicot and four monocot plant species. Genes Genet. Syst. 78, 343–352. doi:10.1266/ggs.78.343
Kudla, G., Lipinski, L., Caffin, F., Helwak, A., and Zylicz, M. (2006). High guanineand cytosine content increases mRNA levels in mammalian cells. PLoS Biol.4:e180. doi: 10.1371/journal.pbio.0040180
Lescot, M., Piffanelli, P., Ciampi, A. Y., Ruiz, M., Blanc, G., Leebens-Mack, J.,et al. (2008). Insights into the Musa genome: syntenic relationships torice and between Musa species. BMC Genomics 9:58. doi: 10.1186/1471-2164-9-58
Lesecque, Y., Mouchiroud, D., and Duret, L. (2013). GC-biased gene conversionin yeast is specifically associated with crossovers: molecular mechanismsand evolutionary significance. Mol. Biol. Evol. 30, 1409–1419. doi:10.1093/molbev/mst056
Li, L. (2009). GADEM: a genetic algorithm guided formation of spaced dyadscoupled with an EM algorithm for motif discovery. J. Comput. Biol. 16, 317–329.doi: 10.1089/cmb.2008.16TT
Liu, H., Huang, Y., Du, X., Chen, Z., Zeng, X., Chen, Y., et al. (2012). Patternsof synonymous codon usage bias in the model grass Brachypodium distachyon.Genet. Mol. Res. 11, 4695–4706. doi: 10.4238/2012.October.17.3
Liu, Q. P., Tan, J., and Xue, Q. Z. (2003). [Synonymous codon usage bias in the ricecultivar 93-11 (Oryza sativa L. ssp. indica)]. Yi Chuan Xue Bao 30, 335–340.
Mancera, E., Bourgon, R., Brozzi, A., Huber, W., and Steinmetz, L. M. (2008). High-resolution mapping of meiotic crossovers and non-crossovers in yeast. Nature454, 479–485. doi: 10.1038/nature07135
Marais, G. (2003). Biased gene conversion: implications for genome and sexevolution. Trends Genet. 19, 330–338. doi: 10.1016/S0168-9525(03)00116-1
Marais, G., Mouchiroud, D., and Duret, L. (2001). Does recombination improveselection on codon usage? Lessons from nematode and fly complete genomes.Proc. Natl. Acad. Sci. U.S.A. 98, 5688–5692. doi: 10.1073/pnas.091427698
Marsolier-Kergoat, M. C. (2011). A simple model for the influence ofmeiotic conversion tracts on GC content. PLoS ONE 6:e16109. doi:10.1371/journal.pone.0016109
Frontiers in Plant Science | www.frontiersin.org 12 September 2016 | Volume 7 | Article 1433
fpls-07-01433 September 20, 2016 Time: 13:22 # 13
Sundararajan et al. Gene Evolutionary Trajectories and GC Patterns
Marsolier-Kergoat, M. C., and Yeramian, E. (2009). GC content andrecombination: reassessing the causal effects for the Saccharomyces cerevisiaegenome. Genetics 183, 31–38. doi: 10.1534/genetics.109.105049
Matassi, G., Montero, L. M., Salinas, J., and Bernardi, G. (1989). The isochoreorganization and the compositional distribution of homologous codingsequences in the nuclear genome of plants. Nucleic Acids Res. 17, 5273–5290.doi: 10.1093/nar/17.13.5273
Moriyama, E. N., and Powell, J. R. (1997). Codon usage bias and tRNA abundancein Drosophila. J. Mol. Evol. 45, 514–523. doi: 10.1007/PL00006256
Muyle, A., Serres-Giardi, L., Ressayre, A., Escobar, J., and Glemin, S. (2011). GC-biased gene conversion and selection affect GC content in the Oryza genus(rice). Mol. Biol. Evol. 28, 2695–2706. doi: 10.1093/molbev/msr104
Myers, S., Spencer, C. C., Auton, A., Bottolo, L., Freeman, C., Donnelly, P., et al.(2006). The distribution and causes of meiotic recombination in the humangenome. Biochem. Soc. Trans. 34, 526–530. doi: 10.1042/BST0340526
Nabholz, B., Kunstner, A., Wang, R., Jarvis, E. D., and Ellegren, H. (2011).Dynamic evolution of base composition: causes and consequences in avianphylogenomics. Mol. Biol. Evol. 28, 2197–2210. doi: 10.1093/molbev/msr047
Padmore, R., Cao, L., and Kleckner, N. (1991). Temporal comparison ofrecombination and synaptonemal complex formation during meiosis in S.cerevisiae. Cell 66, 1239–1256. doi: 10.1016/0092-8674(91)90046-2
Paterson, A. H., Bowers, J. E., Feltus, F. A., Tang, H., Lin, L., and Wang, X. (2009).Comparative genomics of grasses promises a bountiful harvest. Plant Physiol.149, 125–131. doi: 10.1104/pp.108.129262
Serres-Giardi, L., Belkhir, K., David, J., and Glemin, S. (2012). Patternsand evolution of nucleotide landscapes in seed plants. Plant Cell 24,1379–1397. doi: 10.1105/tpc.111.093674
Sharp, P. M., Bailes, E., Grocock, R. J., Peden, J. F., and Sockett, R. E. (2005).Variation in the strength of selected codon usage bias among bacteria. NucleicAcids Res. 33, 1141–1153. doi: 10.1093/nar/gki242
Sharp, P. M., Cowe, E., Higgins, D. G., Shields, D. C., Wolfe, K. H., and Wright, F.(1988). Codon usage patterns in Escherichia coli, Bacillus subtilis, Saccharomycescerevisiae, Schizosaccharomyces pombe, Drosophila melanogaster and Homosapiens; a review of the considerable within-species diversity. Nucleic Acids Res.16, 8207–8211. doi: 10.1093/nar/16.17.8207
Sharp, P. M., and Li, W. H. (1986). An evolutionary perspective on synonymouscodon usage in unicellular organisms. J. Mol. Evol. 24, 28–38. doi:10.1007/BF02099948
Sharp, P. M., and Matassi, G. (1994). Codon usage and genome evolution. Curr.Opin. Genet. Dev. 4, 851–860. doi: 10.1016/0959-437X(94)90070-1
Sheehan, M. J., and Pawlowski, W. P. (2012). Imaging chromosome dynamics inmeiosis in plants. Methods Enzymol. 505, 125–143. doi: 10.1016/B978-0-12-388448-0.00015-2
Shields, D. C., Sharp, P. M., Higgins, D. G., and Wright, F. (1988). “Silent” sitesin Drosophila genes are not neutral: evidence of selection among synonymouscodons. Mol. Biol. Evol. 5, 704–716.
Stenico, M., Lloyd, A. T., and Sharp, P. M. (1994). Codon usage in Caenorhabditiselegans: delineation of translational selection and mutational biases. NucleicAcids Res. 22, 2437–2446. doi: 10.1093/nar/22.13.2437
Sueoka, N., and Kawanishi, Y. (2000). DNA G++C content of the third codonposition and codon usage biases of human genes. Gene 261, 53–62. doi:10.1016/S0378-1119(00)00480-7
Supek, F., Bosnjak, M., Skunca, N., and Smuc, T. (2011). REVIGO summarizesand visualizes long lists of gene ontology terms. PLoS ONE 6:e21800. doi:10.1371/journal.pone.0021800
Tatarinova, T. V., Alexandrov, N. N., Bouck, J. B., and Feldmann, K. A. (2010).GC3 biology in corn, rice, sorghum and other grasses. BMC Genomics 11:308.doi: 10.1186/1471-2164-11-308
Tian, Z., Rizzon, C., Du, J., Zhu, L., Bennetzen, J. L., Jackson, S. A., et al. (2009). Dogenetic recombination and gene density shape the pattern of DNA eliminationin rice long terminal repeat retrotransposons? Genome Res. 19, 2221–2230. doi:10.1101/gr.083899.108
Villagomez, L. T. T. V., and Kuleck, G. (2009). Ecological Genomics: Constructionof Molecular Pathways Responsible for Gene Regulation, and Adaptation toHeavy Metal Stress in Arabidopsis thaliana, and Raphanus sativus. Stockholm:ISMB/ECCB.
Wang, H. C., and Hickey, D. A. (2007). Rapid divergence of codon usage patternswithin the rice genome. BMC Evol. Biol. 7(Suppl 1):S6. doi: 10.1186/1471-2148-7-S1-S6
Webster, M. T., Axelsson, E., and Ellegren, H. (2006). Strong regional biases innucleotide substitution in the chicken genome. Mol. Biol. Evol. 23, 1203–1216.doi: 10.1093/molbev/msk008
Wijnker, E., Velikkakam James, G., Ding, J., Becker, F., Klasen, J. R.,Rawat, V., et al. (2013). The genomic landscape of meiotic crossovers andgene conversions in Arabidopsis thaliana. Elife 2:e01426. doi: 10.7554/eLife.01426
Xu, C., Dong, J., Tong, C., Gong, X., Wen, Q., and Zhuge, Q. (2013). Analysisof synonymous codon usage patterns in seven different citrus species. Evol.Bioinform. 9, 215–228. doi: 10.4137/EBO.S11930
Conflict of Interest Statement: The authors declare that the research wasconducted in the absence of any commercial or financial relationships that couldbe construed as a potential conflict of interest.
Copyright © 2016 Sundararajan, Dukowic-Schulze, Kwicklis, Engstrom, Garcia,Oviedo, Ramaraj, Gonzales, He,Wang, Sun, Pillardy, Kianian, Pawlowski, Chen andMudge. This is an open-access article distributed under the terms of the CreativeCommons Attribution License (CC BY). The use, distribution or reproduction inother forums is permitted, provided the original author(s) or licensor are creditedand that the original publication in this journal is cited, in accordance with acceptedacademic practice. No use, distribution or reproduction is permitted which does notcomply with these terms.
Frontiers in Plant Science | www.frontiersin.org 13 September 2016 | Volume 7 | Article 1433