Embed Size (px)
Citation preview
GENE EXPRESSION ANALYSES AND ASSOCIATION STUDIES OF WOOD
DEVELOPMENT GENES IN LOBLOLLY PINE (Pinus taeda L.)
A Dissertation
by
SREENATH REDDY PALLE
Submitted to the Office of Graduate Studies of
Texas A&M University
in partial fulfillment of the requirements for the degree of
DOCTOR OF PHILOSOPHY
August 2010
Major Subject: Molecular and Environmental Plant Sciences

Gene Expression Analyses and Association Studies of Wood Development Genes in
Loblolly Pine (Pinus taeda L.)
Copyright 2010 Sreenath Reddy Palle
GENE EXPRESSION ANALYSES AND ASSOCIATION STUDIES OF WOOD
DEVELOPMENT GENES IN LOBLOLLY PINE (Pinus taeda L.)
A Dissertation
by
SREENATH REDDY PALLE
Submitted to the Office of Graduate Studies of
Texas A&M University
in partial fulfillment of the requirements for the degree of
DOCTOR OF PHILOSOPHY
Approved by:
Chair of Committee, Carol A. Loopstra
Committee Members, Alan E. Pepper
Konstantin V. Krutovsky
Tom Byram
Chair of Interdiscipinary Program, Jean H. Gould
August 2010
Major Subject: Molecular and Environmental Plant Sciences
iii
ABSTRACT
Gene Expression Analyses and Association Studies of Wood Development Genes in
Loblolly Pine (Pinus taeda L.). (August 2010)
Sreenath Reddy Palle, B.S., Acharya N G Ranga Agricultural University,
M.S., Texas A&M University-Kingsville
Chair of Advisory Committee: Dr. Carol A. Loopstra
Gene expression analyses using native populations can provide information on the
genetic and molecular mechanisms that determine intraspecific variation and contribute
to the understanding of plant development and adaptation in multiple ways. Using
quantitative real time – polymerase chain reaction (qRT-PCR), we analyzed the
expression of 111 genes with probable roles in wood development in 400 loblolly pine
individuals belonging to a population covering much of the natural range. Association
mapping techniques are increasingly being used in plants to dissect complex genetic
traits and identify genes responsible for the quantitative variation of these traits. We used
candidate-gene based association studies to associate single nucleotide polymorphisms
(SNPs) in candidate genes with the variation in gene expression. The specific objectives
established for this study were to study natural variation in expression of xylem
development genes in loblolly pine (Pinus taeda L.) using qRT-PCR, to associate SNPs
in candidate genes with the variation in gene expression using candidate-gene based
iv
association analyses and to detect loblolly pine promoter polymorphisms and study their
effect on gene expression.
Out of the 111 genes analyzed using qRT-PCR, there were significant differences in
expression among clones for 106 genes. Candidate-gene based association studies were
performed between 3937 single nucleotide polymorphisms (SNPs) and gene expression
to associate SNPs in candidate genes with the variation in gene expression. To the best
of our knowledge, this is the first association genetic study where expression of a large
number of genes, analyzed in a natural population, has been the phenotypic trait of
interest. We cloned and sequenced promoters of 19 genes, 16 of which are transcription
factors involved in wood development and drought response. SNP discovery was done in
13 of these promoters using a panel of 24 loblolly pine clones (unique genotypes). SNP
genotyping is underway in the entire association population and association analyses will
be done to study the effects of promoter SNPs on gene expression. The results from this
project are promising and once these associations have been tested and proved, we
believe that they will help in our understanding of the genetics of complex traits.

v
DEDICATION
To
Amma, Nanna, Jyothi and Sailu

vi
ACKNOWLEDGEMENTS
I sincerely thank Dr. Carol Loopstra, my advisor for the last five years, for her
valuable help, guidance and encouragement. She is the best boss anyone can have and
has shown unlimited patience and has been very helpful regarding my research and
dissertation writing. I am also thankful to the other members of my graduate committee,
Dr. Alan Pepper, Dr. Konstantin Krutovsky, and Dr. Tom Byram, for their guidance and
support throughout the course of this research.
My special thanks go to Candace Seeve and Jeff Puryear for all the help and support.
I am also grateful to their friendship and good times during my PhD years. I would like
to thank my friends and colleagues and the department faculty and staff for making my
time at Texas A&M University a great experience. I also want to extend my gratitude to
Dr. David Neale and Dr. Andrew Eckert (University of California-Davis, CA) for the
precious help in doing association studies.
Finally, my deepest gratitude goes to my family and friends for their love and support
throughout my life. Thanks to my Mom, Dad, Jyothi, Sailu, Kranthi, Sonia, Madhuri
akka, Adriana and many others who have been there for me providing constant support,
love and encouragement which helped me to make it this far.
vii
TABLE OF CONTENTS
Page
ABSTRACT .............................................................................................................. iii
DEDICATION .......................................................................................................... v
ACKNOWLEDGEMENTS ...................................................................................... vi
TABLE OF CONTENTS .......................................................................................... vii
LIST OF FIGURES ................................................................................................... x
LIST OF TABLES .................................................................................................... xi
CHAPTER
I INTRODUCTION ................................................................................ 1
II NATURAL VARIATION IN EXPRESSION OF GENES
INVOLVED IN WOOD DEVELOPMENT IN LOBLOLLY
PINE (Pinus taeda L.) .......................................................................... 7
Introduction .................................................................................... 7
Literature review ............................................................................ 10
Gene selection ........................................................................... 10
Materials and methods ................................................................... 19
Plant material ............................................................................. 19
RNA extraction and cDNA synthesis ........................................ 19
Gene selection ........................................................................... 20
Primer design and testing the efficiency of amplification ......... 20
Relative gene expression analysis ............................................. 21
Analysis of the qRT-PCR data .................................................. 22
Sequencing of primer binding sites ........................................... 23
Correlations and clustering analyses ......................................... 23
Gene network inference ............................................................ 24
Results ............................................................................................ 24
Variation in gene expression ..................................................... 24
Primer binding and amplification efficiency ............................. 28
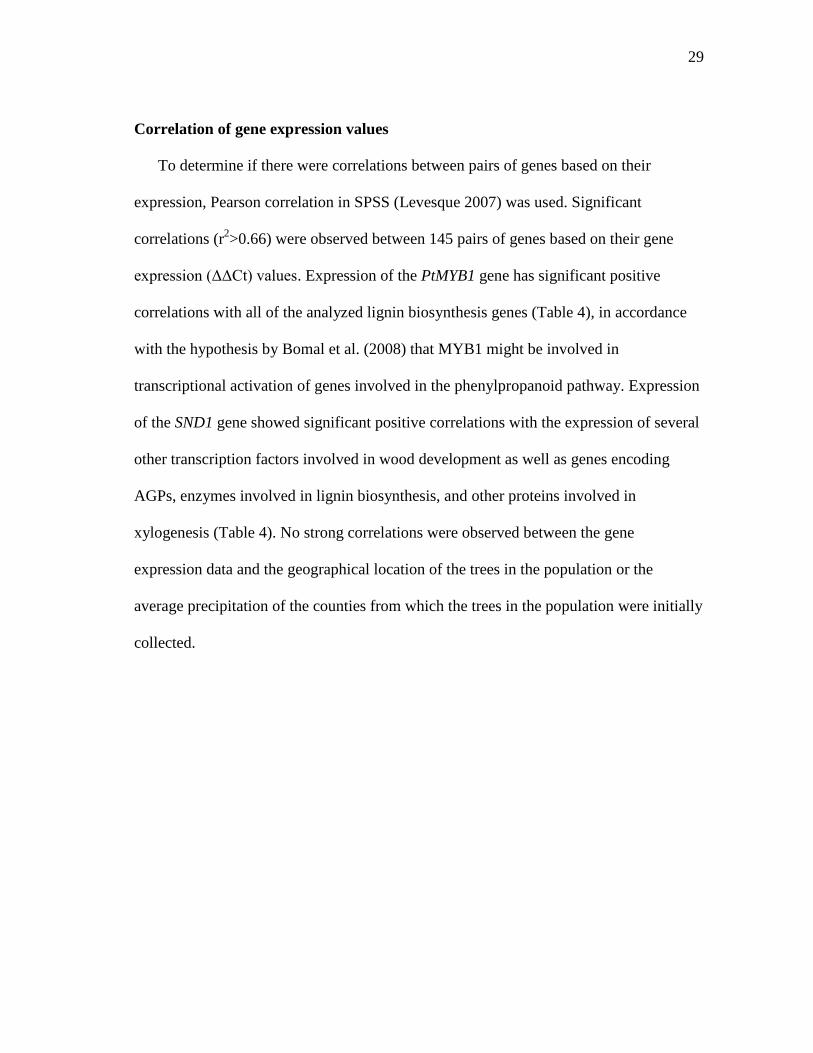
Correlation of gene expression values ...................................... 29
viii
CHAPTER Page
Hierarchical clustering of the gene expression profiles ............ 30
Inference of a gene regulatory network .................................... 34
Discussion ................................................................................. 36
III ASSOCIATION STUDIES OF WOOD DEVELOPMENT
GENES IN A NATURAL POPULATION OF LOBLOLLY
PINE (Pinus taeda L.) .......................................................................... 43
Introduction .................................................................................... 43
Materials and methods ................................................................... 46
Association population .............................................................. 46
Gene selection ........................................................................... 46
RNA extraction, cDNA synthesis and relative gene
expression analyses ................................................................... 47
SNP genotyping ......................................................................... 47
Population structure analysis ..................................................... 48
Association studies .................................................................... 48
Results ............................................................................................ 49
Genetic associations .................................................................. 49
Comparisons to an Arabidopsis network .................................. 55
Effects of associated SNPs on gene expression ........................ 56
Discussion ...................................................................................... 59
IV LOBLOLLY PINE PROMOTER POLYMORPHISMS AND
THEIR EFFECT ON GENE EXPRESSION ....................................... 71
Introduction .................................................................................... 71
Materials and methods ................................................................... 73
Construction of DNA restriction digestion libraries ................. 73
Genome walking technique ....................................................... 74
SNP discovery ........................................................................... 75
Results and discussion .................................................................... 76
Promoter sequencing and SNP discovery ................................. 76
Promoter SNPs and gene expression ......................................... 86
V CONCLUSIONS ................................................................................... 90

ix
Page
REFERENCES .......................................................................................................... 92
APPENDIX A ........................................................................................................... 114
APPENDIX B ........................................................................................................... 117
VITA ......................................................................................................................... 121
x
LIST OF FIGURES
FIGURE Page
1 The natural range of loblolly pine .............................................................. 9
2 Normal distribution plots and barplots showing the range of ΔΔCt
values for the CCR and CCoAMT genes among different clones in
the population ............................................................................................. 26
3 Hierarchical clustering of genes using qRT-PCR expression data. ........... 32
4 Hierarchical clustering of clones using qRT-PCR expression data ........... 33
5 Inferred gene network from the qRT-PCR data using BANJO at the
MARIMBA website ................................................................................... 35
6 Boxplots showing the average expression of different alleles of
genes with significant associations ............................................................ 58
7 Model of the association between the AIP and PRT genes ........................ 64
8 Pathways demonstrating the indirect role of CGS and the direct
role of CAD in lignin biosynthesis ............................................................. 66
9 Flow chart of the GenomeWalker™ protocol ............................................ 75
xi
LIST OF TABLES
TABLE Page
1 Functional classes of genes ........................................................................ 12
2 Gene IDs and their Genbank accession numbers ....................................... 13
3 ΔΔCt values and fold differences between low and high expressing
clones .......................................................................................................... 27
4 Correlation (R2 values, Pearson correlation co-efficient) of genes with
MYB1 and SND1. ........................................................................................ 30
5 SNPs showing significant associations with the expression of more
than one gene .............................................................................................. 50
6 Positions of the associated SNPs in the contigs ......................................... 51
7 Average gene expression values (ΔΔCt) of individuals with different
SNP alleles ................................................................................................. 57
8 Putative transcription factor binding sites (cis-elements) observed in
the promoters as determined using the PLACE database .......................... 77
9 Putative transcription factor binding sites with SNPs in the promoters ..... 80
1
CHAPTER I
INTRODUCTION
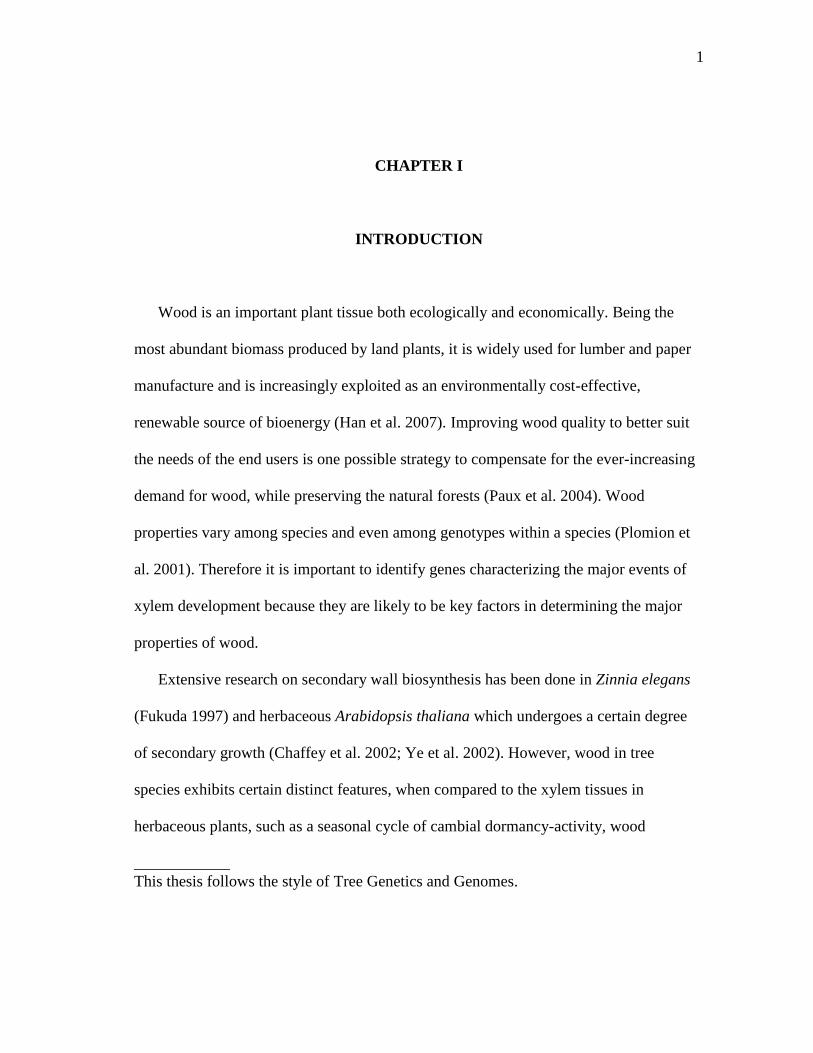
Wood is an important plant tissue both ecologically and economically. Being the
most abundant biomass produced by land plants, it is widely used for lumber and paper
manufacture and is increasingly exploited as an environmentally cost-effective,
renewable source of bioenergy (Han et al. 2007). Improving wood quality to better suit
the needs of the end users is one possible strategy to compensate for the ever-increasing
demand for wood, while preserving the natural forests (Paux et al. 2004). Wood
properties vary among species and even among genotypes within a species (Plomion et
al. 2001). Therefore it is important to identify genes characterizing the major events of
xylem development because they are likely to be key factors in determining the major
properties of wood.
Extensive research on secondary wall biosynthesis has been done in Zinnia elegans
(Fukuda 1997) and herbaceous Arabidopsis thaliana which undergoes a certain degree
of secondary growth (Chaffey et al. 2002; Ye et al. 2002). However, wood in tree
species exhibits certain distinct features, when compared to the xylem tissues in
herbaceous plants, such as a seasonal cycle of cambial dormancy-activity, wood
____________
This thesis follows the style of Tree Genetics and Genomes.
2
maturation, and production of heartwood. In order to achieve these distinctive features,
tree species might have evolved unique regulatory mechanisms that control wood
formation (Nieminen et al. 2004; Zhong et al. 2010). Although the knowledge obtained
from the studies of secondary wall biosynthesis in Zinnia and Arabidopsis can be applied
to better understanding of wood formation, study of trees will still be necessary to fully
understand the mechanism of wood formation in the commercially important species.
Because wood quality is a major trait that tree breeders would like to improve by using
marker-assisted selection, it is vital to understand the molecular biology and
biochemistry behind wood development in trees.
Loblolly pine is the most commercially important pine of the southeast USA where it
is dominant on approximately 29 million acres and makes up over one-half of the
standing pine volume. The native range of loblolly pine extends through 14 states from
southern New Jersey south to central Florida and west to Texas. Loblolly pine has
become a model system to study wood formation in a gymnosperm (Sederoff et al.
1994). The wood from pines is mostly composed of xylem tracheid cell walls and the
differentiating xylem is a rich source of RNAs and proteins involved in cell wall
biosynthesis. The primary and secondary xylem formation involves a cascade of
interesting processes including differentiation of xylem mother cells from the vascular
cambium, division of xylem mother cells, regulation of cell expansion, deposition of
secondary cell wall, programmed cell death and formation of heartwood (Plomion et al.
2001). These steps involve expression of a number of structural genes, coordinated by
transcription factors. Even though these processes have been extensively documented at
3
the structural level, relatively little is known of the molecular genetic mechanisms
behind them.
Wood structure is highly complex and therefore the molecular mechanisms
governing the differentiation of wood tissues are complicated. Several researchers have
identified a number of genes involved in the biosynthesis of polysaccharides, lignins and
cell wall proteins in forest trees using classical biochemical analysis and gene or protein
expression profiling (Whetten et al. 1998; Plomion et al. 2001; Peter and Neale 2004;
Boerjan 2005). Allona et al. (1998), Zhang et al. (2000) and Mellerowicz and Sundberg
(2008) used genomic approaches to identify genes and proteins involved in cell wall
biosynthesis during xylogenesis in trees. In addition, a number of transcription factor
genes have been confirmed to be associated with wood formation (Patzlaff et al. 2003a,
2003b; Schrader et al. 2004; Prassinos et al. 2005; Andersson-Gunneras et al. 2006;
Bomal et al. 2008; Wilkins et al. 2009). Several of these candidate genes for wood
formation have been confirmed by forward or reverse genetic mutant analyses in model
species (Goujon et al. 2003) or by the study of natural mutants (Ralph et al. 1997; Gill et
al. 2003). Tremendous progress has been made in loblolly pine gene discovery in recent
years, primarily through NSF supported projects at North Carolina State University, the
University of Georgia, and the Institute of Paper Science and Technology. As of May
2010, the NCBI EST database has 328,628 loblolly pine ESTs
(http://www.ncbi.nlm.nih.gov/) and these EST libraries were of great use in designing
gene contigs for the selected genes of this project.
4
Genetic variation in pines has been studied extensively because of a high level of
variation in natural populations (Hamrick and Godt 1996; Ledig 1998). Gene expression
analysis is a valuable tool for generating hypotheses about the genetic basis of any
phenotype showing variation across the population. Gene expression levels in organisms
differ not only among cell types within an individual but also among individuals. A
variety of techniques are available that enable analysis of gene expression including
northern blot analyses, microarrays, serial analysis of gene expression (SAGE),
massively parallel sequencing and quantitative real time – polymerase chain reaction
(qRT-PCR). Genes expressed in loblolly pine are often members of gene families
(Kinlaw and Neale 1997), so measures of transcript abundance from cDNA microarrays
and northern blots may not accurately represent the expression phenotypes of individual
genes which often show differential regulation. qRT-PCR was used for loblolly pine
gene expression analysis because of its greater dynamic range, lower cost and ability to
detect specific gene family members. qRT-PCR helps to identify the contributions of
individual gene family members to expression phenotypes and its sensitivity facilitates
the analysis of genes expressed at low levels (Yang et al. 2004).
Association mapping refers to significant association of a molecular marker with a
phenotypic trait and it utilizes the genetic diversity of natural populations to identify
genes responsible for quantitative variation of complex traits with agricultural and
evolutionary importance (Risch and Merikangas, 1996). The advantages of association
mapping over traditional linkage analysis are high mapping resolution, large number of
alleles and reduced research time as there is no need of creating a mapping population
5
(Yu and Buckler, 2006). Advances in high throughput genomic technologies and
improvements in statistical methods have increased the use of association mapping in
genetic research. Association mapping can be divided into candidate-gene association
mapping and genome-wide association mapping, based on the scale and focus of the
study (Zhu et al. 2008). Candidate-gene association mapping is a trait-specific and
hypothesis-driven approach where candidate genes controlling phenotypic variation are
selected based on prior knowledge and polymorphisms in these selected candidate genes
are associated with the specific phenotypic traits. Genome-wide association mapping is a
comprehensive approach that surveys the whole genome for genetic variation in order to
find associations for various complex traits (Zhu et al. 2008). Genome-wide association
studies are, currently, not possible in conifers because of their extremely large genome
sequence. Linkage disequilibrium decays rapidly in conifers and therefore for genome-
wide association studies enormous SNP marker density will be required (Neale and
Savolainen, 2004). Therefore, candidate-gene-based association mapping is the most
feasible approach for conifers.
Using gene expression as a phenotype in the association studies provides a large set
of comparable traits, all measured simultaneously in each clone (Spielman et al. 2007).
Candidate-gene based association studies were performed between 3937 single
nucleotide polymorphisms (SNPs) and gene expression data to associate SNPs in
candidate genes with the variation in gene expression. The gene expression and
association studies will contribute to the understanding of the molecular mechanisms
that control formation of wood.
6
Gene expression is regulated at many levels and the most important part of
regulation occurs at the level of transcription initiation (de Vooght et al. 2009).
Chromatin modifying enzymes and transcription factors (TFs) play the most important
role in transcriptional regulation. The gene promoter recruits these enzymes and TFs to
initiate transcription of that gene. Sequence variation in the promoter region can disturb
the recruitment process and thus affect gene expression. However, not every promoter
sequence variation affects transcriptional regulation. The SNPs or insertion/deletions
that alter the regulatory binding elements in the promoter can disrupt the normal process
of gene activation. In order to study the effect of promoter SNPs on gene expression, we
sequenced promoters of 19 genes involved in wood development and drought response
and performed SNP discovery on 13 of them. These SNPs are being genotyped in the
entire association population at University of California-Davis Genome center. Once we
get the SNP genotype data, we will perform the association studies to check for
associations between our gene expression data and the promoter SNPs.
7
CHAPTER II
NATURAL VARIATION IN EXPRESSION OF GENES INVOLVED IN WOOD
DEVELOPMENT IN LOBLOLLY PINE (Pinus taeda L.)
INTRODUCTION
Differences in gene expression play a significant role in phenotypic variation within
and among species. Within a species, expression levels vary not only among cell types
within an individual but also among individuals (Storey et al. 2007). Natural variation is
caused by spontaneous mutations that have been maintained by selection (Alonso-
Blanco et al., 2009). Intraspecific variation in expression may be due to mutations in
promoter or enhancer regions or in transcription factors or other genes in the signal
transduction cascade. Expression differences between individuals can be particularly
interesting when looking at a species found in its native habitat and adapted to a variety
of environmental conditions. The study of gene expression in natural populations also
has a great potential to aid in understanding molecular population genetics and evolution
(Townsend et al. 2003). The analyses of natural variation in crop plants and Arabidopsis
thaliana have provided information on the genetic and molecular mechanisms that
determine intraspecific variation and help us to understand the molecular bases of
phenotypic differences which help in their adaptation (Alonso-Blanco et al. 2009).
8
Loblolly pine (Pinus taeda L.) is a species native to the southeastern United States
and has considerable variation in traits of economic importance, including those
involved in wood properties. Wood properties are determined by the activity of the
genes and proteins expressed during xylogenesis and variation in wood properties is
partially due to the regulation of these genes in response to developmental and
environmental cues (Whetten et al. 2001). There is a great deal of interest in the
identification of genes or alleles controlling wood/xylem development as wood is a
major source of terrestrial biomass and is an economically important plant tissue
(Plomion et al. 2001). Genes that are of particular interest are those that affect wood
properties such as cell wall thickness, wood specific gravity, microfibril angle, fiber
length, lumen diameter, and chemical composition of major cell wall components such
as cellulose, lignin, and hemicelluloses. These genes are potential targets for
modification of wood properties through breeding or genetic engineering (Yang and
Loopstra, 2005).
We are using gene expression analyses to try to identify genes and alleles controlling
xylem development and to better understand the natural genetic variation in wood
characteristics. There is abundant evidence for differential expression of genes involved
in wood/xylem development among tissues (Loopstra and Sederoff, 1995; Allona et al.
1998; Zhang et al. 2000; Yang et al. 2004 and 2005). However, very little work has been
done to examine differential expression among individuals (Yang and Loopstra, 2005).
In this paper, we present our work to determine how gene expression differs between
9
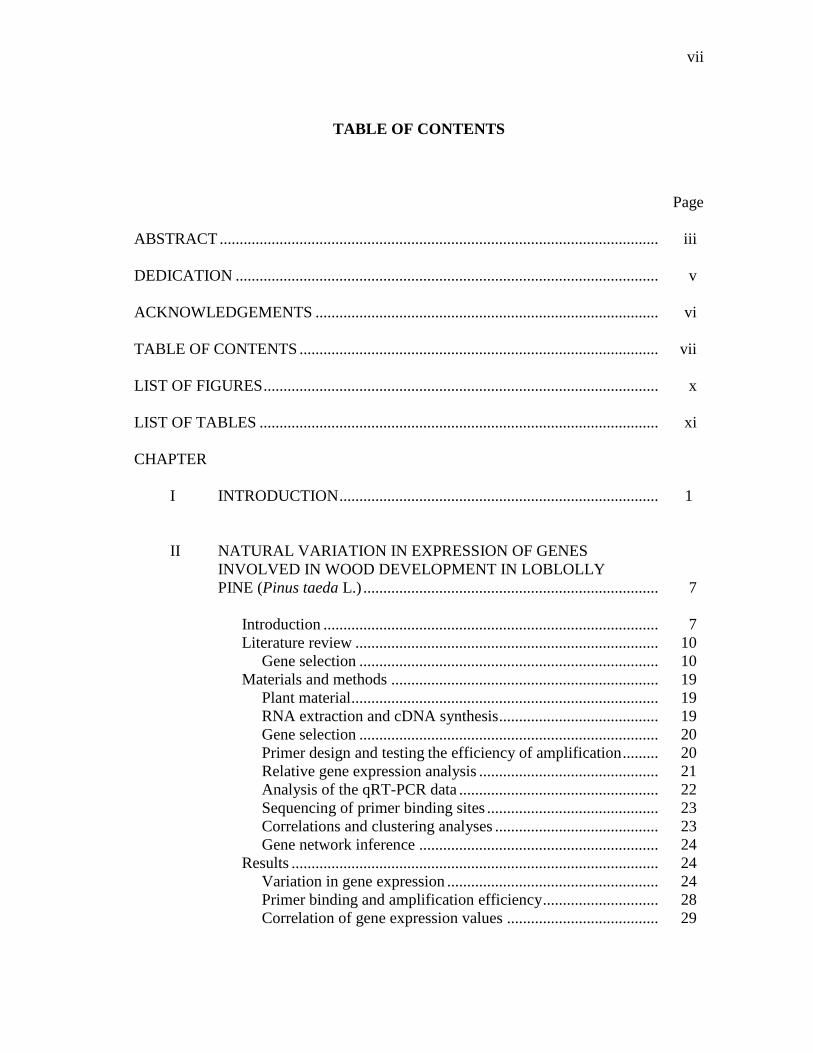
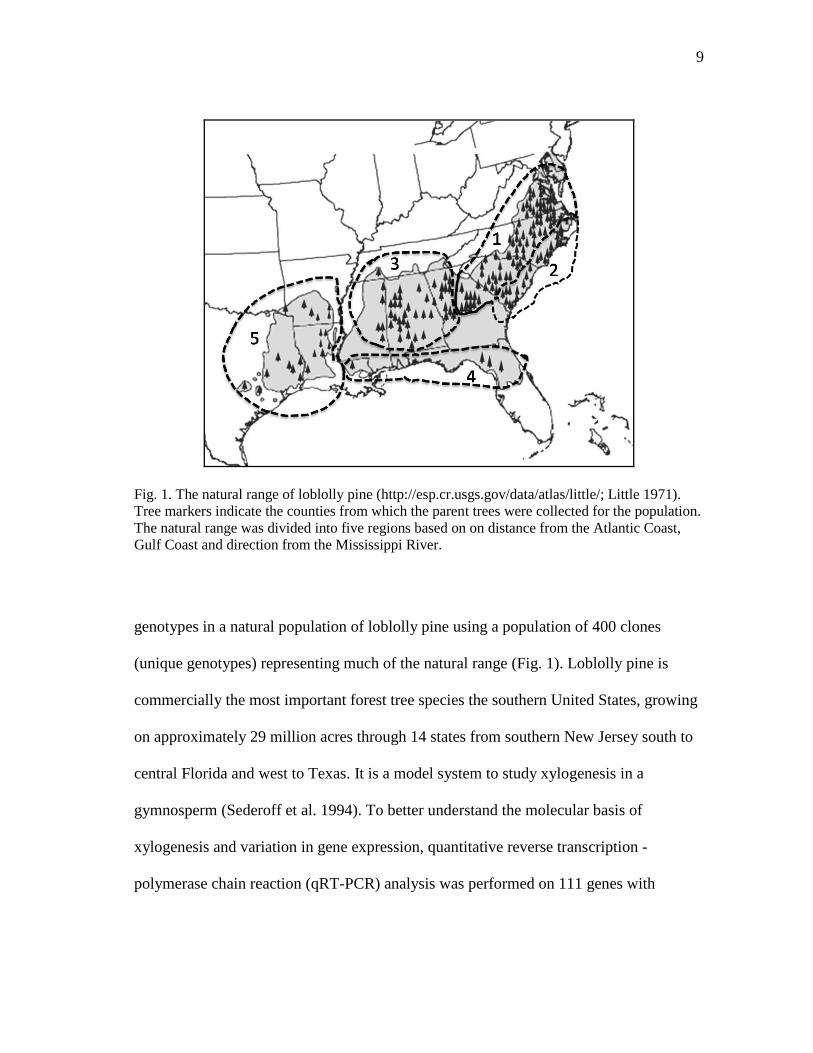
Fig. 1. The natural range of loblolly pine (http://esp.cr.usgs.gov/data/atlas/little/; Little 1971).
Tree markers indicate the counties from which the parent trees were collected for the population.
The natural range was divided into five regions based on on distance from the Atlantic Coast,
Gulf Coast and direction from the Mississippi River.
genotypes in a natural population of loblolly pine using a population of 400 clones
(unique genotypes) representing much of the natural range (Fig. 1). Loblolly pine is
commercially the most important forest tree species the southern United States, growing
on approximately 29 million acres through 14 states from southern New Jersey south to
central Florida and west to Texas. It is a model system to study xylogenesis in a
gymnosperm (Sederoff et al. 1994). To better understand the molecular basis of
xylogenesis and variation in gene expression, quantitative reverse transcription -
polymerase chain reaction (qRT-PCR) analysis was performed on 111 genes with
10
probable roles in xylem development. To the best of our knowledge, there is not a
comparable data set for any other plant species.
Extensive research has been done to infer gene regulatory networks (GRNs) from
expression data obtained from microarrays (Friedman 2004; Nachman et al. 2004; Basso
et al. 2005; Bansal et al. 2007). Bansal et al. (2007) reviewed various approaches to infer
GRNs using gene expression data through reverse engineering networks, including
Bayesian networks. We used Bayesian networks to infer GRNs from our qRT-PCR gene
expression data. Genes interconnected in GRNs suggest that one gene regulates the
transcription of another directly or indirectly. Therefore, GRNs can be used to suggest
functional and regulatory roles to poorly characterized genes (Needham et al. 2009).
Association studies and promoter cloning are being conducted to understand how these
gene expression differences are associated with specific genetic polymorphisms. The
gene expression and association studies will contribute to our understanding of the
molecular mechanisms that control formation of wood.
LITERATURE REVIEW
Gene selection
Wood properties are determined by the activity of the genes and proteins expressed
during xylogenesis and variation in wood properties is partially due to the regulation of
these genes in response to developmental and environmental cues (Whetten et al. 2001).
Loblolly pine EST resources and studies of vascular development in angiosperms
11
provide an opportunity to identify candidate genes for wood formation in pine through
comparative genomic analyses. The genes that are of particular interest are those that
affect wood properties such as cell wall thickness, wood specific gravity, microfibril
angle, fiber length, lumen diameter and chemical composition of major cell wall
components such as cellulose, lignin, and hemicelluloses. These genes are potential
targets for modification of wood properties through breeding or genetic engineering
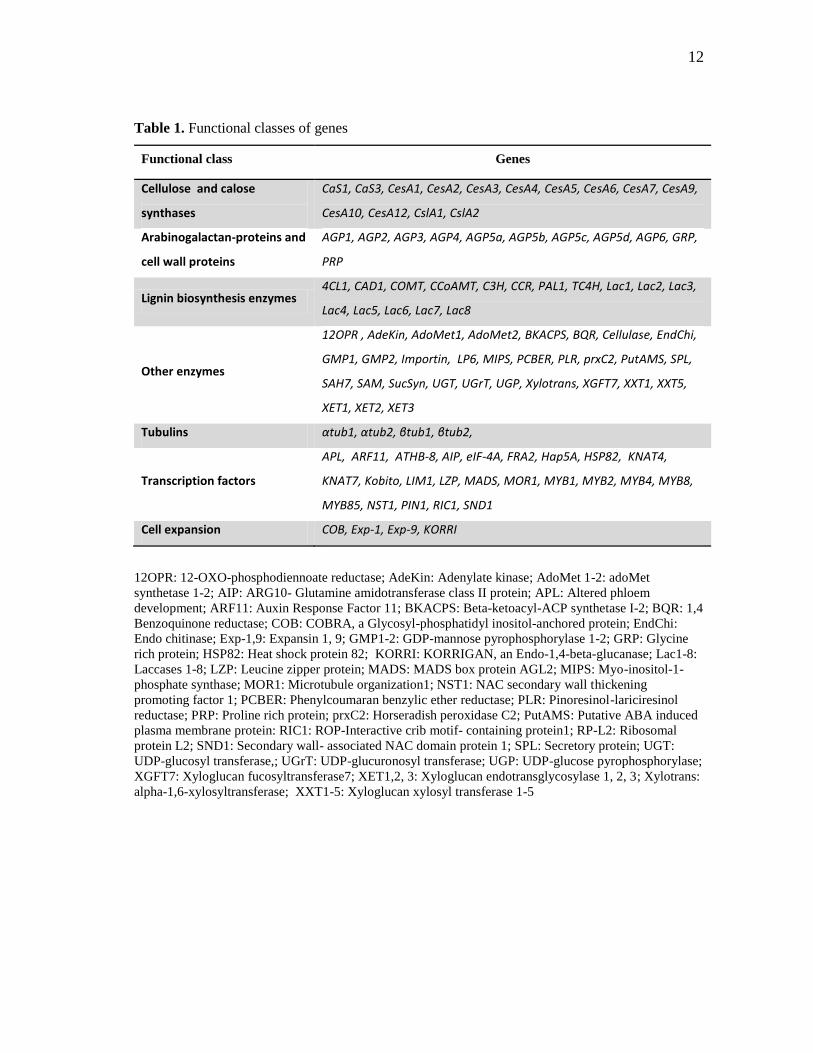
(Yang and Loopstra 2005). Genes implicated in cell wall biosynthesis and xylem
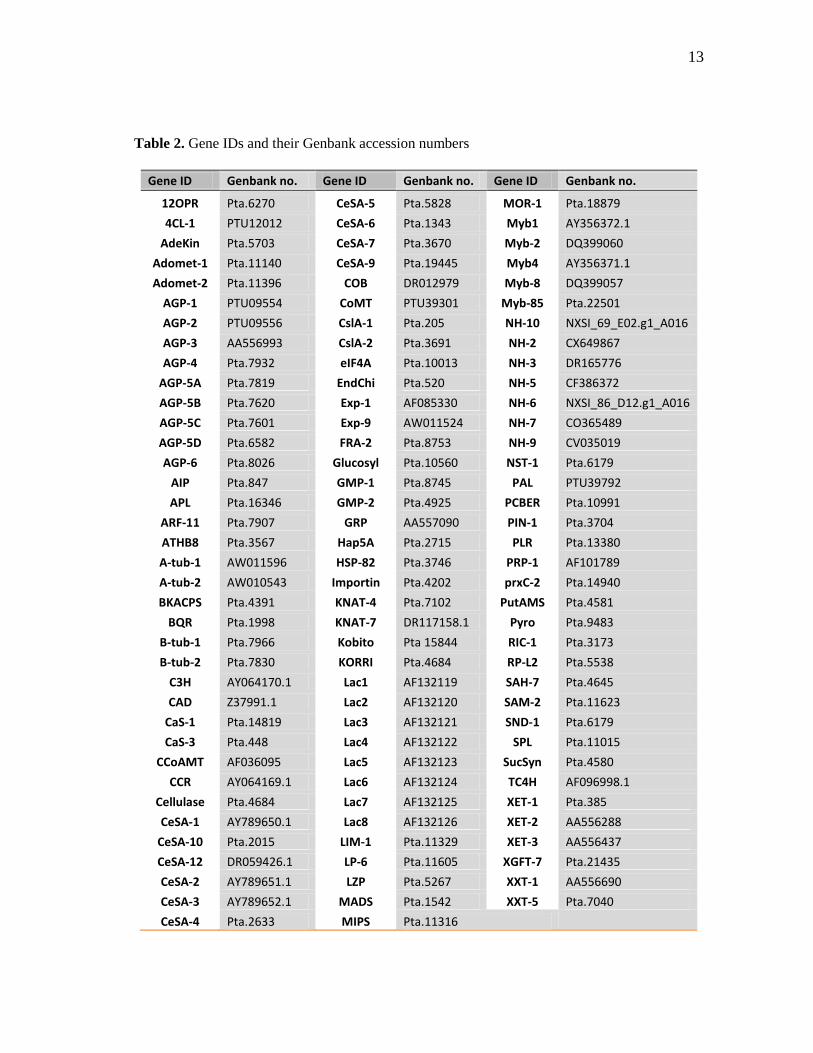
development were selected for the analysis and are listed in table 1. The Genbank
accession numbers of the genes are listed in table 2.
Cellulose biosynthesis
Cellulose, a major component of wood, is a crystalline β-1,4-glucan synthesized
from a UDP-glucose (UDP-Glc) substrate and is the most abundant biopolymer made by
plants (Zhong et al. 2003). Specific plant cellulose synthases (CesA) are necessary for
cell wall synthesis and belong to a multigene family (Richmond, 2000) that is part of a
larger superfamily of putative processive glycosyltransferases (Richmond & Somerville,
2000). The superfamily includes CesA genes and several classes of cellulose synthase-
like (Csl) genes. The Csl genes have been postulated to be involved in the synthesis of
other plant noncellulosic polysaccharides (Dhugga et al. 2004). Nairn and Haselkorn
(2005) have shown that three loblolly pine CesA genes, PtCesA1, PtCesA2 and PtCesA3,
are co-expressed at relatively high levels in tissues undergoing secondary cell wall
synthesis. Ten CesA, 2 Csl and 2 callose synthase (CaS) genes of loblolly pine were
included in our study.
12
Table 1. Functional classes of genes
Functional class Genes
Cellulose and calose
synthases
CaS1, CaS3, CesA1, CesA2, CesA3, CesA4, CesA5, CesA6, CesA7, CesA9,
CesA10, CesA12, CslA1, CslA2
Arabinogalactan-proteins and
cell wall proteins
AGP1, AGP2, AGP3, AGP4, AGP5a, AGP5b, AGP5c, AGP5d, AGP6, GRP,
PRP
Lignin biosynthesis enzymes 4CL1, CAD1, COMT, CCoAMT, C3H, CCR, PAL1, TC4H, Lac1, Lac2, Lac3,
Lac4, Lac5, Lac6, Lac7, Lac8
Other enzymes
12OPR , AdeKin, AdoMet1, AdoMet2, BKACPS, BQR, Cellulase, EndChi,
GMP1, GMP2, Importin, LP6, MIPS, PCBER, PLR, prxC2, PutAMS, SPL,
SAH7, SAM, SucSyn, UGT, UGrT, UGP, Xylotrans, XGFT7, XXT1, XXT5,
XET1, XET2, XET3
Tubulins αtub1, αtub2, βtub1, βtub2,
Transcription factors
APL, ARF11, ATHB-8, AIP, eIF-4A, FRA2, Hap5A, HSP82, KNAT4,
KNAT7, Kobito, LIM1, LZP, MADS, MOR1, MYB1, MYB2, MYB4, MYB8,
MYB85, NST1, PIN1, RIC1, SND1
Cell expansion COB, Exp-1, Exp-9, KORRI
12OPR: 12-OXO-phosphodiennoate reductase; AdeKin: Adenylate kinase; AdoMet 1-2: adoMet
synthetase 1-2; AIP: ARG10- Glutamine amidotransferase class II protein; APL: Altered phloem
development; ARF11: Auxin Response Factor 11; BKACPS: Beta-ketoacyl-ACP synthetase I-2; BQR: 1,4
Benzoquinone reductase; COB: COBRA, a Glycosyl-phosphatidyl inositol-anchored protein; EndChi:
Endo chitinase; Exp-1,9: Expansin 1, 9; GMP1-2: GDP-mannose pyrophosphorylase 1-2; GRP: Glycine
rich protein; HSP82: Heat shock protein 82; KORRI: KORRIGAN, an Endo-1,4-beta-glucanase; Lac1-8:
Laccases 1-8; LZP: Leucine zipper protein; MADS: MADS box protein AGL2; MIPS: Myo-inositol-1-
phosphate synthase; MOR1: Microtubule organization1; NST1: NAC secondary wall thickening
promoting factor 1; PCBER: Phenylcoumaran benzylic ether reductase; PLR: Pinoresinol-lariciresinol
reductase; PRP: Proline rich protein; prxC2: Horseradish peroxidase C2; PutAMS: Putative ABA induced
plasma membrane protein: RIC1: ROP-Interactive crib motif- containing protein1; RP-L2: Ribosomal
protein L2; SND1: Secondary wall- associated NAC domain protein 1; SPL: Secretory protein; UGT:
UDP-glucosyl transferase,; UGrT: UDP-glucuronosyl transferase; UGP: UDP-glucose pyrophosphorylase;
XGFT7: Xyloglucan fucosyltransferase7; XET1,2, 3: Xyloglucan endotransglycosylase 1, 2, 3; Xylotrans:
alpha-1,6-xylosyltransferase; XXT1-5: Xyloglucan xylosyl transferase 1-5
13
Table 2. Gene IDs and their Genbank accession numbers
Gene ID Genbank no. Gene ID Genbank no. Gene ID Genbank no.
12OPR Pta.6270 CeSA-5 Pta.5828 MOR-1 Pta.18879
4CL-1 PTU12012 CeSA-6 Pta.1343 Myb1 AY356372.1
AdeKin Pta.5703 CeSA-7 Pta.3670 Myb-2 DQ399060
Adomet-1 Pta.11140 CeSA-9 Pta.19445 Myb4 AY356371.1
Adomet-2 Pta.11396 COB DR012979 Myb-8 DQ399057
AGP-1 PTU09554 CoMT PTU39301 Myb-85 Pta.22501
AGP-2 PTU09556 CslA-1 Pta.205 NH-10 NXSI_69_E02.g1_A016
AGP-3 AA556993 CslA-2 Pta.3691 NH-2 CX649867
AGP-4 Pta.7932 eIF4A Pta.10013 NH-3 DR165776
AGP-5A Pta.7819 EndChi Pta.520 NH-5 CF386372
AGP-5B Pta.7620 Exp-1 AF085330 NH-6 NXSI_86_D12.g1_A016
AGP-5C Pta.7601 Exp-9 AW011524 NH-7 CO365489
AGP-5D Pta.6582 FRA-2 Pta.8753 NH-9 CV035019
AGP-6 Pta.8026 Glucosyl Pta.10560 NST-1 Pta.6179
AIP Pta.847 GMP-1 Pta.8745 PAL PTU39792
APL Pta.16346 GMP-2 Pta.4925 PCBER Pta.10991
ARF-11 Pta.7907 GRP AA557090 PIN-1 Pta.3704
ATHB8 Pta.3567 Hap5A Pta.2715 PLR Pta.13380
A-tub-1 AW011596 HSP-82 Pta.3746 PRP-1 AF101789
A-tub-2 AW010543 Importin Pta.4202 prxC-2 Pta.14940
BKACPS Pta.4391 KNAT-4 Pta.7102 PutAMS Pta.4581
BQR Pta.1998 KNAT-7 DR117158.1 Pyro Pta.9483
B-tub-1 Pta.7966 Kobito Pta 15844 RIC-1 Pta.3173
B-tub-2 Pta.7830 KORRI Pta.4684 RP-L2 Pta.5538
C3H AY064170.1 Lac1 AF132119 SAH-7 Pta.4645
CAD Z37991.1 Lac2 AF132120 SAM-2 Pta.11623
CaS-1 Pta.14819 Lac3 AF132121 SND-1 Pta.6179
CaS-3 Pta.448 Lac4 AF132122 SPL Pta.11015
CCoAMT AF036095 Lac5 AF132123 SucSyn Pta.4580
CCR AY064169.1 Lac6 AF132124 TC4H AF096998.1
Cellulase Pta.4684 Lac7 AF132125 XET-1 Pta.385
CeSA-1 AY789650.1 Lac8 AF132126 XET-2 AA556288
CeSA-10 Pta.2015 LIM-1 Pta.11329 XET-3 AA556437
CeSA-12 DR059426.1 LP-6 Pta.11605 XGFT-7 Pta.21435
CeSA-2 AY789651.1 LZP Pta.5267 XXT-1 AA556690
CeSA-3 AY789652.1 MADS Pta.1542 XXT-5 Pta.7040
CeSA-4 Pta.2633 MIPS Pta.11316
14
Arabinogalactan-proteins (AGPs)
Transcripts for cell wall structural proteins such as AGPs and glycine-rich proteins
are among the most abundant transcripts in wood forming tissues and are preferentially
expressed in differentiating xylem tissue compared to other tissues (Loopstra and
Sederoff, 1995; Allona et al. 1998; Sterky et al. 1998; Loopstra et al. 2000; Zhang et al.
2000; Whetten et al. 2001; Lorenz and Dean, 2002; Yang et al. 2004). Arabinogalactan-
proteins are a class of large hydroxyproline-rich glycoproteins (HGRPs) and are found in
almost all plant species (Yang et al. 2005). They have been implicated in various plant
growth and developmental processes including secondary cell wall initiation,
lignification (Kieliszewski and Lamport 1994) and in cell expansion (Jauh and Lord
1996, Willats and Knox 1996). To better understand the roles of pine AGPs during
xylogenesis, nine loblolly pine AGP and AGP-like genes (ptx3H6, ptx14A9, ptaAGP3,
ptaAGP4, ptaAGP6 and four members of the ptaAGP5 multigene family) were included
in this project.
Lignin biosynthesis
Lignin constitutes up to 30% of the dry mass in wood (Koutaniemi et al. 2007) and
is crucial for water conduction, mechanical strength and defense against pathogens in
plants. Lignin is a major product of phenylpropanoid metabolism in plants. It is
polymerized from three hydroxycinnamyl alcohol subunits, p-coumaryl, coniferyl and
sinapyl alcohol, resulting in hydroxyphenyl (H), guaiacyl (G) and syringyl (S) types of
lignin, respectively (Whetten et al. 1998). Gymnosperm lignins are based mainly on
coniferyl alcohol, dicot lignins are usually a mixture of coniferyl and sinapyl alcohols,
15
and monocot lignins are a mixture of all three alcohols (Higuchi, 1997). Previous studies
showed that transcripts for genes involved in the lignin biosynthetic pathway are among
the most abundant transcripts in wood forming tissues (Sterky et al. 1998; Whetten et al.
2001; Lorenz and Dean, 2002). Various genes known to be involved in lignin
biosynthesis including CAD, cinnamyl alcohol dehydrogenase; CCoAMT, caffeoyl
coenzymeA O-methyltransferase; CCR, cinnamoyl coenzymeA reductase; COMT,
caffeic acid O-methyltransferase; C3H, coumaroyl coenzyme A 3-hydroxylase; C4H,
cinnamate-4-hydroxylase; 4CL, 4-coumarate coenzyme A ligase; PAL, phenylalanine
ammonia-lyase (Koutaniemi et al. 2007; Mackay et al. 1995 and 1997; Li et al. 1997 and
1999) were analyzed.
Laccase was the first enzyme shown to be able to polymerize lignin monomers in
vitro (Freudenberg et al. 1958) and laccases are presumably involved in numerous
biological processes (Davin et al. 1992). Several studies indicated that laccase and
laccase-like activities are closely correlated with lignin deposition in developing xylem
(Bao et al. 1993; Dean and Eriksson 1994). We included eight loblolly pine laccases in
this project.
Cell expansion
The cell wall, a major structural determinant of plants, must undergo regulated
architectural alterations to contribute to the dynamic morphogenetic changes that
accompany plant growth and development. Xyloglucan endotransglycosylase/hydrolases
(XET/XTHs) are responsible for cutting and rejoining intermicrofibrillar xyloglucan
chains and thus causing the loosening of the cell wall required for plant cell expansion
16
(Bao et al. 1993; Nishitani and Tominaga 1992; Steele et al. 2001). Two XETs,
preferentially expressed in xylem, were analyzed (Yang et al. 2004).
Expansins are proteins residing in the cell walls that have an ability to plasticize
the cellulose-hemicellulose network of primary walls and help in cell expansion (Gray-
Mitsumune et al. 2004). Cho and Cosgrove (2000) showed that ectopic expression of
expansin genes stimulates plant growth, whereas suppression of expansins by gene
silencing decreases plant growth. Expansin-1 and expansin-9, both preferentially
expressed in pine shoots (Bomal et al. 2008), were included in our analyses.
The KORRIGAN (KOR) gene encodes a plasma membrane bound member of the
endo-1,4-beta-D-glucanase family and has been shown to be involved in rapid cell
elongation in Arabidopsis (Nicol et al. 1998). The COBRA (COB) gene encodes a
putative GPI-anchored protein and previous research in Arabidopsis has shown that COB
can act as a regulator of oriented cell expansion (Schindelman et al. 2001). Loblolly pine
homologs of KOR and COB genes were included in this project.
Transcription factors
In plants, MYB transcription factors are highly expressed in differentiating xylem
and are involved in transcriptional regulation of various enzymes involved in
phenylpropanoid metabolism and regulation of cellular morphogenesis and signal
transduction pathways (Martin and Paz-Ares 1997). R2R3-MYBs, one of the largest
families of transcription factors in plants, are strong candidates for the regulation of
phenylpropanoid enzymes and monolignol biosynthesis (Rogers and Campbell, 2004).
Pinus taeda MYB1 (PtMYB1) has been hypothesized to regulate lignin biosynthesis in
17
differentiating xylem (Patzlaff et al. 2003a). Overexpression of PtMYB4 resulted in
increased lignin deposition in transgenic tobacco (Patzlaff et al. 2003b) and Arabidopsis
plants (Newman et al. 2004). PtMYB8 was included in the gene expression analyses
because its closest homologue in spruce, PgMYB8, showed strong preferential
expression in secondary xylem (Bedon et al. 2007). Bomal et al. (2008) showed that
ectopic secondary cell wall deposition was strongly associated with overexpression of
PtMYB8.
The altered phloem development (APL) gene encodes a MYB transcription factor
that is required for phloem identity in Arabidopsis. Bonke et al. (2003) suggested that
the APL gene has a dual role both in promoting phloem differentiation and in repressing
xylem differentiation during vascular development. ATHB-8 is a member of the HD-zip
III class of transcription factors that is expressed in provascular cells and cambial
meristem of Arabidopsis where it has been proposed to regulate vascular development
(Baima et al. 2001).
Zhong et al. (2007) have shown that simultaneous RNA interference (RNAi)
inhibition of the expression of secondary wall-associated NAC domain protein 1 (SND1)
gene results in loss of secondary wall formation in fibers of Arabidopsis stems and also
down-regulation of several fiber-associated transcription factor genes. Overexpression of
SND1 activates the expression of secondary wall biosynthetic genes and results in
ectopic secondary wall deposition (Zhong et al. 2006). Expression of several
transcription factors, including MYB85, KNAT4 (a Knotted1-like homeodomain protein)
and KNAT7, is regulated by SND1 (Zhong et al. 2006, 2007). Secondary wall defects
18
were observed in Arabidposis plants with repressed expression of MYB85 and KNAT7
(Zhong et al. 2008).
Ntlim1 is a transcription factor binding to a PAL-box motif of the horseradish C2
peroxidase (prxC2) promoter (Kaothien et al. 2002) that is responsible for the wound-
induced expression of plant peroxidase genes. Kawaoka et al. (2000) observed that
transgenic tobacco plants with antisense Ntlim1 showed lower expression of PAL and
CAD and resulted in a 27% reduction in lignin content. Loblolly pine homologs of these
Ntlim1 and prxC2 genes were included in the gene expression analyses. Besides the
above mentioned transcription factors, gene expression analysis was performed on
various other transcription factors proposed to be involved in xylem development
including PIN1 (Gälweiler et al. 1998), RIC1, MOR1 (Whittington et al. 2001), and
FRA2/BOTERO (Burk and Ye, 2002).
Other genes involved in xylem development
Other cell wall synthesis genes including cell wall proteins, s-adenosylmethionine
synthases, UDP-glucosyltransferases, UDP-glucose pyrophosphorylase, etc., involved in
cell wall and xylem development were included in the gene expression analyses. Some
genes that have shown no homology with genes in the angiosperm database and are
preferentially expressed in xylem or stems of loblolly pine were also analyzed. These
no-hit sequences could include genes unique to pines, conifers, gymnosperms, or woody
plants.
19
MATERIALS AND METHODS
Plant material
A population of loblolly pine rooted cuttings was created at North Carolina State
University from 600 independent seed lots obtained from the three southern pine
breeding cooperatives (Murthy and Goldfarb, 2001; Rowe et al., 2002; LeBude et al.,
2004). It is comprised of more than 500 loblolly pine clones (unique genotypes) that
represent most of the natural range of loblolly pine and has no mating design (Fig. 1).
Three rooted cuttings from each of 475 clones were transplanted into pots all containing
the same potting mixture and were grown for four additional months (April-August
2006) in a common greenhouse environment with evaporative cooling in College
Station, TX. Conditions were as uniform as possible although there could be small
differences in light or temperature in different parts of the greenhouse and there may be
variability between bags of potting mixture. The stems, needles and roots were collected
from each plant, frozen in liquid nitrogen and stored at -80°C.
RNA extraction and cDNA synthesis
Total RNA was extracted from the stems of two ramets (biological replicates) of
each clone using the method of Chang et al. (1993) except for an additional chloroform
extraction. Residual DNA was removed using DNA-freeTM
(Ambion Inc., TX). The first
strand cDNAs for each sample were synthesized using 5ug of total RNA, random
20
hexamers and a High Capacity cDNA Reverse Transcription Kit (Applied Biosystems,
CA), following the manufacturer‟s recommendations.
Gene selection
Genes shown or hypothesized to be involved in xylem development were selected
for the expression studies. Genes were selected based on reviews of the current literature
and prior research in our laboratory. The selected genes include those involved in cell
wall formation, lignin biosynthesis, transcription factors and genes of unknown function
that are preferentially expressed in loblolly pine xylem tissue. The genes selected and
reasons for selecting particular genes are given in the literature review.
Primer design and testing the efficiency of amplification
Putative orthologs of the selected genes were identified in loblolly pine using the
NCBI EST database and BLAST (http://www.ncbi.nlm.nih.gov/blast/Blast.cgi; Altschul
et al. 1990) and the loblolly EST database at the University of Georgia
(http://fungen.org/Projects/Pine/Pine.htm). Contigs were assembled from these EST
sequences and gene specific primers were designed for qRT-PCR using Primer Express
(Applied Biosystems). The primers were tested on a panel of 12 clones to see if there
were significant differences in expression among the clones and melting curve analyses
were performed to check if the primers were amplifying a single product. The sequences
of the primers used in the expression analysis are given in Appendix A.
21
A template titration assay was done using a dilution series of cDNA templates
(1000ng, 250ng, 62.5ng, 15.625ng and 3.90ng) and 2 control samples: a no template
control (NTC) and a no reverse transcriptase control (-RT). The slope can be affected by
template quality, pipetting errors, etc. 18S rRNA and β-actin were also run on the same
plate to normalize the expression data. All lignin genes were evaluated in the standard-
curve trials to ensure that they gave efficient amplification and the efficiency of
amplification was calculated from a plot of ΔCt versus the template concentration.
Melting curve analyses were done to ensure product specificity and to differentiate
between the true product and primer dimers. Four primer pairs gave more than one peak.
These primers were discarded and new primers were designed and tested. These
redesigned primer pairs gave single peaks, suggesting the amplification of one product.
All the valid primer sets had a slope of approximately –3.3 and a correlation coefficient
(R2-value) >0.95 for the standard curve. These standard curve analyses provided
evidence for the efficiency of the amplification reactions.
Relative gene expression analysis
Transcript levels of the genes of interest were determined using qRT-PCR. The
technical variability of the PCR reaction was standardized by inclusion of a template
normalization step using stably expressed reference genes, 18S rRNA and β-actin. A no
template control (NTC) and a no reverse transcriptase (-RT) control were included on
some plates. Amplification of the NTC sample indicates the presence of primer-dimer
formed during the reaction. The -RT sample is included to confirm the absence of
22
genomic amplification. Samples were run in duplicate on each plate using SYBR-Green
PCR Master Mix (Applied Biosystems) on a GeneAmp 7900HT Sequence Detection
System (Applied Biosystems), following the manufacturer‟s recommendations. Real-
time RT-PCR was performed in an 8 µl reaction containing 2.5 µl ddH2O, 4 µl SYBR-
Green PCR Master Mix, 0.5 µl forward primer (1 mM), 0.5 µl reverse primer (1 mM)
and 0.5 µl of template cDNA (10 ng/µl). The PCR conditions were 2 min of
preincubation at 50°C, 10 min of predenaturation at 95°C, 40 cycles of 15 sec at 95°C
and 1 min at 60°C, followed by steps for dissociation curve generation (15 sec at 95°C,
15 sec at 60°C and 15 sec at 95°C).
Analysis of the qRT-PCR data
Relative transcript levels for each sample were obtained using the „relative standard
curve method‟ (see User Bulletin #20 ABI PRISM 7900 Sequence Detection System for
details), and were normalized to the transcript level of 18S rRNA or β-actin of each
sample to get ΔCt values. The clone with the closest expression values for all the genes
between the ramets was selected as a calibrator and SDS 2.3 software (Applied
Biosystems) was used to collect the ΔΔCt values of all the genes for all the clones. The
selective amplification of individual gene family members was judged based on
dissociation curves. These experiments were conducted for 111 genes x 400 clones x 2
ramets/clone x 2 reps/ramet. A paired t-test and an analysis of variance (ANOVA), using
a p-value of 0.01, were used on normalized and calibrated transcript levels to test for
variation in gene expression among clones.
23
Sequencing of primer binding sites
In order to rule out low primer binding efficiency as a factor responsible for low-
expression, new primers were designed for most genes outside of the initial set of
primers used for qRT-PCR and PCR was performed in low- and high- expressing clones.
These PCR transcripts were sequenced to check for the presence of SNPs in the primer
binding sites. If SNPs were seen only in the primer binding sites of clones with low
expression, then qRT-PCR was performed using a different set of primers to check if
SNPs affected primer binding efficiency and expression values.
Correlations and clustering analyses
The gene expression data (ΔΔCt values) was auto-scaled as described in Stahlberg et
al. (2008) so that the average expression of each gene in all clones is zero and its
standard deviation is one. This allows equal weights to all genes in clustering analyses.
Pearson correlation in SPSS was used to determine if there were correlations between
pairs of genes based on their ΔΔCt values. We applied Ward‟s linkage hierarchical
clustering algorithm (Ward 1963) to group genes according to similar expression
patterns using Euclidean distances. Clone clustering was also done using Ward‟s linkage
hierarchical clustering algorithm. We used bootstrapping (10,000 replicates) to obtain
estimates for the reliability of the groupings using the pvclust (Suzuki and Shimodaira
2006) package as part of the R computing environment (R Core Development Team
2007).
24
Gene network inference
Bayesian Network inference with Java Objects (BANJO, http://www.cs.duke.edu/
~amink/ software/banjo/) was used to infer a gene network from the expression data.
BANJO can infer gene networks from gene expression data (Hartemink 2005; Yu et al.
2004). Results for BANJO were obtained using the default parameters at the MARIMBA
website (http://marimba.hegroup.org/index.php). The gene expression data was changed
from continuous to discrete using their q3 discretization function.
RESULTS
Variation in gene expression
The genes analyzed in this project were primarily selected based on a review of the
literature related to xylem development in woody and non-woody species. Additional
genes were included based on prior results from our laboratory. The genes selected for
expression analyses are listed in table 1.
Gene expression values (Cycle threshold - Ct) for 111 genes known or hypothesized
to be involved in wood development were collected from 400 clones of loblolly pine
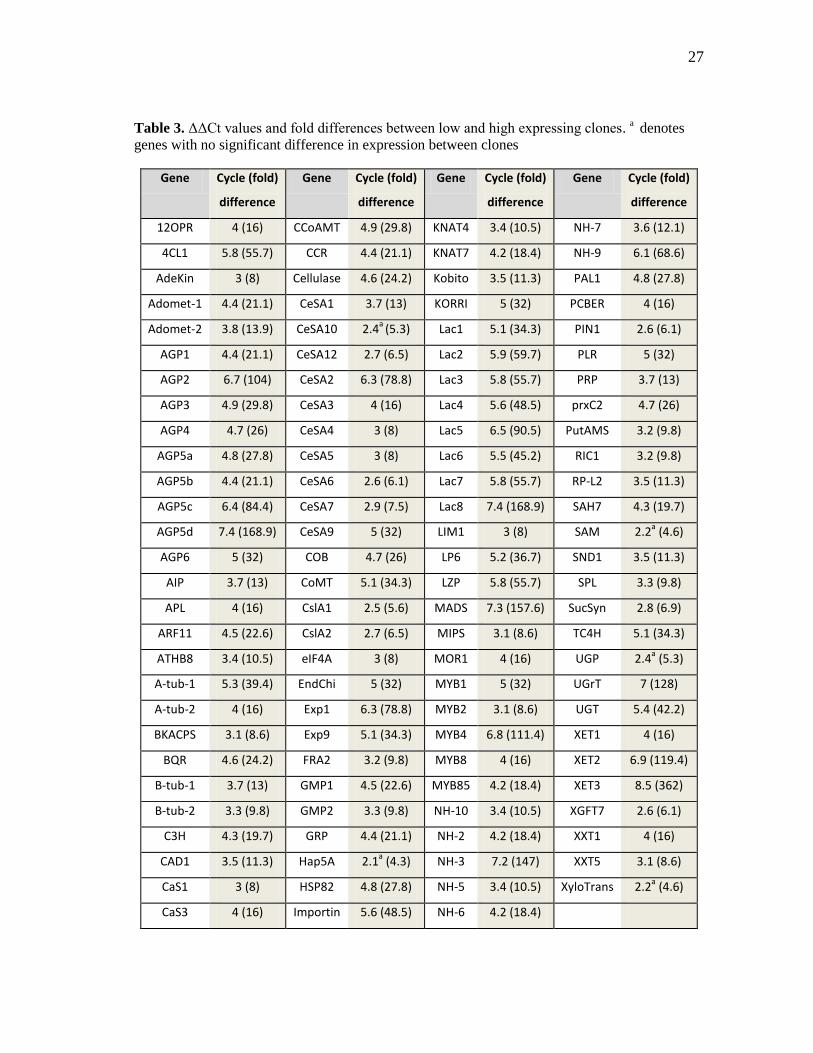
using qRT-PCR (Table 3). Of the 111 genes analyzed, statistically significant differences
among clones were observed for 106 genes. The differences between the clone with the
lowest expression and that with the highest expression ranged from 2.1 cycles (4.3-fold)
for Hap5a to 8.5 cycles (362-fold) for XET3. The average difference between low- and
high-expressing clones for all genes was 4.4 cycles (20.8-fold). The genes showed
25
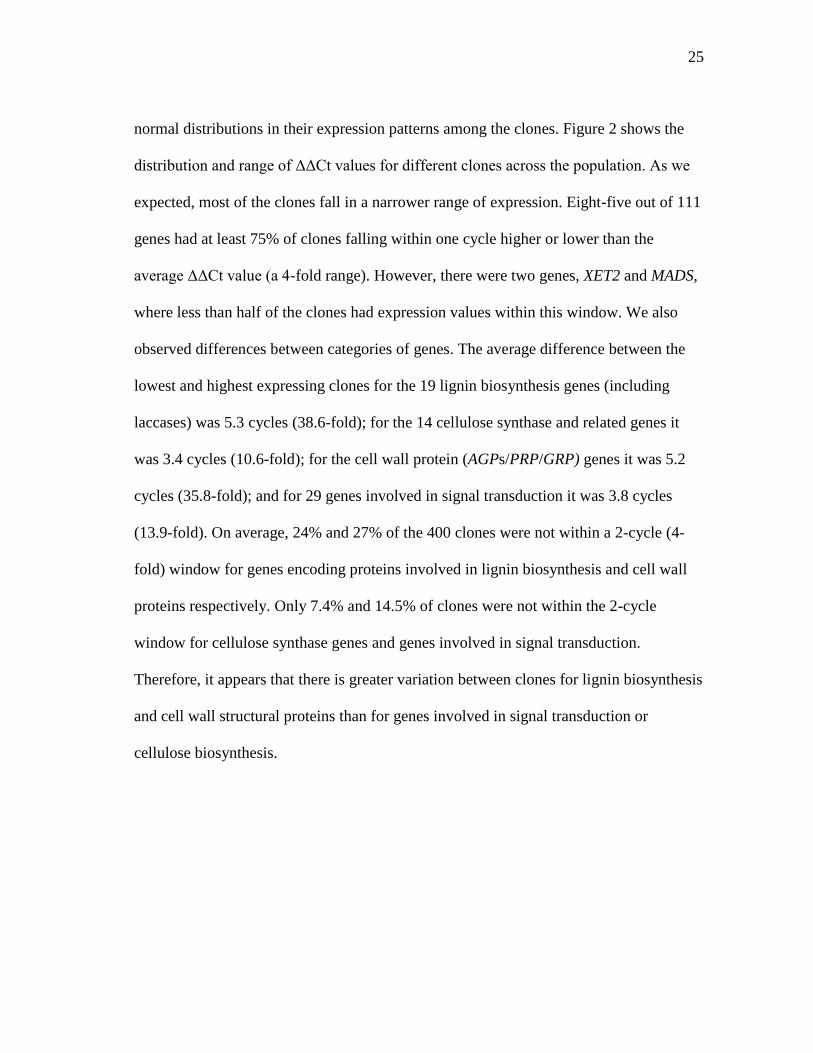
normal distributions in their expression patterns among the clones. Figure 2 shows the
distribution and range of ΔΔCt values for different clones across the population. As we
expected, most of the clones fall in a narrower range of expression. Eight-five out of 111
genes had at least 75% of clones falling within one cycle higher or lower than the
average ΔΔCt value (a 4-fold range). However, there were two genes, XET2 and MADS,
where less than half of the clones had expression values within this window. We also
observed differences between categories of genes. The average difference between the
lowest and highest expressing clones for the 19 lignin biosynthesis genes (including
laccases) was 5.3 cycles (38.6-fold); for the 14 cellulose synthase and related genes it
was 3.4 cycles (10.6-fold); for the cell wall protein (AGPs/PRP/GRP) genes it was 5.2
cycles (35.8-fold); and for 29 genes involved in signal transduction it was 3.8 cycles
(13.9-fold). On average, 24% and 27% of the 400 clones were not within a 2-cycle (4-
fold) window for genes encoding proteins involved in lignin biosynthesis and cell wall
proteins respectively. Only 7.4% and 14.5% of clones were not within the 2-cycle
window for cellulose synthase genes and genes involved in signal transduction.
Therefore, it appears that there is greater variation between clones for lignin biosynthesis
and cell wall structural proteins than for genes involved in signal transduction or
cellulose biosynthesis.
26
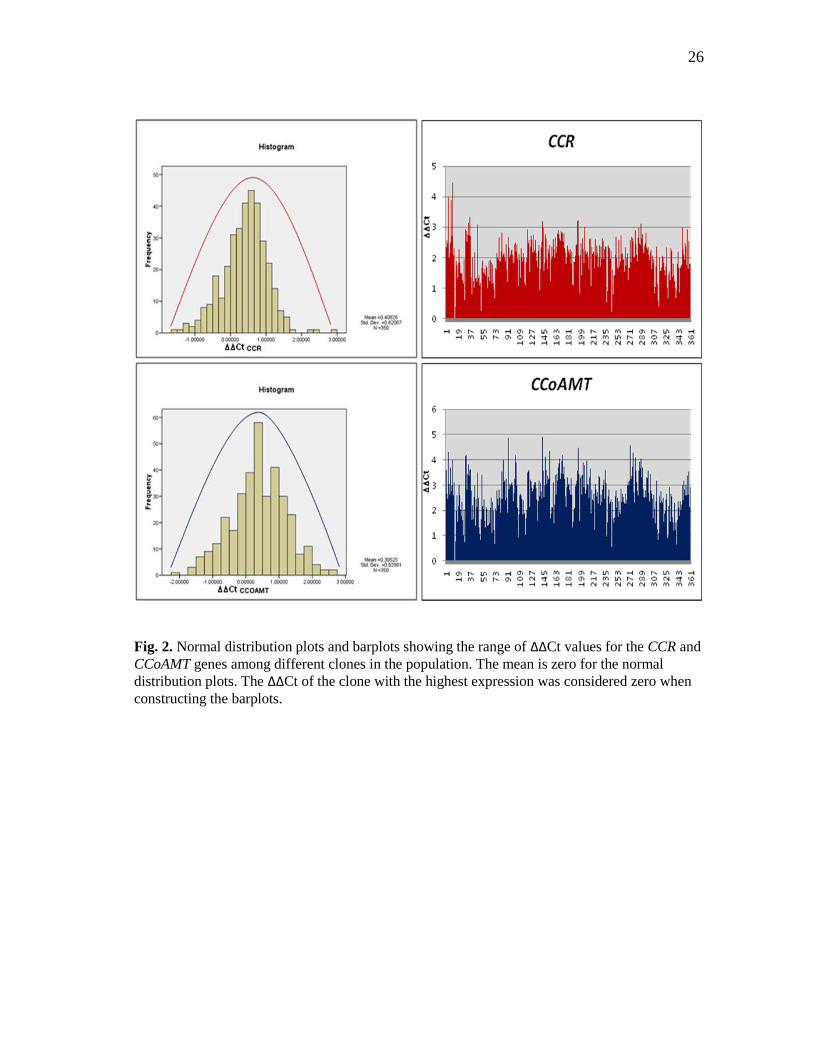
Fig. 2. Normal distribution plots and barplots showing the range of ΔΔCt values for the CCR and
CCoAMT genes among different clones in the population. The mean is zero for the normal
distribution plots. The ΔΔCt of the clone with the highest expression was considered zero when
constructing the barplots.
27
Table 3. ΔΔCt values and fold differences between low and high expressing clones. a denotes
genes with no significant difference in expression between clones
Gene Cycle (fold)
difference
Gene Cycle (fold)
difference
Gene Cycle (fold)
difference
Gene Cycle (fold)
difference
12OPR 4 (16) CCoAMT 4.9 (29.8) KNAT4 3.4 (10.5) NH-7 3.6 (12.1)
4CL1 5.8 (55.7) CCR 4.4 (21.1) KNAT7 4.2 (18.4) NH-9 6.1 (68.6)
AdeKin 3 (8) Cellulase 4.6 (24.2) Kobito 3.5 (11.3) PAL1 4.8 (27.8)
Adomet-1 4.4 (21.1) CeSA1 3.7 (13) KORRI 5 (32) PCBER 4 (16)
Adomet-2 3.8 (13.9) CeSA10 2.4a
(5.3) Lac1 5.1 (34.3) PIN1 2.6 (6.1)
AGP1 4.4 (21.1) CeSA12 2.7 (6.5) Lac2 5.9 (59.7) PLR 5 (32)
AGP2 6.7 (104) CeSA2 6.3 (78.8) Lac3 5.8 (55.7) PRP 3.7 (13)
AGP3 4.9 (29.8) CeSA3 4 (16) Lac4 5.6 (48.5) prxC2 4.7 (26)
AGP4 4.7 (26) CeSA4 3 (8) Lac5 6.5 (90.5) PutAMS 3.2 (9.8)
AGP5a 4.8 (27.8) CeSA5 3 (8) Lac6 5.5 (45.2) RIC1 3.2 (9.8)
AGP5b 4.4 (21.1) CeSA6 2.6 (6.1) Lac7 5.8 (55.7) RP-L2 3.5 (11.3)
AGP5c 6.4 (84.4) CeSA7 2.9 (7.5) Lac8 7.4 (168.9) SAH7 4.3 (19.7)
AGP5d 7.4 (168.9) CeSA9 5 (32) LIM1 3 (8) SAM 2.2a (4.6)
AGP6 5 (32) COB 4.7 (26) LP6 5.2 (36.7) SND1 3.5 (11.3)
AIP 3.7 (13) CoMT 5.1 (34.3) LZP 5.8 (55.7) SPL 3.3 (9.8)
APL 4 (16) CslA1 2.5 (5.6) MADS 7.3 (157.6) SucSyn 2.8 (6.9)
ARF11 4.5 (22.6) CslA2 2.7 (6.5) MIPS 3.1 (8.6) TC4H 5.1 (34.3)
ATHB8 3.4 (10.5) eIF4A 3 (8) MOR1 4 (16) UGP 2.4a (5.3)
A-tub-1 5.3 (39.4) EndChi 5 (32) MYB1 5 (32) UGrT 7 (128)
A-tub-2 4 (16) Exp1 6.3 (78.8) MYB2 3.1 (8.6) UGT 5.4 (42.2)
BKACPS 3.1 (8.6) Exp9 5.1 (34.3) MYB4 6.8 (111.4) XET1 4 (16)
BQR 4.6 (24.2) FRA2 3.2 (9.8) MYB8 4 (16) XET2 6.9 (119.4)
B-tub-1 3.7 (13) GMP1 4.5 (22.6) MYB85 4.2 (18.4) XET3 8.5 (362)
B-tub-2 3.3 (9.8) GMP2 3.3 (9.8) NH-10 3.4 (10.5) XGFT7 2.6 (6.1)
C3H 4.3 (19.7) GRP 4.4 (21.1) NH-2 4.2 (18.4) XXT1 4 (16)
CAD1 3.5 (11.3) Hap5A 2.1a (4.3) NH-3 7.2 (147) XXT5 3.1 (8.6)
CaS1 3 (8) HSP82 4.8 (27.8) NH-5 3.4 (10.5) XyloTrans 2.2a (4.6)
CaS3 4 (16) Importin 5.6 (48.5) NH-6 4.2 (18.4)
28
Primer binding and amplification efficiency
The observed differences between clones could be due to true differences in RNA
levels present in the tissues or inefficient primer binding resulting from polymorphisms
in primer binding sites. The regions amplified by RT-PCR were sequenced to determine
if SNPs (single nucleotide polymorphisms) in the primer binding sites were responsible
for differences in gene expression values. SNPs were observed in the primer binding
sites for several of the primers. All of the SNPs were in the middle or 5΄ end of the
primer sequence, except for SAM, which had a pair of SNPs at the 3΄ end of the primer-
binding site. When the same SNPs were present in both high- and low-expressing clones,
we decided the expression value differences were not due to the SNPs. We redesigned
primers for six genes and performed qRT-PCR to determine if the SNPs were
responsible for the expression differences due to improper primer binding. The gene
expression values with the new primer pairs were identical with those from old primer
pairs (+/- 0.05 cycles), suggesting that the SNPs did not have much impact on primer
binding. This might be due to the fact that the SNPs were mostly present towards the 5΄
end of the primers. Boyle et al. (2009) have shown that SNPs present at the 5΄ end of the
primer do not affect the binding efficiency of the primer and our results are in agreement
with that observation.
29
Correlation of gene expression values
To determine if there were correlations between pairs of genes based on their
expression, Pearson correlation in SPSS (Levesque 2007) was used. Significant
correlations (r2>0.66) were observed between 145 pairs of genes based on their gene
expression (ΔΔCt) values. Expression of the PtMYB1 gene has significant positive
correlations with all of the analyzed lignin biosynthesis genes (Table 4), in accordance
with the hypothesis by Bomal et al. (2008) that MYB1 might be involved in
transcriptional activation of genes involved in the phenylpropanoid pathway. Expression
of the SND1 gene showed significant positive correlations with the expression of several
other transcription factors involved in wood development as well as genes encoding
AGPs, enzymes involved in lignin biosynthesis, and other proteins involved in
xylogenesis (Table 4). No strong correlations were observed between the gene
expression data and the geographical location of the trees in the population or the
average precipitation of the counties from which the trees in the population were initially
collected.
30
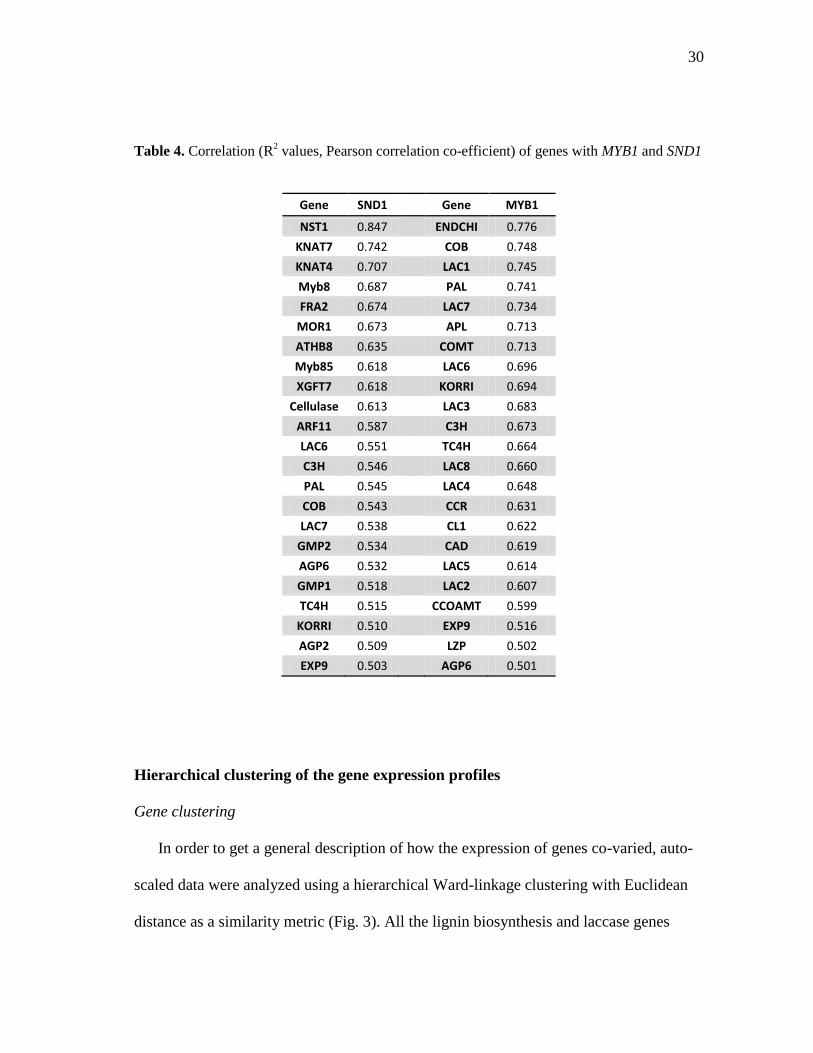
Table 4. Correlation (R2 values, Pearson correlation co-efficient) of genes with MYB1 and SND1
Gene SND1
Gene MYB1
NST1 0.847
ENDCHI 0.776
KNAT7 0.742
COB 0.748
KNAT4 0.707
LAC1 0.745
Myb8 0.687
PAL 0.741
FRA2 0.674
LAC7 0.734
MOR1 0.673
APL 0.713
ATHB8 0.635
COMT 0.713
Myb85 0.618
LAC6 0.696
XGFT7 0.618
KORRI 0.694
Cellulase 0.613
LAC3 0.683
ARF11 0.587
C3H 0.673
LAC6 0.551
TC4H 0.664
C3H 0.546
LAC8 0.660
PAL 0.545
LAC4 0.648
COB 0.543
CCR 0.631
LAC7 0.538
CL1 0.622
GMP2 0.534
CAD 0.619
AGP6 0.532
LAC5 0.614
GMP1 0.518
LAC2 0.607
TC4H 0.515
CCOAMT 0.599
KORRI 0.510
EXP9 0.516
AGP2 0.509
LZP 0.502
EXP9 0.503
AGP6 0.501
Hierarchical clustering of the gene expression profiles
Gene clustering
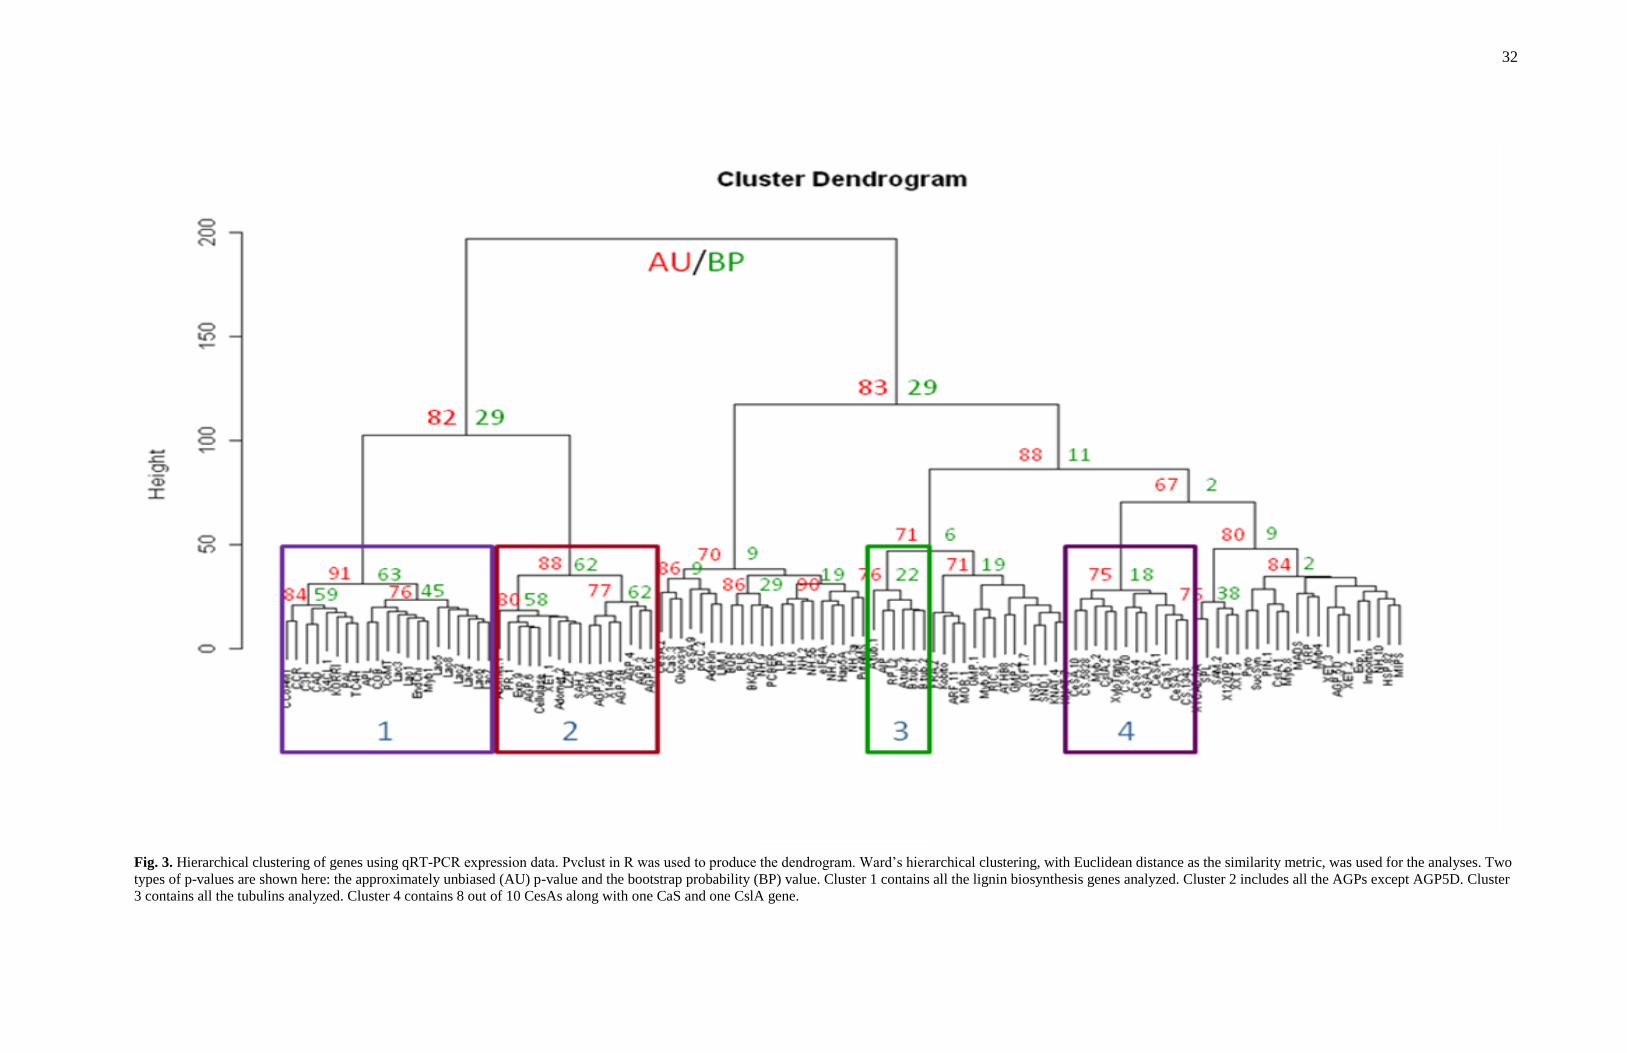
In order to get a general description of how the expression of genes co-varied, auto-
scaled data were analyzed using a hierarchical Ward-linkage clustering with Euclidean
distance as a similarity metric (Fig. 3). All the lignin biosynthesis and laccase genes
31
except LAC1 clustered together with a bootstrap probability (BP) value of 63%. Eight of
the nine genes encoding AGPs clustered together along with seven other genes with a
BP value of 62%. The BP values of the other gene clusters were usually less than 30%,
suggesting the weak nature of these clusters. However, eight of the ten cellulose
synthase genes analyzed as well as one cellulose synthase-like gene and one calose
synthase gene clustered together. The four tubulin genes also clustered together.
Clone clustering
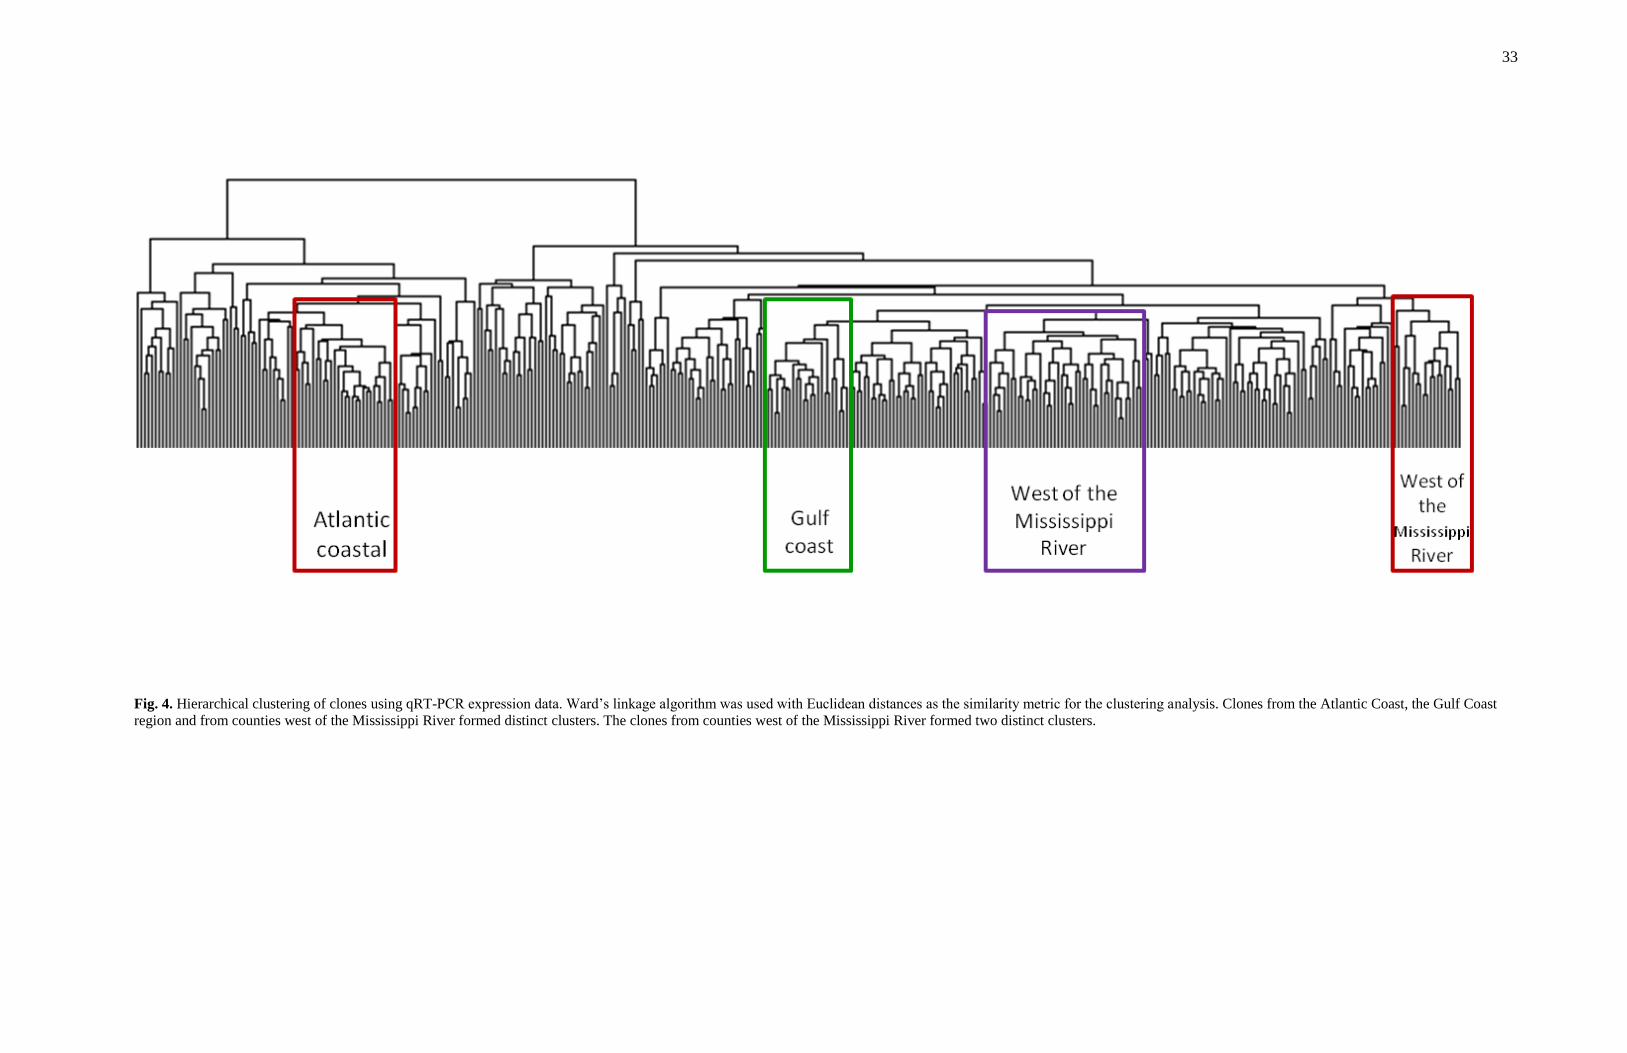
To determine if expression patterns are different across the range of loblolly pine,
auto-scaled gene expression data was used to perform cluster analyses on the 400 clones
in the population (Fig. 4). The clustering analysis was done using hierarchical Ward-
linkage clustering with Euclidean distance as the similarity metric. The dendrogram
grouped individuals based on similar patterns of expression for the 111 genes. Most
clones (50 out of 55) from west of the Mississippi River (Fig.1, region 5) formed two
distinct clusters that contained only five other clones. Thirteen of the 26 clones from the
region along the Gulf Coast (Fig.1, region 4) formed a cluster and almost half (16 out of
33) of the clones from region closest to the Atlantic coast (Fig.1, region 2) formed a
cluster. A large number of the clones (69%) come from areas we have indicated as
regions 1 and 3 (Fig. 1). This includes the parts of Mississippi, Alabama, Georgia, South
Carolina, North Carolina and Virginia that are not close to the Gulf of Mexico or the
Atlantic Ocean. We did not observe strong clustering of clones within these regions.
32
Fig. 3. Hierarchical clustering of genes using qRT-PCR expression data. Pvclust in R was used to produce the dendrogram. Ward‟s hierarchical clustering, with Euclidean distance as the similarity metric, was used for the analyses. Two
types of p-values are shown here: the approximately unbiased (AU) p-value and the bootstrap probability (BP) value. Cluster 1 contains all the lignin biosynthesis genes analyzed. Cluster 2 includes all the AGPs except AGP5D. Cluster
3 contains all the tubulins analyzed. Cluster 4 contains 8 out of 10 CesAs along with one CaS and one CslA gene.
33
Fig. 4. Hierarchical clustering of clones using qRT-PCR expression data. Ward‟s linkage algorithm was used with Euclidean distances as the similarity metric for the clustering analysis. Clones from the Atlantic Coast, the Gulf Coast
region and from counties west of the Mississippi River formed distinct clusters. The clones from counties west of the Mississippi River formed two distinct clusters.
34
Inference of a gene regulatory network
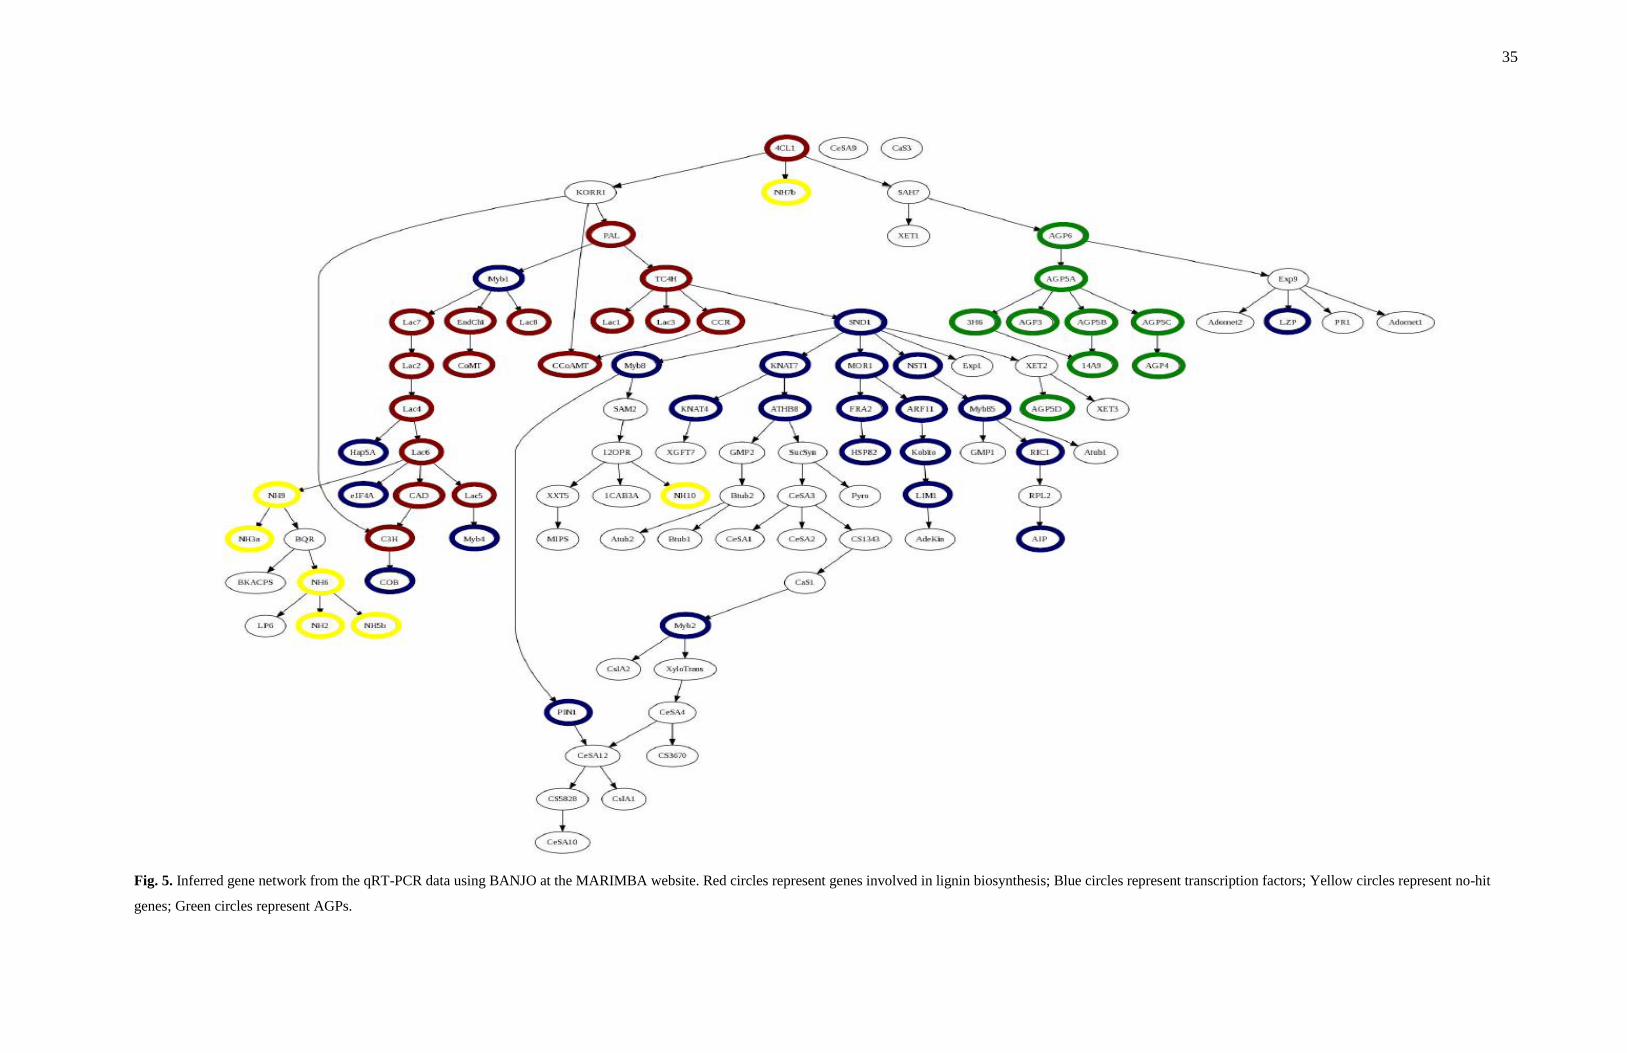
Correlations between gene expression patterns can be used to infer gene
regulatory networks (Ma and Chan 2008). We employed steady-state Bayesian network
inference (BANJO) of interactions between genes involved in wood development (Fig.
5). In an inferred gene network, an interaction between genes does not necessarily imply
a physical interaction. It can refer to an indirect regulation by proteins or metabolites
(Bansal et al. 2007). If two genes are joined by an edge (arrow), it can be hypothesized
that the expression pattern of these two genes is highly correlated and the expression of
the source gene might affect the expression of the target gene. The edge connecting a
gene encoding a transcription factor and a target non-transcription factor gene suggests
the transcriptional regulation of the target by the transcription factor. The edge between
MYB1 and LAC7, LAC8 and EndChi genes suggests that MYB1 transcriptionally
regulates expression of these three genes. If two transcription factors are joined by an
edge, then such an edge can be an indication that the two transcription factors act as
coregulators of the expression of other genes or one of the two transcription factors is a
transcriptional regulator of the other. The transcription factors SND1 and MOR1 may
jointly regulate the target gene HSP82 or SND1 may regulate MOR1, which further
regulates the expression of HSP82. The network analysis indicates that the SND1 gene
may be involved in the regulation of many of the genes we analyzed. We analyzed 111
genes, which is only a fraction of the total genes involved in xylem development.
Therefore, critical links in the network may be missing.
35
Fig. 5. Inferred gene network from the qRT-PCR data using BANJO at the MARIMBA website. Red circles represent genes involved in lignin biosynthesis; Blue circles represent transcription factors; Yellow circles represent no-hit
genes; Green circles represent AGPs.
36
DISCUSSION
Considerable natural variation exists within most forest tree species, some of which
reflects adaptations to different environments (Linhart and Grant, 1996). This natural
variation is the result of the interaction of multiple genes and environmental factors
(Keurentjes and Sulpice, 2009). In order to understand the genetic basis and molecular
mechanisms behind this naturally occurring developmental variation, genome-wide or
candidate gene-based approaches can be used to identify the genes and nucleotide
polymorphisms causing the observed diversity. Thus, the analysis of natural intraspecific
variation helps us to discover the genes involved in plant adaptation to different
environments through developmental modifications (Alonso-Blanco et al. 2005).
Genetic polymorphisms affecting plant development or adaptation may affect protein
structure or gene expression. Studies investigating natural variation in gene expression
have been carried out in several species including humans (Cheung et al. 2003), yeast
(Steinmetz et al. 2002), fish (Oleksiak et al. 2002) Arabidopsis (Vuylsteke et al. 2005),
rice (Liu et al. 2010) and maize (Auger et al. 2005). Cheung et al. (2003) examined the
transcript levels of five genes in human lymphoblastoid cells among unrelated
individuals, related individuals and monozygotic twins. They found that the genes
showed less variability in expression level in more closely related individuals i.e,
expression levels varied the least in monozygotic twins, with intermediate variability in
siblings from the same family (2–5 times greater) and greatest variability in unrelated
individuals (3–11 times greater). Oleksiak et al. (2002) used microarray technology to
37
study the variation in gene expression within and between natural populations of teleost
fish of the genus Fundulus and observed statistically significant differences in
expression for approximately 18% of 907 genes. Liu et al. (2010) have shown that in two
different rice cultivars the expression of four phenylpropanoid pathway-related genes
(C3H, CCR1, CCR10 and CHS8 (Chalcone synthase8)) differs three to 500 fold under
normal conditions and 85 to1150 fold during oxidative stress. We analyzed the
expression profiles of 111 genes, hypothesized to be involved in xylem development, in
a population of 400 loblolly pine plants. Out of these 111 genes, 106 genes showed
statistically significant differences (ranging from 4.3 to 362-fold) in their gene
expression among the clones. The large amounts of variation in expression we observed
support the idea that expression differences may be important factors responsible for
evolutionary changes.
Variation in expression of a particular gene may be due to the environment,
developmental stage, mutations in promoter or enhancer regions of the gene or to
mutations in transcription factors or other genes in the signal transduction cascade. The
additive and epistatic effects of the genes can result in large numbers of individuals with
phenotypes (in our case expression levels) close to the mean with fewer having extreme
phenotypes (expression levels) (Benfey and Mitchell-Olds, 2008). While in some cases
we observed very large differences between high- and low-expressing clones, we did
find that for over three-fourths of our genes, less than 25% of the clones had expression
values more than two-fold higher or lower than the population average. Growth
conditions are not the primary reason for the observed gene expression differences as
38
growth conditions were as uniform as possible. We feel the differences in expression are
primarily due to genetic polymorphisms. Since expression appears to be quantitative
with a continuous distribution between the low- and high-expressing individuals, this
suggests multiple genetic polymorphisms are involved. Gene expression profiles help us
identify genes with highly variable expression, but the reasons for this variation cannot
be determined easily.
Natural variation in a population provides a resource to discover novel gene
functions (Benfey and Mitchell-Olds, 2008). Theoretically, genes in the same expression
cluster must share some common function or regulatory elements. It might be possible to
hypothesize the function of an unknown gene by looking at the other genes with which it
clusters (Hruschka et al. 2006). Alternatively, the known and unknown genes may be
coregulated or one could regulate the other. We used Ward‟s linkage hierarchical
clustering algorithm to group genes according to similar expression patterns. Euclidean
distance was used as a nonparametric distance function. In the analysis with our data set,
the lignin biosynthetic genes and AGPs formed separate clusters with significant
bootstrapping values. All laccases clustered closely together and close to the lignin
biosynthesis genes supporting studies that indicated the activities of laccases are closely
correlated with lignin deposition in developing xylem (Bao et al. 1993; Dean and
Eriksson 1994). PtMYB1, that has been hypothesized to regulate lignin biosynthesis in
differentiating xylem (Patzlaff et al. 2003a), clustered with the lignin biosynthesis genes.
The KORRIGAN (KORRI) gene encodes a plasma membrane-bound member of the
endo-1,4-beta-D-glucanase family and has been shown to be involved in rapid cell
39
elongation in Arabidopsis (Nicol et al. 1998). COBRA (COB), a regulator of oriented
cell expansion (Schindelman et al. 2001), and KORRI clustered together with the lignin
biosynthesis genes and laccases. All CeSAs, CaSs and Csl genes clustered together,
except CeSA2, CeSA9, and CaS3, which formed a cluster with UDP-glucosyl
transferase, adenolyte kinase, prxC2 (horse radish peroxidase) and transcription factor
LIM1. Kaothien et al. (2002) showed that LIM1 is a transcription factor binding to a
PAL-box motif of the horseradish C2 peroxidase (prxC2) promoter in tobacco plants,
which is responsible for the wound-induced expression of plant peroxidase genes. The
similar expression pattern of these two genes in our analysis suggests this relationship is
also true in loblolly pine. The CslA1 gene formed a cluster with MYB8 and PIN1,
suggesting that it might be regulated by these two transcription factors, either directly or
indirectly. Out of the seven no-hit genes (genes with no significant matches in other
plants but selected due to preferential expression in loblolly pine xylem (Yang et al.
2004)) included in our project, five of them clustered together with the following genes:
LP-6 (a chitinase homolog), PutAMS (a putative S-adoMet synthetase), translation
initiation factor eIF-4A and transcription factor Hap5A. One of the no-hit genes, NH-9,
formed a cluster with BQR (1,4 Benzoquinone reductase), PLR (Pinoresinol-lariciresinol
reductase), PCBER (Phenylcoumaran benzylic ether reductase) and BKACPS (Beta-
ketoacyl-ACP synthetase I-2) genes. BQR is shown to be upregulated in cotton during
the fiber initiation stage and is suggested to be involved in cell elongation and secondary
cell wall synthesis (Turley and Taliercio 2008). PCBER and PLR are involved in the
biosynthesis of important phenylpropanoid-derived plant defense compounds and
40
PCBER is considered to be the progenitor of PLR (Gang et al. 1999). These correlations
and the inferred network analyses described below help us to interpret the function of the
no-hit genes. The no-hit genes may have functions similar to or be coregulated with the
genes with which they cluster. Although these predictions are not certain, they at least
provide a point from which one can start to interpret the function of these genes.
Continuous distribution across large geographical expanses makes the presence of
genetic clusters unlikely for species such as loblolly pine. However, based on the results
from principal component analyses (PCA) (Jolliffe 2002) and STRUCTURE (Pritchard
et al., 2000; Falush et al., 2003), a program for detecting population structure, Eckert et
al. (2010) have shown that patterns of population structure for loblolly pine do exist in
natural populations. Principal component analysis of SNP and SSR marker data revealed
the presence of seven significant PCs defining eight genetic clusters of which three were
clearly differentiated clusters. The remaining five significant clusters lacked a strong
geographical basis. One of the strong clusters is separated from the other two by the
Mississippi River Valley, with a further division of the eastern cluster into Gulf and
Atlantic Coast clusters. The clusters from the gene expression analyses are in partial
agreement with the results of the population structure analyses. Out of the 55 clones
from the region west of the Mississippi River, 50 of them formed a distinct cluster, in
agreement with the results of Eckert et al. (2010). However, we did not find that most
clones from the regions east of the Mississippi River Valley formed clusters resembling
those determined by PCA.
41
Using BANJO, we inferred a gene network from our expression data. The inferred
network supported the previous assumptions of genes with known functions involved in
certain metabolic pathways. This inferred gene network might also help to shed some
light on the regulatory interactions among genes and identify genes that regulate each
other. Zhong et al. (2007) have shown that simultaneous RNA interference (RNAi)
inhibition of both the Secondary wall-associated NAC domain protein 1 (SND1) and
NAC secondary wall thickening promoter factor 1 (NST1) genes results in loss of
secondary wall formation in fibers of Arabidopsis stems and also down-regulation of
several fiber-associated transcription factor genes. Overexpression of SND1 activates the
expression of secondary wall biosynthetic genes and results in ectopic secondary wall
deposition (Zhong et al. 2006). Expression of several transcription factors, including
MYB85, KNAT4 (a Knotted1-like homeodomain protein) and KNAT7, are regulated by
SND1 (Zhong et al. 2006, 2007). Secondary wall defects were observed in Arabidopsis
plants with repressed expression of MYB85 and KNAT7 (Zhong et al. 2008). PtMYB8 is
a close homolog of the Arabidopsis MYB61 whose overexpression could cause ectopic
lignin deposition (Zhong and Ye 2009). Our inferred gene network has edges between
SND1 and NST1, KNAT7, MOR1, PtMYB8, MYB85, XET2 and lignin biosynthetic genes.
This inferred network is in accordance with the results of Zhong et al. (2006) suggesting
that SND1 is indeed a master transcriptional switch activating the developmental
program of secondary wall biosynthesis in gymnosperms as well as angiosperms. Zhong
and Ye (2009) have shown that the biosynthesis of other secondary wall components,
including cellulose and xylan are under the control of the same transcriptional network
42
as lignin. Our analyses indicate that regulation of secondary cell wall synthesis in pines
is similar to that in Arabidopsis. As pointed out by Zhong and Ye (2009) identification
of these transcription factors may provide tools valuable for manipulating wood
properties.
PtMYB1, PtMYB2 and PtMYB4 are preferentially expressed in developing xylem
tissues (Patzlaff et al. 2003a, b). These MYBs bind AC elements and activate
transcription from lignin biosynthetic gene promoters in plant cells (Patzlaff et al. 2003a,
b). Our inferred gene network shows edges connecting MYB1 with PAL, Endo chitinase,
COMT and most of the laccases, supporting the previous observations by Patzlaff et al.
(2003a, b) and Bao et al. (1993). In Arabidopsis, KORRI and CTL1, a chitinase-like gene
implicated in cellulose deposition during primary cell wall formation, were highly
correlated with the primary cell wall cellulose complex (Persson et al. 2005). In the
inferred gene network, KORRI is connected to Endchi (Pinus taeda homolog of CTL1)
through PAL and PtMYB1. KORRI is connected to the lignin biosynthetic genes in the
inferred network suggesting that it might be coordinately regulated along with those
genes. We analyzed only a fraction of the total genes involved in xylem development
and therefore, critical links in the network are likely missing. Incorporation of more
genes into the analyses will help us better understand the loblolly pine xylem gene
regulatory network.
43
CHAPTER III
ASSOCIATION STUDIES OF WOOD DEVELOPMENT GENES IN A
NATURAL POPULATION OF LOBLOLLY PINE (Pinus taeda. L)
INTRODUCTION
Most agronomically important traits in plants are complex in nature and are
controlled by multiple genes (Tanksley 1993). The two most commonly used tools for
dissecting these complex genetic traits are Quantitative Trait Loci (QTL) mapping
(Linkage analysis) and association mapping (Linkage disequilibrium mapping) (Lander
and Schork 1994; Zhu et al. 2008). However, the identification of specific genes
responsible for phenotypic variation through QTL mapping is highly unlikely in most
conifers because of their large genetic-to-physical distance ( 3000 kb/cM) (González-
Martínez et al. 2007). Therefore, association mapping which ensures wide coverage of
phenotypic and genotypic variation in a single experiment (González-Martínez et al.
2007), is an ideal choice to dissect and understand complex traits in conifers.
Association mapping utilizes the genetic diversity of natural populations to identify
genes responsible for quantitative variation of complex traits (Risch and Merikangas,
1996). A plant species which retains most of its natural genetic variability, with low
linkage disequilibrium and high nucleotide diversity is the ideal species for association
mapping (Brown et al. 2004; González-Martínez et al. 2006; Zhu et al. 2008). A partial
list of plant species in which association studies have been successfully used to dissect
44
complex traits is given in Gupta et al. (2005). The most important issue to be taken into
consideration while designing an association mapping study is the population structure.
The recent domestication and low level or lack of population structure in conifers, make
them ideal organisms for association studies (Al-Rabab'ah and Williams 2002).
Association mapping requires large numbers of SNPs in the study population and
conifers appear to have sufficient nucleotide diversity to perform association studies
(Neale and Savolainen 2004). Although genome-wide association studies (GWAS) are
most common, they are not suitable for most conifers because of their extremely large
genomes (>1.0×10¹⁰
bp). GWAS would require enormous SNP marker density.
Therefore, a candidate-gene based approach is more feasible and desirable in conifers.
Linkage disequilibrium declines rapidly within the length of an average-sized gene in
conifers (Neale and Savolainen 2004) and therefore, SNPs showing genetic association
are likely to be located in close proximity to the causative polymorphisms (González-
Martínez et al. 2007). Loblolly pine (Pinus taeda L.) possesses virtually all of these
genetic properties in large unstructured natural populations and can be easily propagated
to create large populations (González-Martínez et al. 2007). Due to its large genome
(21.7 billion bp) and rapid decay of linkage disequilibrium, a candidate-gene based
approach is more feasible and cost-effective than a genome-wide approach in loblolly
pine.
Jansen and Nap (2001) coined the term “Genetical genomics” which refers to the use
of transcript levels as quantitative endophenotypes in various statistical analyses to
localize and identify the underlying genetic factors. Gene expression can be measured
45
accurately and consistently making it a relatively easy quantitative phenotype to
measure. Gene expression level is affected by polymorphisms in both cis and trans
regulatory regions or exonic variants altering transcript stability or splicing. Zou et al.
(2010) successfully used gene expression levels as endophenotypes in GWAS of
Alzheimer disease in humans and identified three SNPs that associated significantly with
IDE (insulin degrading enzyme) expression levels. Kirst et al. (2004) used a linkage
mapping approach in Eucalyptus to associate quantitative differences in mRNA levels
with wood quality and growth QTLs. Atwell et al. (2010) performed a GWAS in
Arabidopsis inbred lines with 107 phenotypes which included expression of
FLOWERING LOCUS C and FRIGIDA genes. However, to the best of our knowledge,
this is the first instance where quantitative gene expression variation has been used as a
phenotype in association studies in a natural population.
Biochemical analyses and gene or protein expression profiling experiments have
been used to identify genes involved in wood development in forest trees (Whetten et al.
1998; Plomion et al. 2001; Peter and Neale 2004; Boerjan 2003). The functions of
several of these genes were confirmed with the help of forward or reverse genetic mutant
analyses in model species (Goujon et al. 2003) or by studying natural mutants (Gill et al.
2003). Genes that are hypothesized to be involved in wood development in loblolly pine
were used in our project for expression analyses (Palle et al. in press). Association
studies performed using this gene expression data resulted in significant associations
between wood development genes and SNPs in other genes. Even though very little is
known about the role of quantitative gene expression variation in phenotype
46
determination, the results from these association studies will contribute to the
understanding of the genetic architecture of complex traits.
MATERIALS AND METHODS
Association population
The association population was comprised of over 500 loblolly pine clones (unique
genotypes) that represent most of the natural range of loblolly pine and had no mating
design. This population was created at North Carolina State University from 600
independent seed lots obtained from the three southern pine breeding cooperatives
(Murthy and Goldfarb, 2001; Rowe et al. 2002; LeBude et al. 2004). Three rooted
cuttings from each of 475 clones were transplanted into pots all containing the same
potting mixture and were grown for 4 additional months (April-August 2006) in a
common greenhouse environment with evaporative cooling in College Station, TX.
Conditions were as uniform as possible although there could be small differences in light
or temperature in different parts of the greenhouse and there may be variability between
bags of potting mixture. The stems, needles and roots were collected from each plant,
frozen in liquid nitrogen and stored at -80°C.
Gene selection
Genes shown or hypothesized to be involved in xylem development were selected
for the expression studies based on reviews of the current literature and prior research in
47
our laboratory. The selected genes include those involved in cell wall formation, lignin
biosynthesis, transcription factors and genes of unknown function that are preferentially
expressed in loblolly pine xylem tissue.
RNA extraction, cDNA synthesis and relative gene expression analyses
The methods for RNA extraction, cDNA synthesis and gene expression analysis
have been presented in detail in Palle et al. (in press).
SNP genotyping
Genotyping of single nucleotide polymorphisms (SNPs) was performed using the
Illumina InfiniumTM
assay (Illumina, San Diego, CA) at the University of California-
Davis Genome Center (Eckert et al. 2009). Arrays were imaged on a Bead Array reader
(Illumina) and genotype calling was performed using BeadStudio v. 3.1.3.0 (Illumina).
Approximately 22,000 SNPs were discovered through the resequencing of 7,508 unique
expressed sequence tag (EST) contigs in 18 loblolly pine haploid megagametophytes.
Based on quality scores derived from the original sequence data, 7,216 of these SNPs
were chosen for genotyping (http://dendrome.ucdavis.edu/adept2/). Further information
regarding the discovery, annotation and PCR, genotyping and DNA sequencing
protocols is available in Eckert et al. (2009).
48
Population structure analysis
Patterns of population structure within this association population were assessed
using 23 nuclear single sequence repeat markers in conjunction with STRUCTURE
version 2.2 (Pritchard et al. 2000; Falush et al. 2003). The association analyses
performed in this study were done with a cluster number of five (K = 5). This value was
the minimal value of K at which the log-probability of the data leveled, and membership
coefficients illustrated geographical trends for most clusters (Eckert et al. 2010).
Membership coefficients for these clusters were also in agreement with previous
research, which identified significant structure (FST = 0.02-0.04) between samples
spanning the Mississippi River Valley (Schmidtling et al. 1999; Al-Rabab‟ah and
Williams 2002).
Association studies
General Linear Models (GLM) were fitted for each marker and trait. This approach
takes into account the underlying structure in the population. Kinship matrix was not
used as the plants in the population were unrelated first-generation trees. GLMs were run
using Tassel version 1.9.4 (release March 2006). Corrections for multiple testing were
performed using the positive false discovery rate (FDR) method (Storey 2002; Storey
and Tibshirani 2003). Q-value software was used to do corrections for multiple testing
(http://genomics.princeton.edu/storeylab/qvalue/).
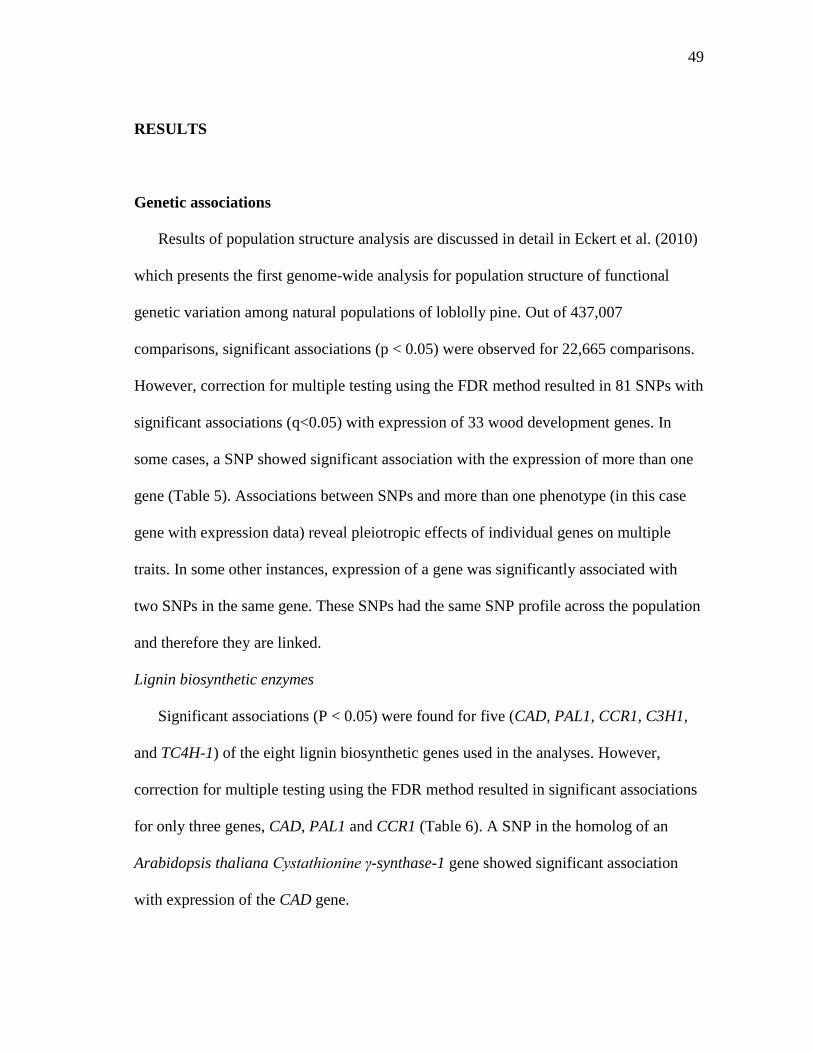
49
RESULTS
Genetic associations
Results of population structure analysis are discussed in detail in Eckert et al. (2010)
which presents the first genome-wide analysis for population structure of functional
genetic variation among natural populations of loblolly pine. Out of 437,007
comparisons, significant associations (p < 0.05) were observed for 22,665 comparisons.
However, correction for multiple testing using the FDR method resulted in 81 SNPs with
significant associations (q<0.05) with expression of 33 wood development genes. In
some cases, a SNP showed significant association with the expression of more than one
gene (Table 5). Associations between SNPs and more than one phenotype (in this case
gene with expression data) reveal pleiotropic effects of individual genes on multiple
traits. In some other instances, expression of a gene was significantly associated with
two SNPs in the same gene. These SNPs had the same SNP profile across the population
and therefore they are linked.
Lignin biosynthetic enzymes
Significant associations (P < 0.05) were found for five (CAD, PAL1, CCR1, C3H1,
and TC4H-1) of the eight lignin biosynthetic genes used in the analyses. However,
correction for multiple testing using the FDR method resulted in significant associations
for only three genes, CAD, PAL1 and CCR1 (Table 6). A SNP in the homolog of an
Arabidopsis thaliana Cystathionine γ-synthase-1 gene showed significant association
with expression of the CAD gene.
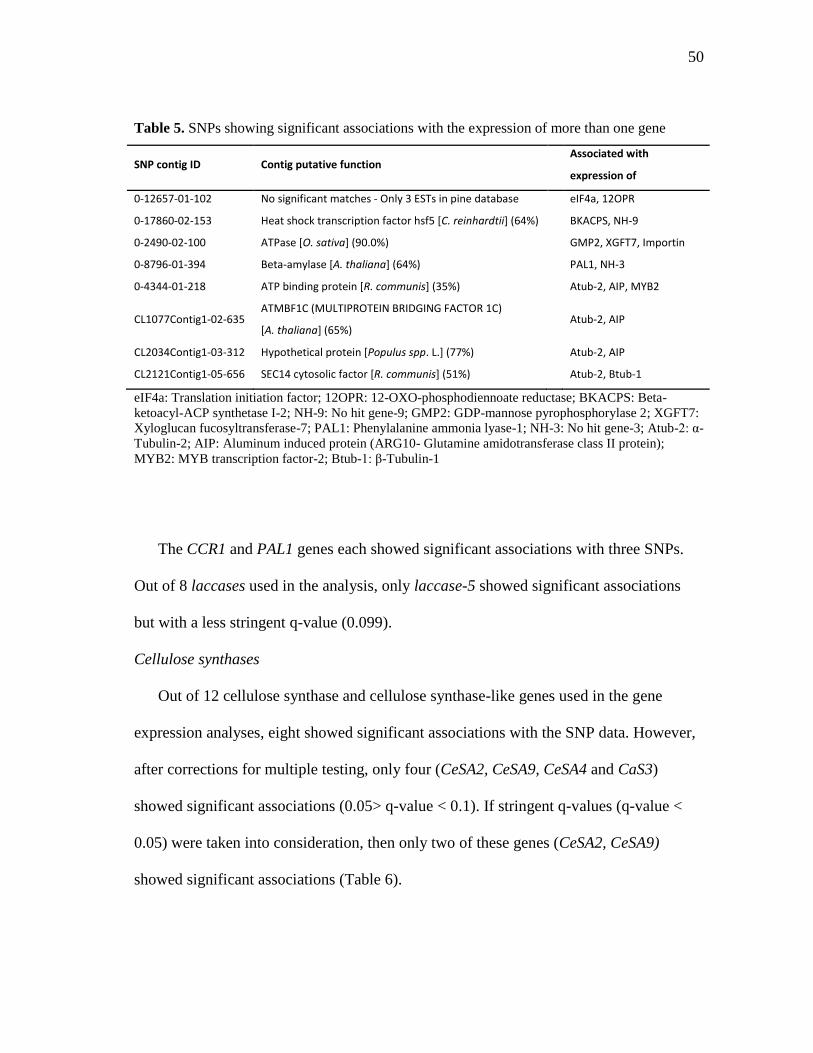
50
Table 5. SNPs showing significant associations with the expression of more than one gene
SNP contig ID Contig putative function Associated with
expression of
0-12657-01-102 No significant matches - Only 3 ESTs in pine database eIF4a, 12OPR
0-17860-02-153 Heat shock transcription factor hsf5 [C. reinhardtii] (64%) BKACPS, NH-9
0-2490-02-100 ATPase [O. sativa] (90.0%) GMP2, XGFT7, Importin
0-8796-01-394 Beta-amylase [A. thaliana] (64%) PAL1, NH-3
0-4344-01-218 ATP binding protein [R. communis] (35%) Atub-2, AIP, MYB2
CL1077Contig1-02-635 ATMBF1C (MULTIPROTEIN BRIDGING FACTOR 1C)
[A. thaliana] (65%) Atub-2, AIP
CL2034Contig1-03-312 Hypothetical protein [Populus spp. L.] (77%) Atub-2, AIP
CL2121Contig1-05-656 SEC14 cytosolic factor [R. communis] (51%) Atub-2, Btub-1
eIF4a: Translation initiation factor; 12OPR: 12-OXO-phosphodiennoate reductase; BKACPS: Beta-
ketoacyl-ACP synthetase I-2; NH-9: No hit gene-9; GMP2: GDP-mannose pyrophosphorylase 2; XGFT7:
Xyloglucan fucosyltransferase-7; PAL1: Phenylalanine ammonia lyase-1; NH-3: No hit gene-3; Atub-2: α-
Tubulin-2; AIP: Aluminum induced protein (ARG10- Glutamine amidotransferase class II protein);
MYB2: MYB transcription factor-2; Btub-1: β-Tubulin-1
The CCR1 and PAL1 genes each showed significant associations with three SNPs.
Out of 8 laccases used in the analysis, only laccase-5 showed significant associations
but with a less stringent q-value (0.099).
Cellulose synthases
Out of 12 cellulose synthase and cellulose synthase-like genes used in the gene
expression analyses, eight showed significant associations with the SNP data. However,
after corrections for multiple testing, only four (CeSA2, CeSA9, CeSA4 and CaS3)
showed significant associations (0.05> q-value < 0.1). If stringent q-values (q-value <
0.05) were taken into consideration, then only two of these genes (CeSA2, CeSA9)
showed significant associations (Table 6).
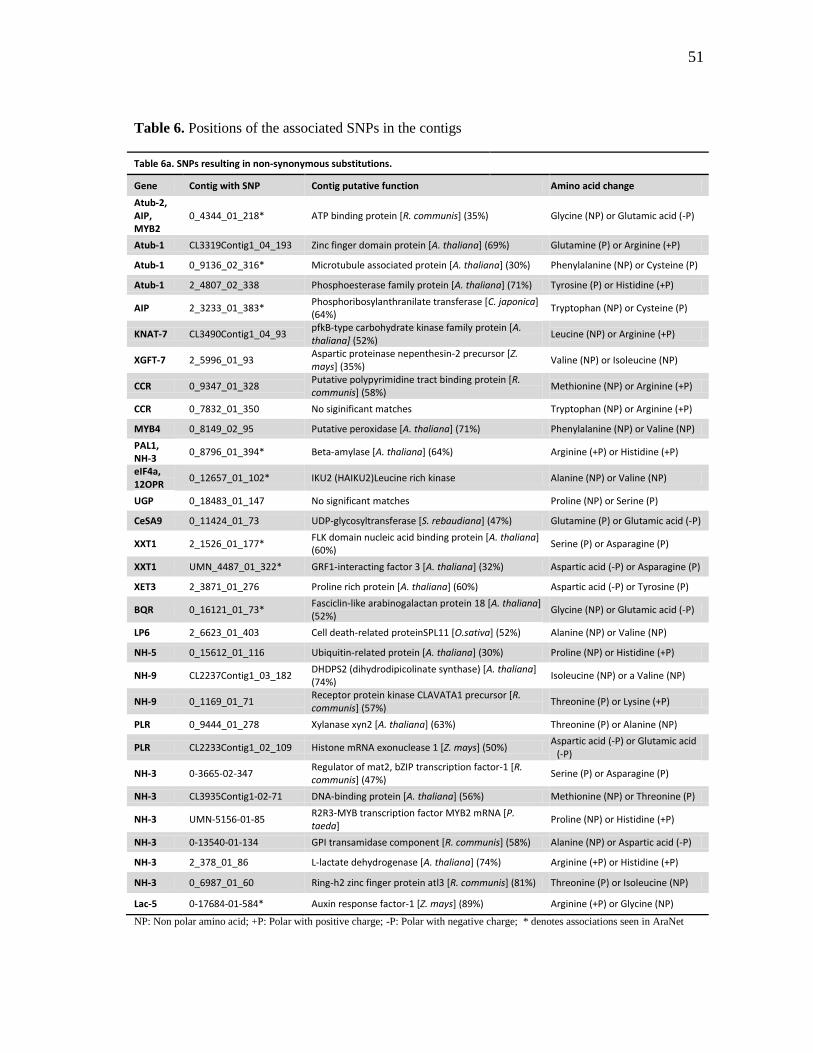
51
Table 6. Positions of the associated SNPs in the contigs
Table 6a. SNPs resulting in non-synonymous substitutions.
Gene Contig with SNP Contig putative function Amino acid change
Atub-2, AIP, MYB2
0_4344_01_218* ATP binding protein [R. communis] (35%) Glycine (NP) or Glutamic acid (-P)
Atub-1 CL3319Contig1_04_193 Zinc finger domain protein [A. thaliana] (69%) Glutamine (P) or Arginine (+P)
Atub-1 0_9136_02_316* Microtubule associated protein [A. thaliana] (30%) Phenylalanine (NP) or Cysteine (P)
Atub-1 2_4807_02_338 Phosphoesterase family protein [A. thaliana] (71%) Tyrosine (P) or Histidine (+P)
AIP 2_3233_01_383* Phosphoribosylanthranilate transferase [C. japonica] (64%)
Tryptophan (NP) or Cysteine (P)
KNAT-7 CL3490Contig1_04_93 pfkB-type carbohydrate kinase family protein [A. thaliana] (52%)
Leucine (NP) or Arginine (+P)
XGFT-7 2_5996_01_93 Aspartic proteinase nepenthesin-2 precursor [Z. mays] (35%)
Valine (NP) or Isoleucine (NP)
CCR 0_9347_01_328 Putative polypyrimidine tract binding protein [R. communis] (58%)
Methionine (NP) or Arginine (+P)
CCR 0_7832_01_350 No siginificant matches Tryptophan (NP) or Arginine (+P)
MYB4 0_8149_02_95 Putative peroxidase [A. thaliana] (71%) Phenylalanine (NP) or Valine (NP)
PAL1, NH-3
0_8796_01_394* Beta-amylase [A. thaliana] (64%) Arginine (+P) or Histidine (+P)
eIF4a, 12OPR
0_12657_01_102* IKU2 (HAIKU2)Leucine rich kinase Alanine (NP) or Valine (NP)
UGP 0_18483_01_147 No significant matches Proline (NP) or Serine (P)
CeSA9 0_11424_01_73 UDP-glycosyltransferase [S. rebaudiana] (47%) Glutamine (P) or Glutamic acid (-P)
XXT1 2_1526_01_177* FLK domain nucleic acid binding protein [A. thaliana] (60%)
Serine (P) or Asparagine (P)
XXT1 UMN_4487_01_322* GRF1-interacting factor 3 [A. thaliana] (32%) Aspartic acid (-P) or Asparagine (P)
XET3 2_3871_01_276 Proline rich protein [A. thaliana] (60%) Aspartic acid (-P) or Tyrosine (P)
BQR 0_16121_01_73* Fasciclin-like arabinogalactan protein 18 [A. thaliana] (52%)
Glycine (NP) or Glutamic acid (-P)
LP6 2_6623_01_403 Cell death-related proteinSPL11 [O.sativa] (52%) Alanine (NP) or Valine (NP)
NH-5 0_15612_01_116 Ubiquitin-related protein [A. thaliana] (30%) Proline (NP) or Histidine (+P)
NH-9 CL2237Contig1_03_182 DHDPS2 (dihydrodipicolinate synthase) [A. thaliana] (74%)
Isoleucine (NP) or a Valine (NP)
NH-9 0_1169_01_71 Receptor protein kinase CLAVATA1 precursor [R. communis] (57%)
Threonine (P) or Lysine (+P)
PLR 0_9444_01_278 Xylanase xyn2 [A. thaliana] (63%) Threonine (P) or Alanine (NP)
PLR CL2233Contig1_02_109 Histone mRNA exonuclease 1 [Z. mays] (50%) Aspartic acid (-P) or Glutamic acid
(-P)
NH-3 0-3665-02-347 Regulator of mat2, bZIP transcription factor-1 [R. communis] (47%)
Serine (P) or Asparagine (P)
NH-3 CL3935Contig1-02-71 DNA-binding protein [A. thaliana] (56%) Methionine (NP) or Threonine (P)
NH-3 UMN-5156-01-85 R2R3-MYB transcription factor MYB2 mRNA [P. taeda]
Proline (NP) or Histidine (+P)
NH-3 0-13540-01-134 GPI transamidase component [R. communis] (58%) Alanine (NP) or Aspartic acid (-P)
NH-3 2_378_01_86 L-lactate dehydrogenase [A. thaliana] (74%) Arginine (+P) or Histidine (+P)
NH-3 0_6987_01_60 Ring-h2 zinc finger protein atl3 [R. communis] (81%) Threonine (P) or Isoleucine (NP)
Lac-5 0-17684-01-584* Auxin response factor-1 [Z. mays] (89%) Arginine (+P) or Glycine (NP)
NP: Non polar amino acid; +P: Polar with positive charge; -P: Polar with negative charge; * denotes associations seen in AraNet
52
Table 6 Cont’d.
Table 6b. SNPs resulting in synonomous mutations
Gene Contig with SNP Contig putative function Amino acid containing SNP
Atub-1 CL2198Contig1-02-178* NP_177974.1 protein kinase family protein [A. thaliana] (51%) Valine
Atub-1 UMN-5895-01-127 Putative endo-1,4-beta-xylanase of Poplar (42%) Valine
Atub-1 2-6554-02-381 NP_567389.1 unknown protein [A. thaliana] (39%) Proline
AIP 0-13311-02-812 Hypothetical transcription factor [A. thaliana] (70%) Isoleucine
GMP1 CL2475Contig1-02-64 NP_001059127.1 Os07g0200000 [O.sativa] (69%) Glutamic acid
MYB4 2-7961-01-49 Protein kinase family protein [O. sativa] (57%) Leucine
PAL 0-11281-01-222 LEA protein-related [A. thaliana] (47%) Valine
MYB2 UMN-3489-01-150 No significant matches Serine
MADS 0-673-01-672* GRV2 (KATAMARI2); heat shock protein binding [A. thaliana] (81%) Alanine
CeSA2 CL1837Contig1-01-474 E3 ubiquitin protein ligase upl2 [R communis] (89%) Aspartic acid
BKACPS, NH-9
0-17860-02-153* Heat shock transcription factor hsf5 [C. reinhardtii] (64%) Threonine
PLR 0-14114-01-244 Cytochrome p450 and TT7 (TRANSPARENT TESTA 7); flavonoid 3'-monooxygenase [A. thaliana] (47%)
Tyrosine
PLR 2-4749-01-281 Heat stress transcription factor-24 [A. thaliana] (49%) Lysine
NH-3 2-3157-01-441 KH domain-containing protein [A. thaliana] (46%) Glutamine
NH-3 CL1802Contig1-01-107 Serine-rich protein-related [A. thaliana] (55%) Lysine
NH-3 0-9749-01-386 Leucine-rich repeat transmembrane protein kinase [A. thaliana] (52%)
Leucine
NH-3 2-6544-02-82 No significant matches Asparagine
12OPR 0-6023-02-51 No significant matches Tyrosine
* denotes associations seen in AraNet
Table 6c. Associations with SNPs in UTRs
Gene Contig with SNP Contig putative function UTR
Ade Kin UMN-6077-01-24 No significant match 5'
Ade Kin 0-8634-01-41* Histone H2A [A. thaliana] (82%) 3'
Btub-1 0-17091-02-72 U1 small nuclear ribonucleoprotein 70 kDa of A. thaliana (82.5%) 3'
PAL CL4678Contig1-02-114* Plasma membrane H+-ATPase of Poplar (85%) 3'
MYB2 0-10162-01-255 Pectate lyase family protein [A. thaliana] (77%) 3'
XET3 2-4937-02-141 AtFLA8 (Fasciclin-like arabinogalactan protein 8 precursor) (60%) 3'
LP6 UMN-CL21Contig1-03-384 Hydroxyproline-rich glycoprotein family protein [A. thaliana](50%) 3'
NH-6 CL3123Contig1-03-93 DNA binding protein [A. thaliana](51%) 3'
NH-6 CL3949Contig1-04-105 ROC3 (rotamase CyP 3) isomerase [A. thaliana] (89%) 3'
NH-9 2-6489-02-64 Predicted protein [P. patens] (30%) 3'
NH-3 0-3548-01-409 Phosphofructokinase family protein [A. thaliana] (76%) 3'
CaS-3 2-5707-02-79* MUR1 or GDP-D-mannose-4,6- dehydratase [A. thaliana] (83%) 3'
* denotes associations seen in AraNet
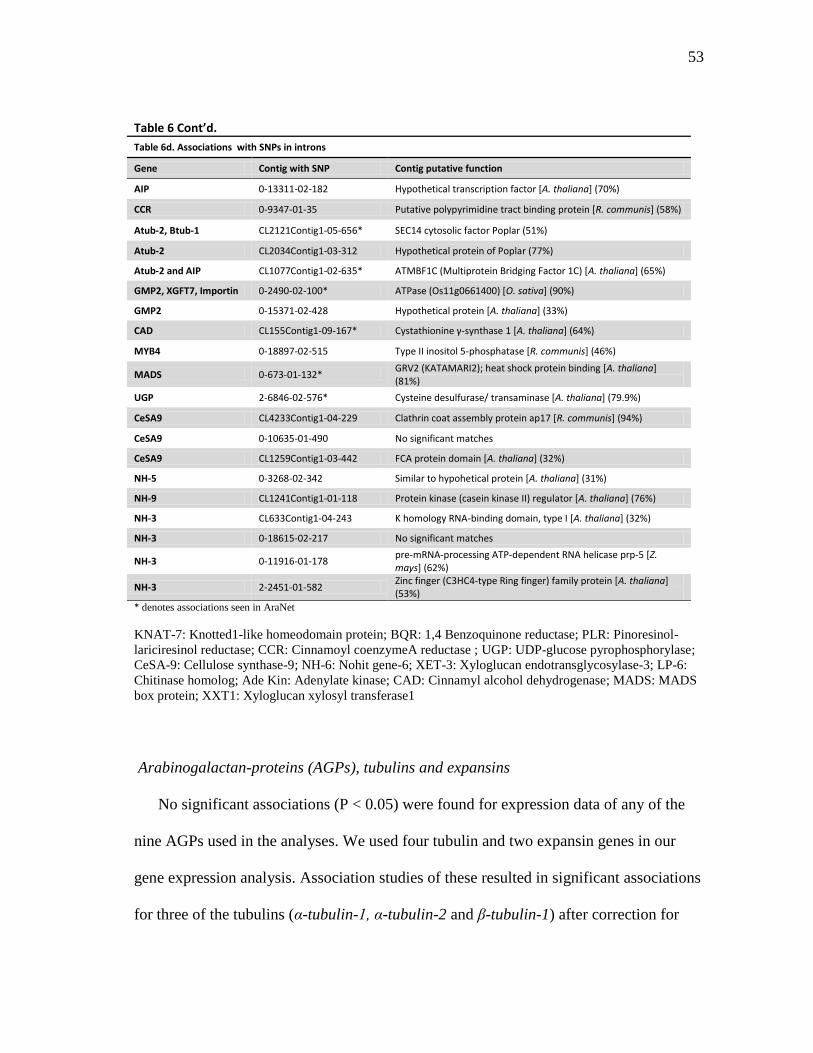
53
Table 6 Cont’d.
Table 6d. Associations with SNPs in introns
Gene Contig with SNP Contig putative function
AIP 0-13311-02-182 Hypothetical transcription factor [A. thaliana] (70%)
CCR 0-9347-01-35 Putative polypyrimidine tract binding protein [R. communis] (58%)
Atub-2, Btub-1 CL2121Contig1-05-656* SEC14 cytosolic factor Poplar (51%)
Atub-2 CL2034Contig1-03-312 Hypothetical protein of Poplar (77%)
Atub-2 and AIP CL1077Contig1-02-635* ATMBF1C (Multiprotein Bridging Factor 1C) [A. thaliana] (65%)
GMP2, XGFT7, Importin 0-2490-02-100* ATPase (Os11g0661400) [O. sativa] (90%)
GMP2 0-15371-02-428 Hypothetical protein [A. thaliana] (33%)
CAD CL155Contig1-09-167* Cystathionine γ-synthase 1 [A. thaliana] (64%)
MYB4 0-18897-02-515 Type II inositol 5-phosphatase [R. communis] (46%)
MADS 0-673-01-132* GRV2 (KATAMARI2); heat shock protein binding [A. thaliana] (81%)
UGP 2-6846-02-576* Cysteine desulfurase/ transaminase [A. thaliana] (79.9%)
CeSA9 CL4233Contig1-04-229 Clathrin coat assembly protein ap17 [R. communis] (94%)
CeSA9 0-10635-01-490 No significant matches
CeSA9 CL1259Contig1-03-442 FCA protein domain [A. thaliana] (32%)
NH-5 0-3268-02-342 Similar to hypohetical protein [A. thaliana] (31%)
NH-9 CL1241Contig1-01-118 Protein kinase (casein kinase II) regulator [A. thaliana] (76%)
NH-3 CL633Contig1-04-243 K homology RNA-binding domain, type I [A. thaliana] (32%)
NH-3 0-18615-02-217 No significant matches
NH-3 0-11916-01-178 pre-mRNA-processing ATP-dependent RNA helicase prp-5 [Z. mays] (62%)
NH-3 2-2451-01-582 Zinc finger (C3HC4-type Ring finger) family protein [A. thaliana] (53%)
* denotes associations seen in AraNet
KNAT-7: Knotted1-like homeodomain protein; BQR: 1,4 Benzoquinone reductase; PLR: Pinoresinol-
lariciresinol reductase; CCR: Cinnamoyl coenzymeA reductase ; UGP: UDP-glucose pyrophosphorylase;
CeSA-9: Cellulose synthase-9; NH-6: Nohit gene-6; XET-3: Xyloglucan endotransglycosylase-3; LP-6:
Chitinase homolog; Ade Kin: Adenylate kinase; CAD: Cinnamyl alcohol dehydrogenase; MADS: MADS
box protein; XXT1: Xyloglucan xylosyl transferase1
Arabinogalactan-proteins (AGPs), tubulins and expansins
No significant associations (P < 0.05) were found for expression data of any of the
nine AGPs used in the analyses. We used four tubulin and two expansin genes in our
gene expression analysis. Association studies of these resulted in significant associations
for three of the tubulins (α-tubulin-1, α-tubulin-2 and β-tubulin-1) after correction for
54
multiple testing. Expression of α-tubulin-1 showed association with 6 SNPs, α-tubulin-2
with 4 SNPs and β-tubulin-1 with 2 SNPs (Table 6).
Transcription factors
Out of 21 transcription factors known or hypothesized to be involved in xylem
development, 10 of them showed significant associations with SNPs in other genes.
However, after corrections for multiple testing, only 6 of them (KNAT7, MYB4, MADS
box protein, eIF4a, MYB2, Aluminum induced transcription factor) had significant
associations (Table 6).
Other enzymes involved in xylem development
Thirty-seven genes encoding enzymes hypothesized to be involved in xylem
development, besides those involved in lignin biosynthesis, were also included in the
analysis. Thirteen of these genes showed significant associations with SNPs after
corrections for multiple testing (Table 6).
No hit genes
Seven No hit genes (Genes with no homologous sequences in other plant databases)
known to be preferentially expressed in xylem tissue were added to the expression
analysis and association studies. Out of these 7 genes, 5 of them showed significant
associations with SNPs after corrections for multiple testing (Table 6). An interesting
result was obtained for the No hit-4 gene (NH-4). The expression of this gene showed
significant associations with 12 SNPs in ten different genes with nearly identical q-
values. Of these 12 SNPs, ten of them had the same SNP profile across all the clones
while two had minor differences. The SNPs are from EST contigs that map to the same
55
place on linkage group 8. This result appears to be due to the tight linkage of these genes
and only one of these genes might have a functional association with the expression of
the NH-4 gene. One more instance of linkage resulting in significant associations was
seen with UDP-glucose pyrophosphorylase (UGP). Expression of the UGP gene has
significant associations with SNPs in two genes. These two SNPs have the same SNP
profile and their EST contigs map to the same region on linkage map 2 of the loblolly
pine genome. Only one of these two associations is likely to be a functional association
while the other appears to be a significant association because of its linkage with the
functionally associated gene.
Of the 81 SNPs with highly significant q-values, 31 of the SNPs showing significant
associations caused an amino acid change in the resulting protein (Table 6a). Eighteen
SNPs resulted in synonymous mutations (no amino acid change) (Table 6b), 11 SNPs
were in 3´ untranslated regions (UTRs), 1 SNP was in a 5´ UTR (Table 6c) and 20 SNPs
were in introns (Table 6d).
Comparisons to an Arabidopsis network
We determined the Arabidopsis homologs of both the genes with expression
analyzed and those containing SNPs with associations and used AraNet, a probabilistic
functional gene network of Arabidopsis thaliana, to determine if they were associated in
a gene network. AraNet provides a resource for plant gene function identification and
genetic dissection of plant traits (Lee et al. 2010) (http://www.functionalnet.org/aranet/).
Out of the 81 highly significant associations found in our study, 21 of the gene pairs are
also shown to be associated in gene networks in Arabidopsis (Table 6). Some of the
56
contigs containing SNPs and some of the genes used in expression analysis (total of 28
significant associations) did not have significant matches in Arabidopsis gene or EST
database and hence could not be found in the networks. Some plant-specific processes
are poorly represented in AraNet. Arabidopsis being an herbaceous flowering plant and
loblolly pine a gymnosperm, it is understandable that we might not find all the
associations we identified in loblolly pine in Arabidopsis. However, finding many of our
associations in Arabidopsis provides some validity to our association study results.
Effects of associated SNPs on gene expression
In order to study the direct or indirect effect of the SNP on the expression of the
gene with which it showed a significant association, the average gene expression values
for the clones with two homozygous alleles or the heterozygous allele at the SNP
position were calculated for all the associations (Table 7; Fig. 6). In most cases the
average expression of the plants with the rare homozygous allele was low and the
heterozygote had an average expression close to the abundant homozygous allele.
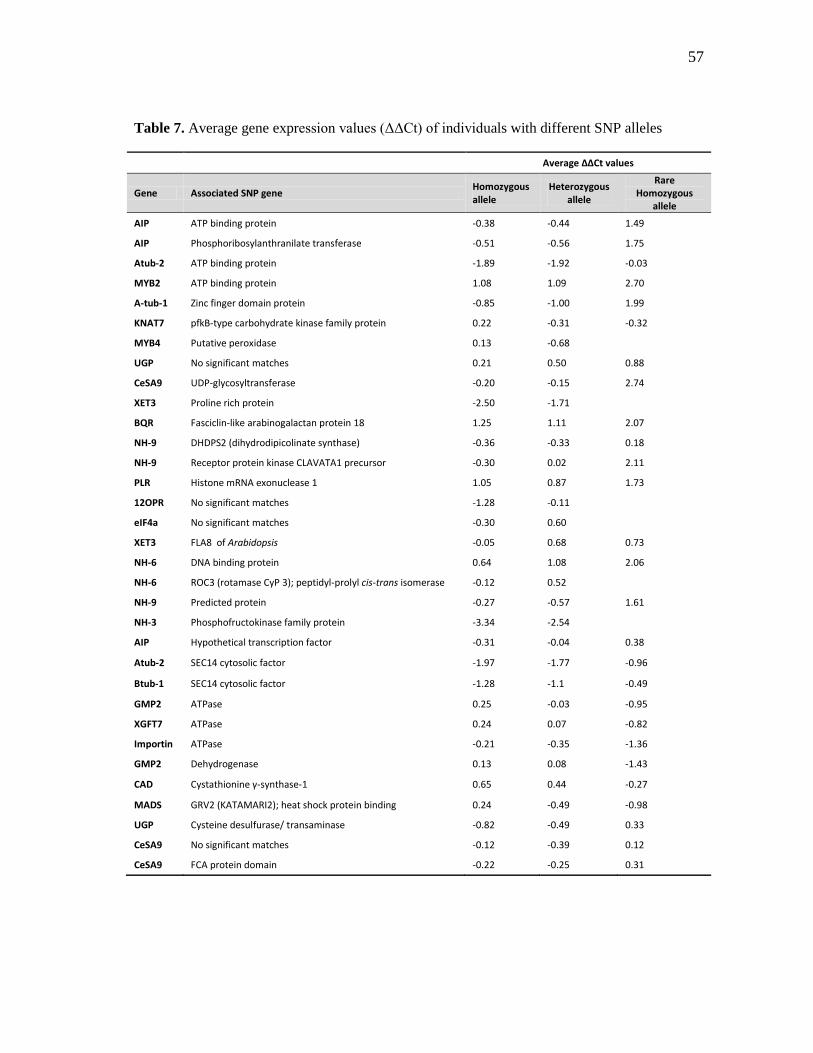
57
Table 7. Average gene expression values (ΔΔCt) of individuals with different SNP alleles Average ΔΔCt values
Gene Associated SNP gene Homozygous allele
Heterozygous allele
Rare Homozygous
allele
AIP ATP binding protein -0.38 -0.44 1.49
AIP Phosphoribosylanthranilate transferase -0.51 -0.56 1.75
Atub-2 ATP binding protein -1.89 -1.92 -0.03
MYB2 ATP binding protein 1.08 1.09 2.70
A-tub-1 Zinc finger domain protein -0.85 -1.00 1.99
KNAT7 pfkB-type carbohydrate kinase family protein 0.22 -0.31 -0.32
MYB4 Putative peroxidase 0.13 -0.68
UGP No significant matches 0.21 0.50 0.88
CeSA9 UDP-glycosyltransferase -0.20 -0.15 2.74
XET3 Proline rich protein -2.50 -1.71
BQR Fasciclin-like arabinogalactan protein 18 1.25 1.11 2.07
NH-9 DHDPS2 (dihydrodipicolinate synthase) -0.36 -0.33 0.18
NH-9 Receptor protein kinase CLAVATA1 precursor -0.30 0.02 2.11
PLR Histone mRNA exonuclease 1 1.05 0.87 1.73
12OPR No significant matches -1.28 -0.11
eIF4a No significant matches -0.30 0.60
XET3 FLA8 of Arabidopsis -0.05 0.68 0.73
NH-6 DNA binding protein 0.64 1.08 2.06
NH-6 ROC3 (rotamase CyP 3); peptidyl-prolyl cis-trans isomerase -0.12 0.52
NH-9 Predicted protein -0.27 -0.57 1.61
NH-3 Phosphofructokinase family protein -3.34 -2.54
AIP Hypothetical transcription factor -0.31 -0.04 0.38
Atub-2 SEC14 cytosolic factor -1.97 -1.77 -0.96
Btub-1 SEC14 cytosolic factor -1.28 -1.1 -0.49
GMP2 ATPase 0.25 -0.03 -0.95
XGFT7 ATPase 0.24 0.07 -0.82
Importin ATPase -0.21 -0.35 -1.36
GMP2 Dehydrogenase 0.13 0.08 -1.43
CAD Cystathionine γ-synthase-1 0.65 0.44 -0.27
MADS GRV2 (KATAMARI2); heat shock protein binding 0.24 -0.49 -0.98
UGP Cysteine desulfurase/ transaminase -0.82 -0.49 0.33
CeSA9 No significant matches -0.12 -0.39 0.12
CeSA9 FCA protein domain -0.22 -0.25 0.31
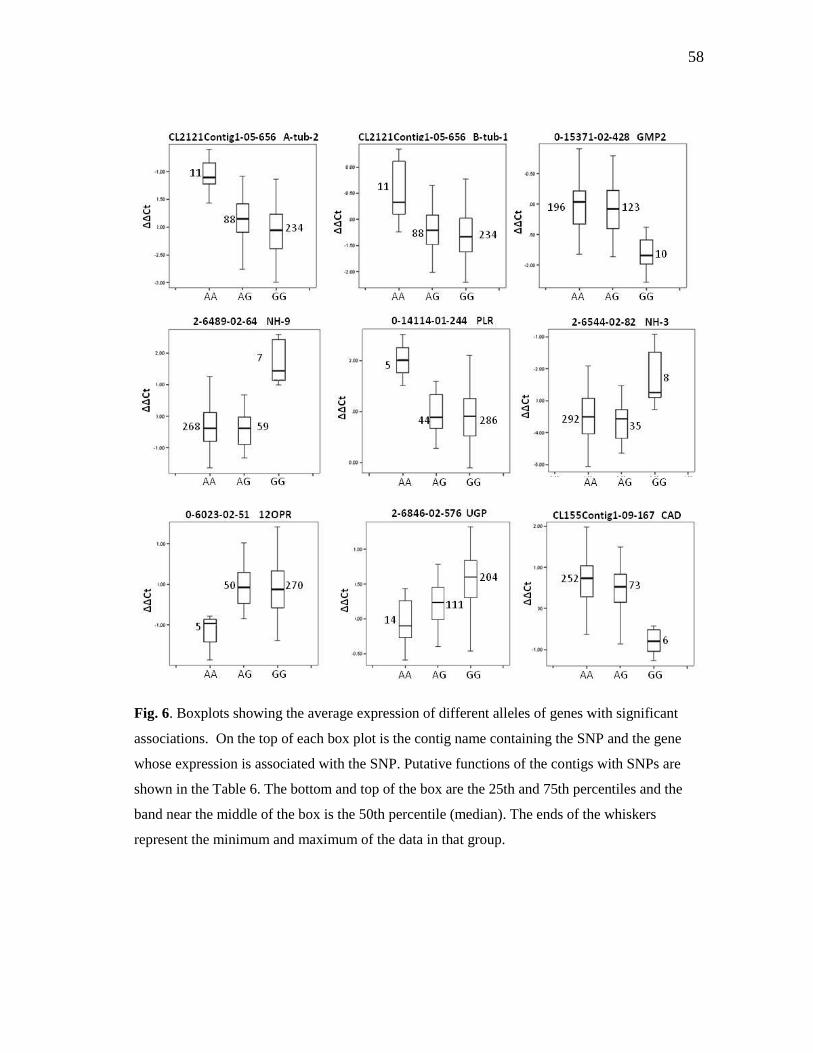
58
Fig. 6. Boxplots showing the average expression of different alleles of genes with significant
associations. On the top of each box plot is the contig name containing the SNP and the gene
whose expression is associated with the SNP. Putative functions of the contigs with SNPs are
shown in the Table 6. The bottom and top of the box are the 25th and 75th percentiles and the
band near the middle of the box is the 50th percentile (median). The ends of the whiskers
represent the minimum and maximum of the data in that group.
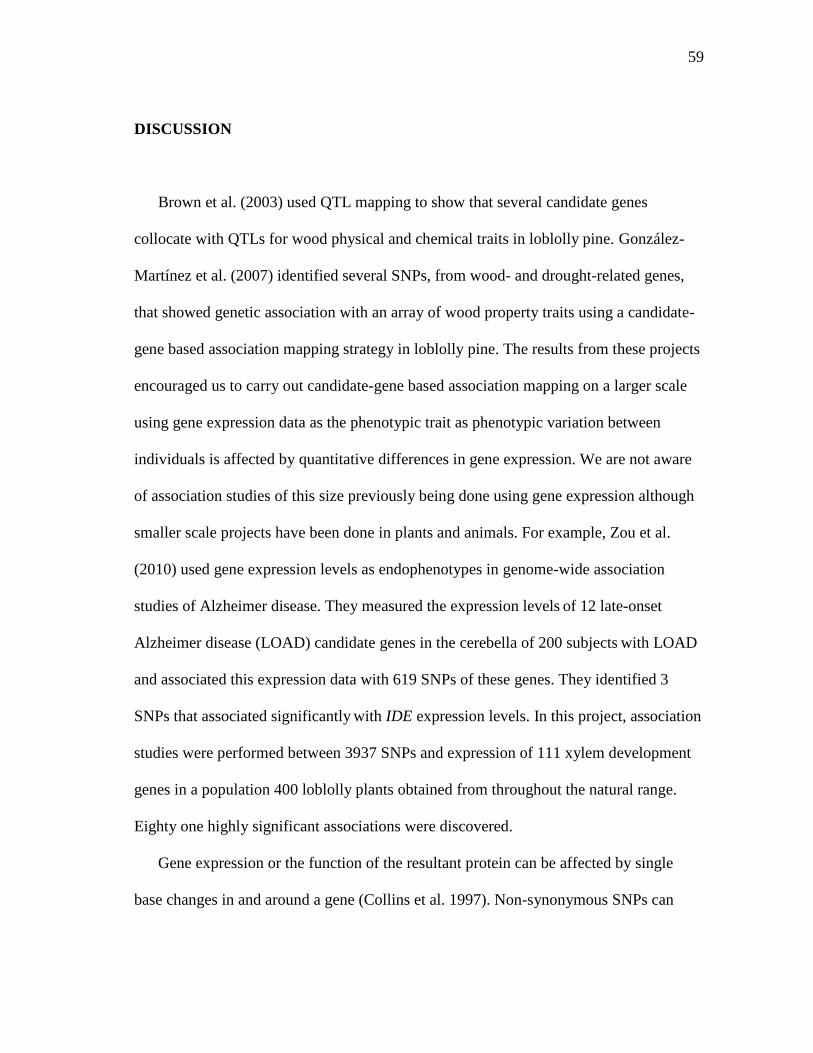
59
DISCUSSION
Brown et al. (2003) used QTL mapping to show that several candidate genes
collocate with QTLs for wood physical and chemical traits in loblolly pine. González-
Martínez et al. (2007) identified several SNPs, from wood- and drought-related genes,
that showed genetic association with an array of wood property traits using a candidate-
gene based association mapping strategy in loblolly pine. The results from these projects
encouraged us to carry out candidate-gene based association mapping on a larger scale
using gene expression data as the phenotypic trait as phenotypic variation between
individuals is affected by quantitative differences in gene expression. We are not aware
of association studies of this size previously being done using gene expression although
smaller scale projects have been done in plants and animals. For example, Zou et al.
(2010) used gene expression levels as endophenotypes in genome-wide association
studies of Alzheimer disease. They measured the expression levels of 12 late-onset
Alzheimer disease (LOAD) candidate genes in the cerebella of 200 subjects with LOAD
and associated this expression data with 619 SNPs of these genes. They identified 3
SNPs that associated significantly with IDE expression levels. In this project, association
studies were performed between 3937 SNPs and expression of 111 xylem development
genes in a population 400 loblolly plants obtained from throughout the natural range.
Eighty one highly significant associations were discovered.
Gene expression or the function of the resultant protein can be affected by single
base changes in and around a gene (Collins et al. 1997). Non-synonymous SNPs can
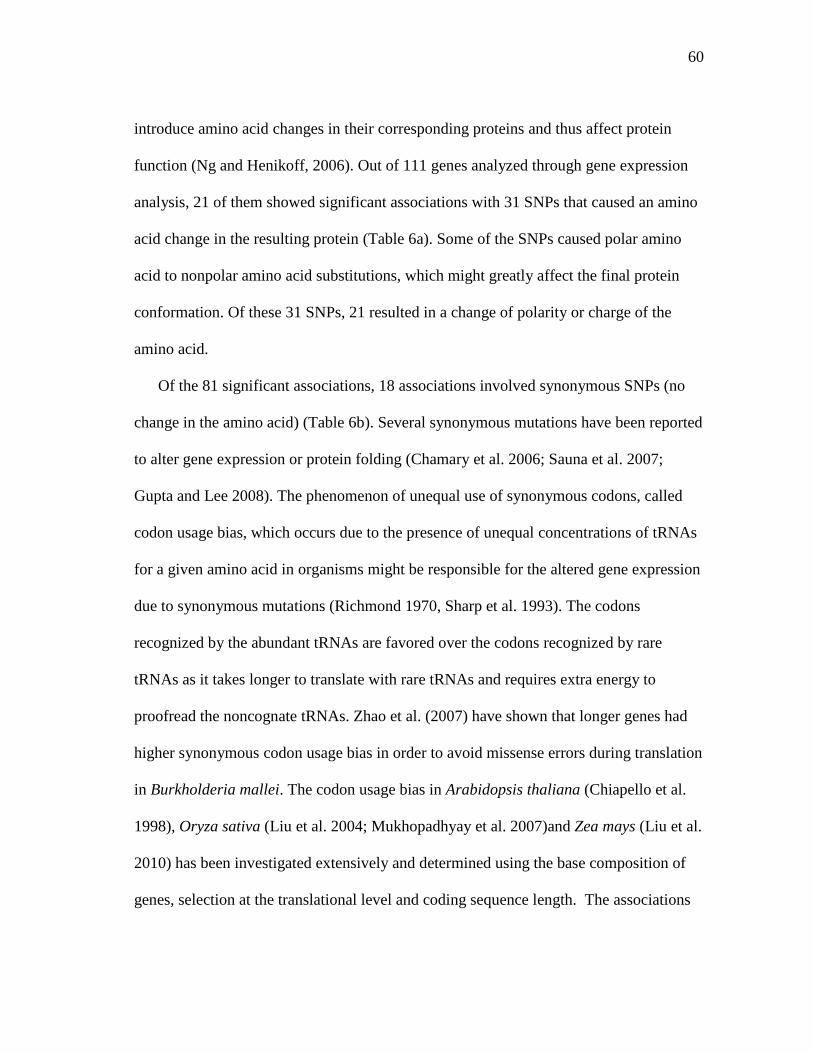
60
introduce amino acid changes in their corresponding proteins and thus affect protein
function (Ng and Henikoff, 2006). Out of 111 genes analyzed through gene expression
analysis, 21 of them showed significant associations with 31 SNPs that caused an amino
acid change in the resulting protein (Table 6a). Some of the SNPs caused polar amino
acid to nonpolar amino acid substitutions, which might greatly affect the final protein
conformation. Of these 31 SNPs, 21 resulted in a change of polarity or charge of the
amino acid.
Of the 81 significant associations, 18 associations involved synonymous SNPs (no
change in the amino acid) (Table 6b). Several synonymous mutations have been reported
to alter gene expression or protein folding (Chamary et al. 2006; Sauna et al. 2007;
Gupta and Lee 2008). The phenomenon of unequal use of synonymous codons, called
codon usage bias, which occurs due to the presence of unequal concentrations of tRNAs
for a given amino acid in organisms might be responsible for the altered gene expression
due to synonymous mutations (Richmond 1970, Sharp et al. 1993). The codons
recognized by the abundant tRNAs are favored over the codons recognized by rare
tRNAs as it takes longer to translate with rare tRNAs and requires extra energy to
proofread the noncognate tRNAs. Zhao et al. (2007) have shown that longer genes had
higher synonymous codon usage bias in order to avoid missense errors during translation
in Burkholderia mallei. The codon usage bias in Arabidopsis thaliana (Chiapello et al.
1998), Oryza sativa (Liu et al. 2004; Mukhopadhyay et al. 2007)and Zea mays (Liu et al.
2010) has been investigated extensively and determined using the base composition of
genes, selection at the translational level and coding sequence length. The associations
61
that we discovered between expression data of wood development genes and
synonymous SNPs in other genes might be due to codon usage bias. Alternatively, these
SNPs might not be functional associations but are tightly linked to SNPs in genes that
were not included in this project but are the real cause of the expression differences.
Therefore SNPs present in genes close to these associated SNPs should be detected and
analyzed for the presence of linkage or a stronger association with gene expression.
Some of the SNPs in the significant associations observed in these studies are located in
non-coding regions including UTRs (Table 6c) or introns (Table 6d), raising the
possibility that these regions are involved in the expression of that particular gene
through some unidentified regulatory mechanisms and are thus affecting the expression
of our gene. SNPs in UTRs influence gene expression by affecting mRNA stability,
transcription efficiency, translation efficiency and mRNA localization (Serre et al. 2008;
Wang and Cooper, 2007). Kamiyama et al. (2007) have shown that a SNP present in the
3′ UTR of a gene encoding neurocalcin δ (NCALD) was responsible for the mRNA
stability in diabetic patients. SNPs in the 3' UTR of the DAT gene (Miller and Madras,
2002) and of alpha-synuclein gene (Sotiriou et al. 2009) are responsible for the
variability in the protein levels and expression levels respectively.
Intronic SNPs can affect gene expression by altering the transcription factor binding
sites or splice enhancers present in some introns or by changing splicing patterns, which
leads to a truncated or mutant protein (ElSharawy et al. 2006). Mutations in introns have
been shown to affect regulation and thus expression of some genes including a tubulin
(Fiume et al. 2004) and a polyubiquitin gene, rubi3 (Samadder et al. 2008) in rice as well
62
theVRN-1 gene (Vernalization response-1) in barley and wheat (Fu et al. 2005). Tsukada
et al. (2006) found that polymorphisms in the first intron of TFAP2B regulate
transcriptional activity and affect adipocytokine gene expression in differentiated
adipocytes in humans. Horikawa et al. (2000) have reported that expression of the
susceptibility gene of type 2 diabetes, CAPN10, was under the influence of the three
intron SNPs. The splicing sites of DNA sequences can be predicted by using the
GeneSplicer computational tool (Pertea et al., 2001) (http://www.cbcb.umd.edu/
software/ GeneSplicer/gene_spl.shtml). Out of the 19 intronic SNPs that showed
associations with the expression of wood development genes, two of them were
recognized as potential splice sites by the GeneSplicer program. One of those intronic
SNPs is in the homolog of Poplar SEC14 cytosolic factor that has shown significant
associations with expression of two tubulins while the other SNP is in a homolog of an
Arabidopsis hypothetical protein (AT1G01500) that is associated with the expression of
GMP2. These two SNPs may be changing the splice patterns thus resulting in a truncated
or mutated protein while the spliced out piece of mRNA may be degraded thus resulting
in low gene expression values.
We have attempted to develop models to explain how a SNP in one gene could affect
expression of another gene. A non-synonymous SNP in a transcription factor could
directly affect the expression of genes regulated by that transcript factor. For example,
the expression of the NH-3 gene has significant associations with non-synonymous
SNPs in four different transcription factors. Two of these SNPs are present in the DNA
binding domains of these transcription factors (PtMYB2 and homolog of an Arabidopsis
63
bZIP transcription factor). Therefore, we can hypothesize that these SNPs are resulting
in mutated transcription factors that are unable to bind tightly to the binding elements in
the NH-3 promoter, thus leading to low expression of NH-3. However, there may be
situations where the explanation is not as obvious. The expression of an aluminum-
induced protein (AIP), which is a transcription factor belonging to the ARG10-
Glutamine amidotransferase class II protein family and is preferably expressed in xylem
tissue, showed significant association with a SNP in a tryptophan biosynthetic pathway
gene, phosphoribosylanthranilate transferase (PRT). The SNP resulted in an amino acid
change from cysteine a polar amino acid, to tryptophan, which is nonpolar. Limson et al.
(1998) showed that melatonin precursors like tryptophan may form complexes with
aluminum. It is possible that aluminum induces the expression of AIP after forming a
complex with tryptophan. We hypothesize that by changing a cysteine residue to
tryptophan in PRT, tryptophan synthesis is negatively affected thus affecting the
formation of the tryptophan-aluminum complex and eventually resulting in the reduced
expression of AIP (Fig. 7). Therefore the plants homozygous or heterozygous for
cysteine have ~4.5 fold higher expression than those homozygous for tryptophan. In
AraNet, the Arabidopsis homologs of these two genes were shown to be connected in a
network through other genes.
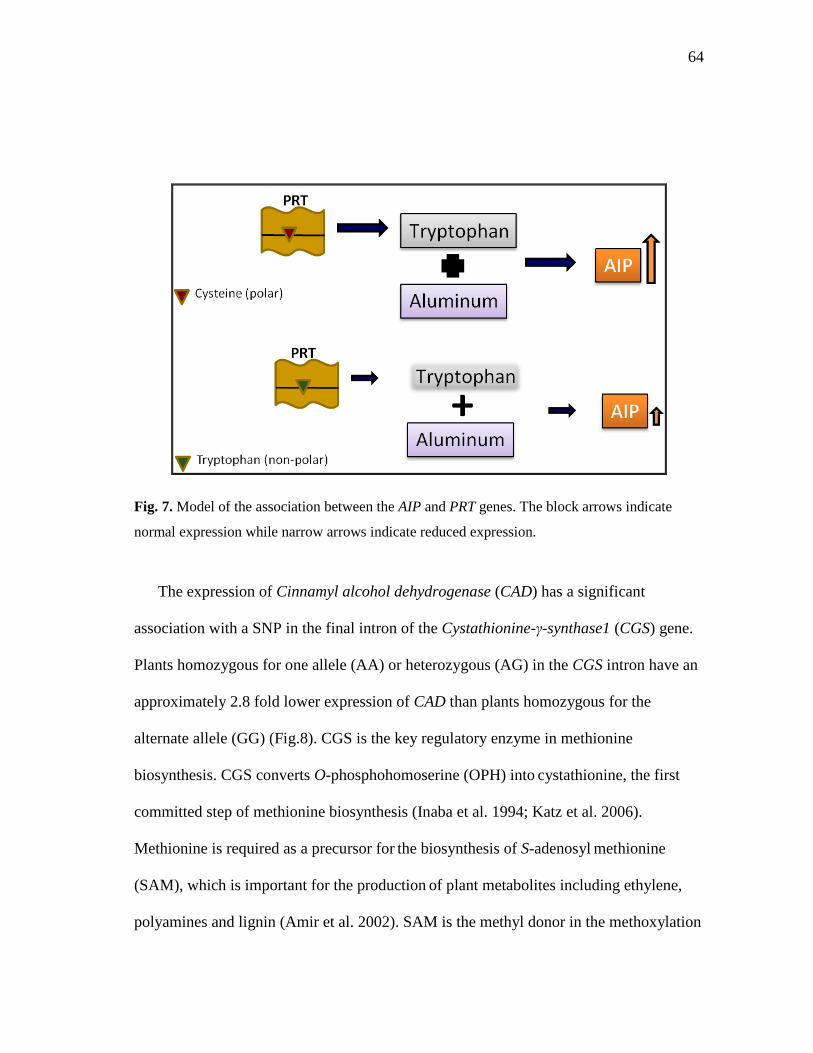
64
Fig. 7. Model of the association between the AIP and PRT genes. The block arrows indicate
normal expression while narrow arrows indicate reduced expression.
The expression of Cinnamyl alcohol dehydrogenase (CAD) has a significant
association with a SNP in the final intron of the Cystathionine-γ-synthase1 (CGS) gene.
Plants homozygous for one allele (AA) or heterozygous (AG) in the CGS intron have an
approximately 2.8 fold lower expression of CAD than plants homozygous for the
alternate allele (GG) (Fig.8). CGS is the key regulatory enzyme in methionine
biosynthesis. CGS converts O-phosphohomoserine (OPH) into cystathionine, the first
committed step of methionine biosynthesis (Inaba et al. 1994; Katz et al. 2006).
Methionine is required as a precursor for the biosynthesis of S-adenosyl
methionine
(SAM), which is important for the production of plant metabolites including ethylene,
polyamines and lignin (Amir et al. 2002). SAM is the methyl donor in the methoxylation
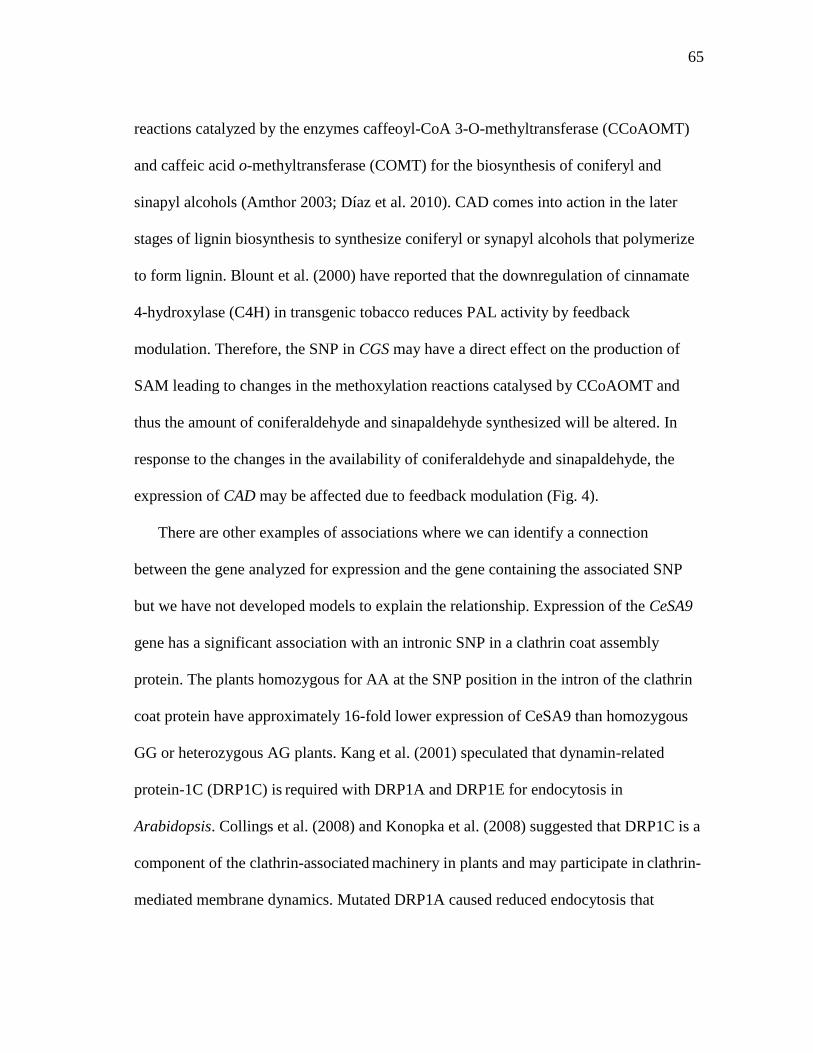
65
reactions catalyzed by the enzymes caffeoyl-CoA 3-O-methyltransferase (CCoAOMT)
and caffeic acid o-methyltransferase (COMT) for the biosynthesis of coniferyl and
sinapyl alcohols (Amthor 2003; Díaz et al. 2010). CAD comes into action in the later
stages of lignin biosynthesis to synthesize coniferyl or synapyl alcohols that polymerize
to form lignin. Blount et al. (2000) have reported that the downregulation of cinnamate
4-hydroxylase (C4H) in transgenic tobacco reduces PAL activity by feedback
modulation. Therefore, the SNP in CGS may have a direct effect on the production of
SAM leading to changes in the methoxylation reactions catalysed by CCoAOMT and
thus the amount of coniferaldehyde and sinapaldehyde synthesized will be altered. In
response to the changes in the availability of coniferaldehyde and sinapaldehyde, the
expression of CAD may be affected due to feedback modulation (Fig. 4).
There are other examples of associations where we can identify a connection
between the gene analyzed for expression and the gene containing the associated SNP
but we have not developed models to explain the relationship. Expression of the CeSA9
gene has a significant association with an intronic SNP in a clathrin coat assembly
protein. The plants homozygous for AA at the SNP position in the intron of the clathrin
coat protein have approximately 16-fold lower expression of CeSA9 than homozygous
GG or heterozygous AG plants. Kang et al. (2001) speculated that dynamin-related
protein-1C (DRP1C) is required with DRP1A and DRP1E for endocytosis in
Arabidopsis. Collings et al. (2008) and Konopka et al. (2008) suggested that DRP1C is a
component of the clathrin-associated machinery in plants and may participate in
clathrin-
mediated membrane dynamics. Mutated DRP1A caused reduced endocytosis that
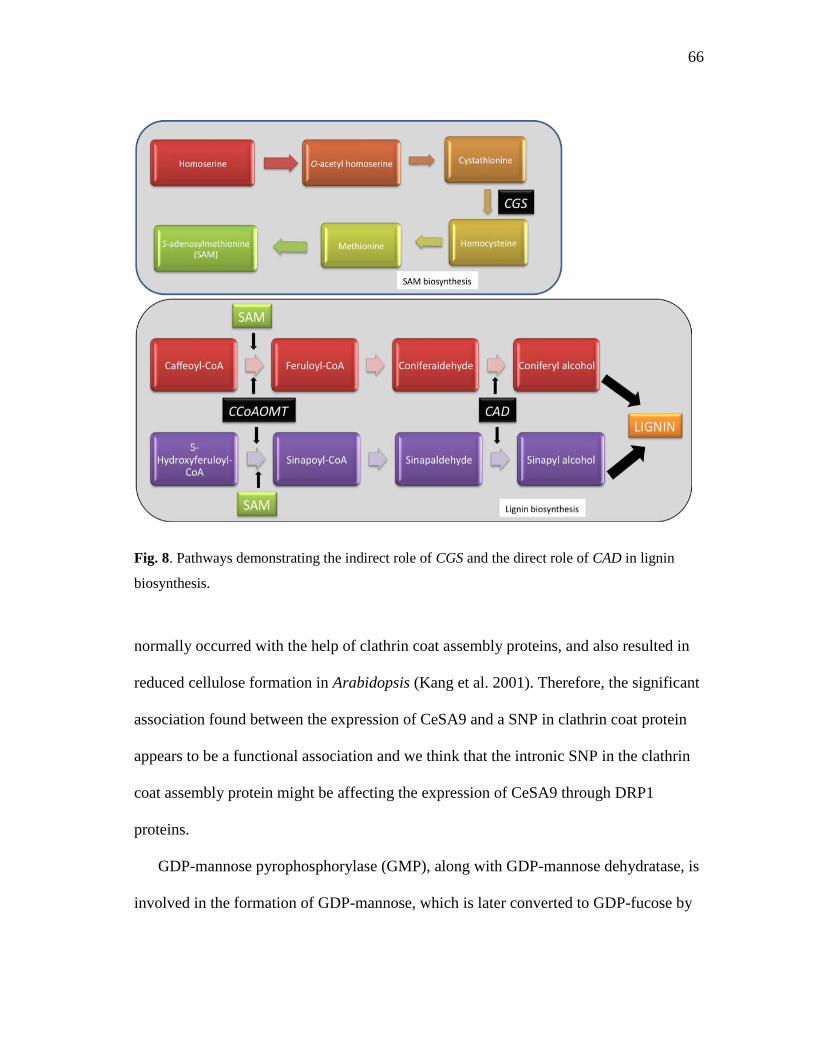
66
Fig. 8. Pathways demonstrating the indirect role of CGS and the direct role of CAD in lignin
biosynthesis.
normally occurred with the help of clathrin coat assembly proteins, and also resulted in
reduced cellulose formation in Arabidopsis (Kang et al. 2001). Therefore, the significant
association found between the expression of CeSA9 and a SNP in clathrin coat protein
appears to be a functional association and we think that the intronic SNP in the clathrin
coat assembly protein might be affecting the expression of CeSA9 through DRP1
proteins.
GDP-mannose pyrophosphorylase (GMP), along with GDP-mannose dehydratase, is
involved in the formation of GDP-mannose, which is later converted to GDP-fucose by
67
the action of three other enzymes (Somerville, 2006). The GDP-fucose supplies the
fucosyl residue that is added to terminal galactose residues on XG side chains by a
fucosyltransferase, XGFT (Perrin et al. 1999). Expression of GMP2 and XGFT7, along
with Importin, which functions as a nuclear transport receptor, have shown significant
associations with a SNP in an intron of an ATPase gene. These three enzymes need the
presence of ATP and enzyme ATPase to catalyze their reactions. ATPases catalyze the
decomposition of adenosine triphosphate (ATP) into adenosine diphosphate (ADP) and a
free phosphate ion. The intronic SNP in ATPase might result in the production of a
truncated or mutated protein and limit the availability of functional ATPase, thus
affecting the expression of GMP2 and XGFT7 through feedback regulation.
Benzoquinone reductase (BQR) helps in catalyzing the breakdown of monomeric
intermediates in the cell wall and helps in cell elongation. BQR mRNA was found in
older cotton fiber suggesting that this protein has a function in both cell elongation and
secondary cell wall formation (Turley and Taliercio, 2008). Xyloglucan
endotransglycosylases are the enzymes that cut and rejoin the xyloglucan chains and
play an important role during the formation of secondary cell walls in vascular tissues.
The expression of BQR and XET3 is significantly associated with SNPs in fasciclin-like
arabinogalactan proteins (FLAs). These FLAs are a subclass of arabinogalactan proteins
(AGPs) that play a role in secondary wall formation (Johnson et al. 2003). FLA proteins
are preferentially expressed in differentiating xylem and are thought to be involved in
cell elongation and cell expansion (Lafarguette et al. 2004). BQR and FLA were
preferentially expressed in apical shoot woody stem bases in Sitka spruce (Friedmann et
68
al. 2007). Expression of BQR was associated with a SNP in a homolog of a FLA gene
and the heterozygous and homozygous plants with a glutamic acid residue at the SNP
position have approximately 2-fold higher expression than the plants homozygous for
glycine. Expression of XET3 was associated with a SNP in the 3‟UTR of a homolog of
the FLA8 gene and the homozygous (AA) and heterozygous (AC) plants have
approximately 1.5-fold higher expression than the plants with the other homozygous
allele (CC).
GRV2/KATAMARI2 is a heat shock protein required for the vacuolar pathway and
endomembrane organization in plants (Tamura et al. 2007). MADS box-containing
transcription factors are widely distributed DNA-binding proteins, which are
hypothesized to be involved in the transcriptional regulation of many genes. The
expression of a MADS box-containing transcription factor that was preferentially
expressed in xylem tissue, showed significant association with two SNPs in a homolog
of the GRV2/KATAMARI2 heat shock protein. One is in an intron while the other is a
synonymous SNP is in the coding region. These SNPs appear to be linked because of
their identical SNP profile across the population and hence only one or neither of these
SNPs may be functional. Plants homozygous for the common allele have approximately
2-fold higher expression than plants homozygous for the rare allele and heterozygous
plants have expression intermediate of the two homozygotes.
Neale and Savolainen (2004) have shown that linkage disequilibrium declines within
the length of an average-sized gene in conifers. That appears to be true for many of the
genotyped genes used for these analyses as frequently two SNPs from the same gene did
69
not have the same SNP profile. However, in our association study we found that
expression of one gene was associated with 12 SNPs in ten different genes with nearly
identical q-values. The 10 genes had the same SNP profile and mapped together on
linkage group 8. This is in contrast to the thought that linkage disequilibrium decays
rapidly in loblolly pine. Therefore, although the expression of the NH-4 gene showed
significant association with 10 genes, it is probably functionally associated with only one
of those genes. The remaining genes are significantly associated because of their close
linkage with the functionally associated gene. In fact, the functional association could be
to another linked gene that was not analyzed for SNPs. In the same way, expression of a
UDP-glucose pyrophosphorylase gene showed significant association with SNPs in two
genes that were closely linked, suggesting that only one, or neither, of those SNPs might
be a functional association. Therefore, SNPs with significant genetic associations with
expression of other genes may be responsible for the association or they may be located
in close proximity to the causative polymorphism.
LD-based association analyses assist in the development of functional markers by
studying marker-trait associations, which can be utilized in marker assisted selection
(MAS). In forest trees where mapping populations cannot be easily generated, MAS will
be extremely useful (Gupta et al. 2005). Once significant associations have been
discovered, the next question is to determine the molecular mechanisms through which
they influence phenotypic expression (McCarthy et al. 2008). It becomes difficult to
determine the molecular mechanisms if the genes are of unknown function or have no
connection to the phenotype (Stranger et al. 2007). We also need to determine if the
70
associations are functional and not due to linkage. In order to completely understand the
genetic architecture of a trait, including gene expression, it will be necessary to conduct
association studies with virtually all the genes in the genome (González-Martínez et al.
2007).
It would be interesting to analyze other phenotypic traits including wood
characteristics, growth and survival in this population to see if the gene expression
differences observed result in changes. This would help us understand the causes of
natural variation in traits of economic importance observed in the population and also
determine if the rare alleles of the associated SNPs provide any fitness advantage to the
plant in its local environment (Weigel and Nordborg 2005).
71
CHAPTER-IV
LOBLOLLY PINE PROMOTER POLYMORPHISMS AND THEIR EFFECT ON
GENE EXPRESSION
INTRODUCTION
Natural populations of most plants and animals harbor considerable functional
variation in gene expression (Brem et al. 2002; Oleksiak et al. 2002; Rifkin et al. 2003;
Schadt et al. 2003). Regulation of gene expression is complex and occurs at many levels,
including chromatin packing, histone modification, transcription initiation, RNA
polyadenylation, pre-mRNA splicing, mRNA stability and translation initiation (de
Vooght et al. 2009). However, most regulation of gene expression occurs at the
transcriptional level. The promoter is a regulatory region of DNA located upstream of a
gene and it plays an essential role in transcriptional regulation. The size of a promoter is
unknown, varies for each gene and is considered to span between 50 bases downstream
and 3 kb upstream of the transcription start site (Veerla and Hoglund, 2006). However,
high densities of regulatory elements have been reported only between − 100 and − 600
bp in the upstream region (Ram kumar et al. 2010). Along with the coding sequences
that determine the arrangement of amino acids in a protein, these transcriptional
regulatory sequences are critical for gene function (Wray et al. 2003). Several
72
researchers have reviewed the pervasive and important role that transcriptional
regulation plays in evolution (Doebley and Lukens 1998; Wray and Lowe 2000;
Davidson 2001; Wray et al. 2003). For example, Wang et al. (1999) found that the
anatomical changes that occurred when teosinte was domesticated to produce domestic
maize were partly due to changes in the promoter of teosinte branched 1, a transcription
factor.
Proteins that bind to discrete, idiosyncratic transcription factor binding sites
(TFBS) control the specificity of transcription (Wray et al. 2003). TFBS occupy a wide
range of positions relative to the translation start site (TSS) and play key roles in gene
regulation. Any changes in their sequences due to single nucleotide polymorphisms
(SNPs) or insertion or deletions may influence gene expression resulting in variable trait
expression. SNPs are abundant and widespread in many genomes and are more frequent
in non-coding regions than in coding ones. The mean frequency of SNPs varies greatly
among species with Pinus taeda L. having on average 16 SNPs/kb (Brown et al. 2004).
The most direct way to identify SNPs is to sequence a genome fragment from multiple
individuals. SNP discovery by sequencing amplified DNA fragments is very reliable,
with a false discovery rate below 5% (Ganal et al. 2009). Rockman and Wray (2002)
showed that in human promoters the first 500 nucleotides upstream of the translation
start site (TSS) contained most of the functional SNPs (59%). Mutations in the
promoters leading to polymorphisms within or adjacent to the transcription factor
binding sites may disrupt the normal processes of gene activation by disturbing the
ordered recruitment of transcription factors. As a result, a promoter mutation can
73
decrease or increase the level of mRNA and the resultant protein (de Vooght et al. 2009).
Faniello et al. (2006) have shown through functional analyses that a G to T substitution
adjacent to a Bbf binding site in an H ferritin promoter affected the transcription of that
gene in humans. However, not every promoter sequence variation affects transcriptional
regulation.
Transcriptional initiation is one of the most important determinants of the overall
gene expression profile (White 2001). In order to understand the effect of regulatory
SNPs on gene expression loblolly pine we performed promoter analysis of 19 genes with
probable roles in wood development or drought response. These promoter SNPs are
being genotyped in an association population and this SNP genotype data will be used to
perform association studies with the expression of 200 wood development and stress
response genes.
MATERIALS AND METHODS
Construction of DNA restriction digestion libraries
Genomic DNA from loblolly pine needles was isolated using the CTAB method
(Doyle and Doyle, 1987). A Genome Walker kit (Clontech, USA) was used to clone the
promoters following the manufacturer‟s instructions. We constructed pools of uncloned,
adaptor-ligated genomic DNA fragments, known as DNA restriction digestion libraries.
For complete digestion, 2.5 μg of genomic DNA was restricted with 100 U of DraI,
EcoRV, PvuII, ScaI, and StuI separately, then purified, dried and dissolved in 20 μl of
74
TE. 0.5 μg of this completely digested DNA was used to ligate to the “Genome Walker
Adaptor” (Clontech, USA) using T4 DNA ligase. The ligated products were diluted 10
times with TE to a final volume of 80 μl, out of which 1 μl was used for the first PCR
reactions.
Genome walking technique
Two gene-specific primers (GSP) were designed for each gene. The GSPs were
26-30 nucleotides in length with a melting temperature of 67-70 °C and a G/C-content of
40-60%. The primers were designed so that the GSP1 primer was from the coding region
of the gene and the GSP2 primer was further upstream closer to the 5′ end to give a
nested product in the subsequent PCR reactions. The primary PCR reactions were
performed with the outer adaptor primer (AP1) and the outer gene-specific primers
(GSP1). The product of the primary walk was then diluted and used as a template for a
secondary walk with the nested adaptor (AP2) and nested gene-specific (GSP2) primers
(Fig. 9). The major PCR products obtained were gel extracted using a QIAquick gel
extraction kit (Qiagen), sequenced and aligned using the Sequencher program (Gene
Codes Corporation). The 5' upstream region sequences were obtained for 19 genes and
were scanned for regulatory elements using the PLACE database (Higo et al. 1999).
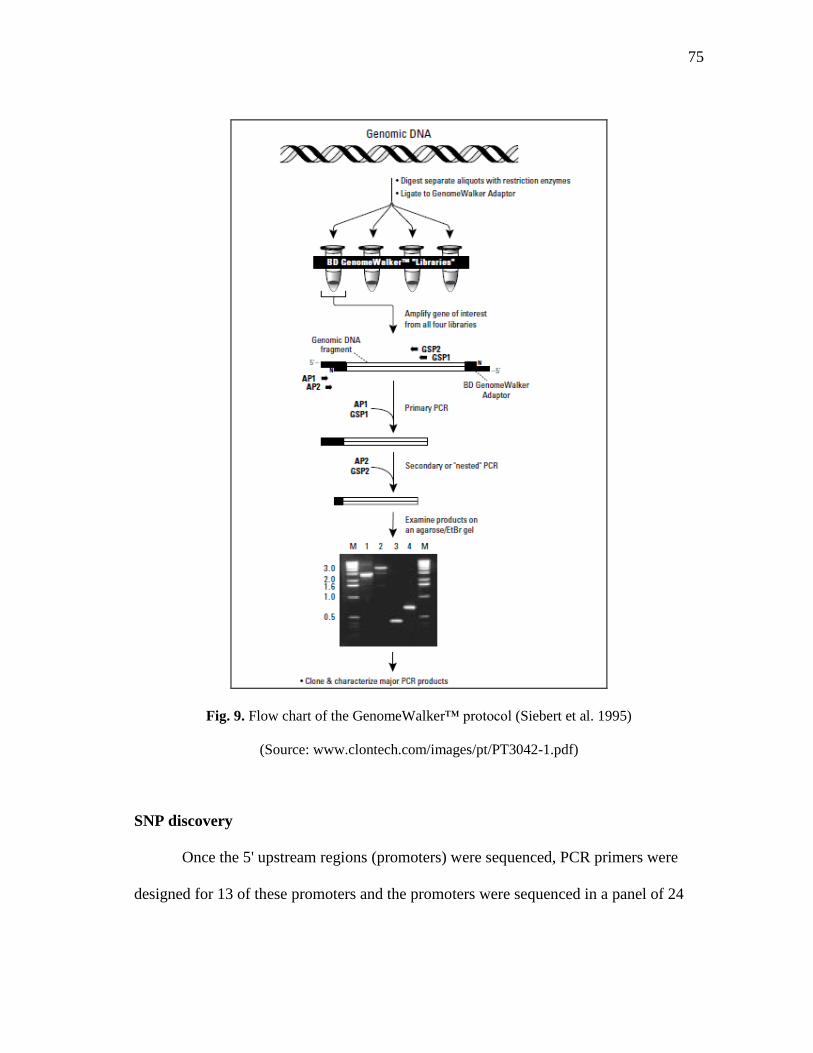
75
Fig. 9. Flow chart of the GenomeWalker™ protocol (Siebert et al. 1995)
(Source: www.clontech.com/images/pt/PT3042-1.pdf)
SNP discovery
Once the 5' upstream regions (promoters) were sequenced, PCR primers were
designed for 13 of these promoters and the promoters were sequenced in a panel of 24
76
loblolly pine plants collected from different regions of their natural range. These
sequences were then aligned using the Sequencher program to identify any SNPs in the
promoters. The promoter sequences were used to determine if any of the SNPs fall in the
putative TFBS found in the PLACE database. The profile of promoter SNPs were
compared with the expression of the respective genes to see if they had any effect on
their expression.
RESULTS AND DISCUSSION
Promoter sequencing and SNP discovery
We successfully cloned 5' upstream regions of 19 genes thought to be involved in
wood development or drought response. Sixteen of these genes are transcription factors.
The sequence length varied from 600 bases to 1600 bases. Many putative binding
elements were observed in these regions using the PLACE database (Table8). The main
functions of all the putative TFBS observed in these promoters are given in Appendix B.
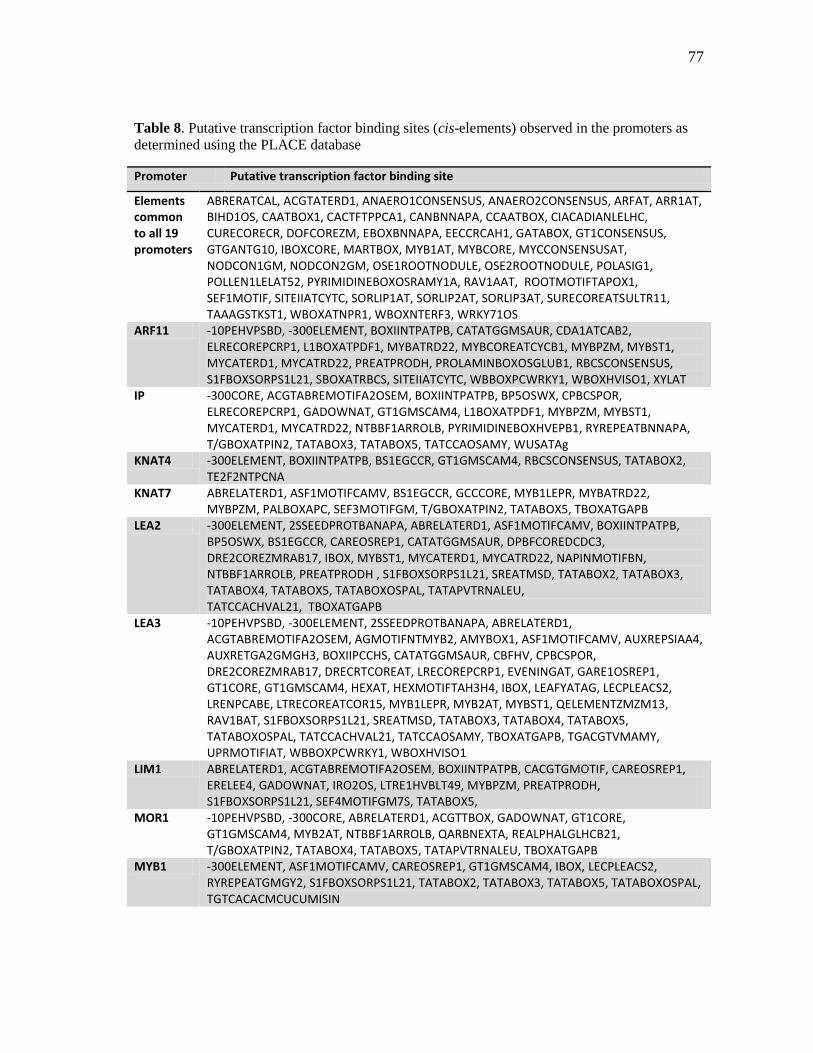
77
Table 8. Putative transcription factor binding sites (cis-elements) observed in the promoters as
determined using the PLACE database
Promoter Putative transcription factor binding site
Elements common to all 19 promoters
ABRERATCAL, ACGTATERD1, ANAERO1CONSENSUS, ANAERO2CONSENSUS, ARFAT, ARR1AT, BIHD1OS, CAATBOX1, CACTFTPPCA1, CANBNNAPA, CCAATBOX, CIACADIANLELHC, CURECORECR, DOFCOREZM, EBOXBNNAPA, EECCRCAH1, GATABOX, GT1CONSENSUS, GTGANTG10, IBOXCORE, MARTBOX, MYB1AT, MYBCORE, MYCCONSENSUSAT, NODCON1GM, NODCON2GM, OSE1ROOTNODULE, OSE2ROOTNODULE, POLASIG1, POLLEN1LELAT52, PYRIMIDINEBOXOSRAMY1A, RAV1AAT, ROOTMOTIFTAPOX1, SEF1MOTIF, SITEIIATCYTC, SORLIP1AT, SORLIP2AT, SORLIP3AT, SURECOREATSULTR11, TAAAGSTKST1, WBOXATNPR1, WBOXNTERF3, WRKY71OS
ARF11 -10PEHVPSBD, -300ELEMENT, BOXIINTPATPB, CATATGGMSAUR, CDA1ATCAB2, ELRECOREPCRP1, L1BOXATPDF1, MYBATRD22, MYBCOREATCYCB1, MYBPZM, MYBST1, MYCATERD1, MYCATRD22, PREATPRODH, PROLAMINBOXOSGLUB1, RBCSCONSENSUS, S1FBOXSORPS1L21, SBOXATRBCS, SITEIIATCYTC, WBBOXPCWRKY1, WBOXHVISO1, XYLAT
IP -300CORE, ACGTABREMOTIFA2OSEM, BOXIINTPATPB, BP5OSWX, CPBCSPOR, ELRECOREPCRP1, GADOWNAT, GT1GMSCAM4, L1BOXATPDF1, MYBPZM, MYBST1, MYCATERD1, MYCATRD22, NTBBF1ARROLB, PYRIMIDINEBOXHVEPB1, RYREPEATBNNAPA, T/GBOXATPIN2, TATABOX3, TATABOX5, TATCCAOSAMY, WUSATAg
KNAT4 -300ELEMENT, BOXIINTPATPB, BS1EGCCR, GT1GMSCAM4, RBCSCONSENSUS, TATABOX2, TE2F2NTPCNA
KNAT7 ABRELATERD1, ASF1MOTIFCAMV, BS1EGCCR, GCCCORE, MYB1LEPR, MYBATRD22, MYBPZM, PALBOXAPC, SEF3MOTIFGM, T/GBOXATPIN2, TATABOX5, TBOXATGAPB
LEA2 -300ELEMENT, 2SSEEDPROTBANAPA, ABRELATERD1, ASF1MOTIFCAMV, BOXIINTPATPB, BP5OSWX, BS1EGCCR, CAREOSREP1, CATATGGMSAUR, DPBFCOREDCDC3, DRE2COREZMRAB17, IBOX, MYBST1, MYCATERD1, MYCATRD22, NAPINMOTIFBN, NTBBF1ARROLB, PREATPRODH , S1FBOXSORPS1L21, SREATMSD, TATABOX2, TATABOX3, TATABOX4, TATABOX5, TATABOXOSPAL, TATAPVTRNALEU, TATCCACHVAL21, TBOXATGAPB
LEA3 -10PEHVPSBD, -300ELEMENT, 2SSEEDPROTBANAPA, ABRELATERD1, ACGTABREMOTIFA2OSEM, AGMOTIFNTMYB2, AMYBOX1, ASF1MOTIFCAMV, AUXREPSIAA4, AUXRETGA2GMGH3, BOXIIPCCHS, CATATGGMSAUR, CBFHV, CPBCSPOR, DRE2COREZMRAB17, DRECRTCOREAT, LRECOREPCRP1, EVENINGAT, GARE1OSREP1, GT1CORE, GT1GMSCAM4, HEXAT, HEXMOTIFTAH3H4, IBOX, LEAFYATAG, LECPLEACS2, LRENPCABE, LTRECOREATCOR15, MYB1LEPR, MYB2AT, MYBST1, QELEMENTZMZM13, RAV1BAT, S1FBOXSORPS1L21, SREATMSD, TATABOX3, TATABOX4, TATABOX5, TATABOXOSPAL, TATCCACHVAL21, TATCCAOSAMY, TBOXATGAPB, TGACGTVMAMY, UPRMOTIFIAT, WBBOXPCWRKY1, WBOXHVISO1
LIM1 ABRELATERD1, ACGTABREMOTIFA2OSEM, BOXIINTPATPB, CACGTGMOTIF, CAREOSREP1, ERELEE4, GADOWNAT, IRO2OS, LTRE1HVBLT49, MYBPZM, PREATPRODH, S1FBOXSORPS1L21, SEF4MOTIFGM7S, TATABOX5,
MOR1 -10PEHVPSBD, -300CORE, ABRELATERD1, ACGTTBOX, GADOWNAT, GT1CORE, GT1GMSCAM4, MYB2AT, NTBBF1ARROLB, QARBNEXTA, REALPHALGLHCB21, T/GBOXATPIN2, TATABOX4, TATABOX5, TATAPVTRNALEU, TBOXATGAPB
MYB1 -300ELEMENT, ASF1MOTIFCAMV, CAREOSREP1, GT1GMSCAM4, IBOX, LECPLEACS2, RYREPEATGMGY2, S1FBOXSORPS1L21, TATABOX2, TATABOX3, TATABOX5, TATABOXOSPAL, TGTCACACMCUCUMISIN
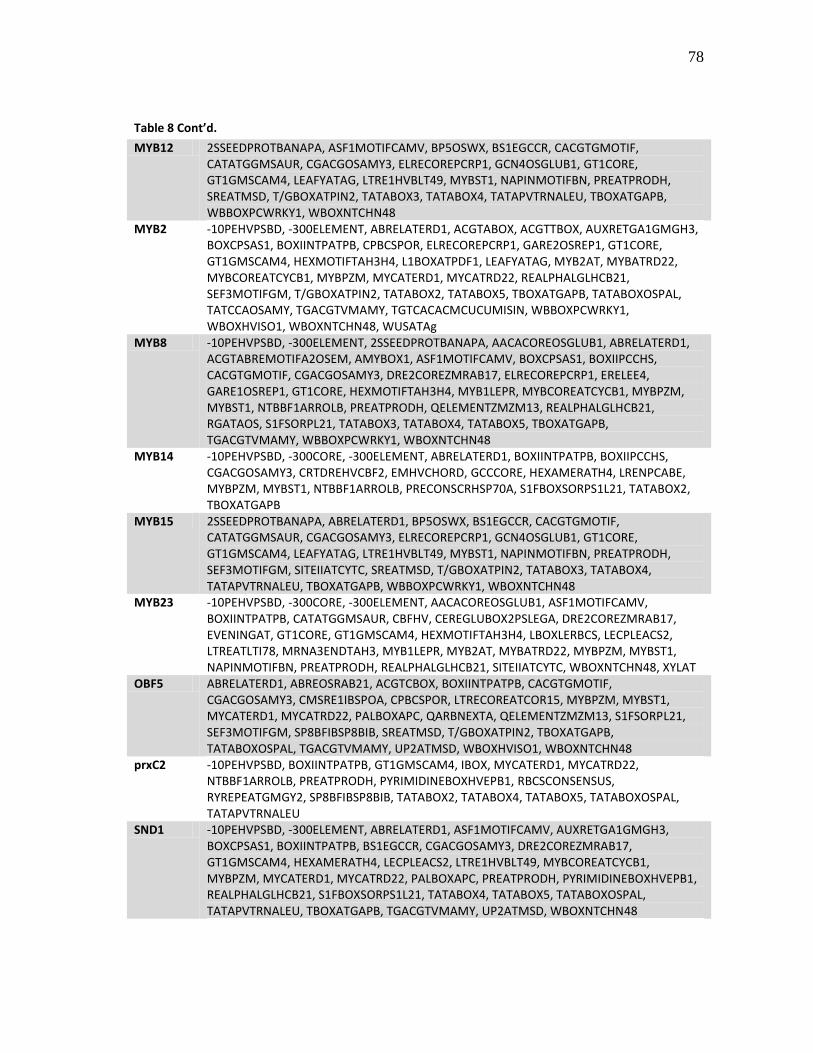
78
Table 8 Cont’d.
MYB12 2SSEEDPROTBANAPA, ASF1MOTIFCAMV, BP5OSWX, BS1EGCCR, CACGTGMOTIF, CATATGGMSAUR, CGACGOSAMY3, ELRECOREPCRP1, GCN4OSGLUB1, GT1CORE, GT1GMSCAM4, LEAFYATAG, LTRE1HVBLT49, MYBST1, NAPINMOTIFBN, PREATPRODH, SREATMSD, T/GBOXATPIN2, TATABOX3, TATABOX4, TATAPVTRNALEU, TBOXATGAPB, WBBOXPCWRKY1, WBOXNTCHN48
MYB2 -10PEHVPSBD, -300ELEMENT, ABRELATERD1, ACGTABOX, ACGTTBOX, AUXRETGA1GMGH3, BOXCPSAS1, BOXIINTPATPB, CPBCSPOR, ELRECOREPCRP1, GARE2OSREP1, GT1CORE, GT1GMSCAM4, HEXMOTIFTAH3H4, L1BOXATPDF1, LEAFYATAG, MYB2AT, MYBATRD22, MYBCOREATCYCB1, MYBPZM, MYCATERD1, MYCATRD22, REALPHALGLHCB21, SEF3MOTIFGM, T/GBOXATPIN2, TATABOX2, TATABOX5, TBOXATGAPB, TATABOXOSPAL, TATCCAOSAMY, TGACGTVMAMY, TGTCACACMCUCUMISIN, WBBOXPCWRKY1, WBOXHVISO1, WBOXNTCHN48, WUSATAg
MYB8 -10PEHVPSBD, -300ELEMENT, 2SSEEDPROTBANAPA, AACACOREOSGLUB1, ABRELATERD1, ACGTABREMOTIFA2OSEM, AMYBOX1, ASF1MOTIFCAMV, BOXCPSAS1, BOXIIPCCHS, CACGTGMOTIF, CGACGOSAMY3, DRE2COREZMRAB17, ELRECOREPCRP1, ERELEE4, GARE1OSREP1, GT1CORE, HEXMOTIFTAH3H4, MYB1LEPR, MYBCOREATCYCB1, MYBPZM, MYBST1, NTBBF1ARROLB, PREATPRODH, QELEMENTZMZM13, REALPHALGLHCB21, RGATAOS, S1FSORPL21, TATABOX3, TATABOX4, TATABOX5, TBOXATGAPB, TGACGTVMAMY, WBBOXPCWRKY1, WBOXNTCHN48
MYB14 -10PEHVPSBD, -300CORE, -300ELEMENT, ABRELATERD1, BOXIINTPATPB, BOXIIPCCHS, CGACGOSAMY3, CRTDREHVCBF2, EMHVCHORD, GCCCORE, HEXAMERATH4, LRENPCABE, MYBPZM, MYBST1, NTBBF1ARROLB, PRECONSCRHSP70A, S1FBOXSORPS1L21, TATABOX2, TBOXATGAPB
MYB15 2SSEEDPROTBANAPA, ABRELATERD1, BP5OSWX, BS1EGCCR, CACGTGMOTIF, CATATGGMSAUR, CGACGOSAMY3, ELRECOREPCRP1, GCN4OSGLUB1, GT1CORE, GT1GMSCAM4, LEAFYATAG, LTRE1HVBLT49, MYBST1, NAPINMOTIFBN, PREATPRODH, SEF3MOTIFGM, SITEIIATCYTC, SREATMSD, T/GBOXATPIN2, TATABOX3, TATABOX4, TATAPVTRNALEU, TBOXATGAPB, WBBOXPCWRKY1, WBOXNTCHN48
MYB23 -10PEHVPSBD, -300CORE, -300ELEMENT, AACACOREOSGLUB1, ASF1MOTIFCAMV, BOXIINTPATPB, CATATGGMSAUR, CBFHV, CEREGLUBOX2PSLEGA, DRE2COREZMRAB17, EVENINGAT, GT1CORE, GT1GMSCAM4, HEXMOTIFTAH3H4, LBOXLERBCS, LECPLEACS2, LTREATLTI78, MRNA3ENDTAH3, MYB1LEPR, MYB2AT, MYBATRD22, MYBPZM, MYBST1, NAPINMOTIFBN, PREATPRODH, REALPHALGLHCB21, SITEIIATCYTC, WBOXNTCHN48, XYLAT
OBF5 ABRELATERD1, ABREOSRAB21, ACGTCBOX, BOXIINTPATPB, CACGTGMOTIF, CGACGOSAMY3, CMSRE1IBSPOA, CPBCSPOR, LTRECOREATCOR15, MYBPZM, MYBST1, MYCATERD1, MYCATRD22, PALBOXAPC, QARBNEXTA, QELEMENTZMZM13, S1FSORPL21, SEF3MOTIFGM, SP8BFIBSP8BIB, SREATMSD, T/GBOXATPIN2, TBOXATGAPB, TATABOXOSPAL, TGACGTVMAMY, UP2ATMSD, WBOXHVISO1, WBOXNTCHN48
prxC2 -10PEHVPSBD, BOXIINTPATPB, GT1GMSCAM4, IBOX, MYCATERD1, MYCATRD22, NTBBF1ARROLB, PREATPRODH, PYRIMIDINEBOXHVEPB1, RBCSCONSENSUS, RYREPEATGMGY2, SP8BFIBSP8BIB, TATABOX2, TATABOX4, TATABOX5, TATABOXOSPAL, TATAPVTRNALEU
SND1 -10PEHVPSBD, -300ELEMENT, ABRELATERD1, ASF1MOTIFCAMV, AUXRETGA1GMGH3, BOXCPSAS1, BOXIINTPATPB, BS1EGCCR, CGACGOSAMY3, DRE2COREZMRAB17, GT1GMSCAM4, HEXAMERATH4, LECPLEACS2, LTRE1HVBLT49, MYBCOREATCYCB1, MYBPZM, MYCATERD1, MYCATRD22, PALBOXAPC, PREATPRODH, PYRIMIDINEBOXHVEPB1, REALPHALGLHCB21, S1FBOXSORPS1L21, TATABOX4, TATABOX5, TATABOXOSPAL, TATAPVTRNALEU, TBOXATGAPB, TGACGTVMAMY, UP2ATMSD, WBOXNTCHN48
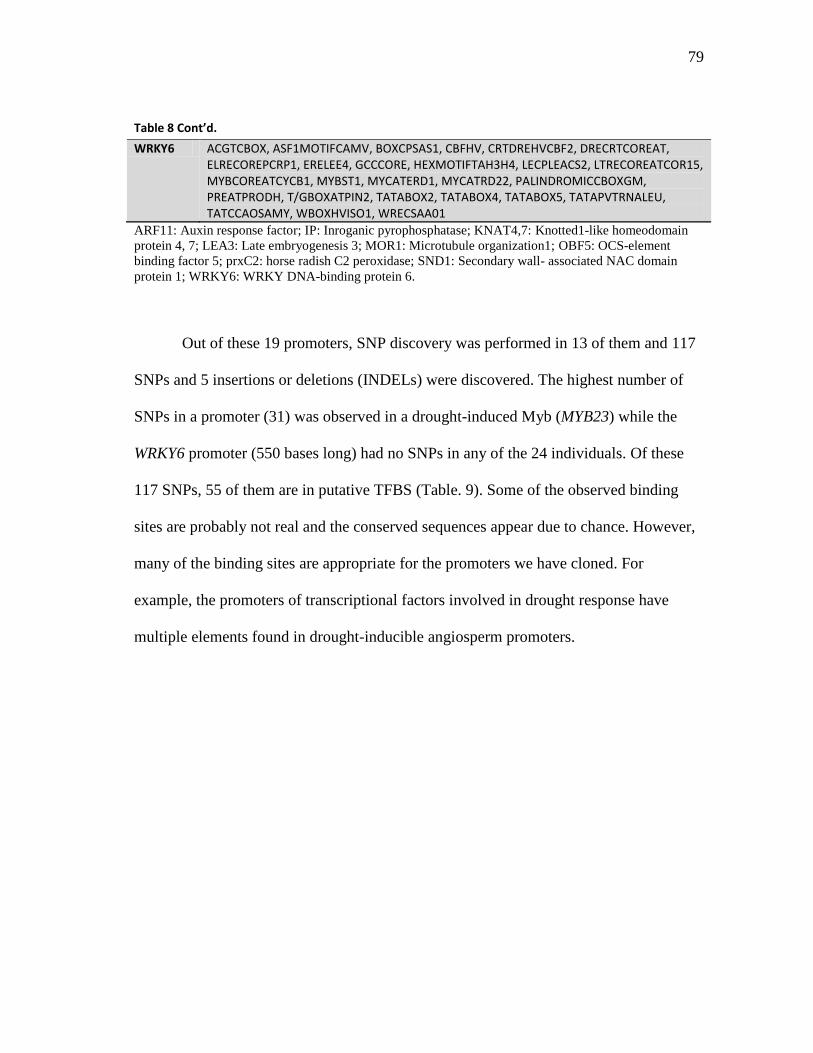
79
Table 8 Cont’d.
WRKY6 ACGTCBOX, ASF1MOTIFCAMV, BOXCPSAS1, CBFHV, CRTDREHVCBF2, DRECRTCOREAT, ELRECOREPCRP1, ERELEE4, GCCCORE, HEXMOTIFTAH3H4, LECPLEACS2, LTRECOREATCOR15, MYBCOREATCYCB1, MYBST1, MYCATERD1, MYCATRD22, PALINDROMICCBOXGM, PREATPRODH, T/GBOXATPIN2, TATABOX2, TATABOX4, TATABOX5, TATAPVTRNALEU, TATCCAOSAMY, WBOXHVISO1, WRECSAA01
ARF11: Auxin response factor; IP: Inroganic pyrophosphatase; KNAT4,7: Knotted1-like homeodomain
protein 4, 7; LEA3: Late embryogenesis 3; MOR1: Microtubule organization1; OBF5: OCS-element
binding factor 5; prxC2: horse radish C2 peroxidase; SND1: Secondary wall- associated NAC domain
protein 1; WRKY6: WRKY DNA-binding protein 6.
Out of these 19 promoters, SNP discovery was performed in 13 of them and 117
SNPs and 5 insertions or deletions (INDELs) were discovered. The highest number of
SNPs in a promoter (31) was observed in a drought-induced Myb (MYB23) while the
WRKY6 promoter (550 bases long) had no SNPs in any of the 24 individuals. Of these
117 SNPs, 55 of them are in putative TFBS (Table. 9). Some of the observed binding
sites are probably not real and the conserved sequences appear due to chance. However,
many of the binding sites are appropriate for the promoters we have cloned. For
example, the promoters of transcriptional factors involved in drought response have
multiple elements found in drought-inducible angiosperm promoters.
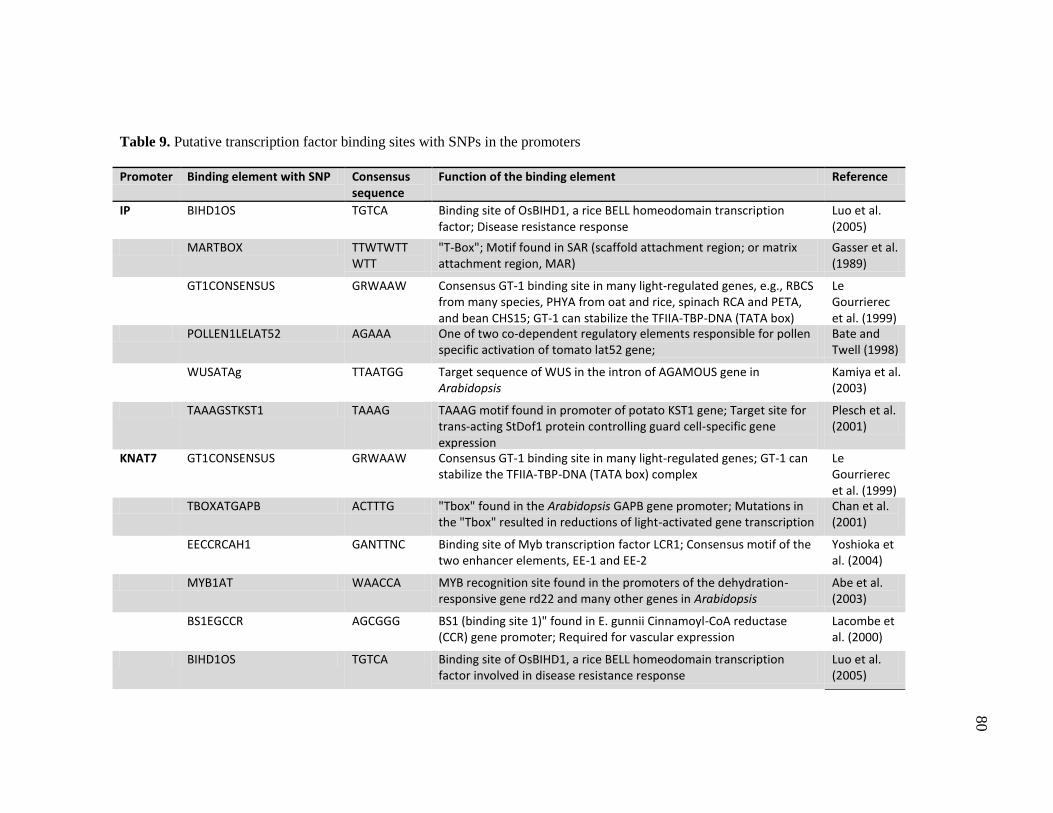
80
80
Table 9. Putative transcription factor binding sites with SNPs in the promoters
Promoter Binding element with SNP Consensus sequence
Function of the binding element Reference
IP BIHD1OS TGTCA Binding site of OsBIHD1, a rice BELL homeodomain transcription factor; Disease resistance response
Luo et al. (2005)
MARTBOX TTWTWTTWTT
"T-Box"; Motif found in SAR (scaffold attachment region; or matrix attachment region, MAR)
Gasser et al. (1989)
GT1CONSENSUS GRWAAW Consensus GT-1 binding site in many light-regulated genes, e.g., RBCS from many species, PHYA from oat and rice, spinach RCA and PETA, and bean CHS15; GT-1 can stabilize the TFIIA-TBP-DNA (TATA box) complex
Le Gourrierec et al. (1999)
POLLEN1LELAT52 AGAAA One of two co-dependent regulatory elements responsible for pollen specific activation of tomato lat52 gene;
Bate and Twell (1998)
WUSATAg TTAATGG Target sequence of WUS in the intron of AGAMOUS gene in Arabidopsis
Kamiya et al. (2003)
TAAAGSTKST1 TAAAG TAAAG motif found in promoter of potato KST1 gene; Target site for trans-acting StDof1 protein controlling guard cell-specific gene expression
Plesch et al. (2001)
KNAT7 GT1CONSENSUS GRWAAW Consensus GT-1 binding site in many light-regulated genes; GT-1 can stabilize the TFIIA-TBP-DNA (TATA box) complex
Le Gourrierec et al. (1999)
TBOXATGAPB ACTTTG "Tbox" found in the Arabidopsis GAPB gene promoter; Mutations in the "Tbox" resulted in reductions of light-activated gene transcription
Chan et al. (2001)
EECCRCAH1 GANTTNC Binding site of Myb transcription factor LCR1; Consensus motif of the two enhancer elements, EE-1 and EE-2
Yoshioka et al. (2004)
MYB1AT WAACCA MYB recognition site found in the promoters of the dehydration-responsive gene rd22 and many other genes in Arabidopsis
Abe et al. (2003)
BS1EGCCR AGCGGG BS1 (binding site 1)" found in E. gunnii Cinnamoyl-CoA reductase (CCR) gene promoter; Required for vascular expression
Lacombe et al. (2000)
BIHD1OS TGTCA Binding site of OsBIHD1, a rice BELL homeodomain transcription factor involved in disease resistance response
Luo et al. (2005)
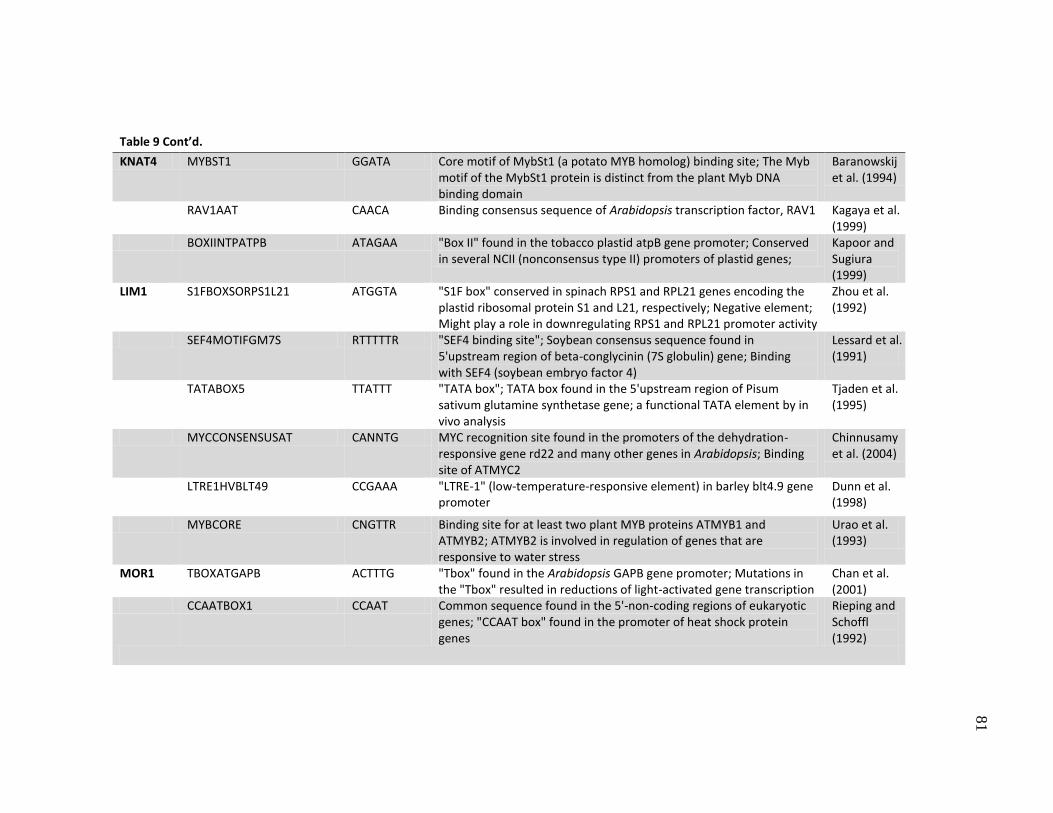
81
80
Table 9 Cont’d.
KNAT4 MYBST1 GGATA Core motif of MybSt1 (a potato MYB homolog) binding site; The Myb motif of the MybSt1 protein is distinct from the plant Myb DNA binding domain
Baranowskij et al. (1994)
RAV1AAT CAACA Binding consensus sequence of Arabidopsis transcription factor, RAV1 Kagaya et al. (1999)
BOXIINTPATPB ATAGAA "Box II" found in the tobacco plastid atpB gene promoter; Conserved in several NCII (nonconsensus type II) promoters of plastid genes;
Kapoor and Sugiura (1999)
LIM1 S1FBOXSORPS1L21 ATGGTA "S1F box" conserved in spinach RPS1 and RPL21 genes encoding the plastid ribosomal protein S1 and L21, respectively; Negative element; Might play a role in downregulating RPS1 and RPL21 promoter activity
Zhou et al. (1992)
SEF4MOTIFGM7S RTTTTTR "SEF4 binding site"; Soybean consensus sequence found in 5'upstream region of beta-conglycinin (7S globulin) gene; Binding with SEF4 (soybean embryo factor 4)
Lessard et al. (1991)
TATABOX5 TTATTT "TATA box"; TATA box found in the 5'upstream region of Pisum sativum glutamine synthetase gene; a functional TATA element by in vivo analysis
Tjaden et al. (1995)
MYCCONSENSUSAT CANNTG MYC recognition site found in the promoters of the dehydration-responsive gene rd22 and many other genes in Arabidopsis; Binding site of ATMYC2
Chinnusamy et al. (2004)
LTRE1HVBLT49 CCGAAA "LTRE-1" (low-temperature-responsive element) in barley blt4.9 gene promoter
Dunn et al. (1998)
MYBCORE CNGTTR Binding site for at least two plant MYB proteins ATMYB1 and ATMYB2; ATMYB2 is involved in regulation of genes that are responsive to water stress
Urao et al. (1993)
MOR1 TBOXATGAPB ACTTTG "Tbox" found in the Arabidopsis GAPB gene promoter; Mutations in the "Tbox" resulted in reductions of light-activated gene transcription
Chan et al. (2001)
CCAATBOX1 CCAAT Common sequence found in the 5'-non-coding regions of eukaryotic genes; "CCAAT box" found in the promoter of heat shock protein genes
Rieping and Schoffl (1992)
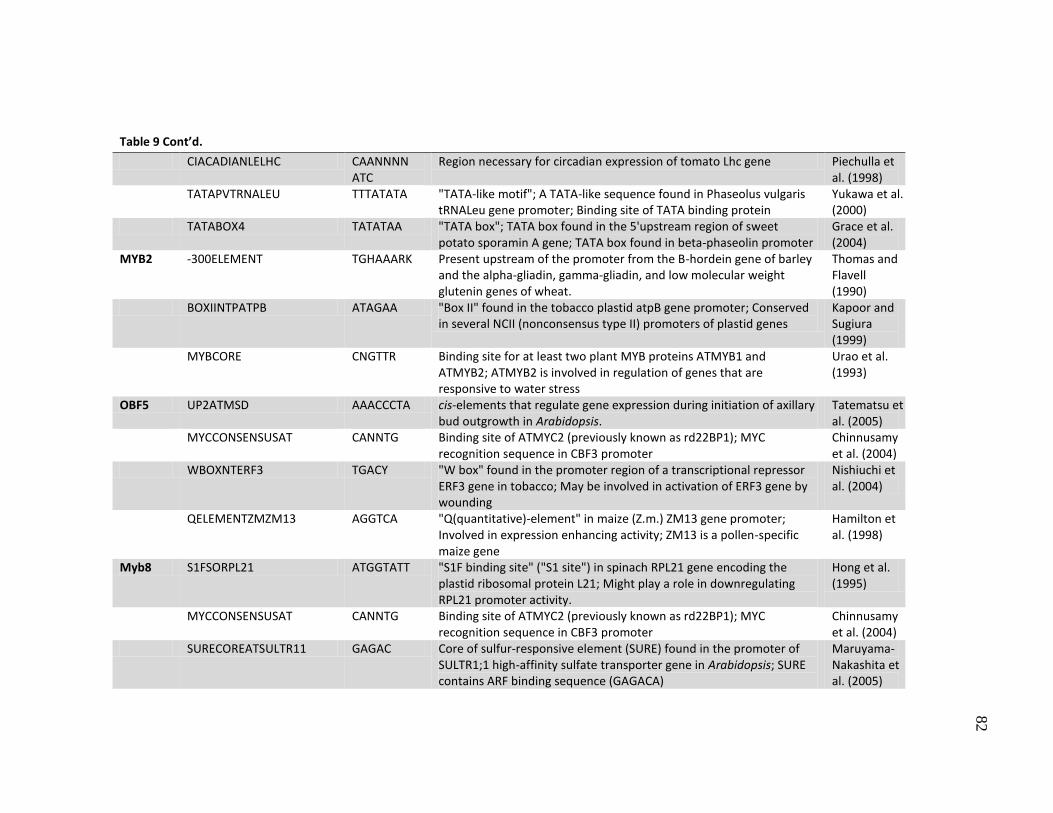
82
80
Table 9 Cont’d.
CIACADIANLELHC CAANNNNATC
Region necessary for circadian expression of tomato Lhc gene Piechulla et al. (1998)
TATAPVTRNALEU TTTATATA "TATA-like motif"; A TATA-like sequence found in Phaseolus vulgaris tRNALeu gene promoter; Binding site of TATA binding protein
Yukawa et al. (2000)
TATABOX4 TATATAA "TATA box"; TATA box found in the 5'upstream region of sweet potato sporamin A gene; TATA box found in beta-phaseolin promoter
Grace et al. (2004)
MYB2 -300ELEMENT TGHAAARK Present upstream of the promoter from the B-hordein gene of barley and the alpha-gliadin, gamma-gliadin, and low molecular weight glutenin genes of wheat.
Thomas and Flavell (1990)
BOXIINTPATPB ATAGAA "Box II" found in the tobacco plastid atpB gene promoter; Conserved in several NCII (nonconsensus type II) promoters of plastid genes
Kapoor and Sugiura (1999)
MYBCORE CNGTTR Binding site for at least two plant MYB proteins ATMYB1 and ATMYB2; ATMYB2 is involved in regulation of genes that are responsive to water stress
Urao et al. (1993)
OBF5 UP2ATMSD AAACCCTA cis-elements that regulate gene expression during initiation of axillary bud outgrowth in Arabidopsis.
Tatematsu et al. (2005)
MYCCONSENSUSAT CANNTG Binding site of ATMYC2 (previously known as rd22BP1); MYC recognition sequence in CBF3 promoter
Chinnusamy et al. (2004)
WBOXNTERF3 TGACY "W box" found in the promoter region of a transcriptional repressor ERF3 gene in tobacco; May be involved in activation of ERF3 gene by wounding
Nishiuchi et al. (2004)
QELEMENTZMZM13 AGGTCA "Q(quantitative)-element" in maize (Z.m.) ZM13 gene promoter; Involved in expression enhancing activity; ZM13 is a pollen-specific maize gene
Hamilton et al. (1998)
Myb8 S1FSORPL21 ATGGTATT "S1F binding site" ("S1 site") in spinach RPL21 gene encoding the plastid ribosomal protein L21; Might play a role in downregulating RPL21 promoter activity.
Hong et al. (1995)
MYCCONSENSUSAT CANNTG Binding site of ATMYC2 (previously known as rd22BP1); MYC recognition sequence in CBF3 promoter
Chinnusamy et al. (2004)
SURECOREATSULTR11 GAGAC Core of sulfur-responsive element (SURE) found in the promoter of SULTR1;1 high-affinity sulfate transporter gene in Arabidopsis; SURE contains ARF binding sequence (GAGACA)
Maruyama-Nakashita et al. (2005)
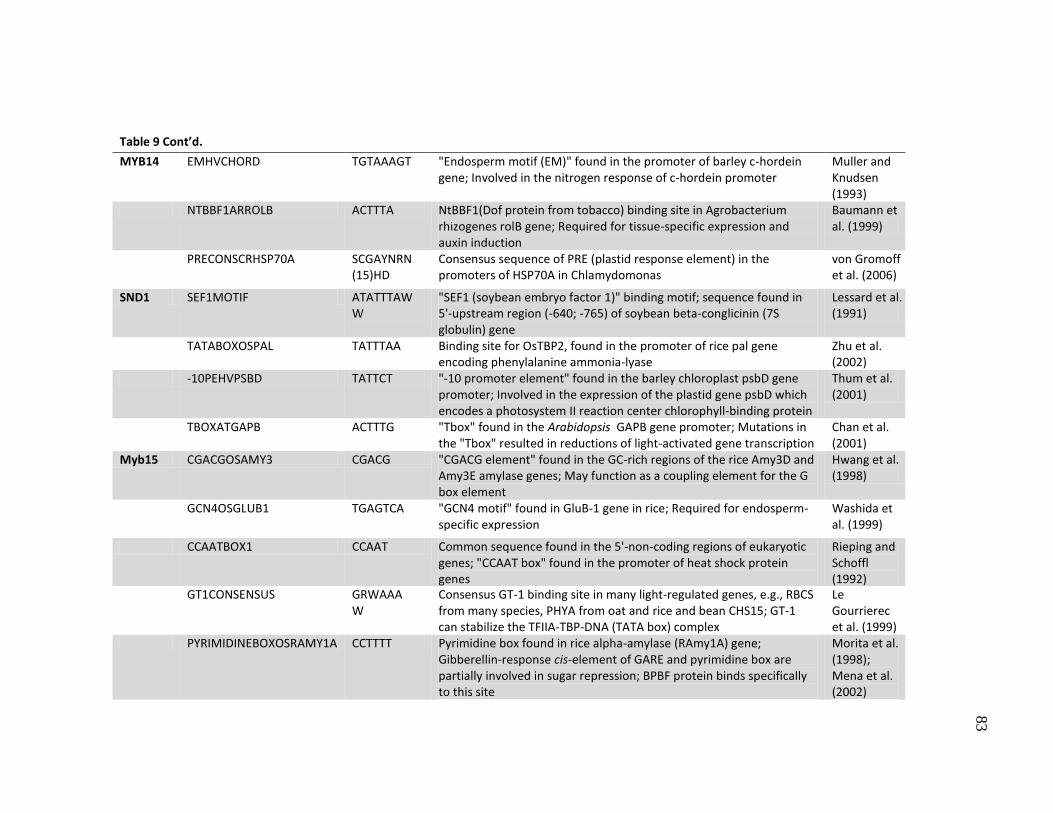
83
80
Table 9 Cont’d.
MYB14 EMHVCHORD TGTAAAGT "Endosperm motif (EM)" found in the promoter of barley c-hordein gene; Involved in the nitrogen response of c-hordein promoter
Muller and Knudsen (1993)
NTBBF1ARROLB ACTTTA NtBBF1(Dof protein from tobacco) binding site in Agrobacterium rhizogenes rolB gene; Required for tissue-specific expression and auxin induction
Baumann et al. (1999)
PRECONSCRHSP70A SCGAYNRN(15)HD
Consensus sequence of PRE (plastid response element) in the promoters of HSP70A in Chlamydomonas
von Gromoff et al. (2006)
SND1 SEF1MOTIF ATATTTAWW
"SEF1 (soybean embryo factor 1)" binding motif; sequence found in 5'-upstream region (-640; -765) of soybean beta-conglicinin (7S globulin) gene
Lessard et al. (1991)
TATABOXOSPAL TATTTAA Binding site for OsTBP2, found in the promoter of rice pal gene encoding phenylalanine ammonia-lyase
Zhu et al. (2002)
-10PEHVPSBD TATTCT "-10 promoter element" found in the barley chloroplast psbD gene promoter; Involved in the expression of the plastid gene psbD which encodes a photosystem II reaction center chlorophyll-binding protein
Thum et al. (2001)
TBOXATGAPB ACTTTG "Tbox" found in the Arabidopsis GAPB gene promoter; Mutations in the "Tbox" resulted in reductions of light-activated gene transcription
Chan et al. (2001)
Myb15 CGACGOSAMY3 CGACG "CGACG element" found in the GC-rich regions of the rice Amy3D and Amy3E amylase genes; May function as a coupling element for the G box element
Hwang et al. (1998)
GCN4OSGLUB1 TGAGTCA "GCN4 motif" found in GluB-1 gene in rice; Required for endosperm-specific expression
Washida et al. (1999)
CCAATBOX1 CCAAT Common sequence found in the 5'-non-coding regions of eukaryotic genes; "CCAAT box" found in the promoter of heat shock protein genes
Rieping and Schoffl (1992)
GT1CONSENSUS GRWAAAW
Consensus GT-1 binding site in many light-regulated genes, e.g., RBCS from many species, PHYA from oat and rice and bean CHS15; GT-1 can stabilize the TFIIA-TBP-DNA (TATA box) complex
Le Gourrierec et al. (1999)
PYRIMIDINEBOXOSRAMY1A CCTTTT Pyrimidine box found in rice alpha-amylase (RAmy1A) gene; Gibberellin-response cis-element of GARE and pyrimidine box are partially involved in sugar repression; BPBF protein binds specifically to this site
Morita et al. (1998); Mena et al. (2002)
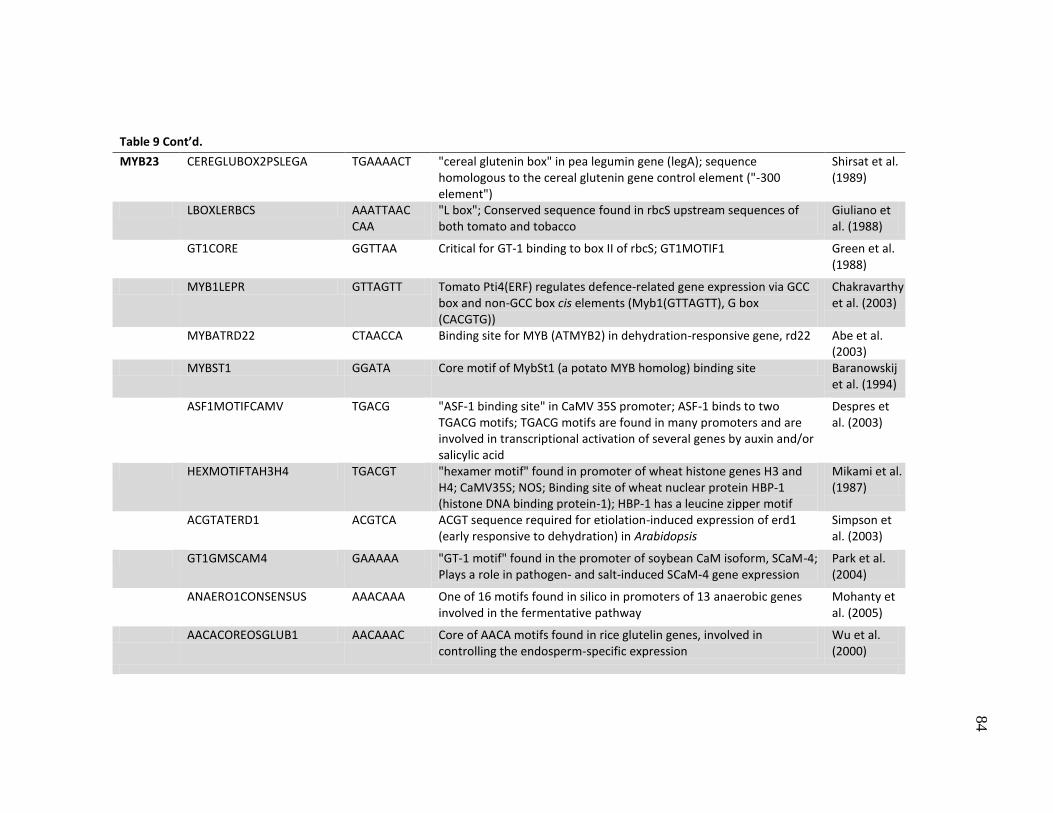
84
80
Table 9 Cont’d.
MYB23 CEREGLUBOX2PSLEGA TGAAAACT "cereal glutenin box" in pea legumin gene (legA); sequence homologous to the cereal glutenin gene control element ("-300 element")
Shirsat et al. (1989)
LBOXLERBCS AAATTAACCAA
"L box"; Conserved sequence found in rbcS upstream sequences of both tomato and tobacco
Giuliano et al. (1988)
GT1CORE GGTTAA Critical for GT-1 binding to box II of rbcS; GT1MOTIF1 Green et al. (1988)
MYB1LEPR GTTAGTT Tomato Pti4(ERF) regulates defence-related gene expression via GCC box and non-GCC box cis elements (Myb1(GTTAGTT), G box (CACGTG))
Chakravarthy et al. (2003)
MYBATRD22 CTAACCA Binding site for MYB (ATMYB2) in dehydration-responsive gene, rd22 Abe et al. (2003)
MYBST1 GGATA Core motif of MybSt1 (a potato MYB homolog) binding site Baranowskij et al. (1994)
ASF1MOTIFCAMV TGACG "ASF-1 binding site" in CaMV 35S promoter; ASF-1 binds to two TGACG motifs; TGACG motifs are found in many promoters and are involved in transcriptional activation of several genes by auxin and/or salicylic acid
Despres et al. (2003)
HEXMOTIFTAH3H4 TGACGT "hexamer motif" found in promoter of wheat histone genes H3 and H4; CaMV35S; NOS; Binding site of wheat nuclear protein HBP-1 (histone DNA binding protein-1); HBP-1 has a leucine zipper motif
Mikami et al. (1987)
ACGTATERD1 ACGTCA ACGT sequence required for etiolation-induced expression of erd1 (early responsive to dehydration) in Arabidopsis
Simpson et al. (2003)
GT1GMSCAM4 GAAAAA "GT-1 motif" found in the promoter of soybean CaM isoform, SCaM-4; Plays a role in pathogen- and salt-induced SCaM-4 gene expression
Park et al. (2004)
ANAERO1CONSENSUS AAACAAA One of 16 motifs found in silico in promoters of 13 anaerobic genes involved in the fermentative pathway
Mohanty et al. (2005)
AACACOREOSGLUB1 AACAAAC Core of AACA motifs found in rice glutelin genes, involved in controlling the endosperm-specific expression
Wu et al. (2000)
.
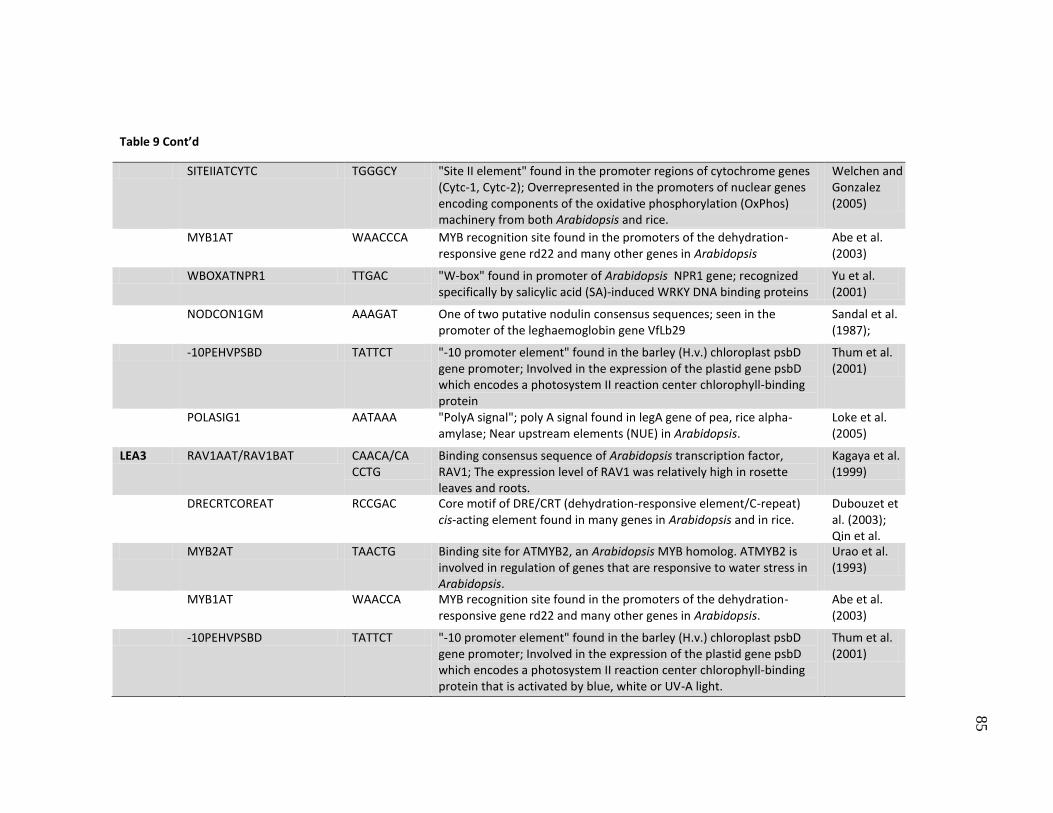
85
80
Table 9 Cont’d
SITEIIATCYTC TGGGCY "Site II element" found in the promoter regions of cytochrome genes (Cytc-1, Cytc-2); Overrepresented in the promoters of nuclear genes encoding components of the oxidative phosphorylation (OxPhos) machinery from both Arabidopsis and rice.
Welchen and Gonzalez (2005)
MYB1AT WAACCCA MYB recognition site found in the promoters of the dehydration-responsive gene rd22 and many other genes in Arabidopsis
Abe et al. (2003)
WBOXATNPR1 TTGAC "W-box" found in promoter of Arabidopsis NPR1 gene; recognized specifically by salicylic acid (SA)-induced WRKY DNA binding proteins
Yu et al. (2001)
NODCON1GM AAAGAT One of two putative nodulin consensus sequences; seen in the promoter of the leghaemoglobin gene VfLb29
Sandal et al. (1987);
-10PEHVPSBD TATTCT "-10 promoter element" found in the barley (H.v.) chloroplast psbD gene promoter; Involved in the expression of the plastid gene psbD which encodes a photosystem II reaction center chlorophyll-binding protein
Thum et al. (2001)
POLASIG1 AATAAA "PolyA signal"; poly A signal found in legA gene of pea, rice alpha-amylase; Near upstream elements (NUE) in Arabidopsis.
Loke et al. (2005)
LEA3 RAV1AAT/RAV1BAT CAACA/CACCTG
Binding consensus sequence of Arabidopsis transcription factor, RAV1; The expression level of RAV1 was relatively high in rosette leaves and roots.
Kagaya et al. (1999)
DRECRTCOREAT RCCGAC Core motif of DRE/CRT (dehydration-responsive element/C-repeat) cis-acting element found in many genes in Arabidopsis and in rice.
Dubouzet et al. (2003); Qin et al. (2004) MYB2AT TAACTG Binding site for ATMYB2, an Arabidopsis MYB homolog. ATMYB2 is
involved in regulation of genes that are responsive to water stress in Arabidopsis.
Urao et al. (1993)
MYB1AT WAACCA MYB recognition site found in the promoters of the dehydration-responsive gene rd22 and many other genes in Arabidopsis.
Abe et al. (2003)
-10PEHVPSBD TATTCT "-10 promoter element" found in the barley (H.v.) chloroplast psbD gene promoter; Involved in the expression of the plastid gene psbD which encodes a photosystem II reaction center chlorophyll-binding protein that is activated by blue, white or UV-A light.
Thum et al. (2001)
86
86
80
Promoter SNPs and gene expression
Gene expression data was obtained for these genes using quantitative real-time
PCR (qRT-PCR) to study the effect of promoter SNPs on expression of the respective
genes. Some of the SNPs in the putative TFBS had a subtle effect on the expression. One
SNP in a putative TFBS in LIM1 gene promoter showed small differences on the
expression of LIM1. The clones with the binding site for NODCON2GM/
OSE2ROOTNODULE had 1.6-fold higher average expression than the clones without
the binding site. The clones heterozygous at that SNP position had the average
expression closer to the clones with the binding site. This SNP also belongs to a
MYCCONSENSUSAT/ EBOXBNNAPA cis-element that overlaps the previous
element. Four clones were homozygous for the SNP with the binding site, 12 were
heterozygous and 8 were homozygous for the SNP without the binding site. Two other
LIM1 promoter SNPs had the same profile across the 24 clones. Although these two
SNPs are not present in any known putative TFBS in PLACE database, they might be
part of an unknown cis-element.
One clone with a SNP that results in a TBOXATGAPB cis-element in the MOR1
promoter has a 3-fold higher expression of the gene than the average expression of the
clones without the cis-element. The same clone has another SNP eleven bases
downstream to the previous SNP which deletes a CCAATBOX1 cis-element. The
CCAATBOX1 binding element is seen in the promoters of most heat shock proteins and
MOR1 gene expression is affected by temperature (Kawamura et al. 2008). Therefore
87
87
80
CCAATBOX1 might be a functional binding site for the transcription factors involved in
regulation of heat shock proteins and thus affecting the expression of MOR1.
One clone with a SNP that removes the QELEMENTZMZM13 and
WBOXNTERF3 cis-elements in the OBF5 promoter has a 2.3-fold lower expression of
the gene than the average expression of the clones with the cis-element.
QELEMENTZMZM13 has been involved in expression enhancing activity of the ZM13
gene in maize (Hamilton et al 1998). WBOXNTERF3 is found in the promoter region of
a transcriptional repressor ERF3 gene in tobacco and is hypothesized to be involved in
activation of ERF3 gene by wounding (Nishiuchi et al. 2004.)
A clone with a SNP that removes the S1FSORPL21 and
SURECOREATSULTR11 cis-elements in the MYB8 promoter has a 4-fold lower
expression of the gene than the average expression of the clones with the cis-element.
S1FSORPL21 is a negative element and might play a role in down-regulating RPL21
promoter activity (Lagrange et al. 1993). SURECOREATSULTR11 is a sulfur-
responsive element, conferring sulfur deficiency response in Arabidopsis roots
(Maruyama-Nakashita et al. 2005). It also contains an auxin response factor binding
sequence in it. Clones with a SNP in the -300ELEMENT in the MYB2 promoter have
7.5-fold higher average expression than the clone with the cis-element. The -
300ELEMENT is a cis-element present in the promoters of the B-hordein gene of barley
and the alpha-gliadin, gamma-gliadin, and low molecular weight glutenin genes of
wheat.
88
88
80
Two out of 24 plants have a GT1CONSENSUS binding site in the PtMyb15
promoter. Plants with the binding site (GGAAAA) have 2-fold higher expression of
PtMyb15 when compared to plants with no binding site (GCCAAA). One of these SNPs
overlaps with another cis-element, CCAATBOX1. Plants with the CCAATBOX1
binding site have 2-fold higher expression of PtMyb15 when compared to plants with no
binding site.
Out of the 24 clones used for SNP discovery, most of the SNPs were present in
only one or two clones. Therefore, all of these SNPs are being genotyped in the entire
association population. Once we get this SNP genotype data it will be compared with the
gene expression data to see if the SNPs had any effects on the gene expression. The
promoter SNP genotype data will also be used in association analyses to determine if
these SNPs have any associations with the expression of other genes.
The effect of promoter mutations can be very subtle and not every promoter
sequence variation affects transcriptional regulation. In addition, promoter mutation
analysis is complex, and the assays that are needed to investigate the functional
relationship between the mutation and a phenotype are laborious and difficult to
perform. The promoter region can have a large number of SNPs and it is a very difficult
task to determine the SNPs that have a functional regulatory role. Comparing the SNP
profile across a population with its gene expression will help us to discover the SNPs
that play a role in the expression. However, identifying functional binding sites requires
biochemical data and in vitro and in vivo functional assays. Electrophoretic mobility
shift and supershift assays can be used to identify trans-acting proteins that putatively
89
89
80
interact with the promoter region of interest. Chromatin immunoprecipitation assays can
be used to confirm in vivo binding of these proteins to the promoter.
Identification of genes and gene variants controlling wood quality traits is an
important objective in many forest tree breeding programs and we expect the results
from the promoter SNP association studies will be helpful in learning more about
regulation of wood development genes in conifers.
90
90
80
CHAPTER V
CONCLUSIONS
Gene expression analyses using native populations can contribute to the
understanding of plant development and adaptation in multiple ways. Association
mapping utilizes the genetic diversity of natural populations to identify genes
responsible for quantitative variation of complex traits. The study is an effort to
determine how gene expression phenotypes differ between genotypes and to what extent
the phenotypic differences are associated with specific genetic polymorphisms.
In Chapter II, variation in gene expression for 111 xylem development genes in 400
individuals of loblolly pine (Pinus taeda L.) from across the natural range was analyzed
using quantitative real-time PCR (qRT-PCR). Considerable variation in expression of
xylem-related genes was observed. Genes encoding lignin biosynthetic enzymes and
arabinogalactan-proteins were more variable than those encoding cellulose synthases or
those involved in signal transduction. In clustering analysis, several groups of genes with
related functions formed clusters. The cluster analysis using clones did not result in
discrete populations but did identify some expression differences between regions. A
gene network analysis identified transcription factors that may be key regulators of
xylem development in pine. SND1 (Secondary wall-associated NAC domain protein 1)
in particular appears to be involved in the regulation of many other genes. In Chapter III,
candidate-gene based association analyses were used to associate single nucleotide
91
91
80
polymorphisms (SNPs) in candidate genes with the variation in gene expression.
Association studies were performed using 3937 SNPs and the gene expression data. A
general linear model (GLM) approach, which takes the underlying population structure
into consideration, was used to discover the significant associations. After correction for
multiple testing using the FDR (False discovery rate) method, significant associations (p
< 0.05) were observed for 81SNPs with the expression data of 33 xylem development
genes. In Chapter IV, promoters of 19 genes thought to be involved in wood
development or drought response were sequenced using genome walking. Thirteen of
these promoters were later sequenced in 24 loblolly pine clones to identify promoter
polymorphisms. We identified 117 SNPs and 5 INDELs in these promoters and using
the PLACE database we identified 55 polymorphisms that fall in putative cis-elements in
the promoters. These promoter polymorphisms are being genotyped at the UC Davis
Genome Center in an association population of approximately 400 clones from regions
covering most of the natural range of loblolly pine. This SNP genotype data will be used
to perform association studies with the expression of 200 wood development and stress
response genes.
The results from this project are promising and once these associations have been
validated, we believe that they will help our understanding of the genetics of complex
traits and development of functional molecular markers that can be applied successfully
in tree improvement programs. The analysis of loblolly pine transcription factor
promoters may provide insight into the molecular mechanisms of gene expression,
evolution, natural variation and adaptation.
92
92
80
REFERENCES
Abe H, Urao T, Ito T, Seki M, Shinozaki K, Yamaguchi-ShinozakiK (2003) Arabidopsis
AtMYC2 (bHLH) and AtMYB2 (MYB) function as transcriptional activators in
abscisic acid signaling. Plant Cell 15:63-78
Allona I, Quinn M, Shoop E, Swope K, St Cyr S, Carlis J, Riedl J, Retzel E, Campbell
MM, Sederoff R, Whetten R (1998) Analysis of xylem formation in pine by
cDNA sequencing. Proc Natl Acad Sci USA 95:9693-9698
Alonso-Blanco C, Mendez-Vigo B, Koornneef M (2005) From phenotypic to molecular
polymorphisms involved in naturally occurring variation of plant development.
Int J Dev Biol 49:717-732
Alonso-Blanco C, Arts MGM, Bentsink L, Keurentjes JJB, Reymond M, Vreugdenhil D,
Koornneef M (2009) What has natural variation taught us about plant
development, physiology, and adaptation. Plant Cell 21:1877-1896
Al-Rabab'ah MA, Williams CG (2002) Population dynamics of Pinus taeda L. based on
nuclear microsatellites. For Ecol Manage 163:263-271
Altschul SF, Gish W, Miller W, Myers EW, Lipman DJ (1990) Basic local alignment
search tool. J Mol Biol 215:403-410
Amir R, Hacham Y, Galili G (2002) Cystathionine -synthase and threonine synthase
operate in concert to regulate carbon flow towards methionine in plants. Trends
Plant Sci 7:153-156
Amthor J (2003) Efficiency of lignin biosynthesis: a quantitative analysis. Annals of
Botany 91:673-695
Andersson-Gunneras S, Mellerowicz EJ, Love J, Segerman B, Ohmiya Y, Coutinho PM,
Nilsson P, Henrissat B, Moritz T, Sundberg B (2006) Biosynthesis of cellulose-
enriched tension wood in Populus:global analysis of transcripts and metabolites
identifies biochemical and developmental regulators in secondary wall
biosynthesis. Plant J 45:144-165
Atwell S, Huang YS, Vilhjálmsson BJ, Willems G et al (2010) Genome-wide association
study of 107 phenotypes in Arabidopsis thaliana inbred lines. Nature 465:627-
631
93
93
80
Auger DL, Gray AD, Ream TS, Kato A, et al (2005) Nonadditive gene expression in
diploid and triploid hybrids in maize. Genetics 169:389-397
Baima S, Possenti M, Matteucci A, Wisman E, Altamura MM, Ruberti I, Morelli G
(2001) The Arabidopsis ATHB-8 HD-zip protein acts as a differentiation-
promoting transcription factor of the vascular meristems. Plant Physiol 126:643-
655
Bansal M, Belcastro V, Ambesi-Impiombato A, di Bernardo D (2007) How to infer gene
networks from expression profiles. Mol Syst Biol 3:78-87
Bao W, O'Malley DM, Whetten R, Sederoff RR (1993) A laccase associated with
lignification in loblolly pine xylem. Science 260:672-674
Baranowskij N, Frohberg C, Prat S, Willmitzer L (1994) A novel DNA binding protein
with homology to Myb oncoproteins containing only one repeat can function as a
transcriptional activator. EMBO J 13:5383-5392
Basso K, Margolin AA, Stolovitzky G, Klein U, Dalla-Favera R, Califano A (2005)
Reverse engineering of regulatory networks in human B cells. Nat Genet 37:382-
390
Bate N, Twell D (1998) Functional architecture of a late pollen promoter: pollen-specific
transcription is developmentally regulated by multiple stage-specific and co-
dependent activator elements. Plant Mol Biol 37:859-869
Baumann K, De Paolis A, Costantino P, Gualberti G (1999) The DNA binding site of the
Dof protein NtBBF1 is essential for tissue-specific and auxin-regulated
expression of the rolB oncogene in plants. Plant Cell 11:323-333
Bedon F, Grima-Pettenati J, Mackay J (2007) Conifer R2R3-MYB transcription factors:
sequence analysis and gene expression in wood-forming tissues of white spruce
(Picea glauca). BMC Plant Biol 7:17
Benfey PN, Mitchell-Olds T (2008) From clone to phenotype: systems biology meets
natural variation. Science 320:495-497
Blount JW, Korth KL, Masoud SA, Rasmussen S, Lamb C, Dixon RA (2000) Altering
expression of cinnamic acid 4-hydroxylase in transgenic plants provides evidence
for a feedback loop at the entry point into the phenylpropanoid pathway. Plant
Physiol 122:107-16
Boerjan W, Ralph J, Baucher M (2003) Lignin biosynthesis. Annu Rev Plant Biol
54:519-546
94
94
80
Bomal C, Bedon F, Caron S, Mansfield SD, Levasseur C, Cooke JE, Blais S, Tremblay
L, Morency MJ, Pavy N, Grima-Pettenati J, Séguin A, Mackay J (2008)
Involvement of Pinus taeda MYB1 and MYB8 in phenylpropanoid metabolism
and secondary cell wall biogenesis: a comparative in planta analysis. J Exp Bot
59:3925-3939
Bonke M, Thitamadee S, Mähönen AP, Hauser MT, Helariutta Y (2003) APL regulates
vascular tissue identity in Arabidopsis. Nature 400:181-186
Boyle B, Dallaire N, MacKay J (2009) Evaluation of the impact of single nucleotide
polymorphisms and primer mismatches on quantitative PCR. BMC Biotech 9:75-
90
Brem RB, Yvert G, Clinton R, Kruglyak L (2002) Genetic dissection of transcriptional
regulation in budding yeast. Science 296:752-755
Brown GR, Bassoni DL, Gill GP, Fontana JR, Wheeler NC, Megraw RA, Davis MF,
Sewell MM, Tuskan GA, Neale DB (2003) Identification of quantitative trait loci
influencing wood property traits in loblolly pine (Pinus taeda L.). III. QTL
verification and candidate gene mapping. Genetics 164:1537-1546
Brown GR, Gill GP, Kuntz R, Langley CH, Neale DB (2004) Nucleotide diversity and
linkage disequilibrium in loblolly pine. Proc Natl Acad Sci USA 42:15255-15260
Burk DH, Ye ZH (2002) Alteration of oriented deposition of cellulose microfibrils by
mutation of a katanin-like microtubule-severing protein. Plant Cell 14:2145-2160
Chaffey N (1999) Cambium: old challenges - new opportunities. Trees 13:138-151
Chakravarthy S, Tuori RP, DAscenzo MD, Fobert PR, Despres C, Martin GB (2003)
The tomato transcription factor Pti4 regulates defence-related gene expression
via GCC box and non-GCC box cis-elements. Plant Cell 15:3033-3050
Chamary JV, Parmley JL, Hurst LD (2006) Hearing silence: non-neutral evolution at
synonymous sites in mammals. Nat Rev Genet 7:98-108
Chan CS, Guo L, Shih MC (2001) Promoter analysis of the nuclear gene encoding the
chloroplast glyceraldehyde-3-phosphate dehydrogenase B subunit of Arabidopsis
thaliana. Plant Mol Biol 46:131-141
Chang S, Puryear J, Cairney JA (1993) Simple and efficient method for isolating RNA
from pine trees. Plant Mol Biol Rep 11:114-117
95
95
80
Cheung VG, Conlin LK, Weber TM, Arcaro M, Jen KY, Morley M, Spielman RS
(2003) Natural variation in human gene expression assessed in lymphoblastoid
cells. Nat Gen 33:422 -425
Chiapello H, Lisacek F, Caboche M, Hénaut A (1998) Codon usage and gene function
are related in sequences of Arabidopsis thaliana. Gene 209:1-38
Chinnusamy V, Schumaker K, Zhu JK (2004) Molecular genetic perspectives on cross-
talk and specificity in abiotic stress signalling in plants. J Exp Bot 55:225-236
Cho HT, Cosgrove DJ (2000) Altered expression of expansin modulates leaf growth and
pedicel abscission in Arabidopsis thaliana. Proc Natl Acad Sci USA 97:9783-
9788
Collings DA, Gebbie LK, Howles PA, Hurley UA, Birch RJ, Cork AH, Hocart CH,
Arioli T, Williamson RE (2008) Arabidopsis dynamin-like protein DRP1A:A
null mutant with widespread defects in endocytosis, cellulose synthesis,
cytokinesis, and cell expansion. J Exp Bot 59:361-376
Collins FS, Guyer MS, Charkravarti A (1997) Variations on a theme: cataloging human
DNA sequence variation. Science 278:1580-81
Davidson EH (2001) Genomic regulatory systems: development and evolution.
Academic Press, San Diego, Calif
Davin LB, Bedgar DL, Katayama T, Lewis NG (1992) On the stereoselective synthesis
of (π)-pinoresinol in Forsythia suspensa from its achiral precursor, coniferyl
alcohol. Phytochem 31:3869-3874
de Vooght KMK, van Wijk R, van Solinge WW (2009) Management of gene promoter
mutations in molecular diagnostics. Clinical Chem 55:698-708
Dean JFD, Eriksson K-EL (1994) Laccase and the deposition of lignin in vascular plants.
Holzforschung 48:21-33
Despres C, Chubak C, Rochon A, Clark R, Bethune T, Desveaux D, Fobert PR (2003)
The Arabidopsis NPR1 disease resistance protein is a novel cofactor that confers
redox regulation of DNA binding activity to the basic domain/leucine zipper
transcription factor TGA1. Plant Cell 15:2181-2191
Dhugga K, Barreiro R, Whitten B, Stecca K, Hazebroek J, Randhawa G, Dolan M,
Kinney A, Tomes D, Nichols S, Anderson P (2004) Guar seed β-mannan
synthase is a member of the cellulose synthase super gene family. Science
303:363-366
96
96
80
Díaz ML, Garbus I, Echenique V (2010) Allele-specific expression of a weeping
lovegrass gene from the lignin biosynthetic pathway, caffeoyl-coenzyme A 3-O-
methyltransferase. Mol Breeding DOI 101007/s11032-010-9399-z
Doebley J, Lukens L (1998) Transcriptional regulators and the evolution of plant form.
Plant Cell 10:1075-1082
Doyle JJ, Doyle JL (1987) A rapid DNA isolation procedure for small quantities of fresh
leaf tissue. Phytochem Bull 19:11-15
Dubouzet JG, Sakuma Y, Ito Y, Kasuga M, Dubouzet EG, Miura S, Seki M, Shinozaki
K, Yamaguchi-Shinozaki K (2003) OsDREB genes in rice, Oryza sativa L,
encode transcription activators that function in drought-, high-salt- and cold-
responsive gene expression. Plant J 33:751-763
Dunn MA, White AJ, Vural S, Hughes MA (1998) Identification of promoter elements
in a low-temperature-responsive gene (blt49) from barley (Hordeum vulgare L).
Plant Mol Biol 38:551-564
Eckert AJ, Ersoz ES, Pande B, Wright MH, Rashbrook VK, Nicolet CM, Neale DB
(2009) High-throughput genotyping and mapping of single nucleotide
polymorphisms in loblolly pine (Pinus taeda L). Tree Genetics and Genomes
5:225-234
Eckert AJ, van Heerwaarden J, Wegrzyn JL, Nelson CD, Ross-Ibarra J, González-
Martínez SC, Neale DB (2010) Patterns of population structure and
environmental associations to aridity across the range of loblolly pine (Pinus
taeda L, Pinaceae). Genetics 101534/genetics110115543
ElSharawy A, Manaster C, Teuber M, Rosenstiel P, Schreiber S et al (2006)
SNPSplicer:systematic analysis of SNP-dependent splicing in genotyped cDNAs.
Hum Mutat 27:1129-1134
Falush D, Stephens M, Pritchard JK (2003) Inference of population structure using
multilocus genotype data: linked loci and correlated allele frequencies. Genetics
164:1567-1587
Faniello MC, Fregola A, Nistico A, Quaresima B, Crugliano T, Faraonio R, Puzzonia P,
Baudi F, Parlato G, Cuda G, et al (2006) Detection and functional analysis of an
SNP in the promoter of the human ferritin H gene that modulates the gene
expression. Gene 377:1-5
Fiume E, Christou P, Gianı` S, Breviario D (2004) Introns are key regulatory elements of
rice tubulin expression. Planta 218:693-703
97
97
80
Freudenberg K, Harkin JM, Rechert M, Fukuzumi T (1958) Die an der Verholzung
beteiligten Enzyme die Dehydrierung des Subaoinalkohols. Chem Ber 91:581-
590
Friedman N (2004) Inferring cellular networks using probabilistic graphical models.
Science 303:799-805
Friedmann M, Ralph SG, Aeschliman D, Zhuang J, Ritland K, Ellis BE, Bohlmann J,
Douglas CJ (2007) Microarray gene expression profiling of developmental
transitions in Sitka spruce (Picea sitchensis) apical shoots. J Exp Bot 58:593-614
Fu D, Szucs P, Yan L, Helguera M, Skinner JS, von Zitzewitz J Hayes PM, Dubcovsky
J (2005) Large deletions within the first intron in VRN-1are associated with
spring growth habit in barley and wheat. Mol Gen Genomics 273:54-65
Fukuda H (1997) Tracheary element differentiation. Plant Cell 9:1147-1156
Gälweiler L, Guan C, Muller A, Wisman E, Mendgen K, Yephremov A, Palme K (1998)
Regulation of polar auxin transport by AtPIN1 in Arabidopsis vascular tissue.
Science 282:2226-2230
Ganal MW, Altmann T, Roder MS (2009) SNP identification in crop plants. Curr Opin
Plant Biol 12:211-217
Gang DR, Kasahara H, Xia ZQ, Mijnsbrugge KV, Bauw G, Boerjan W, Van Montagu
M, Davin LB, Lewis NG (1999) Evolution of plant defense mechanisms:
relationships of phenylcoumaran benzylic ether reductases to pinoresinol-
lariciresinol and isoflavone reductases. J Biol Chem 274:7516-7527
Gasser SM, Amati BB, Cardenas ME, Hofmann JFX (1989) Studies on scaffold
attachment sites and their relation to genome function. Int Rev Cyto 119:57-96
Gill GP, Brown GR, Neale DB (2003) A sequence mutation in cinnamyl alcohol
dehydrogenase gene associated with altered lignification in loblolly pine. Plant
Biotech J 1:253-258
Giuliano G, Pichersky E, Malik VS, Timko MP, Scolnik PA, Cashmore AR (1988) An
evolutionarily conserved protein binding sequence upstream of a plant light-
regulated gene. Proc Natl Acad Sci USA 85:7089-7093
González-Martínez,SC, Ersoz E, Brown GR, Wheeler NC, Neale DB (2006) DNA
sequence variation and selection of tag single-nucleotide at candidate genes for
drought-stress response in Pinus taeda L. Genetics 172:1915-1926
98
98
80
González-Martínez SC, Wheeler NC, Ersoz E, Nelson DC, Neale DB (2007) Association
genetics in Pinus taeda L. I. Wood property traits. Genetics 175:399-409
Goujon T, Sibout R, Eudes A, Mackay J, Jouanin L (2003) Genes involved in the
biosynthesis of lignin precursors in Arabidopsis thaliana. Plant Physiol Biochem
41:677-687
Grace ML, Chandrasekharan MB, Hall TC, Crowe AJ (2004) Sequence and spacing of
TATA box elements are critical for accurate initiation from the beta-phaseolin
promoter. J Biol Chem 279:8102-8110
Gray-Mitsumune M, Mellerowicz EJ, Abe H, Schrader J, Winzéll A, Sterky F,
Blomqvist K, McQueen-Mason S, Teeri TT, Sundberg B (2004) Expansins
abundant in secondary xylem belong to subgroup A of the α-expansin gene
family. Plant Physiol 135:1552-1564
Green PJ, Yong M-H, Cuozzo M, Kano-Murakami Y, Silverstein P, Chua N-H (1988)
Binding site requirements for pea nuclear protein factor GT-1 correlate with
sequences required for light-dependent transcriptional activation of the rbcS-3A
gene. EMBO J 7:4035-4044
Gupta PK, Lee KH (2008) Silent mutations result in HlyA hypersecretion by reducing
intracellular HlyA protein aggregates. Biotechnol Bioeng 101:967-974
Gupta PK, Rustgi S, Kulwal PL (2005) Linkage disequilibrium and association studies
in higher plants: present status and future prospects. Plant Mol Biol 57:461-485
Hamilton DA, Schwarz YH, Mascarenhas JP (1998) A monocot pollen-specific
promoter contains separable pollen-specific and quantitative elements. Plant Mol
Biol 38:663-669
Hamrick JL, Godt MJW (1996) Effects of life history traits on genetic diversity in plant
species. Phil Trans R Soc London B 351:1291-1298
Han K-H, Ko J-H, Yang SH (2007) Optimizing lignocellulosic feedstock for improved
biofuel productivity and processing. Biofuels Bioprod Biorefining 1:135-146
Hartemink A (2005) Reverse engineering gene regulatory networks. Nat Biotech 23:554-
555
Higo K, Ugawa Y, Iwamoto M, Korenaga T (1999) Plant cis-acting regulatory DNA
elements (PLACE) database: 1999. Nucleic Acids Res 27:297-300
Higuchi T (1997) Biochemistry and molecular biology of wood. Springer, New York

99
99
80
Hong JC, Cheong YH, Nagao RT, Bahk JD, Key JL, Cho MJ (1995) Isolation of two
soybean G-box binding factors which interact with G-box sequences of an auxin-
responsive gene. Plant J 8:199-211
Horikawa Y, Oda N, Cox NJ, Li X, Bell GI et al (2000) Genetic variation in the gene
encoding calpain-10 is associated with type 2 diabetes mellitus. Nat Genet
26:163-175
Hruschka ER, Campello RJGB, de Castro LN (2006) Evolving clusters in gene-
expression data. Inf Sci176:1898-1927
Hwang YS, Karrer EE, Thomas BR, Chen L, Rodriguez RL (1998) Three cis-elements
required for rice alpha-amylase Amy3D expression during sugar starvation. Plant
Mol Biol 36:331-341
Inaba K, Fujiwara T, Hayashi H, Chino M, Komeda Y, Naito S (1994) Isolation of an
Arabidopsis thaliana mutant, mto1, that overaccumulates soluble methionine.
Plant Physiol 104:881-887
Jansen RC, Nap JP (2001) Genetical genomics: the added value from segregation.
Trends Genet 17:388-391
Jauh GY, Lord EM (1996) Localization of pectins and arabinogalactan-proteins in lily
(Lilium longiflum L) pollen tube and style, and their possible roles in pollination.
Planta 199:251-261
Johnson KL, Jones BJ, Bacic A, Schultz CJ (2003) The fasciclin-like arabinogalactan
proteins of Arabidopsis. A multigene family of putative cell adhesion molecules.
Plant Physiol 133:1911-1925
Jolliffe IT (2002) Principal component analysis. 2nd ed, Springer series in statistics.
Springer, New York
Kagaya Y, Ohmiya K, Hattori T (1999) RAV1, a novel DNA-binding protein, binds to
bipartite recognition sequence through two distinct DNA-binding domains
uniquely found in higher plants. Nucleic Acids Res 27:470-478
Kamiya N, Nagasaki H, Morikami A, Sato Y, Matsuoka M (2003) Isolation and
characterization of a rice WUSCHEL-type homoebox gene that is specifically
expressed in the central cells of a quiescent center in the root apical meristem.
Plant J 35:429-441
100
100
80
Kamiyama M, Kobayashi M, Araki S, Iida A, Tsunoda T, et al (2007) Polymorphisms in
the 3′UTR in the neurocalcin delta gene affect mRNA stability, and confer
susceptibility to diabetic nephropathy. Hum Genet 122:397-407
Kang BH, Busse JS, Dickey C, Rancour DM, Bednarek SY (2001) The Arabidopsis cell
plate-associated dynamin-like protein, ADL1Ap, is required for multiple stages
of plant growth and development. Plant Physiol 126:47-68
Kaothien P, Kawaoka A, Ebinuma H, Yoshida K, Shinmyo A (2002) Ntlim1, a PAL-box
binding factor, controls promoter activity of the horseradish wound-inducible
peroxidase gene. Plant Mol Biol 49:591-599
Kapoor S, Sugiura M (1999) Identification of two essential sequence elements in the
nonconsensus type II PatpB-290 plastid promoter by using plastid transcription
extracts from cultured tobacco BY-2 cells. Plant Cell 11:1799-1810
Katz YS, Galili G, Amir R (2006) Regulatory role of cystathionine- -synthase and de
novo synthesis of methionine in the ethylene production during tomato fruit
ripening. Plant Mol Biol 61:255-268
Kawamura E, Wasteneys GO (2008) MOR1, the Arabidopsis thaliana homologue of
Xenopus MAP215, promotes rapid growth and shrinkage, and suppresses the
pausing of microtubules in vivo. J Cell Sci 121:4114-4123
Kawaoka A, Kaothien P, Yoshida K, Endo S, Yamada K, Ebinuma H (2000) Functional
analysis of tobacco LIM protein Ntlim1 involved in lignin biosynthesis. Plant J
22:289-301
Keurentjes JJB, Sulpice R (2009) The role of natural variation in dissecting genetic
regulation of primary metabolism. Plant Signal Behav 4:244-246
Kieliszewski MJ, Lamport DTA (1994) Extensin:repetitive motifs, functional sites, post-
translational codes, and phylogeny. Plant J 5:157-172
Kirst M, MYBurg AA, De Leon JP, Kirst ME, Scott J, Sederoff R (2004) Coordinated
genetic regulation of growth and lignin revealed by quantitative trait locus
analysis of cDNA microarray data in an interspecific backcross of eucalyptus.
Plant Physiol 135:2368-2378
Konopka CA, Backues SK, Bednarek SY (2008) Dynamics of Arabidopsis dynamin-
related protein 1C and a clathrin light chain at the plasma membrane. The Plant
Cell 20:1363-1380
101
101
80
Koutaniemi S, Warinowski T, Kärkönen A, Alatalo E, Fossdal CG, Saranpää P, Laakso
T, Fagerstedt KV, Simola LK, Paulin L, Rudd S, Teeri TH (2007) Expression
profiling of the lignin biosynthetic pathway in Norway spruce using EST
sequencing and real-time RT-PCR. Plant Mol Biol 65:311-328
Lacombe E, Van Doorsselaere J, Boerjan W, Boudet AM, Grima-Pettenati J (2000)
Characterization of cis-elements required for vascular expression of the
cinnamoyl CoA reductase gene and for protein-DNA complex formation. Plant J
23:663-676
Lafarguette F, Leple JC, Dejardin A, Laurans F, Costa G, Lesage-Descauses MC, Pilate
G (2004) Poplar genes encoding fasciclin-like arabinogalactan proteins are
highly expressed in tension wood. New Phytol 164:107-121
Lander ES, Schork NJ (1994) Genetic dissection of complex traits. Science 265:2037-
2048
Le Gourrierec J, Li YF, Zhou DX (1999) Transcriptional activation by Arabidopsis GT-
1 may be through interaction with TFIIA-TBP-TATA complex. Plant J 18:663-
668
LeBude AV, Goldfarb B, Blazich FA, Wise FC, Frampton Jr LJ (2004) Mist, medium
water potential, and cutting water potential influence rooting of stem cuttings of
loblolly pine. Tree Physiol 24:823-831
Ledig FT (1998) Genetic variation in Pinus. In D M Richardson [ed], Ecology and
biogeography of Pinus, 251-280 Cambridge University Press, Cambridge
Lee I, Ambaru B, Thakkar P, Marcotte EM, Rhee SY (2010) Rational association of
genes with traits using a genome-scale gene network for Arabidopsis thaliana.
Nat Biotech 28:149-156
Lessard PA, Allen RD, Bernier F, Crispino JD, Fujiwara T, Beachy RN (1991) Multiple
nuclear factors interact with upstream sequences of differentially regulated beta-
conglycinin genes. Plant Mol Biol 16:397-413
Levesque R (2007) SPSS programming and data management: A guide for SPSS and
SAS users, 4th Ed, SPSS Inc, Chicago Il
Li L, Popko JL, Zhang XH, Osakabe K, Tsai CJ, Joshi CP, Chiang VL (1997) A novel
multifunctional O-methyltransferase implicated in a dual methylation pathway
associated with lignin biosynthesis in loblolly pine. Proc Natl Acad Sci USA
94:5461-5466
102
102
80
Li L, Osakabe Y, Joshi CP, Chiang VL (1999) Secondary xylem- specific expression of
caffeoyl-coenzyme A 3-O-methyltransferase plays an important role in the
methylation pathway associated with lignin biosynthesis in loblolly pine. Plant
Mol Biol 40:555-565
Limson J, Nyokong T, Daya S (1998) The interaction of melatonin and its precursors
with aluminium, cadmium, copper, iron, lead, and zinc:an adsorptive
voltammetric study. J Pineal Res 24:15-21
Linhart YB, Grant MC (1996) Evolutionary significance of local genetic differentiation
in plants. Annu Rev Ecol Syst 27:237-277
Little EL Jr (1971) Atlas of United States trees, Vol 1, Conifers and important
hardwoods: US Dept Agri Misc Pub 1146, US Government Printing Office,
Washington DC
Liu F, Xu W, Wei Q, Zhang Z, Xing Z, et al 2010 Gene expression profiles
deciphering rice phenotypic variation between Nipponbare (Japonica) and 93-11
(Indica) during oxidative stress. PLoS ONE 5(1):e8632
doi:101371/journalpone0008632
Liu H, He R, Zhang H, Huang Y, Tian M, Zhang J (2010) Analysis of synonymous
codon usage in Zea mays. Mol Biol Rep 37:677-684
Liu Q, Feng Y, Zhao X, Dong H, Xue Q (2004) Synonymous codon usage bias in Oryza
sativa. Plant Sci 167:101-105
Loke JC, Stahlberg EA, Strenski DG, Haas BJ, Wood PC, Li QQ (2005) Compilation of
mRNA polyadenylation signals in Arabidopsis revealed a new signal element
and potential secondary structures. Plant Physiol 138:1457-1468
Loopstra CA, Sederoff RR (1995) Xylem-specific gene expression in loblolly pine. Plant
Mol Biol 27:277-291
Loopstra CA, Puryear JD, No EG (2000) Purification and cloning of an arabinogalactan-
protein from xylem of loblolly pine. Planta 210:686-689
Lorenz WW, Dean JFD (2002) SAGE profiling and demonstration of differential gene
expression along the axial developmental gradient of lignifying xylem in loblolly
pine (Pinus taeda). Tree Physiol 22:301-310
Luo H, Song F, Goodman RM, Zheng Z (2005) Up-regulation of OsBIHD1, a rice gene
encoding BELL homeodomain transcriptional factor, in disease resistance
responses. Plant Biol 7:459-468
103
103
80
Ma PCH, Chan KCC (2008) Inferring gene regulatory networks from expression data by
discovering fuzzy dependency relationships. IEEE Transactions on Fuzzy
Systems 16:455-465
MacKay JJ, Liu W, Whetten R, Sederoff RR, O‟Malley DM (1995) Genetic analysis of
cinnamyl alcohol dehydrogenase in loblolly pine: single gene inheritance,
molecular characterization and evolution. Mol Gen Genet 247:537-545
MacKay JJ, O‟Malley DM, Presnell T, Booker FL, Campbell MM, Whetten RW,
Sederoff RR (1997) Inheritance, gene expression, and lignin characterization in a
mutant pine deficient in cinnamyl alcohol dehydrogenase. Proc Natl Acad Sci
USA 95:13330-3335
Martin C, Paz-Ares J (1997) Myb transcription factors in plants. Trends Genet 13:67-73
Maruyama-Nakashita A, Nakamura Y, Watanabe-Takahashi A, Inoue E, Yamaya T,
Takahashi H (2005) Identification of a novel cis-acting element conferring sulfur
deficiency response in Arabidopsis roots. Plant J 42:305-314
McCarthy MI, Abecasis GR, Cardon LR, Goldstein DB, Little J, et al (2008) Genome-
wide association studies for complex traits: consensus, uncertainty and
challenges. Nature Rev Genet 9:356-369
Mellerowicz EJ, Sundberg B (2008) Wood cell walls: biosynthesis, developmental
dynamics and their implications for wood properties. Curr Opin Plant Biol 11:
293-300
Mena M, Cejudo FJ, Isabel-Lamoneda I, Carbonero P (2002) A role for the DOF
transcription factor BPBF in the regulation of gibberellin-responsive genes in
barley aleurone. Plant Physiol 130:111-119
Mikami K, Tabata T, Kawata T, Nakayama T, Iwabuchi M (1987) Nuclear protein(s)
binding to the conserved DNA hexameric sequence postulated to regulate
transcription of wheat histone genes. FEBS Lett 223:273-278
Miller GM, Madras BK (2002) Polymorphisms in the 3'-untranslated region of human
and monkey dopamine transporter genes affect reporter gene expression. Mol
Psychiatry 7:44-55
Mitchell-Olds T, Willis JH, Goldstein DB (2007) Which evolutionary processes
influence natural genetic variation for phenotypic traits? Nat Rev Genet 8:845-
856
104
104
80
Mohanty B, Krishnan SP, Swarup S, Bajic VB (2005) Detection and preliminary
analysis of motifs in promoters of anaerobically induced genes of different plant
species. Ann Bot 96:669-681
Morita A, Umemura T, Kuroyanagi M, Futsuhara Y, Perata P, Yamaguchi J (1998)
Functional dissection of a sugar-repressed alpha-amylase gene (Ramy1A)
promoter in rice embryos. FEBS Lett 423:81-85
Mukhopadhyay P, Basak S, Ghosh TC (2007) Nature of selective constraints on
synonymous codon usage of rice differs in GC-poor and GC-rich genes. Gene
400:71-81
Muller M, Knudsen S (1993) The nitrogen response of a barley C-hordein promoter is
controlled by positive and negative regulation of the GCN4 and endosperm box.
Plant J 4:343-355
Murthy R, Goldfarb B (2001) Effect of handling and water stress on water status and
rooting of loblolly pine stem cuttings. New Forests 21:217-230
Nachman I, Regev A, Friedman N (2004) Inferring quantitative models of regulatory
networks from expression data. Bioinformatics 20:248-256
Nairn CJ, Haselkorn T (2005) Three loblolly pine CesA genes expressed in developing
xylem are orthologous to secondary cell wall CesA genes of angiosperms. New
Phytol 166:907-915
Neale DB, Savolainen O (2004) Association genetics of complex traits in conifers.
Trends Plant Sci 9:325-330
Needham CJ, Manfield IW, Bulpitt AJ, Gilmartin PM, Westhead DR (2009) From gene
expression to gene regulatory networks in Arabidopsis thaliana. BMC Systems
Biol 3:85-93
Newman LJ, Perazza DE, Juda L, Campbell MM (2004) Involvement of the R2R3-
MYB, At MYB61, in the ectopic lignication and dark-photomorphogenic
components of the det3 mutant phenotphype. The Plant J 37:239-250
Ng PC, Henikoff S (2006) Predicting the effects of amino acid substitutions on protein
function. Ann Rev Genomics and Human Genetics 7:61-80
Nicol F, His I, Jauneau A, Vernhettes S, Canut H, Höfte H (1998) A plasma membrane-
bound putative endo-1,4-β-D-glucanase is required for normal wall assembly and
cell elongation in Arabidopsis. EMBO J 17:5563-5576
105
105
80
Nieminen KM, Kauppinen L, Helariutta Y (2004) A weed for wood? Arabidopsis as a
genetic model for xylem development. Plant Physiol 135:653-659
Nishitani K, Tominaga T (1992) Endo-xyloglucan transferase, a novel class of
glycosyltransferase that catalyzes transfer of a segment of xyloglucan molecule
to another xyloglucan molecule. J Biol Chem 267:21058-21064
Nishiuchi T, Shinshi H, Suzuki K (2004) Rapid and transient activation of transcription
of the ERF3 gene by wounding in tobacco leaves: Possible involvement of
NtWRKYs and autorepression. J Biol Chem 279:55355-55361
Oleksiak MF, Churchill GA, Crawford DL (2002) Variation in gene expression within
and among natural populations. Nat Genet 32:261-266
Palle SR, Seeve CM, Eckert AJ, Cumbie WP, Goldfard B, Loopstra CA (2010) Natural
variation in expression of genes involved in xylem development in loblolly pine
(Pinus taeda L.). Tree genetics and genomes (In press)
Park HC, Kim ML, Kang YH, Jeon JM, Yoo JH, Kim MC, Park CY, Jeong JC, Moon
BC, Lee JH, Yoon HW, Lee SH, Chung WS, Lim CO, Lee SY, Hong JC, Cho
MJ (2004) Pathogen- and NaCl-induced expression of the SCaM-4 promoter is
mediated in part by a GT-1 box that interacts with a GT-1-like transcription
factor. Plant Physiol 135:2150-2161
Patzlaff A, McInnis S, Courtenay A, Surman C, Newman LJ, Smith C, Bevan MW,
Mansfield S, Whetten RW, Sederoff RR, Campbell MM (2003a)
Characterization of a pine MYB that regulates lignifications. Plant J 36:743-754
Patzlaff A, Newman LJ, Dubos C, Whetten RW, Smith C, McInnis S, Bevan MW,
Sederoff RR, Campbell MM (2003b) Characterization of PtMYB1, an R2R3-
MYB from pine xylem. Plant Mol Biol 53: 597-608
Paux E, Tamasloukht M, Ladouce N, Sivadon P, Grima-Pettenati J (2004) Identification
of genes preferentially expressed during wood formation in Eucalyptus. Plant
Mol Biol 55:263-280
Perrin RM, DeRocher AE, Bar-Peled M, Zeng W, Norambuena L, Orellana A, Raikhel
NV, Keegstra K (1999) Xyloglucan fucosyltransferase, an enzyme involved in
plant cell wall biosynthesis. Science 284:1976-1979
Persson S, Hairong W, Milne J, Grier O, Somerville C (2005) Identification of genes
required for cellulose synthesis by regression analysis of public microarray data
sets. Proc Natl Acad Sci USA 102:8633-8638
106
106
80
Pertea M, Lin X, Salzberg SL (2001) GeneSplicer:a new computational method for
splice site prediction. Nucleic Acids Res 29:1185-1190
Pritchard JK, Stephens M, Donnelly P (2000) Inference of population structure using
multilocus genotype data. Genetics 155:945-959
Peter G, Neale DB (2004) Molecular basis for the evolution of xylem lignifications. Curr
Opin Plant Biol 7:737-742
Piechulla B, Merforth N, Rudolph B (1998) Identification of tomato Lhc promoter
regions necessary for circadian expression. Plant Mol Biol 38:655-662
Plesch G, Ehrhardt T, Mueller-Roeber B (2001) Involvement of TAAAG elements
suggests a role for Dof transcription factors in guard cell-specific gene
expression. Plant J 28:455-464
Plomion C, Leprovost G, Stokes A (2001) Wood formation in trees. Plant Physiol
127:1513-1523
Prassinos C, Ko JH, Yang J, Han KH (2005) Transcriptome profiling of vertical stem
segments provides insights into the genetic regulation of secondary growth in
hybrid aspen trees. Plant Cell Physiol 46:1213-1225
Pritchard JK, Stephens M, Donnelly P (2000) Inference of population structure using
multilocus genotype data. Genetics 155:945-959
Qin F, Sakuma Y, Li J, Liu Q, Li YQ, Shinozaki K, Yamaguchi-Shinozaki K (2004)
Cloning and functional analysis of a novel DREB1/CBF transcription factor
involved in cold-responsive gene expression in Zea mays L. Plant Cell Physiol
45:1042-1052
Ralph J, MacKay JJ, Hatfield RD, O'Malley DM, Whetten RW, Sederoff RR (1997)
Abnormal lignin in a loblolly pine mutant. Science 277:235-239
Ram Kumar G, Sakthivel K, Sundaram RM, Neeraja CN, Balachandran SM, Shobha
Rani N, Viraktamath BC, Madhav MS (2010) Allele mining in crops: prospects
and potentials. Biotech Adv 28:451-461
Richmond RC (1970) Non-Darwinian evolution:a critique. Nature 225:1025-1028
Richmond T (2000) Higher plant cellulose sythases. Genome Biol 1:30011-30016
Richmond T, Somerville C (2000) The cellulose synthase superfamily. Plant Physiol
124:495-498
107
107
80
Rieping M, Schoffl F (1992) Synergistic effect of upstream sequences, CCAAT box
elements, and HSE sequences for enhanced expression of chimaeric heat shock
genes in transgenic tobacco. Mol Gen Genet 231:226-232
Rifkin SA, Kim J, White KP (2003) Evolution of gene expression in the Drosophila
melanogaster subgroup. Nat Genet 33:138-144
Risch N, Merikangas K (1996) The future of genetic studies of complex human diseases.
Science 273:1516-1517
Rockman MV, Wray GA (2002) Abundant raw material for cis-regulatory evolution in
humans. Mol Biol Evol 19:1991-2004
Rogers LA, Campbell MM (2004) The genetic control of lignin deposition during plant
growth and development. New Phytol 164:17-30
Rowe DB, Blazich FA, Goldfarb B, Wise FC (2002) Nitrogen nutrition of hedged stock
plants of loblolly pine II Influence of carbohydrate and nitrogen status on
adventitious rooting of stem cuttings. New Forests 24:53-65
Samadder P, Sivamani E, Lu J, Li X, Qu R (2008) Transcriptional and post-
transcriptional enhancement of gene expression by the 5′ UTR intron of rice
rubi3 gene in transgenic rice cells. Mol Genet Genomics 279:429-439
Sandal NN, Bojsen K, Marcker KA (1987) A small family of nodule specific genes from
soybean. Nucleic Acids Res 15:1507-1519
Sauna ZE, Kimchi-Sarfaty C, Ambudkar SV, Gottesman MM (2007) Silent
polymorphisms speak: how they affect pharmacogenomics and the treatment of
cancer. Cancer Res 67:9609-9612
Schadt EE, Monks SA, Drake TA et al (2003) Genetics of gene expression surveyed in
maize, mouse and man. Nature 422:297-302
Schindelman G, Morikami A, Jung J, Baskin T I, Carpita NC, Derbyshire P, McCann
MC, Benfey PN (2001) COBRA encodes a putative GPI-anchored protein, which
is polarly localized and necessary for oriented cell expansion in Arabidopsis.
Genes Dev 15:1115-1117
Schmidtling RC, Carroll E, LaFarge T (1999) Allozyme diversity of selected and natural
loblolly pine populations. Silvae Genetica 48:35-45
108
108
80
Schrader J, Nilsson J, Mellerowicz E, Berglund A, Nilsson P, Hertzberg M, Sandberg G
(2004) A high-resolution transcript profile across the wood-forming meristem of
poplar identifies potential regulators of cambial stem cell identity. Plant Cell
16:2278-2292
Sederoff RR, Campbell M, O‟Malley D, Whetten R (1994) Genetic regulation of lignin
biosynthesis and the potential modification of wood by genetic engineering in
loblolly pine. Rec Adv Phytochem 28:313-355
Serre D, Gurd S, Ge B, et al (2008) Differential allelic expression in the human
genome:a robust approach to identify genetic and epigenetic cis-acting
mechanisms regulating gene expression. PLoS Genet 4:2 e1000006
doi:101371/journalpgen1000006
Sharp PM, Stenico M, Peden JF, Lloyd AT (1993) Codon usage: mutational bias,
translational selection, or both? Biochem Soc Trans 21:835-841
Shirsat A, Wilford N, Croy R, Boulter D (1989) Sequences responsible for the tissue
specific promoter activity of a pea legumin gene in tobacco. Mol Gen Genet
215:326-331
Siebert PD, Chenchik A, Kellog DE, Lukyanov KA, Lukyanov SA (1995) An improved
PCR method for walking in uncloned genomic DNA. Nucleic Acids Res
23:1087-1088.
Simpson SD, Nakashima K, Narusaka Y, Seki M, Shinozaki K, Yamaguchi-Shinozaki K
(2003) Two different novel cis-acting elements of erd1, a clpA homologous
Arabidopsis gene function in induction by dehydration stress and dark-induced
senescence. Plant J 33:259-270
Somerville C (2006) Cellulose synthesis in higher plants. Ann Rev Cell Dev Biol 22:53-
78
Sotiriou S, Gibney G, Baxevanis AD, Nussbaum RL (2009) A single nucleotide
polymorphism in the 3'UTR of the SNCA gene encoding alpha-synuclein is a
new potential susceptibility locus for Parkinson disease. Neurosci Lett 461:196-
201
Spielman RS, Bastone LA, Burdick JT, Morley M, Ewens WJ, Cheung VG (2007)
Common genetic variants account for differences in gene expression among
ethnic groups. Nat Genet 39:226-231
Stahlberg A, Elbing K, Andrade-Garda JM, Sjogreen B, Forootan A, Kubista M (2008)
Multiway real-time PCR gene expression profiling in yeast Saccharomyces
109
109
80
cerevisiae reveals altered transcriptional response of ADH-genes to glucose
stimuli. BMC Genomics 9:170-184
Steele NM, Sulová Z, Campbell P, Braam J, Farkas V, Fry SC (2001) Ten isoenzymes of
xyloglucan endotransglycosylase from plant cell walls select and cleave the
donor substrate stochastically Biochem J 355:671-679
Steinmetz LM, Sinha H, Richards DR, Spiegelman JI, Oefner PJ, McCusker JH, Davis
RW (2002) Dissecting the architecture of a quantitative trait locus in yeast.
Nature 416:326-330
Sterky F, Regan S, Karlsson J, Hertzberg M, Rohde A, Holmberg A, Amini B, Bhalerao
R, Larsson M, Villarroel R, Van Montagu M, Sandberg G, Olsson O, Teeri TT,
Boerjan W, Gustafsson P, Uhlen M, Sundberg B, Lundeberg J (1998) Gene
discovery in the wood-forming tissues of poplar:analysis of 5692 expressed
sequence tags. Proc Natl Acad Sci USA 95:13330-13335
Storey JD (2002) A direct approach to false discovery rates. J Royal Stat Soc, Series B
64:479-498
Storey JD, Tibshirani R (2003) Statistical significance for genome-wide studies. Proc
Natl Acad Sci USA 100:9440-9445
Storey JD, Madeoy J, Strout JL, Wurfel M, Ronald J, Akey JM (2007) Gene-expression
variation within and among human populations. Am J Hum Genet 80:502-509
Stranger BE, Forrest MS, Dermitzakis ET, et al (2007) Relative impact of nucleotide and
copy number variation on gene expression phenotypes. Science 315:848-853
Suzuki R, Shimodaira H (2006) Pvclust: an R package for assessing the uncertainty in
hierarchical clustering Bioinformatics 22:1540-1542
Tamura K, Takahashi H, Kunieda T, Fuji K, Shimada T, Hara-Nishimura I (2007)
Arabidopsis KAM2/GRV2 is required for proper endosome formation and
functions in vacuolar sorting and determination of the embryo growth axis. Plant
Cell 19:320-332
Tanksley SD (1993) Mapping polygenes. Annu Rev Genet 27:205-233
Tatematsu K, Ward S, Leyser O, Kamiya Y, Nambara E (2005) Identification of cis-
elements that regulate gene expression during initiation of axillary bud outgrowth
in Arabidopsis. Plant Physiol 138:757-766
110
110
80
Thomas MS, Flavell RB (1990) Identification of an enhancer element for the
endosperm-specific expression of high molecular weight glutenin. Plant Cell
2:1171-1180
Thum KE, Kim M, Morishige DT, Eibl C, Koop HU, Mullet JE (2001) Analysis of
barley chloroplast psbD light-responsive promoter elements in transplastomic
tobacco. Plant Mol Biol 47:353-366
Tjaden G, Edwards JW, Coruzzi GM (1995) cis-elements and trans-acting factors
affecting regulation of a nonphotosynthetic light-regulated gene for chloroplast
glutamine synthetase. Plant Physiol 108:1109-1117
Townsend JP, Cavalieri D, Hartl DL (2003) Population genetic variation in genome-
wide gene expression. Mol Biol Evol 20:955-963
Tsukada S, Tanaka Y, Maegawa H, Kashiwagi A, Kawamori R, Maeda S (2006)
Intronic polymorphisms within TFAP2B regulate transcriptional activity and
affect adipocytokine gene expression in differentiated adipocytes. Mol
Endocrinol 20:1104-1111
Turley RB, Taliercio E (2008) Cotton benzoquinone reductase: up-regulation during
early fiber development and heterologous expression and characterization in
Pichia pastoris. Plant Physiol Biochem 46:780-785
Urao T, Yamaguchi-Shinozaki K, Urao S, Shinozaki K (1993) An Arabidopsis myb
homolog is induced by dehydration stress and its gene product binds to the
conserved MYB recognition sequence. Plant Cell 5:1529-1539
Veerla S, Hoglund M (2006) Analysis of promoter regions of co-expressed genes
identified by microarray analysis. BMC Bioinformatics 7:384-390
von Gromoff ED, Schroda M, Oster U, Beck CF (2006) Identification of a plastid
response element that acts as an enhancer within the Chlamydomonas HSP70A
promoter. Nucleic Acids Res 34:4767-4779
Vuylsteke M, van Eeuwijk F, Van Hummelen P, Kuiper M, Zabeau M (2005) Genetic
analysis of variation in gene expression in Arabidopsis thaliana. Genetics
171:1267-75
Wang GS, Cooper TA (2007) Splicing in disease: disruption of the splicing code and the
decoding machinery. Nat Rev Genetics 8:749-761
Wang RL, Syec A, Hey J, Lukens L, Doebey J (1999) The limits of selection during
maize domestication. Nature 398:236-239
111
111
80
Ward, JH (1963) Hierarchical grouping to optimize an objective function. J Am
Statistical Assn 58:236-244
Washida H, Wu CY, Suzuki A, Yamanouchi U, Akihama T, Harada K, Takaiwa F
(1999) Identification of cis-regulatory elements required for endosperm
expression of the rice storage protein glutelin gene GluB-1. Plant Mol Biol 40:1-
12
Weigel D, Nordborg M (2005) Natural variation in Arabidopsis. How do we find the
causal genes. Plant Physiol 138:567-568
Welchen E, Gonzalez DH (2005) Differential expression of the Arabidopsis cytochrome
c genes Cytc-1 and Cytc-2: Evidence for the involvement of TCP-domain
protein-binding elements in anther- and meristem-specific expression of the
Cytc-1 gene. Plant Physiol 139:88-100
Whetten RW, Mackay JJ, Sederoff RR (1998) Recent advances in understanding lignin
biosynthesis. Ann Rev Pl Physiol P Mol Biol 49:585-609
Whetten RW, Sun Y-H, Zhang Y, Sederoff RR (2001) Functional genomics and cell
wall biosynthesis in loblolly pine. Plant Mol Biol 47:275-291
White RJ (2001) Gene transcription: mechanisms and control Blackwell Science,
Malden, MA
Whittington AT, Vugrek O, Wei KJ, Hasenbein NG, Sugimoto K, Rashbrooke, MC,
Wasteneys GO (2001) MOR1 is essential for organizing cortical microtubules in
plants. Nature 411:610-613
Wilkins O, Nahal H, Foong J, Provart NJ, Campbell MM (2009) Expansion and
diversification of the Populus R2R3-MYB family of transcription factors. Plant
Physiol 149: 981-993
Willats WGT, Knox JP (1996) A role for arabinogalactanproteins in plant cell
expansion: evidence from studies on the interaction of b-glucosyl Yariv reagent
with seedlings of Arabidopsis thaliana. Plant J 9:919-925
Wray GA, Lowe CJ (2000) Developmental regulatory genes and echinoderm evolution.
Syst Biol 49:28-51
Wray GA, Hahn MW, Abouheif E, Balhoff JP, Pizer M, Rockman MV, Romano LA
(2003) The evolution of transcriptional regulation in eukaryotes. Mol Biol Evol
20:1377-1419
112
112
80
Wu C, Washida H, Onodera Y, Harada K, Takaiwa F (2000) Quantitative nature of the
Prolamin-box, ACGT and AACA motifs in a rice glutelin gene
promoter:minimal cis-element requirements for endosperm-specific gene
expression. Plant J 23:415-421
Yang S-H, van Zyl L, No E-G, Loopstra CA (2004) Microarray analysis of genes
preferentially expressed in differentiating xylem of loblolly pine (Pinus taeda).
Plant Sci 166:1185-1195
Yang S-H, Loopstra CA (2005) Seasonal variation in gene expression for loblolly pines
(Pinus taeda) from different geographical regions. Tree Physiol 25:1063-73
Yang S-H, Wang H, Sathyan P, Stasolla C, Loopstra CA (2005) Real-time RT-PCR
analysis of loblolly pine (Pinus taeda) arabinogalactan-protein and
arabinogalactan-protein-like genes. Physiol Planta 124:91-106
Ye Z-H, Freshour G, Hahn MG, Burk DH, Zhong R (2002) Vascular development in
Arabidopsis. Int Rev Cytol 220:225-256
Yoshioka S, Taniguchi F, Miura K, Inoue T, Yamano T, Fukuzawa H (2004) The novel
Myb transcription factor LCR1 regulates the CO2-responsive gene Cah1,
encoding a periplasmic carbonic anhydrase in Chlamydomonas reinhardtii. Plant
Cell 16:1466-1477
Yu D, Chen C, Chen Z (2001) Evidence for an important role of WRKY DNA binding
proteins in the regulation of NPR1 gene expression. Plant Cell 13:1527-1540
Yu J, Smith VA, Wang PP, Hartemink AJ, Jarvis ED (2004) Advances to Bayesian
network inference for generating causal networks from observational biological
data. Bioinformatics 20:3594-3603
Yu J, Buckler ES (2006) Genetic association mapping and genome organization of
maize. Curr Opn Biotech 17:155-160
Yukawa Y, Sugita M, Choisne N, Small I, Sugiura M (2000) The TATA motif, the CAA
motif and the poly(T) transcription termination motif are all important for
transcription re-initiation on plant tRNA genes. Plant J 22:439-447
Zhang Y, Sederoff RR, Allona I (2000) Differential expression of genes encoding cell
wall proteins in vascular tissues from vertical and bent loblolly pine trees. Tree
Physiol 20:457-466
113
113
80
Zhao S, Zhang Q, Chen Z, Zhao Y, Zhong J (2007) The factors shaping synonymous
codon usage in the genome of Burkholderia mallei. J Genetics and Genomics
34:362-372
Zhong R, Morrison H, Freshour GD, Hahn MG, Ye ZH (2003) Expression of a mutant
form of cellulose synthase AtCesA7 causes dominant negative effect on cellulose
biosynthesis. Plant Physiol 132:786-795
Zhong R, Demura T, Yea ZH (2006) SND1, a NAC domain transcription factor, is a key
regulator of secondary wall synthesis in fibers of Arabidopsis. Plant Cell
18:3158-3170
Zhong R, Richardson EA, Ye ZH (2007) Two NAC domain transcription factors, SND1
and NST1, function redundantly in regulation of secondary wall synthesis in
fibers of Arabidopsis. Planta 225:1603-1611
Zhong R, Lee C, Zhou J, McCarthy RL, Ye ZH (2008) A battery of transcription factors
involved in the regulation of secondary cell wall biosynthesis in Arabidopsis.
The Plant Cell 20:2763-2782
Zhong R, Ye ZH (2009) Transcriptional regulation of lignin biosynthesis. Plant
Signaling & Behavior 4:1028-1034
Zhong R, Lee C, Ye ZH (2010) Functional characterization of poplar wood-associated
NAC domain transcription factors. Plant Physiol 152:1044-1055
Zhou DX, LI YF, Rocipon M, Mache R (1992) Sequence specific interaction between
S1F, a spinach nuclear factor, and a negative cis-element conserved in plastid-
related genes. J Biol Chem 267:23515-23519
Zhu C, Gore M, Buckler ES, Yu J (2008) Status and prospects of association mapping in
plants. The Plant Genome 1:5-20
Zhu Q, Ordiz MI, Dabi T, Beachy RN, Lamb C (2002) Rice TATA binding protein
interacts functionally with transcription factor IIB and the RF2a bZIP
transcriptional activator in an enhanced plant in vitro transcription system. Plant
Cell 14:795-803
Zou F, Carrasquillo MM, Pankratz VS, Ertekin-Taner N, et al (2010) Gene expression
levels as endophenotypes in genome-wide association studies of Alzheimer
disease. Neurol 74:480-486.
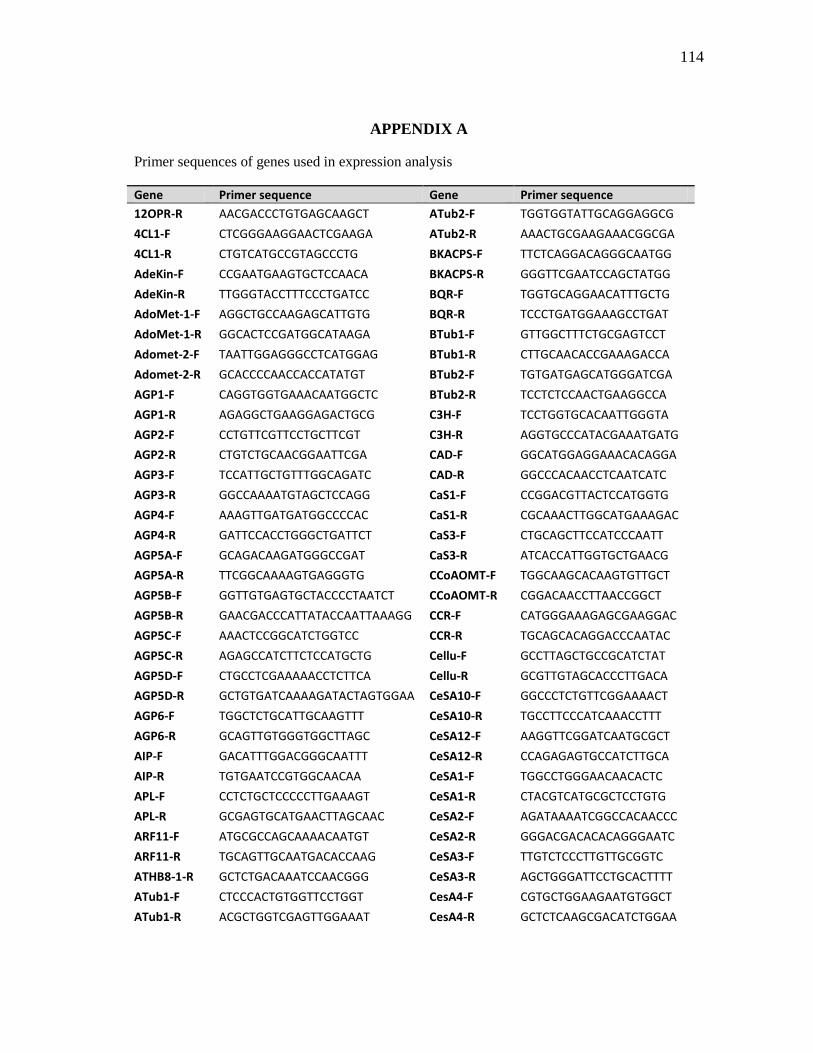
114
114
80
APPENDIX A
Primer sequences of genes used in expression analysis
Gene Primer sequence Gene Primer sequence
12OPR-R AACGACCCTGTGAGCAAGCT ATub2-F TGGTGGTATTGCAGGAGGCG
4CL1-F CTCGGGAAGGAACTCGAAGA ATub2-R AAACTGCGAAGAAACGGCGA
4CL1-R CTGTCATGCCGTAGCCCTG BKACPS-F TTCTCAGGACAGGGCAATGG
AdeKin-F CCGAATGAAGTGCTCCAACA BKACPS-R GGGTTCGAATCCAGCTATGG
AdeKin-R TTGGGTACCTTTCCCTGATCC BQR-F TGGTGCAGGAACATTTGCTG
AdoMet-1-F AGGCTGCCAAGAGCATTGTG BQR-R TCCCTGATGGAAAGCCTGAT
AdoMet-1-R GGCACTCCGATGGCATAAGA BTub1-F GTTGGCTTTCTGCGAGTCCT
Adomet-2-F TAATTGGAGGGCCTCATGGAG BTub1-R CTTGCAACACCGAAAGACCA
Adomet-2-R GCACCCCAACCACCATATGT BTub2-F TGTGATGAGCATGGGATCGA
AGP1-F CAGGTGGTGAAACAATGGCTC BTub2-R TCCTCTCCAACTGAAGGCCA
AGP1-R AGAGGCTGAAGGAGACTGCG C3H-F TCCTGGTGCACAATTGGGTA
AGP2-F CCTGTTCGTTCCTGCTTCGT C3H-R AGGTGCCCATACGAAATGATG
AGP2-R CTGTCTGCAACGGAATTCGA CAD-F GGCATGGAGGAAACACAGGA
AGP3-F TCCATTGCTGTTTGGCAGATC CAD-R GGCCCACAACCTCAATCATC
AGP3-R GGCCAAAATGTAGCTCCAGG CaS1-F CCGGACGTTACTCCATGGTG
AGP4-F AAAGTTGATGATGGCCCCAC CaS1-R CGCAAACTTGGCATGAAAGAC
AGP4-R GATTCCACCTGGGCTGATTCT CaS3-F CTGCAGCTTCCATCCCAATT
AGP5A-F GCAGACAAGATGGGCCGAT CaS3-R ATCACCATTGGTGCTGAACG
AGP5A-R TTCGGCAAAAGTGAGGGTG CCoAOMT-F TGGCAAGCACAAGTGTTGCT
AGP5B-F GGTTGTGAGTGCTACCCCTAATCT CCoAOMT-R CGGACAACCTTAACCGGCT
AGP5B-R GAACGACCCATTATACCAATTAAAGG CCR-F CATGGGAAAGAGCGAAGGAC
AGP5C-F AAACTCCGGCATCTGGTCC CCR-R TGCAGCACAGGACCCAATAC
AGP5C-R AGAGCCATCTTCTCCATGCTG Cellu-F GCCTTAGCTGCCGCATCTAT
AGP5D-F CTGCCTCGAAAAACCTCTTCA Cellu-R GCGTTGTAGCACCCTTGACA
AGP5D-R GCTGTGATCAAAAGATACTAGTGGAA CeSA10-F GGCCCTCTGTTCGGAAAACT
AGP6-F TGGCTCTGCATTGCAAGTTT CeSA10-R TGCCTTCCCATCAAACCTTT
AGP6-R GCAGTTGTGGGTGGCTTAGC CeSA12-F AAGGTTCGGATCAATGCGCT
AIP-F GACATTTGGACGGGCAATTT CeSA12-R CCAGAGAGTGCCATCTTGCA
AIP-R TGTGAATCCGTGGCAACAA CeSA1-F TGGCCTGGGAACAACACTC
APL-F CCTCTGCTCCCCCTTGAAAGT CeSA1-R CTACGTCATGCGCTCCTGTG
APL-R GCGAGTGCATGAACTTAGCAAC CeSA2-F AGATAAAATCGGCCACAACCC
ARF11-F ATGCGCCAGCAAAACAATGT CeSA2-R GGGACGACACACAGGGAATC
ARF11-R TGCAGTTGCAATGACACCAAG CeSA3-F TTGTCTCCCTTGTTGCGGTC
ATHB8-1-R GCTCTGACAAATCCAACGGG CeSA3-R AGCTGGGATTCCTGCACTTTT
ATub1-F CTCCCACTGTGGTTCCTGGT CesA4-F CGTGCTGGAAGAATGTGGCT
ATub1-R ACGCTGGTCGAGTTGGAAAT CesA4-R GCTCTCAAGCGACATCTGGAA
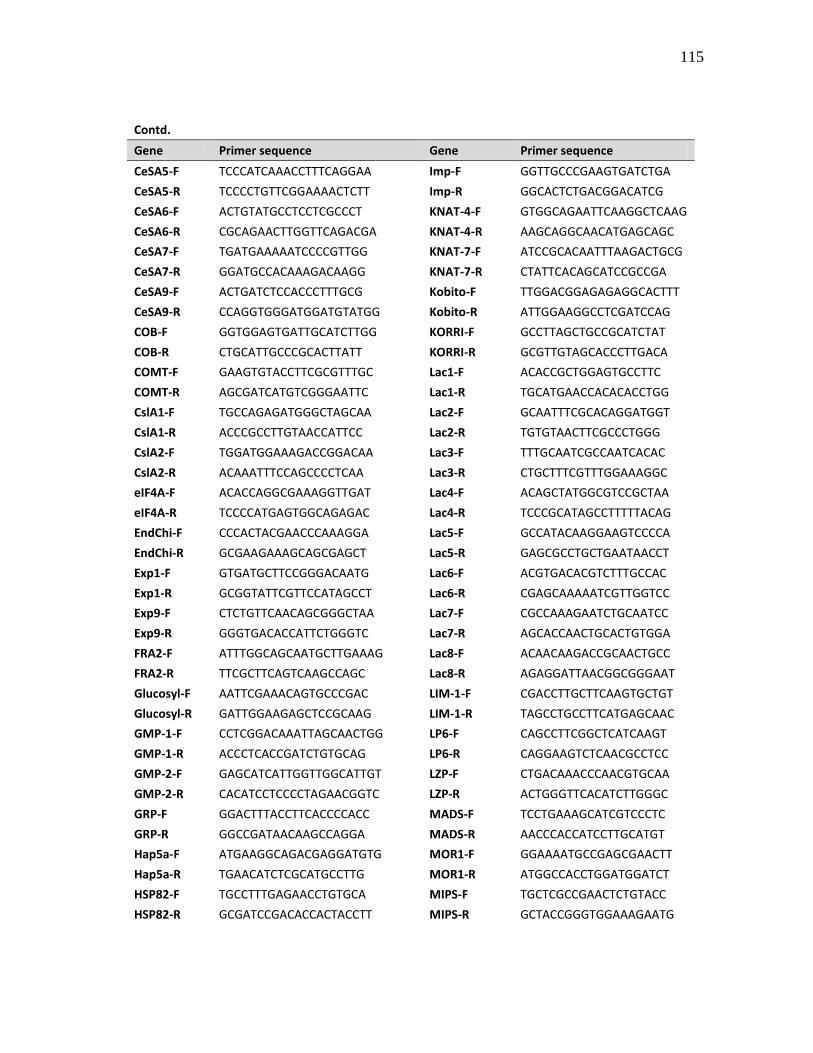
115
115
80
Contd.
Gene Primer sequence Gene Primer sequence
CeSA5-F TCCCATCAAACCTTTCAGGAA Imp-F GGTTGCCCGAAGTGATCTGA
CeSA5-R TCCCCTGTTCGGAAAACTCTT Imp-R GGCACTCTGACGGACATCG
CeSA6-F ACTGTATGCCTCCTCGCCCT KNAT-4-F GTGGCAGAATTCAAGGCTCAAG
CeSA6-R CGCAGAACTTGGTTCAGACGA KNAT-4-R AAGCAGGCAACATGAGCAGC
CeSA7-F TGATGAAAAATCCCCGTTGG KNAT-7-F ATCCGCACAATTTAAGACTGCG
CeSA7-R GGATGCCACAAAGACAAGG KNAT-7-R CTATTCACAGCATCCGCCGA
CeSA9-F ACTGATCTCCACCCTTTGCG Kobito-F TTGGACGGAGAGAGGCACTTT
CeSA9-R CCAGGTGGGATGGATGTATGG Kobito-R ATTGGAAGGCCTCGATCCAG
COB-F GGTGGAGTGATTGCATCTTGG KORRI-F GCCTTAGCTGCCGCATCTAT
COB-R CTGCATTGCCCGCACTTATT KORRI-R GCGTTGTAGCACCCTTGACA
COMT-F GAAGTGTACCTTCGCGTTTGC Lac1-F ACACCGCTGGAGTGCCTTC
COMT-R AGCGATCATGTCGGGAATTC Lac1-R TGCATGAACCACACACCTGG
CslA1-F TGCCAGAGATGGGCTAGCAA Lac2-F GCAATTTCGCACAGGATGGT
CslA1-R ACCCGCCTTGTAACCATTCC Lac2-R TGTGTAACTTCGCCCTGGG
CslA2-F TGGATGGAAAGACCGGACAA Lac3-F TTTGCAATCGCCAATCACAC
CslA2-R ACAAATTTCCAGCCCCTCAA Lac3-R CTGCTTTCGTTTGGAAAGGC
eIF4A-F ACACCAGGCGAAAGGTTGAT Lac4-F ACAGCTATGGCGTCCGCTAA
eIF4A-R TCCCCATGAGTGGCAGAGAC Lac4-R TCCCGCATAGCCTTTTTACAG
EndChi-F CCCACTACGAACCCAAAGGA Lac5-F GCCATACAAGGAAGTCCCCA
EndChi-R GCGAAGAAAGCAGCGAGCT Lac5-R GAGCGCCTGCTGAATAACCT
Exp1-F GTGATGCTTCCGGGACAATG Lac6-F ACGTGACACGTCTTTGCCAC
Exp1-R GCGGTATTCGTTCCATAGCCT Lac6-R CGAGCAAAAATCGTTGGTCC
Exp9-F CTCTGTTCAACAGCGGGCTAA Lac7-F CGCCAAAGAATCTGCAATCC
Exp9-R GGGTGACACCATTCTGGGTC Lac7-R AGCACCAACTGCACTGTGGA
FRA2-F ATTTGGCAGCAATGCTTGAAAG Lac8-F ACAACAAGACCGCAACTGCC
FRA2-R TTCGCTTCAGTCAAGCCAGC Lac8-R AGAGGATTAACGGCGGGAAT
Glucosyl-F AATTCGAAACAGTGCCCGAC LIM-1-F CGACCTTGCTTCAAGTGCTGT
Glucosyl-R GATTGGAAGAGCTCCGCAAG LIM-1-R TAGCCTGCCTTCATGAGCAAC
GMP-1-F CCTCGGACAAATTAGCAACTGG LP6-F CAGCCTTCGGCTCATCAAGT
GMP-1-R ACCCTCACCGATCTGTGCAG LP6-R CAGGAAGTCTCAACGCCTCC
GMP-2-F GAGCATCATTGGTTGGCATTGT LZP-F CTGACAAACCCAACGTGCAA
GMP-2-R CACATCCTCCCCTAGAACGGTC LZP-R ACTGGGTTCACATCTTGGGC
GRP-F GGACTTTACCTTCACCCCACC MADS-F TCCTGAAAGCATCGTCCCTC
GRP-R GGCCGATAACAAGCCAGGA MADS-R AACCCACCATCCTTGCATGT
Hap5a-F ATGAAGGCAGACGAGGATGTG MOR1-F GGAAAATGCCGAGCGAACTT
Hap5a-R TGAACATCTCGCATGCCTTG MOR1-R ATGGCCACCTGGATGGATCT
HSP82-F TGCCTTTGAGAACCTGTGCA MIPS-F TGCTCGCCGAACTCTGTACC
HSP82-R GCGATCCGACACCACTACCTT MIPS-R GCTACCGGGTGGAAAGAATG
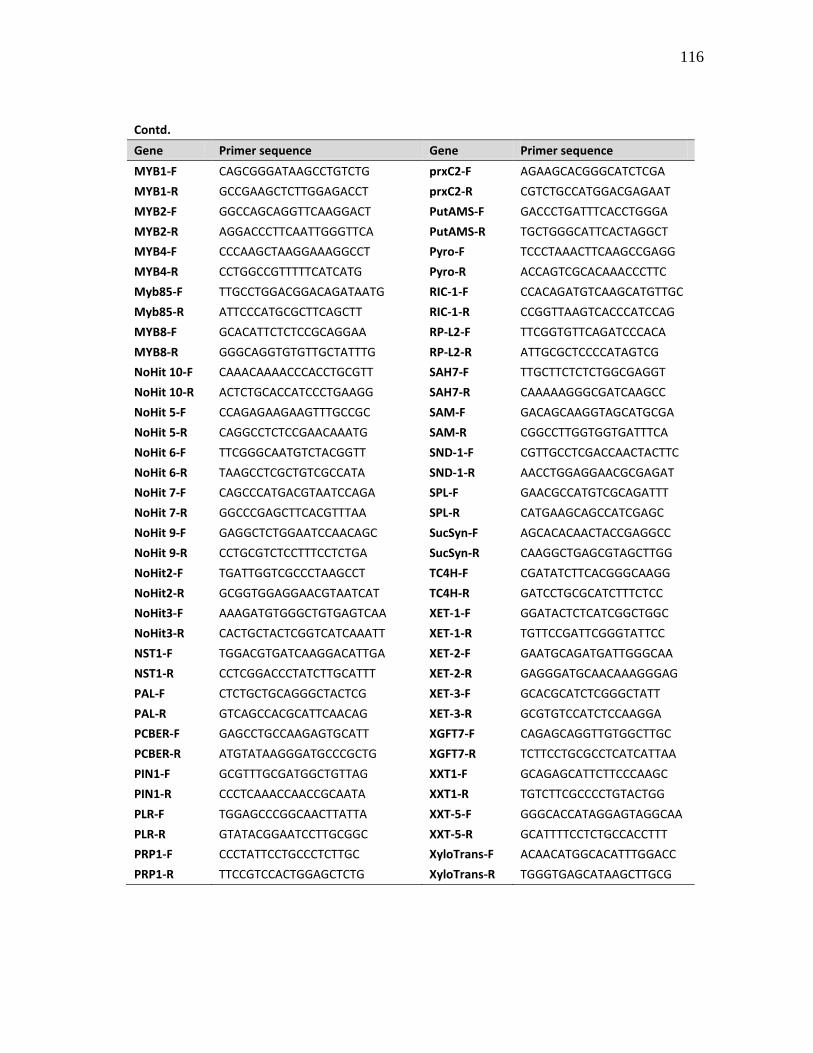
116
116
80
Contd.
Gene Primer sequence Gene Primer sequence
MYB1-F CAGCGGGATAAGCCTGTCTG prxC2-F AGAAGCACGGGCATCTCGA
MYB1-R GCCGAAGCTCTTGGAGACCT prxC2-R CGTCTGCCATGGACGAGAAT
MYB2-F GGCCAGCAGGTTCAAGGACT PutAMS-F GACCCTGATTTCACCTGGGA
MYB2-R AGGACCCTTCAATTGGGTTCA PutAMS-R TGCTGGGCATTCACTAGGCT
MYB4-F CCCAAGCTAAGGAAAGGCCT Pyro-F TCCCTAAACTTCAAGCCGAGG
MYB4-R CCTGGCCGTTTTTCATCATG Pyro-R ACCAGTCGCACAAACCCTTC
Myb85-F TTGCCTGGACGGACAGATAATG RIC-1-F CCACAGATGTCAAGCATGTTGC
Myb85-R ATTCCCATGCGCTTCAGCTT RIC-1-R CCGGTTAAGTCACCCATCCAG
MYB8-F GCACATTCTCTCCGCAGGAA RP-L2-F TTCGGTGTTCAGATCCCACA
MYB8-R GGGCAGGTGTGTTGCTATTTG RP-L2-R ATTGCGCTCCCCATAGTCG
NoHit 10-F CAAACAAAACCCACCTGCGTT SAH7-F TTGCTTCTCTCTGGCGAGGT
NoHit 10-R ACTCTGCACCATCCCTGAAGG SAH7-R CAAAAAGGGCGATCAAGCC
NoHit 5-F CCAGAGAAGAAGTTTGCCGC SAM-F GACAGCAAGGTAGCATGCGA
NoHit 5-R CAGGCCTCTCCGAACAAATG SAM-R CGGCCTTGGTGGTGATTTCA
NoHit 6-F TTCGGGCAATGTCTACGGTT SND-1-F CGTTGCCTCGACCAACTACTTC
NoHit 6-R TAAGCCTCGCTGTCGCCATA SND-1-R AACCTGGAGGAACGCGAGAT
NoHit 7-F CAGCCCATGACGTAATCCAGA SPL-F GAACGCCATGTCGCAGATTT
NoHit 7-R GGCCCGAGCTTCACGTTTAA SPL-R CATGAAGCAGCCATCGAGC
NoHit 9-F GAGGCTCTGGAATCCAACAGC SucSyn-F AGCACACAACTACCGAGGCC
NoHit 9-R CCTGCGTCTCCTTTCCTCTGA SucSyn-R CAAGGCTGAGCGTAGCTTGG
NoHit2-F TGATTGGTCGCCCTAAGCCT TC4H-F CGATATCTTCACGGGCAAGG
NoHit2-R GCGGTGGAGGAACGTAATCAT TC4H-R GATCCTGCGCATCTTTCTCC
NoHit3-F AAAGATGTGGGCTGTGAGTCAA XET-1-F GGATACTCTCATCGGCTGGC
NoHit3-R CACTGCTACTCGGTCATCAAATT XET-1-R TGTTCCGATTCGGGTATTCC
NST1-F TGGACGTGATCAAGGACATTGA XET-2-F GAATGCAGATGATTGGGCAA
NST1-R CCTCGGACCCTATCTTGCATTT XET-2-R GAGGGATGCAACAAAGGGAG
PAL-F CTCTGCTGCAGGGCTACTCG XET-3-F GCACGCATCTCGGGCTATT
PAL-R GTCAGCCACGCATTCAACAG XET-3-R GCGTGTCCATCTCCAAGGA
PCBER-F GAGCCTGCCAAGAGTGCATT XGFT7-F CAGAGCAGGTTGTGGCTTGC
PCBER-R ATGTATAAGGGATGCCCGCTG XGFT7-R TCTTCCTGCGCCTCATCATTAA
PIN1-F GCGTTTGCGATGGCTGTTAG XXT1-F GCAGAGCATTCTTCCCAAGC
PIN1-R CCCTCAAACCAACCGCAATA XXT1-R TGTCTTCGCCCCTGTACTGG
PLR-F TGGAGCCCGGCAACTTATTA XXT-5-F GGGCACCATAGGAGTAGGCAA
PLR-R GTATACGGAATCCTTGCGGC XXT-5-R GCATTTTCCTCTGCCACCTTT
PRP1-F CCCTATTCCTGCCCTCTTGC XyloTrans-F ACAACATGGCACATTTGGACC
PRP1-R TTCCGTCCACTGGAGCTCTG XyloTrans-R TGGGTGAGCATAAGCTTGCG
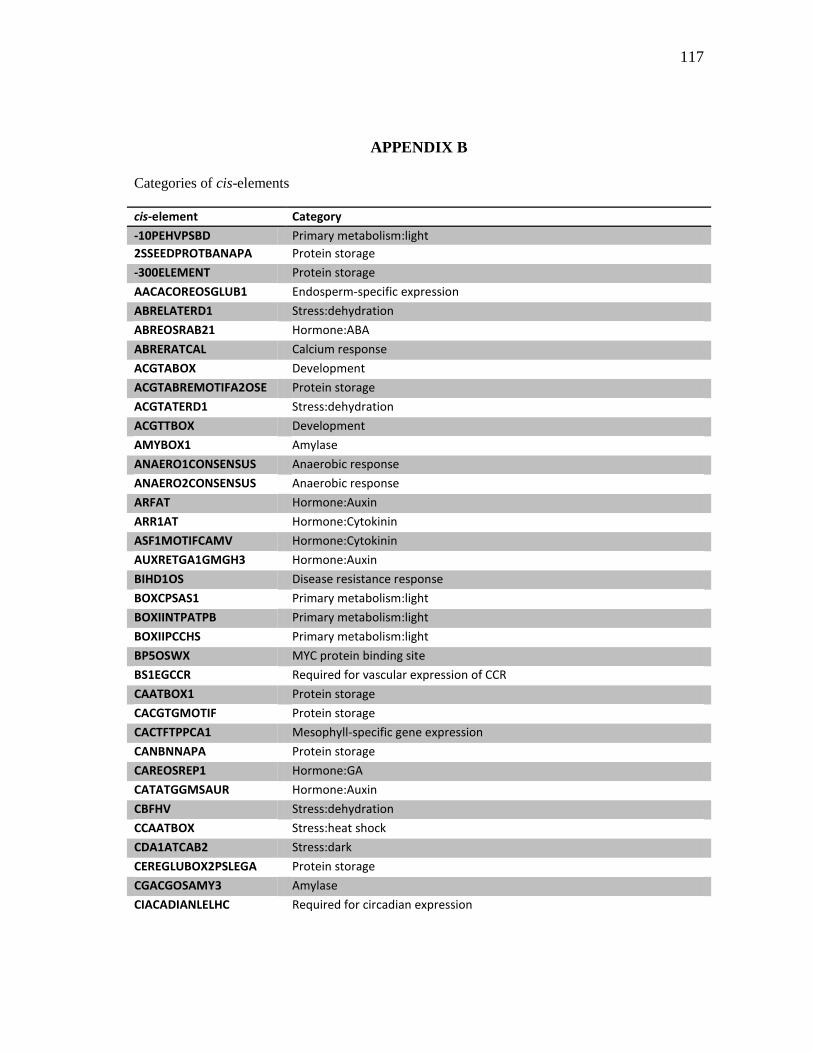
117
117
80
APPENDIX B
Categories of cis-elements
cis-element Category
-10PEHVPSBD Primary metabolism:light
2SSEEDPROTBANAPA Protein storage
-300ELEMENT Protein storage
AACACOREOSGLUB1 Endosperm-specific expression
ABRELATERD1 Stress:dehydration
ABREOSRAB21 Hormone:ABA
ABRERATCAL Calcium response
ACGTABOX Development
ACGTABREMOTIFA2OSE
M
Protein storage
ACGTATERD1 Stress:dehydration
ACGTTBOX Development
AMYBOX1 Amylase
ANAERO1CONSENSUS Anaerobic response
ANAERO2CONSENSUS Anaerobic response
ARFAT Hormone:Auxin
ARR1AT Hormone:Cytokinin
ASF1MOTIFCAMV Hormone:Cytokinin
AUXRETGA1GMGH3 Hormone:Auxin
BIHD1OS Disease resistance response
BOXCPSAS1 Primary metabolism:light
BOXIINTPATPB Primary metabolism:light
BOXIIPCCHS Primary metabolism:light
BP5OSWX MYC protein binding site
BS1EGCCR Required for vascular expression of CCR
CAATBOX1 Protein storage
CACGTGMOTIF Protein storage
CACTFTPPCA1 Mesophyll-specific gene expression
CANBNNAPA Protein storage
CAREOSREP1 Hormone:GA
CATATGGMSAUR Hormone:Auxin
CBFHV Stress:dehydration
CCAATBOX Stress:heat shock
CDA1ATCAB2 Stress:dark
CEREGLUBOX2PSLEGA Protein storage
CGACGOSAMY3 Amylase
CIACADIANLELHC Required for circadian expression
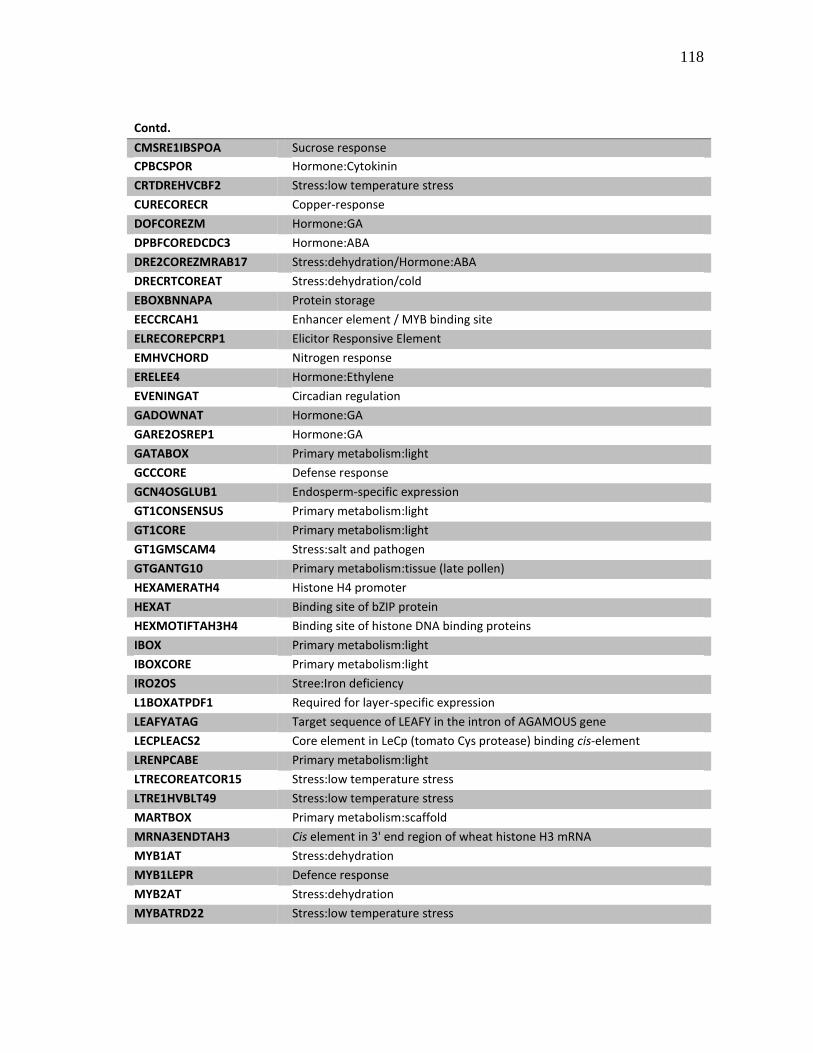
118
118
80
Contd.
CMSRE1IBSPOA Sucrose response
CPBCSPOR Hormone:Cytokinin
CRTDREHVCBF2 Stress:low temperature stress
CURECORECR Copper-response
DOFCOREZM Hormone:GA
DPBFCOREDCDC3 Hormone:ABA
DRE2COREZMRAB17 Stress:dehydration/Hormone:ABA
DRECRTCOREAT Stress:dehydration/cold
EBOXBNNAPA Protein storage
EECCRCAH1 Enhancer element / MYB binding site
ELRECOREPCRP1 Elicitor Responsive Element
EMHVCHORD Nitrogen response
ERELEE4 Hormone:Ethylene
EVENINGAT Circadian regulation
GADOWNAT Hormone:GA
GARE2OSREP1 Hormone:GA
GATABOX Primary metabolism:light
GCCCORE Defense response
GCN4OSGLUB1 Endosperm-specific expression
GT1CONSENSUS Primary metabolism:light
GT1CORE Primary metabolism:light
GT1GMSCAM4 Stress:salt and pathogen
GTGANTG10 Primary metabolism:tissue (late pollen)
HEXAMERATH4 Histone H4 promoter
HEXAT Binding site of bZIP protein
HEXMOTIFTAH3H4 Binding site of histone DNA binding proteins
IBOX Primary metabolism:light
IBOXCORE Primary metabolism:light
IRO2OS Stree:Iron deficiency
L1BOXATPDF1 Required for layer-specific expression
LEAFYATAG Target sequence of LEAFY in the intron of AGAMOUS gene
LECPLEACS2 Core element in LeCp (tomato Cys protease) binding cis-element
LRENPCABE Primary metabolism:light
LTRECOREATCOR15 Stress:low temperature stress
LTRE1HVBLT49 Stress:low temperature stress
MARTBOX Primary metabolism:scaffold
MRNA3ENDTAH3 Cis element in 3' end region of wheat histone H3 mRNA
MYB1AT Stress:dehydration
MYB1LEPR Defence response
MYB2AT Stress:dehydration
MYBATRD22 Stress:low temperature stress
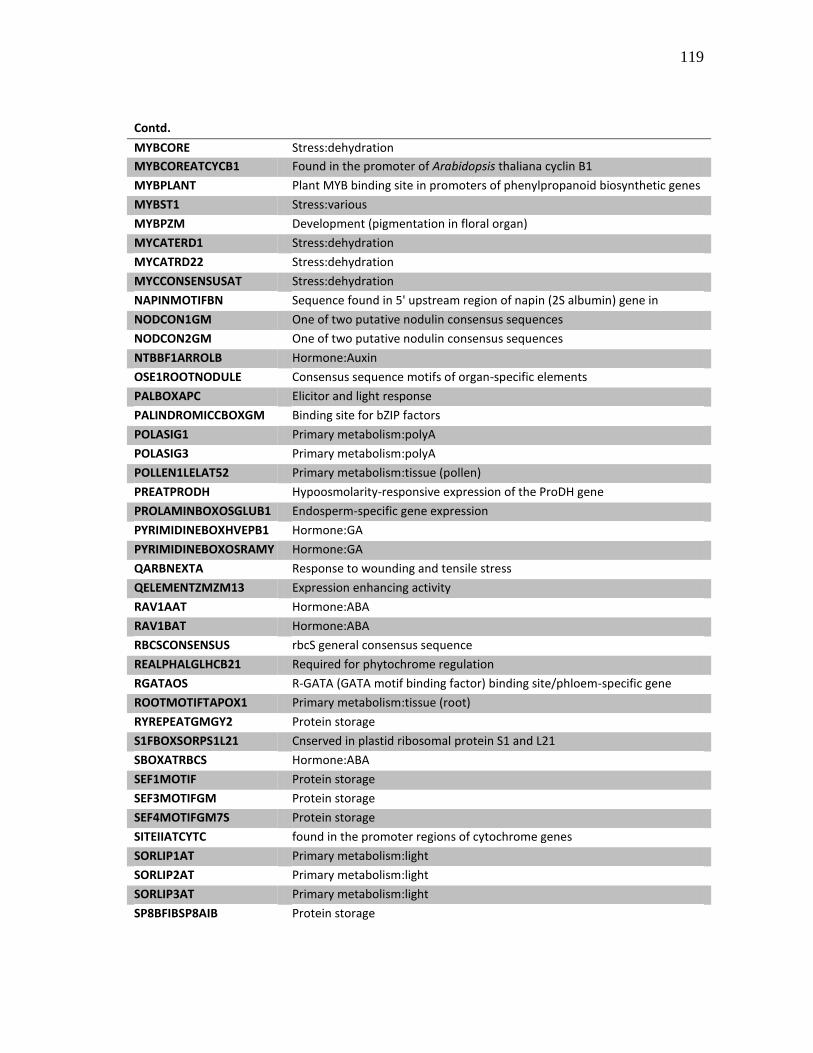
119
119
80
Contd.
MYBCORE Stress:dehydration
MYBCOREATCYCB1 Found in the promoter of Arabidopsis thaliana cyclin B1
MYBPLANT Plant MYB binding site in promoters of phenylpropanoid biosynthetic genes
MYBST1 Stress:various
MYBPZM Development (pigmentation in floral organ)
MYCATERD1 Stress:dehydration
MYCATRD22 Stress:dehydration
MYCCONSENSUSAT Stress:dehydration
NAPINMOTIFBN Sequence found in 5' upstream region of napin (2S albumin) gene in
Brassica napus NODCON1GM One of two putative nodulin consensus sequences
NODCON2GM One of two putative nodulin consensus sequences
NTBBF1ARROLB Hormone:Auxin
OSE1ROOTNODULE Consensus sequence motifs of organ-specific elements
PALBOXAPC Elicitor and light response
PALINDROMICCBOXGM Binding site for bZIP factors
POLASIG1 Primary metabolism:polyA
POLASIG3 Primary metabolism:polyA
POLLEN1LELAT52 Primary metabolism:tissue (pollen)
PREATPRODH Hypoosmolarity-responsive expression of the ProDH gene
PROLAMINBOXOSGLUB1 Endosperm-specific gene expression
PYRIMIDINEBOXHVEPB1 Hormone:GA
PYRIMIDINEBOXOSRAMY
1A
Hormone:GA
QARBNEXTA Response to wounding and tensile stress
QELEMENTZMZM13 Expression enhancing activity
RAV1AAT Hormone:ABA
RAV1BAT Hormone:ABA
RBCSCONSENSUS rbcS general consensus sequence
REALPHALGLHCB21 Required for phytochrome regulation
RGATAOS R-GATA (GATA motif binding factor) binding site/phloem-specific gene
expression ROOTMOTIFTAPOX1 Primary metabolism:tissue (root)
RYREPEATGMGY2 Protein storage
S1FBOXSORPS1L21 Cnserved in plastid ribosomal protein S1 and L21
SBOXATRBCS Hormone:ABA
SEF1MOTIF Protein storage
SEF3MOTIFGM Protein storage
SEF4MOTIFGM7S Protein storage
SITEIIATCYTC found in the promoter regions of cytochrome genes
SORLIP1AT Primary metabolism:light
SORLIP2AT Primary metabolism:light
SORLIP3AT Primary metabolism:light
SP8BFIBSP8AIB Protein storage
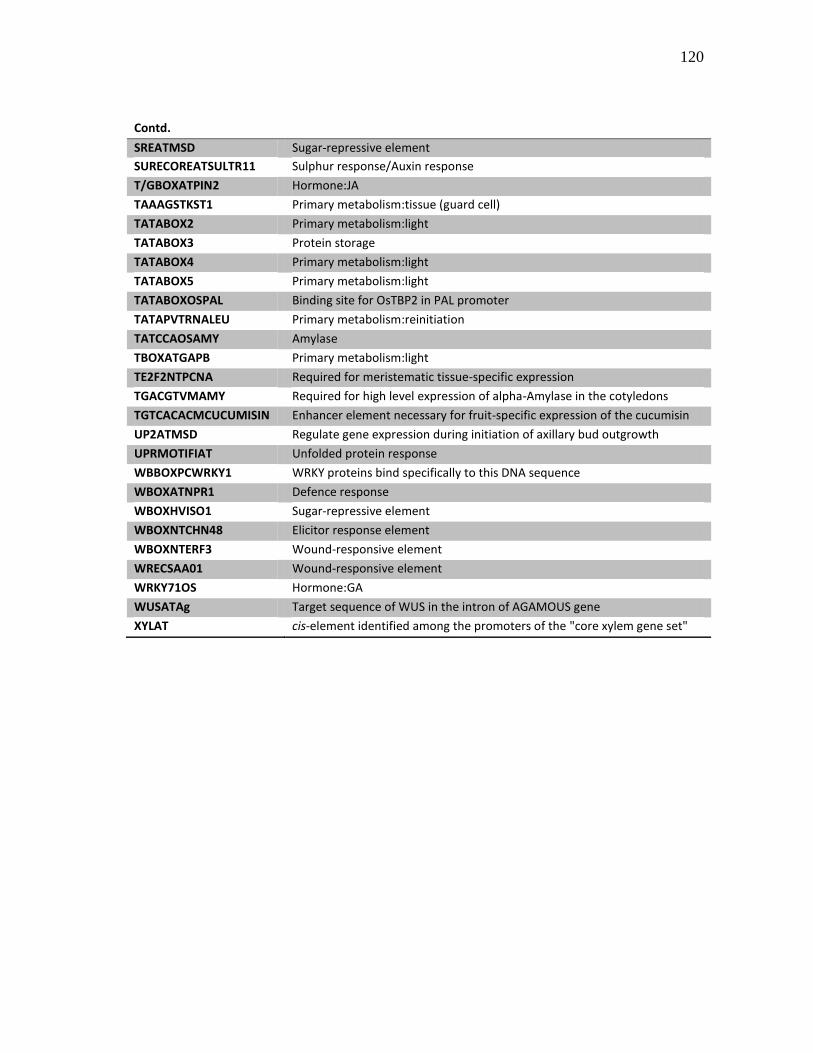
120
120
80
Contd.
SREATMSD Sugar-repressive element
SURECOREATSULTR11 Sulphur response/Auxin response
T/GBOXATPIN2 Hormone:JA
TAAAGSTKST1 Primary metabolism:tissue (guard cell)
TATABOX2 Primary metabolism:light
TATABOX3 Protein storage
TATABOX4 Primary metabolism:light
TATABOX5 Primary metabolism:light
TATABOXOSPAL Binding site for OsTBP2 in PAL promoter
TATAPVTRNALEU Primary metabolism:reinitiation
TATCCAOSAMY Amylase
TBOXATGAPB Primary metabolism:light
TE2F2NTPCNA Required for meristematic tissue-specific expression
TGACGTVMAMY Required for high level expression of alpha-Amylase in the cotyledons
TGTCACACMCUCUMISIN Enhancer element necessary for fruit-specific expression of the cucumisin
gene UP2ATMSD Regulate gene expression during initiation of axillary bud outgrowth
UPRMOTIFIAT Unfolded protein response
WBBOXPCWRKY1 WRKY proteins bind specifically to this DNA sequence
WBOXATNPR1 Defence response
WBOXHVISO1 Sugar-repressive element
WBOXNTCHN48 Elicitor response element
WBOXNTERF3 Wound-responsive element
WRECSAA01 Wound-responsive element
WRKY71OS Hormone:GA
WUSATAg Target sequence of WUS in the intron of AGAMOUS gene
XYLAT cis-element identified among the promoters of the "core xylem gene set"
121
121
80
VITA
SREENATH REDDY PALLE
MS 2123 TAMU, Rm #124,
College Station, TX 77843-2123
Education
October 2001 B.S. in Agricultural Sciences
Acharya N G Ranga Agricultural University, Mahanandi,
Andhra Pradesh, India.
August 2004 M.S. in Plant Sciences
Texas A&M University-Kingsville, Kingsville, TX
Thesis: Study of Possible Natural Transmission of Citrus Psorosis
Virus
Advisor: Dr. John daGraca
August 2010 Ph.D. in Molecular and Environmental Plant Sciences
Texas A&M University, College Station, TX
Advisor: Dr. Carol A. Loopstra