Embed Size (px)
Citation preview
Gene Expression and Networks
2
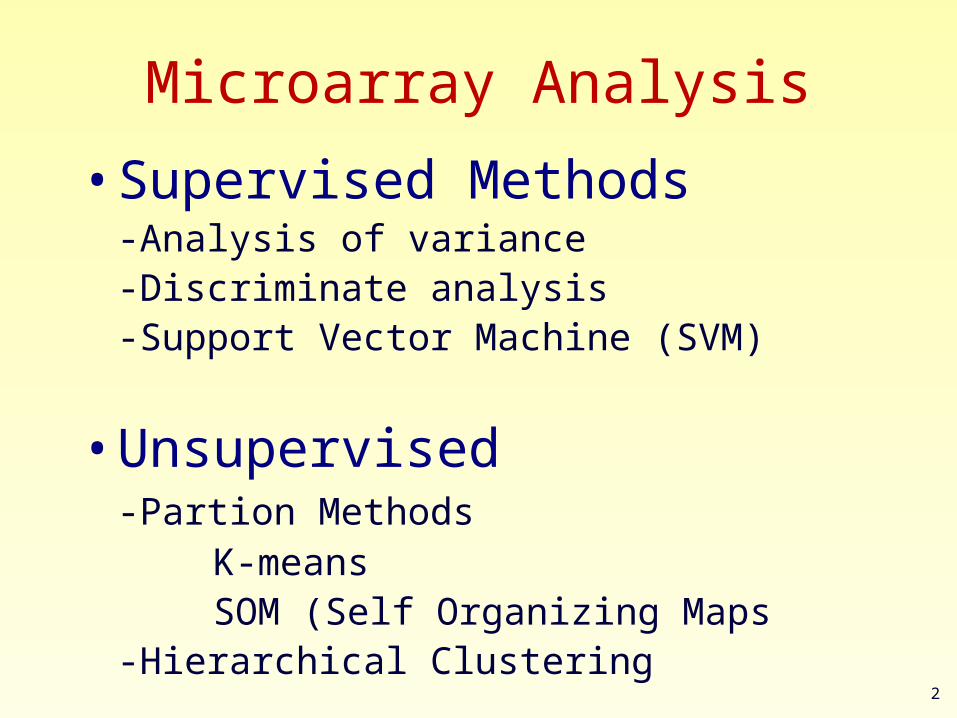
Microarray Analysis
• Supervised Methods-Analysis of variance-Discriminate analysis-Support Vector Machine (SVM)
• Unsupervised-Partion Methods
K-meansSOM (Self Organizing Maps
-Hierarchical Clustering
3
Support Vector Machine (SVM)• As applied to gene expression data, an SVM would
begin with a set of genes that have a common function, for example, genes coding for components of the proteasome. In addition, a separate set of genes that are known not to be members of the functional class is specified. These two sets of genes are combined to form a set of training of positive and negative examples
• Using this training set, an SVM would learn to discriminate between the members and non-members of a given functional class based on expression data.
• Having learned the expression features of the class, the SVM could recognize new genes as members or as non-members of the class based on their expression data.
4
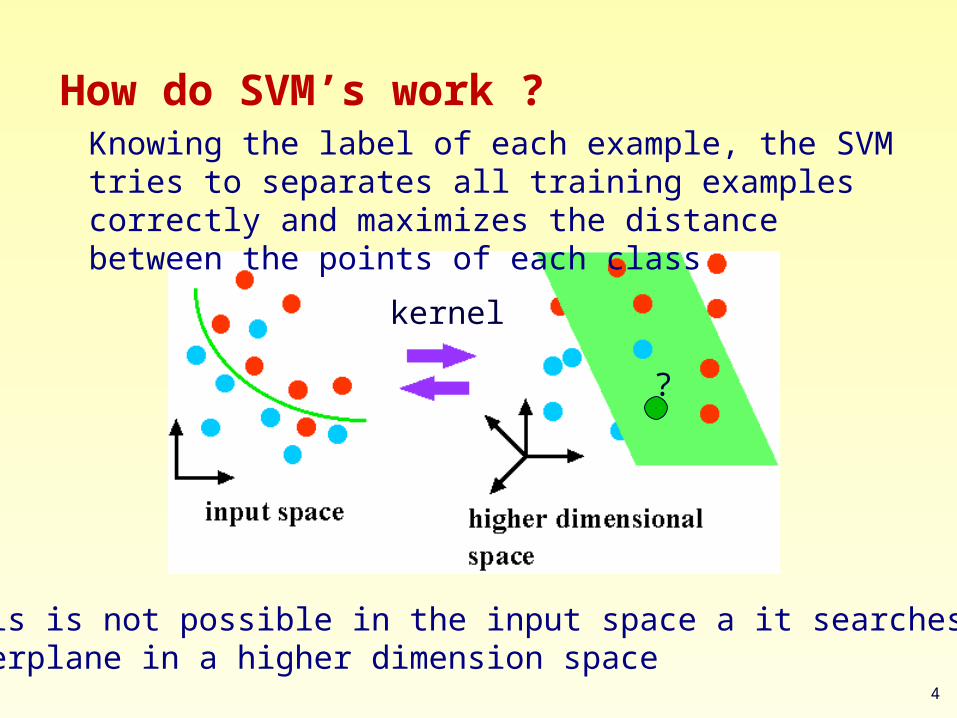
How do SVM’s work ?Knowing the label of each example, the SVM tries to separates all training examples correctly and maximizes the distance between the points of each class
If this is not possible in the input space a it searches forA hyperplane in a higher dimension space
kernel
?
5
Clustering
• Grouping genes together according to their expression profiles.
• Hierarchical clustering: generate a tree– Each gene is a leaf on the tree– Distances reflect similarity of expression– Internal nodes represent functional groups– Similar approach to phylogenetic trees
• k-means clustering: generate k groups– Number k is chosen in advance– Each group represents similar expression
6
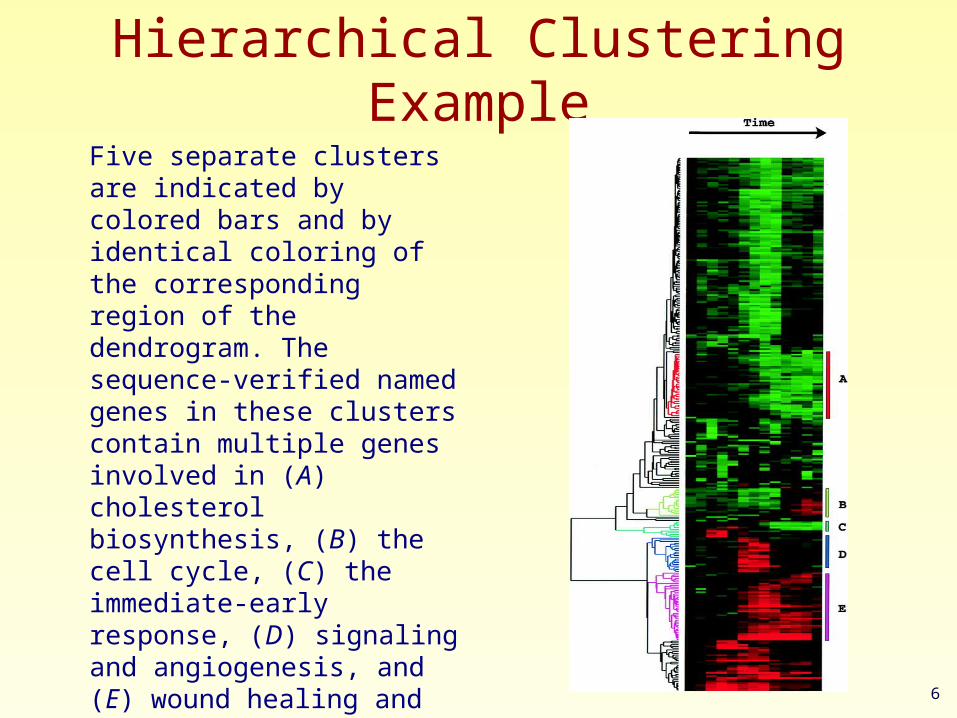
Hierarchical Clustering Example
Five separate clusters are indicated by colored bars and by identical coloring of the corresponding region of the dendrogram. The sequence-verified named genes in these clusters contain multiple genes involved in (A) cholesterol biosynthesis, (B) the cell cycle, (C) the immediate-early response, (D) signaling and angiogenesis, and (E) wound healing and tissue remodeling. These clusters also contain named genes not involved in these processes and numerous uncharacterized genes.
7
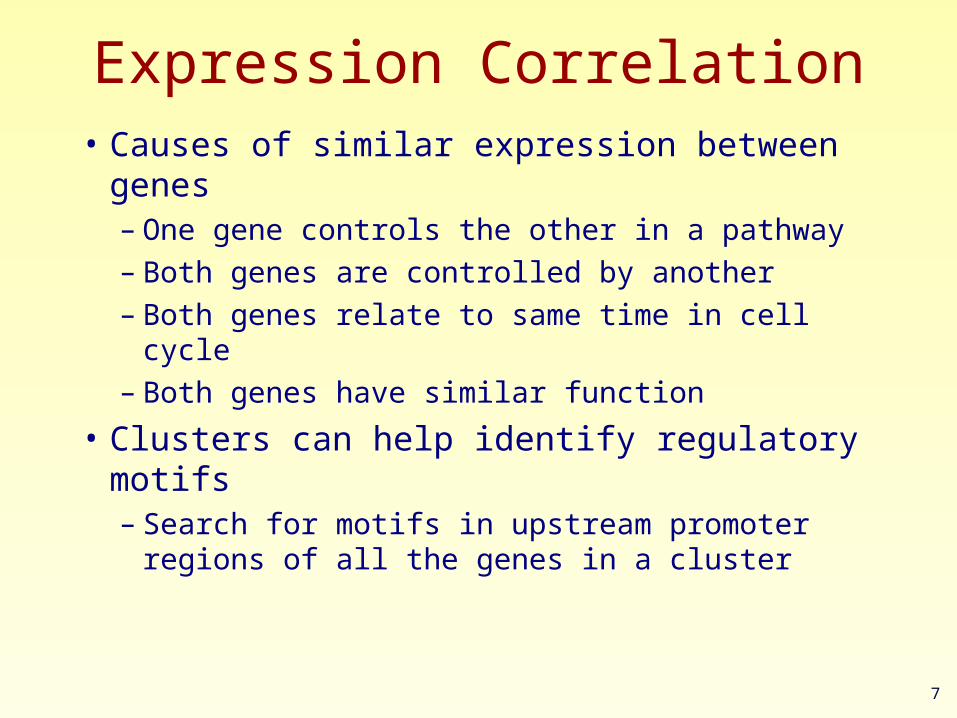
Expression Correlation• Causes of similar expression between genes
– One gene controls the other in a pathway– Both genes are controlled by another– Both genes relate to same time in cell cycle– Both genes have similar function
• Clusters can help identify regulatory motifs– Search for motifs in upstream promoter regions
of all the genes in a cluster
8
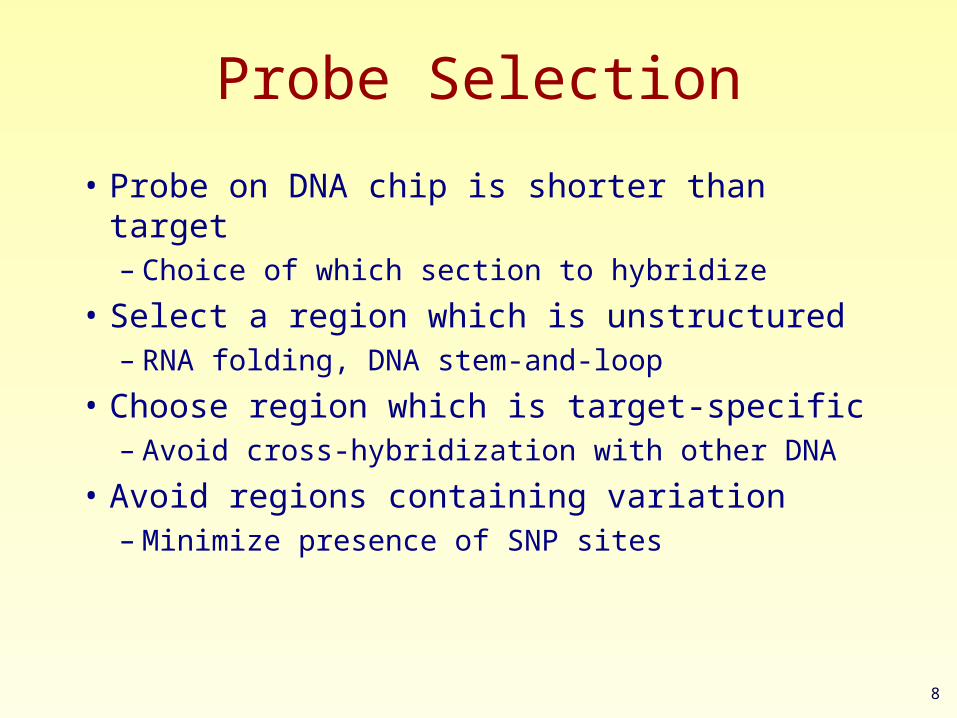
Probe Selection
• Probe on DNA chip is shorter than target– Choice of which section to hybridize
• Select a region which is unstructured– RNA folding, DNA stem-and-loop
• Choose region which is target-specific– Avoid cross-hybridization with other DNA
• Avoid regions containing variation– Minimize presence of SNP sites
9
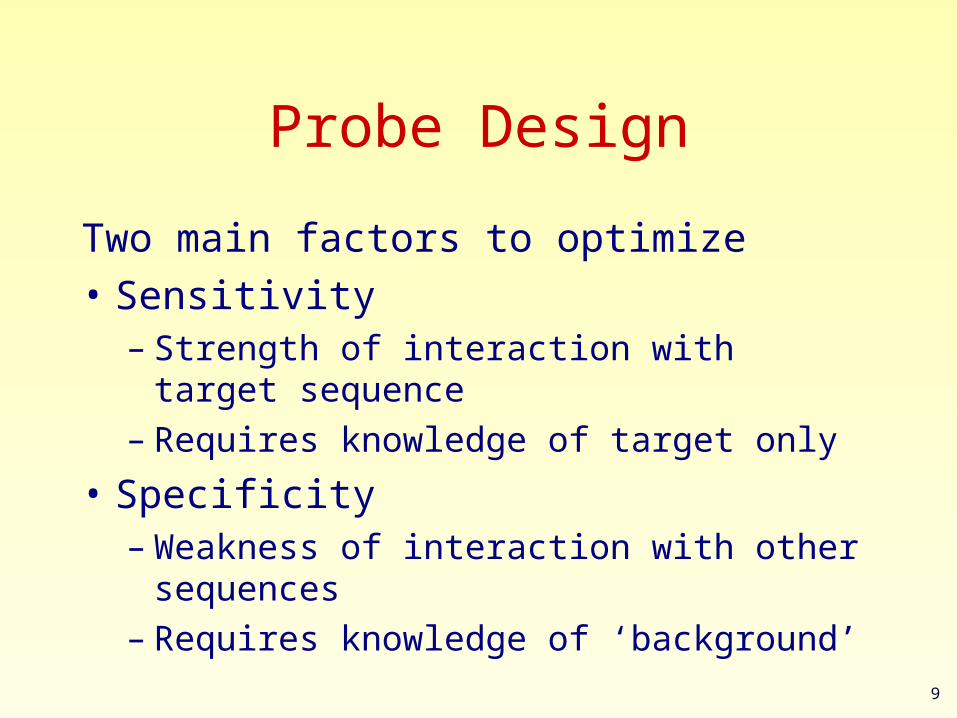
Probe Design
Two main factors to optimize
• Sensitivity– Strength of interaction with target sequence– Requires knowledge of target only
• Specificity– Weakness of interaction with other sequences– Requires knowledge of ‘background’
10
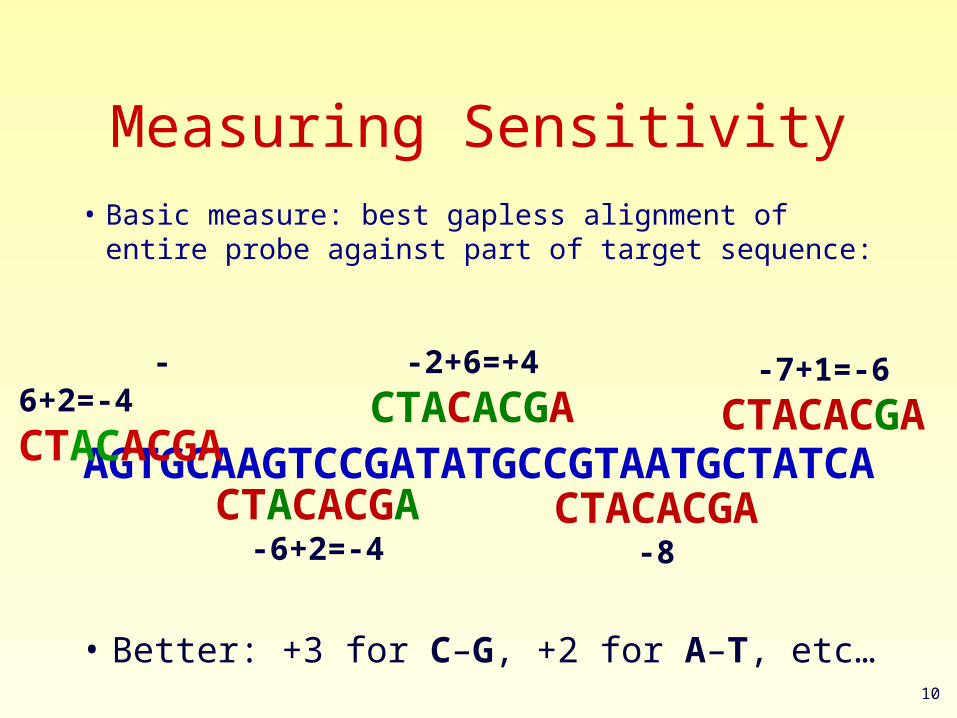
Measuring Sensitivity
• Basic measure: best gapless alignment of entire probe against part of target sequence:
AGTGCAAGTCCGATATGCCGTAATGCTATCA
-2+6=+4
CTACACGA-7+1=-6
CTACACGA
CTACACGA-6+2=-4
CTACACGA-8
• Better: +3 for C–G, +2 for A–T, etc…
-6+2=-4
CTACACGA
11
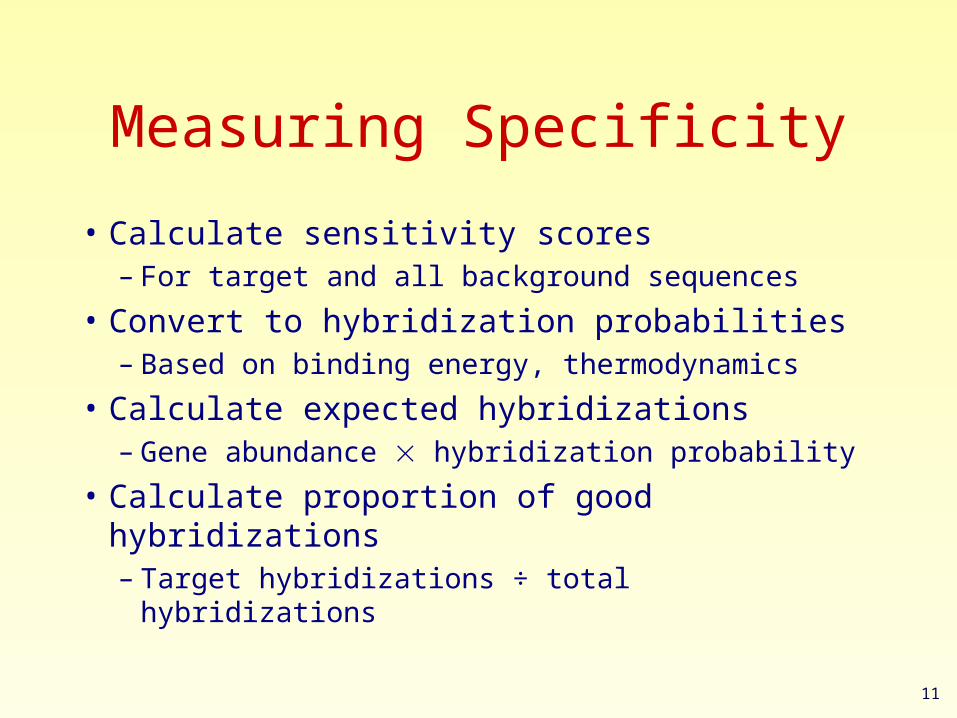
Measuring Specificity
• Calculate sensitivity scores – For target and all background sequences
• Convert to hybridization probabilities– Based on binding energy, thermodynamics
• Calculate expected hybridizations– Gene abundance hybridization probability
• Calculate proportion of good hybridizations– Target hybridizations ÷ total hybridizations
12
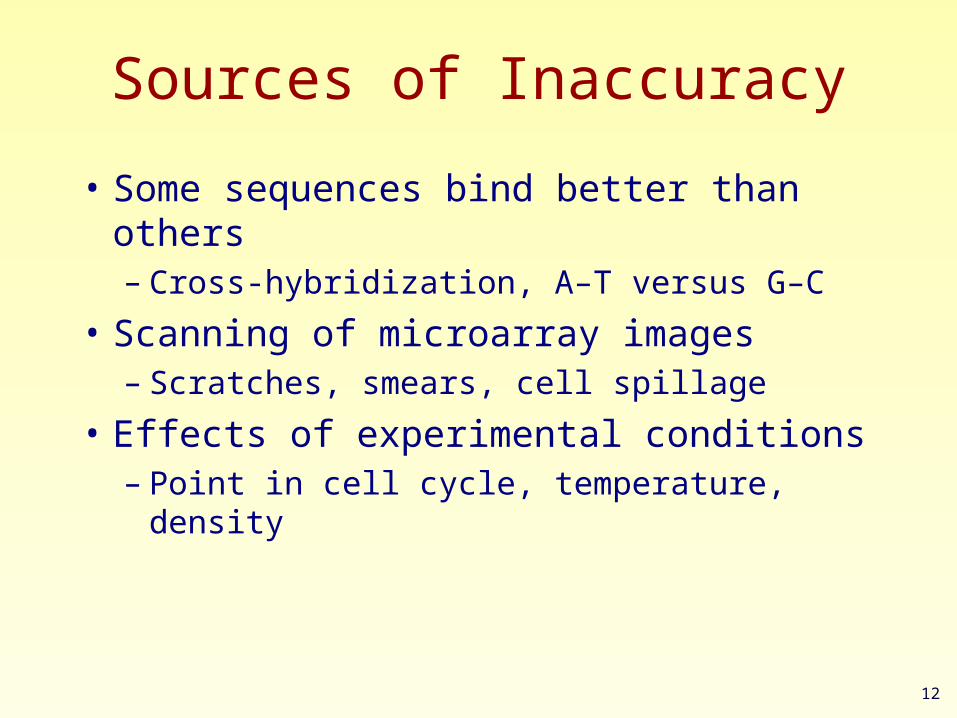
Sources of Inaccuracy
• Some sequences bind better than others– Cross-hybridization, A–T versus G–C
• Scanning of microarray images– Scratches, smears, cell spillage
• Effects of experimental conditions– Point in cell cycle, temperature, density
13
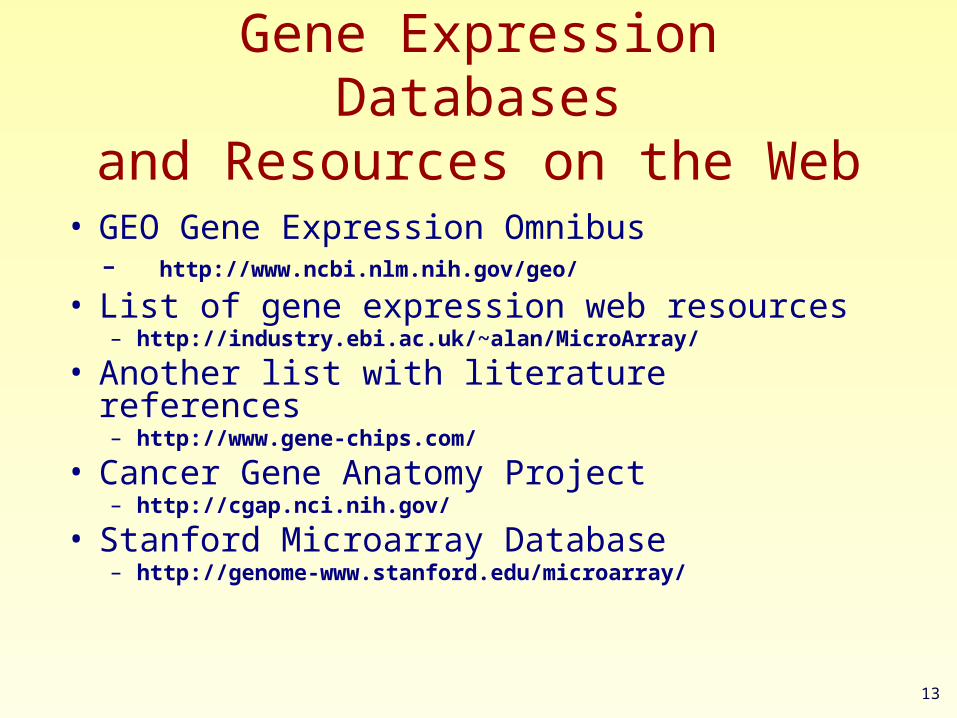
Gene Expression Databasesand Resources on the Web
• GEO Gene Expression Omnibus- http://www.ncbi.nlm.nih.gov/geo/
• List of gene expression web resources– http://industry.ebi.ac.uk/~alan/MicroArray/
• Another list with literature references– http://www.gene-chips.com/
• Cancer Gene Anatomy Project– http://cgap.nci.nih.gov/
• Stanford Microarray Database– http://genome-www.stanford.edu/microarray/
14
Functional Genomics
The task is to define the function of a gene (or its protein) in the life processes of the organism, where function refers to the role it plays in a larger context.
15
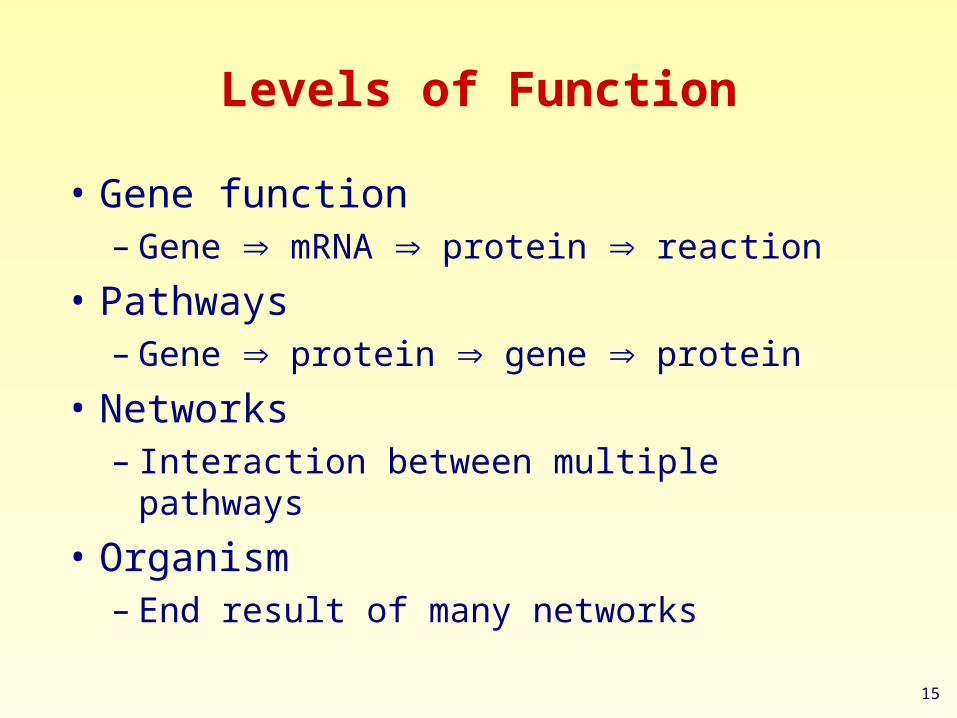
Levels of Function
• Gene function– Gene mRNA protein reaction
• Pathways– Gene protein gene protein
• Networks– Interaction between multiple pathways
• Organism– End result of many networks
16
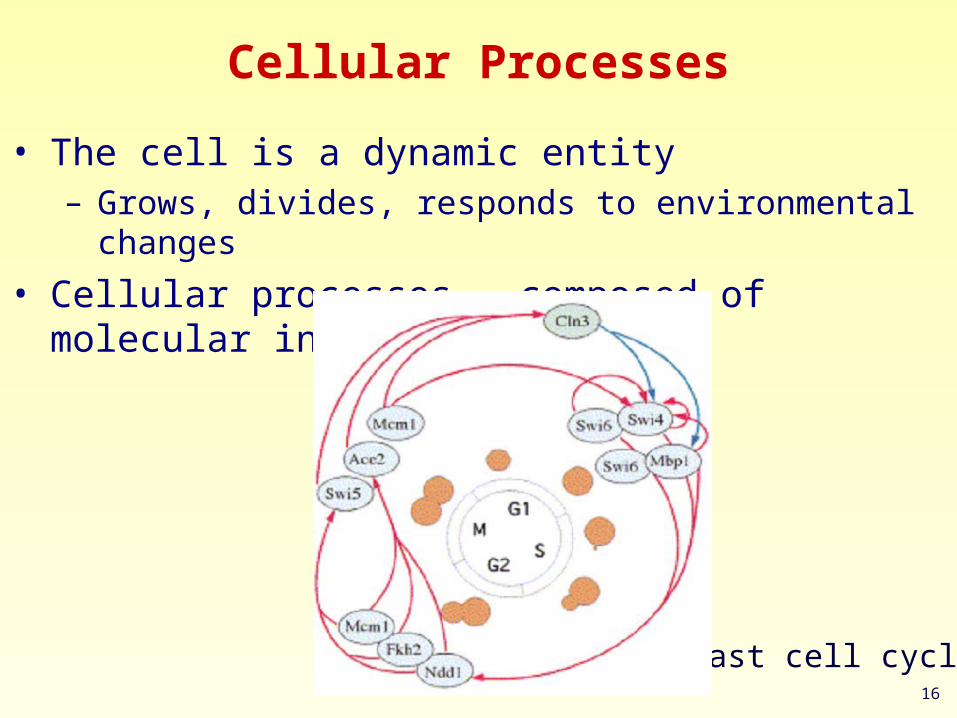
Cellular Processes
• The cell is a dynamic entity– Grows, divides, responds to environmental changes
• Cellular processes - composed of molecular interactions
Yeast cell cycle
17
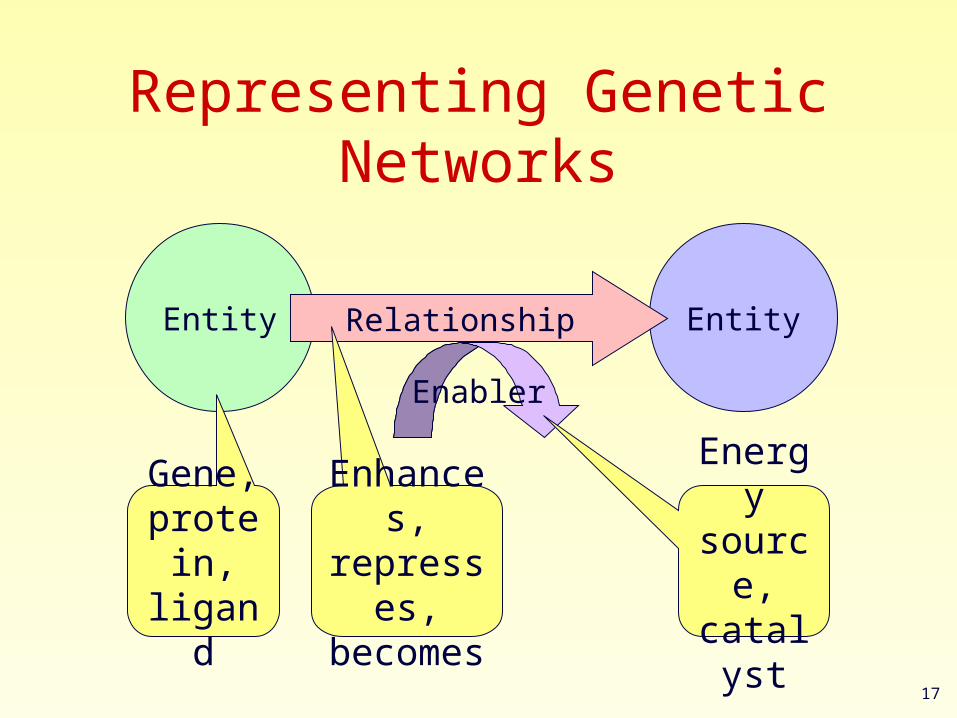
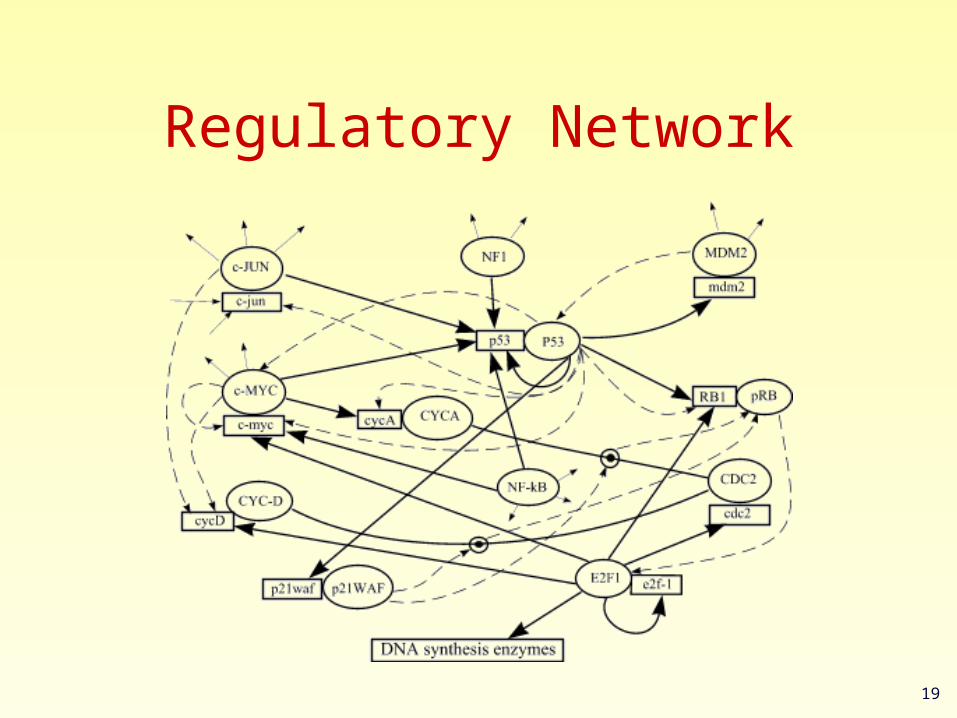
Representing Genetic Networks
Entity EntityRelationship
Gene, protein, ligand
Enhances, represses, becomes
Enabler
Energy source, catalyst
18
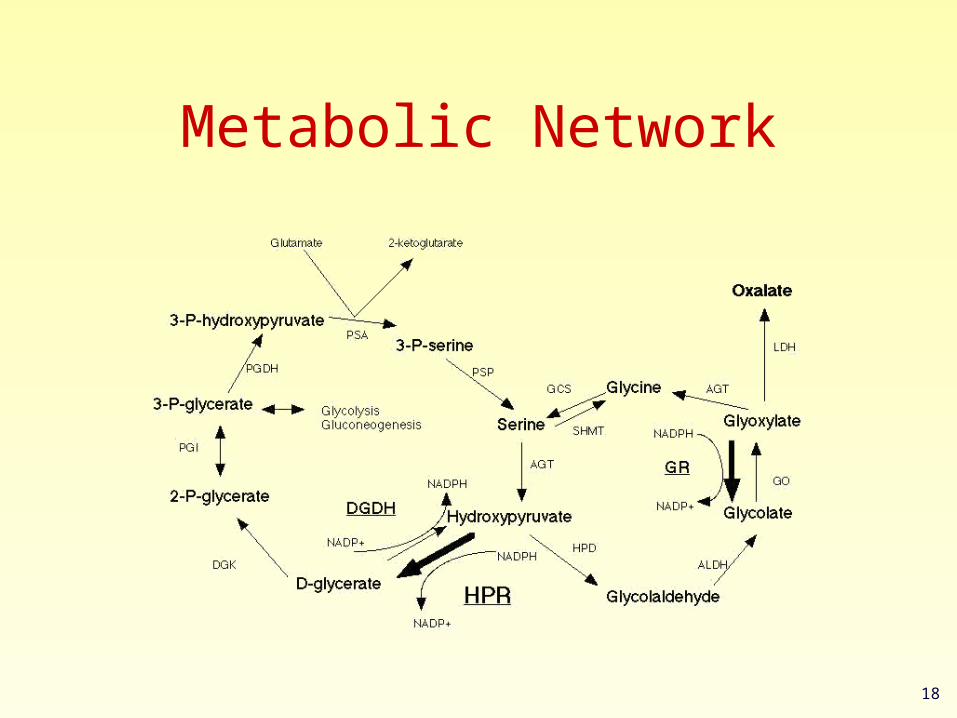
Metabolic Network
19
Regulatory Network
20
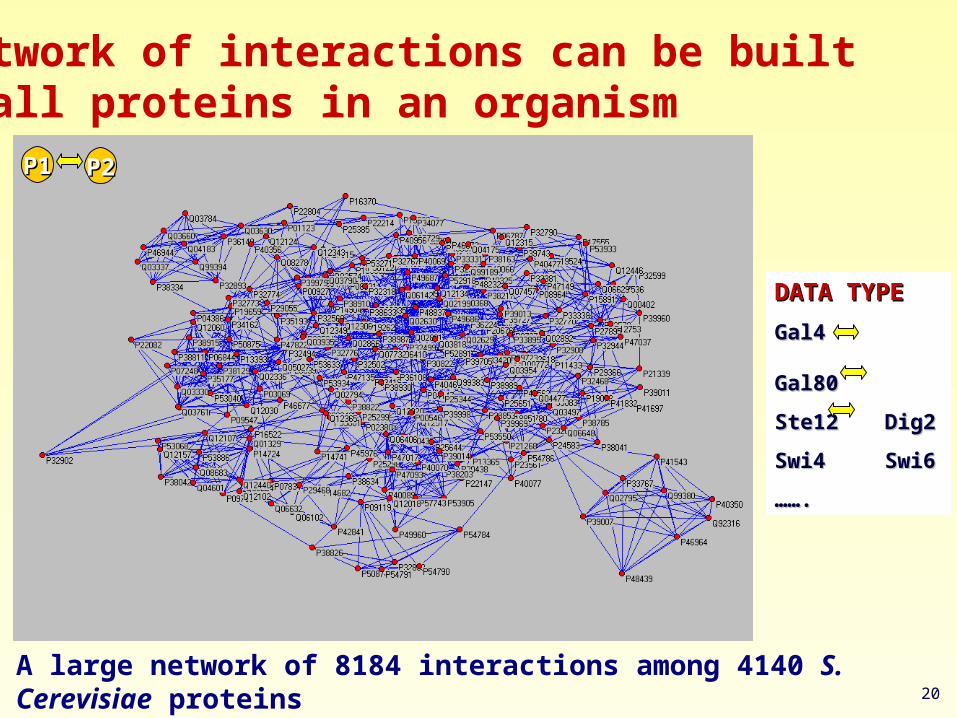
A large network of 8184 interactions among 4140 S. Cerevisiae proteins
A network of interactions can be built For all proteins in an organism
DATA TYPEDATA TYPE
Gal4 Gal4 Gal80 Gal80
Ste12 Ste12 Dig2 Dig2
Swi4Swi4 Swi6 Swi6
…………..
P1P1 P2P2
21
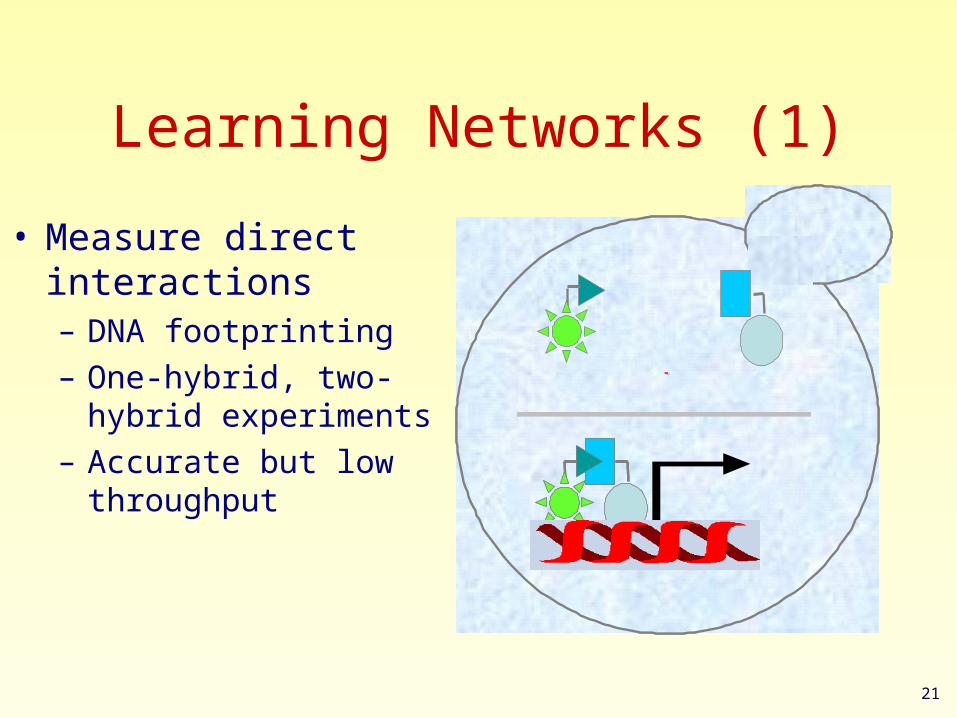
Learning Networks (1)
• Measure direct interactions– DNA footprinting
– One-hybrid, two-hybrid experiments
– Accurate but low throughput
Yeast 2Yeast 2 -- hybridhybrid--
22
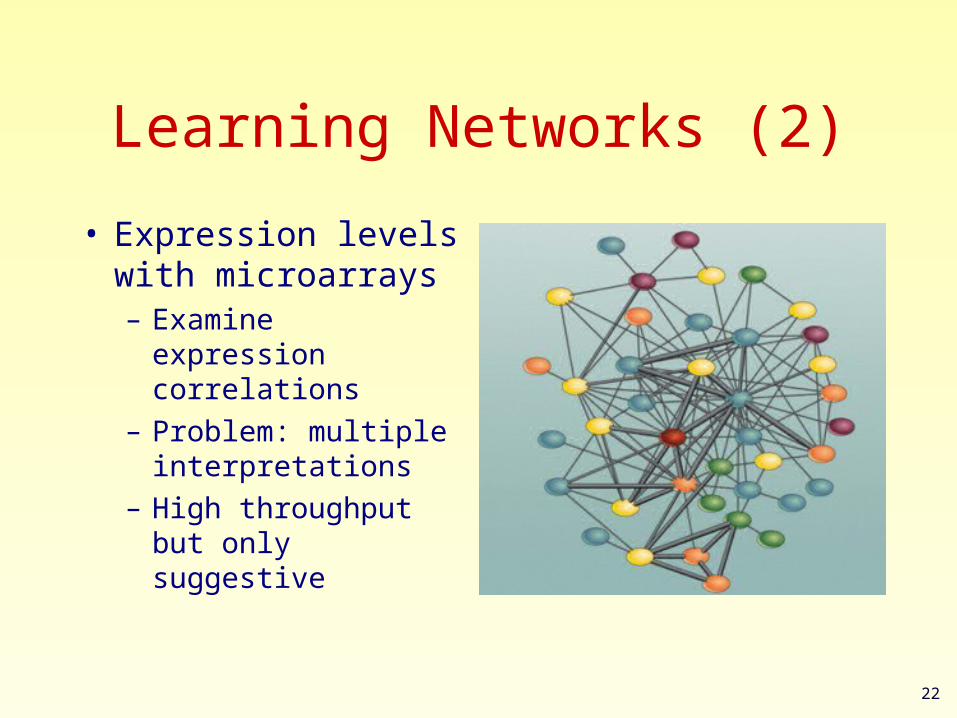
Learning Networks (2)
• Expression levels with microarrays– Examine expression
correlations
– Problem: multiple interpretations
– High throughput but only suggestive
23
Learning Networks (3)
• Literature mining– Scan existing scientific literature– Problems: no standard sentence structure,
diverse nomenclature, limited historically– Shows promise but many false positives
• Protein microarrays– Same as DNA microarrays but for proteins– Huge potential but not ready yet
24
Other Resources
• BioCyc– http://www.biocyc.org/
• Biomolecular Interaction Network Database– http://www.bind.ca/
• ‘What is There’ Interaction Database– http://wit.mcs.anl.gov/WIT2/
• Gene Ontology Consortium– http://www.geneontology.org/