Embed Size (px)
Citation preview
Gene expression bioinformatics:
Part 1. Highthroughput quantitative genomics
October 05, 2015
Alvin T. KhoBoston Children's Hospital
Created with
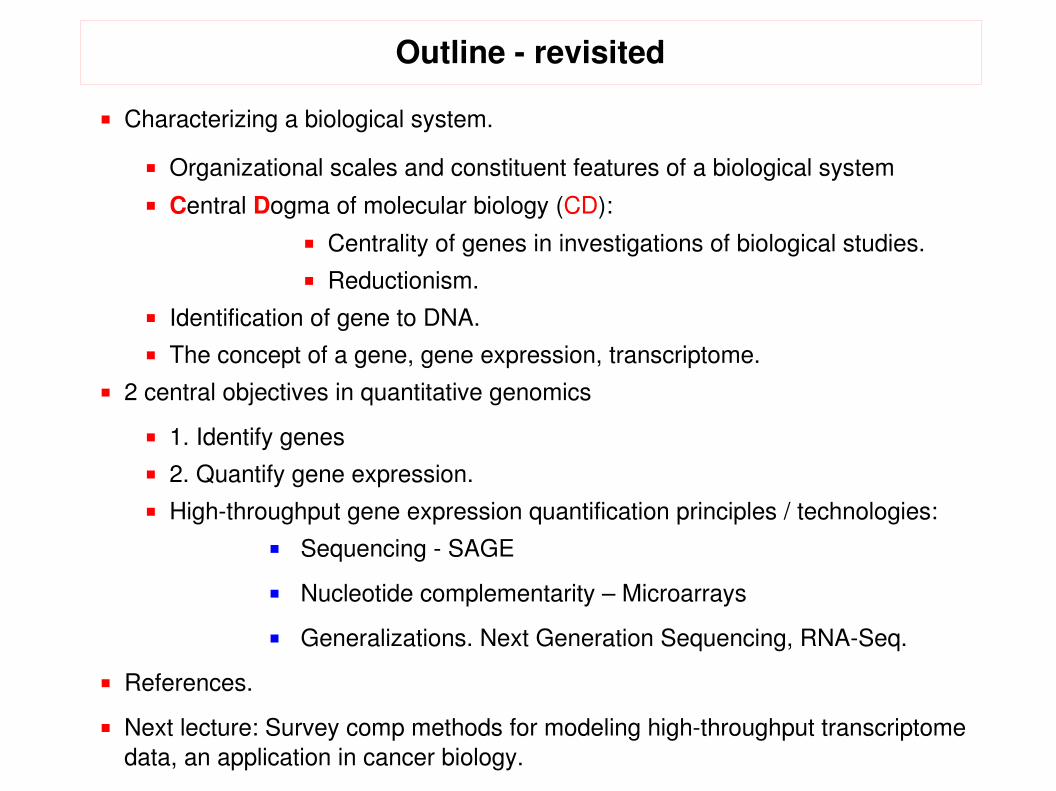
Characterizing a biological system.
Organizational scales and constituent features of a biological system Central Dogma of molecular biology (CD):
Centrality of genes in investigations of biological studies. Reductionism.
Identification of gene to DNA. The concept of a gene, gene expression, transcriptome.
2 central objectives in quantitative genomics
1. Identify genes 2. Quantify gene expression. Highthroughput gene expression quantification principles / technologies:
Sequencing SAGE
Nucleotide complementarity – Microarrays
Generalizations. Next Generation Sequencing, RNASeq.
References.
Next lecture: Survey comp methods for modeling highthroughput transcriptome data, an application in cancer biology.
Outline
Characterizing a biological system
Environment
Objects/Attributes
Biological system state
Readout
Typical Biological Experiment Perturb Environment
Biological system state
Biological system state
Biological system state
Objects/Attributes
Objects/Attributes
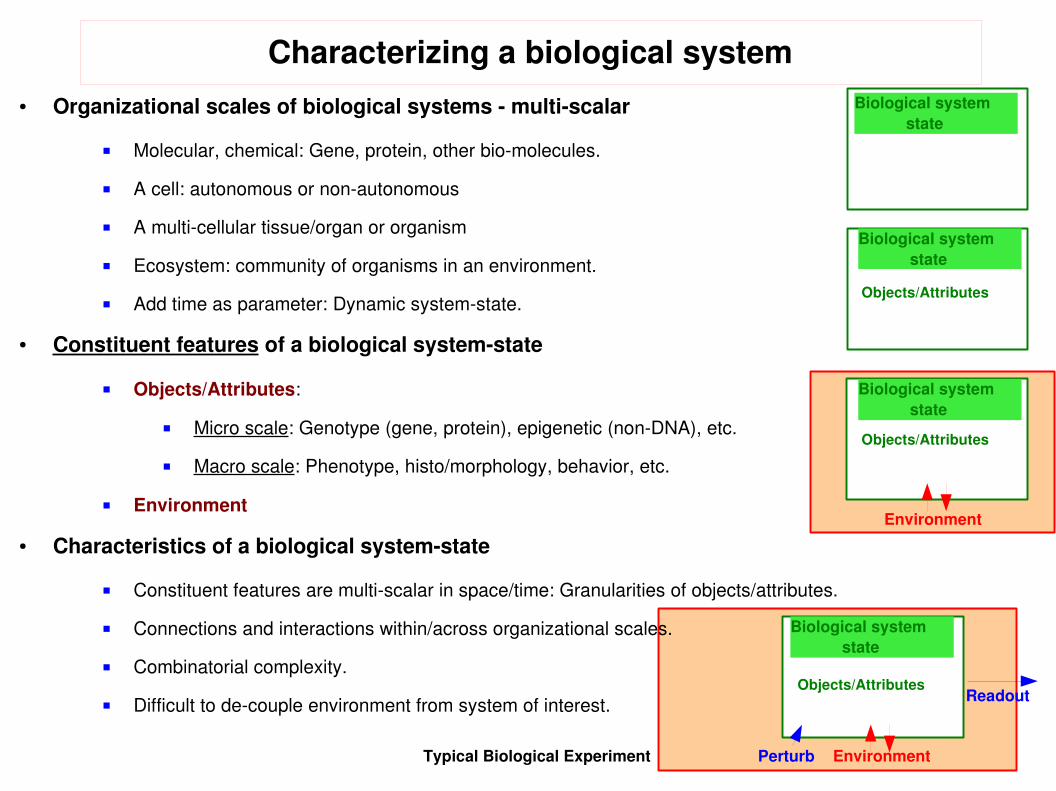
● Organizational scales of biological systems multiscalar
Molecular, chemical: Gene, protein, other biomolecules.
A cell: autonomous or nonautonomous
A multicellular tissue/organ or organism
Ecosystem: community of organisms in an environment.
Add time as parameter: Dynamic systemstate.
● Constituent features of a biological systemstate
Objects/Attributes:
Micro scale: Genotype (gene, protein), epigenetic (nonDNA), etc.
Macro scale: Phenotype, histo/morphology, behavior, etc.
Environment
● Characteristics of a biological systemstate
Constituent features are multiscalar in space/time: Granularities of objects/attributes.
Connections and interactions within/across organizational scales.
Combinatorial complexity.
Difficult to decouple environment from system of interest.

Characterizing a biological system● Generic questions for a biological systemstate
Identify objects / attributes / environmental factors that characterize a biological system state.
Identify associations between Micro and Macro scalar features:
Characterize the interaction of objects / attributes / environment factors that transform the state of a biological system.
Distinguish Causative (Generative / Mechanistic) from Correlative (Descriptive) interactions.
● Disease = a gene environment interaction that moves the biological system out of reference “normal” state(s).

● Basic biology question: Identify features and their connections/interactions across organizational scales of a biological system state.
Characterizing a biological system
Microscopic molecular scale objects / attributes
Macroscopic large scale,phenomenological observations
GenotypeProtein networksTranscriptome
Epigenetics
PhenotypeCellular organization
MorphologyBehavior
TASK: Characterize object /
attribute / environment interaction
Environment
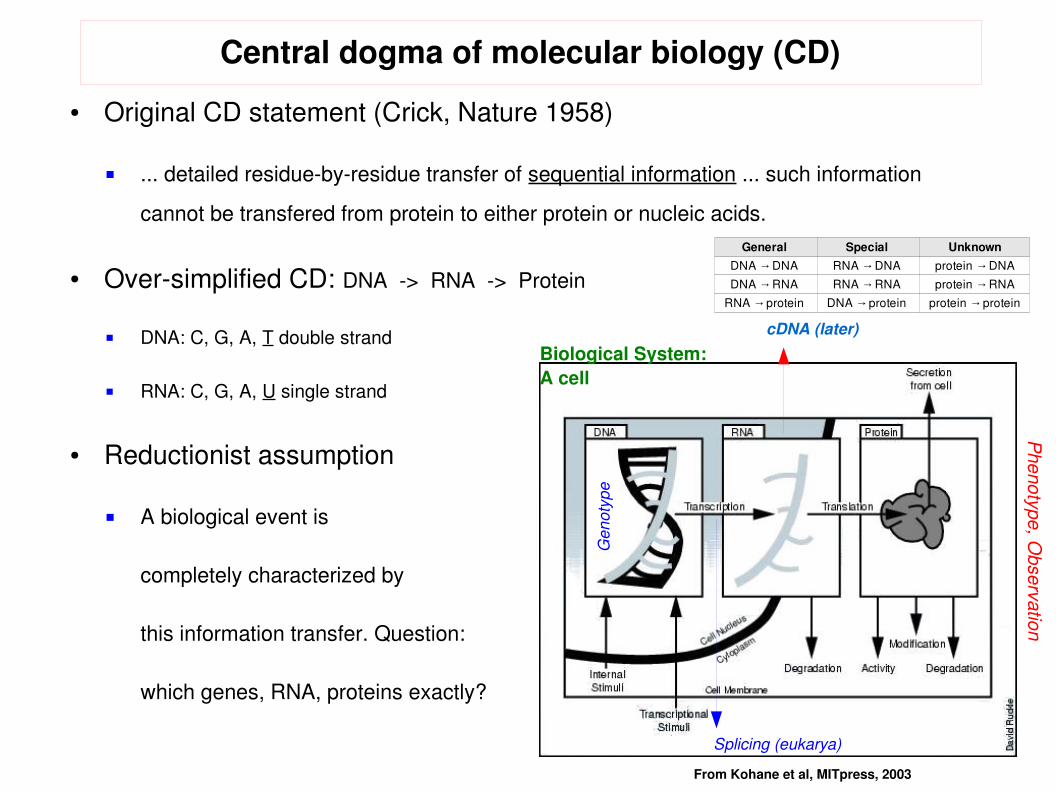
● Original CD statement (Crick, Nature 1958)
... detailed residuebyresidue transfer of sequential information ... such information
cannot be transfered from protein to either protein or nucleic acids.
● Oversimplified CD: DNA > RNA > Protein
DNA: C, G, A, T double strand
RNA: C, G, A, U single strand
● Reductionist assumption
A biological event is
completely characterized by
this information transfer. Question:
which genes, RNA, proteins exactly?
Central dogma of molecular biology (CD)P
henotyp e, Observ ation
From Kohane et al, MITpress, 2003
Gen
otyp
e
Splicing (eukarya)
cDNA (later)
Biological System: A cell
General Special UnknownDNA DNA → RNA DNA → protein DNA→
DNA RNA → RNA RNA → protein RNA→
RNA protein → DNA protein → protein protein→
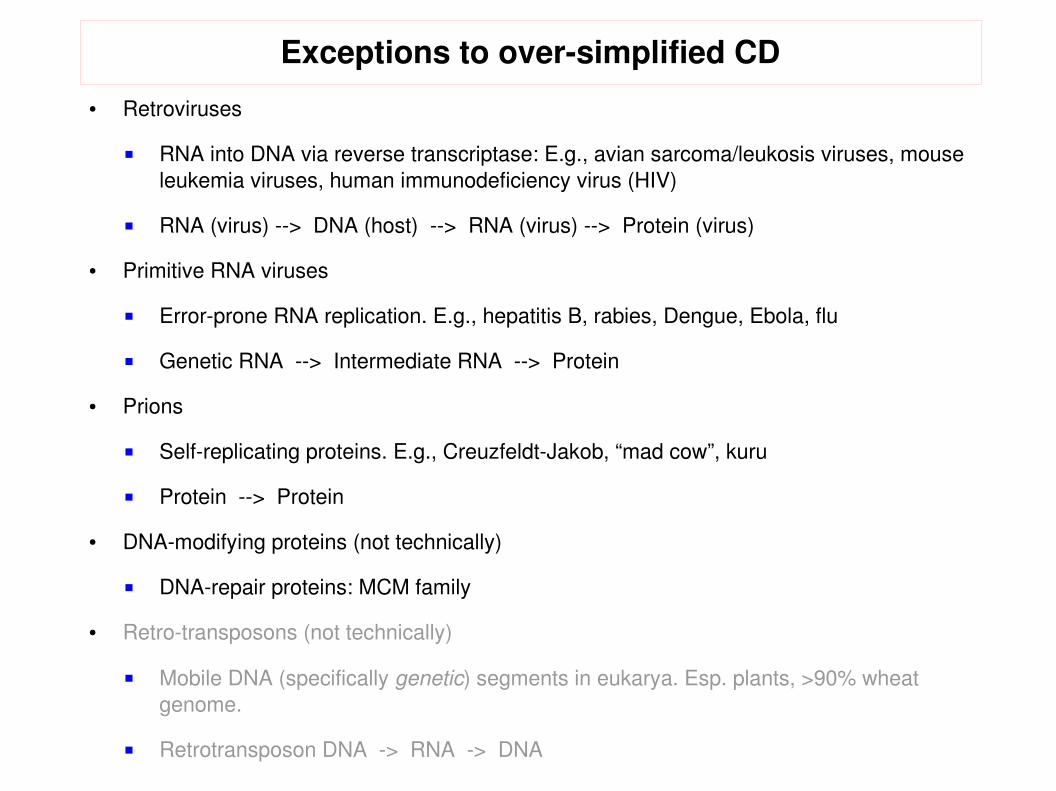
Exceptions to oversimplified CD● Retroviruses
RNA into DNA via reverse transcriptase: E.g., avian sarcoma/leukosis viruses, mouse leukemia viruses, human immunodeficiency virus (HIV)
RNA (virus) > DNA (host) > RNA (virus) > Protein (virus)
● Primitive RNA viruses
Errorprone RNA replication. E.g., hepatitis B, rabies, Dengue, Ebola, flu
Genetic RNA > Intermediate RNA > Protein
● Prions
Selfreplicating proteins. E.g., CreuzfeldtJakob, “mad cow”, kuru
Protein > Protein
● DNAmodifying proteins (not technically)
DNArepair proteins: MCM family
● Retrotransposons (not technically)
Mobile DNA (specifically genetic) segments in eukarya. Esp. plants, >90% wheat genome.
Retrotransposon DNA > RNA > DNA
DNA is a molecule,
what is a gene ?
1. “Gene” is an abstract concept – agent transmitting
biological information.
2. DNA is one of many classes of molecules
in a cell.
3. How do we know that DNA is the class of molecules
that transmit biological information, phenotype ?
DNA = Gene ?
Concept of a gene
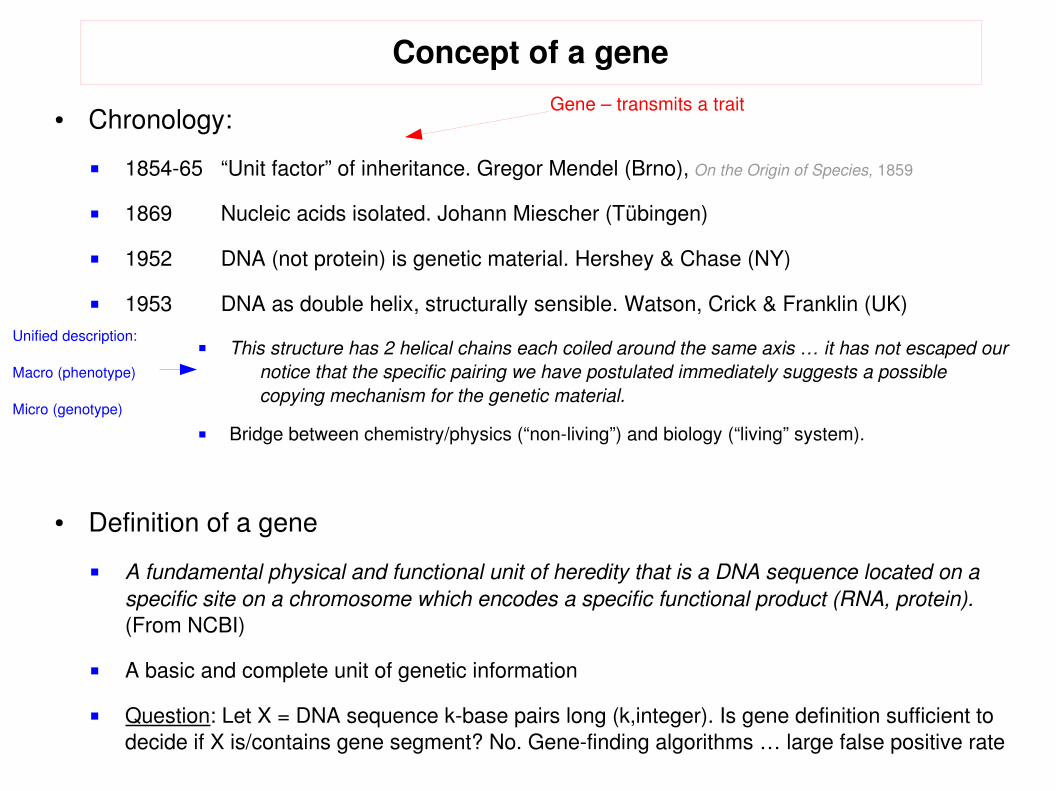
● Chronology:
185465 “Unit factor” of inheritance. Gregor Mendel (Brno), On the Origin of Species, 1859
1869 Nucleic acids isolated. Johann Miescher (Tübingen)
1952 DNA (not protein) is genetic material. Hershey & Chase (NY)
1953 DNA as double helix, structurally sensible. Watson, Crick & Franklin (UK)
This structure has 2 helical chains each coiled around the same axis … it has not escaped our notice that the specific pairing we have postulated immediately suggests a possible copying mechanism for the genetic material.
Bridge between chemistry/physics (“nonliving”) and biology (“living” system).
● Definition of a gene
A fundamental physical and functional unit of heredity that is a DNA sequence located on a specific site on a chromosome which encodes a specific functional product (RNA, protein). (From NCBI)
A basic and complete unit of genetic information
Question: Let X = DNA sequence kbase pairs long (k,integer). Is gene definition sufficient to decide if X is/contains gene segment? No. Genefinding algorithms … large false positive rate
Unified description:
Macro (phenotype)
Micro (genotype)
Gene – transmits a trait
Concept of a gene
● Definition of genome / genotype
Genome the total genetic material (DNA) in a living organism. Genotype – total genetic information in a living organism. (From NCBI)
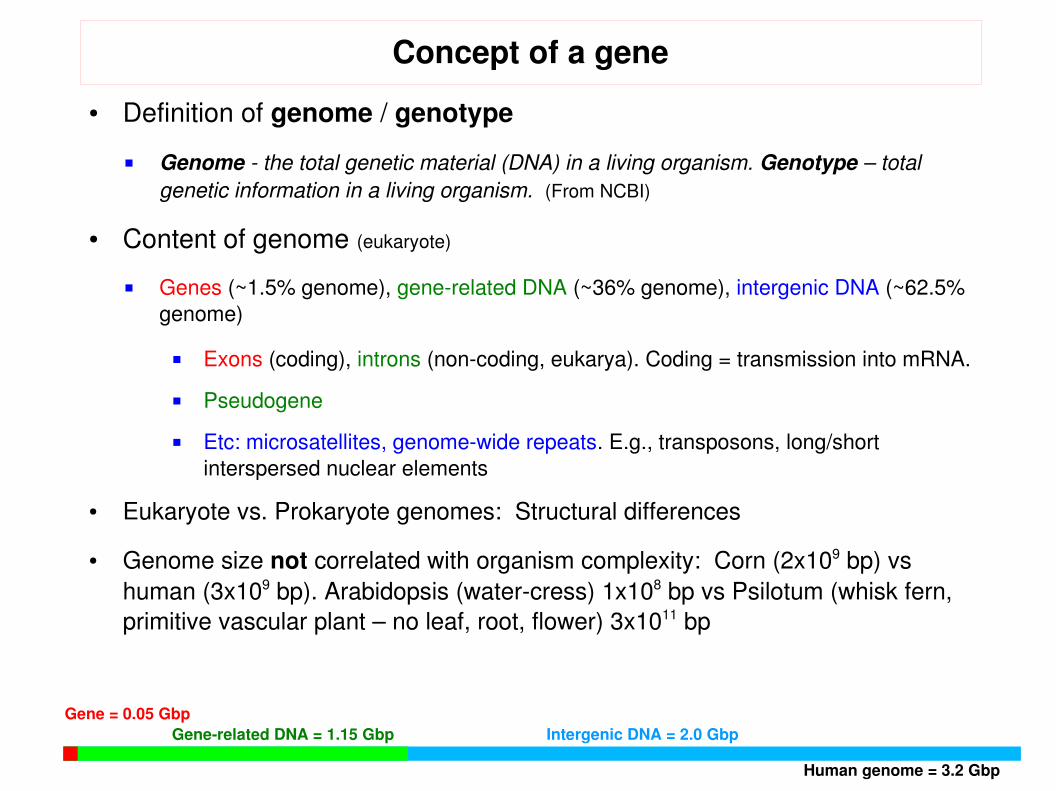
● Content of genome (eukaryote)
Genes (~1.5% genome), generelated DNA (~36% genome), intergenic DNA (~62.5% genome)
Exons (coding), introns (noncoding, eukarya). Coding = transmission into mRNA.
Pseudogene
Etc: microsatellites, genomewide repeats. E.g., transposons, long/short interspersed nuclear elements
● Eukaryote vs. Prokaryote genomes: Structural differences
● Genome size not correlated with organism complexity: Corn (2x10⁹ bp) vs human (3x10⁹ bp). Arabidopsis (watercress) 1x10⁸ bp vs Psilotum (whisk fern, primitive vascular plant – no leaf, root, flower) 3x10¹¹ bp
Human genome = 3.2 Gbp
Gene = 0.05 Gbp Generelated DNA = 1.15 Gbp Intergenic DNA = 2.0 Gbp

Concept of a gene● Gene coding regions (exons) not contiguous along chromosomal stretch. Non coding
introns in between.
Figure 1.14. A segment of the human genome showing the location of genes, gene segments, pseudogenes, genome-wide repeats and microsatellites in a 50-kb segment of the human beta T-cell receptor locuson chromosome 7. Redrawn from Rowen et al. (1996). From T.A. Brown, Genomes 2
Intergenic DNA = Junk ? Yes & No. Palazzo AF, Gregory TR (2014) The Case for Junk DNA. PLoS Genet 10(5)Rands et al. (2014) 8.2% of the Human Genome Is Constrained: Variation in Rates of Turnover across Functional Element Classes in the Human Lineage. PLoS Genetics 10(7)
Palazzo & Gregory, PLoS Genetics, 2014
Genome size, log
Gene 1 Intergenic
Intergenic
Gene 2 intergenic
Gene 3 Intergenic
Pseudogene Intergenic
Concept of gene expression
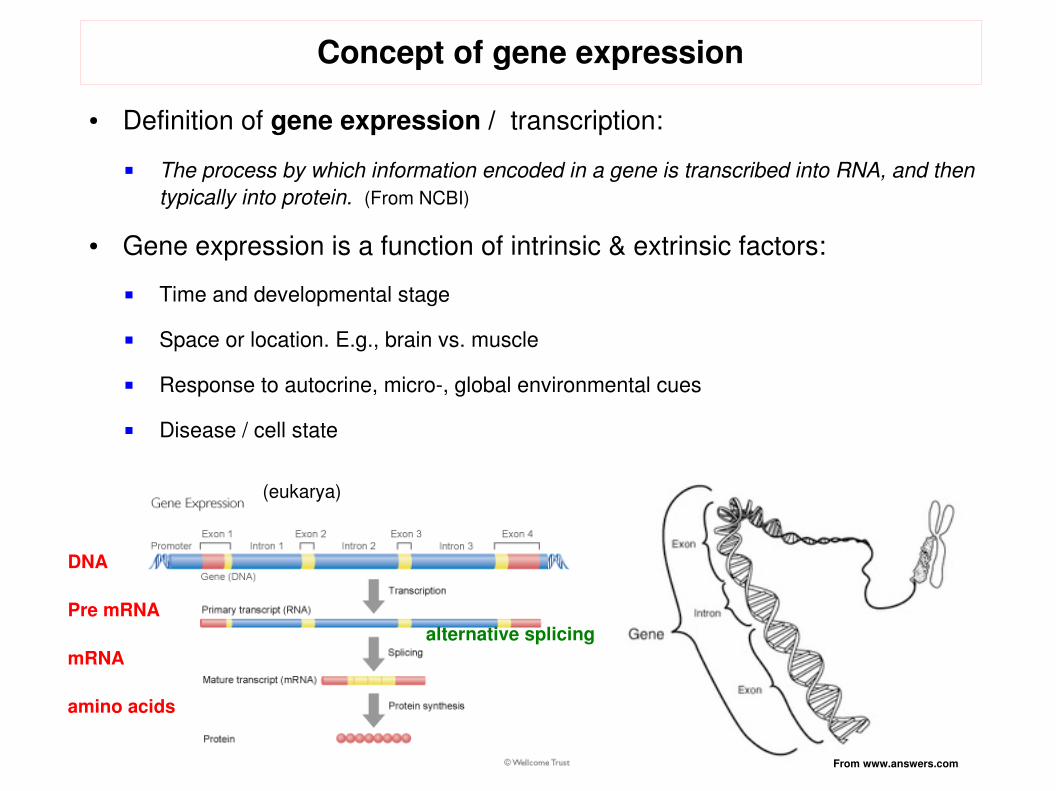
● Definition of gene expression / transcription:
The process by which information encoded in a gene is transcribed into RNA, and then typically into protein. (From NCBI)
● Gene expression is a function of intrinsic & extrinsic factors:
Time and developmental stage
Space or location. E.g., brain vs. muscle
Response to autocrine, micro, global environmental cues
Disease / cell state
From www.answers.com
(eukarya)
DNA
Pre mRNA alternative splicingmRNA
amino acids
Concept of gene expression
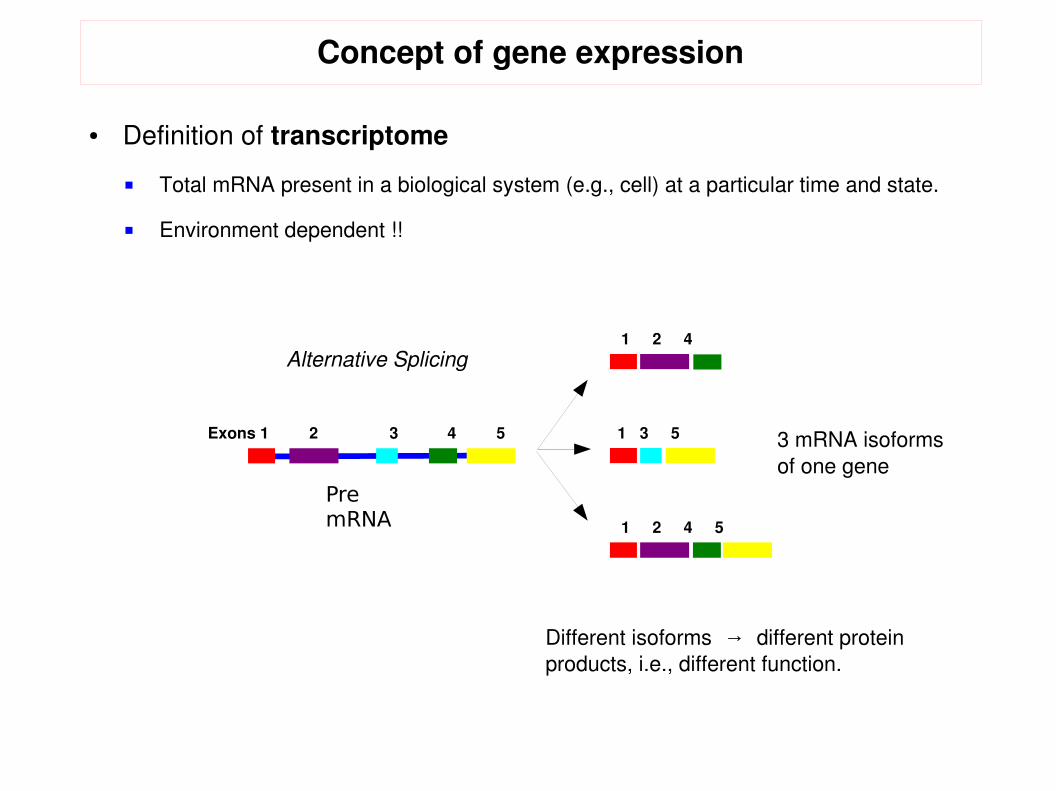
● Definition of transcriptome
Total mRNA present in a biological system (e.g., cell) at a particular time and state.
Environment dependent !!
Exons 1 2 3 4 5 1 3 5
1 2 4
1 2 4 5
Alternative Splicing
Pre mRNA
3 mRNA isoformsof one gene
Different isoforms different protein →products, i.e., different function.
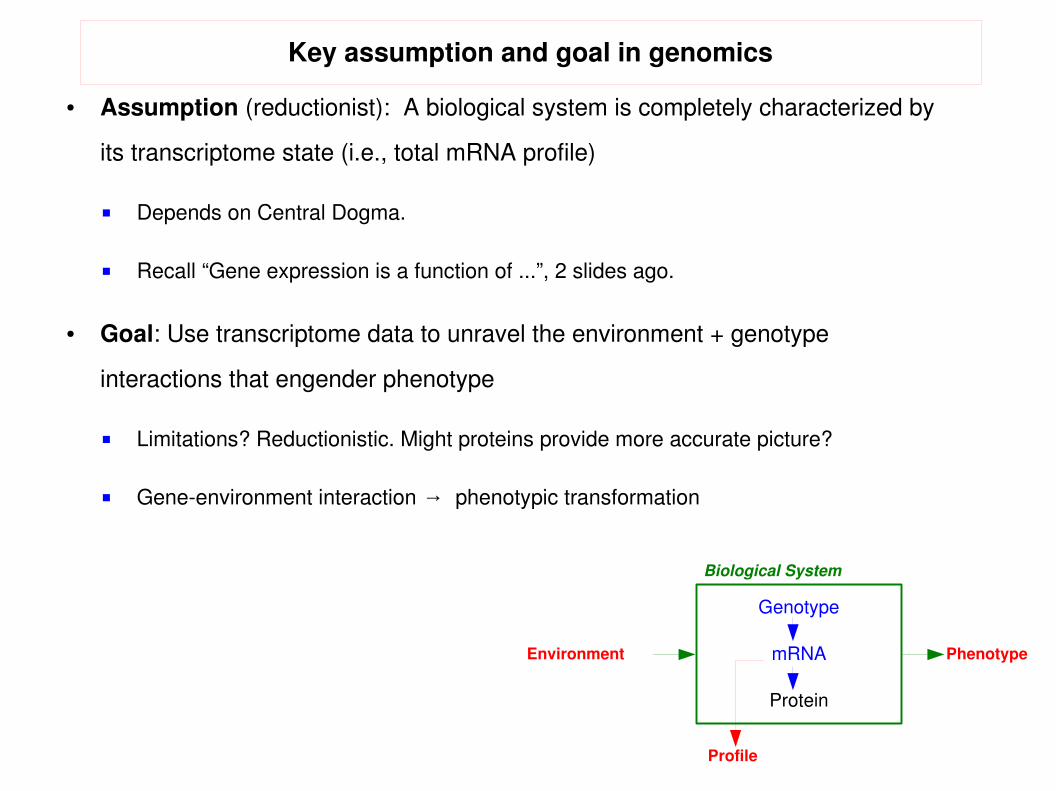
● Assumption (reductionist): A biological system is completely characterized by
its transcriptome state (i.e., total mRNA profile)
Depends on Central Dogma.
Recall “Gene expression is a function of ...”, 2 slides ago.
● Goal: Use transcriptome data to unravel the environment + genotype
interactions that engender phenotype
Limitations? Reductionistic. Might proteins provide more accurate picture?
Geneenvironment interaction phenotypic transformation→
Key assumption and goal in genomics
Genotype
mRNA
Protein
PhenotypeEnvironment
Biological System
Profile
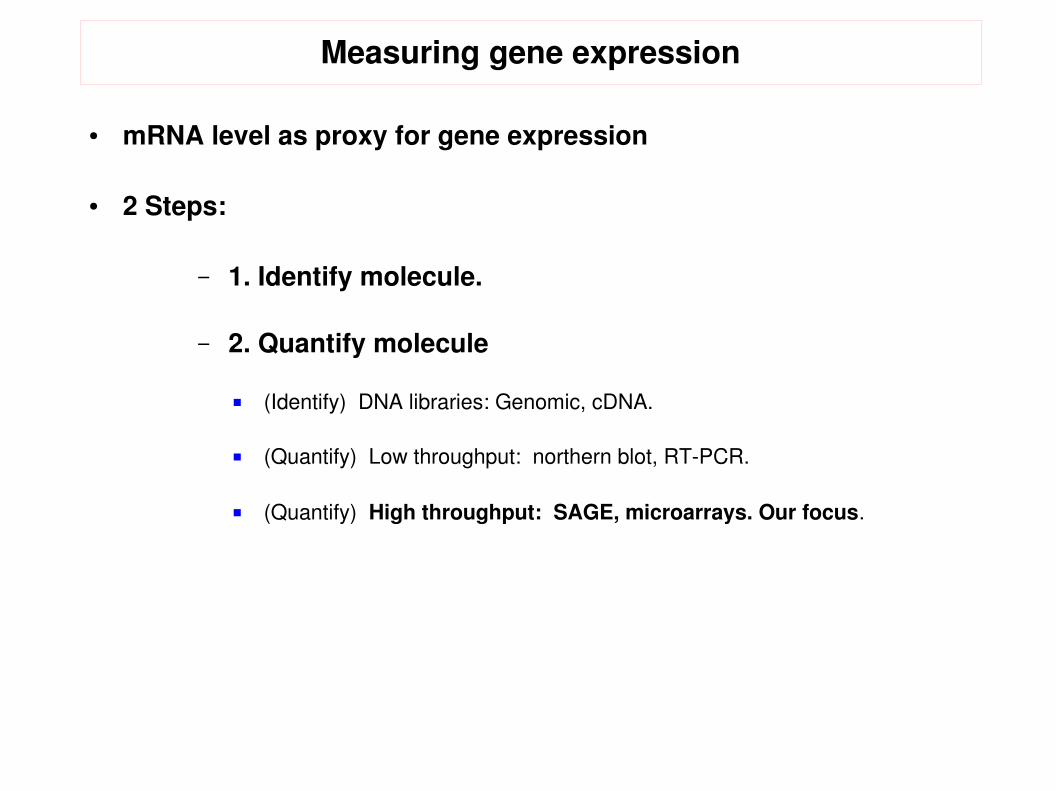
Measuring gene expression
● mRNA level as proxy for gene expression
● 2 Steps:
– 1. Identify molecule.
– 2. Quantify molecule
(Identify) DNA libraries: Genomic, cDNA.
(Quantify) Low throughput: northern blot, RTPCR.
(Quantify) High throughput: SAGE, microarrays. Our focus.

Step 1. DNA libraries (Identification)● DNA libraries = collections of clones DNA fragments: Genomic & cDNA via
sequencing. Assembling fragments into complete sequence is bioinformatics challenge: 1. coverage (redundancy), 2. minimal sequence length
● Genomic libraries
Overlapping genomic DNA fragments representing ~entire genome of an organism.
● Complementary DNA libraries (genomic material that is “expressed”, genes)
All mRNA species in a particular biological system/state. Contains only coding regions of genome (minus introns), proxy for expressed proteins.
mRNA cDNA (chemically more stable) → → Expressed Sequence Tags. Each EST gets a Genbank ID.
A gene may be “covered” by >1 EST's. Redundancy. Human genome >4 million →EST's. Estimate # of genes in human genome ~30K.
EST's screened. All EST's associated with a particular gene forms an EST cluster for that gene This cluster is assigned a Unigene ID.
Biological materialwith mRNA mRNA cDNA
Biological system at specific state
(organism, region, time)
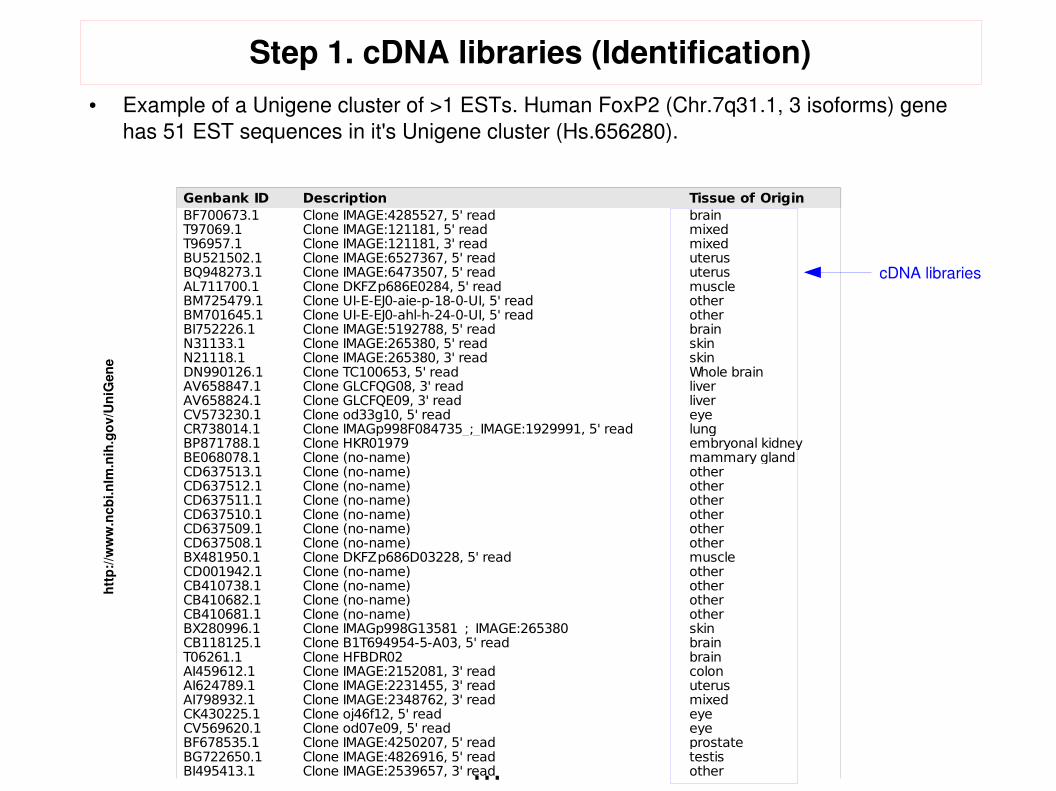
Step 1. cDNA libraries (Identification)● Example of a Unigene cluster of >1 ESTs. Human FoxP2 (Chr.7q31.1, 3 isoforms) gene
has 51 EST sequences in it's Unigene cluster (Hs.656280).
Genbank ID Description Tissue of OriginBF700673.1 Clone IMAGE:4285527, 5' read brain T97069.1 Clone IMAGE:121181, 5' read mixed T96957.1 Clone IMAGE:121181, 3' read mixed BU521502.1 Clone IMAGE:6527367, 5' read uterus BQ948273.1 Clone IMAGE:6473507, 5' read uterus AL711700.1 Clone DKFZp686E0284, 5' read muscle BM725479.1 Clone UI-E-EJ0-aie-p-18-0-UI, 5' read other BM701645.1 Clone UI-E-EJ0-ahl-h-24-0-UI, 5' read other BI752226.1 Clone IMAGE:5192788, 5' read brain N31133.1 Clone IMAGE:265380, 5' read skin N21118.1 Clone IMAGE:265380, 3' read skin DN990126.1 Clone TC100653, 5' read Whole brain AV658847.1 Clone GLCFQG08, 3' read liver AV658824.1 Clone GLCFQE09, 3' read liver CV573230.1 Clone od33g10, 5' read eye CR738014.1 Clone IMAGp998F084735_;_IMAGE:1929991, 5' read lung BP871788.1 Clone HKR01979 embryonal kidney BE068078.1 Clone (no-name) mammary gland CD637513.1 Clone (no-name) other CD637512.1 Clone (no-name) other CD637511.1 Clone (no-name) other CD637510.1 Clone (no-name) other CD637509.1 Clone (no-name) other CD637508.1 Clone (no-name) other BX481950.1 Clone DKFZp686D03228, 5' read muscle CD001942.1 Clone (no-name) other CB410738.1 Clone (no-name) other CB410682.1 Clone (no-name) other CB410681.1 Clone (no-name) other BX280996.1 Clone IMAGp998G13581_;_IMAGE:265380 skin CB118125.1 Clone B1T694954-5-A03, 5' read brain T06261.1 Clone HFBDR02 brain AI459612.1 Clone IMAGE:2152081, 3' read colon AI624789.1 Clone IMAGE:2231455, 3' read uterus AI798932.1 Clone IMAGE:2348762, 3' read mixed CK430225.1 Clone oj46f12, 5' read eye CV569620.1 Clone od07e09, 5' read eye BF678535.1 Clone IMAGE:4250207, 5' read prostate BG722650.1 Clone IMAGE:4826916, 5' read testis BI495413.1 Clone IMAGE:2539657, 3' read other ...
http
://w
ww
.ncb
i.nlm
.nih
.gov
/Uni
Gen
e
cDNA libraries
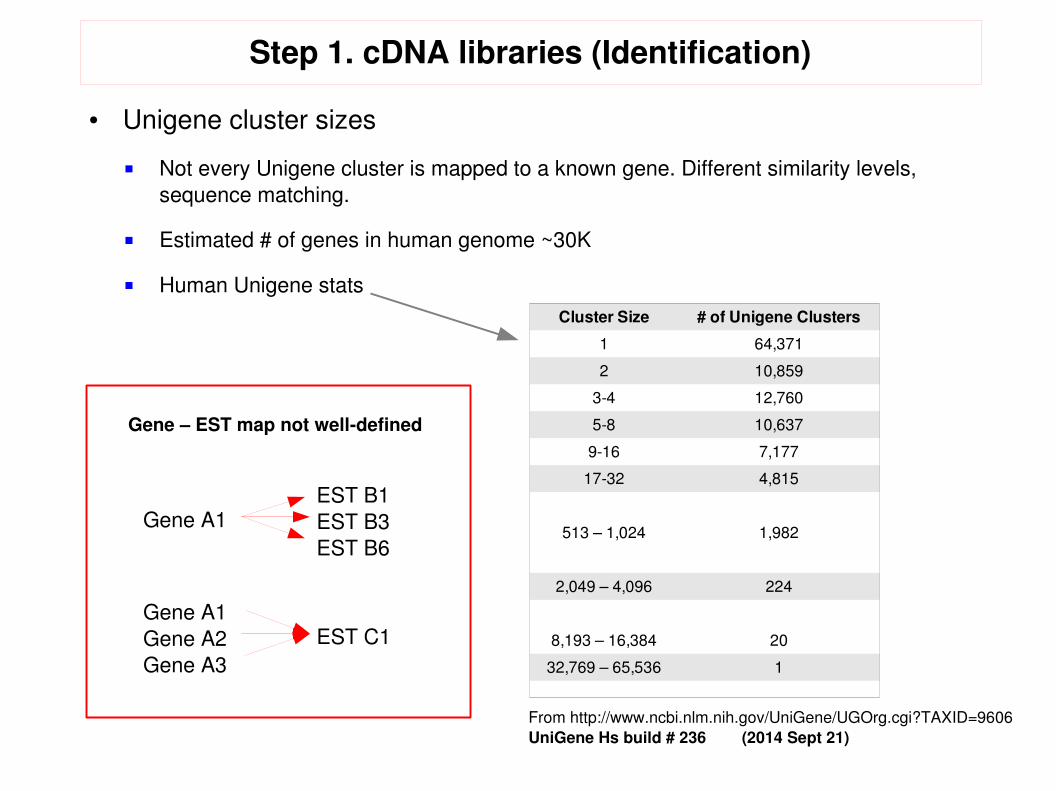
Step 1. cDNA libraries (Identification)
● Unigene cluster sizes
Not every Unigene cluster is mapped to a known gene. Different similarity levels, sequence matching.
Estimated # of genes in human genome ~30K
Human Unigene statsCluster Size # of Unigene Clusters
1 64,371
2 10,859
34 12,760
58 10,637
916 7,177
1732 4,815
513 – 1,024 1,982
2,049 – 4,096 224
8,193 – 16,384 20
32,769 – 65,536 1
Gene A1EST B1EST B3EST B6
Gene A1Gene A2Gene A3
EST C1
Gene – EST map not welldefined
From http://www.ncbi.nlm.nih.gov/UniGene/UGOrg.cgi?TAXID=9606UniGene Hs build # 236 (2014 Sept 21)
Step 2. Comparing between cDNA libraries
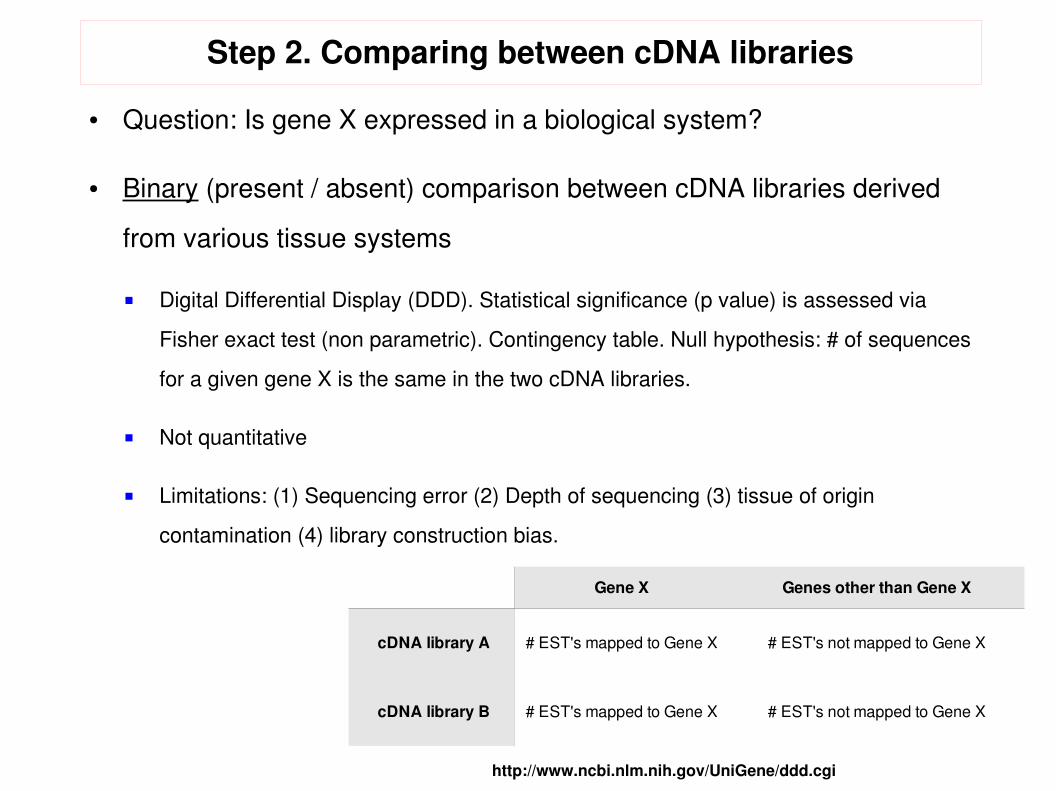
● Question: Is gene X expressed in a biological system?
● Binary (present / absent) comparison between cDNA libraries derived
from various tissue systems
Digital Differential Display (DDD). Statistical significance (p value) is assessed via
Fisher exact test (non parametric). Contingency table. Null hypothesis: # of sequences
for a given gene X is the same in the two cDNA libraries.
Not quantitative
Limitations: (1) Sequencing error (2) Depth of sequencing (3) tissue of origin
contamination (4) library construction bias.
Gene X Genes other than Gene X
cDNA library A # EST's mapped to Gene X # EST's not mapped to Gene X
cDNA library B # EST's mapped to Gene X # EST's not mapped to Gene X
http://www.ncbi.nlm.nih.gov/UniGene/ddd.cgi

Step 2. SAGE (Quantification)
● Serial Analysis of Gene Expression
Need SAGE library: a 11 map between SAGE tags and genes & EST's
Get mRNA to construct cDNA.
From each cDNA transcript, cut a short sequence tag (SAGE tag) of 1014 bps from a specific position (3'end typically) that uniquely identifies the transcript.
Tags have uniform length.
Concatenate all SAGE tags into one concatamer > clone and sequence.
# of times a specific tag observed = expression level of specific gene/mRNA
● http://www.scq.ubc.ca/painlessgeneexpressionprofilingsageserialanalysisofgeneexpression/
From www.sagenet.org, Note cartoon hides a lot of vital details!
concatamer
uniform lengths
di-tags
AAAAA
TTTTT
AAAAA
TTTTT
AAAAA
TTTTT
AAAAA
TTTTT
AAAAA
TTTTT
AAAAA
TTTTT
AAAAA
TTTTT
PolyA cDNA

Step 2. SAGE (Quantification)
Example of SAGE result: 3 types of transcripts relative to SAGE library
Tag_Sequence Count Gene Name
ATATTGTCAA 5 translation elongation factor 1 gamma
AAATCGGAAT 2 Tcomplex protein 1, zsubunit
ACCGCCTTCG 1 no match
GCCTTGTTTA 81 rpa1 mRNA fragment for r ribosomal protein
GTTAACCATC 45 ubiquitin 52AA extension protein
CCGCCGTGGG 9 SF1 protein (SF1 gene)
TTTTTGTTAA 99 NADH dehydrogenase 3 (ND3) gene
GCAAAACCGG 63 rpL21
GGAGCCCGCC 45 ribosomal protein L18a
GCCCGCAACA 34 ribosomal protein S31
GCCGAAGTTG 50 ribosomal protein S5 homolog (M(1)15D)
GTGGCTTACA 4 EST BB205679
Novel gene ?
Known gene
EST
Step 2. SAGE (Quantification)
● SAGE limitations:
Tag specificity. Short SAGE tag size may lead to identification problems. 1 tag
mapping to >1 genes is a problem.
Restriction enzyme action variability. Each SAGE tag must have constant length,
otherwise problems arise in sequencing concatamer. Restriction enzyme may not yield
tags of uniform length. Not all mRNA species have the same enzyme recognition
sequence. Temperature dependency of enzyme.
What is appropriate control/reference system for comparison? Really a more general
problem that we will revisit as we cover microarrays and other highthroughput
assaying technologies.
Step 2. DNA microarrays (Quantification)
● What is a DNA microarray (chip) ?
A collection of singlestranded DNA (known sequences of genes / EST's) anchored at one end onto a substrate, typically in the form of a gridded array. Different DNA species placed on separate grids.
ssDNA fragments (called probes), not entire gene sequence is placed. Why?
Inspired by PCR & southern blots for DNA. Exploits parallelism.
Mechanistic principle: Nucleic acid complementarity – i.e., hybridization of complement partners, A ↔ T, G ↔ C.
ssDNA on chip hybridizes to complementary strand in solution (derived from biological system). Complementary strand is fluorescent labeled.
Assumption: Fluorescence is (linearly) proportional to gene expression level.
● Microarray oligo probe design technicalities
GC content: Hybridization (binding) energy for GC > AT. Introduces nonlinearity in hybridization rate for cDNA species with different %CG content. General problem.
Distance of ssDNA design sequence from 3' end. General problem.
Step 2. DNA microarrays (Quantification)
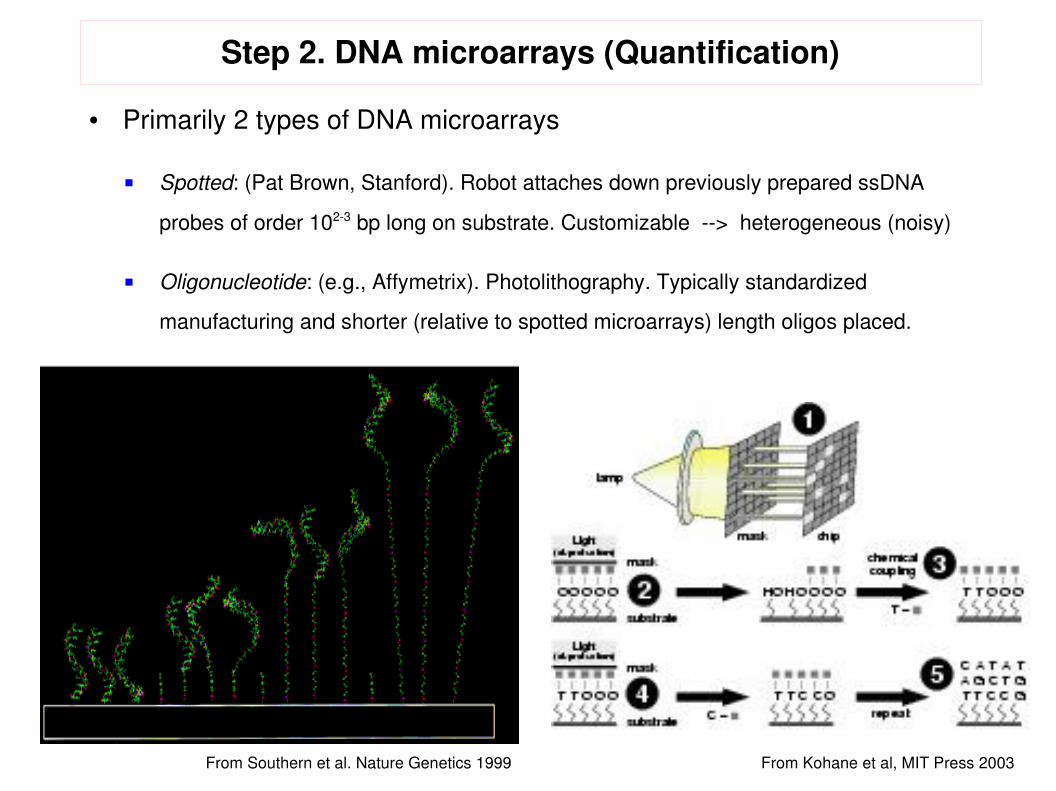
● Primarily 2 types of DNA microarrays
Spotted: (Pat Brown, Stanford). Robot attaches down previously prepared ssDNA
probes of order 1023 bp long on substrate. Customizable > heterogeneous (noisy)
Oligonucleotide: (e.g., Affymetrix). Photolithography. Typically standardized
manufacturing and shorter (relative to spotted microarrays) length oligos placed.
From Southern et al. Nature Genetics 1999 From Kohane et al, MIT Press 2003
Step 2. DNA microarrays (Quantification)
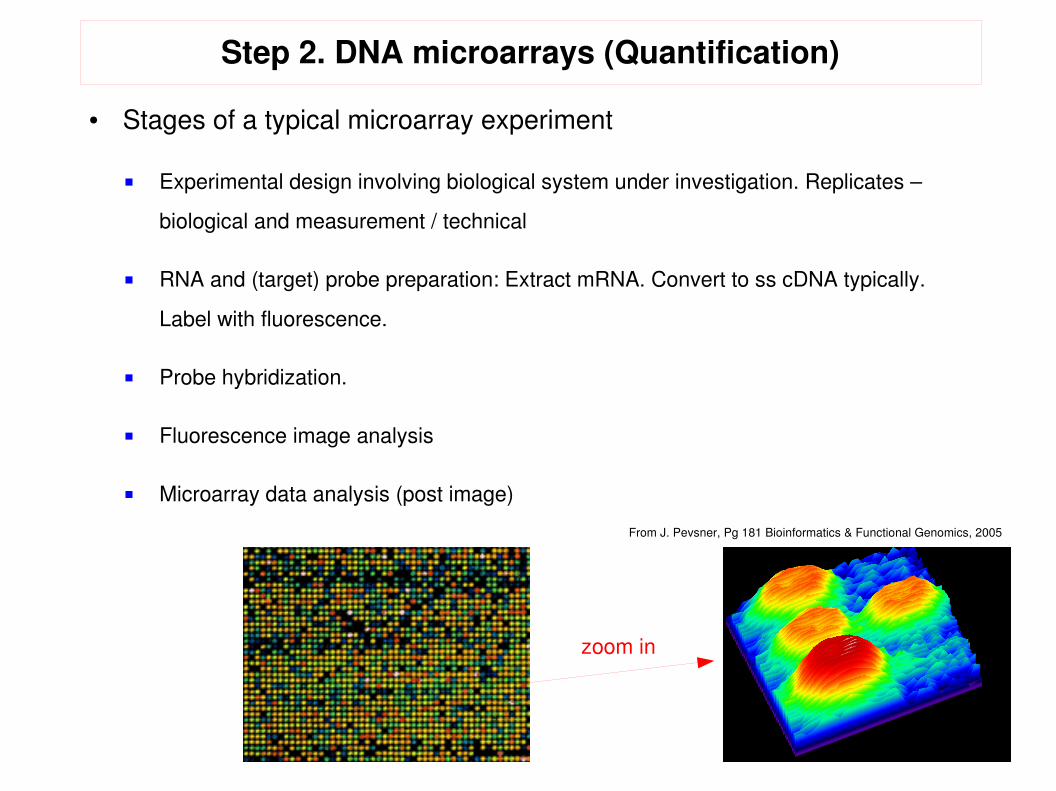
● Stages of a typical microarray experiment
Experimental design involving biological system under investigation. Replicates –
biological and measurement / technical
RNA and (target) probe preparation: Extract mRNA. Convert to ss cDNA typically.
Label with fluorescence.
Probe hybridization.
Fluorescence image analysis
Microarray data analysis (post image)
From J. Pevsner, Pg 181 Bioinformatics & Functional Genomics, 2005
zoom in

Step 2. DNA microarrays (Quantification)
cRNA
Competitive,2channel
Control Test
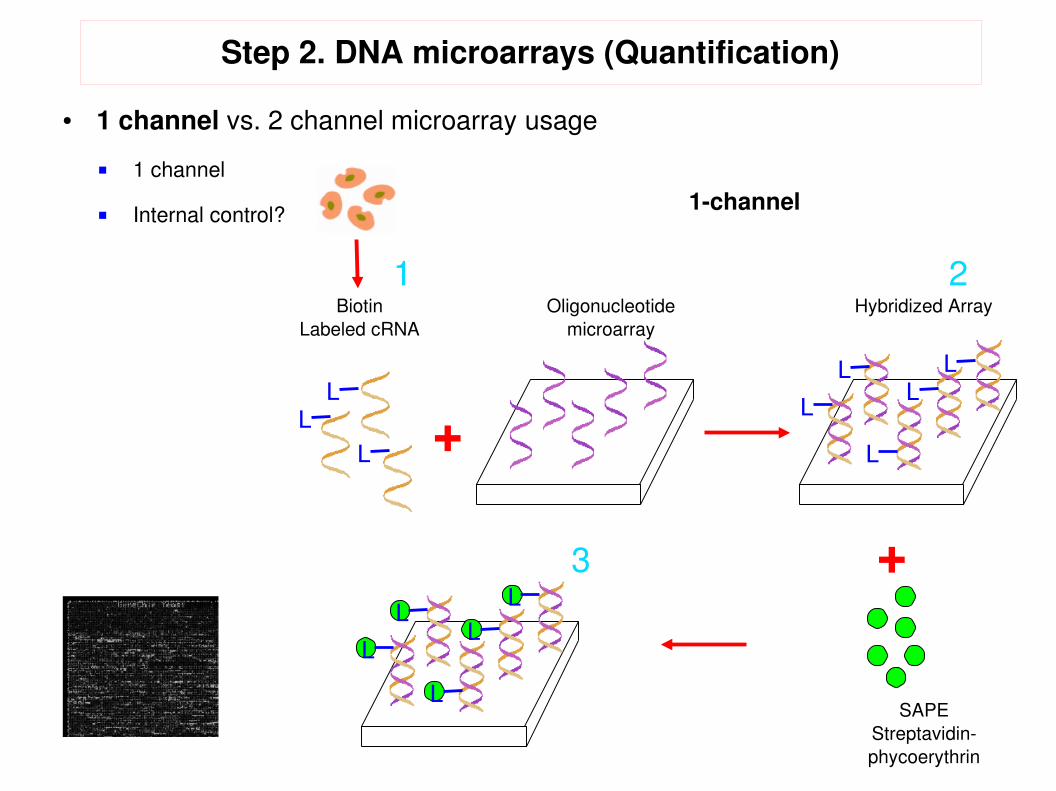
● 1 channel vs. 2 channel microarray usage
2 channel
Internal control for fluorescence
Step 2. DNA microarrays (Quantification)
● 1 channel vs. 2 channel microarray usage
1 channel
Internal control?
+
Oligonucleotide microarray
BiotinLabeled cRNA
Hybridized Array
LL
L
L
L
L
LL
L
L
LL
L
SAPEStreptavidinphycoerythrin
+
1 2
3
1channel
Step 2. DNA microarrays (Quantification)
● Canonical usage and experimental designs
Comparing two groups. E.g., tumor/cancer vs. “normal” tissue
Time course (dosagelevel) profiling
Suitable reference state is a general problem
Typical “statisticallysound” experiment design principles apply. Sample pooling
mRNA? For 2channel experiments: Dye swap.
● Microarray experiment (biological) assumptions
Central Dogma holds. Specifically that mRNA transcription is proportional to its
associated protein translation
All mRNA have ~identical lifespans. ~Uniform degradation rate.
Principal cellular activities are ~entirely characterized by the transcriptome.
Step 2. DNA microarrays (Quantification)
● Generalizing chip parallelism/complementarity principle to measuring other principal
biologicalcomponents/characteristics
Protein microarrays. Identify protein targets, e.g, other proteins (proteinprotein interaction),
mRNA, other bioactive small molecules.
Tissue microarrays. Paraffin blocks of distinct biological tissue cores. Simultaneous
histologic analysis, immunohistochemical (protein) & in situ (mRNA) analyses.
Reverse transfection microarrays. cDNA probes on grid with a cell culture on top. Cells
assimilate probes.
● Limitations:
Probe specificity. Cross ( RNA) species hybridization, promiscuous probes.
Nonuniform RNA degradation.
“Noise”. Next time.
● Future: Next generation sequencing. High efficiency, low cost.
– http://www.nature.com/nmeth/journal/v5/n1/full/nmeth1156.html
Characterizing a biological system.
Organizational scales and constituent features of a biological system Central Dogma of molecular biology (CD):
Centrality of genes in investigations of biological studies. Reductionism.
Identification of gene to DNA. The concept of a gene, gene expression, transcriptome.
2 central objectives in quantitative genomics
1. Identify genes 2. Quantify gene expression. Highthroughput gene expression quantification principles / technologies:
Sequencing SAGE
Nucleotide complementarity – Microarrays
Generalizations. Next Generation Sequencing, RNASeq.
References.
Next lecture: Survey comp methods for modeling highthroughput transcriptome data, an application in cancer biology.
Outline revisited

References
● ReaderFriendly References
T.A. Brown. Genomes. 2nd edition. WileyLiss, 2002. This is a comprehensive,
highlyreadable biologically oriented text on genome. Entire book is FREE online at
www.ncbi.nlm.nih.gov/books
NCBI has a many userfriendly primers on genomic biology:
www.ncbi.nlm.nih.gov/books/NBK2345/. Coffee Break section, and library of
searchable free books / tutorials
J Pevsner. Bioinformatics & Functional Genomics. John Wiley 2003.
IS Kohane, AT Kho, AJ Butte. Microarrays for an Integrative Genomics. MIT Press
2003.