Embed Size (px)
Citation preview

Eric Seiser, PhD
Field Application Scientist
Partek Incorporated
Gene Expression Data Analysis
in Partek® Genomics Suite®
HANDS-ON TRAINING
NCI Workshop
December 13th, 2017
Copyright © 2017 Partek Incorporated. All rights reserved.
Contents
Partek Main Dialog………………………….…………………….……………….………………….3
Importing Data from Affymetrix Cel Files……….……………………….………………....……....5
QA & QC……….……………………….…………………………………….…………..……….…..8
Detect Differential Expressed gene.…………….…………….…………………………..………..10
Create Gene List.……………………….…………………………………..……..…………..…......13
Hierarchical Clustering.……………………….…………………………………..……..………......14
Biological Interpretation ……………………………………………………………….………….....16
Filter Options.……………………….…………………………….….……………………………….18
Advanced Analyses..……………….…………………………….….……………………………….19
Independent Analysis…………………………………………………………………………………20
– 2 –
Copyright © 2017 Partek Incorporated. All rights reserved.
Notes:_________________________________________________________________________
______________________________________________________________________________
______________________________________________________________________________
______________________________________________________________________________
______________________________________________________________________________
______________________________________________________________________________
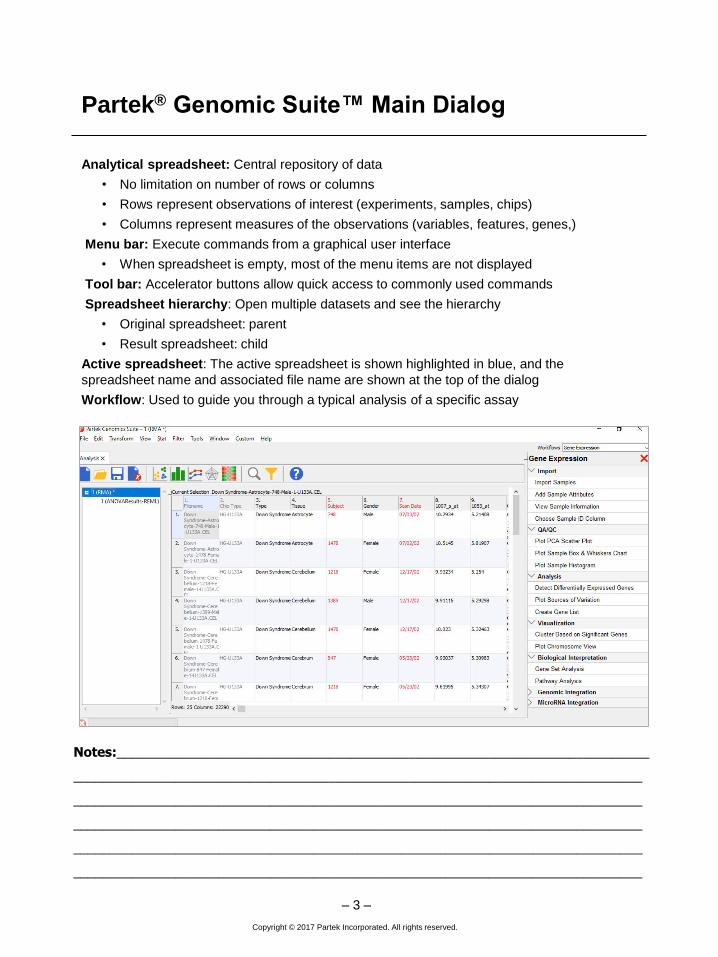
Partek® Genomic Suite™ Main Dialog
Analytical spreadsheet: Central repository of data
• No limitation on number of rows or columns
• Rows represent observations of interest (experiments, samples, chips)
• Columns represent measures of the observations (variables, features, genes,)
Menu bar: Execute commands from a graphical user interface
• When spreadsheet is empty, most of the menu items are not displayed
Tool bar: Accelerator buttons allow quick access to commonly used commands
Spreadsheet hierarchy: Open multiple datasets and see the hierarchy
• Original spreadsheet: parent
• Result spreadsheet: child
Active spreadsheet: The active spreadsheet is shown highlighted in blue, and the
spreadsheet name and associated file name are shown at the top of the dialog
Workflow: Used to guide you through a typical analysis of a specific assay
– 3 –
Copyright © 2017 Partek Incorporated. All rights reserved.
Notes:_________________________________________________________________________
______________________________________________________________________________
______________________________________________________________________________
______________________________________________________________________________
______________________________________________________________________________
______________________________________________________________________________
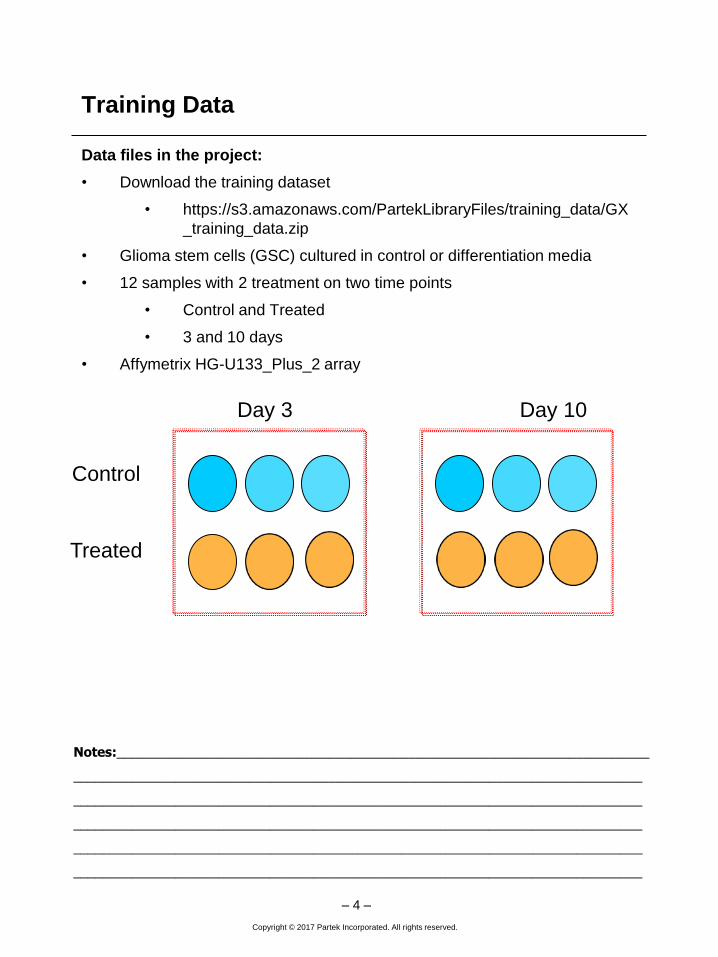
Training Data
Data files in the project:
• Download the training dataset
• https://s3.amazonaws.com/PartekLibraryFiles/training_data/GX
_training_data.zip
• Glioma stem cells (GSC) cultured in control or differentiation media
• 12 samples with 2 treatment on two time points
• Control and Treated
• 3 and 10 days
• Affymetrix HG-U133_Plus_2 array
– 4 –
Control
Treated
Day 3 Day 10
Copyright © 2017 Partek Incorporated. All rights reserved.
Notes:_________________________________________________________________________
______________________________________________________________________________
______________________________________________________________________________
______________________________________________________________________________
______________________________________________________________________________
______________________________________________________________________________
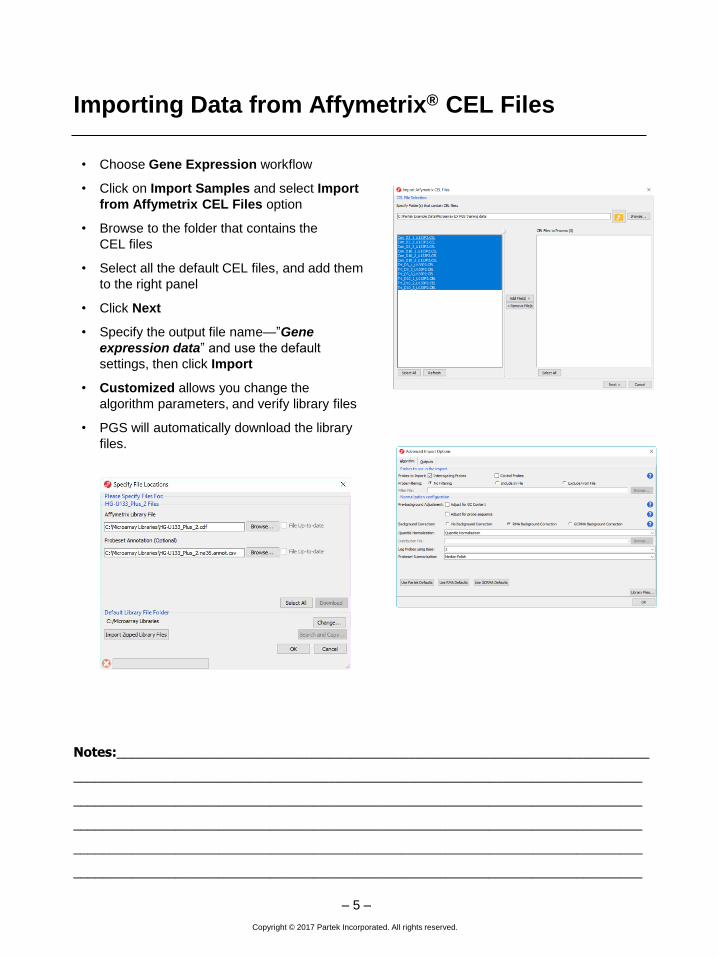
Importing Data from Affymetrix® CEL Files
• Choose Gene Expression workflow
• Click on Import Samples and select Import
from Affymetrix CEL Files option
• Browse to the folder that contains the
CEL files
• Select all the default CEL files, and add them
to the right panel
• Click Next
• Specify the output file name—”Gene
expression data” and use the default
settings, then click Import
• Customized allows you change the
algorithm parameters, and verify library files
• PGS will automatically download the library
files.
– 5 –
Copyright © 2017 Partek Incorporated. All rights reserved.
Notes:_________________________________________________________________________
______________________________________________________________________________
______________________________________________________________________________
______________________________________________________________________________
______________________________________________________________________________
______________________________________________________________________________
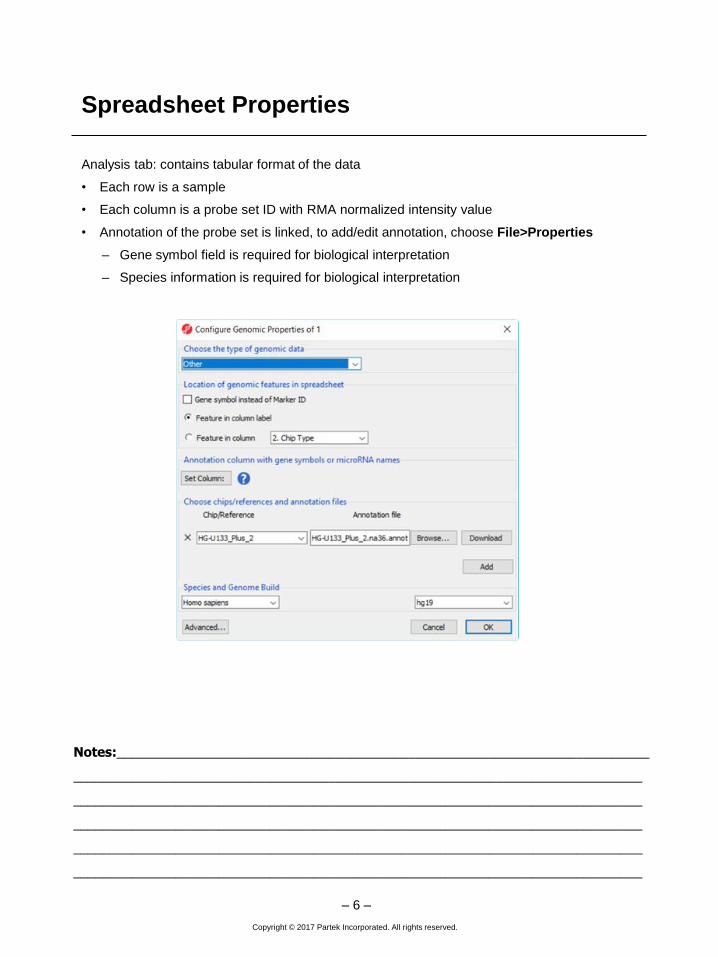
Spreadsheet Properties
Analysis tab: contains tabular format of the data
• Each row is a sample
• Each column is a probe set ID with RMA normalized intensity value
• Annotation of the probe set is linked, to add/edit annotation, choose File>Properties
– Gene symbol field is required for biological interpretation
– Species information is required for biological interpretation
– 6 –
Copyright © 2017 Partek Incorporated. All rights reserved.
Notes:_________________________________________________________________________
______________________________________________________________________________
______________________________________________________________________________
______________________________________________________________________________
______________________________________________________________________________
______________________________________________________________________________
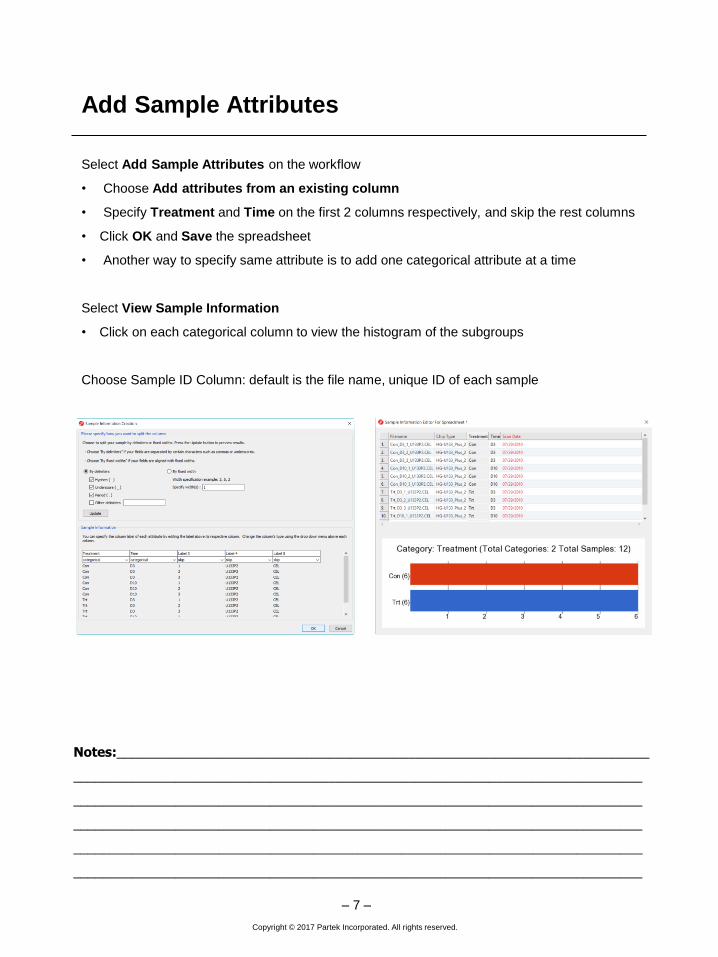
Add Sample Attributes
Select Add Sample Attributes on the workflow
• Choose Add attributes from an existing column
• Specify Treatment and Time on the first 2 columns respectively, and skip the rest columns
• Click OK and Save the spreadsheet
• Another way to specify same attribute is to add one categorical attribute at a time
Select View Sample Information
• Click on each categorical column to view the histogram of the subgroups
Choose Sample ID Column: default is the file name, unique ID of each sample
– 7 –
Copyright © 2017 Partek Incorporated. All rights reserved.
Notes:_________________________________________________________________________
______________________________________________________________________________
______________________________________________________________________________
______________________________________________________________________________
______________________________________________________________________________
______________________________________________________________________________
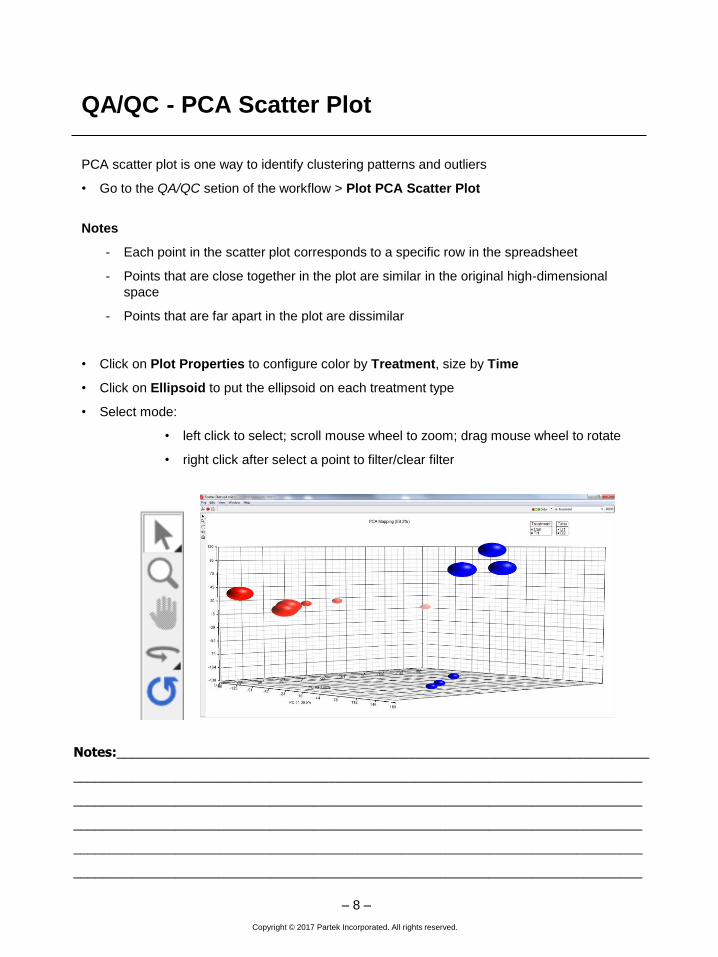
QA/QC - PCA Scatter Plot
PCA scatter plot is one way to identify clustering patterns and outliers
• Go to the QA/QC setion of the workflow > Plot PCA Scatter Plot
Notes
- Each point in the scatter plot corresponds to a specific row in the spreadsheet
- Points that are close together in the plot are similar in the original high-dimensional
space
- Points that are far apart in the plot are dissimilar
• Click on Plot Properties to configure color by Treatment, size by Time
• Click on Ellipsoid to put the ellipsoid on each treatment type
• Select mode:
• left click to select; scroll mouse wheel to zoom; drag mouse wheel to rotate
• right click after select a point to filter/clear filter
– 8 –
Copyright © 2017 Partek Incorporated. All rights reserved.
Notes:_________________________________________________________________________
______________________________________________________________________________
______________________________________________________________________________
______________________________________________________________________________
______________________________________________________________________________
______________________________________________________________________________
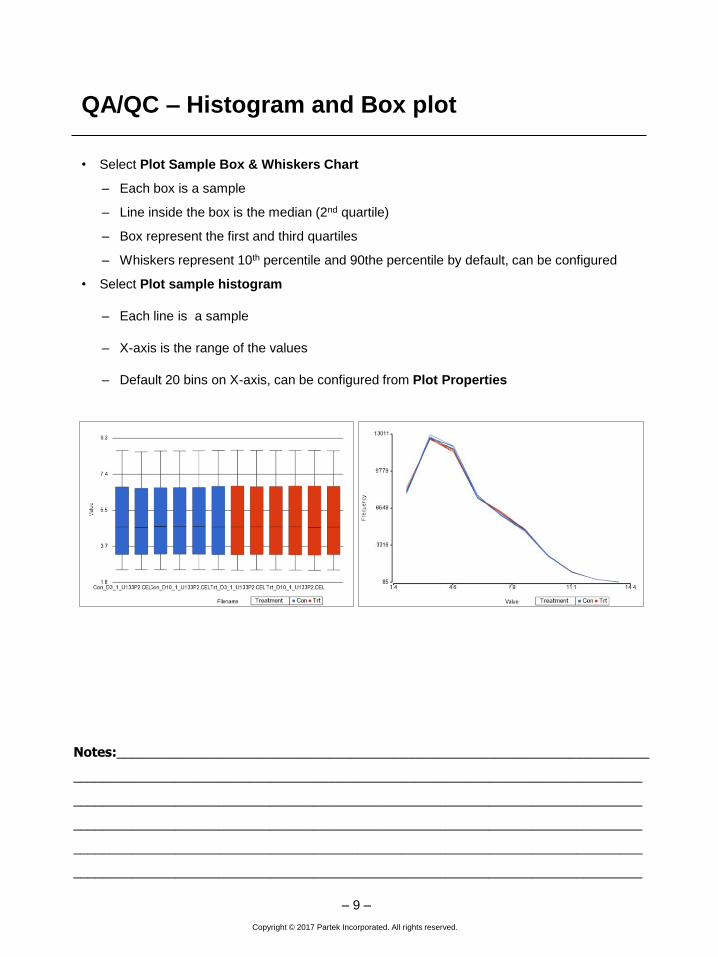
QA/QC – Histogram and Box plot
• Select Plot Sample Box & Whiskers Chart
– Each box is a sample
– Line inside the box is the median (2nd quartile)
– Box represent the first and third quartiles
– Whiskers represent 10th percentile and 90the percentile by default, can be configured
• Select Plot sample histogram
– Each line is a sample
– X-axis is the range of the values
– Default 20 bins on X-axis, can be configured from Plot Properties
– 9 –
Copyright © 2017 Partek Incorporated. All rights reserved.
Notes:_________________________________________________________________________
______________________________________________________________________________
______________________________________________________________________________
______________________________________________________________________________
______________________________________________________________________________
______________________________________________________________________________
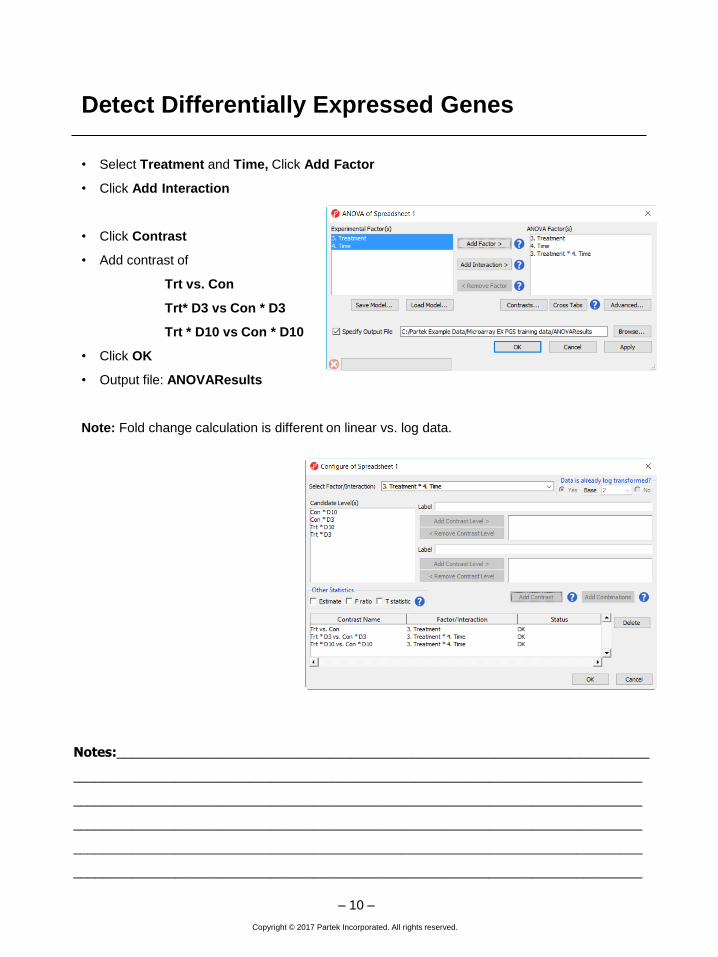
Detect Differentially Expressed Genes
• Select Treatment and Time, Click Add Factor
• Click Add Interaction
• Click Contrast
• Add contrast of
Trt vs. Con
Trt* D3 vs Con * D3
Trt * D10 vs Con * D10
• Click OK
• Output file: ANOVAResults
Note: Fold change calculation is different on linear vs. log data.
– 10 –
Copyright © 2017 Partek Incorporated. All rights reserved.
Notes:_________________________________________________________________________
______________________________________________________________________________
______________________________________________________________________________
______________________________________________________________________________
______________________________________________________________________________
______________________________________________________________________________
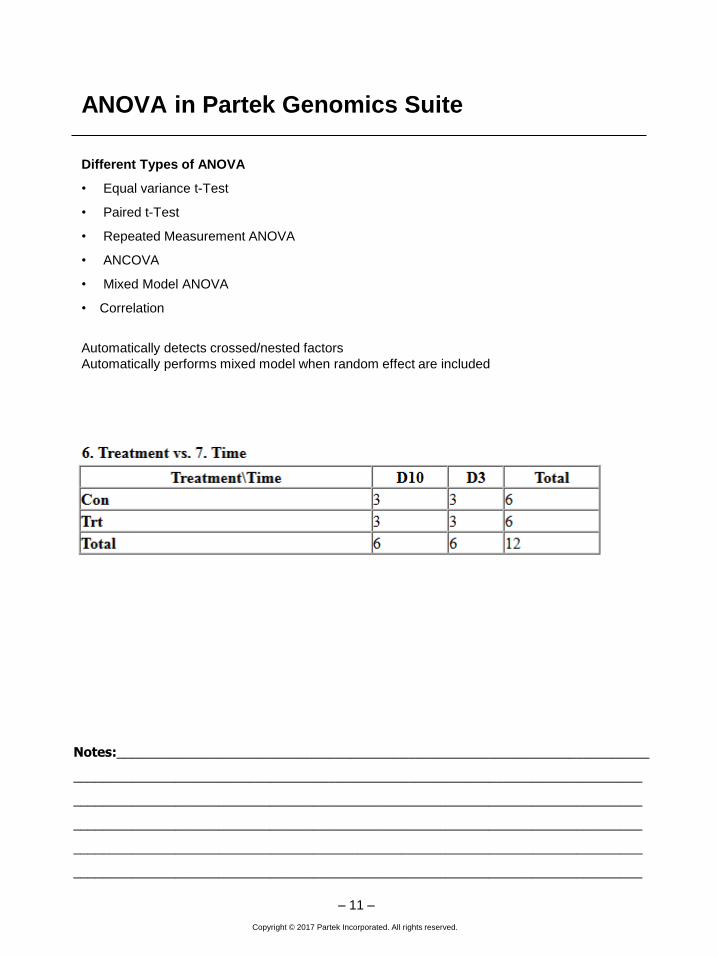
ANOVA in Partek Genomics Suite
Different Types of ANOVA
• Equal variance t-Test
• Paired t-Test
• Repeated Measurement ANOVA
• ANCOVA
• Mixed Model ANOVA
• Correlation
Automatically detects crossed/nested factors
Automatically performs mixed model when random effect are included
– 11 –
Copyright © 2017 Partek Incorporated. All rights reserved.
Notes:_________________________________________________________________________
______________________________________________________________________________
______________________________________________________________________________
______________________________________________________________________________
______________________________________________________________________________
______________________________________________________________________________
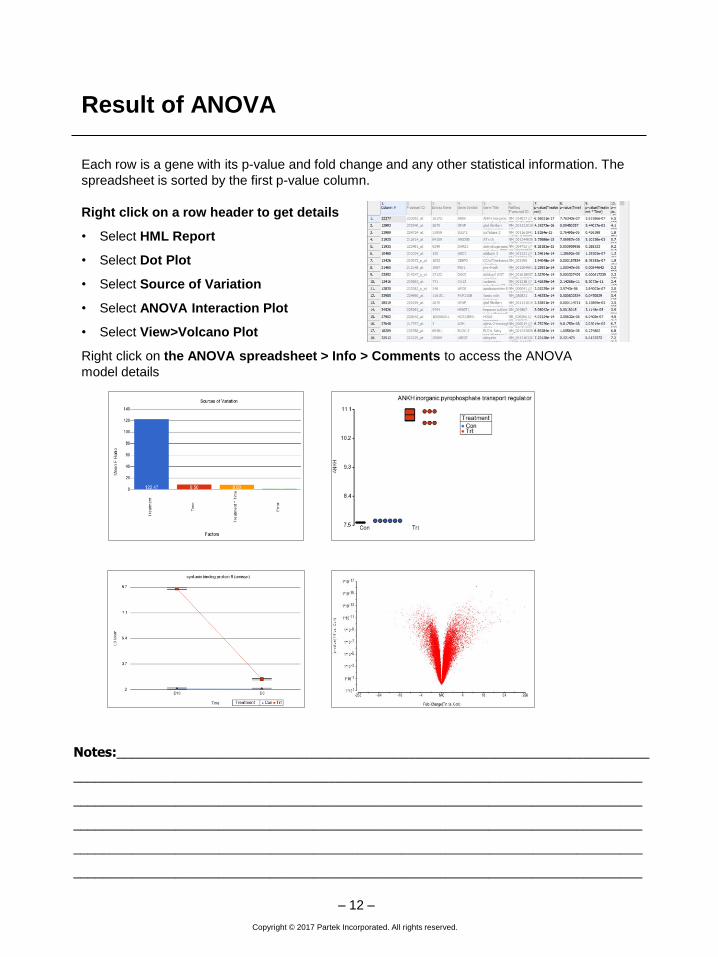
Result of ANOVA
Each row is a gene with its p-value and fold change and any other statistical information. The
spreadsheet is sorted by the first p-value column.
Right click on a row header to get details
• Select HML Report
• Select Dot Plot
• Select Source of Variation
• Select ANOVA Interaction Plot
• Select View>Volcano Plot
Right click on the ANOVA spreadsheet > Info > Comments to access the ANOVA
model details
– 12 –
Copyright © 2017 Partek Incorporated. All rights reserved.
Notes:_________________________________________________________________________
______________________________________________________________________________
______________________________________________________________________________
______________________________________________________________________________
______________________________________________________________________________
______________________________________________________________________________
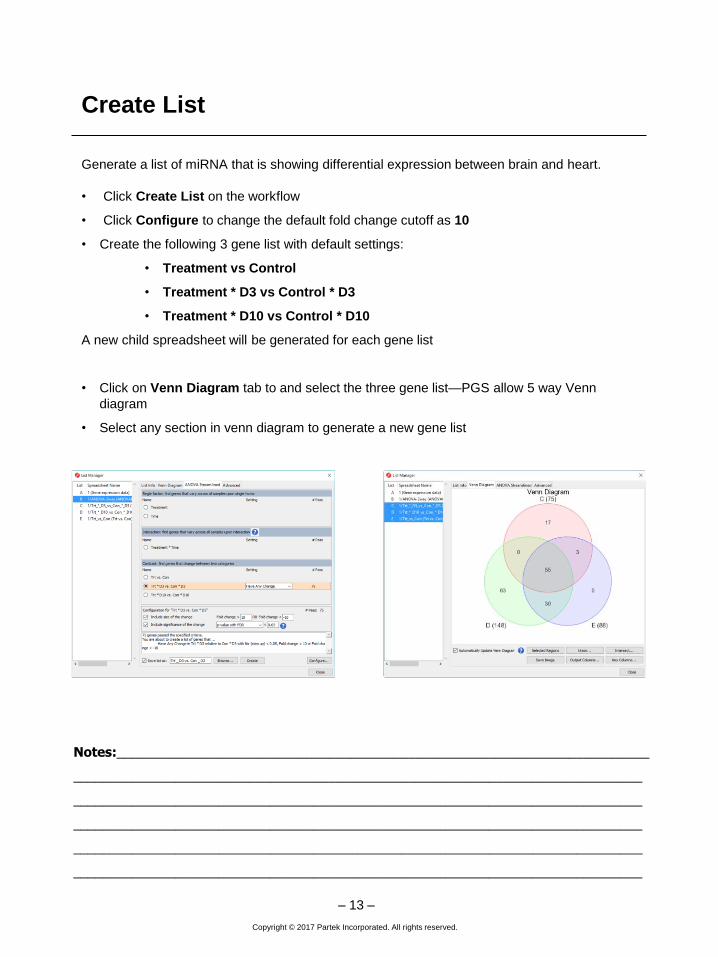
Create List
Generate a list of miRNA that is showing differential expression between brain and heart.
• Click Create List on the workflow
• Click Configure to change the default fold change cutoff as 10
• Create the following 3 gene list with default settings:
• Treatment vs Control
• Treatment * D3 vs Control * D3
• Treatment * D10 vs Control * D10
A new child spreadsheet will be generated for each gene list
• Click on Venn Diagram tab to and select the three gene list—PGS allow 5 way Venn
diagram
• Select any section in venn diagram to generate a new gene list
– 13 –
Copyright © 2017 Partek Incorporated. All rights reserved.
Notes:_________________________________________________________________________
______________________________________________________________________________
______________________________________________________________________________
______________________________________________________________________________
______________________________________________________________________________
______________________________________________________________________________
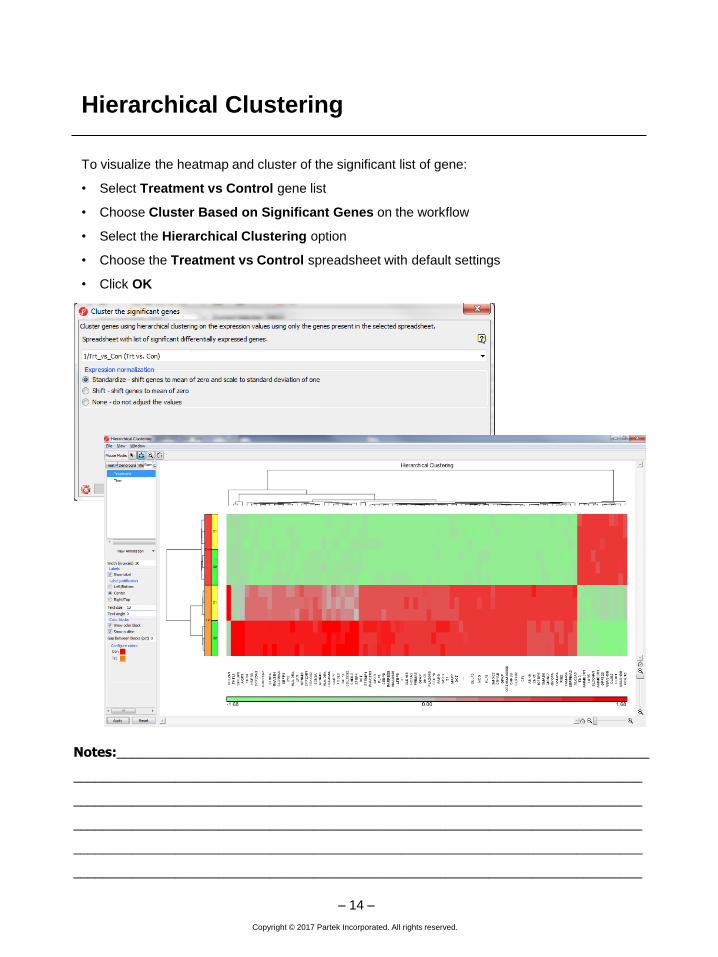
Hierarchical Clustering
To visualize the heatmap and cluster of the significant list of gene:
• Select Treatment vs Control gene list
• Choose Cluster Based on Significant Genes on the workflow
• Select the Hierarchical Clustering option
• Choose the Treatment vs Control spreadsheet with default settings
• Click OK
– 14 –
Copyright © 2017 Partek Incorporated. All rights reserved.
Notes:_________________________________________________________________________
______________________________________________________________________________
______________________________________________________________________________
______________________________________________________________________________
______________________________________________________________________________
______________________________________________________________________________
Hierarchical Clustering Configuration
Heatmap
• Click on the color square to change
the heatmap color
• Change the orientation
Dendrograms
• Change the width/height of
the dendrogram
• Color dendrogram
Rows
• Change the width of annotation
• Check show label
• Change color
• Add new annotation
Columns
• Label with column header or gene symbol
Save/Load: save or load configuration settings
– 15 –
Mode: mouse over, select, zoom, and flip
Copyright © 2017 Partek Incorporated. All rights reserved.
Notes:_________________________________________________________________________
______________________________________________________________________________
______________________________________________________________________________
______________________________________________________________________________
______________________________________________________________________________
______________________________________________________________________________
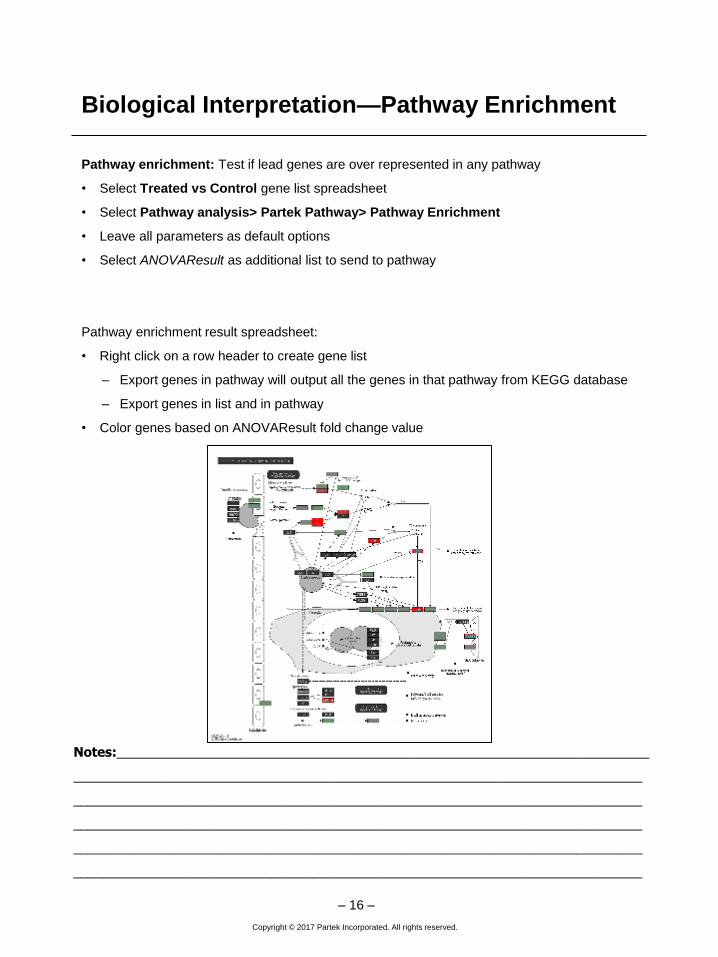
Biological Interpretation—Pathway Enrichment
Pathway enrichment: Test if lead genes are over represented in any pathway
• Select Treated vs Control gene list spreadsheet
• Select Pathway analysis> Partek Pathway> Pathway Enrichment
• Leave all parameters as default options
• Select ANOVAResult as additional list to send to pathway
Pathway enrichment result spreadsheet:
• Right click on a row header to create gene list
– Export genes in pathway will output all the genes in that pathway from KEGG database
– Export genes in list and in pathway
• Color genes based on ANOVAResult fold change value
– 16 –
Copyright © 2017 Partek Incorporated. All rights reserved.
Notes:_________________________________________________________________________
______________________________________________________________________________
______________________________________________________________________________
______________________________________________________________________________
______________________________________________________________________________
______________________________________________________________________________
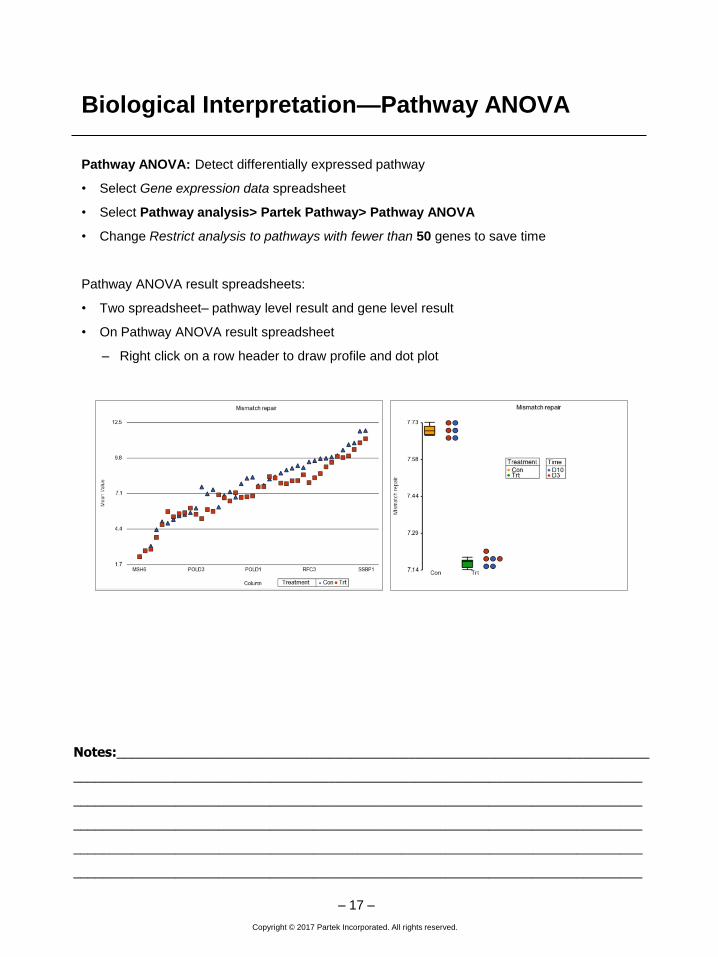
Biological Interpretation—Pathway ANOVA
Pathway ANOVA: Detect differentially expressed pathway
• Select Gene expression data spreadsheet
• Select Pathway analysis> Partek Pathway> Pathway ANOVA
• Change Restrict analysis to pathways with fewer than 50 genes to save time
Pathway ANOVA result spreadsheets:
• Two spreadsheet– pathway level result and gene level result
• On Pathway ANOVA result spreadsheet
– Right click on a row header to draw profile and dot plot
– 17 –
Copyright © 2017 Partek Incorporated. All rights reserved.
Notes:_________________________________________________________________________
______________________________________________________________________________
______________________________________________________________________________
______________________________________________________________________________
______________________________________________________________________________
______________________________________________________________________________
Filter Options
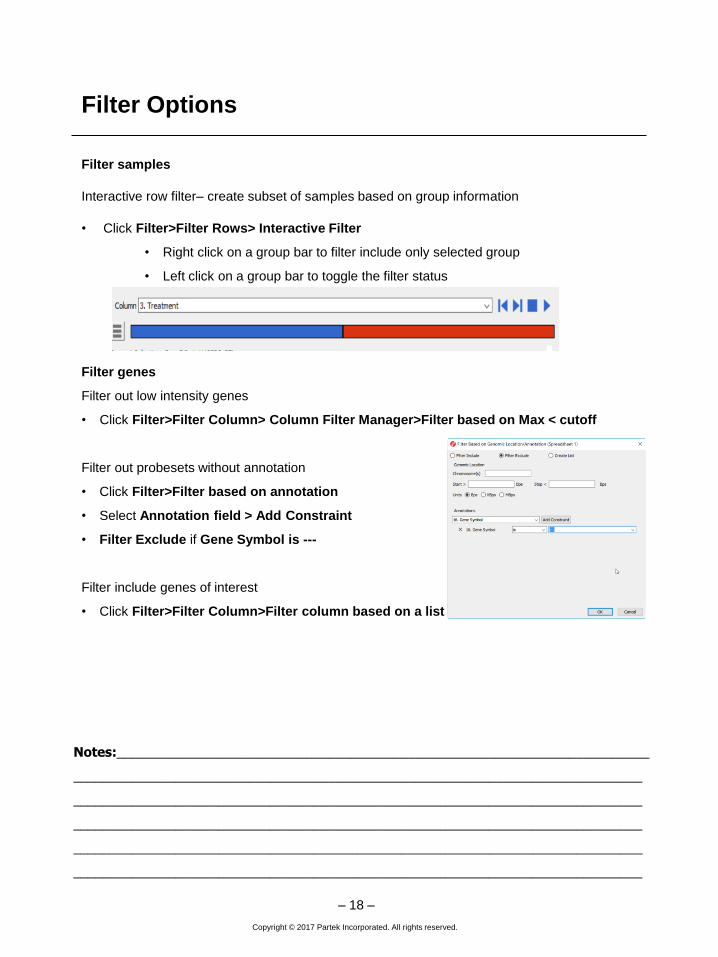
Filter samples
Interactive row filter– create subset of samples based on group information
• Click Filter>Filter Rows> Interactive Filter
• Right click on a group bar to filter include only selected group
• Left click on a group bar to toggle the filter status
Filter genes
Filter out low intensity genes
• Click Filter>Filter Column> Column Filter Manager>Filter based on Max < cutoff
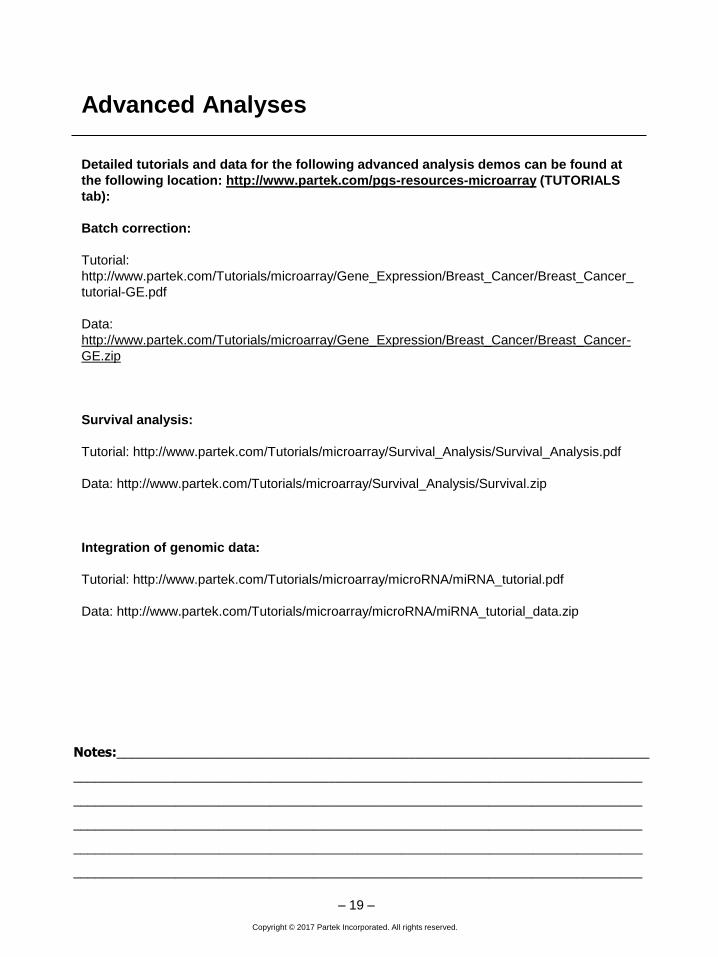
Filter out probesets without annotation
• Click Filter>Filter based on annotation
• Select Annotation field > Add Constraint
• Filter Exclude if Gene Symbol is ---
Filter include genes of interest
• Click Filter>Filter Column>Filter column based on a list
– 18 –
Copyright © 2017 Partek Incorporated. All rights reserved.
Notes:_________________________________________________________________________
______________________________________________________________________________
______________________________________________________________________________
______________________________________________________________________________
______________________________________________________________________________
______________________________________________________________________________
Advanced Analyses
Detailed tutorials and data for the following advanced analysis demos can be found at
the following location: http://www.partek.com/pgs-resources-microarray (TUTORIALS
tab):
Batch correction:
Tutorial:
http://www.partek.com/Tutorials/microarray/Gene_Expression/Breast_Cancer/Breast_Cancer_
tutorial-GE.pdf
Data:
http://www.partek.com/Tutorials/microarray/Gene_Expression/Breast_Cancer/Breast_Cancer-
GE.zip
Survival analysis:
Tutorial: http://www.partek.com/Tutorials/microarray/Survival_Analysis/Survival_Analysis.pdf
Data: http://www.partek.com/Tutorials/microarray/Survival_Analysis/Survival.zip
Integration of genomic data:
Tutorial: http://www.partek.com/Tutorials/microarray/microRNA/miRNA_tutorial.pdf
Data: http://www.partek.com/Tutorials/microarray/microRNA/miRNA_tutorial_data.zip
– 19 –
Copyright © 2017 Partek Incorporated. All rights reserved.
Notes:_________________________________________________________________________
______________________________________________________________________________
______________________________________________________________________________
______________________________________________________________________________
______________________________________________________________________________
______________________________________________________________________________
Independent Analysis
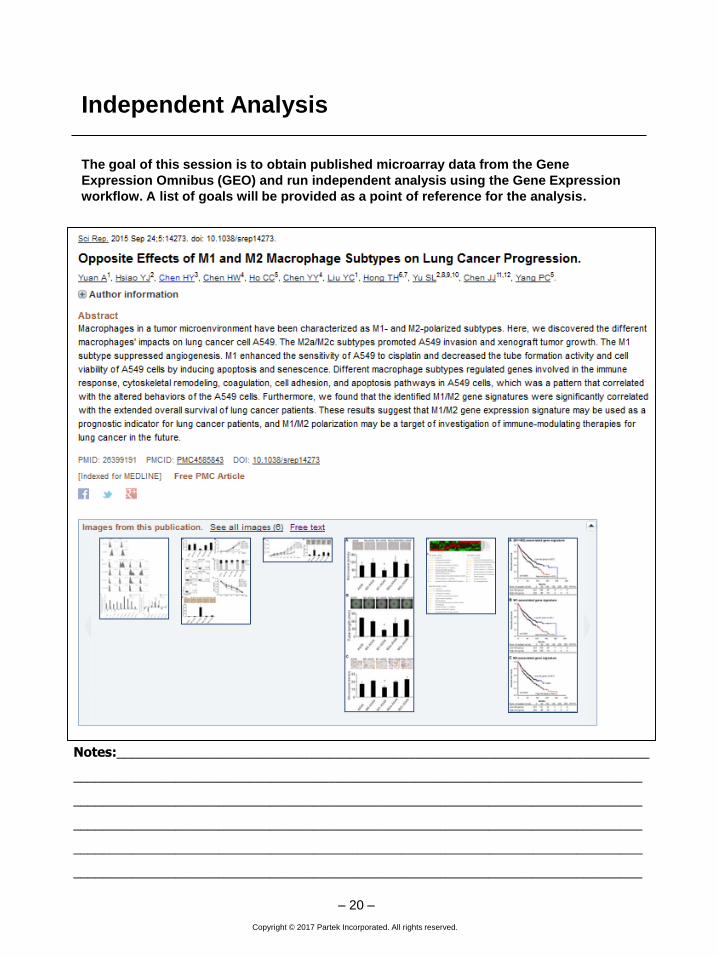
The goal of this session is to obtain published microarray data from the Gene
Expression Omnibus (GEO) and run independent analysis using the Gene Expression
workflow. A list of goals will be provided as a point of reference for the analysis.
– 20 –
Copyright © 2017 Partek Incorporated. All rights reserved.
Notes:_________________________________________________________________________
______________________________________________________________________________
______________________________________________________________________________
______________________________________________________________________________
______________________________________________________________________________
______________________________________________________________________________
Independent Analysis Goals
1.Download raw CEL files from GEO
2.Extract data and import into genomics suite
3.Add sample attributes
4.Explore the data using PCA
5.Identify differentially expressed genes between control and macrophage co-culture
6.Identify differentially expressed genes between control and each macrophage subtype
7.Plot expression for a significant gene
8.Create lists of significant genes
9.Use a venn diagram to look at overlap between macrophage subtypes and create a list
10.Perform hierarchical clustering on a significant gene list, overlaying control and
subtype information on the plot
11.Perform GO and Pathway enrichment on a significant gene list
Optional: Attempt to replicate the results of the study following the methodology as
closely as possible (differences in analysis may lead to differences in results)
– 21 –

Copyright © 2017 Partek Incorporated. All rights reserved.
Notes:_________________________________________________________________________
______________________________________________________________________________
______________________________________________________________________________
______________________________________________________________________________
______________________________________________________________________________
______________________________________________________________________________
Further Training
Self-learning
• Help > Check for Updates
• Help > On-line tutorials
• Recorded webinars
Regional Technical Support
• Email: [email protected]
• Phone: +1-314-878-2329
– 22 –


