Embed Size (px)
Citation preview
Contents lists available at ScienceDirect
NeuroImage: Clinical
journal homepage: www.elsevier.com/locate/ynicl
General and selective brain connectivity alterations in essential tremor: Aresting state fMRI study
Karsten Muellera,1, Robert Jechb,⁎,1, Martina Hoskovcováb, Olga Ulmanováb, Dušan Urgošíkc,Josef Vymazalc, Evžen Růžičkaba Max Planck Institute for Human Cognitive and Brain Sciences, Leipzig, Germanyb Department of Neurology, Charles University, First Faculty of Medicine and General University Hospital in Prague, Czech Republicc Na Homolce Hospital, Prague, Czech Republic
A R T I C L E I N F O
Keywords:Essential tremorMagnetic resonance imagingfMRIBrain connectivityEigenvector centralityFahn-Tolosa-Marin Tremor Rating Scale
A B S T R A C T
Although essential tremor is the most common movement disorder, there is little knowledge about the patho-physiological mechanisms of this disease. Therefore, we explored brain connectivity based on slow spontaneousfluctuations of blood oxygenation level dependent (BOLD) signal in patients with essential tremor (ET). A cohortof 19 ET patients and 23 healthy individuals were scanned in resting condition using functional magnetic re-sonance imaging (fMRI). General connectivity was assessed by eigenvector centrality (EC) mapping. Selectiveconnectivity was analyzed by correlations of the BOLD signal between the preselected seed regions and all theother brain areas. These measures were then correlated with the tremor severity evaluated by the Fahn-Tolosa-Marin Tremor Rating Scale (FTMTS). Compared to healthy subjects, ET patients were found to have lower EC inthe cerebellar hemispheres and higher EC in the anterior cingulate and in the primary motor cortices bilaterally.In patients, the FTMTS score correlated positively with the EC in the putamen. In addition, the FTMTS scorecorrelated positively with selective connectivity between the thalamus and other structures (putamen, pre-supplementary motor area (pre-SMA), parietal cortex), and between the pre-SMA and the putamen. We observeda selective coupling between a number of areas in the sensorimotor network including the basal ganglia and theventral intermediate nucleus of thalamus, which is widely used as neurosurgical target for tremor treatment.Finally, ET was marked by suppression of general connectivity in the cerebellum, which is in agreement with theconcept of ET as a disorder with cerebellar damage.
1. Introduction
Although essential tremor (ET) is the most common movementdisorder, its causes and pathophysiological mechanisms are still un-known. For the development of new approaches of ET therapy, a betterunderstanding of the pathophysiological background would be crucial.In particular, the mechanisms behind altered brain oscillations need tobe further studied. Investigating ET relating to resting brain con-nectivity changes might be essential for understanding the whole pic-ture of ET even in the absence of tremor when a patient has their armsin a relaxed position.
In our study, we investigated whole brain connectivity alterationswith ET using resting-state fMRI from two perspectives. First, we usedeigenvector centrality (EC) as a measure of general connectivity in orderto investigate a potential change of interconnectedness between brain
regions of ET patients. Second, we analyzed voxel-wise correlationsfrom predefined seeds in motor network with a complementary ap-proach as a measure of selective connectivity. While the general con-nectivity is based on data driven analysis of resting network in ET, theselective connectivity analyzes a limited number of connections based ona priori hypotheses.
The method of EC was established for analysis of resting-state fMRIdata to detect major hubs of brain networks using correlations betweenfMRI time courses (Lohmann et al., 2010). Higher EC values are at-tributed to brain regions which show a high connectivity with otherbrain regions having higher EC values themselves. In contrast to othermethods for investigating brain connectivity using selected fMRI timecourses of specific brain regions (Friston et al., 2003; Lohmann et al.,2012), the concept of EC works without a priori assumptions by usingall measured fMRI time courses within the data set. Thus, the procedure
http://dx.doi.org/10.1016/j.nicl.2017.06.004Received 9 February 2017; Received in revised form 22 May 2017; Accepted 1 June 2017
⁎ Corresponding author at: Center for interventional therapy of movement disorders, Department of Neurology, Charles University, First Faculty of Medicine and General UniversityHospital in Prague, Kateřinská 30, 120 00 Praha, Czech Republic.
1 Equal contribution.E-mail address: [email protected] (R. Jech).
NeuroImage: Clinical 16 (2017) 468–476
Available online 02 June 20172213-1582/ © 2017 The Authors. Published by Elsevier Inc. This is an open access article under the CC BY-NC-ND license (http://creativecommons.org/licenses/BY-NC-ND/4.0/).
T
can be used to detect disease-related brain connectivity changes basedon resting-state fMRI. Meanwhile, EC is successfully used in variousfields of neurodegenerative disease such as Alzheimer's disease andmild cognitive impairment (Binnewijzend et al., 2014; Qiu et al., 2016)but also within movement disorders such as Parkinson's disease (Holigaet al., 2015; Lou et al., 2015). However, to our knowledge, no work hasyet used EC to investigate ET functional correlates with respect toclinical involvement.
The ET can be treated with deep brain stimulation or lesioning ofthe ventral intermediate nucleus (VIM) of the thalamus if tremor isunbearable. This structure is well known to be related to tremor oscil-latory network (Hassler and Riechert, 1954). Recently, that brainstructure was confirmed to play a central role in ET demonstratingconnectivity alterations between VIM and other brain regions withinthe thalamo-cortical-cerebellar network (Fang et al., 2016). We in-cluded the VIM to seed-based correlation analysis to map selectiveconnectivity, considering the potential relationship between tremor se-verity and brain connectivity between VIM and other brain regionswithin the motor system. Further hypotheses assumed involvement ofseveral cortical regions in the motor network potentially participatingin ET pathophysiology regardless of general connectivity dysfunction.Therefore, selective connectivity was investigated using additional seedsincluding the supplementary motor area (pre-SMA, post-SMA), lateralpremotor cortex (LPM), primary motor cortex (M1) and primary so-matosensory cortex (S1) with locations derived from previously pub-lished meta-analysis of 126 papers (Mayka et al., 2006) as some of theseregions were previously attributed to ET dysfunction (Neely et al.,2015).
2. Methods
2.1. Participants
A cohort of 19 patients with ET (55.5 ± (SD) 19.2 years, diseaseduration: 6–54 years) and 23 healthy individuals (50.9 ± 18.0 years)were included in the study. All patients fulfilled the clinical criteria forthe diagnosis of ET (Deuschl et al., 1998). Thirteen patients (68%) re-ported a positive family history of tremor. Nine patients were on reg-ular monotherapy or combined treatment to suppress tremor (5 onbeta-sympatholytics, 5 on primidone, 5 on benzodiazepines and 2 ongabapentin) which they were taking on the day of examination, while10 patients weren't taking any drugs for tremor. All subjects werewithout history or clinical signs of any other neurological or psychiatricdisorders. The study protocol was approved by the Ethics Committee ofthe General University Hospital in Prague, Czech Republic. All parti-cipants were carefully informed about the study and signed a writtenconsent in accordance with the Declaration of Helsinki.
2.2. Clinical assessment
All patients underwent clinical assessment investigating the tremorseverity using the Fahn-Tolosa-Marin Tremor Rating Score (FTMTS)(Fahn et al., 1993) with an average total score of 28.8 ± 15.3. Here weassessed the tremor in the left and right arms and legs, head, voice, andtrunk. While resting tremor was assessed with relaxed arms on knees ofpatients with siting position, postural tremor was evaluated with armsraised horizontally forward with hands pronated. To assess kinetictremor, the finger-to-nose task was performed with each upper limb.Patients mainly suffered with nearly symmetrical postural tremor(1.6 ± 0.7) and kinetic tremor (1.7 ± 0.7) of arms, while the restingcomponent was only minimally expressed (0.2 ± 0.4). An additionalclinical description of all patients is listed in Table 1.
2.3. Resting state fMRI protocol
All subjects were scanned with resting-state fMRI protocol in supine
position with the eyes open fixating the cross in the middle of the visualfield. As their upper limbs were freely positioned along trunk in relaxedstate, the resting tremor was absent or negligible (see above).Wakefulness of each subject was continuously monitored with the MRIcompatible camera 12 M (MRC Systems, Heidelberg, Germany) aimingat the left eyeball throughout the whole scanning session. Imaging datawere obtained using a 1.5 T MAGNETOM Avanto scanner (SiemensHealthcare, Erlangen, Germany) with a T2*-weighted gradient-echoecho planar imaging (EPI) sequence (repetition time, TR = 3 s; echotime, TE = 51 ms, flip angle 90°) with an acquisition of 200 volumes ina period of 10 min. Each volume consisted of 31 axial slices (thick-ness = 3 mm, gap = 1 mm) with a nominal in-plane resolution of3 × 3 mm2 covering the whole brain. For registration purposes, T1-weighted images were obtained using a magnetization-prepared rapidgradient echo (MP-RAGE) sequence (TR = 2140 ms; inversion time,TI = 1100 ms; TE = 3.93 ms; flip angle 15°). A set of 176 sagittal sliceswere acquired with a nominal resolution of 1 × 1 × 1 mm3.
2.4. Data pre-processing
Image pre-processing was performed using SPM8 (Wellcome TrustCentre for Neuroimaging, UCL, London, UK) and Matlab® (TheMathWorks Inc., Natick, MA). Standard processing included realign-ment, slice-time correction, normalization to the Montreal NeurologicalInstitute (MNI) space based on the unified segmentation approach(Ashburner and Friston, 2005). After normalization, the resulting voxelsize of the functional images was interpolated to an isotropic voxel sizeof 3 × 3 × 3 mm3. Spatial filtering was performed using a Gaussiankernel with 8-mm full width at half maximum. Finally, a baselinecorrection was achieved using a high pass filter with a cutoff frequencyof 1/80 Hz. Note that it is shown that temporal filtering induces acorrelation in resting-state fMRI (Davey et al., 2013) and therefore thecutoff frequency should be chosen that low frequency oscillations arenot affected in the signal (Obrig et al., 2000).
2.5. General connectivity analysis
After pre-processing, the general connectivity of functional imageswas assessed by Eigenvector centrality (EC) which was computed usingthe Lipsia software package (Lohmann et al., 2001). EC is a suitablemethod for investigating hubs of networks within the whole brain(Lohmann et al., 2001; Power et al., 2013) based on a node centralityapproach accentuating correlations with nodes that are central withinthe network (Lohmann et al., 2010). EC attributes a value to each voxelin the brain so that a voxel receives a large value if it is strongly cor-related with many other nodes that are themselves central within thenetwork. Using the EC measure, an EC map can be produced in whicheach voxel has a value that indicates its centrality. For obtaining an EC,a similarity matrix A= [aij] was computed including Pearson's corre-lation coefficient between all resting-state fMRI time courses for thewhole brain. In order to use a similarity matrix with only positivenumbers, the absolute value was taken from all correlation coefficientsbefore computing the EC. Thus, we achieved aij > 0 for all elements ofthe similarity matrix A. According to the theorem of Peron and Fro-benius (Frobenius, 1912), this similarity matrix has a unique real lar-gest eigenvalue λ, and the corresponding eigenvector has strictly po-sitive components. Then, the EC map was generated using the i-thcomponent of this eigenvector to obtain the EC value for voxel i asfollows:
= ∑ =x μ a x μ λwith 1 .i j ij j
After computing EC maps for all patients and all healthy controls, agroup analysis was performed using a two-sample t-test to check for ECdifferences between both groups. The resulting statistical parametricmaps were processed using a voxel-wise threshold of P < 0.005. We
K. Mueller et al. NeuroImage: Clinical 16 (2017) 468–476
469
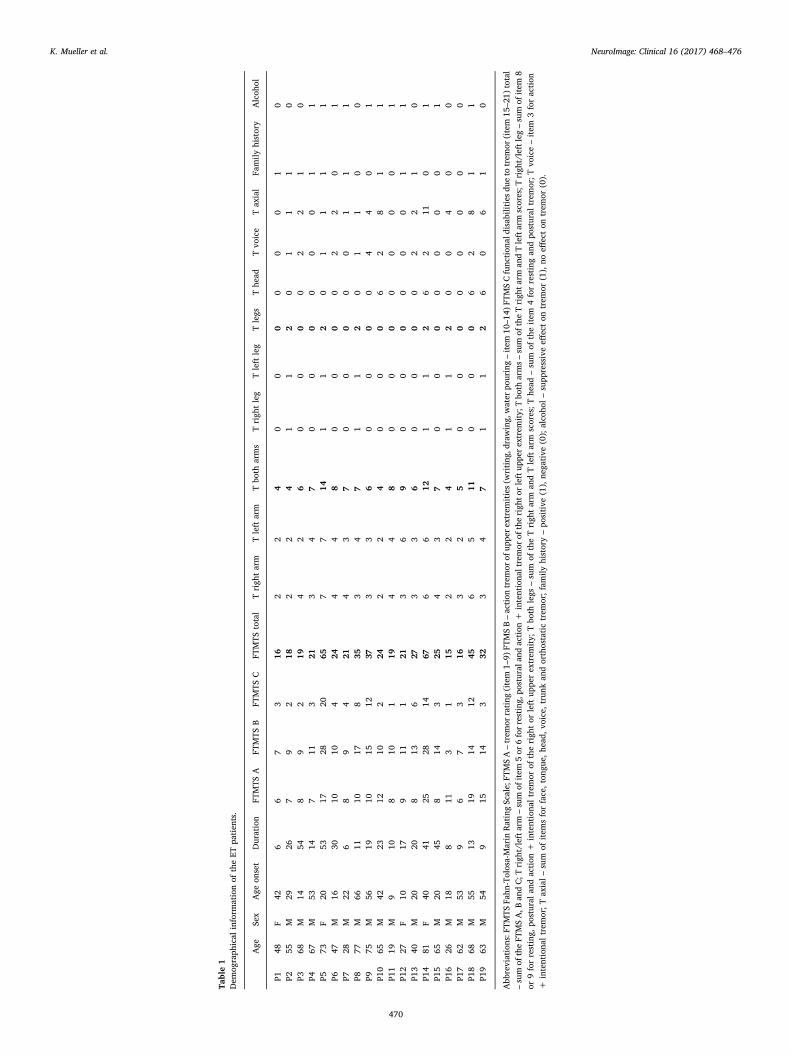
Table1
Dem
ograph
ical
inform
ationof
theET
patien
ts.
Age
Sex
Age
onset
Duration
FTMTS
AFT
MTS
BFT
MTS
CFT
MTS
total
Trigh
tarm
Tleft
arm
Tbo
tharms
Trigh
tleg
Tleft
leg
Tlegs
The
adTvo
ice
Tax
ial
Family
history
Alcoh
ol
P148
F42
66
73
162
24
00
00
00
10
P255
M29
267
92
182
24
11
20
11
10
P368
M14
548
92
194
26
00
00
22
10
P467
M53
147
113
213
47
00
00
00
11
P573
F20
5317
2820
657
714
11
20
11
11
P647
M16
3010
104
244
48
00
00
22
01
P728
M22
68
94
214
37
00
00
01
11
P877
M66
1110
178
353
47
11
20
11
00
P975
M56
1910
1512
373
36
00
00
44
01
P10
65M
4223
1210
224
22
40
00
62
81
1P1
119
M9
108
101
194
48
00
00
00
01
P12
27F
1017
911
121
36
90
00
00
01
1P1
340
M20
208
136
273
36
00
00
22
10
P14
81F
4041
2528
1467
66
121
12
62
110
1P1
565
M20
458
143
254
37
00
00
00
01
P16
26M
188
113
115
22
41
12
00
40
0P1
762
M53
96
73
163
25
00
00
00
00
P18
68M
5513
1914
1245
65
110
00
62
81
1P1
963
M54
915
143
323
47
11
26
06
10
Abb
reviations:F
TMTS
Fahn
-Tolosa-Marin
RatingScale;
FTMSA–trem
orrating
(item
1–9)
FTMSB–action
trem
orof
uppe
rextrem
ities(w
riting
,drawing,
water
pouring–item
10–1
4)FT
MSCfunc
tion
aldisabilitiesdu
eto
trem
or(item
15–2
1)total
–sum
oftheFT
MSA,B
andC;T
righ
t/leftarm
–sum
ofitem
5or
6forresting,
postural
andaction
+intentiona
ltremor
oftherigh
torleftup
perextrem
ity;
Tbo
tharms–sum
oftheTrigh
tarm
andTleftarm
scores;T
righ
t/leftleg–sum
ofitem
8or
9forresting,
postural
andaction
+intentiona
ltrem
orof
therigh
tor
left
uppe
rextrem
ity;
Tbo
thlegs
–sum
oftheTrigh
tarm
andTleft
arm
scores;T
head
–sum
oftheitem
4forrestingan
dpo
stural
trem
or;T
voice–item
3foraction
+intentiona
ltrem
or;T
axial–sum
ofitem
sforface,ton
gue,
head
,voice,trunk
andorthostatictrem
or;fam
ilyhistory–po
sitive
(1),ne
gative
(0);alco
hol–supp
ressiveeff
ecton
trem
or(1),no
effecton
trem
or(0).
K. Mueller et al. NeuroImage: Clinical 16 (2017) 468–476
470
also checked for multiple comparisons using family-wise error (FWE)correction with P < 0.05 (Nichols and Hayasaka, 2003). In addition tothis FWE approach implemented in SPM8 that is relying on the as-sumptions of the Gaussian Random Field theory, we also used the Lipsiasoftware (Lohmann et al., 2001) to obtain significant clusters. Here,statistical maps underwent a multiple-comparison procedure for sig-nificance thresholding based on Monte Carlo simulations with 10,000iterations. This method uses two features (cluster size and clustermaximum) to quantify a cluster as significant (Forman et al., 1995;Poline et al., 1997). Significant clusters were obtained using a voxel-threshold of P < 0.005 and a corrected cluster threshold of P < 0.05.
We further investigated the relationship between EC and tremorseverity using the FTMTS within the group of ET patients. A correlationanalysis was performed between EC und FTMTS using the general linearmodel including age and gender as additional covariates. A significantcorrelation was detected using a voxel threshold of P < 0.005 and anFWE-corrected cluster threshold of P < 0.05.
In order to discuss the contribution of positive and negative corre-lations in context of general connectivity (Goelman and Dan, 2017), ECwas computed using a different approach of treating correlations in thesimilarity matrix. In our main approach, we used the absolute value ofall correlations that regards negative correlations as important as po-sitive ones (see above). To estimate the share of negative correlationson our main result, we performed a subsequent analysis, in which weignored all negative correlations setting all negative correlations tozero. This approach considered only the positive correlations whencomputing the EC. To compare both approaches, all computations in-cluding voxel-wise two-sample t-tests between the EC of patients andcontrol subjects were performed with the Lipsia software package(Lohmann et al., 2001) using a voxel threshold of P < 0.005 and acluster threshold of 50 voxels. We also used both approaches whencomputing the voxel-wise correlation between EC und FTMTS.
2.6. Selective connectivity analysis
The selective connectivity was mapped using seed-based correlationanalysis aimed at investigating functional connectivity between pre-selected seed-region and other regions within the whole brain. In ourseed-based analysis, coordinates for seed-voxels were chosen in the VIMnucleus of the thalamus (Klein et al., 2012), and in the premotor andsensorimotor cortices reported in meta-analysis (Mayka et al., 2006).For each ET patient, a correlation between those seeds and the rest ofthe brain was computed with Pearson's correlation coefficient using theLIPSIA software package (Lohmann et al., 2001). To ensure a Gaussiandistribution for subsequent statistical analysis, the resulting correlationmaps were transformed using the Fisher's r-to-z transform. All resultingindividual correlation maps were subsequently processed in a second-level analysis using the general linear model including FTMTS, age andgender as covariates. Statistical analysis was performed using SPM8 tofind a significant correlation between FTMTS and selective connectivityfor all seed regions. A significant correlation between selective con-nectivity and the FTMTS was detected using a voxel-threshold ofP < 0.005 and an FWE-corrected cluster threshold of P < 0.05. Inaddition, we used the Lipsia software for statistical analysis correctingfor multiple comparisons with Monte Carlo simulations using a clusterthreshold of P < 0.05.
2.7. Motion effects
Head motion inside the MR scanner might bias the connectivityanalysis and, finally, the EC values due to motion-induced signal fluc-tuations. This could particularly be a problem if the degree of motion-related artifacts would vary between ET patients and healthy controls.Therefore, we checked for differences in head motion by computing theframewise displacement (FD) as introduced in (Power et al., 2012). Asan input, we used the translational and rotational motion parameters
obtained by SPM's motion correction. For the whole series of 200functional images, motion between the volumes was characterizedusing 199 FD values. Finally, for both patients and controls, all FD timecourses were characterized by the mean FD, the maximum FD, themaximum FD after eliminating the largest 5% of the FD values, and thenumber of FD values exceeding 1 mm. The difference in head motionbetween patients and controls was also assessed using statistical ana-lysis. Three two-sample t-tests were performed to detect differencesbetween (1) the mean FD, (2) the maximum FD, and (3) the maximumFD after eliminating the largest 5% of the FD values between patientsand controls.
To investigate the effect of motion to EC, we performed a scrubbingtechnique using an FD threshold of 0.5 mm (Power et al., 2012).Scrubbing was performed by deleting the affected volume but also thepreceding and the subsequent volume. Thus, three volumes were de-leted for each single motion. For comparing EC differences using thescrubbing and the non-scrubbing approach, all computations includingvoxel-wise two-sample t-tests between the EC of patients and controlsubjects were performed with the Lipsia software package (Lohmannet al., 2001) using a voxel threshold of P < 0.005 and a clusterthreshold of 20 voxels. We also computed the voxel-wise correlationbetween EC und FTMTS with and without the scrubbing technique.
3. Results
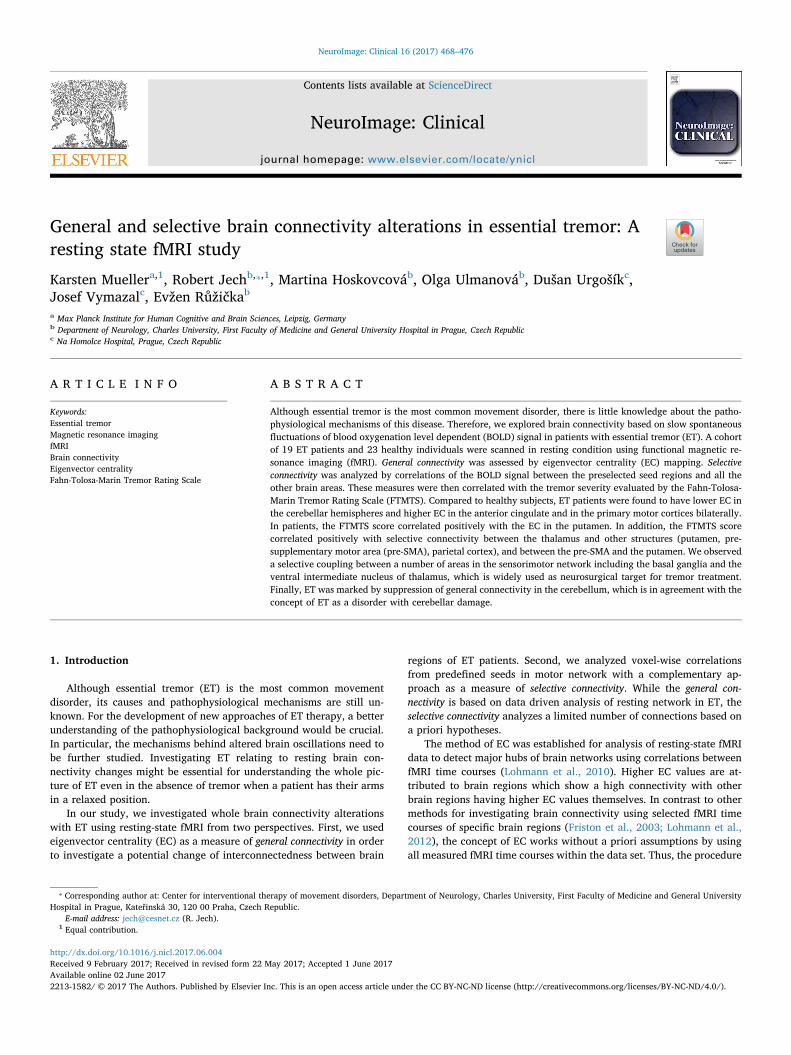
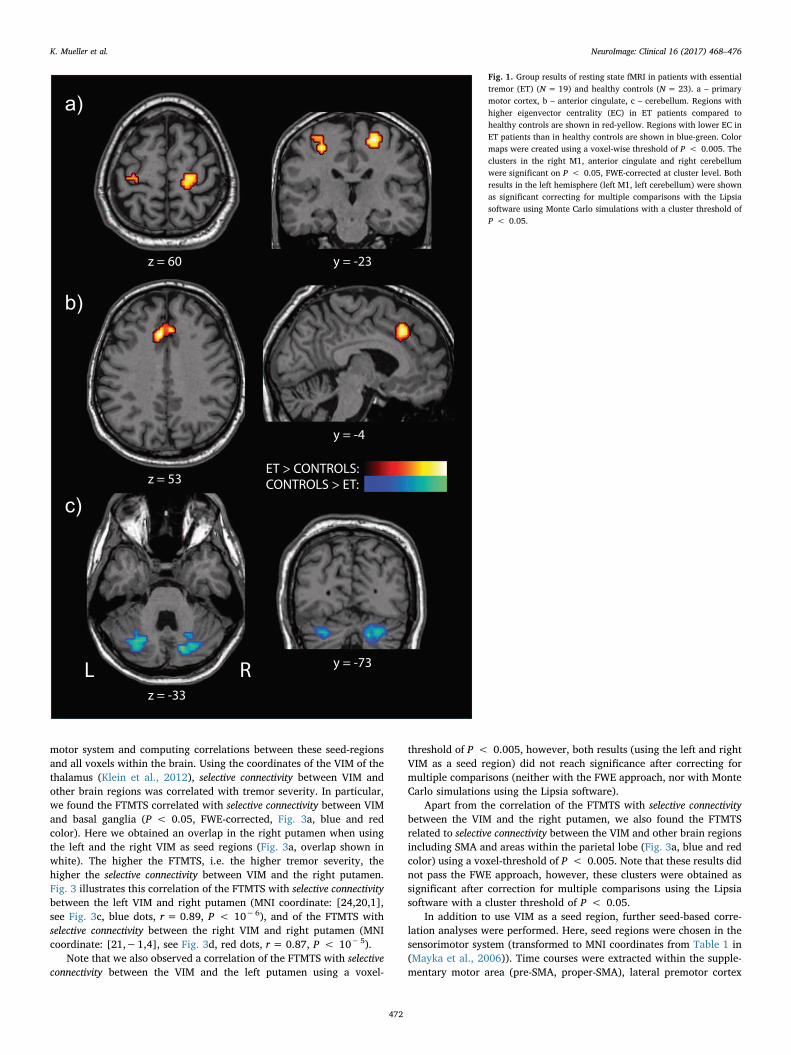
The group analysis including ET patients and healthy controls re-vealed differences in general connectivity in brain regions of the motorsystem. Compared to healthy subjects, ET patients showed a sig-nificantly increased EC in the right primary motor cortex (P < 0.05,FWE-corrected, Fig. 1a, red-yellow scale). We also found a cluster in thehomologue region in the left hemisphere using a voxel-threshold ofP < 0.005. Note that this cluster did not pass the FWE-correction,however, it reached significance with correction for multiple compar-isons in the Lipsia software using a corrected cluster threshold ofP < 0.05. A symmetric result is also in line with the fact that ET is abilateral disease (see tremor assessment for the left and right arms andlegs in Table 1).
When comparing EC between ET patients and healthy controls, afurther significant cluster of increased EC in ET patients was found inthe anterior cingulate cortex (P < 0.05, FWE-corrected, Fig. 1b, red-yellow scale). Using the inverse contrast of investigating reduced EC inET patients compared with healthy controls, a significant cluster wasfound in the right cerebellum (P < 0.05, FWE-corrected, Fig. 1c, thirdrow, blue-green scale). Here, we also found a cluster in the homologueregion in the left cerebellum with using a voxel-threshold ofP < 0.005. Note that this cluster did not pass the FWE-correction,however, it reached significance with correction for multiple compar-isons in the Lipsia software using a corrected P < 0.05.
Our results described above were also obtained when using onlypositive correlations (instead of using the absolute value) when com-puting the EC (see Supplementary Figs. S1 and S2). Thus, EC differencescan be explained by the positive correlations between fMRI timecourses.
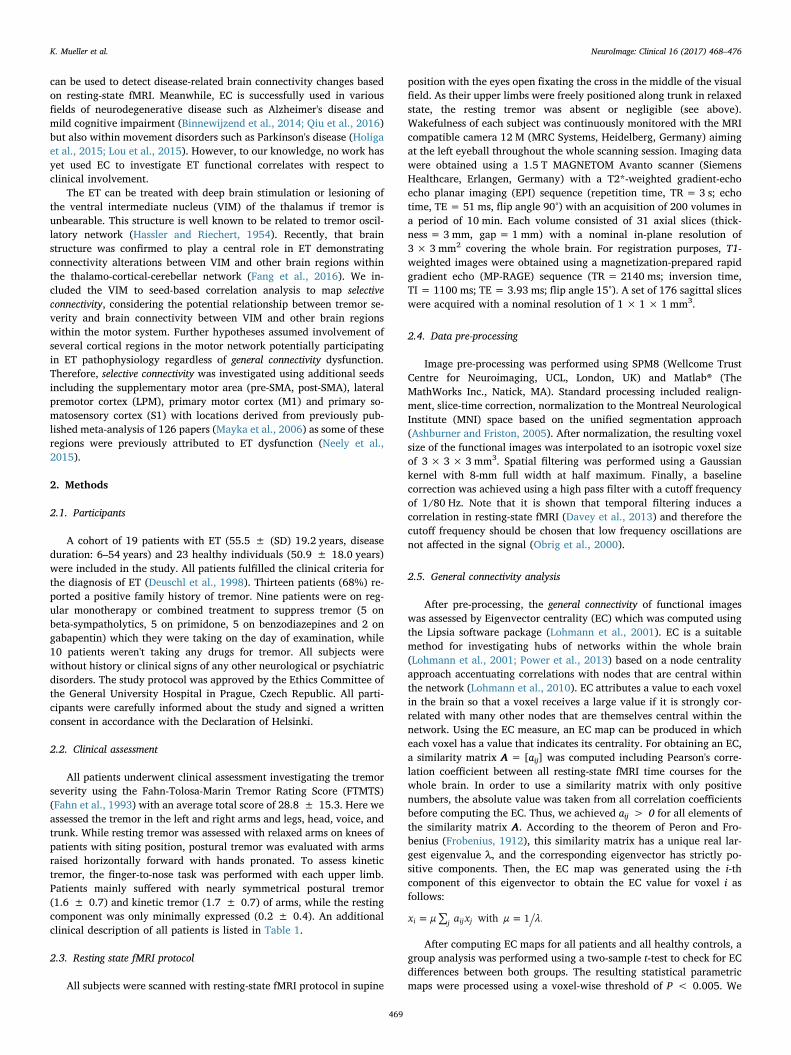
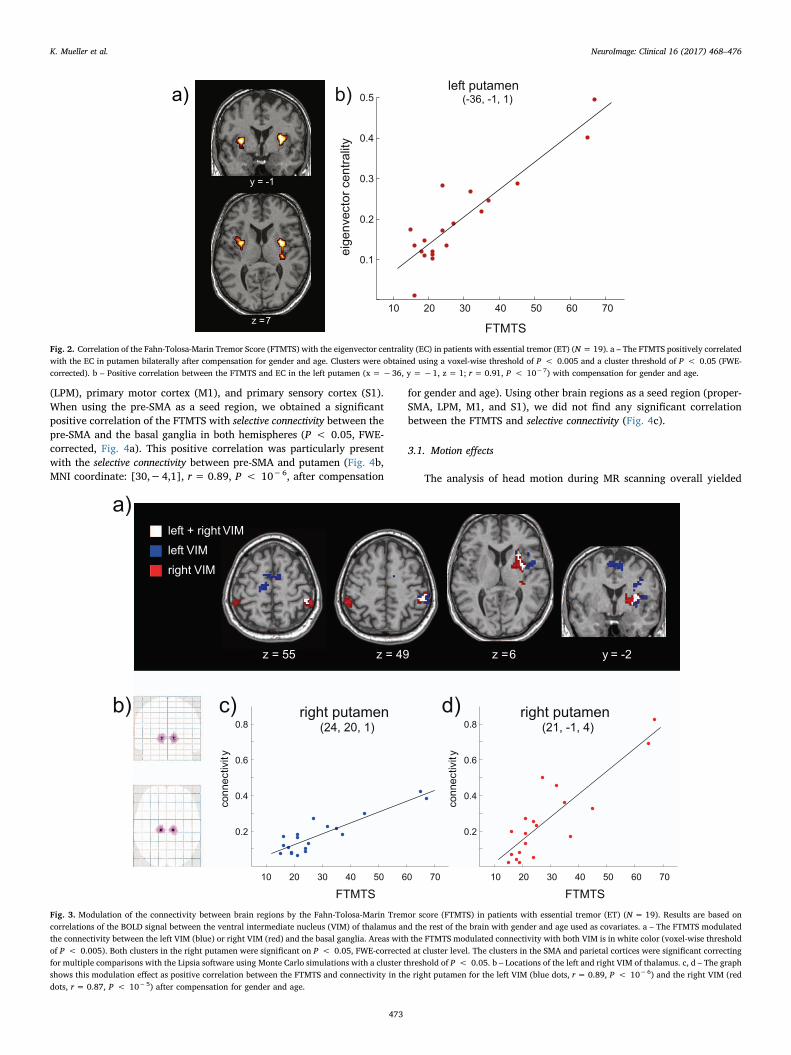
The correlation analysis between EC and FTMTS showed a sig-nificant relationship between general connectivity and tremor severity inET patients. We found a significant positive correlation between FTMTSand EC in the putamen bilaterally after compensating for gender andage (P < 0.05, FWE-corrected, Fig. 2a, orange color). Higher con-nectivity was found to be associated with higher tremor severity (seeFig. 2b, correlation in the left putamen, MNI coordinate: [−36,−1,1],r = 0.91, P < 10−7). Note that this positive relationship betweenFTMTS and EC was found in both approaches of computing EC (1) usingthe absolute value of the correlation between the fMRI time courses and(2) using only positive correlations setting all negative correlation va-lues to zero (see Supplementary Fig. S3).
Selective connectivity was obtained choosing seed-regions in the
K. Mueller et al. NeuroImage: Clinical 16 (2017) 468–476
471
motor system and computing correlations between these seed-regionsand all voxels within the brain. Using the coordinates of the VIM of thethalamus (Klein et al., 2012), selective connectivity between VIM andother brain regions was correlated with tremor severity. In particular,we found the FTMTS correlated with selective connectivity between VIMand basal ganglia (P < 0.05, FWE-corrected, Fig. 3a, blue and redcolor). Here we obtained an overlap in the right putamen when usingthe left and the right VIM as seed regions (Fig. 3a, overlap shown inwhite). The higher the FTMTS, i.e. the higher tremor severity, thehigher the selective connectivity between VIM and the right putamen.Fig. 3 illustrates this correlation of the FTMTS with selective connectivitybetween the left VIM and right putamen (MNI coordinate: [24,20,1],see Fig. 3c, blue dots, r = 0.89, P < 10−6), and of the FTMTS withselective connectivity between the right VIM and right putamen (MNIcoordinate: [21,−1,4], see Fig. 3d, red dots, r = 0.87, P < 10−5).
Note that we also observed a correlation of the FTMTS with selectiveconnectivity between the VIM and the left putamen using a voxel-
threshold of P < 0.005, however, both results (using the left and rightVIM as a seed region) did not reach significance after correcting formultiple comparisons (neither with the FWE approach, nor with MonteCarlo simulations using the Lipsia software).
Apart from the correlation of the FTMTS with selective connectivitybetween the VIM and the right putamen, we also found the FTMTSrelated to selective connectivity between the VIM and other brain regionsincluding SMA and areas within the parietal lobe (Fig. 3a, blue and redcolor) using a voxel-threshold of P < 0.005. Note that these results didnot pass the FWE approach, however, these clusters were obtained assignificant after correction for multiple comparisons using the Lipsiasoftware with a cluster threshold of P < 0.05.
In addition to use VIM as a seed region, further seed-based corre-lation analyses were performed. Here, seed regions were chosen in thesensorimotor system (transformed to MNI coordinates from Table 1 in(Mayka et al., 2006)). Time courses were extracted within the supple-mentary motor area (pre-SMA, proper-SMA), lateral premotor cortex
a)
b)
c)
Fig. 1. Group results of resting state fMRI in patients with essentialtremor (ET) (N = 19) and healthy controls (N = 23). a – primarymotor cortex, b – anterior cingulate, c – cerebellum. Regions withhigher eigenvector centrality (EC) in ET patients compared tohealthy controls are shown in red-yellow. Regions with lower EC inET patients than in healthy controls are shown in blue-green. Colormaps were created using a voxel-wise threshold of P < 0.005. Theclusters in the right M1, anterior cingulate and right cerebellumwere significant on P < 0.05, FWE-corrected at cluster level. Bothresults in the left hemisphere (left M1, left cerebellum) were shownas significant correcting for multiple comparisons with the Lipsiasoftware using Monte Carlo simulations with a cluster threshold ofP < 0.05.
K. Mueller et al. NeuroImage: Clinical 16 (2017) 468–476
472
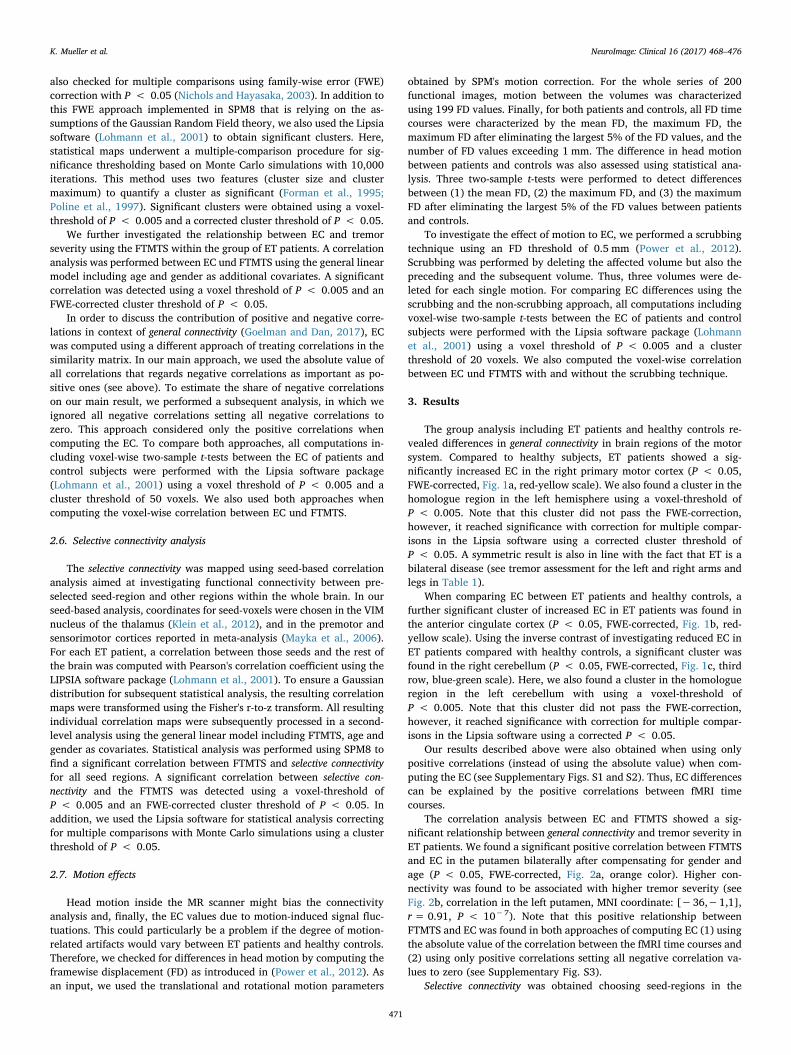
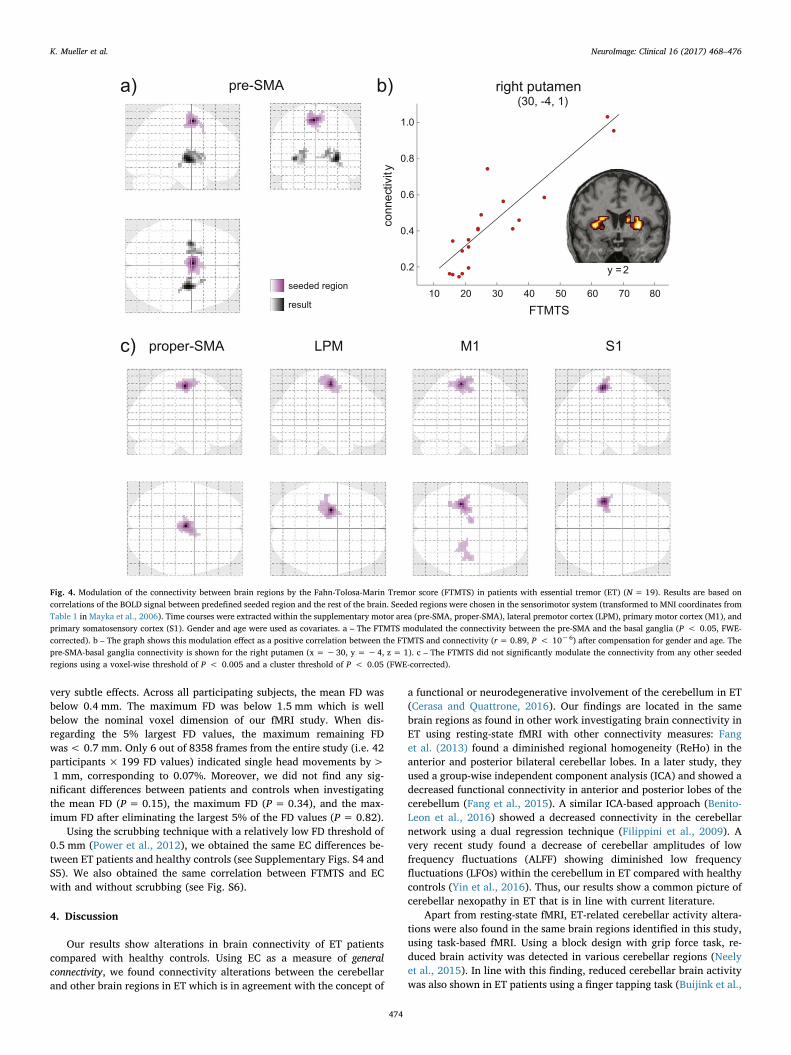
(LPM), primary motor cortex (M1), and primary sensory cortex (S1).When using the pre-SMA as a seed region, we obtained a significantpositive correlation of the FTMTS with selective connectivity between thepre-SMA and the basal ganglia in both hemispheres (P < 0.05, FWE-corrected, Fig. 4a). This positive correlation was particularly presentwith the selective connectivity between pre-SMA and putamen (Fig. 4b,MNI coordinate: [30,−4,1], r = 0.89, P < 10−6, after compensation
for gender and age). Using other brain regions as a seed region (proper-SMA, LPM, M1, and S1), we did not find any significant correlationbetween the FTMTS and selective connectivity (Fig. 4c).
3.1. Motion effects
The analysis of head motion during MR scanning overall yielded
0.5
0.1
0.2
0.3
0.4
10 20 30 40 50 60 70
FTMTS
y = -1
z = 7
a) b)left putamen
(-36, -1, 1)
eig
envecto
r c
entr
ality
Fig. 2. Correlation of the Fahn-Tolosa-Marin Tremor Score (FTMTS) with the eigenvector centrality (EC) in patients with essential tremor (ET) (N= 19). a – The FTMTS positively correlatedwith the EC in putamen bilaterally after compensation for gender and age. Clusters were obtained using a voxel-wise threshold of P < 0.005 and a cluster threshold of P < 0.05 (FWE-corrected). b – Positive correlation between the FTMTS and EC in the left putamen (x =−36, y =−1, z = 1; r= 0.91, P < 10−7) with compensation for gender and age.
b)
10 20 30 40 50 60 70
FTMTS
10 20 30 40 50 60 70
FTMTS
0.2
0.4
0.6
0.8
0.2
0.4
0.6
0.8
left VIM
right VIM
left + right VIM
z = 55 z = 49 z = 6 y = -2
right putamen
(24, 20, 1)
a)
c) d) right putamen
(21, -1, 4)
connectivit
y
connectivit
y
Fig. 3. Modulation of the connectivity between brain regions by the Fahn-Tolosa-Marin Tremor score (FTMTS) in patients with essential tremor (ET) (N = 19). Results are based oncorrelations of the BOLD signal between the ventral intermediate nucleus (VIM) of thalamus and the rest of the brain with gender and age used as covariates. a – The FTMTS modulatedthe connectivity between the left VIM (blue) or right VIM (red) and the basal ganglia. Areas with the FTMTS modulated connectivity with both VIM is in white color (voxel-wise thresholdof P < 0.005). Both clusters in the right putamen were significant on P < 0.05, FWE-corrected at cluster level. The clusters in the SMA and parietal cortices were significant correctingfor multiple comparisons with the Lipsia software using Monte Carlo simulations with a cluster threshold of P < 0.05. b – Locations of the left and right VIM of thalamus. c, d – The graphshows this modulation effect as positive correlation between the FTMTS and connectivity in the right putamen for the left VIM (blue dots, r= 0.89, P < 10−6) and the right VIM (reddots, r= 0.87, P < 10−5) after compensation for gender and age.
K. Mueller et al. NeuroImage: Clinical 16 (2017) 468–476
473
very subtle effects. Across all participating subjects, the mean FD wasbelow 0.4 mm. The maximum FD was below 1.5 mm which is wellbelow the nominal voxel dimension of our fMRI study. When dis-regarding the 5% largest FD values, the maximum remaining FDwas< 0.7 mm. Only 6 out of 8358 frames from the entire study (i.e. 42participants × 199 FD values) indicated single head movements by>1 mm, corresponding to 0.07%. Moreover, we did not find any sig-nificant differences between patients and controls when investigatingthe mean FD (P= 0.15), the maximum FD (P = 0.34), and the max-imum FD after eliminating the largest 5% of the FD values (P = 0.82).
Using the scrubbing technique with a relatively low FD threshold of0.5 mm (Power et al., 2012), we obtained the same EC differences be-tween ET patients and healthy controls (see Supplementary Figs. S4 andS5). We also obtained the same correlation between FTMTS and ECwith and without scrubbing (see Fig. S6).
4. Discussion
Our results show alterations in brain connectivity of ET patientscompared with healthy controls. Using EC as a measure of generalconnectivity, we found connectivity alterations between the cerebellarand other brain regions in ET which is in agreement with the concept of
a functional or neurodegenerative involvement of the cerebellum in ET(Cerasa and Quattrone, 2016). Our findings are located in the samebrain regions as found in other work investigating brain connectivity inET using resting-state fMRI with other connectivity measures: Fanget al. (2013) found a diminished regional homogeneity (ReHo) in theanterior and posterior bilateral cerebellar lobes. In a later study, theyused a group-wise independent component analysis (ICA) and showed adecreased functional connectivity in anterior and posterior lobes of thecerebellum (Fang et al., 2015). A similar ICA-based approach (Benito-Leon et al., 2016) showed a decreased connectivity in the cerebellarnetwork using a dual regression technique (Filippini et al., 2009). Avery recent study found a decrease of cerebellar amplitudes of lowfrequency fluctuations (ALFF) showing diminished low frequencyfluctuations (LFOs) within the cerebellum in ET compared with healthycontrols (Yin et al., 2016). Thus, our results show a common picture ofcerebellar nexopathy in ET that is in line with current literature.
Apart from resting-state fMRI, ET-related cerebellar activity altera-tions were also found in the same brain regions identified in this study,using task-based fMRI. Using a block design with grip force task, re-duced brain activity was detected in various cerebellar regions (Neelyet al., 2015). In line with this finding, reduced cerebellar brain activitywas also shown in ET patients using a finger tapping task (Buijink et al.,
10 20 30 40 50 60 70
FTMTS
1.0
0.2
0.4
0.6
0.8
b)a)
seeded region
result
80
y = 2
c) proper-SMA M1LPM S1
pre-SMA right putamen
(30, -4, 1)
co
nn
ectivit
y
Fig. 4. Modulation of the connectivity between brain regions by the Fahn-Tolosa-Marin Tremor score (FTMTS) in patients with essential tremor (ET) (N = 19). Results are based oncorrelations of the BOLD signal between predefined seeded region and the rest of the brain. Seeded regions were chosen in the sensorimotor system (transformed to MNI coordinates fromTable 1 in Mayka et al., 2006). Time courses were extracted within the supplementary motor area (pre-SMA, proper-SMA), lateral premotor cortex (LPM), primary motor cortex (M1), andprimary somatosensory cortex (S1). Gender and age were used as covariates. a – The FTMTS modulated the connectivity between the pre-SMA and the basal ganglia (P < 0.05, FWE-corrected). b – The graph shows this modulation effect as a positive correlation between the FTMTS and connectivity (r = 0.89, P < 10−6) after compensation for gender and age. Thepre-SMA-basal ganglia connectivity is shown for the right putamen (x =−30, y = −4, z = 1). c – The FTMTS did not significantly modulate the connectivity from any other seededregions using a voxel-wise threshold of P < 0.005 and a cluster threshold of P < 0.05 (FWE-corrected).
K. Mueller et al. NeuroImage: Clinical 16 (2017) 468–476
474
2015). However, there are also studies showing increased cerebellaractivity which appears contradictory. Nicoletti and colleagues in-vestigated ET patients using a task with continuous writing of thenumber “8” with the right dominant hand and they found increasedactivity in the cerebellum and other brain regions of the cerebello-thalamo-cortical circuit (Nicoletti et al., 2015). Increased cerebellaractivity was also found in ET patients using a working memory task(Passamonti et al., 2011). A possible interpretation of these divergentfindings between a decrease and increase of brain activity might be aneffect of ET related oscillations in the motor cortex in the fMRI signal.Oscillations about 3–8 Hz are related to hyperactivity in the motorcortex and while 0–3 Hz oscillations lead to hypoactivity in the cere-bellum (Raethjen and Deuschl, 2012). It is also known that 0–3 Hzoscillations are related to an impairment of cerebellar-cortical func-tional connectivity that is in line with our observation of cerebellar ECdecrease.
Our finding of a diminished EC in the cerebellum is accompaniedwith an increased EC in primary motor regions and the anterior cin-gulate cortex. The increased EC means that these regions act more likeactive network hubs in ET than in controls. This is in line with a currenthypothesis of increased flow of information within the thalamo-corticalloop in ET leading to self-sustained oscillatory activity (Raethjen andDeuschl, 2012). Our results fit well to other studies investigating con-nectivity with resting-state fMRI showing an increased degree of con-nectivity in cortical motor and salience networks (Fang et al., 2015).Interestingly, in same brain regions, an increased ALFF was observed inET patients (Yin et al., 2016) indicating alterations in spontaneousneural activity (Fox and Raichle, 2007). In line with these findings, ETpatients also showed an increased ReHo in cortical motor regions in theleft hemisphere (Fang et al., 2013). Our result of EC increase in themotor cortex also goes in line with increased brain activity in ET pa-tients in M1 and SMA which correlated positively with 3–8 Hz oscilla-tions (Neely et al., 2015). Findings of increased brain connectivity andactivity may reflect easier propagations of slow oscillatory activity inmotor circuitry of ET patients. An increased EC in cortical motor re-gions might be a consequence of stronger brain connectivity betweenputamen and cortical brain regions in parallel with dysfunctional con-nections projecting from/to cerebellum.
Investigating the clinical parameters in context of brain connectivityin ET, we found a positive correlation between EC and FTMTS showingan increased connectivity of the putamen of ET patients with a highertremor severity. This means that more pronounced tremor corre-sponded to an increased connectivity between the putamen and otherbrain regions including the thalamus and SMA. This finding might besurprising because involvement of the basal ganglia is rarely reported incontext with ET. As previously reported, there are mild abnormalities ofstriatal dopamine transporters showing a slight PD-like pattern sug-gesting the possible role of the basal ganglia in ET (Isaias et al., 2008).Another recent study demonstrated an involvement of the basal gangliain context with ET therapy using beta-sympatholytics (Song et al.,2015). Patients that did not respond to propranolol therapy showed asignificantly increased FTMTS together with an increased glucose me-tabolism in the putamen and pallidum. This finding would be in linewith our result showing a positive correlation between FTMTS and ECin the putamen. Despite fundamental clinical differences, tremor gen-eration in Parkinson's disease is associated with activity in the cere-bello-thalamic circuit possibly induced by transient signals from theputamen and globus pallidus (Helmich et al., 2011). Therefore, onemight speculate that an increased connectivity between the basalganglia and cortical motor regions might be accompanied by a highertremor severity. Interestingly, in Parkinson's disease, Helmich andcolleagues describe a positive correlation between tremor severity andconnectivity between the putamen and motor cortex (Helmich et al.,2011). We found a similar result showing that higher tremor severityco-varies with an increased selective connectivity between the putamen
and pre-SMA as well as and with increased general connectivity of theputamen with the rest of the brain. Our results of general connectivityassessed by EC and selective connectivity assessed by voxel wise seed-based analysis might provide evidence for the possible involvement ofthe basal ganglia in ET. However, further work is necessary to in-vestigate potential common pathological substrates in ET and PD.
For therapeutic intervention in ET, the ventral intermediate nucleus(VIM) of the thalamus turned out to play a central role. A first approachwas suggested using thalamotomy (Hassler and Riechert, 1954; Zirhet al., 1999) with an ablation of the VIM in a surgical procedure. Later,VIM became a primary target for deep brain stimulation (DBS) tosuppress tremor (Klein et al., 2012; Papavassiliou et al., 2008). There-fore, the role of the VIM needs to be investigated when analyzing al-terations of brain connectivity with ET. We evaluated selective con-nectivity of the VIM using seed-based correlation analysis with rest ofthe brain, and we obtained a positive relationship of the FTMTS withconnectivity between the left or right VIM and putamen in the righthemisphere. This correlation contributes to the increased EC in theputamen with higher tremor severity as discussed above. In anotherrecent work, VIM was used in a seed-based correlation analysis to in-vestigate ET-related connectivity change using resting-state fMRI (Fanget al., 2016). However, they did not obtain a relationship betweentremor severity and connectivity between the VIM and basal ganglia.They report an increased connectivity between the VIM and SMA andfurther regions of the primary motor cortex when comparing ET pa-tients with healthy controls (Fang et al., 2016). This is in line with ourresults which show a positive correlation of the FTMTS with selectiveconnectivity between the VIM and SMA.
We also studied selective connectivity using seed regions within themotor and sensory cortices. Here we used coordinates listed in (Maykaet al., 2006) to be independent from the EC analysis (Kriegeskorte et al.,2009). We found a positive correlation of the FTMTS with connectivitybetween pre-SMA and putamen. A higher tremor score was found to berelated to increased connectivity between these regions that is in linewith our findings described above. Both putamen and SMA were foundwhen investigating the relationship of the FTMTS with connectivitybetween the VIM and other brain regions. Therefore, the positive cor-relation of the FTMTS with connectivity between the pre-SMA and theputamen would be an expected finding. Interestingly, we did not findany FTMTS-related connectivity changes using other seed regions as theproper-SMA, the lateral premotor cortex, the primary motor cortex, andthe sensorimotor cortex. However, this does not necessarily show theabsence of such a relationship. Another explanation could be due tolimitations of sensitivity with our approach.
To summarize, we investigated ET patients with resting-state fMRIand we found abnormal general connectivity expressed in alterations ofeigenvector centrality showing a dysfunctional connectivity in thecerebellum but an increased connectivity with cortical motor regions.In addition, we mapped selective connectivity using seed-based correla-tion and found a relationship between tremor severity and brain con-nectivity related to regions that are known to be affected in ET. Ourresults fit very well into the current literature but also show an in-volvement of the basal ganglia that is a new finding aside from thecurrent view of ET. Future studies might be aimed at further enlight-enment of the complete picture of brain network alteration related toET.
Supplementary data to this article can be found online at http://dx.doi.org/10.1016/j.nicl.2017.06.004.
Acknowledgements
The study was supported by the Czech Science Foundation(GACR16-13323S), the Czech Agency for health research (AZV16-28119A) and by Charles University in Prague (Progres Q27/LF1).
K. Mueller et al. NeuroImage: Clinical 16 (2017) 468–476
475
References
Ashburner, J., Friston, K.J., 2005. Unified segmentation. NeuroImage 26, 839–851.Benito-Leon, J., Louis, E.D., Manzanedo, E., Hernandez-Tamames, J.A., Alvarez-Linera, J.,
Molina-Arjona, J.A., Matarazzo, M., Romero, J.P., Dominguez-Gonzalez, C.,Domingo-Santos, A., Sanchez-Ferro, A., 2016. Resting state functional MRI revealsabnormal network connectivity in orthostatic tremor. Medicine (Baltimore) 95,e4310.
Binnewijzend, M.A., Adriaanse, S.M., Van der Flier, W.M., Teunissen, C.E., de Munck,J.C., Stam, C.J., Scheltens, P., van Berckel, B.N., Barkhof, F., Wink, A.M., 2014. Brainnetwork alterations in Alzheimer's disease measured by eigenvector centrality infMRI are related to cognition and CSF biomarkers. Hum. Brain Mapp. 35, 2383–2393.
Buijink, A.W., Broersma, M., van der Stouwe, A.M., van Wingen, G.A., Groot, P.F.,Speelman, J.D., Maurits, N.M., van Rootselaar, A.F., 2015. Rhythmic finger tappingreveals cerebellar dysfunction in essential tremor. Parkinsonism Relat. Disord. 21,383–388.
Cerasa, A., Quattrone, A., 2016. Linking essential tremor to the cerebellum-neuroimagingevidence. Cerebellum 15, 263–275.
Davey, C.E., Grayden, D.B., Egan, G.F., Johnston, L.A., 2013. Filtering induces correlationin fMRI resting state data. NeuroImage 64, 728–740.
Deuschl, G., Bain, P., Brin, M., 1998. Consensus statement of the Movement DisorderSociety on Tremor. Ad Hoc Scientific Committee. Mov. Disord. 13 (Suppl. 3), 2–23.
Fahn, S., Tolosa, E., Marin, C., 1993. Clinical rating scale for tremor. In: Jankovic, J.,Tolosa, E. (Eds.), Parkinson's Disease and Movement Disorders, 2nd ed.Williams &Wilkins, Baltimore, pp. 271–280.
Fang, W., Lv, F., Luo, T., Cheng, O., Liao, W., Sheng, K., Wang, X., Wu, F., Hu, Y., Luo, J.,Yang, Q.X., Zhang, H., 2013. Abnormal regional homogeneity in patients with es-sential tremor revealed by resting-state functional MRI. PLoS One 8, e69199.
Fang, W., Chen, H., Wang, H., Zhang, H., Liu, M., Puneet, M., Lv, F., Cheng, O., Wang, X.,Lu, X., Luo, T., 2015. Multiple resting-state networks are associated with tremors andcognitive features in essential tremor. Mov. Disord. 30, 1926–1936.
Fang, W., Chen, H., Wang, H., Zhang, H., Puneet, M., Liu, M., Lv, F., Luo, T., Cheng, O.,Wang, X., Lu, X., 2016. Essential tremor is associated with disruption of functionalconnectivity in the ventral intermediate nucleus–motor cortex–cerebellum circuit.Hum. Brain Mapp. 37, 165–178.
Filippini, N., MacIntosh, B.J., Hough, M.G., Goodwin, G.M., Frisoni, G.B., Smith, S.M.,Matthews, P.M., Beckmann, C.F., Mackay, C.E., 2009. Distinct patterns of brain ac-tivity in young carriers of the APOE-epsilon4 allele. Proc. Natl. Acad. Sci. U. S. A.106, 7209–7214.
Forman, S.D., Cohen, J.D., Fitzgerald, M., Eddy, W.F., Mintun, M.A., Noll, D.C., 1995.Improved assessment of significant activation in functional magnetic resonanceimaging (fMRI): use of a cluster-size threshold. Magn. Reson. Med. 33, 636–647.
Fox, M.D., Raichle, M.E., 2007. Spontaneous fluctuations in brain activity observed withfunctional magnetic resonance imaging. Nat. Rev. Neurosci. 8, 700–711.
Friston, K.J., Harrison, L., Penny, W., 2003. Dynamic causal modelling. NeuroImage 19,1273–1302.
Frobenius, G., 1912. On matrices from non-negative elements. Sitzungsberichte DerKoniglich Preussischen Akademie Der Wissenschaften 456–477.
Goelman, G., Dan, R., 2017. Multiple-region directed functional connectivity based onphase delays. Hum. Brain Mapp. 38, 1374–1386.
Hassler, R., Riechert, T., 1954. Indications and localization of stereotactic brain opera-tions. Nervenarzt 25, 441–447.
Helmich, R.C., Janssen, M.J., Oyen, W.J., Bloem, B.R., Toni, I., 2011. Pallidal dysfunctiondrives a cerebellothalamic circuit into Parkinson tremor. Ann. Neurol. 69, 269–281.
Holiga, S., Mueller, K., Moller, H.E., Urgosik, D., Ruzicka, E., Schroeter, M.L., Jech, R.,2015. Resting-state functional magnetic resonance imaging of the subthalamic mi-crolesion and stimulation effects in Parkinson's disease: indications of a principal roleof the brainstem. Neuroimage Clin. 9, 264–274.
Isaias, I.U., Canesi, M., Benti, R., Gerundini, P., Cilia, R., Pezzoli, G., Antonini, A., 2008.Striatal dopamine transporter abnormalities in patients with essential tremor. Nucl.Med. Commun. 29, 349–353.
Klein, J.C., Barbe, M.T., Seifried, C., Baudrexel, S., Runge, M., Maarouf, M., Gasser, T.,
Hattingen, E., Liebig, T., Deichmann, R., Timmermann, L., Weise, L., Hilker, R., 2012.The tremor network targeted by successful VIM deep brain stimulation in humans.Neurology 78, 787–795.
Kriegeskorte, N., Simmons, W.K., Bellgowan, P.S.F., Baker, C.I., 2009. Circular analysis insystems neuroscience — the dangers of double dipping. Nat. Neurosci. 12, 535–540.
Lohmann, G., Muller, K., Bosch, V., Mentzel, H., Hessler, S., Chen, L., Zysset, S., vonCramon, D.Y., 2001. LIPSIA—a new software system for the evaluation of functionalmagnetic resonance images of the human brain. Comput. Med. Imaging Graph. 25,449–457.
Lohmann, G., Margulies, D.S., Horstmann, A., Pleger, B., Lepsien, J., Goldhahn, D.,Schloegl, H., Stumvoll, M., Villringer, A., Turner, R., 2010. Eigenvector centralitymapping for analyzing connectivity patterns in fMRI data of the human brain. PLoSOne 5, e10232.
Lohmann, G., Erfurth, K., Muller, K., Turner, R., 2012. Critical comments on dynamiccausal modelling. NeuroImage 59, 2322–2329.
Lou, Y., Huang, P., Li, D., Cen, Z., Wang, B., Gao, J., Xuan, M., Yu, H., Zhang, M., Luo, W.,2015. Altered brain network centrality in depressed Parkinson's disease patients.Mov. Disord. 30, 1777–1784.
Mayka, M.A., Corcos, D.M., Leurgans, S.E., Vaillancourt, D.E., 2006. Three-dimensionallocations and boundaries of motor and premotor cortices as defined by functionalbrain imaging: a meta-analysis. NeuroImage 31, 1453–1474.
Neely, K.A., Kurani, A.S., Shukla, P., Planetta, P.J., Wagle Shukla, A., Goldman, J.G.,Corcos, D.M., Okun, M.S., Vaillancourt, D.E., 2015. Functional brain activity relatesto 0–3 and 3–8 Hz force oscillations in essential tremor. Cereb. Cortex 25,4191–4202.
Nichols, T., Hayasaka, S., 2003. Controlling the familywise error rate in functional neu-roimaging: a comparative review. Stat. Methods Med. Res. 12, 419–446.
Nicoletti, V., Cecchi, P., Frosini, D., Pesaresi, I., Fabbri, S., Diciotti, S., Bonuccelli, U.,Cosottini, M., Ceravolo, R., 2015. Morphometric and functional MRI changes in es-sential tremor with and without resting tremor. J. Neurol. 262, 719–728.
Obrig, H., Neufang, M., Wenzel, R., Kohl, M., Steinbrink, J., Einhaupl, K., Villringer, A.,2000. Spontaneous low frequency oscillations of cerebral hemodynamics and meta-bolism in human adults. NeuroImage 12, 623–639.
Papavassiliou, E., Rau, G., Heath, S., Abosch, A., Barbaro, N.M., Larson, P.S., Lamborn, K.,Starr, P.A., 2008. Thalamic deep brain stimulation for essential tremor: relation oflead location to outcome. Neurosurgery 62 (Suppl. 2), 884–894.
Passamonti, L., Novellino, F., Cerasa, A., Chiriaco, C., Rocca, F., Matina, M.S., Fera, F.,Quattrone, A., 2011. Altered cortical-cerebellar circuits during verbal workingmemory in essential tremor. Brain 134, 2274–2286.
Poline, J.B., Worsley, K.J., Evans, A.C., Friston, K.J., 1997. Combining spatial extent andpeak intensity to test for activations in functional imaging. NeuroImage 5, 83–96.
Power, J.D., Barnes, K.A., Snyder, A.Z., Schlaggar, B.L., Petersen, S.E., 2012. Spurious butsystematic correlations in functional connectivity MRI networks arise from subjectmotion. NeuroImage 59, 2142–2154.
Power, J.D., Schlaggar, B.L., Lessov-Schlaggar, C.N., Petersen, S.E., 2013. Evidence forhubs in human functional brain networks. Neuron 79, 798–813.
Qiu, T., Luo, X., Shen, Z., Huang, P., Xu, X., Zhou, J., Zhang, M., Alzheimer's DiseaseNeuroimaging, I., 2016. Disrupted brain network in progressive mild cognitive im-pairment measured by eigenvector centrality mapping is linked to cognition andcerebrospinal fluid biomarkers. J. Alzheimers Dis. 54, 1483–1493.
Raethjen, J., Deuschl, G., 2012. The oscillating central network of essential tremor. Clin.Neurophysiol. 123, 61–64.
Song, I.U., Ha, S.W., Yang, Y.S., Chung, Y.A., 2015. Differences in regional glucose me-tabolism of the brain measured with F-18-FDG-PET in patients with essential tremoraccording to their response to beta-blockers. Korean J. Radiol. 16, 967–972.
Yin, W., Lin, W., Li, W., Qian, S., Mou, X., 2016. Resting state fMRI demonstrates a dis-turbance of the cerebello-cortical circuit in essential tremor. Brain Topogr. 29,412–418.
Zirh, A., Reich, S.G., Dougherty, P.M., Lenz, F.A., 1999. Stereotactic thalamotomy in thetreatment of essential tremor of the upper extremity: reassessment including ablinded measure of outcome. J. Neurol. Neurosurg. Psychiatry 66, 772–775.
K. Mueller et al. NeuroImage: Clinical 16 (2017) 468–476
476


![Functional Connectivity Alterations in Children with ...€¦ · thalamic injury following profound hypoxic insults and commonly seen in term infants [17, 18]. Cortical injury and](https://img.pdfslide.net/doc/110x75/5feec6b29d7ab34bba4d8b20/functional-connectivity-alterations-in-children-with-thalamic-injury-following.jpg)