Embed Size (px)
Citation preview

General information on child nutrition
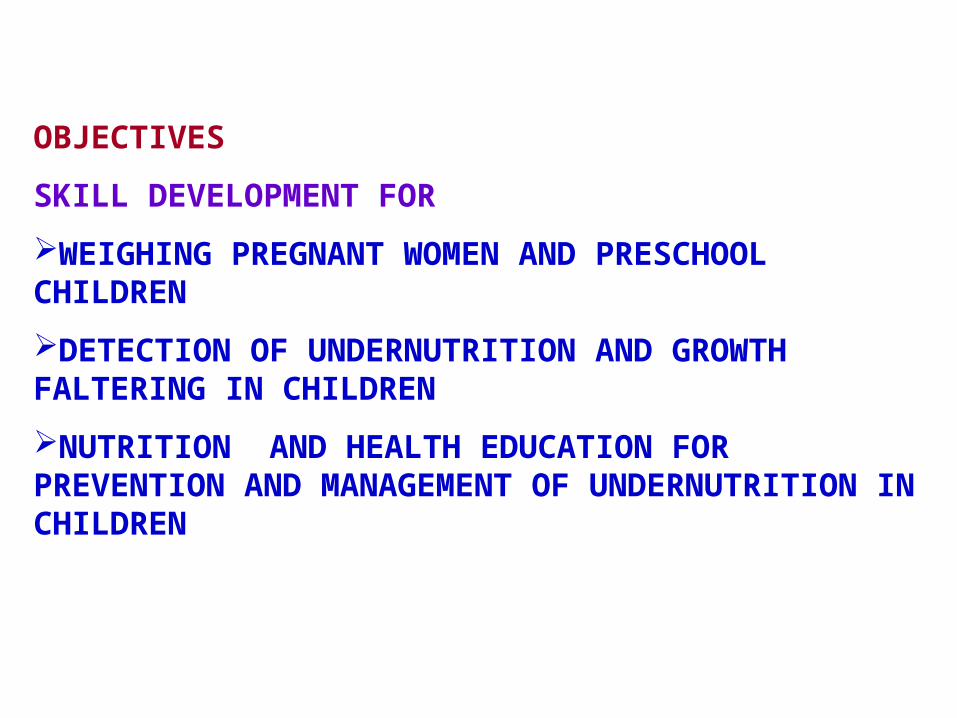
OBJECTIVES
SKILL DEVELOPMENT FOR
WEIGHING PREGNANT WOMEN AND PRESCHOOL CHILDREN
DETECTION OF UNDERNUTRITION AND GROWTH FALTERING IN CHILDREN
NUTRITION AND HEALTH EDUCATION FOR PREVENTION AND MANAGEMENT OF UNDERNUTRITION IN CHILDREN
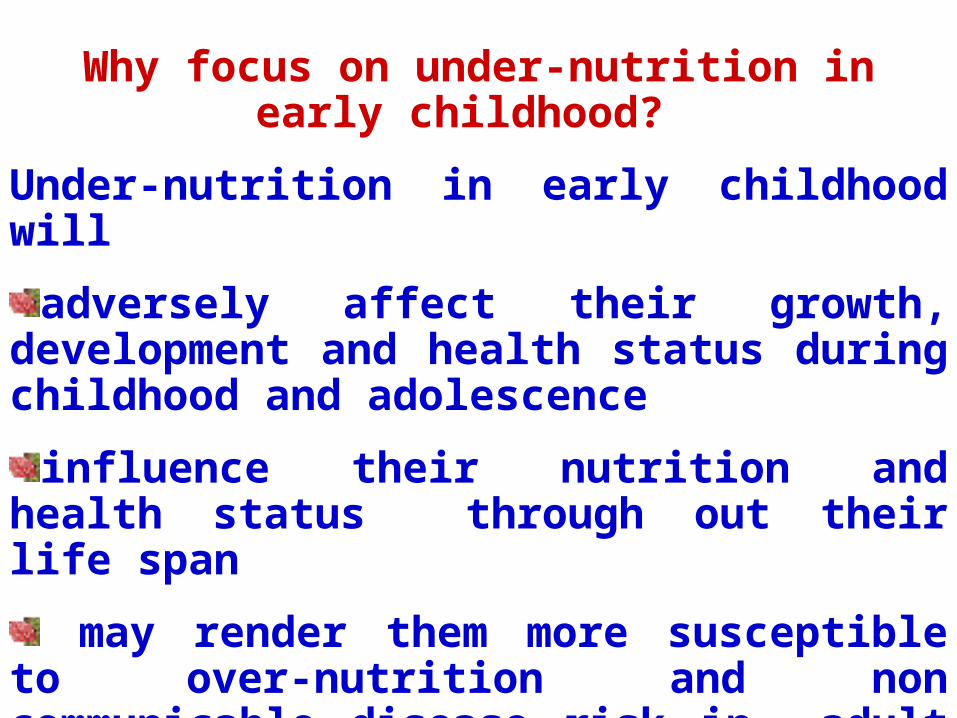
Why focus on under-nutrition in early childhood?
Under-nutrition in early childhood will
adversely affect their growth, development and health status during childhood and adolescence
influence their nutrition and health status through out their life span
may render them more susceptible to over-nutrition and non communicable disease risk in adult life
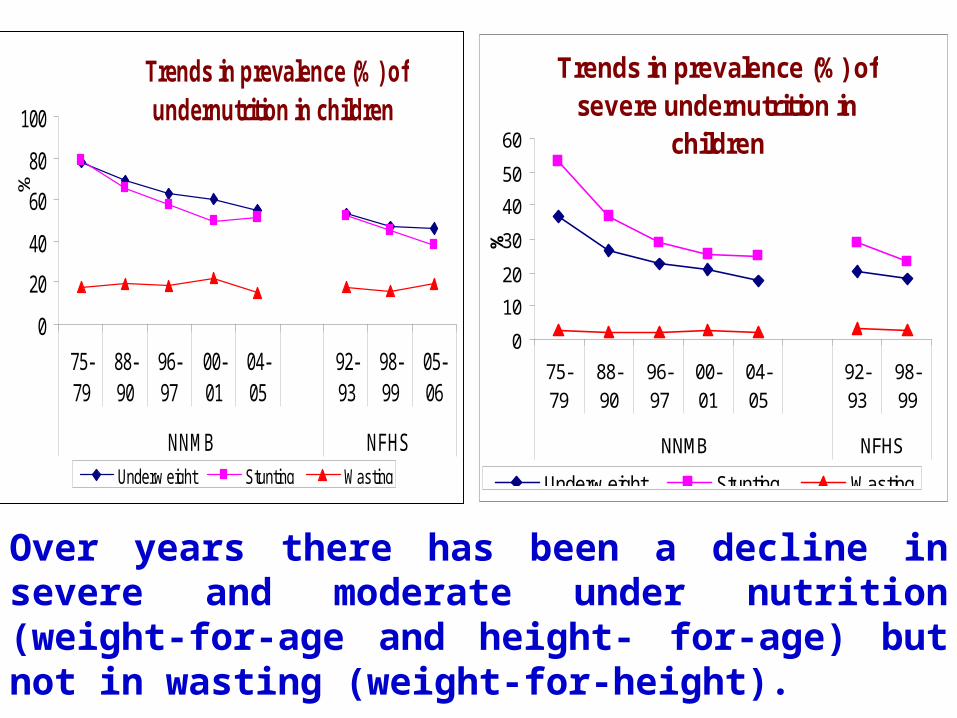
Trends in prevalence (%) of undernutrition in children
0
20
40
60
80
100
75-79
88-90
96-97
00-01
04-05
92-93
98-99
05-06
NNMB NFHS
%
Underw eight Stunting Wasting
Trends in prevalence (%) of severe undernutrition in
children
0
10
20
30
40
50
60
75-79
88-90
96-97
00-01
04-05
92-93
98-99
NNMB NFHS
%Underw eight Stunting Wasting
Over years there has been a decline in severe and moderate under nutrition (weight-for-age and height- for-age) but not in wasting (weight-for-height).
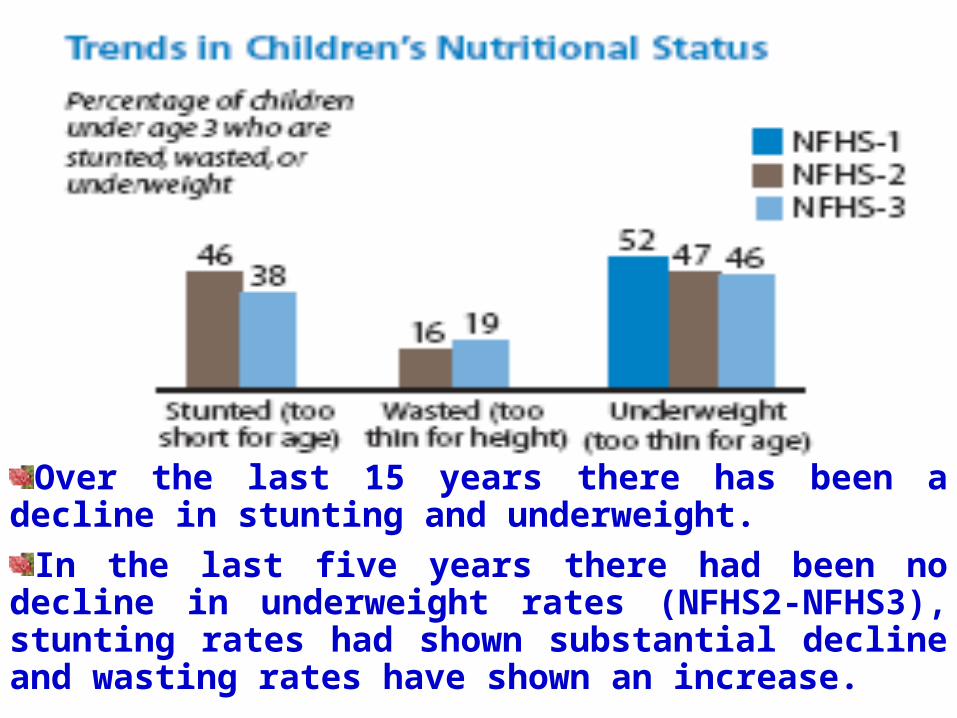
Over the last 15 years there has been a decline in stunting and underweight.
In the last five years there had been no decline in underweight rates (NFHS2-NFHS3), stunting rates had shown substantial decline and wasting rates have shown an increase.
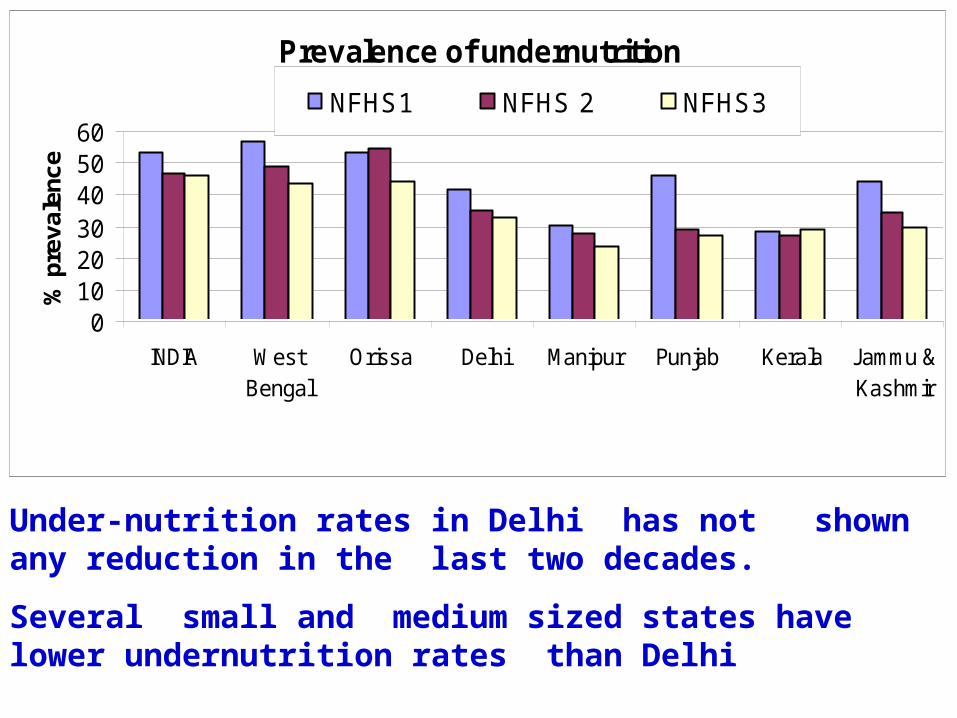
Prevalence of undernutrition
0102030405060
INDIA WestBengal
Orissa Delhi Manipur Punjab Kerala Jammu &Kashmir
% p
reva
lenc
e
NFHS1 NFHS 2 NFHS3
Under-nutrition rates in Delhi has not shown any reduction in the last two decades.
Several small and medium sized states have lower undernutrition rates than Delhi

Beginning of under-nutrition: in utero
Nutritional status during infancy
Nutritional status in early childhood
Detection of undernutrition
Under-nutrition begins in utero
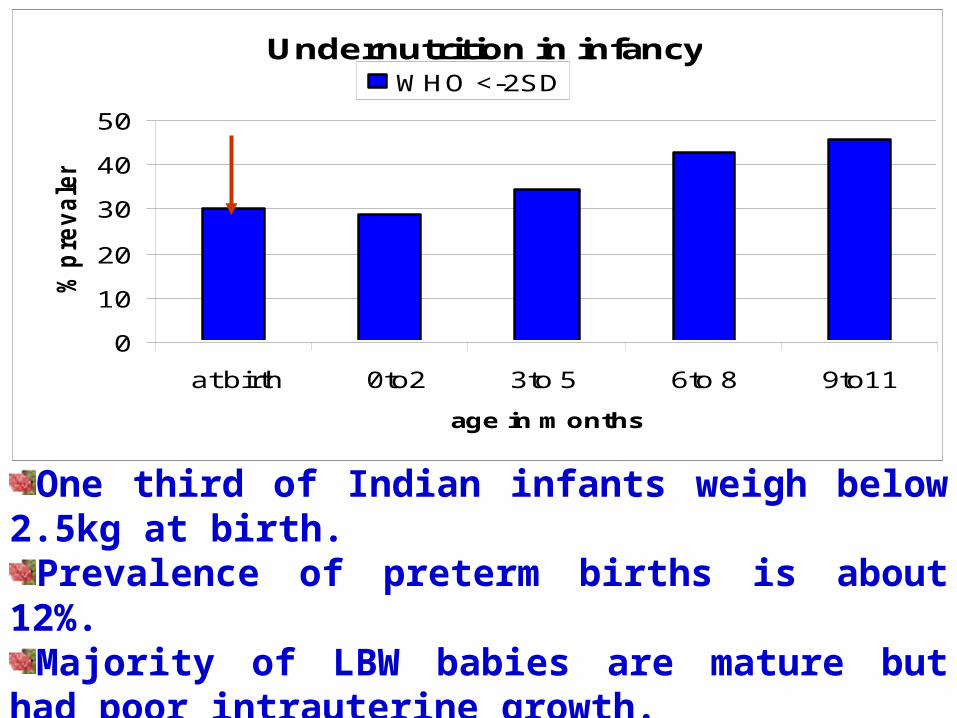
Undernutrition in infancy
0
10
20
30
40
50
at birth 0to2 3to 5 6to 8 9to11
age in months
%p
revale
ne
WHO <-2SD
One third of Indian infants weigh below 2.5kg at birth.
Prevalence of preterm births is about 12%.Majority of LBW babies are mature but had poor
intrauterine growth.
2200230024002500260027002800290030003100
< 16 16-17 17-18.5 18.5-20 20-25 > 25
BMI (Kg/m2)
0
10
20
30
40
50
60
Mean Birth Weight (g) Prevalence of LBW (%)
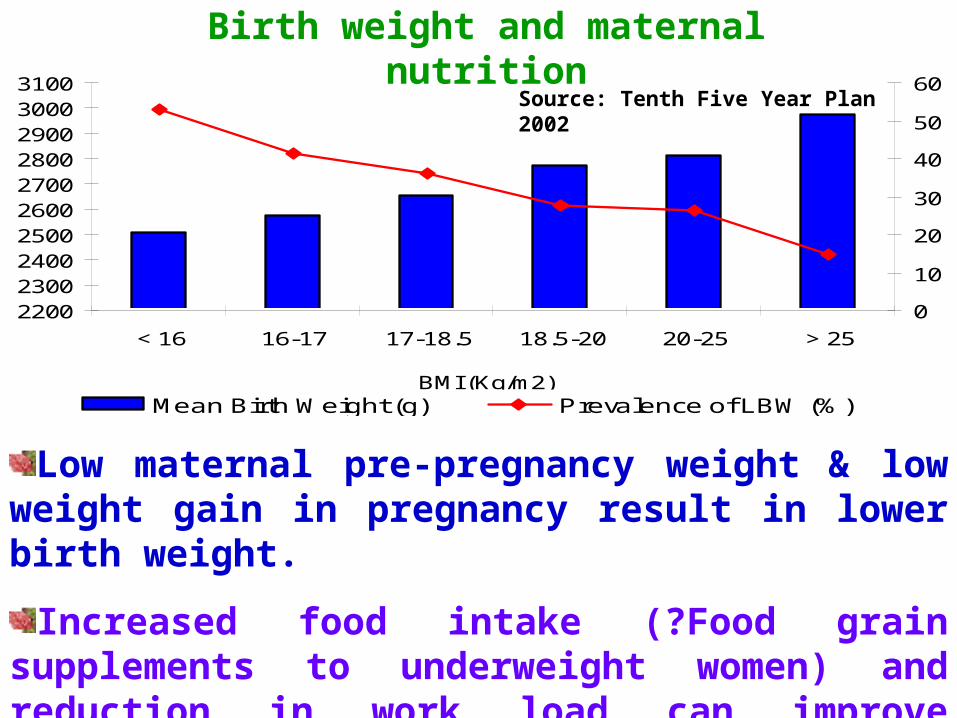
Birth weight and maternal nutrition
Source: Tenth Five Year Plan 2002
Low maternal pre-pregnancy weight & low weight gain in pregnancy result in lower birth weight.
Increased food intake (?Food grain supplements to underweight women) and reduction in work load can improve pregnancy weight gain & birth weight.
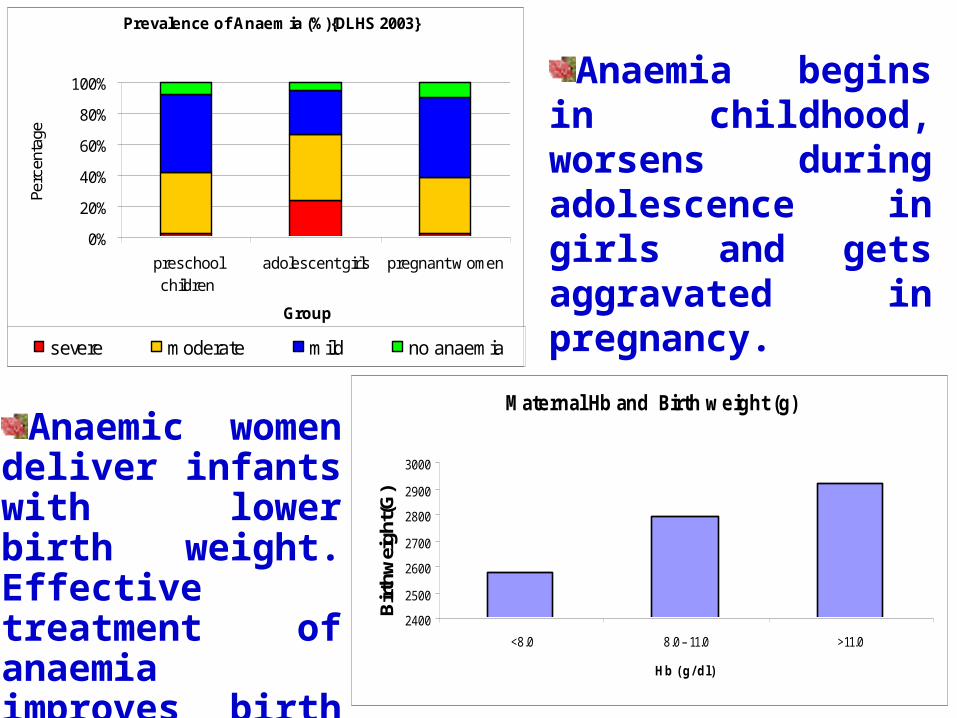
Prevalence of Anaemia (%){DLHS 2003}
0%
20%
40%
60%
80%
100%
preschoolchildren
adolescent girls pregnant w omen
Group
Perc
enta
ge
severe moderate mild no anaemia
Anaemia begins in childhood, worsens during adolescence in girls and gets aggravated in pregnancy.
Maternal Hb and Birth weight (g)
2400
2500
2600
2700
2800
2900
3000
< 8.0 8.0 – 11.0 > 11.0
Hb (g/ dl)
Birt
hwei
ght(
G)
Anaemic women deliver infants with lower birth weight. Effective treatment of anaemia improves birth weight.
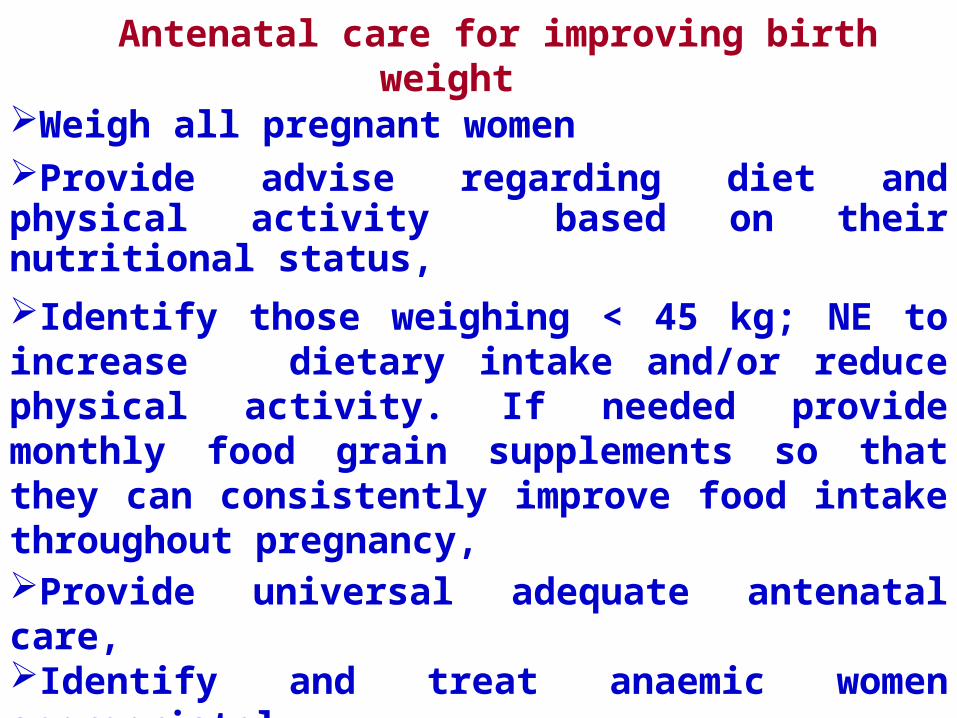
Antenatal care for improving birth weight Weigh all pregnant women Provide advise regarding diet and physical activity based on their nutritional status,
Identify those weighing < 45 kg; NE to increase dietary intake and/or reduce physical activity. If needed provide monthly food grain supplements so that they can consistently improve food intake throughout pregnancy,Provide universal adequate antenatal care,Identify and treat anaemic women appropriately Detect and treat antenatal problems,All these can be effectively implemented through convergence between ICDS & NRHM. This opportunity should be fully utilised.
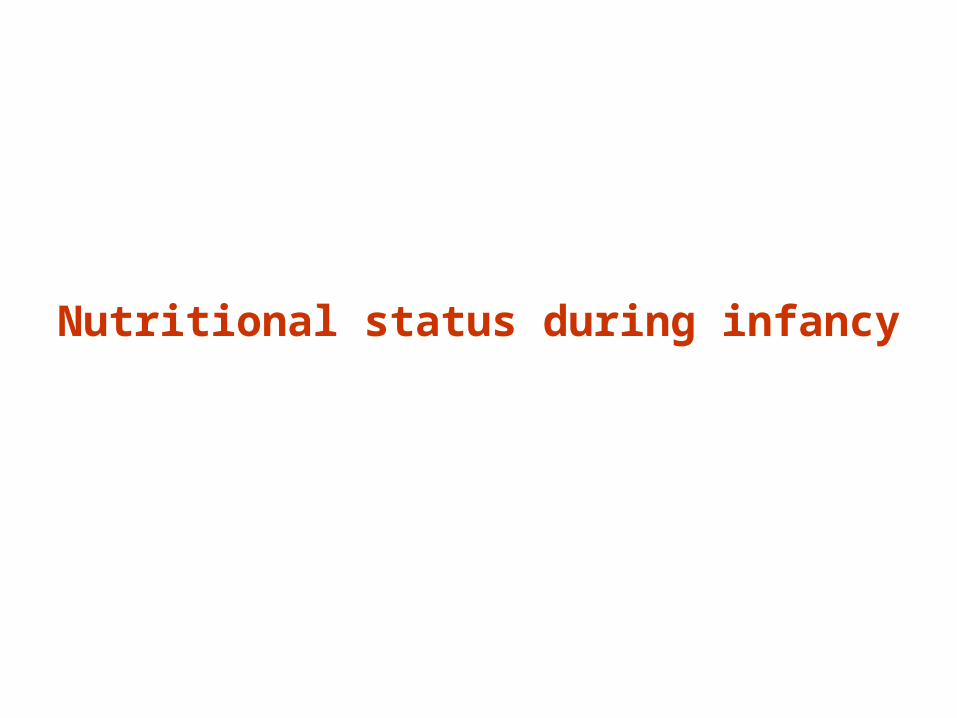
Nutritional status during infancy
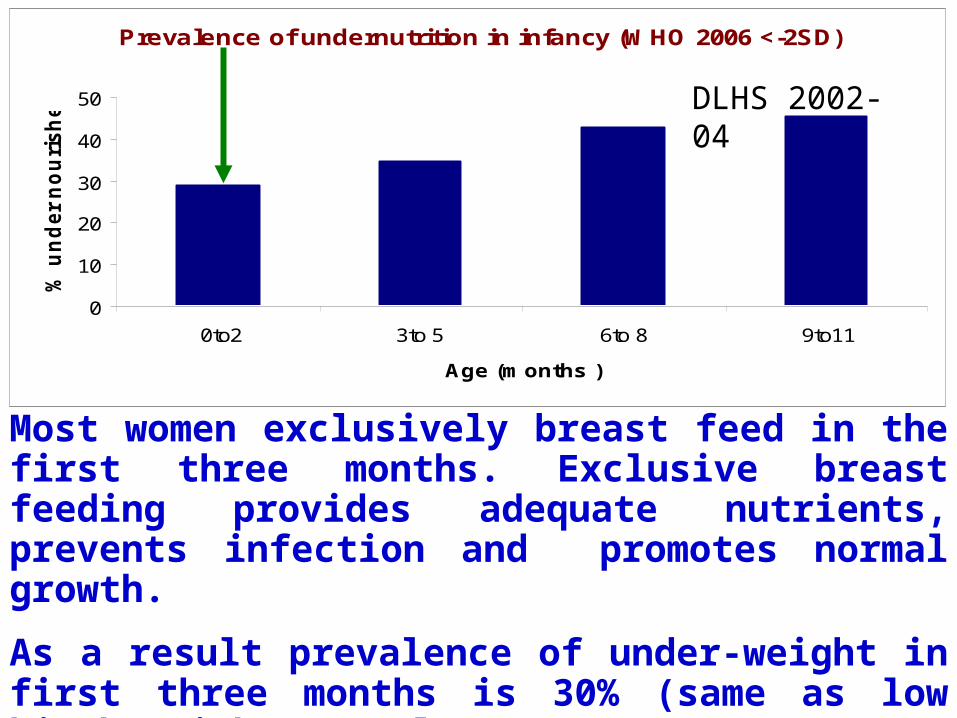
Prevalence of undernutrition in infancy (WHO 2006 <-2SD)
0
10
20
30
40
50
0to2 3to 5 6to 8 9to11
Age (months )
% u
nd
er
no
uri
sh
ed
Most women exclusively breast feed in the first three months. Exclusive breast feeding provides adequate nutrients, prevents infection and promotes normal growth.
As a result prevalence of under-weight in first three months is 30% (same as low birth weight prevalence).
DLHS 2002-04
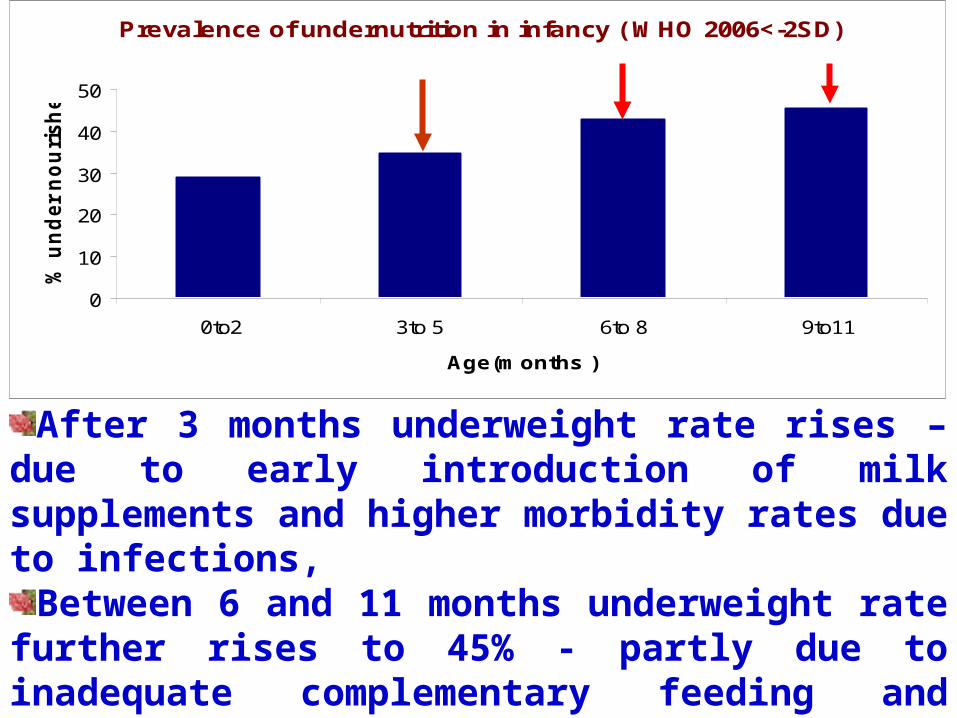
Prevalence of undernutrition in infancy ( WHO 2006<-2SD)
0
10
20
30
40
50
0to2 3to 5 6to 8 9to11
Age(months )
% u
nd
er
no
uri
sh
ed
After 3 months underweight rate rises – due to early introduction of milk supplements and higher morbidity rates due to infections,
Between 6 and 11 months underweight rate further rises to 45% - partly due to inadequate complementary feeding and partly due to increase in morbidity due to infections.
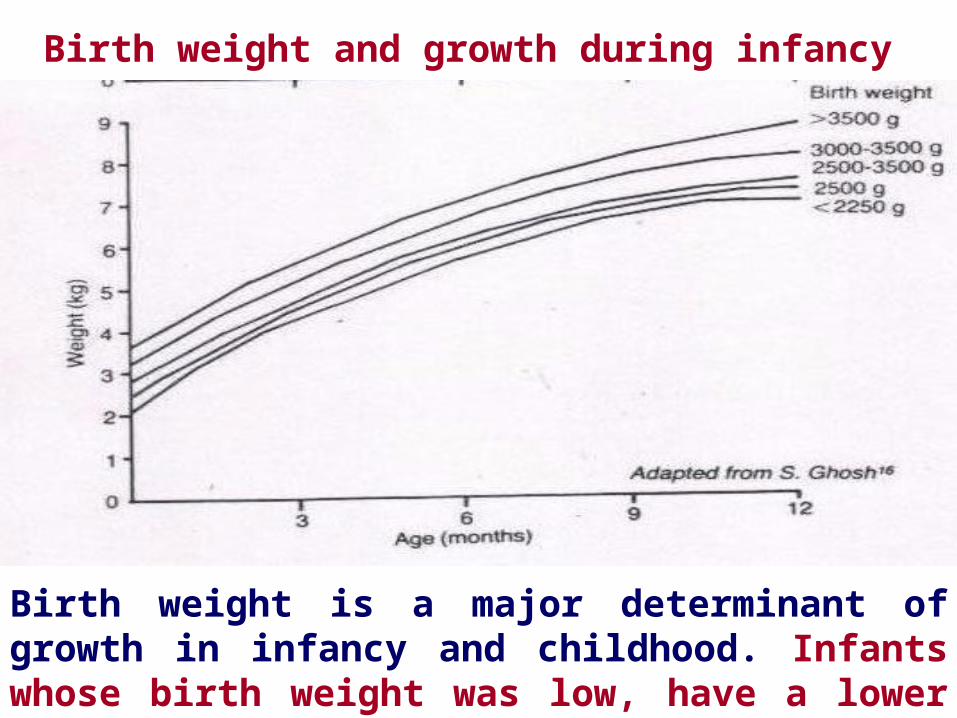
Birth weight is a major determinant of growth in infancy and childhood. Infants whose birth weight was low, have a lower growth trajectory.
Birth weight and growth during infancy
Nutritional status in early childhood
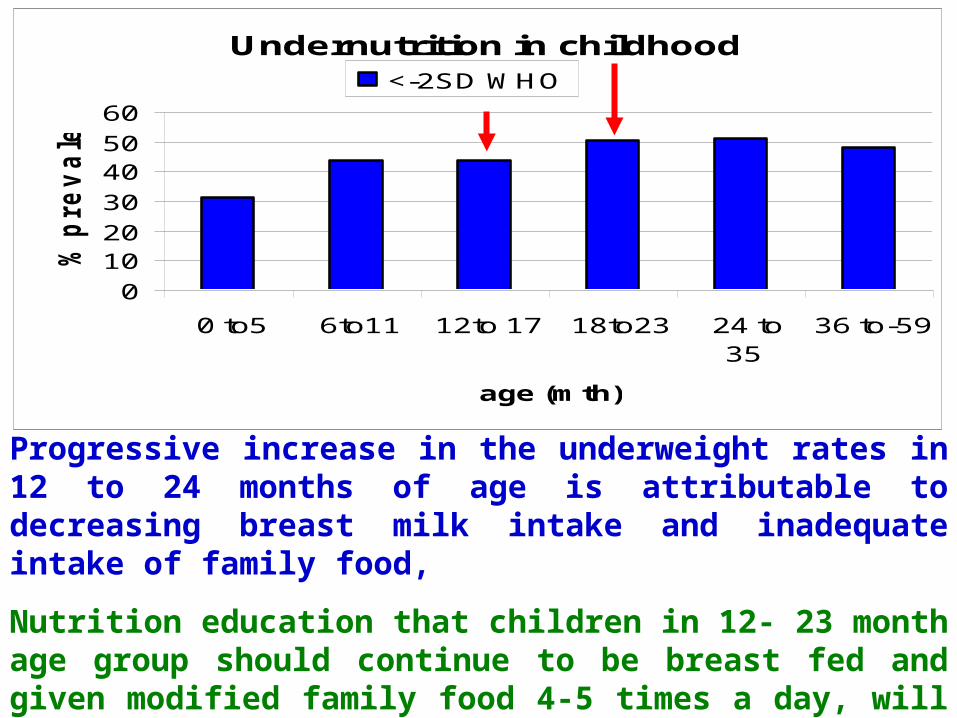
Undernutrition in childhood
0
1020
30
4050
60
0 to5 6to11 12to 17 18to23 24 to35
36 to-59
age (mth)
%p
re
va
len
ce
<-2SD WHO
Progressive increase in the underweight rates in 12 to 24 months of age is attributable to decreasing breast milk intake and inadequate intake of family food,
Nutrition education that children in 12- 23 month age group should continue to be breast fed and given modified family food 4-5 times a day, will go a long way in reducing the under-nutrition in this age group.
Age groups Males Females
Kcals RDA % RDA Kcals RDA % RDA
Pre-school 889 1357 65.5 897 1351 66.4
School Age 1464 1929 75.9 1409 1876 75.1
Adolescents 2065 2441 84.6 1670 1823 91.6
Adults 2226 2425 91.8 1923 1874 102.6
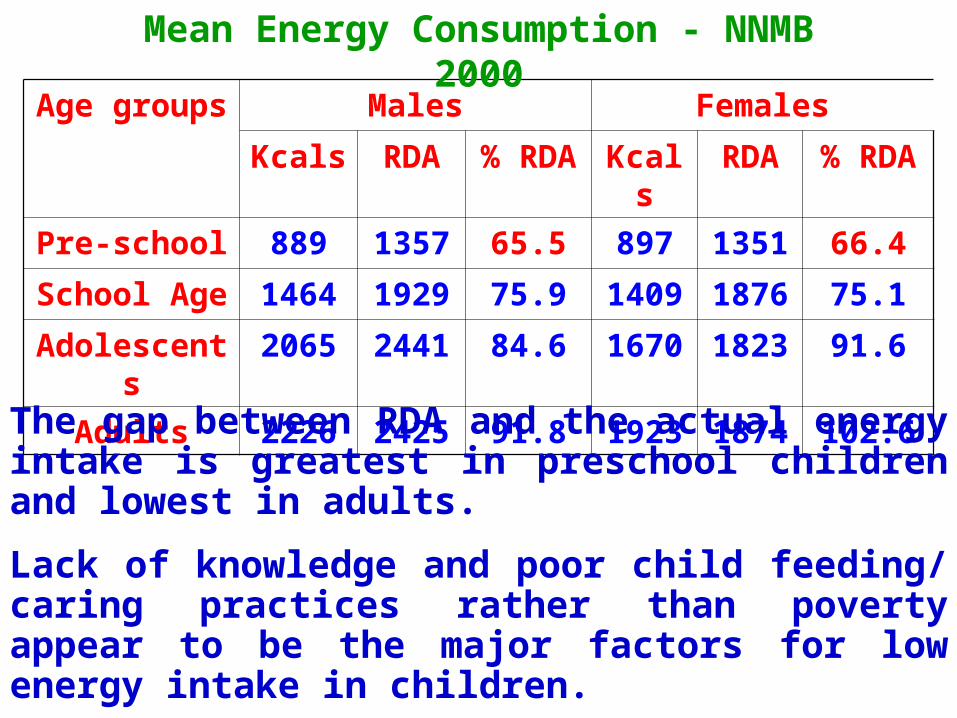
Mean Energy Consumption - NNMB 2000
The gap between RDA and the actual energy intake is greatest in preschool children and lowest in adults.
Lack of knowledge and poor child feeding/ caring practices rather than poverty appear to be the major factors for low energy intake in children.
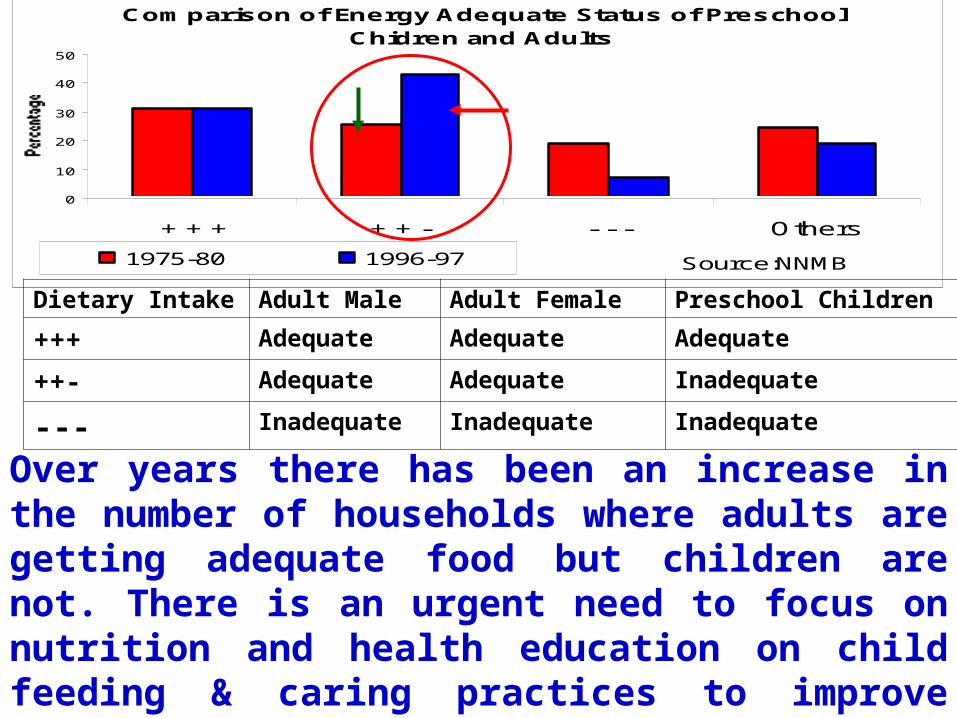
Comparison of Energy Adequate Status of Preschool Chidren and Adults
0
10
20
30
40
50
+ + + + + - - - - Others
1975-80 1996-97 Source:NNMB
Over years there has been an increase in the number of households where adults are getting adequate food but children are not. There is an urgent need to focus on nutrition and health education on child feeding & caring practices to improve dietary intake in preschool child.
Dietary Intake Adult Male Adult Female Preschool Children
+++ Adequate Adequate Adequate
++- Adequate Adequate Inadequate
--- Inadequate Inadequate Inadequate
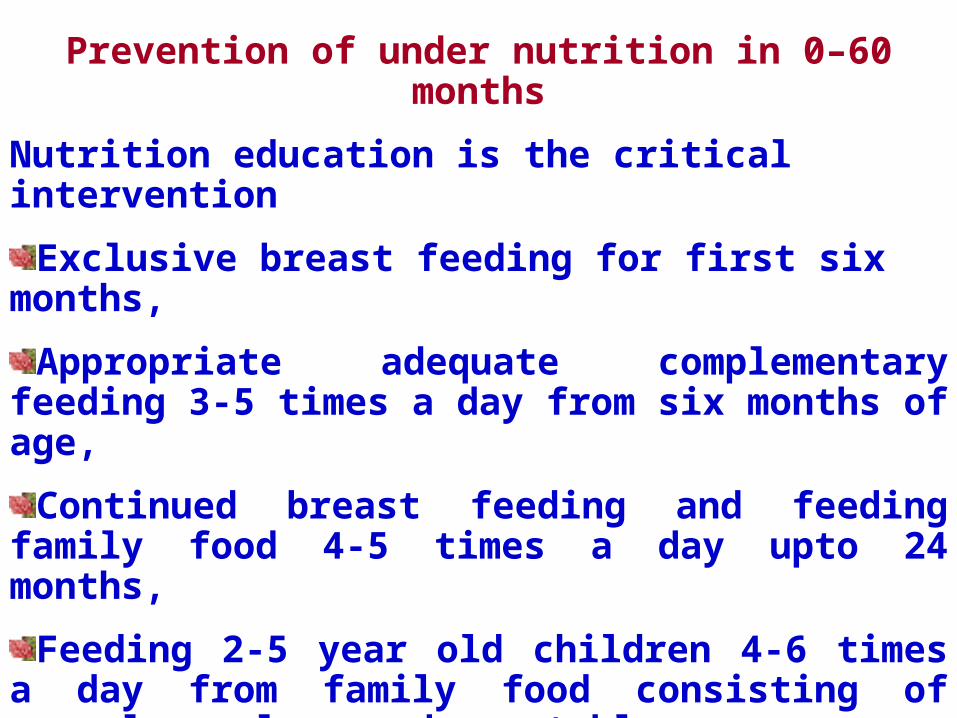
Prevention of under nutrition in 0–60 months
Nutrition education is the critical intervention
Exclusive breast feeding for first six months,
Appropriate adequate complementary feeding 3-5 times a day from six months of age,
Continued breast feeding and feeding family food 4-5 times a day upto 24 months,
Feeding 2-5 year old children 4-6 times a day from family food consisting of cereals, pulses and vegetables.
Advise regarding timely immunisation, measures to prevent infections, care during illness and convalescence.
Detection of undernutrition
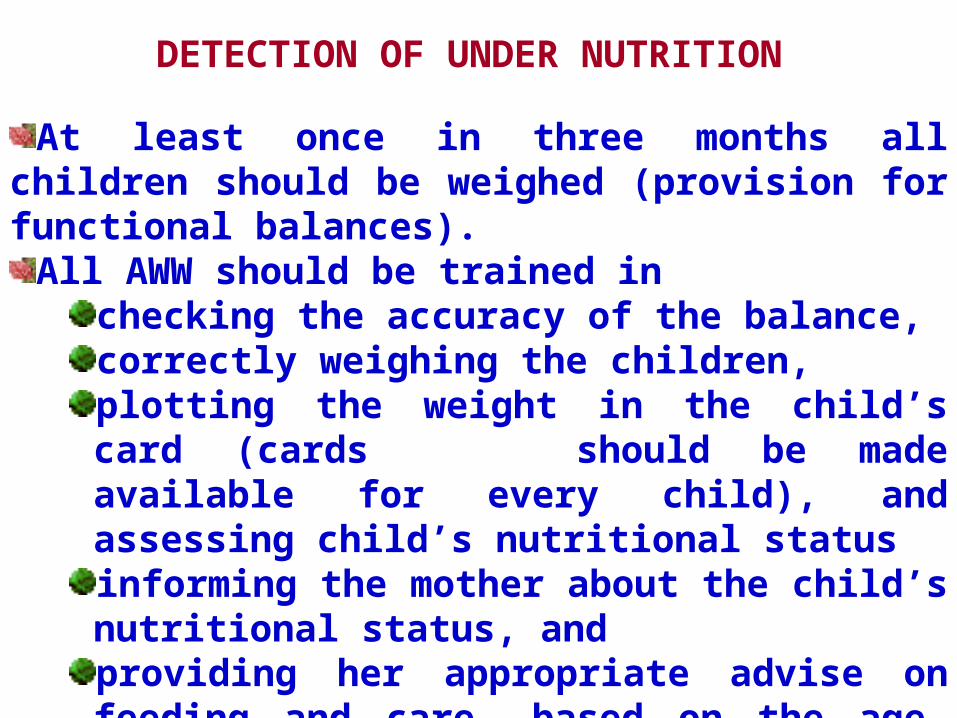
DETECTION OF UNDER NUTRITION
At least once in three months all children should be weighed (provision for functional balances).
All AWW should be trained inchecking the accuracy of the balance,correctly weighing the children,plotting the weight in the child’s card (cards should be made available for every child), and assessing child’s nutritional status informing the mother about the child’s nutritional status, andproviding her appropriate advise on feeding and care, based on the age, feeding practices and nutritional status of the child.

Assessment of nutritional status
Weight-for-age is most widely used index for assessment of nutritional status in children in all settings – hospitals to anganwadi.
In India, three standards for weight for age are being used for assessing & reporting under-nutrition
IAP standards – currently used in ICDS programme,
WHO/NCHS standards: Used in NNMB, NFHS and DLHS,
WHO (2006) used in NFHS-3 and DLHS – 2.
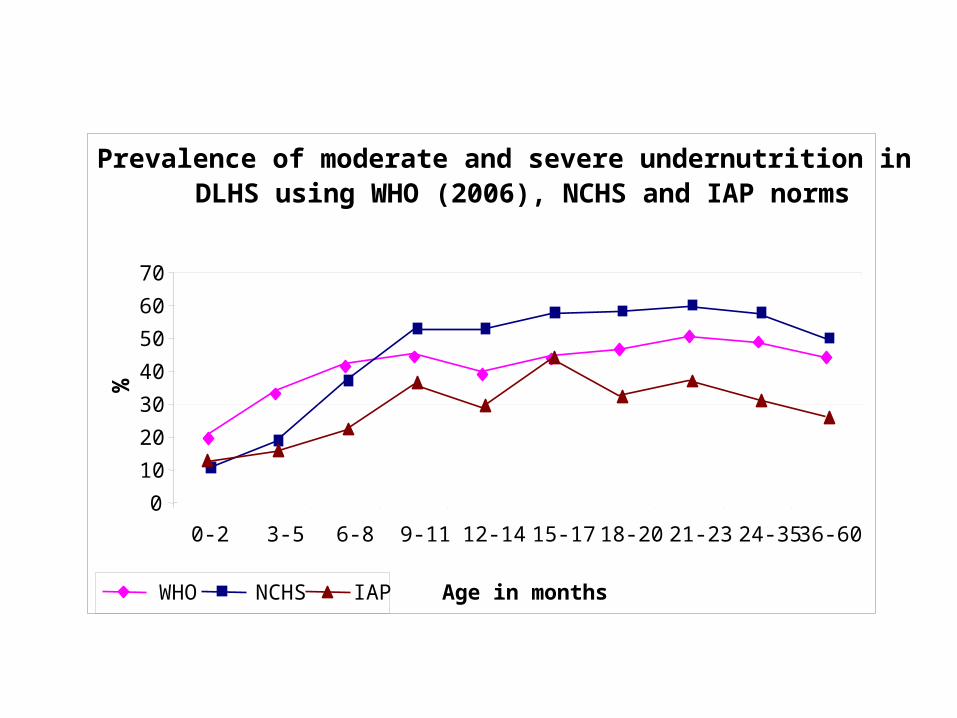
Prevalence of moderate and severe undernutrition in DLHS using WHO (2006), NCHS and IAP norms
0
10
20
30
40
50
60
70
0-2 3-5 6-8 9-11 12-14 15-17 18-20 21-23 24-35 36-60
Age in months
%
WHO NCHS IAP
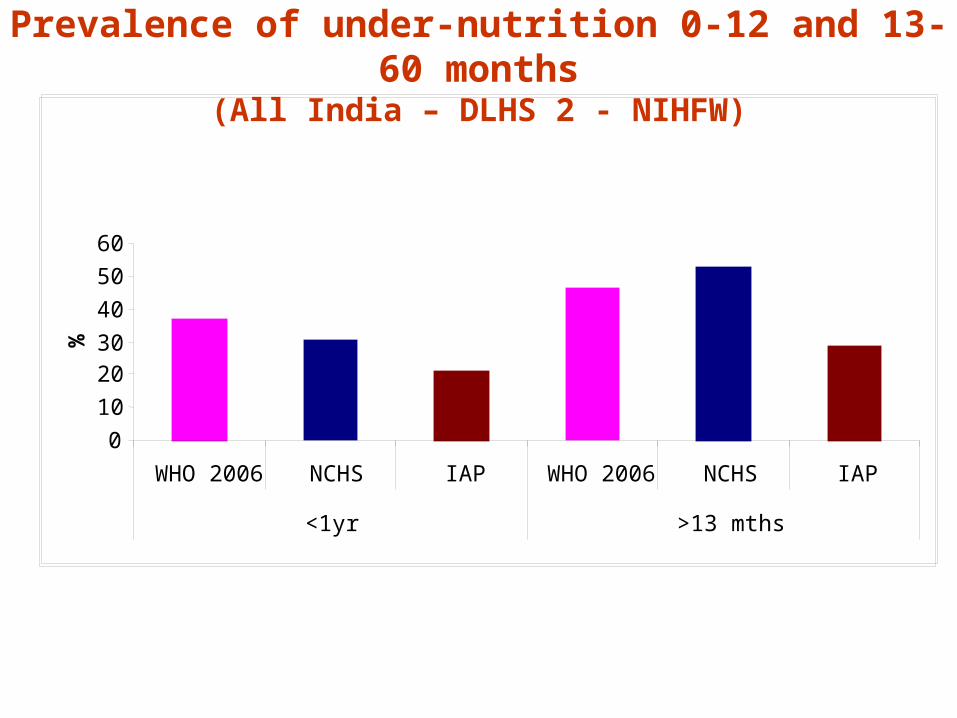
Prevalence of under-nutrition 0-12 and 13-60 months(All India – DLHS 2 - NIHFW)
0
10
2030
40
50
60
WHO 2006 NCHS IAP WHO 2006 NCHS IAP
<1yr >13 mths
%
There are substantial differences in prevalence of under-nutrition as assessed by the three standards
These vary with age of the child.
Use of multiple standards in different reporting systems has created a lot of confusion.
Government of India has decided to hence forth use the WHO 2006 standards in ICDS as well as health care settings .
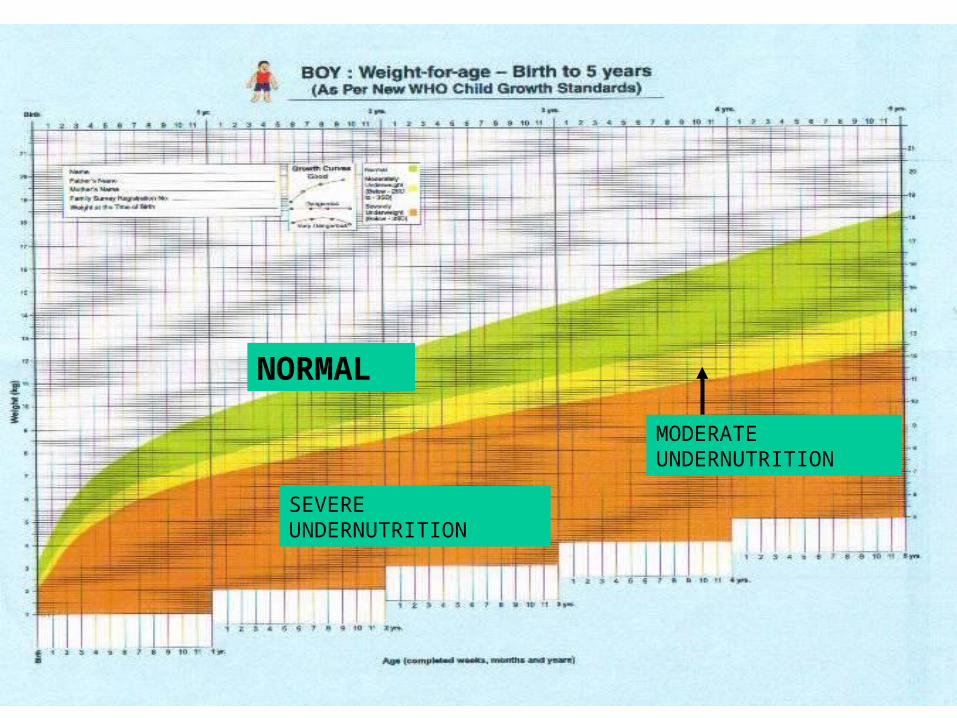
SEVERE UNDERNUTRITION
MODERATE UNDERNUTRITION
NORMAL

To sum up
Low birth-weight rate in India is 30% could be reduced through better antenatal care
Prevalence of under-weight in first three months is 30%- exclusive breast-feeding prevents deterioration in nutritional status.
After 3 months underweight rate rises – due to introduction of milk supplements & infections.
Between 6 and 11 months underweight rate further rises to 45% - due to inadequate complementary feeding & infections.
Poor infant feeding and caring practices are major determinants of underweight in infancy; nutrition education and health care can prevent the rise in under-nutrition rates.
Progressive increase in the underweight rates in 12 to 24 months of age – mainly attributable to inadequate intake of family food due to poor child feeding practices. Nutrition education to correct these faulty habits is the critical intervention needed.
Further rise in under-nutrition rates is mainly due to poor intra-family distribution of food; nutrition education to parents that children have small stomach capacity and have to be fed 5-6 times a day to fully get adequate food intake will improve dietary intake and nutritional status .