Embed Size (px)
Citation preview
General Ledger Sample Reports
Copyright © 1983-2015
Software Technology, Inc.
1621 Cushman Drive
Lincoln, NE 68512
(402) 423-1440
www.Tabs3.com
Tabs3, PracticeMaster, and the “pinwheel” symbol ( ) are registered trademarks of
Software Technology, Inc.
Portions copyright © Microsoft Corporation
Version 17 (January 2014)
Tabs3 General Ledger Software
Sample Reports
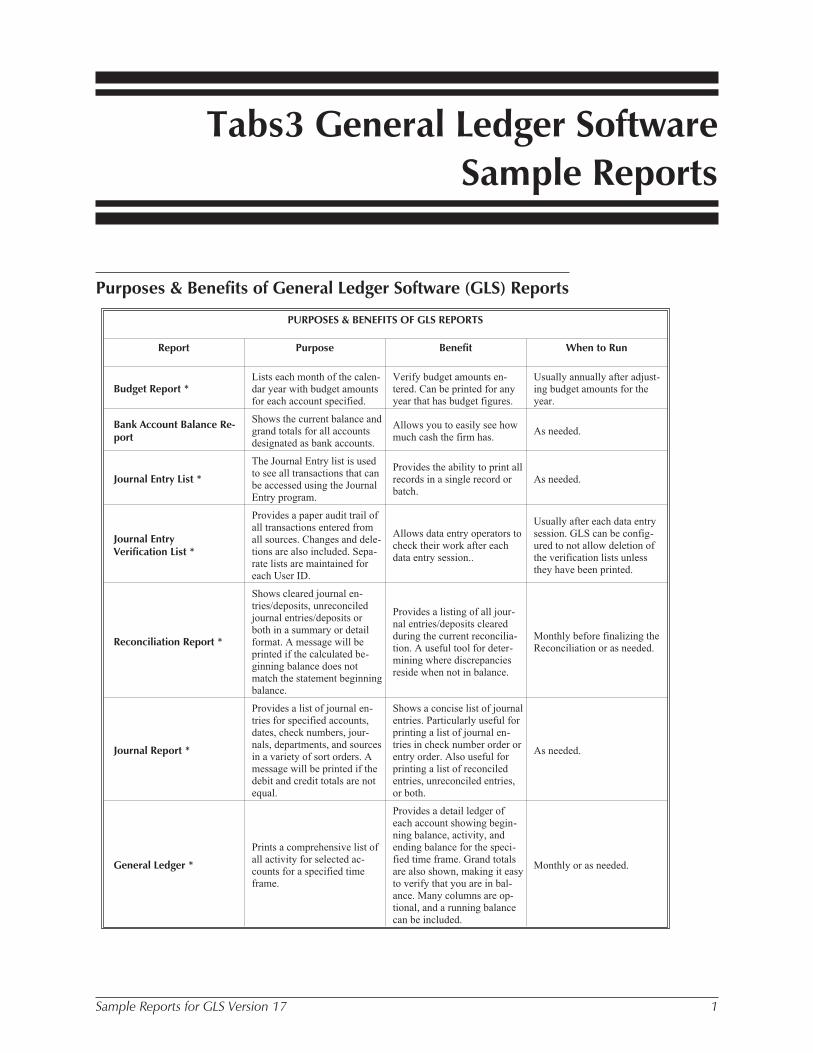
Purposes & Benefits of General Ledger Software (GLS) Reports
Sample Reports for GLS Version 17 1
PURPOSES & BENEFITS OF GLS REPORTS
Report Purpose Benefit When to Run
Budget Report *Lists each month of the calen-dar year with budget amountsfor each account specified.
Verify budget amounts en-tered. Can be printed for anyyear that has budget figures.
Usually annually after adjust-ing budget amounts for theyear.
Bank Account Balance Re-port
Shows the current balance andgrand totals for all accountsdesignated as bank accounts.
Allows you to easily see howmuch cash the firm has.
As needed.
Journal Entry List *
The Journal Entry list is usedto see all transactions that canbe accessed using the JournalEntry program.
Provides the ability to print allrecords in a single record orbatch.
As needed.
Journal EntryVerification List *
Provides a paper audit trail ofall transactions entered fromall sources. Changes and dele-tions are also included. Sepa-rate lists are maintained foreach User ID.
Allows data entry operators tocheck their work after eachdata entry session..
Usually after each data entrysession. GLS can be config-ured to not allow deletion ofthe verification lists unlessthey have been printed.
Reconciliation Report *
Shows cleared journal en-tries/deposits, unreconciledjournal entries/deposits orboth in a summary or detailformat. A message will beprinted if the calculated be-ginning balance does notmatch the statement beginningbalance.
Provides a listing of all jour-nal entries/deposits clearedduring the current reconcilia-tion. A useful tool for deter-mining where discrepanciesreside when not in balance.
Monthly before finalizing theReconciliation or as needed.
Journal Report *
Provides a list of journal en-tries for specified accounts,dates, check numbers, jour-nals, departments, and sourcesin a variety of sort orders. Amessage will be printed if thedebit and credit totals are notequal.
Shows a concise list of journalentries. Particularly useful forprinting a list of journal en-tries in check number order orentry order. Also useful forprinting a list of reconciledentries, unreconciled entries,or both.
As needed.
General Ledger *
Prints a comprehensive list ofall activity for selected ac-counts for a specified timeframe.
Provides a detail ledger ofeach account showing begin-ning balance, activity, andending balance for the speci-fied time frame. Grand totalsare also shown, making it easyto verify that you are in bal-ance. Many columns are op-tional, and a running balancecan be included.
Monthly or as needed.
Sample Reports for GLS Version 17 2
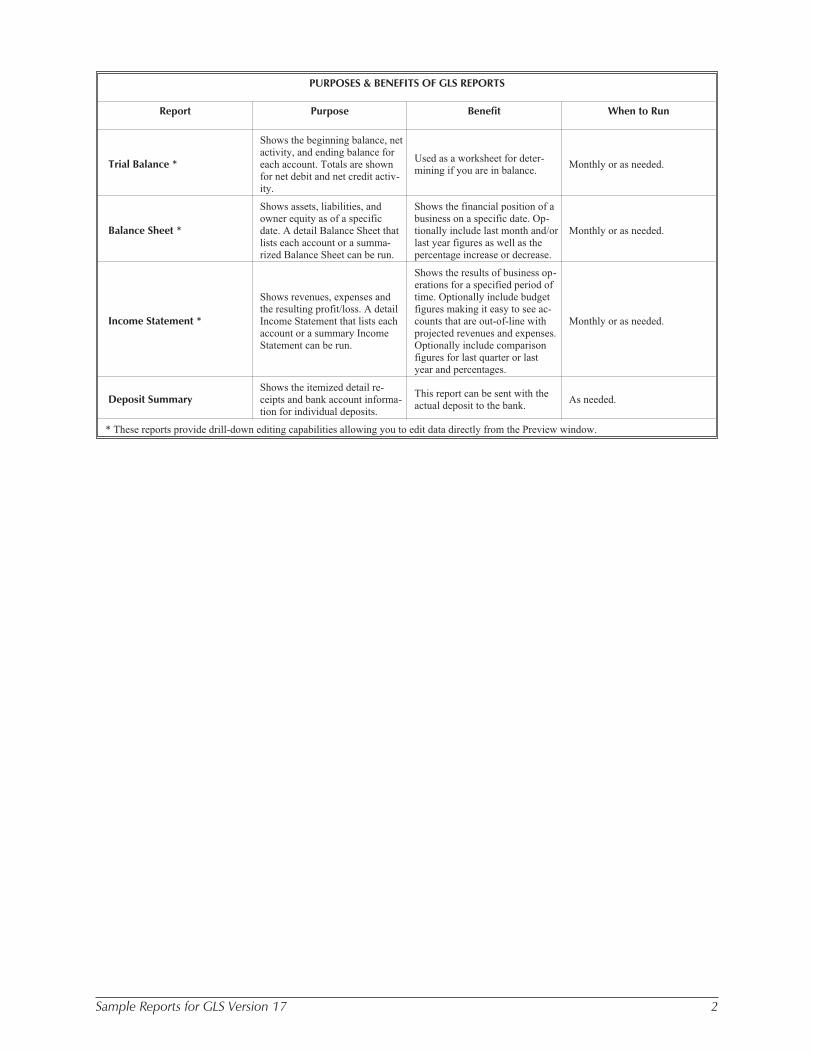
PURPOSES & BENEFITS OF GLS REPORTS
Report Purpose Benefit When to Run
Trial Balance *
Shows the beginning balance, netactivity, and ending balance foreach account. Totals are shownfor net debit and net credit activ-ity.
Used as a worksheet for deter-mining if you are in balance.
Monthly or as needed.
Balance Sheet *
Shows assets, liabilities, andowner equity as of a specificdate. A detail Balance Sheet thatlists each account or a summa-rized Balance Sheet can be run.
Shows the financial position of abusiness on a specific date. Op-tionally include last month and/orlast year figures as well as thepercentage increase or decrease.
Monthly or as needed.
Income Statement *
Shows revenues, expenses andthe resulting profit/loss. A detailIncome Statement that lists eachaccount or a summary IncomeStatement can be run.
Shows the results of business op-erations for a specified period oftime. Optionally include budgetfigures making it easy to see ac-counts that are out-of-line withprojected revenues and expenses.Optionally include comparisonfigures for last quarter or lastyear and percentages.
Monthly or as needed.
Deposit SummaryShows the itemized detail re-ceipts and bank account informa-tion for individual deposits.
This report can be sent with theactual deposit to the bank.
As needed.
* These reports provide drill-down editing capabilities allowing you to edit data directly from the Preview window.
Sample Reports
Sample Reports for GLS Version 17 3
Table of Contents
Balance Sheet. . . . . . . . . . . . . . . . . . . . . . . . . . . 23 thru 26, 34, 38 thru 40
Bank Account Balance Report . . . . . . . . . . . . . . . . . . . . . . . . . . . . . . . . 12
Budget Report . . . . . . . . . . . . . . . . . . . . . . . . . . . . . . . . . . . . . . . . . . . . 10
Chart of Accounts . . . . . . . . . . . . . . . . . . . . . . . . . . . 7 thru 10, 34, 35, 37
Criteria Page. . . . . . . . . . . . . . . . . . . . . . . . . . . . . . . . . . . . . . . . . . . . . . 18
Department List . . . . . . . . . . . . . . . . . . . . . . . . . . . . . . . . . . . . . . . . . 5, 36
Deposit Summary. . . . . . . . . . . . . . . . . . . . . . . . . . . . . . . . . . . . . . . . . . 13
Detail Balance Sheet . . . . . . . . . . . . . . . . . . . . . . . . . . . . . . 23, 38 thru 40
Detail Income Statement . . . . . . . . . . . . . . . . . . . . . . . . . . . 27, 41 thru 42
General Ledger. . . . . . . . . . . . . . . . . . . . . . . . . . . . . . . . . . . . . . 18 thru 20
GLS Client List . . . . . . . . . . . . . . . . . . . . . . . . . . . . . . . . . . . . . . . . . . . . 4
Income Statement . . . . . . . . . . . . . . . . . . . . . . . . . . 27 thru 32, 41 thru 42
Journal Entry List by Batch Number . . . . . . . . . . . . . . . . . . . . . . . . . . . . 5
Journal Entry List by Transaction Number. . . . . . . . . . . . . . . . . . . . . . . . 6
Journal Entry Verification List . . . . . . . . . . . . . . . . . . . . . . . . . . . . . . . . 11
Journal Name List . . . . . . . . . . . . . . . . . . . . . . . . . . . . . . . . . . . . . . . . . . 5
Journal Report . . . . . . . . . . . . . . . . . . . . . . . . . . . . . . . . . . . . . . . . . 16, 17
Reconciliation Report. . . . . . . . . . . . . . . . . . . . . . . . . . . . . . . . . . . . . . . 14
Recurring Entry List. . . . . . . . . . . . . . . . . . . . . . . . . . . . . . . . . . . . . . . . . 6
Summary Balance Sheet. . . . . . . . . . . . . . . . . . . . . . . . . . . . . . . . . . 25, 26
Summary Income Statement. . . . . . . . . . . . . . . . . . . . . . . . . . . . . . . . . . 32
Trial Balance . . . . . . . . . . . . . . . . . . . . . . . . . . . . . . . . . . . . . . . . . . . . . 22
Verification List . . . . . . . . . . . . . . . . . . . . . . . . . . . . . . . . . . . . . . . . . . . 11
Sam
ple
Rep
orts
4 Sample Reports for GLS Version 17
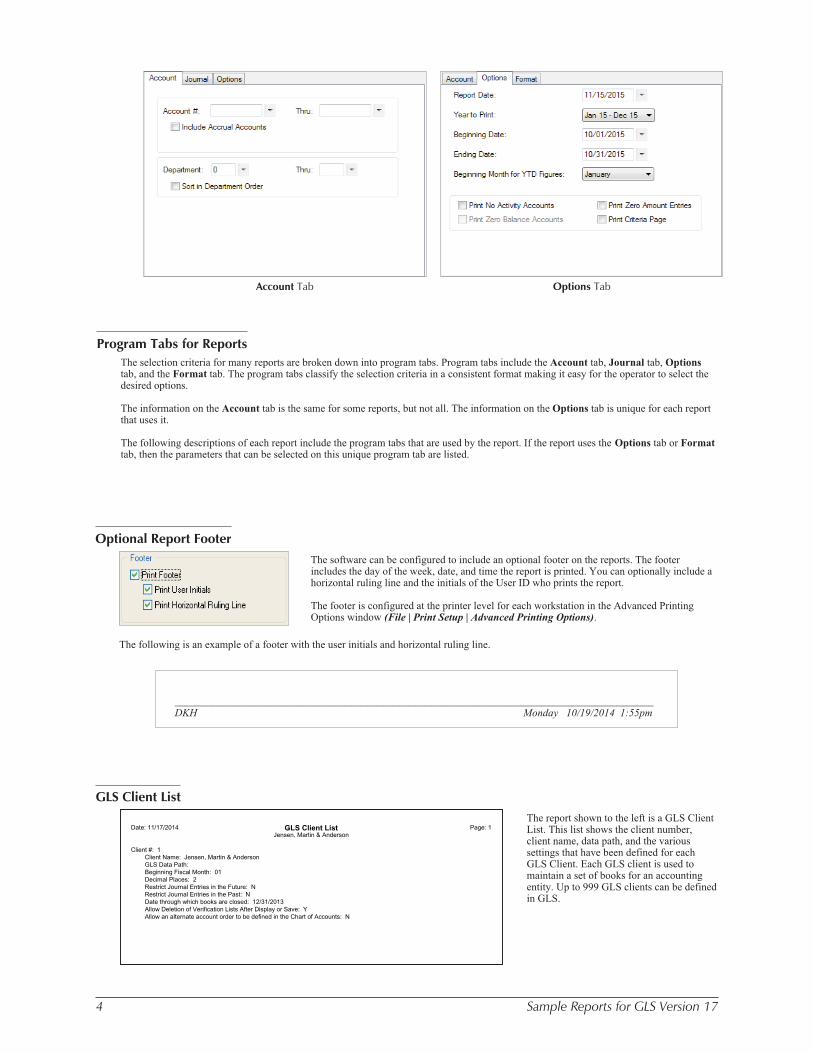
Program Tabs for Reports
The selection criteria for many reports are broken down into program tabs. Program tabs include the Account tab, Journal tab, Optionstab, and the Format tab. The program tabs classify the selection criteria in a consistent format making it easy for the operator to select thedesired options.
The information on the Account tab is the same for some reports, but not all. The information on the Options tab is unique for each reportthat uses it.
The following descriptions of each report include the program tabs that are used by the report. If the report uses the Options tab or Formattab, then the parameters that can be selected on this unique program tab are listed.
Account Tab
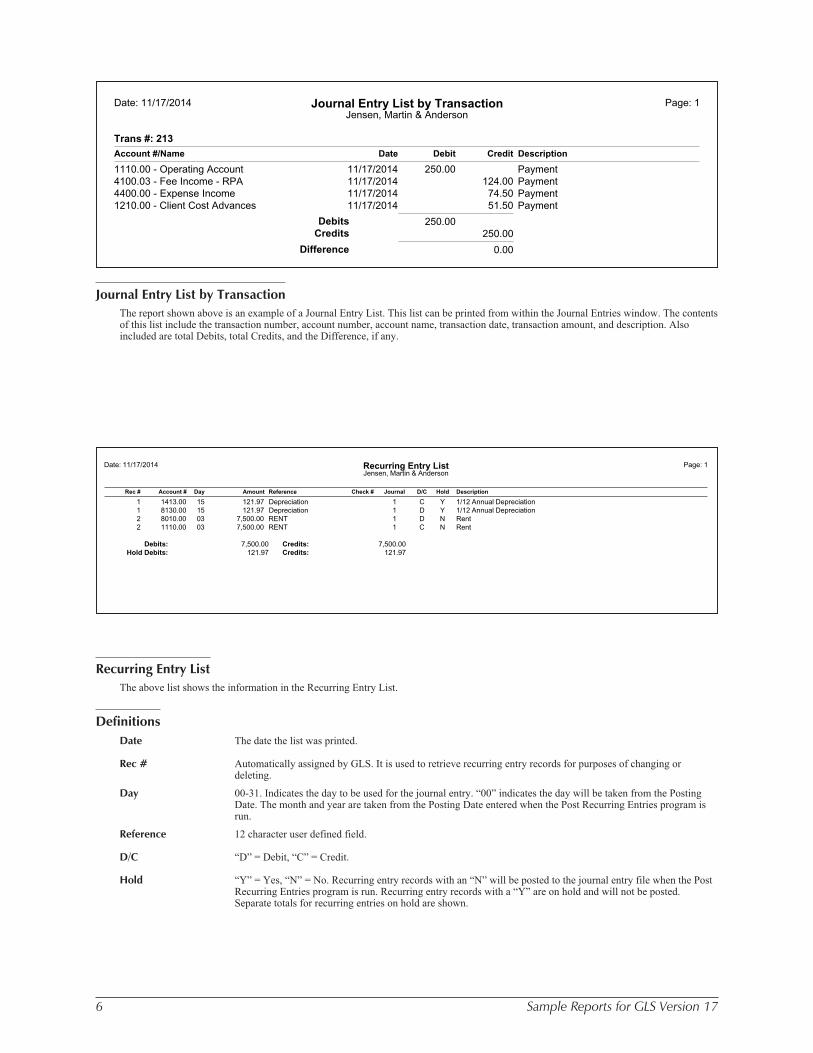
Date: 11/17/2014 GLS Client List Page: 1Jensen, Martin & Anderson
Client #: 1Client Name: Jensen, Martin & AndersonGLS Data Path:Beginning Fiscal Month: 01Decimal Places: 2Restrict Journal Entries in the Future: NRestrict Journal Entries in the Past: NDate through which books are closed: 12/31/2013Allow Deletion of Verification Lists After Display or Save: YAllow an alternate account order to be defined in the Chart of Accounts: N
GLS Client List
The report shown to the left is a GLS ClientList. This list shows the client number,client name, data path, and the varioussettings that have been defined for eachGLS Client. Each GLS client is used tomaintain a set of books for an accountingentity. Up to 999 GLS clients can be definedin GLS.
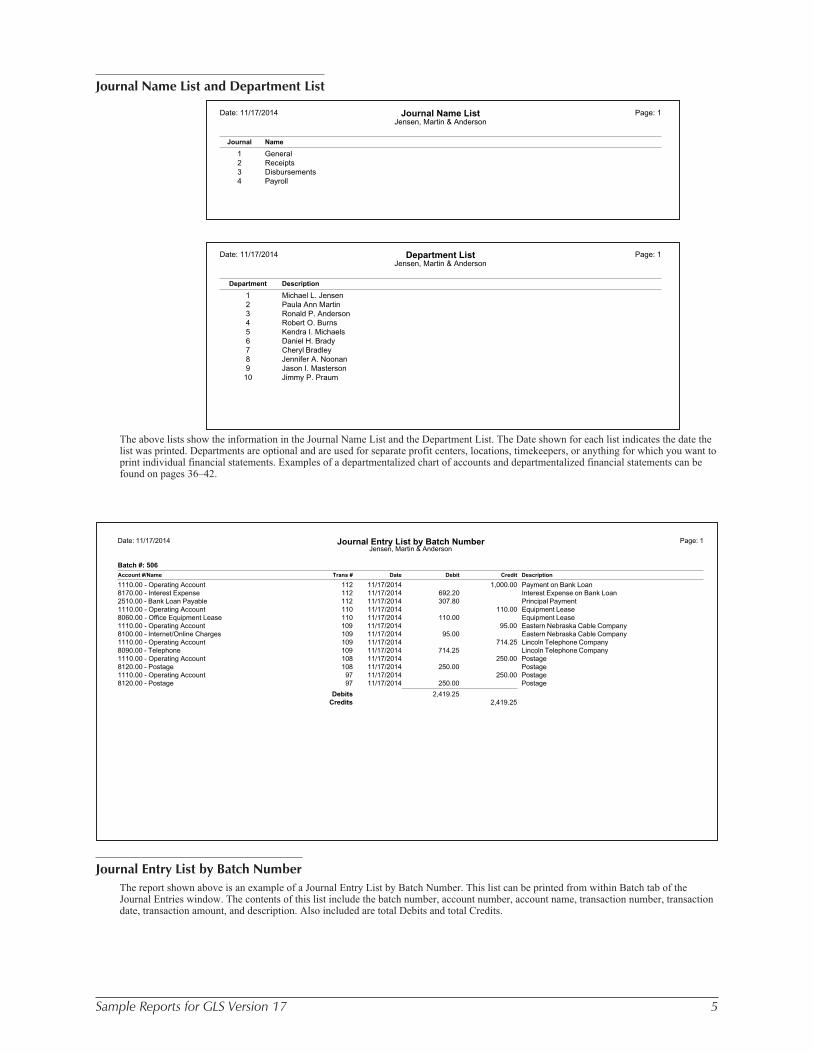
Optional Report Footer
The software can be configured to include an optional footer on the reports. The footerincludes the day of the week, date, and time the report is printed. You can optionally include ahorizontal ruling line and the initials of the User ID who prints the report.
The footer is configured at the printer level for each workstation in the Advanced PrintingOptions window (File | Print Setup | Advanced Printing Options).
The following is an example of a footer with the user initials and horizontal ruling line.
__________________________________________________________________________________________
DKH Monday 10/19/2014 1:55pm
Options Tab
Sample Reports for GLS Version 17 5
Date: 11/17/2014 Journal Name List Page: 1Jensen, Martin & Anderson
Journal Name
1 General2 Receipts3 Disbursements4 Payroll
Date: 11/17/2014 Department List Page: 1Jensen, Martin & Anderson
Department Description
1 Michael L. Jensen2 Paula Ann Martin3 Ronald P. Anderson4 Robert O. Burns5 Kendra I. Michaels6 Daniel H. Brady7 Cheryl Bradley8 Jennifer A. Noonan9 Jason I. Masterson10 Jimmy P. Praum
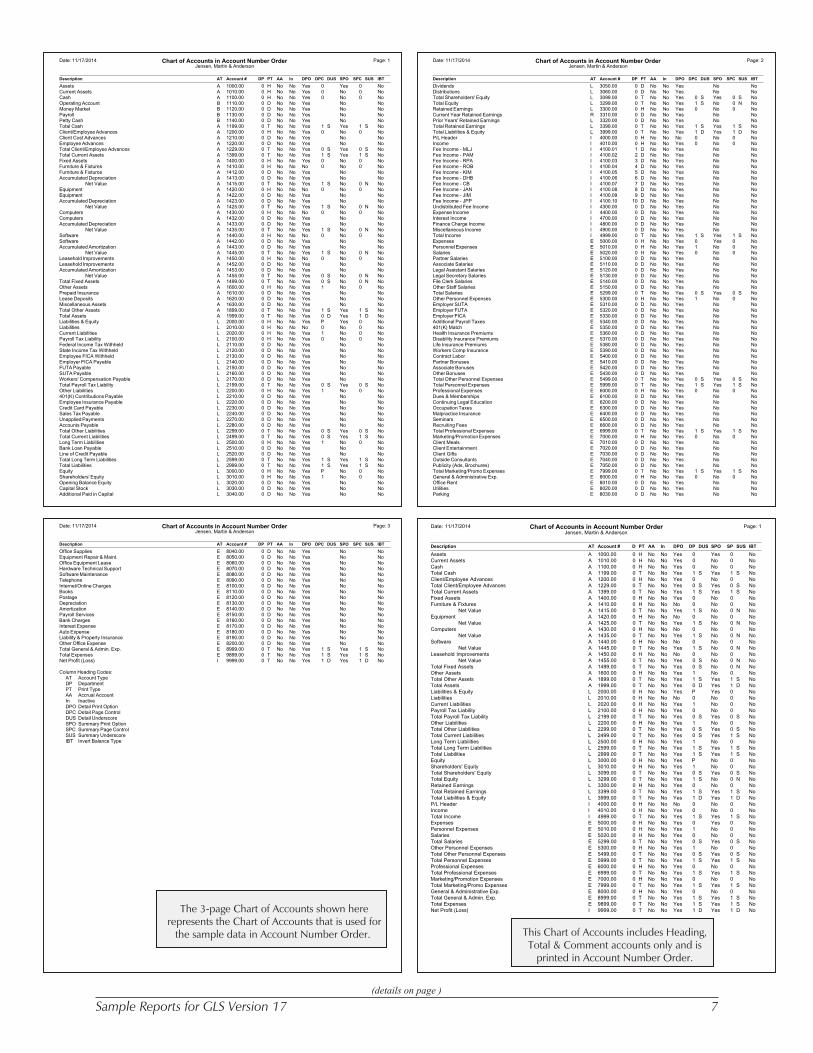
Journal Name List and Department List
The above lists show the information in the Journal Name List and the Department List. The Date shown for each list indicates the date thelist was printed. Departments are optional and are used for separate profit centers, locations, timekeepers, or anything for which you want toprint individual financial statements. Examples of a departmentalized chart of accounts and departmentalized financial statements can befound on pages 36–42.
Journal Entry List by Batch Number
The report shown above is an example of a Journal Entry List by Batch Number. This list can be printed from within Batch tab of theJournal Entries window. The contents of this list include the batch number, account number, account name, transaction number, transactiondate, transaction amount, and description. Also included are total Debits and total Credits.
Date: 11/17/2014 Journal Entry List by Batch Number Page: 1Jensen, Martin & Anderson
Batch #: 506Account #/Name Trans # Date Debit Credit Description
1110.00 - Operating Account 112 11/17/2014 1,000.00 Payment on Bank Loan8170.00 - Interest Expense 112 11/17/2014 692.20 Interest Expense on Bank Loan2510.00 - Bank Loan Payable 112 11/17/2014 307.80 Principal Payment1110.00 - Operating Account 110 11/17/2014 110.00 Equipment Lease8060.00 - Office Equipment Lease 110 11/17/2014 110.00 Equipment Lease1110.00 - Operating Account 109 11/17/2014 95.00 Eastern Nebraska Cable Company8100.00 - Internet/Online Charges 109 11/17/2014 95.00 Eastern Nebraska Cable Company1110.00 - Operating Account 109 11/17/2014 714.25 Lincoln Telephone Company8090.00 - Telephone 109 11/17/2014 714.25 Lincoln Telephone Company1110.00 - Operating Account 108 11/17/2014 250.00 Postage8120.00 - Postage 108 11/17/2014 250.00 Postage1110.00 - Operating Account 97 11/17/2014 250.00 Postage8120.00 - Postage 97 11/17/2014 250.00 Postage
Debits 2,419.25Credits 2,419.25
6 Sample Reports for GLS Version 17
Recurring Entry List
The above list shows the information in the Recurring Entry List.
Definitions
Date The date the list was printed.
Rec # Automatically assigned by GLS. It is used to retrieve recurring entry records for purposes of changing ordeleting.
Day 00-31. Indicates the day to be used for the journal entry. “00” indicates the day will be taken from the PostingDate. The month and year are taken from the Posting Date entered when the Post Recurring Entries program isrun.
Reference 12 character user defined field.
D/C “D” = Debit, “C” = Credit.
Hold “Y” = Yes, “N” = No. Recurring entry records with an “N” will be posted to the journal entry file when the PostRecurring Entries program is run. Recurring entry records with a “Y” are on hold and will not be posted.Separate totals for recurring entries on hold are shown.
Date: 11/17/2014 Recurring Entry List Page: 1Jensen, Martin & Anderson
Rec # Account # Day Amount Reference Check # Journal D/C Hold Description
1 1413.00 15 121.97 Depreciation 1 C Y 1/12 Annual Depreciation1 8130.00 15 121.97 Depreciation 1 D Y 1/12 Annual Depreciation2 8010.00 03 7,500.00 RENT 1 D N Rent2 1110.00 03 7,500.00 RENT 1 C N Rent
Debits: 7,500.00 Credits: 7,500.00Hold Debits: 121.97 Credits: 121.97
Journal Entry List by Transaction
The report shown above is an example of a Journal Entry List. This list can be printed from within the Journal Entries window. The contentsof this list include the transaction number, account number, account name, transaction date, transaction amount, and description. Alsoincluded are total Debits, total Credits, and the Difference, if any.
Date: 11/17/2014 Journal Entry List by Transaction Page: 1Jensen, Martin & Anderson
Trans #: 213Account #/Name Date Debit Credit Description
1110.00 - Operating Account 11/17/2014 250.00 Payment4100.03 - Fee Income - RPA 11/17/2014 124.00 Payment4400.00 - Expense Income 11/17/2014 74.50 Payment1210.00 - Client Cost Advances 11/17/2014 51.50 Payment
Debits 250.00Credits 250.00
Difference 0.00
Sample Reports for GLS Version 17 7
Date: 11/17/2014 Chart of Accounts in Account Number Order Page: 2Jensen, Martin & Anderson
Description AT Account # DP PT AA In DPO DPC DUS SPO SPC SUS IBT
Dividends L 3050.00 0 D No No Yes No NoDistributions L 3060.00 0 D No No Yes No NoTotal Shareholders' Equity L 3099.00 0 T No No Yes 0 S Yes 0 S NoTotal Equity L 3299.00 0 T No No Yes 1 S No 0 N NoRetained Earnings L 3300.00 0 H No No Yes 0 No 0 NoCurrent Year Retained Earnings R 3310.00 0 D No No Yes No NoPrior Years' Retained Earnings L 3320.00 0 D No No Yes No NoTotal Retained Earnings L 3399.00 0 T No No Yes 1 S Yes 1 S NoTotal Liabilities & Equity L 3999.00 0 T No No Yes 1 D Yes 1 D NoP/L Header I 4000.00 0 H No No No 0 No 0 NoIncome I 4010.00 0 H No No Yes 0 No 0 NoFee Income - MLJ I 4100.01 1 D No No Yes No NoFee Income - PAM I 4100.02 2 D No No Yes No NoFee Income - RPA I 4100.03 3 D No No Yes No NoFee Income - ROB I 4100.04 4 D No No Yes No NoFee Income - KIM I 4100.05 5 D No No Yes No NoFee Income - DHB I 4100.06 6 D No No Yes No NoFee Income - CB I 4100.07 7 D No No Yes No NoFee Income - JAN I 4100.08 8 D No No Yes No NoFee Income - JIM I 4100.09 9 D No No Yes No NoFee Income - JPP I 4100.10 10 D No No Yes No NoUndistributed Fee Income I 4300.00 0 D No No Yes No NoExpense Income I 4400.00 0 D No No Yes No NoInterest Income I 4700.00 0 D No No Yes No NoFinance Charge Income I 4800.00 0 D No No Yes No NoMiscellaneous Income I 4900.00 0 D No No Yes No NoTotal Income I 4999.00 0 T No No Yes 1 S Yes 1 S NoExpenses E 5000.00 0 H No No Yes 0 Yes 0 NoPersonnel Expenses E 5010.00 0 H No No Yes 1 No 0 NoSalaries E 5020.00 0 H No No Yes 0 No 0 NoPartner Salaries E 5100.00 0 D No No Yes No NoAssociate Salaries E 5110.00 0 D No No Yes No NoLegal Assistant Salaries E 5120.00 0 D No No Yes No NoLegal Secretary Salaries E 5130.00 0 D No No Yes No NoFile Clerk Salaries E 5140.00 0 D No No Yes No NoOther Staff Salaries E 5150.00 0 D No No Yes No NoTotal Salaries E 5299.00 0 T No No Yes 0 S Yes 0 S NoOther Personnel Expenses E 5300.00 0 H No No Yes 1 No 0 NoEmployer SUTA E 5310.00 0 D No No Yes No NoEmployer FUTA E 5320.00 0 D No No Yes No NoEmployer FICA E 5330.00 0 D No No Yes No NoAdditional Payroll Taxes E 5340.00 0 D No No Yes No No401(K) Match E 5350.00 0 D No No Yes No NoHealth Insurance Premiums E 5360.00 0 D No No Yes No NoDisability Insurance Premiums E 5370.00 0 D No No Yes No NoLife Insurance Premiums E 5380.00 0 D No No Yes No NoWorkers Comp Insurance E 5390.00 0 D No No Yes No NoContract Labor E 5400.00 0 D No No Yes No NoPartner Bonuses E 5410.00 0 D No No Yes No NoAssociate Bonuses E 5420.00 0 D No No Yes No NoOther Bonuses E 5430.00 0 D No No Yes No NoTotal Other Personnel Expenses E 5499.00 0 T No No Yes 0 S Yes 0 S NoTotal Personnel Expenses E 5999.00 0 T No No Yes 1 S Yes 1 S NoProfessional Expenses E 6000.00 0 H No No Yes 0 No 0 NoDues & Memberships E 6100.00 0 D No No Yes No NoContinuing Legal Education E 6200.00 0 D No No Yes No NoOccupation Taxes E 6300.00 0 D No No Yes No NoMalpractice Insurance E 6400.00 0 D No No Yes No NoSeminars E 6500.00 0 D No No Yes No NoRecruiting Fees E 6600.00 0 D No No Yes No NoTotal Professional Expenses E 6999.00 0 T No No Yes 1 S Yes 1 S NoMarketing/Promotion Expenses E 7000.00 0 H No No Yes 0 No 0 NoClient Meals E 7010.00 0 D No No Yes No NoClient Entertainment E 7020.00 0 D No No Yes No NoClient Gifts E 7030.00 0 D No No Yes No NoOutside Consultants E 7040.00 0 D No No Yes No NoPublicity (Ads, Brochures) E 7050.00 0 D No No Yes No NoTotal Marketing/Promo Expenses E 7999.00 0 T No No Yes 1 S Yes 1 S NoGeneral & Administrative Exp. E 8000.00 0 H No No Yes 0 No 0 NoOffice Rent E 8010.00 0 D No No Yes No NoUtilities E 8020.00 0 D No No Yes No NoParking E 8030.00 0 D No No Yes No No
Date: 11/17/2014 Chart of Accounts in Account Number Order Page: 1Jensen, Martin & Anderson
Description AT Account # DP PT AA In DPO DPC DUS SPO SPC SUS IBT
Assets A 1000.00 0 H No No Yes 0 Yes 0 NoCurrent Assets A 1010.00 0 H No No Yes 0 No 0 NoCash A 1100.00 0 H No No Yes 0 No 0 NoOperating Account B 1110.00 0 D No No Yes No NoMoney Market B 1120.00 0 D No No Yes No NoPayroll B 1130.00 0 D No No Yes No NoPetty Cash B 1140.00 0 D No No Yes No NoTotal Cash A 1199.00 0 T No No Yes 1 S Yes 1 S NoClient/Employee Advances A 1200.00 0 H No No Yes 0 No 0 NoClient Cost Advances A 1210.00 0 D No No Yes No NoEmployee Advances A 1220.00 0 D No No Yes No NoTotal Client/Employee Advances A 1229.00 0 T No No Yes 0 S Yes 0 S NoTotal Current Assets A 1399.00 0 T No No Yes 1 S Yes 1 S NoFixed Assets A 1400.00 0 H No No Yes 0 No 0 NoFurniture & Fixtures A 1410.00 0 H No No No 0 No 0 NoFurniture & Fixtures A 1412.00 0 D No No Yes No NoAccumulated Depreciation A 1413.00 0 D No No Yes No No Net Value A 1415.00 0 T No No Yes 1 S No 0 N NoEquipment A 1420.00 0 H No No No 0 No 0 NoEquipment A 1422.00 0 D No No Yes No NoAccumulated Depreciation A 1423.00 0 D No No Yes No No Net Value A 1425.00 0 T No No Yes 1 S No 0 N NoComputers A 1430.00 0 H No No No 0 No 0 NoComputers A 1432.00 0 D No No Yes No NoAccumulated Depreciation A 1433.00 0 D No No Yes No No Net Value A 1435.00 0 T No No Yes 1 S No 0 N NoSoftware A 1440.00 0 H No No No 0 No 0 NoSoftware A 1442.00 0 D No No Yes No NoAccumulated Amortization A 1443.00 0 D No No Yes No No Net Value A 1445.00 0 T No No Yes 1 S No 0 N NoLeasehold Improvements A 1450.00 0 H No No No 0 No 0 NoLeasehold Improvements A 1452.00 0 D No No Yes No NoAccumulated Amortization A 1453.00 0 D No No Yes No No Net Value A 1455.00 0 T No No Yes 0 S No 0 N NoTotal Fixed Assets A 1499.00 0 T No No Yes 0 S No 0 N NoOther Assets A 1600.00 0 H No No Yes 1 No 0 NoPrepaid Insurance A 1610.00 0 D No No Yes No NoLease Deposits A 1620.00 0 D No No Yes No NoMiscellaneous Assets A 1630.00 0 D No No Yes No NoTotal Other Assets A 1899.00 0 T No No Yes 1 S Yes 1 S NoTotal Assets A 1999.00 0 T No No Yes 0 D Yes 1 D NoLiabilities & Equity L 2000.00 0 H No No Yes P Yes 0 NoLiabilities L 2010.00 0 H No No No 0 No 0 NoCurrent Liabilities L 2020.00 0 H No No Yes 1 No 0 NoPayroll Tax Liability L 2100.00 0 H No No Yes 0 No 0 NoFederal Income Tax Withheld L 2110.00 0 D No No Yes No NoState Income Tax Withheld L 2120.00 0 D No No Yes No NoEmployee FICA Withheld L 2130.00 0 D No No Yes No NoEmployer FICA Payable L 2140.00 0 D No No Yes No NoFUTA Payable L 2150.00 0 D No No Yes No NoSUTA Payable L 2160.00 0 D No No Yes No NoWorkers' Compensation Payable L 2170.00 0 D No No Yes No NoTotal Payroll Tax Liability L 2199.00 0 T No No Yes 0 S Yes 0 S NoOther Liabilities L 2200.00 0 H No No Yes 1 No 0 No401(K) Contributions Payable L 2210.00 0 D No No Yes No NoEmployee Insurance Payable L 2220.00 0 D No No Yes No NoCredit Card Payable L 2230.00 0 D No No Yes No NoSales Tax Payable L 2240.00 0 D No No Yes No NoUnapplied Payments L 2270.00 0 D No No Yes No NoAccounts Payable L 2280.00 0 D No No Yes No NoTotal Other Liabilities L 2299.00 0 T No No Yes 0 S Yes 0 S NoTotal Current Liabilities L 2499.00 0 T No No Yes 0 S Yes 1 S NoLong Term Liabilities L 2500.00 0 H No No Yes 1 No 0 NoBank Loan Payable L 2510.00 0 D No No Yes No NoLine of Credit Payable L 2520.00 0 D No No Yes No NoTotal Long Term Liabilities L 2599.00 0 T No No Yes 1 S Yes 1 S NoTotal Liabilities L 2999.00 0 T No No Yes 1 S Yes 1 S NoEquity L 3000.00 0 H No No Yes P No 0 NoShareholders' Equity L 3010.00 0 H No No Yes 1 No 0 NoOpening Balance Equity L 3020.00 0 D No No Yes No NoCapital Stock L 3030.00 0 D No No Yes No NoAdditional Paid in Capital L 3040.00 0 D No No Yes No No
(details on page )
Date: 11/17/2014 Chart of Accounts in Account Number Order Page: 3Jensen, Martin & Anderson
Description AT Account # DP PT AA In DPO DPC DUS SPO SPC SUS IBT
Office Supplies E 8040.00 0 D No No Yes No NoEquipment Repair & Maint. E 8050.00 0 D No No Yes No NoOffice Equipment Lease E 8060.00 0 D No No Yes No NoHardware Technical Support E 8070.00 0 D No No Yes No NoSoftware Maintenance E 8080.00 0 D No No Yes No NoTelephone E 8090.00 0 D No No Yes No NoInternet/Online Charges E 8100.00 0 D No No Yes No NoBooks E 8110.00 0 D No No Yes No NoPostage E 8120.00 0 D No No Yes No NoDepreciation E 8130.00 0 D No No Yes No NoAmortization E 8140.00 0 D No No Yes No NoPayroll Services E 8150.00 0 D No No Yes No NoBank Charges E 8160.00 0 D No No Yes No NoInterest Expense E 8170.00 0 D No No Yes No NoAuto Expense E 8180.00 0 D No No Yes No NoLiability & Property Insurance E 8190.00 0 D No No Yes No NoOther Office Expense E 8200.00 0 D No No Yes No NoTotal General & Admin. Exp. E 8999.00 0 T No No Yes 1 S Yes 1 S NoTotal Expenses E 9899.00 0 T No No Yes 1 S Yes 1 S NoNet Profit (Loss) I 9999.00 0 T No No Yes 1 D Yes 1 D No
Column Heading Codes:AT Account TypeDP DepartmentPT Print TypeAA Accrual AccountIn InactiveDPO Detail Print OptionDPC Detail Page ControlDUS Detail UnderscoreSPO Summary Print OptionSPC Summary Page ControlSUS Summary UnderscoreIBT Invert Balance Type
Date: 11/17/2014 Chart of Accounts in Account Number Order Page: 1Jensen, Martin & Anderson
Description AT Account # D PT AA In DPO DP DUS SPO SP SUS IBT
Assets A 1000.00 0 H No No Yes 0 Yes 0 NoCurrent Assets A 1010.00 0 H No No Yes 0 No 0 NoCash A 1100.00 0 H No No Yes 0 No 0 NoTotal Cash A 1199.00 0 T No No Yes 1 S Yes 1 S NoClient/Employee Advances A 1200.00 0 H No No Yes 0 No 0 NoTotal Client/Employee Advances A 1229.00 0 T No No Yes 0 S Yes 0 S NoTotal Current Assets A 1399.00 0 T No No Yes 1 S Yes 1 S NoFixed Assets A 1400.00 0 H No No Yes 0 No 0 NoFurniture & Fixtures A 1410.00 0 H No No No 0 No 0 No Net Value A 1415.00 0 T No No Yes 1 S No 0 N No
Equipment A 1420.00 0 H No No No 0 No 0 No Net Value A 1425.00 0 T No No Yes 1 S No 0 N No
Computers A 1430.00 0 H No No No 0 No 0 No Net Value A 1435.00 0 T No No Yes 1 S No 0 N No
Software A 1440.00 0 H No No No 0 No 0 No Net Value A 1445.00 0 T No No Yes 1 S No 0 N No
Leasehold Improvements A 1450.00 0 H No No No 0 No 0 No Net Value A 1455.00 0 T No No Yes 0 S No 0 N No
Total Fixed Assets A 1499.00 0 T No No Yes 0 S No 0 N NoOther Assets A 1600.00 0 H No No Yes 1 No 0 NoTotal Other Assets A 1899.00 0 T No No Yes 1 S Yes 1 S NoTotal Assets A 1999.00 0 T No No Yes 0 D Yes 1 D NoLiabilities & Equity L 2000.00 0 H No No Yes P Yes 0 NoLiabilities L 2010.00 0 H No No No 0 No 0 NoCurrent Liabilities L 2020.00 0 H No No Yes 1 No 0 NoPayroll Tax Liability L 2100.00 0 H No No Yes 0 No 0 NoTotal Payroll Tax Liability L 2199.00 0 T No No Yes 0 S Yes 0 S NoOther Liabilities L 2200.00 0 H No No Yes 1 No 0 NoTotal Other Liabilities L 2299.00 0 T No No Yes 0 S Yes 0 S NoTotal Current Liabilities L 2499.00 0 T No No Yes 0 S Yes 1 S NoLong Term Liabilities L 2500.00 0 H No No Yes 1 No 0 NoTotal Long Term Liabilities L 2599.00 0 T No No Yes 1 S Yes 1 S NoTotal Liabilities L 2999.00 0 T No No Yes 1 S Yes 1 S NoEquity L 3000.00 0 H No No Yes P No 0 NoShareholders' Equity L 3010.00 0 H No No Yes 1 No 0 NoTotal Shareholders' Equity L 3099.00 0 T No No Yes 0 S Yes 0 S NoTotal Equity L 3299.00 0 T No No Yes 1 S No 0 N NoRetained Earnings L 3300.00 0 H No No Yes 0 No 0 NoTotal Retained Earnings L 3399.00 0 T No No Yes 1 S Yes 1 S NoTotal Liabilities & Equity L 3999.00 0 T No No Yes 1 D Yes 1 D NoP/L Header I 4000.00 0 H No No No 0 No 0 NoIncome I 4010.00 0 H No No Yes 0 No 0 NoTotal Income I 4999.00 0 T No No Yes 1 S Yes 1 S NoExpenses E 5000.00 0 H No No Yes 0 Yes 0 NoPersonnel Expenses E 5010.00 0 H No No Yes 1 No 0 NoSalaries E 5020.00 0 H No No Yes 0 No 0 NoTotal Salaries E 5299.00 0 T No No Yes 0 S Yes 0 S NoOther Personnel Expenses E 5300.00 0 H No No Yes 1 No 0 NoTotal Other Personnel Expenses E 5499.00 0 T No No Yes 0 S Yes 0 S NoTotal Personnel Expenses E 5999.00 0 T No No Yes 1 S Yes 1 S NoProfessional Expenses E 6000.00 0 H No No Yes 0 No 0 NoTotal Professional Expenses E 6999.00 0 T No No Yes 1 S Yes 1 S NoMarketing/Promotion Expenses E 7000.00 0 H No No Yes 0 No 0 NoTotal Marketing/Promo Expenses E 7999.00 0 T No No Yes 1 S Yes 1 S NoGeneral & Administrative Exp. E 8000.00 0 H No No Yes 0 No 0 NoTotal General & Admin. Exp. E 8999.00 0 T No No Yes 1 S Yes 1 S NoTotal Expenses E 9899.00 0 T No No Yes 1 S Yes 1 S NoNet Profit (Loss) I 9999.00 0 T No No Yes 1 D Yes 1 D No
This Chart of Accounts includes Heading,Total & Comment accounts only and is
printed in Account Number Order.
The 3-page Chart of Accounts shown hererepresents the Chart of Accounts that is used for
the sample data in Account Number Order.
8 Sample Reports for GLS Version 17
Date: 11/17/2014 Chart of Accounts Page: 2Jensen, Martin & Anderson
Description AT Account # DP PT AA In DPO DPC DUS SPO SPC SUS IBT
Dividends L 3050.00 0 D No No Yes No NoDistributions L 3060.00 0 D No No Yes No No
Total Shareholders' Equity L 3099.00 0 T No No Yes 0 S Yes 0 S NoTotal Equity L 3299.00 0 T No No Yes 1 S No 0 N NoRetained Earnings L 3300.00 0 H No No Yes 0 No 0 No
Current Year Retained Earnings R 3310.00 0 D No No Yes No NoPrior Years' Retained Earnings L 3320.00 0 D No No Yes No No
Total Retained Earnings L 3399.00 0 T No No Yes 1 S Yes 1 S NoTotal Liabilities & Equity L 3999.00 0 T No No Yes 1 D Yes 1 D NoP/L Header I 4000.00 0 H No No No 0 No 0 No
Income I 4010.00 0 H No No Yes 0 No 0 NoFee Income - MLJ I 4100.01 1 D No No Yes No NoFee Income - PAM I 4100.02 2 D No No Yes No NoFee Income - RPA I 4100.03 3 D No No Yes No NoFee Income - ROB I 4100.04 4 D No No Yes No NoFee Income - KIM I 4100.05 5 D No No Yes No NoFee Income - DHB I 4100.06 6 D No No Yes No NoFee Income - CB I 4100.07 7 D No No Yes No NoFee Income - JAN I 4100.08 8 D No No Yes No NoFee Income - JIM I 4100.09 9 D No No Yes No NoFee Income - JPP I 4100.10 10 D No No Yes No NoUndistributed Fee Income I 4300.00 0 D No No Yes No NoExpense Income I 4400.00 0 D No No Yes No NoInterest Income I 4700.00 0 D No No Yes No NoFinance Charge Income I 4800.00 0 D No No Yes No NoMiscellaneous Income I 4900.00 0 D No No Yes No No
Total Income I 4999.00 0 T No No Yes 1 S Yes 1 S NoExpenses E 5000.00 0 H No No Yes 0 Yes 0 No
Personnel Expenses E 5010.00 0 H No No Yes 1 No 0 NoSalaries E 5020.00 0 H No No Yes 0 No 0 No
Partner Salaries E 5100.00 0 D No No Yes No NoAssociate Salaries E 5110.00 0 D No No Yes No NoLegal Assistant Salaries E 5120.00 0 D No No Yes No NoLegal Secretary Salaries E 5130.00 0 D No No Yes No NoFile Clerk Salaries E 5140.00 0 D No No Yes No NoOther Staff Salaries E 5150.00 0 D No No Yes No No
Total Salaries E 5299.00 0 T No No Yes 0 S Yes 0 S NoOther Personnel Expenses E 5300.00 0 H No No Yes 1 No 0 No
Employer SUTA E 5310.00 0 D No No Yes No NoEmployer FUTA E 5320.00 0 D No No Yes No NoEmployer FICA E 5330.00 0 D No No Yes No NoAdditional Payroll Taxes E 5340.00 0 D No No Yes No No401(K) Match E 5350.00 0 D No No Yes No NoHealth Insurance Premiums E 5360.00 0 D No No Yes No NoDisability Insurance Premiums E 5370.00 0 D No No Yes No NoLife Insurance Premiums E 5380.00 0 D No No Yes No NoWorkers Comp Insurance E 5390.00 0 D No No Yes No NoContract Labor E 5400.00 0 D No No Yes No NoPartner Bonuses E 5410.00 0 D No No Yes No NoAssociate Bonuses E 5420.00 0 D No No Yes No NoOther Bonuses E 5430.00 0 D No No Yes No No
Total Other Personnel Expenses E 5499.00 0 T No No Yes 0 S Yes 0 S NoTotal Personnel Expenses E 5999.00 0 T No No Yes 1 S Yes 1 S NoProfessional Expenses E 6000.00 0 H No No Yes 0 No 0 No
Dues & Memberships E 6100.00 0 D No No Yes No NoContinuing Legal Education E 6200.00 0 D No No Yes No NoOccupation Taxes E 6300.00 0 D No No Yes No NoMalpractice Insurance E 6400.00 0 D No No Yes No NoSeminars E 6500.00 0 D No No Yes No NoRecruiting Fees E 6600.00 0 D No No Yes No No
Total Professional Expenses E 6999.00 0 T No No Yes 1 S Yes 1 S NoMarketing/Promotion Expenses E 7000.00 0 H No No Yes 0 No 0 No
Client Meals E 7010.00 0 D No No Yes No NoClient Entertainment E 7020.00 0 D No No Yes No NoClient Gifts E 7030.00 0 D No No Yes No NoOutside Consultants E 7040.00 0 D No No Yes No NoPublicity (Ads, Brochures) E 7050.00 0 D No No Yes No No
Total Marketing/Promo Expenses E 7999.00 0 T No No Yes 1 S Yes 1 S NoGeneral & Administrative Exp. E 8000.00 0 H No No Yes 0 No 0 No
Office Rent E 8010.00 0 D No No Yes No NoUtilities E 8020.00 0 D No No Yes No NoParking E 8030.00 0 D No No Yes No No
Date: 11/17/2014 Chart of Accounts Page: 1Jensen, Martin & Anderson
Description AT Account # DP PT AA In DPO DPC DUS SPO SPC SUS IBT
Assets A 1000.00 0 H No No Yes 0 Yes 0 NoCurrent Assets A 1010.00 0 H No No Yes 0 No 0 No
Cash A 1100.00 0 H No No Yes 0 No 0 NoOperating Account B 1110.00 0 D No No Yes No NoMoney Market B 1120.00 0 D No No Yes No NoPayroll B 1130.00 0 D No No Yes No NoPetty Cash B 1140.00 0 D No No Yes No No
Total Cash A 1199.00 0 T No No Yes 1 S Yes 1 S NoClient/Employee Advances A 1200.00 0 H No No Yes 0 No 0 No
Client Cost Advances A 1210.00 0 D No No Yes No NoEmployee Advances A 1220.00 0 D No No Yes No No
Total Client/Employee Advances A 1229.00 0 T No No Yes 0 S Yes 0 S NoTotal Current Assets A 1399.00 0 T No No Yes 1 S Yes 1 S NoFixed Assets A 1400.00 0 H No No Yes 0 No 0 No
Furniture & Fixtures A 1410.00 0 H No No No 0 No 0 NoFurniture & Fixtures A 1412.00 0 D No No Yes No NoAccumulated Depreciation A 1413.00 0 D No No Yes No No
Net Value A 1415.00 0 T No No Yes 1 S No 0 N NoEquipment A 1420.00 0 H No No No 0 No 0 No
Equipment A 1422.00 0 D No No Yes No NoAccumulated Depreciation A 1423.00 0 D No No Yes No No
Net Value A 1425.00 0 T No No Yes 1 S No 0 N NoComputers A 1430.00 0 H No No No 0 No 0 No
Computers A 1432.00 0 D No No Yes No NoAccumulated Depreciation A 1433.00 0 D No No Yes No No
Net Value A 1435.00 0 T No No Yes 1 S No 0 N NoSoftware A 1440.00 0 H No No No 0 No 0 No
Software A 1442.00 0 D No No Yes No NoAccumulated Amortization A 1443.00 0 D No No Yes No No
Net Value A 1445.00 0 T No No Yes 1 S No 0 N NoLeasehold Improvements A 1450.00 0 H No No No 0 No 0 No
Leasehold Improvements A 1452.00 0 D No No Yes No NoAccumulated Amortization A 1453.00 0 D No No Yes No No
Net Value A 1455.00 0 T No No Yes 0 S No 0 N NoTotal Fixed Assets A 1499.00 0 T No No Yes 0 S No 0 N NoOther Assets A 1600.00 0 H No No Yes 1 No 0 No
Prepaid Insurance A 1610.00 0 D No No Yes No NoLease Deposits A 1620.00 0 D No No Yes No NoMiscellaneous Assets A 1630.00 0 D No No Yes No No
Total Other Assets A 1899.00 0 T No No Yes 1 S Yes 1 S NoTotal Assets A 1999.00 0 T No No Yes 0 D Yes 1 D NoLiabilities & Equity L 2000.00 0 H No No Yes P Yes 0 No
Liabilities L 2010.00 0 H No No No 0 No 0 NoCurrent Liabilities L 2020.00 0 H No No Yes 1 No 0 No
Payroll Tax Liability L 2100.00 0 H No No Yes 0 No 0 NoFederal Income Tax Withheld L 2110.00 0 D No No Yes No NoState Income Tax Withheld L 2120.00 0 D No No Yes No NoEmployee FICA Withheld L 2130.00 0 D No No Yes No NoEmployer FICA Payable L 2140.00 0 D No No Yes No NoFUTA Payable L 2150.00 0 D No No Yes No NoSUTA Payable L 2160.00 0 D No No Yes No NoWorkers' Compensation Payable L 2170.00 0 D No No Yes No No
Total Payroll Tax Liability L 2199.00 0 T No No Yes 0 S Yes 0 S NoOther Liabilities L 2200.00 0 H No No Yes 1 No 0 No
401(K) Contributions Payable L 2210.00 0 D No No Yes No NoEmployee Insurance Payable L 2220.00 0 D No No Yes No NoCredit Card Payable L 2230.00 0 D No No Yes No NoSales Tax Payable L 2240.00 0 D No No Yes No NoUnapplied Payments L 2270.00 0 D No No Yes No NoAccounts Payable L 2280.00 0 D No No Yes No No
Total Other Liabilities L 2299.00 0 T No No Yes 0 S Yes 0 S NoTotal Current Liabilities L 2499.00 0 T No No Yes 0 S Yes 1 S NoLong Term Liabilities L 2500.00 0 H No No Yes 1 No 0 No
Bank Loan Payable L 2510.00 0 D No No Yes No NoLine of Credit Payable L 2520.00 0 D No No Yes No No
Total Long Term Liabilities L 2599.00 0 T No No Yes 1 S Yes 1 S NoTotal Liabilities L 2999.00 0 T No No Yes 1 S Yes 1 S NoEquity L 3000.00 0 H No No Yes P No 0 No
Shareholders' Equity L 3010.00 0 H No No Yes 1 No 0 NoOpening Balance Equity L 3020.00 0 D No No Yes No NoCapital Stock L 3030.00 0 D No No Yes No NoAdditional Paid in Capital L 3040.00 0 D No No Yes No No
Date: 11/17/2014 Chart of Accounts Page: 3Jensen, Martin & Anderson
Description AT Account # DP PT AA In DPO DPC DUS SPO SPC SUS IBT
Office Supplies E 8040.00 0 D No No Yes No NoEquipment Repair & Maint. E 8050.00 0 D No No Yes No NoOffice Equipment Lease E 8060.00 0 D No No Yes No NoHardware Technical Support E 8070.00 0 D No No Yes No NoSoftware Maintenance E 8080.00 0 D No No Yes No NoTelephone E 8090.00 0 D No No Yes No NoInternet/Online Charges E 8100.00 0 D No No Yes No NoBooks E 8110.00 0 D No No Yes No NoPostage E 8120.00 0 D No No Yes No NoDepreciation E 8130.00 0 D No No Yes No NoAmortization E 8140.00 0 D No No Yes No NoPayroll Services E 8150.00 0 D No No Yes No NoBank Charges E 8160.00 0 D No No Yes No NoInterest Expense E 8170.00 0 D No No Yes No NoAuto Expense E 8180.00 0 D No No Yes No NoLiability & Property Insurance E 8190.00 0 D No No Yes No NoOther Office Expense E 8200.00 0 D No No Yes No No
Total General & Admin. Exp. E 8999.00 0 T No No Yes 1 S Yes 1 S NoTotal Expenses E 9899.00 0 T No No Yes 1 S Yes 1 S No
Net Profit (Loss) I 9999.00 0 T No No Yes 1 D Yes 1 D No
Column Heading Codes:AT Account TypeDP DepartmentPT Print TypeAA Accrual AccountIn InactiveDPO Detail Print OptionDPC Detail Page ControlDUS Detail UnderscoreSPO Summary Print OptionSPC Summary Page ControlSUS Summary UnderscoreIBT Invert Balance Type
Date: 11/17/2014 Chart of Accounts Page: 1Jensen, Martin & Anderson
Description AT Account # DP PT AA In DPO DPC DUS SPO SPC SUS IBT
Assets A 1000.00 0 H No No Yes 0 Yes 0 NoCurrent Assets A 1010.00 0 H No No Yes 0 No 0 No
Cash A 1100.00 0 H No No Yes 0 No 0 NoTotal Cash A 1199.00 0 T No No Yes 1 S Yes 1 S NoClient/Employee Advances A 1200.00 0 H No No Yes 0 No 0 NoTotal Client/Employee Advances A 1229.00 0 T No No Yes 0 S Yes 0 S No
Total Current Assets A 1399.00 0 T No No Yes 1 S Yes 1 S NoFixed Assets A 1400.00 0 H No No Yes 0 No 0 No
Furniture & Fixtures A 1410.00 0 H No No No 0 No 0 No Net Value A 1415.00 0 T No No Yes 1 S No 0 N NoEquipment A 1420.00 0 H No No No 0 No 0 No Net Value A 1425.00 0 T No No Yes 1 S No 0 N NoComputers A 1430.00 0 H No No No 0 No 0 No Net Value A 1435.00 0 T No No Yes 1 S No 0 N NoSoftware A 1440.00 0 H No No No 0 No 0 No Net Value A 1445.00 0 T No No Yes 1 S No 0 N NoLeasehold Improvements A 1450.00 0 H No No No 0 No 0 No Net Value A 1455.00 0 T No No Yes 0 S No 0 N No
Total Fixed Assets A 1499.00 0 T No No Yes 0 S No 0 N NoOther Assets A 1600.00 0 H No No Yes 1 No 0 NoTotal Other Assets A 1899.00 0 T No No Yes 1 S Yes 1 S No
Total Assets A 1999.00 0 T No No Yes 0 D Yes 1 D NoLiabilities & Equity L 2000.00 0 H No No Yes P Yes 0 No
Liabilities L 2010.00 0 H No No No 0 No 0 NoCurrent Liabilities L 2020.00 0 H No No Yes 1 No 0 No
Payroll Tax Liability L 2100.00 0 H No No Yes 0 No 0 NoTotal Payroll Tax Liability L 2199.00 0 T No No Yes 0 S Yes 0 S NoOther Liabilities L 2200.00 0 H No No Yes 1 No 0 NoTotal Other Liabilities L 2299.00 0 T No No Yes 0 S Yes 0 S No
Total Current Liabilities L 2499.00 0 T No No Yes 0 S Yes 1 S NoLong Term Liabilities L 2500.00 0 H No No Yes 1 No 0 NoTotal Long Term Liabilities L 2599.00 0 T No No Yes 1 S Yes 1 S No
Total Liabilities L 2999.00 0 T No No Yes 1 S Yes 1 S NoEquity L 3000.00 0 H No No Yes P No 0 No
Shareholders' Equity L 3010.00 0 H No No Yes 1 No 0 NoTotal Shareholders' Equity L 3099.00 0 T No No Yes 0 S Yes 0 S No
Total Equity L 3299.00 0 T No No Yes 1 S No 0 N NoRetained Earnings L 3300.00 0 H No No Yes 0 No 0 NoTotal Retained Earnings L 3399.00 0 T No No Yes 1 S Yes 1 S No
Total Liabilities & Equity L 3999.00 0 T No No Yes 1 D Yes 1 D NoP/L Header I 4000.00 0 H No No No 0 No 0 No
Income I 4010.00 0 H No No Yes 0 No 0 NoTotal Income I 4999.00 0 T No No Yes 1 S Yes 1 S NoExpenses E 5000.00 0 H No No Yes 0 Yes 0 No
Personnel Expenses E 5010.00 0 H No No Yes 1 No 0 NoSalaries E 5020.00 0 H No No Yes 0 No 0 NoTotal Salaries E 5299.00 0 T No No Yes 0 S Yes 0 S NoOther Personnel Expenses E 5300.00 0 H No No Yes 1 No 0 NoTotal Other Personnel Expenses E 5499.00 0 T No No Yes 0 S Yes 0 S No
Total Personnel Expenses E 5999.00 0 T No No Yes 1 S Yes 1 S NoProfessional Expenses E 6000.00 0 H No No Yes 0 No 0 NoTotal Professional Expenses E 6999.00 0 T No No Yes 1 S Yes 1 S NoMarketing/Promotion Expenses E 7000.00 0 H No No Yes 0 No 0 NoTotal Marketing/Promo Expenses E 7999.00 0 T No No Yes 1 S Yes 1 S NoGeneral & Administrative Exp. E 8000.00 0 H No No Yes 0 No 0 NoTotal General & Admin. Exp. E 8999.00 0 T No No Yes 1 S Yes 1 S No
Total Expenses E 9899.00 0 T No No Yes 1 S Yes 1 S NoNet Profit (Loss) I 9999.00 0 T No No Yes 1 D Yes 1 D No
Column Heading Codes:AT Account TypeDP DepartmentPT Print TypeAA Accrual AccountIn InactiveDPO Detail Print OptionDPC Detail Page ControlDUS Detail UnderscoreSPO Summary Print OptionSPC Summary Page ControlSUS Summary UnderscoreIBT Invert Balance Type
This Chart of Accounts includes Heading,Total & Comment accounts only and is
printed in Chart of Accounts Order.
The 3-page Chart of Accounts shown hererepresents the Chart of Accounts that is used for
the sample data in Chart of Accounts Order.
(details on the following page)
Sample Reports for GLS Version 17 9
Date: 11/17/2014 Chart of Accounts in Account Number Order Page: 2Jensen, Martin & Anderson
Description AT Account # D PT AA In DPO DP DUS SPO SP SUS IBT
401(K) Match E 5350.00 0 D No No Yes No NoHealth Insurance Premiums E 5360.00 0 D No No Yes No NoDisability Insurance Premiums E 5370.00 0 D No No Yes No NoLife Insurance Premiums E 5380.00 0 D No No Yes No NoWorkers Comp Insurance E 5390.00 0 D No No Yes No NoContract Labor E 5400.00 0 D No No Yes No NoPartner Bonuses E 5410.00 0 D No No Yes No NoAssociate Bonuses E 5420.00 0 D No No Yes No NoOther Bonuses E 5430.00 0 D No No Yes No NoDues & Memberships E 6100.00 0 D No No Yes No NoContinuing Legal Education E 6200.00 0 D No No Yes No NoOccupation Taxes E 6300.00 0 D No No Yes No NoMalpractice Insurance E 6400.00 0 D No No Yes No NoSeminars E 6500.00 0 D No No Yes No NoRecruiting Fees E 6600.00 0 D No No Yes No NoClient Meals E 7010.00 0 D No No Yes No NoClient Entertainment E 7020.00 0 D No No Yes No NoClient Gifts E 7030.00 0 D No No Yes No NoOutside Consultants E 7040.00 0 D No No Yes No NoPublicity (Ads, Brochures) E 7050.00 0 D No No Yes No NoOffice Rent E 8010.00 0 D No No Yes No NoUtilities E 8020.00 0 D No No Yes No NoParking E 8030.00 0 D No No Yes No NoOffice Supplies E 8040.00 0 D No No Yes No NoEquipment Repair & Maint. E 8050.00 0 D No No Yes No NoOffice Equipment Lease E 8060.00 0 D No No Yes No NoHardware Technical Support E 8070.00 0 D No No Yes No NoSoftware Maintenance E 8080.00 0 D No No Yes No NoTelephone E 8090.00 0 D No No Yes No NoInternet/Online Charges E 8100.00 0 D No No Yes No NoBooks E 8110.00 0 D No No Yes No NoPostage E 8120.00 0 D No No Yes No NoDepreciation E 8130.00 0 D No No Yes No NoAmortization E 8140.00 0 D No No Yes No NoPayroll Services E 8150.00 0 D No No Yes No NoBank Charges E 8160.00 0 D No No Yes No NoInterest Expense E 8170.00 0 D No No Yes No NoAuto Expense E 8180.00 0 D No No Yes No NoLiability & Property Insurance E 8190.00 0 D No No Yes No NoOther Office Expense E 8200.00 0 D No No Yes No No
Column Heading Codes:AT Account TypeDP DepartmentPT Print TypeAA Accrual AccountIn InactiveDPO Detail Print OptionDPC Detail Page ControlDUS Detail UnderscoreSPO Summary Print OptionSPC Summary Page ControlSUS Summary UnderscoreIBT Invert Balance Type
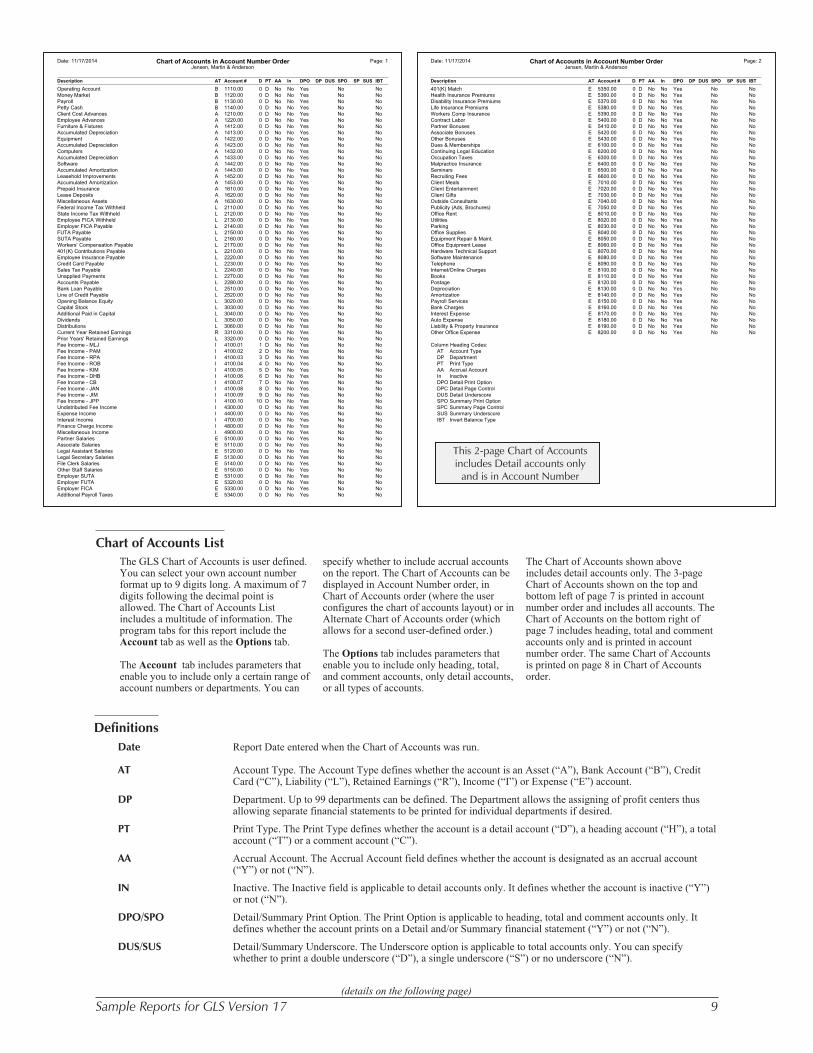
This 2-page Chart of Accountsincludes Detail accounts only
and is in Account Number
Date: 11/17/2014 Chart of Accounts in Account Number Order Page: 1Jensen, Martin & Anderson
Description AT Account # D PT AA In DPO DP DUS SPO SP SUS IBT
Operating Account B 1110.00 0 D No No Yes No NoMoney Market B 1120.00 0 D No No Yes No NoPayroll B 1130.00 0 D No No Yes No NoPetty Cash B 1140.00 0 D No No Yes No NoClient Cost Advances A 1210.00 0 D No No Yes No NoEmployee Advances A 1220.00 0 D No No Yes No NoFurniture & Fixtures A 1412.00 0 D No No Yes No NoAccumulated Depreciation A 1413.00 0 D No No Yes No NoEquipment A 1422.00 0 D No No Yes No NoAccumulated Depreciation A 1423.00 0 D No No Yes No NoComputers A 1432.00 0 D No No Yes No NoAccumulated Depreciation A 1433.00 0 D No No Yes No NoSoftware A 1442.00 0 D No No Yes No NoAccumulated Amortization A 1443.00 0 D No No Yes No NoLeasehold Improvements A 1452.00 0 D No No Yes No NoAccumulated Amortization A 1453.00 0 D No No Yes No NoPrepaid Insurance A 1610.00 0 D No No Yes No NoLease Deposits A 1620.00 0 D No No Yes No NoMiscellaneous Assets A 1630.00 0 D No No Yes No NoFederal Income Tax Withheld L 2110.00 0 D No No Yes No NoState Income Tax Withheld L 2120.00 0 D No No Yes No NoEmployee FICA Withheld L 2130.00 0 D No No Yes No NoEmployer FICA Payable L 2140.00 0 D No No Yes No NoFUTA Payable L 2150.00 0 D No No Yes No NoSUTA Payable L 2160.00 0 D No No Yes No NoWorkers' Compensation Payable L 2170.00 0 D No No Yes No No401(K) Contributions Payable L 2210.00 0 D No No Yes No NoEmployee Insurance Payable L 2220.00 0 D No No Yes No NoCredit Card Payable L 2230.00 0 D No No Yes No NoSales Tax Payable L 2240.00 0 D No No Yes No NoUnapplied Payments L 2270.00 0 D No No Yes No NoAccounts Payable L 2280.00 0 D No No Yes No NoBank Loan Payable L 2510.00 0 D No No Yes No NoLine of Credit Payable L 2520.00 0 D No No Yes No NoOpening Balance Equity L 3020.00 0 D No No Yes No NoCapital Stock L 3030.00 0 D No No Yes No NoAdditional Paid in Capital L 3040.00 0 D No No Yes No NoDividends L 3050.00 0 D No No Yes No NoDistributions L 3060.00 0 D No No Yes No NoCurrent Year Retained Earnings R 3310.00 0 D No No Yes No NoPrior Years' Retained Earnings L 3320.00 0 D No No Yes No NoFee Income - MLJ I 4100.01 1 D No No Yes No NoFee Income - PAM I 4100.02 2 D No No Yes No NoFee Income - RPA I 4100.03 3 D No No Yes No NoFee Income - ROB I 4100.04 4 D No No Yes No NoFee Income - KIM I 4100.05 5 D No No Yes No NoFee Income - DHB I 4100.06 6 D No No Yes No NoFee Income - CB I 4100.07 7 D No No Yes No NoFee Income - JAN I 4100.08 8 D No No Yes No NoFee Income - JIM I 4100.09 9 D No No Yes No NoFee Income - JPP I 4100.10 10 D No No Yes No NoUndistributed Fee Income I 4300.00 0 D No No Yes No NoExpense Income I 4400.00 0 D No No Yes No NoInterest Income I 4700.00 0 D No No Yes No NoFinance Charge Income I 4800.00 0 D No No Yes No NoMiscellaneous Income I 4900.00 0 D No No Yes No NoPartner Salaries E 5100.00 0 D No No Yes No NoAssociate Salaries E 5110.00 0 D No No Yes No NoLegal Assistant Salaries E 5120.00 0 D No No Yes No NoLegal Secretary Salaries E 5130.00 0 D No No Yes No NoFile Clerk Salaries E 5140.00 0 D No No Yes No NoOther Staff Salaries E 5150.00 0 D No No Yes No NoEmployer SUTA E 5310.00 0 D No No Yes No NoEmployer FUTA E 5320.00 0 D No No Yes No NoEmployer FICA E 5330.00 0 D No No Yes No NoAdditional Payroll Taxes E 5340.00 0 D No No Yes No No
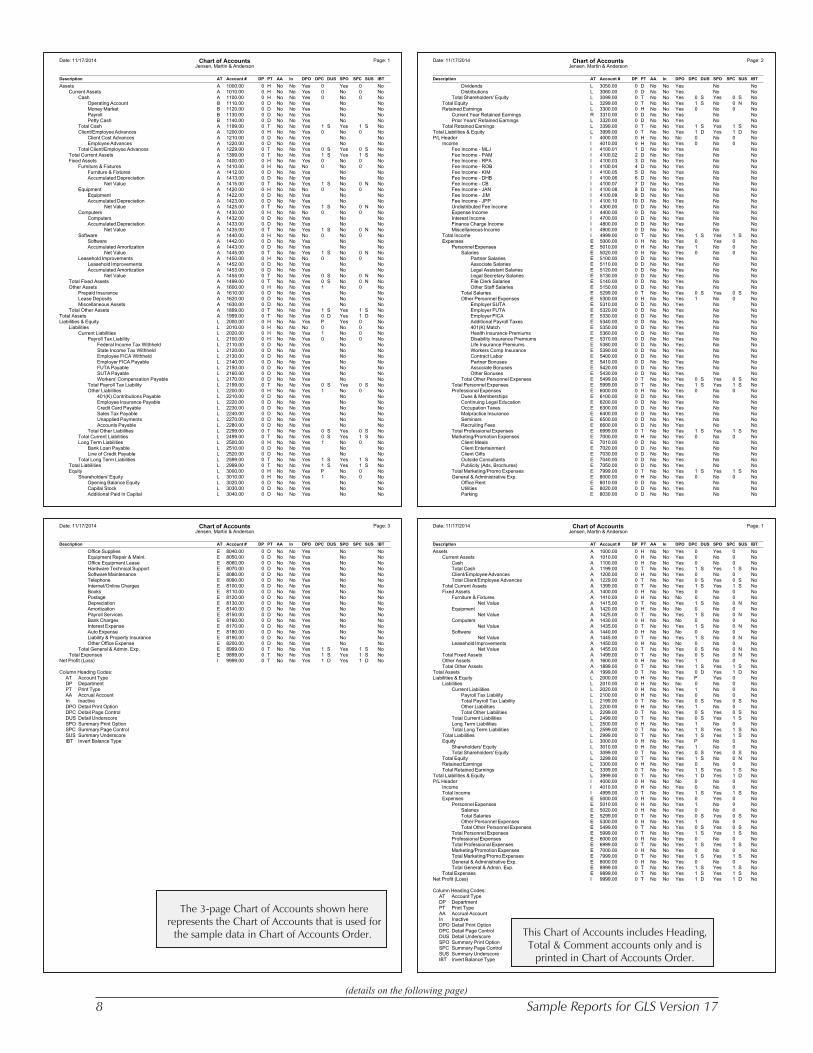
Chart of Accounts List
The GLS Chart of Accounts is user defined.You can select your own account numberformat up to 9 digits long. A maximum of 7digits following the decimal point isallowed. The Chart of Accounts Listincludes a multitude of information. Theprogram tabs for this report include theAccount tab as well as the Options tab.
The Account tab includes parameters thatenable you to include only a certain range ofaccount numbers or departments. You can
specify whether to include accrual accountson the report. The Chart of Accounts can bedisplayed in Account Number order, inChart of Accounts order (where the userconfigures the chart of accounts layout) or inAlternate Chart of Accounts order (whichallows for a second user-defined order.)
The Options tab includes parameters thatenable you to include only heading, total,and comment accounts, only detail accounts,or all types of accounts.
The Chart of Accounts shown aboveincludes detail accounts only. The 3-pageChart of Accounts shown on the top andbottom left of page 7 is printed in accountnumber order and includes all accounts. TheChart of Accounts on the bottom right ofpage 7 includes heading, total and commentaccounts only and is printed in accountnumber order. The same Chart of Accountsis printed on page 8 in Chart of Accountsorder.
Definitions
Date Report Date entered when the Chart of Accounts was run.
AT Account Type. The Account Type defines whether the account is an Asset (“A”), Bank Account (“B”), CreditCard (“C”), Liability (“L”), Retained Earnings (“R”), Income (“I”) or Expense (“E”) account.
DP Department. Up to 99 departments can be defined. The Department allows the assigning of profit centers thusallowing separate financial statements to be printed for individual departments if desired.
PT Print Type. The Print Type defines whether the account is a detail account (“D”), a heading account (“H”), a totalaccount (“T”) or a comment account (“C”).
AA Accrual Account. The Accrual Account field defines whether the account is designated as an accrual account(“Y”) or not (“N”).
IN Inactive. The Inactive field is applicable to detail accounts only. It defines whether the account is inactive (“Y”)or not (“N”).
DPO/SPO Detail/Summary Print Option. The Print Option is applicable to heading, total and comment accounts only. Itdefines whether the account prints on a Detail and/or Summary financial statement (“Y”) or not (“N”).
DUS/SUS Detail/Summary Underscore. The Underscore option is applicable to total accounts only. You can specifywhether to print a double underscore (“D”), a single underscore (“S”) or no underscore (“N”).
(details on the following page)
10 Sample Reports for GLS Version 17
(continued from the previous page)
DPC/SPC Detail/Summary Page Control. The Page Control is applicable to heading, total and comment accounts only. Youcan assign blank lines (0-9) or page breaks (“P”) to print between accounts.
IBT Invert Balance Type. The Invert Balance Type field specifies whether an account has been set to display apositive amount rather than a negative one or vice versa. This is typically done with contra accounts.
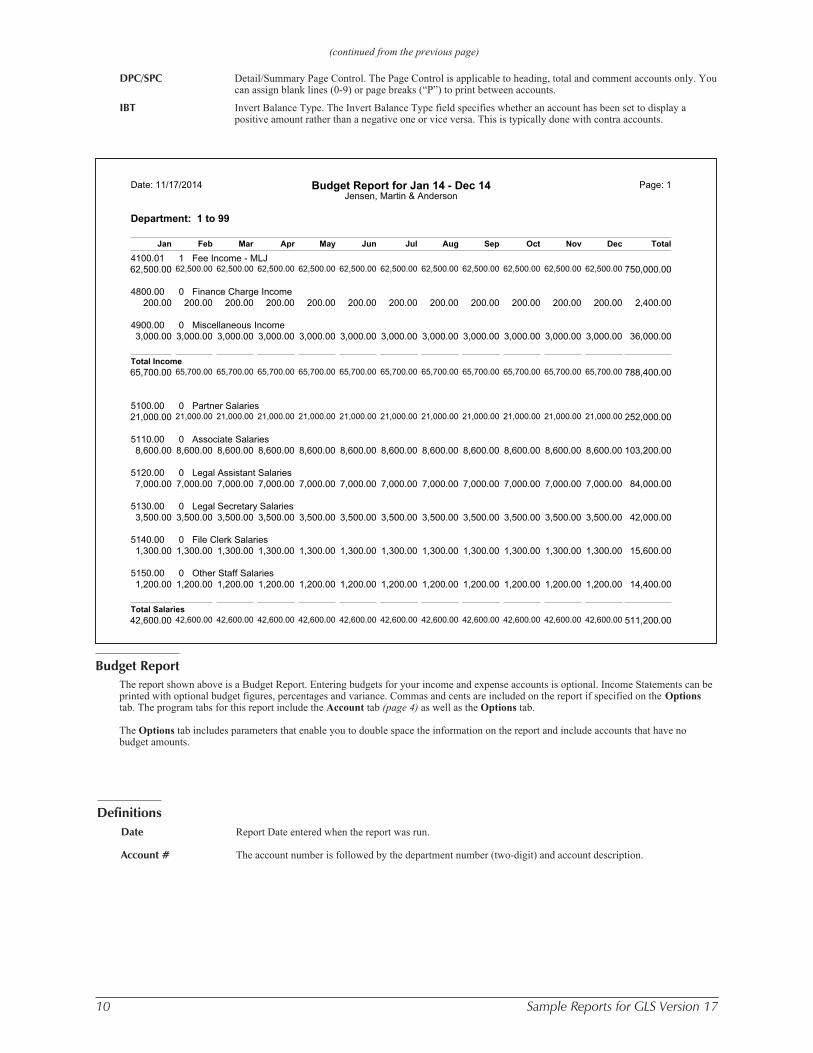
Budget Report
The report shown above is a Budget Report. Entering budgets for your income and expense accounts is optional. Income Statements can beprinted with optional budget figures, percentages and variance. Commas and cents are included on the report if specified on the Optionstab. The program tabs for this report include the Account tab (page 4) as well as the Options tab.
The Options tab includes parameters that enable you to double space the information on the report and include accounts that have nobudget amounts.
Date: 11/17/2014 Budget Report for Jan 14 - Dec 14 Page: 1Jensen, Martin & Anderson
Department: 1 to 99
Jan Feb Mar Apr May Jun Jul Aug Sep Oct Nov Dec Total
4100.01 1 Fee Income - MLJ62,500.00 62,500.00 62,500.00 62,500.00 62,500.00 62,500.00 62,500.00 62,500.00 62,500.00 62,500.00 62,500.00 62,500.00 750,000.00
4800.00 0 Finance Charge Income200.00 200.00 200.00 200.00 200.00 200.00 200.00 200.00 200.00 200.00 200.00 200.00 2,400.00
4900.00 0 Miscellaneous Income3,000.00 3,000.00 3,000.00 3,000.00 3,000.00 3,000.00 3,000.00 3,000.00 3,000.00 3,000.00 3,000.00 3,000.00 36,000.00
Total Income65,700.00 65,700.00 65,700.00 65,700.00 65,700.00 65,700.00 65,700.00 65,700.00 65,700.00 65,700.00 65,700.00 65,700.00 788,400.00
5100.00 0 Partner Salaries21,000.00 21,000.00 21,000.00 21,000.00 21,000.00 21,000.00 21,000.00 21,000.00 21,000.00 21,000.00 21,000.00 21,000.00 252,000.00
5110.00 0 Associate Salaries8,600.00 8,600.00 8,600.00 8,600.00 8,600.00 8,600.00 8,600.00 8,600.00 8,600.00 8,600.00 8,600.00 8,600.00 103,200.00
5120.00 0 Legal Assistant Salaries7,000.00 7,000.00 7,000.00 7,000.00 7,000.00 7,000.00 7,000.00 7,000.00 7,000.00 7,000.00 7,000.00 7,000.00 84,000.00
5130.00 0 Legal Secretary Salaries3,500.00 3,500.00 3,500.00 3,500.00 3,500.00 3,500.00 3,500.00 3,500.00 3,500.00 3,500.00 3,500.00 3,500.00 42,000.00
5140.00 0 File Clerk Salaries1,300.00 1,300.00 1,300.00 1,300.00 1,300.00 1,300.00 1,300.00 1,300.00 1,300.00 1,300.00 1,300.00 1,300.00 15,600.00
5150.00 0 Other Staff Salaries1,200.00 1,200.00 1,200.00 1,200.00 1,200.00 1,200.00 1,200.00 1,200.00 1,200.00 1,200.00 1,200.00 1,200.00 14,400.00
Total Salaries42,600.00 42,600.00 42,600.00 42,600.00 42,600.00 42,600.00 42,600.00 42,600.00 42,600.00 42,600.00 42,600.00 42,600.00 511,200.00
Definitions
Date Report Date entered when the report was run.
Account # The account number is followed by the department number (two-digit) and account description.
Sample Reports for GLS Version 17 11
Date: 11/17/2014 GLS Journal Entry Verification List Page: 1Jensen, Martin & AndersonUser: (BLANK) Blank User
Jrnl Entry DateAccount Account Name Jrn Date Entered Reference Check # Amount D/C Src Status Trans # Description
5140.00 File Clerk Salaries 4 11/18/2014 11/17/2014 Jimmy Praum 2805 1,208.07 D P O 213 Payroll 5310.00 Employer SUTA 4 11/18/2014 11/17/2014 Jimmy Praum 2805 92.42 D P O 213 Payroll 1130.00 Payroll 4 11/18/2014 11/17/2014 Jimmy Praum 2805 979.05 C P R 213 Payroll 2110.00 Fed. Inc. Tax Wheld 4 11/18/2014 11/17/2014 Jimmy Praum 2805 100.36 C P O 213 Payroll 2120.00 St. Inc. Tax Wheld 4 11/18/2014 11/17/2014 Jimmy Praum 2805 92.42 C P O 213 Payroll 2140.00 Emplr FICA Pyble 4 11/18/2014 11/17/2014 Jimmy Praum 2805 92.42 C P O 213 Payroll 2130.00 Emplee FICA Wheld 4 11/18/2014 11/17/2014 Jimmy Praum 2805 36.24 C P O 213 Payroll 1442.00 Software 3 11/17/2014 11/17/2014 320559 25653 150.00 D A O 214 Software Technology, Inc./Purchase Tabs3 Device
Interface Program 1110.00 Operating Account 3 11/17/2014 11/17/2014 320559 25653 150.00 C A C 214 Software Technology, Inc./Purchase Tabs3 Device
Interface Program 1210.00 Client Cost Advances 3 11/17/2014 11/17/2014 25654 150.00 D A O 215 Clerk of the District Court/Petition for Dissolution of
Marriage Filing Fee 1110.00 Operating Account 3 11/17/2014 11/17/2014 25654 150.00 C A O 215 Clerk of the District Court/Petition for Dissolution of
Marriage Filing Fee 5400.00 Contract Labor 3 11/17/2014 11/17/2014 KEY 25655 10.00 D A O 216 D & B Real Estate Management Company/Duplicate
Key for building 1110.00 Operating Account 3 11/17/2014 11/17/2014 KEY 25655 10.00 C A C 216 D & B Real Estate Management Company/Duplicate
Key for building 8090.00 Telephone 3 11/17/2014 11/17/2014 402310760011 25656 68.96 D A O 217 Sprint Local & Long Distance/November Cell Phone
Charges 1110.00 Operating Account 3 11/17/2014 11/17/2014 402310760011 25656 68.96 C A R 217 Sprint Local & Long Distance/November Cell Phone
Charges 8200.00 Other Office Expense 3 11/17/2014 11/17/2014 25657 750.00 D A O 218 Clean All Janitorial Services/Monthly Cleaning Charges
(Bi-Weekly Service) 1110.00 Operating Account 3 11/17/2014 11/17/2014 25657 750.00 C A O 218 Clean All Janitorial Services/Monthly Cleaning Charges
(Bi-Weekly Service) 1110.00 Operating Account 2 11/17/2014 11/17/2014 850.00 2107 565.00 D B C 219 Payment 4100.01 Fee Income - MLJ 2 11/17/2014 11/17/2014 850.00 2107 370.54 C B O 219 Payment 4100.05 Fee Income - KIM 2 11/17/2014 11/17/2014 850.00 2107 44.46 C B O 219 Payment 1210.00 Client Cost Advances 2 11/17/2014 11/17/2014 850.00 2107 150.00 C B O 219 Payment 1110.00 Operating Account 1 11/17/2014 11/17/2014 Luncheon 275.00 D M O 220 Office luncheon - supplies 8200.00 Other Office Expense 1 11/17/2014 11/17/2014 Luncheon 275.00 C M O 220 Office luncheon - supplies
Debits: 3,269.45Credits: 3,269.45
Account Checksum = 6,980,206
Changed EntriesNew
5140.00 File Clerk Salaries 4 11/18/2014 11/17/2014 Jimmy Praum 2805 1,208.07 D P O 213 PayrollOld
5140.00 File Clerk Salaries 4 11/18/2014 11/17/2014 Jimmy Praum 2805 1,208.07 D P O 213 Payroll
New 5310.00 Employer SUTA 4 11/18/2014 11/17/2014 Jimmy Praum 2805 92.42 D P O 213 Payroll
Old 5310.00 Employer SUTA 4 11/18/2014 11/17/2014 Jimmy Praum 2805 92.42 D P O 213 Payroll
New 1110.00 Operating Account 3 11/17/2014 11/17/2014 320559 25653 150.00 C A C 214 Software Technology, Inc./Purchase Tabs3 Device
Interface ProgramOld
1110.00 Operating Account 3 11/17/2014 11/17/2014 320559 25653 150.00 C A O 214 Software Technology, Inc./Purchase Tabs3 DeviceInterface Program
Total Transaction Count = 30
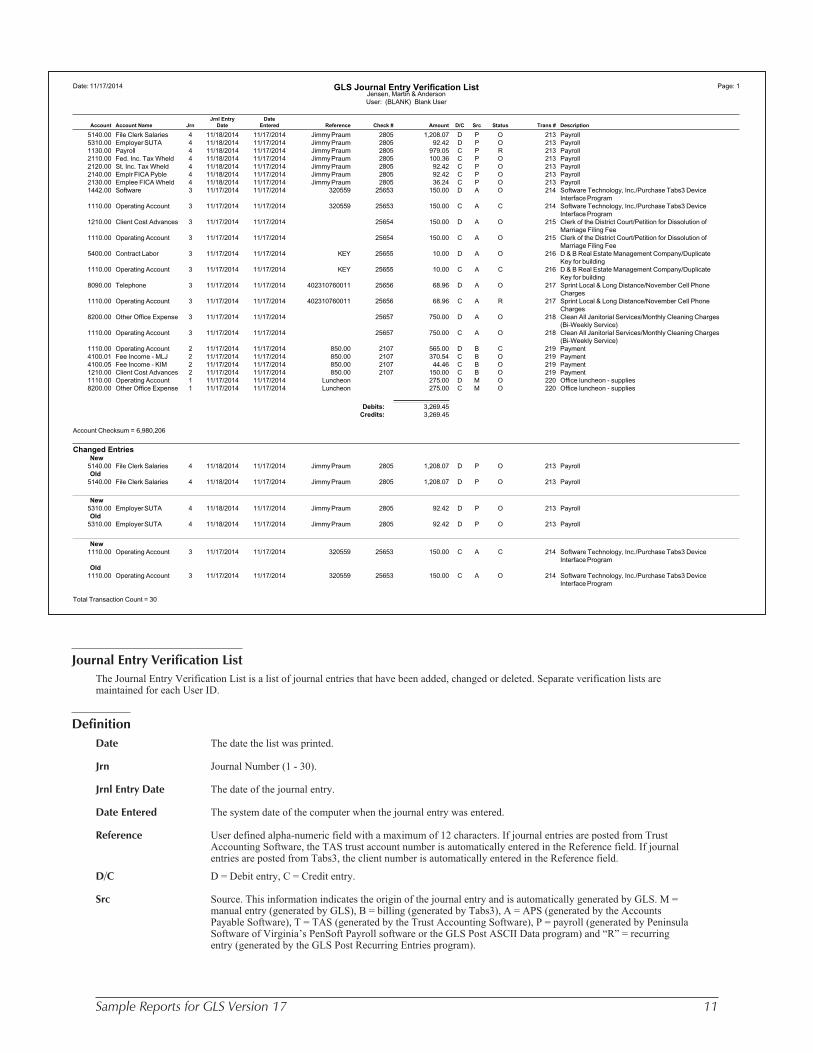
Journal Entry Verification List
The Journal Entry Verification List is a list of journal entries that have been added, changed or deleted. Separate verification lists aremaintained for each User ID.
Definition
Date The date the list was printed.
Jrn Journal Number (1 - 30).
Jrnl Entry Date The date of the journal entry.
Date Entered The system date of the computer when the journal entry was entered.
Reference User defined alpha-numeric field with a maximum of 12 characters. If journal entries are posted from TrustAccounting Software, the TAS trust account number is automatically entered in the Reference field. If journalentries are posted from Tabs3, the client number is automatically entered in the Reference field.
D/C D = Debit entry, C = Credit entry.
Src Source. This information indicates the origin of the journal entry and is automatically generated by GLS. M =manual entry (generated by GLS), B = billing (generated by Tabs3), A = APS (generated by the AccountsPayable Software), T = TAS (generated by the Trust Accounting Software), P = payroll (generated by PeninsulaSoftware of Virginia’s PenSoft Payroll software or the GLS Post ASCII Data program) and “R” = recurringentry (generated by the GLS Post Recurring Entries program).
12 Sample Reports for GLS Version 17
Recon Reconciled. “O” indicates that the journal entry is outstanding (has not been reconciled). “C” indicates that thejournal entry has been cleared on the current reconciliation. “R” indicates that the journal entry has beenreconciled to the bank statement.
Trans # The Trans # is automatically assigned by GLS. It is used to retrieve journal entries for editing purposes.
ChangedEntries
Any journal entries that are edited will be listed under Changed Entries. For each journal entry that is changed,the journal entry will be shown twice—before changes and after changes. The journal entry under the “New”heading represents the journal entry after the changes. The journal entry under the “Old” heading represents thejournal entry before the changes. If the verification list for the original journal entry has not been printed prior toany change, the original journal entry will also print with the new journal entries as well as in the ChangedEntries portion of the list. Deleted journal entries are deleted by editing the amount to zero. These “deleted”journal entries will be shown in the Changed Entries section with the New journal entry having an amount of$0.00.
AccountChecksum
Total of the account numbers (the decimal is not used in the addition). The purpose of this number is to providea cross-total for batched entries. By manually totaling the account numbers from the journal entries entered andcomparing the total to the checksum, you can ensure that all journal entries have been entered and assigned tothe proper account.
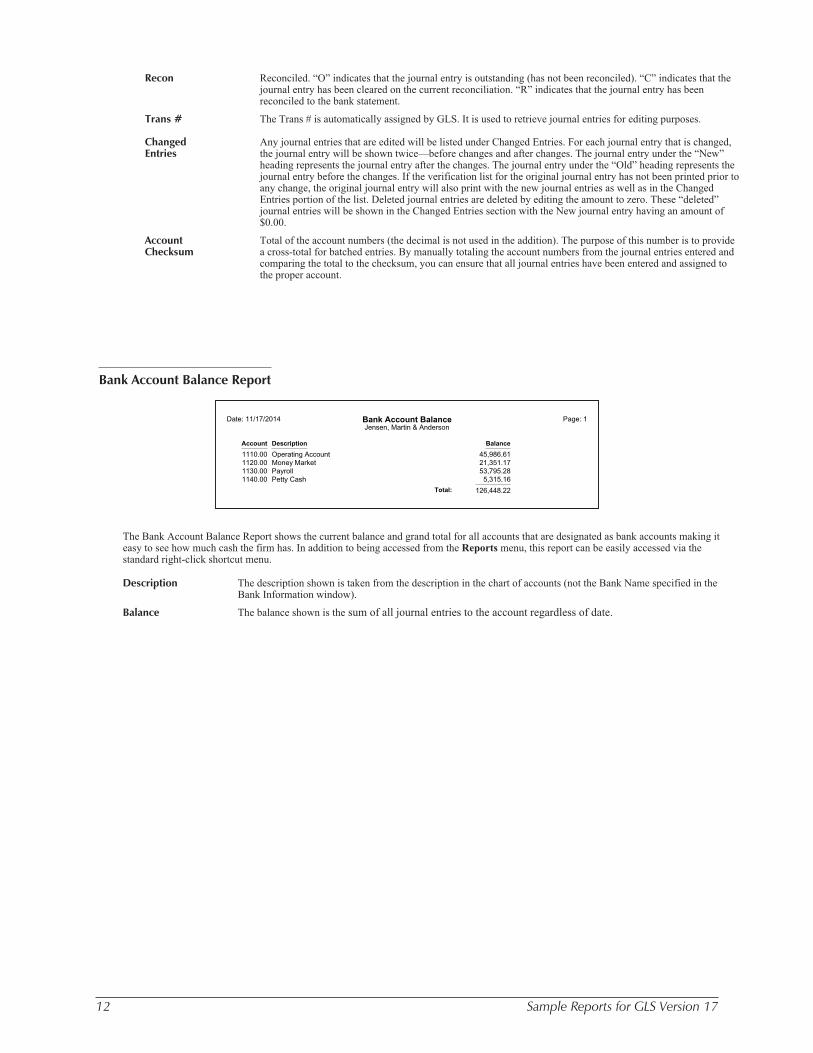
Bank Account Balance Report
The Bank Account Balance Report shows the current balance and grand total for all accounts that are designated as bank accounts making iteasy to see how much cash the firm has. In addition to being accessed from the Reports menu, this report can be easily accessed via thestandard right-click shortcut menu.
Description The description shown is taken from the description in the chart of accounts (not the Bank Name specified in theBank Information window).
Balance The balance shown is the sum of all journal entries to the account regardless of date.
Date: 11/17/2014 Bank Account Balance Page: 1Jensen, Martin & Anderson
Account Description Balance
1110.00 Operating Account 45,986.611120.00 Money Market 21,351.171130.00 Payroll 53,795.281140.00 Petty Cash 5,315.16
Total: 126,448.22
Sample Reports for GLS Version 17 13
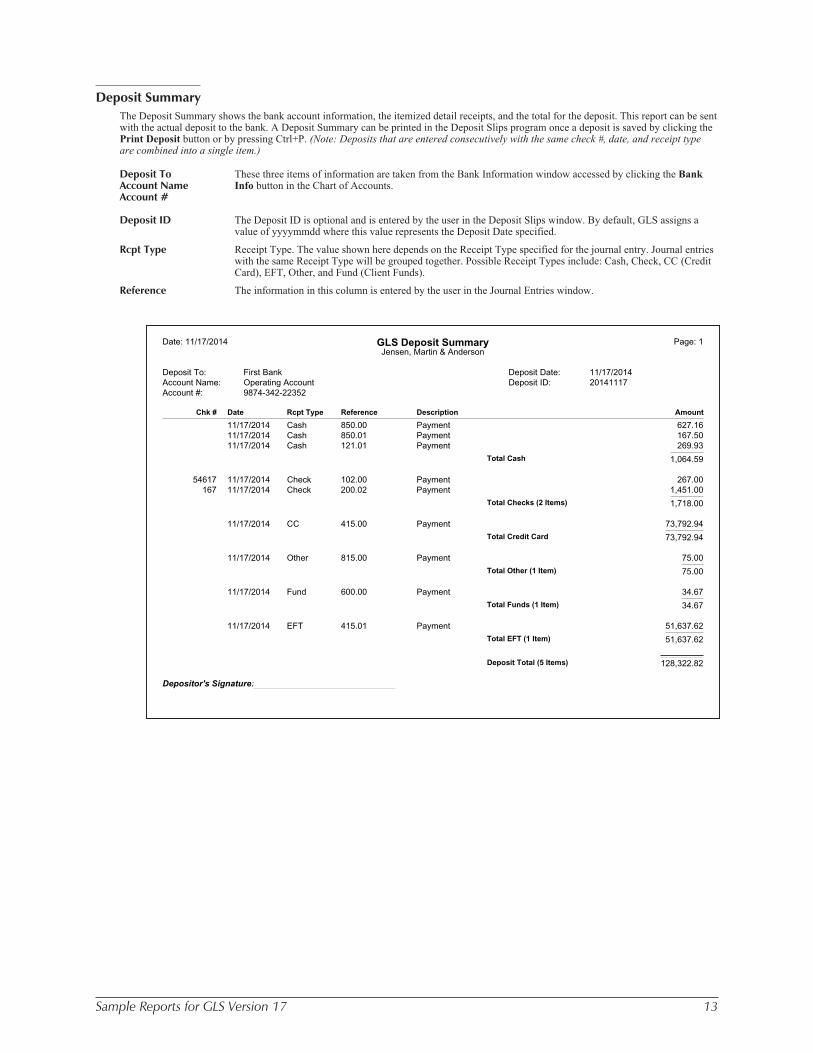
Deposit Summary
The Deposit Summary shows the bank account information, the itemized detail receipts, and the total for the deposit. This report can be sentwith the actual deposit to the bank. A Deposit Summary can be printed in the Deposit Slips program once a deposit is saved by clicking thePrint Deposit button or by pressing Ctrl+P. (Note: Deposits that are entered consecutively with the same check #, date, and receipt typeare combined into a single item.)
Deposit ToAccount NameAccount #
These three items of information are taken from the Bank Information window accessed by clicking the BankInfo button in the Chart of Accounts.
Deposit ID The Deposit ID is optional and is entered by the user in the Deposit Slips window. By default, GLS assigns avalue of yyyymmdd where this value represents the Deposit Date specified.
Rcpt Type Receipt Type. The value shown here depends on the Receipt Type specified for the journal entry. Journal entrieswith the same Receipt Type will be grouped together. Possible Receipt Types include: Cash, Check, CC (CreditCard), EFT, Other, and Fund (Client Funds).
Reference The information in this column is entered by the user in the Journal Entries window.
Date: 11/17/2014 GLS Deposit Summary Page: 1Jensen, Martin & Anderson
Deposit To: First Bank Deposit Date: 11/17/2014Account Name: Operating Account Deposit ID: 20141117Account #: 9874-342-22352
Chk # Date Rcpt Type Reference Description Amount
11/17/2014 Cash 850.00 Payment 627.1611/17/2014 Cash 850.01 Payment 167.5011/17/2014 Cash 121.01 Payment 269.93
Total Cash 1,064.59
54617 11/17/2014 Check 102.00 Payment 267.00167 11/17/2014 Check 200.02 Payment 1,451.00
Total Checks (2 Items) 1,718.00
11/17/2014 CC 415.00 Payment 73,792.94Total Credit Card 73,792.94
11/17/2014 Other 815.00 Payment 75.00
Total Other (1 Item) 75.00
11/17/2014 Fund 600.00 Payment 34.67Total Funds (1 Item) 34.67
11/17/2014 EFT 415.01 Payment 51,637.62Total EFT (1 Item) 51,637.62
Deposit Total (5 Items) 128,322.82
Depositor's Signature:
14 Sample Reports for GLS Version 17
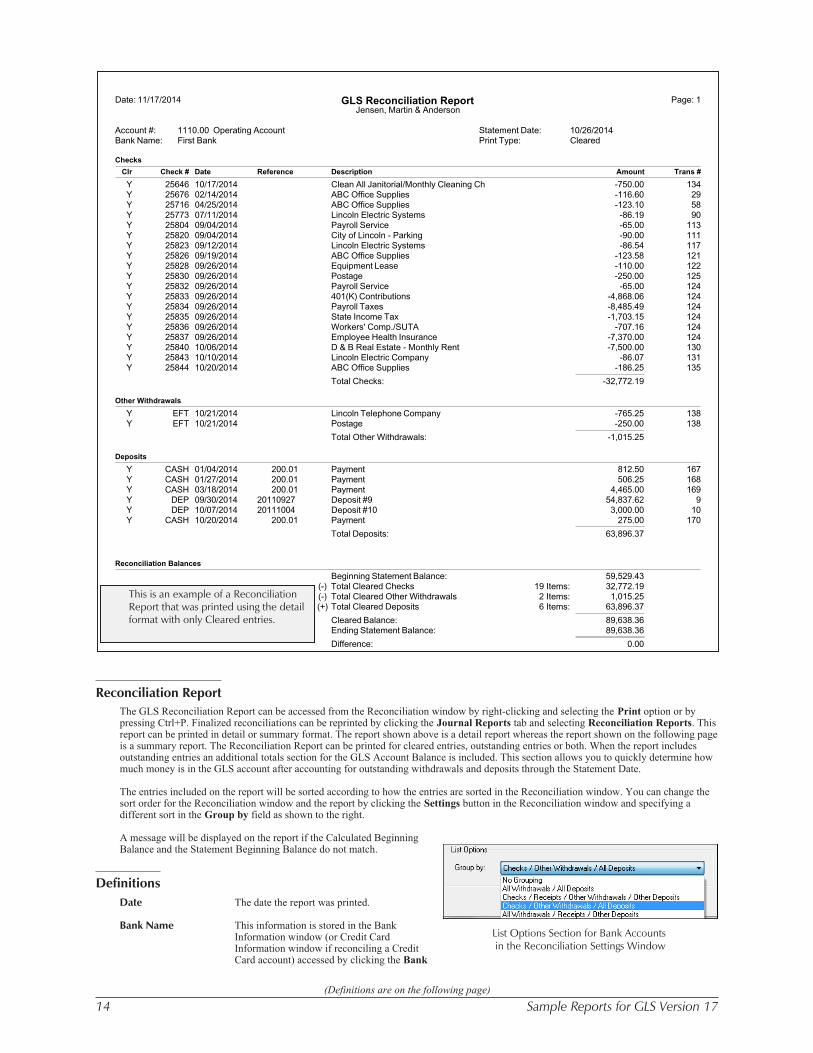
Reconciliation Report
The GLS Reconciliation Report can be accessed from the Reconciliation window by right-clicking and selecting the Print option or bypressing Ctrl+P. Finalized reconciliations can be reprinted by clicking the Journal Reports tab and selecting Reconciliation Reports. Thisreport can be printed in detail or summary format. The report shown above is a detail report whereas the report shown on the following pageis a summary report. The Reconciliation Report can be printed for cleared entries, outstanding entries or both. When the report includesoutstanding entries an additional totals section for the GLS Account Balance is included. This section allows you to quickly determine howmuch money is in the GLS account after accounting for outstanding withdrawals and deposits through the Statement Date.
The entries included on the report will be sorted according to how the entries are sorted in the Reconciliation window. You can change thesort order for the Reconciliation window and the report by clicking the Settings button in the Reconciliation window and specifying adifferent sort in the Group by field as shown to the right.
A message will be displayed on the report if the Calculated BeginningBalance and the Statement Beginning Balance do not match.
Definitions
Date The date the report was printed.
Bank Name This information is stored in the BankInformation window (or Credit CardInformation window if reconciling a CreditCard account) accessed by clicking the Bank
Date: 11/17/2014 GLS Reconciliation Report Page: 1Jensen, Martin & Anderson
Account #: 1110.00 Operating Account Statement Date: 10/26/2014Bank Name: First Bank Print Type: Cleared
Checks
Clr Check # Date Reference Description Amount Trans #
Y 25646 10/17/2014 Clean All Janitorial/Monthly Cleaning Ch -750.00 134Y 25676 02/14/2014 ABC Office Supplies -116.60 29Y 25716 04/25/2014 ABC Office Supplies -123.10 58Y 25773 07/11/2014 Lincoln Electric Systems -86.19 90Y 25804 09/04/2014 Payroll Service -65.00 113Y 25820 09/04/2014 City of Lincoln - Parking -90.00 111Y 25823 09/12/2014 Lincoln Electric Systems -86.54 117Y 25826 09/19/2014 ABC Office Supplies -123.58 121Y 25828 09/26/2014 Equipment Lease -110.00 122Y 25830 09/26/2014 Postage -250.00 125Y 25832 09/26/2014 Payroll Service -65.00 124Y 25833 09/26/2014 401(K) Contributions -4,868.06 124Y 25834 09/26/2014 Payroll Taxes -8,485.49 124Y 25835 09/26/2014 State Income Tax -1,703.15 124Y 25836 09/26/2014 Workers' Comp./SUTA -707.16 124Y 25837 09/26/2014 Employee Health Insurance -7,370.00 124Y 25840 10/06/2014 D & B Real Estate - Monthly Rent -7,500.00 130Y 25843 10/10/2014 Lincoln Electric Company -86.07 131Y 25844 10/20/2014 ABC Office Supplies -186.25 135
Total Checks: -32,772.19
Other Withdrawals
Y EFT 10/21/2014 Lincoln Telephone Company -765.25 138Y EFT 10/21/2014 Postage -250.00 138
Total Other Withdrawals: -1,015.25
Deposits
Y CASH 01/04/2014 200.01 Payment 812.50 167Y CASH 01/27/2014 200.01 Payment 506.25 168Y CASH 03/18/2014 200.01 Payment 4,465.00 169Y DEP 09/30/2014 20110927 Deposit #9 54,837.62 9Y DEP 10/07/2014 20111004 Deposit #10 3,000.00 10Y CASH 10/20/2014 200.01 Payment 275.00 170
Total Deposits: 63,896.37
Reconciliation Balances
Beginning Statement Balance: 59,529.43(-) Total Cleared Checks 19 Items: 32,772.19(-) Total Cleared Other Withdrawals 2 Items: 1,015.25(+) Total Cleared Deposits 6 Items: 63,896.37
Cleared Balance: 89,638.36Ending Statement Balance: 89,638.36
Difference: 0.00
This is an example of a ReconciliationReport that was printed using the detailformat with only Cleared entries.
List Options Section for Bank Accountsin the Reconciliation Settings Window
(Definitions are on the following page)
Sample Reports for GLS Version 17 15
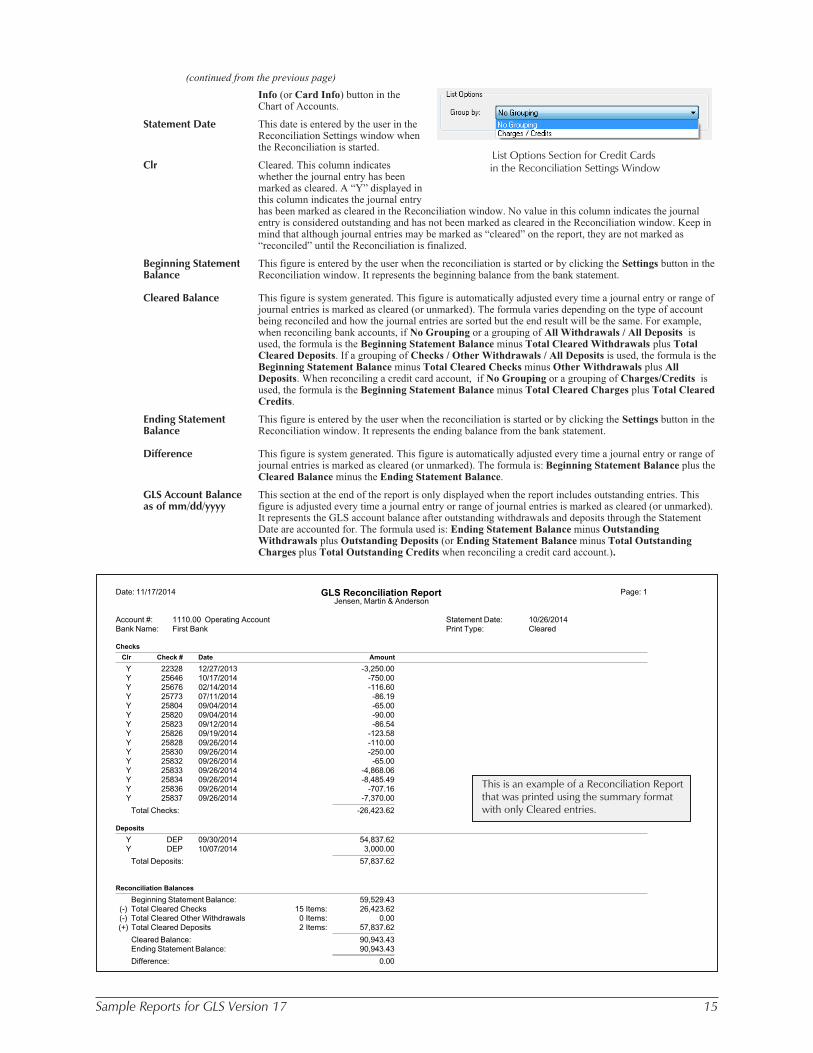
Date: 11/17/2014 GLS Reconciliation Report Page: 1Jensen, Martin & Anderson
Account #: 1110.00 Operating Account Statement Date: 10/26/2014Bank Name: First Bank Print Type: Cleared
Checks
Clr Check # Date Amount
Y 22328 12/27/2013 -3,250.00Y 25646 10/17/2014 -750.00Y 25676 02/14/2014 -116.60Y 25773 07/11/2014 -86.19Y 25804 09/04/2014 -65.00Y 25820 09/04/2014 -90.00Y 25823 09/12/2014 -86.54Y 25826 09/19/2014 -123.58Y 25828 09/26/2014 -110.00Y 25830 09/26/2014 -250.00Y 25832 09/26/2014 -65.00Y 25833 09/26/2014 -4,868.06Y 25834 09/26/2014 -8,485.49Y 25836 09/26/2014 -707.16Y 25837 09/26/2014 -7,370.00
Total Checks: -26,423.62
Deposits
Y DEP 09/30/2014 54,837.62Y DEP 10/07/2014 3,000.00
Total Deposits: 57,837.62
Reconciliation Balances
Beginning Statement Balance: 59,529.43(-) Total Cleared Checks 15 Items: 26,423.62(-) Total Cleared Other Withdrawals 0 Items: 0.00(+) Total Cleared Deposits 2 Items: 57,837.62
Cleared Balance: 90,943.43Ending Statement Balance: 90,943.43
Difference: 0.00
Info (or Card Info) button in theChart of Accounts.
Statement Date This date is entered by the user in theReconciliation Settings window whenthe Reconciliation is started.
Clr Cleared. This column indicateswhether the journal entry has beenmarked as cleared. A “Y” displayed inthis column indicates the journal entryhas been marked as cleared in the Reconciliation window. No value in this column indicates the journalentry is considered outstanding and has not been marked as cleared in the Reconciliation window. Keep inmind that although journal entries may be marked as “cleared” on the report, they are not marked as“reconciled” until the Reconciliation is finalized.
Beginning StatementBalance
This figure is entered by the user when the reconciliation is started or by clicking the Settings button in theReconciliation window. It represents the beginning balance from the bank statement.
Cleared Balance This figure is system generated. This figure is automatically adjusted every time a journal entry or range ofjournal entries is marked as cleared (or unmarked). The formula varies depending on the type of accountbeing reconciled and how the journal entries are sorted but the end result will be the same. For example,when reconciling bank accounts, if No Grouping or a grouping of All Withdrawals / All Deposits isused, the formula is the Beginning Statement Balance minus Total Cleared Withdrawals plus TotalCleared Deposits. If a grouping of Checks / Other Withdrawals / All Deposits is used, the formula is theBeginning Statement Balance minus Total Cleared Checks minus Other Withdrawals plus AllDeposits. When reconciling a credit card account, if No Grouping or a grouping of Charges/Credits isused, the formula is the Beginning Statement Balance minus Total Cleared Charges plus Total ClearedCredits.
Ending StatementBalance
This figure is entered by the user when the reconciliation is started or by clicking the Settings button in theReconciliation window. It represents the ending balance from the bank statement.
Difference This figure is system generated. This figure is automatically adjusted every time a journal entry or range ofjournal entries is marked as cleared (or unmarked). The formula is: Beginning Statement Balance plus theCleared Balance minus the Ending Statement Balance.
GLS Account Balanceas of mm/dd/yyyy
This section at the end of the report is only displayed when the report includes outstanding entries. Thisfigure is adjusted every time a journal entry or range of journal entries is marked as cleared (or unmarked).It represents the GLS account balance after outstanding withdrawals and deposits through the StatementDate are accounted for. The formula used is: Ending Statement Balance minus OutstandingWithdrawals plus Outstanding Deposits (or Ending Statement Balance minus Total OutstandingCharges plus Total Outstanding Credits when reconciling a credit card account.).
This is an example of a Reconciliation Reportthat was printed using the summary formatwith only Cleared entries.
(continued from the previous page)
List Options Section for Credit Cardsin the Reconciliation Settings Window

16 Sample Reports for GLS Version 17
Journal Report
Journals can be printed at any time for selected ranges of dates, check numbers, departments and in a variety of sort orders. This page andthe following page show only two of the many different ways that journals can be printed. The Journal Report above was printed in Entryorder. The journal on the following page was printed using a primary order of Date and a secondary order of Reference. Notice that theDescription prints on the same line as the journal entry when the report is printed in Entry order.
The program tabs for this report include the Account tab, the Journal tab, and the Options tab. The Options tab includes parameters thatenable you to select a journal entry source and sort the report in Entry order. If you elect to not print the journal in Entry order, you canselect separate primary and secondary sort orders from the following: reference, date, account number or check number. The message“Debits and Credits Do Not Balance” will be printed if the debits and credits are not equal.
Definitions
Date The date the Journal was printed.
Trans # Transaction #. The Transaction # is used for identifying the transaction for editing purposes.
Date: 11/17/2014 Journal Page: 1Jensen, Martin & Anderson
From 10/17/2014 Thru 10/27/2014Department: 0 to 99
Trans # Account # Date Src Reference Check # DP JR Debit Credit Description
134 8200.00 10/17/2014 A 25646 0 3 750.00 Clean All Janitorial/Monthly Cleaning Ch134 1110.00 10/17/2014 A 25646 0 3 750.00 Clean All Janitorial/Monthly Cleaning Ch135 1110.00 10/20/2014 M 25844 0 3 186.25 ABC Office Supplies135 8040.00 10/20/2014 M 25844 0 3 186.25 ABC Office Supplies138 1110.00 10/21/2014 M 25845 0 3 95.00 Eastern Nebraska Cable Company138 8100.00 10/21/2014 M 25845 0 3 95.00 Eastern Nebraska Cable Company138 1110.00 10/21/2014 M 25846 0 3 765.25 Lincoln Telephone Company138 8090.00 10/21/2014 M 25846 0 3 765.25 Lincoln Telephone Company142 1110.00 10/27/2014 M 25848 0 3 1,000.00 Payment on Bank Loan142 8170.00 10/27/2014 M 25848 0 3 640.98 Interest Expense on Bank Loan142 2510.00 10/27/2014 M 25848 0 3 359.02 Principal Payment138 8120.00 10/21/2014 M 25842 0 3 250.00 Postage138 1110.00 10/21/2014 M 25842 0 3 250.00 Postage143 1110.00 10/27/2014 M 25849 0 4 65.00 Payroll Service143 8150.00 10/27/2014 M 25849 0 4 65.00 Payroll Service143 1130.00 10/27/2014 M 25850 0 4 32,026.96 Payroll Deposit143 1110.00 10/27/2014 M 25850 0 4 32,026.96 Payroll Deposit143 5100.00 10/27/2014 M 0 4 21,000.00 Partner Payroll - October143 5110.00 10/27/2014 M 0 4 8,600.00 Associate Payroll - October143 5120.00 10/27/2014 M 0 4 7,000.00 Legal Assistant Payroll - October143 5130.00 10/27/2014 M 0 4 3,500.00 Legal Secretary Payroll - October143 5140.00 10/27/2014 M 0 4 1,300.00 File Clerk Payroll - October143 5150.00 10/27/2014 M 0 4 1,200.00 Other Staff Payroll - October143 2110.00 10/27/2014 M 0 4 4,429.97 Federal Income Tax Withheld143 2120.00 10/27/2014 M 0 4 1,703.15 State Income Tax Withheld143 2130.00 10/27/2014 M 0 4 325.89 Employee FICA Withheld143 2210.00 10/27/2014 M 0 4 2,434.03 401(K) Contributions Withheld143 2220.00 10/27/2014 M 0 4 1,680.00 Employee Insurance Withheld143 1130.00 10/27/2014 M 0 4 32,026.96 Payroll - October143 2140.00 10/27/2014 M 0 4 325.89 Employer FICA Payable143 2150.00 10/27/2014 M 0 4 3,403.74 FUTA Payable143 2160.00 10/27/2014 M 0 4 553.80 SUTA Payable143 5310.00 10/27/2014 M 0 4 553.80 SUTA Expense143 5320.00 10/27/2014 M 0 4 3,403.74 FUTA Expense143 5330.00 10/27/2014 M 0 4 325.89 FICA Expense143 2210.00 10/27/2014 M 25851 0 4 2,434.03 401(K) Contributions Payable143 5350.00 10/27/2014 M 25851 0 4 2,434.03 401(K) Contributions Match143 1110.00 10/27/2014 M 25851 0 4 4,868.06 401(K) Contributions143 2110.00 10/27/2014 M 25852 0 4 4,429.97 Federal Income Tax Withheld143 2130.00 10/27/2014 M 25852 0 4 325.89 Employee FICA Withheld143 2140.00 10/27/2014 M 25852 0 4 325.89 Employer FICA Payable143 2150.00 10/27/2014 M 25852 0 4 3,403.74 FUTA Payable143 1110.00 10/27/2014 M 25852 0 4 8,485.49 Payroll Taxes143 2120.00 10/27/2014 M 0 4 1,703.15 State Income Tax Withheld143 1110.00 10/27/2014 M 25853 0 4 1,703.15 State Income Tax143 2160.00 10/27/2014 M 0 4 553.80 SUTA Payable143 5390.00 10/27/2014 M 0 4 153.36 Workers' Comp. Expense143 1110.00 10/27/2014 M 25854 0 4 707.16 Workers' Comp./SUTA143 2220.00 10/27/2014 M 0 4 1,680.00 Employee Insurance Payable143 5360.00 10/27/2014 M 0 4 5,690.00 Health Insurance Premiums143 1110.00 10/27/2014 M 25855 0 4 7,370.00 Employee Health Insurance144 1110.00 10/27/2014 M 0 2 3,000.00 Rent Received - Sublease144 4900.00 10/27/2014 M 0 2 3,000.00 Rent Received - Sublease144 8010.00 10/27/2014 M 0 3 7,500.00 D & B Real Estate - Monthly Rent144 1110.00 10/27/2014 M 25856 0 3 7,500.00 D & B Real Estate - Monthly Rent144 8030.00 10/27/2014 M 0 3 90.00 City of Lincoln - Parking144 1110.00 10/27/2014 M 25857 0 3 90.00 City of Lincoln - Parking170 1110.00 10/20/2014 B 200.01 0 2 275.00 Payment170 2270.00 10/20/2014 B 200.01 0 2 275.00 Payment182 1110.00 10/20/2014 B 415.00 0 2 65,011.69 Payment182 2270.00 10/20/2014 B 415.00 0 2 65,011.69 Payment
Total 181,032.44 181,032.44
(continued on the following page)
Src Source. This indicates the origin of the journal entry and is automatically generated by GLS. M = manual entry(generated by GLS), B = billing (generated by Tabs3), A = APS (generated by the Accounts Payable Software),T = TAS (generated by the Trust Accounting Software), P = payroll (generated by Peninsula Software ofVirginia’s PenSoft Payroll software or the GLS Post ASCII Data program) and R = recurring entry (generated bythe GLS Post Recurring Entries program).
Check # An asterisk following the check number indicates the check has been reconciled.
Sample Reports for GLS Version 17 17
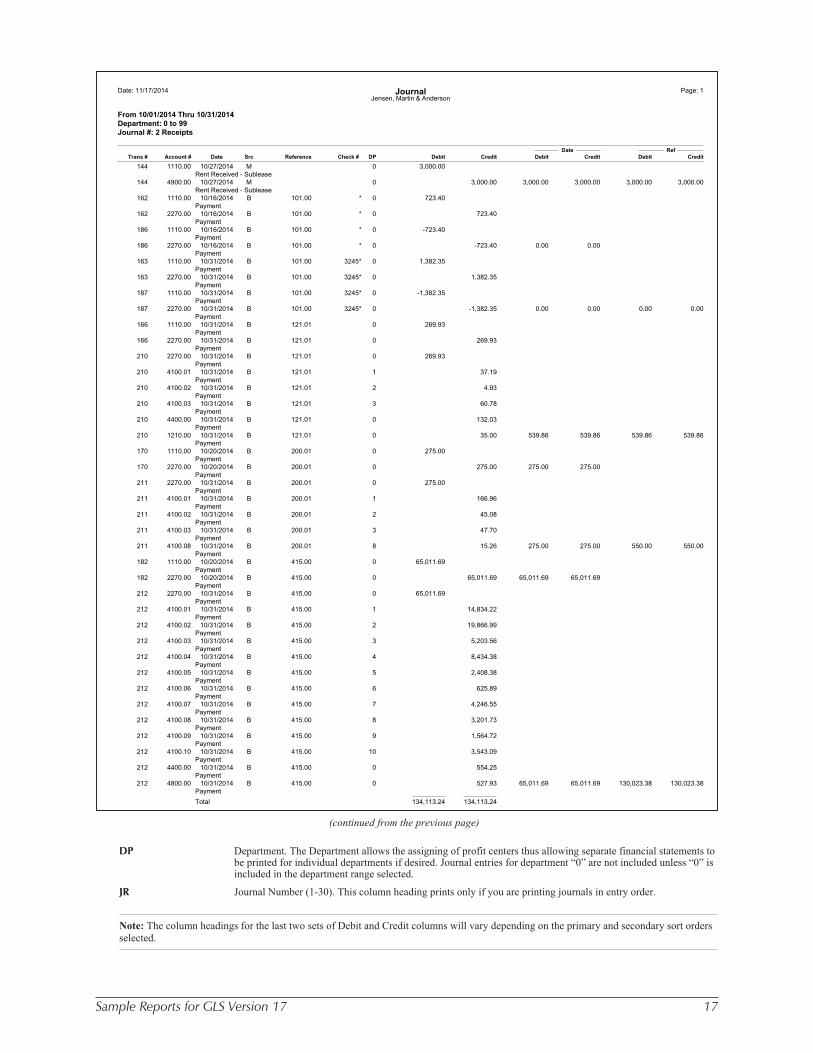
Date: 11/17/2014 Journal Page: 1Jensen, Martin & Anderson
From 10/01/2014 Thru 10/31/2014Department: 0 to 99Journal #: 2 Receipts
Date RefTrans # Account # Date Src Reference Check # DP Debit Credit Debit Credit Debit Credit
144 1110.00 10/27/2014 M 0 3,000.00Rent Received - Sublease
144 4900.00 10/27/2014 M 0 3,000.00 3,000.00 3,000.00 3,000.00 3,000.00Rent Received - Sublease
162 1110.00 10/16/2014 B 101.00 * 0 723.40Payment
162 2270.00 10/16/2014 B 101.00 * 0 723.40Payment
186 1110.00 10/16/2014 B 101.00 * 0 -723.40Payment
186 2270.00 10/16/2014 B 101.00 * 0 -723.40 0.00 0.00Payment
163 1110.00 10/31/2014 B 101.00 3245* 0 1,382.35Payment
163 2270.00 10/31/2014 B 101.00 3245* 0 1,382.35Payment
187 1110.00 10/31/2014 B 101.00 3245* 0 -1,382.35Payment
187 2270.00 10/31/2014 B 101.00 3245* 0 -1,382.35 0.00 0.00 0.00 0.00Payment
166 1110.00 10/31/2014 B 121.01 0 269.93Payment
166 2270.00 10/31/2014 B 121.01 0 269.93Payment
210 2270.00 10/31/2014 B 121.01 0 269.93Payment
210 4100.01 10/31/2014 B 121.01 1 37.19Payment
210 4100.02 10/31/2014 B 121.01 2 4.93Payment
210 4100.03 10/31/2014 B 121.01 3 60.78Payment
210 4400.00 10/31/2014 B 121.01 0 132.03Payment
210 1210.00 10/31/2014 B 121.01 0 35.00 539.86 539.86 539.86 539.86Payment
170 1110.00 10/20/2014 B 200.01 0 275.00Payment
170 2270.00 10/20/2014 B 200.01 0 275.00 275.00 275.00Payment
211 2270.00 10/31/2014 B 200.01 0 275.00Payment
211 4100.01 10/31/2014 B 200.01 1 166.96Payment
211 4100.02 10/31/2014 B 200.01 2 45.08Payment
211 4100.03 10/31/2014 B 200.01 3 47.70Payment
211 4100.08 10/31/2014 B 200.01 8 15.26 275.00 275.00 550.00 550.00Payment
182 1110.00 10/20/2014 B 415.00 0 65,011.69Payment
182 2270.00 10/20/2014 B 415.00 0 65,011.69 65,011.69 65,011.69Payment
212 2270.00 10/31/2014 B 415.00 0 65,011.69Payment
212 4100.01 10/31/2014 B 415.00 1 14,834.22Payment
212 4100.02 10/31/2014 B 415.00 2 19,866.99Payment
212 4100.03 10/31/2014 B 415.00 3 5,203.56Payment
212 4100.04 10/31/2014 B 415.00 4 8,434.38Payment
212 4100.05 10/31/2014 B 415.00 5 2,408.38Payment
212 4100.06 10/31/2014 B 415.00 6 625.89Payment
212 4100.07 10/31/2014 B 415.00 7 4,246.55Payment
212 4100.08 10/31/2014 B 415.00 8 3,201.73Payment
212 4100.09 10/31/2014 B 415.00 9 1,564.72Payment
212 4100.10 10/31/2014 B 415.00 10 3,543.09Payment
212 4400.00 10/31/2014 B 415.00 0 554.25Payment
212 4800.00 10/31/2014 B 415.00 0 527.93 65,011.69 65,011.69 130,023.38 130,023.38Payment
Total 134,113.24 134,113.24
(continued from the previous page)
DP Department. The Department allows the assigning of profit centers thus allowing separate financial statements tobe printed for individual departments if desired. Journal entries for department “0” are not included unless “0” isincluded in the department range selected.
JR Journal Number (1-30). This column heading prints only if you are printing journals in entry order.
Note: The column headings for the last two sets of Debit and Credit columns will vary depending on the primary and secondary sort ordersselected.

18 Sample Reports for GLS Version 17
Date: 11/17/2014 Journal Page: 1Jensen, Martin & Anderson
System Date: 11/17/2014 Time: 02:14 PM User ID: CHERYL
Account Number Selection Criteria:Account Number: 0.00 Thru: 999999.99Include Accrual Accounts: No
Department Selection Criteria:Department: 0 Thru: 99Sort in Department Order: No
Journal Report Options:Journal Date: 10/01/2014 Thru: 10/31/2014Check Number: 0 Thru: 999999999Journal Number: 1 Thru: 30Journal Entry Source: EverythingSort By Entry Order: NoPrimary Sort order: ReferenceSecondary Sort order: DateRecord Status: ( ) Reconciled
( ) Outstanding(x) Both
Criteria Page
The report shown above is an example of a Criteria Page. A Criteria Page is an optional page that can be printed at the end of most reports.This separate page lists all of the options and criteria used for the generation of the report. The options listed on the Criteria Page are brokendown by program tabs where applicable. The Criteria Page shown above is for a Journal Report.
General Ledger Report
The General Ledger Report shows detailedactivity for each account. The program tabsfor this report include the Account tab, theOptions tab, and the Format tab.
The Options tab includes parameters thatenable you to select the year to print,beginning and ending date, and beginningmonth for year-to-date figures as well aswhether to include “no activity” accounts,
zero balance accounts and zero amountentries. The Format tab includes fields thatcan optionally be included on the report,such as Department, Transaction #, Journal#, Reference, Check #, Source and NetChange, as well as specify whether thereport will print in portrait or landscape. Youcan optionally select to include a runningbalance and have each account start on anew page. The message “Debits and Credits
Do Not Balance” will be printed if the debitsand credits on the General Ledger are notequal and you have included all accounts.The order in which the journal entries aresorted is: Account #, Date, Check #. If aCheck # is not used, then the entries aresorted by Account #, Date and Reference.
Definitions
DP Department. Optional column. The Department allows the assigning of profit centers thus allowing separatefinancial statements to be printed for the individual departments if desired. Accounts with a department of zerowill not be included unless “0” is included in the selected department range.
Trans # Transaction #. Optional column. The Transaction # is used for identifying the journal entry for editing purposes.
JR Journal Number (01 - 30). Optional column.
Reference 12-character user defined field. Optional column.
Check # An asterisk following the check number indicates the check has been reconciled (not shown on the samplereport). Optional column.
Src Source. Optional column. This indicates the origin of the journal entry and is automatically generated by GLS. M= manual entry (generated by GLS), B = billing (generated by Tabs3), A = APS (generated by the AccountsPayable Software), T = TAS (generated by the Trust Accounting Software), P = payroll (generated by PeninsulaSoftware of Virginia’s PenSoft Payroll software or the GLS Post ASCII Data program) and R = Recurring Entry(generated by the GLS Post Recurring Entries program).
BalanceForward
The Balance Forward for balance sheet accounts is the ending balance of the previous month. The BalanceForward for income statement accounts is the total of the months from the “Beginning Month for YTD Figures”through the month prior to the “Beginning Calendar Month” selected. Changing the month selected for“Beginning Month for YTD Figures” will affect beginning balance figures for the income statement accounts.
Period Totals Total debits and total credits for activity on the account for the period selected. These figures do not include theBalance Forward amount.
Net Change Total debits minus total credits. Optional column.
(continued on the following page)
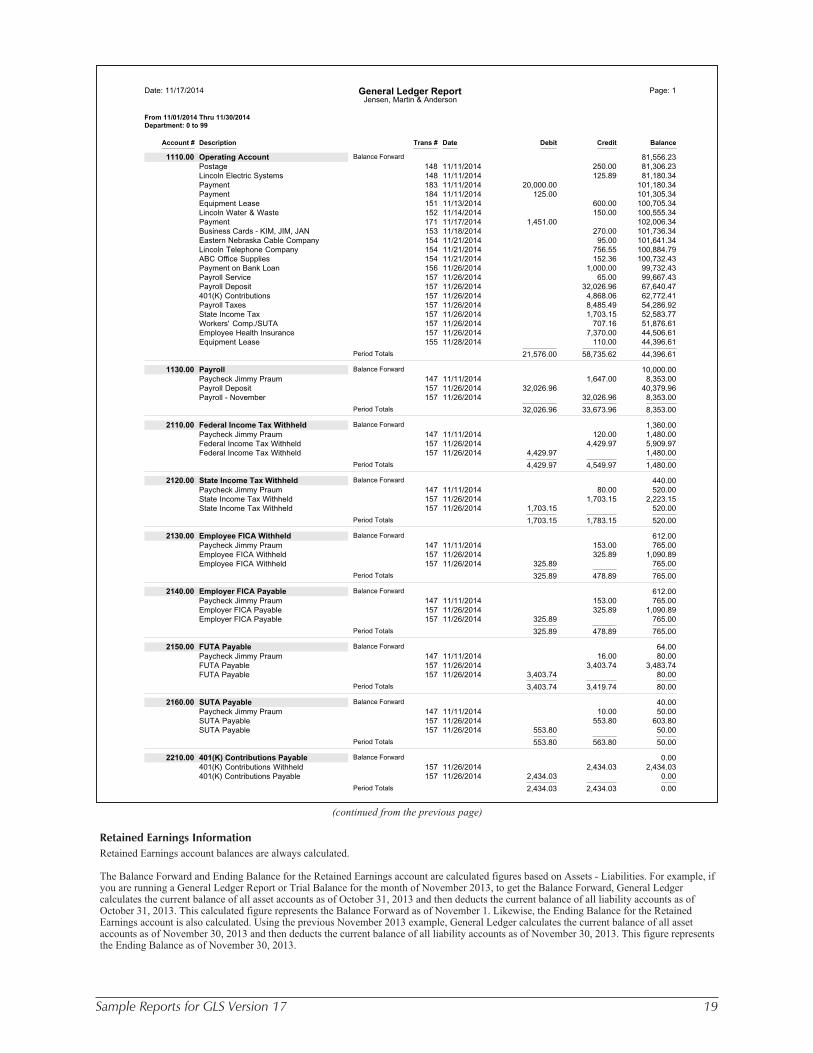
Sample Reports for GLS Version 17 19
Date: 11/17/2014 General Ledger Report Page: 1Jensen, Martin & Anderson
From 11/01/2014 Thru 11/30/2014Department: 0 to 99
Account # Description Trans # Date Debit Credit Balance
1110.00 Operating Account Balance Forward 81,556.23Postage 148 11/11/2014 250.00 81,306.23Lincoln Electric Systems 148 11/11/2014 125.89 81,180.34Payment 183 11/11/2014 20,000.00 101,180.34Payment 184 11/11/2014 125.00 101,305.34Equipment Lease 151 11/13/2014 600.00 100,705.34Lincoln Water & Waste 152 11/14/2014 150.00 100,555.34Payment 171 11/17/2014 1,451.00 102,006.34Business Cards - KIM, JIM, JAN 153 11/18/2014 270.00 101,736.34Eastern Nebraska Cable Company 154 11/21/2014 95.00 101,641.34Lincoln Telephone Company 154 11/21/2014 756.55 100,884.79ABC Office Supplies 154 11/21/2014 152.36 100,732.43Payment on Bank Loan 156 11/26/2014 1,000.00 99,732.43Payroll Service 157 11/26/2014 65.00 99,667.43Payroll Deposit 157 11/26/2014 32,026.96 67,640.47401(K) Contributions 157 11/26/2014 4,868.06 62,772.41Payroll Taxes 157 11/26/2014 8,485.49 54,286.92State Income Tax 157 11/26/2014 1,703.15 52,583.77Workers' Comp./SUTA 157 11/26/2014 707.16 51,876.61Employee Health Insurance 157 11/26/2014 7,370.00 44,506.61Equipment Lease 155 11/28/2014 110.00 44,396.61
Period Totals 21,576.00 58,735.62 44,396.61
1130.00 Payroll Balance Forward 10,000.00Paycheck Jimmy Praum 147 11/11/2014 1,647.00 8,353.00Payroll Deposit 157 11/26/2014 32,026.96 40,379.96Payroll - November 157 11/26/2014 32,026.96 8,353.00
Period Totals 32,026.96 33,673.96 8,353.00
2110.00 Federal Income Tax Withheld Balance Forward 1,360.00Paycheck Jimmy Praum 147 11/11/2014 120.00 1,480.00Federal Income Tax Withheld 157 11/26/2014 4,429.97 5,909.97Federal Income Tax Withheld 157 11/26/2014 4,429.97 1,480.00
Period Totals 4,429.97 4,549.97 1,480.00
2120.00 State Income Tax Withheld Balance Forward 440.00Paycheck Jimmy Praum 147 11/11/2014 80.00 520.00State Income Tax Withheld 157 11/26/2014 1,703.15 2,223.15State Income Tax Withheld 157 11/26/2014 1,703.15 520.00
Period Totals 1,703.15 1,783.15 520.00
2130.00 Employee FICA Withheld Balance Forward 612.00Paycheck Jimmy Praum 147 11/11/2014 153.00 765.00Employee FICA Withheld 157 11/26/2014 325.89 1,090.89Employee FICA Withheld 157 11/26/2014 325.89 765.00
Period Totals 325.89 478.89 765.00
2140.00 Employer FICA Payable Balance Forward 612.00Paycheck Jimmy Praum 147 11/11/2014 153.00 765.00Employer FICA Payable 157 11/26/2014 325.89 1,090.89Employer FICA Payable 157 11/26/2014 325.89 765.00
Period Totals 325.89 478.89 765.00
2150.00 FUTA Payable Balance Forward 64.00Paycheck Jimmy Praum 147 11/11/2014 16.00 80.00FUTA Payable 157 11/26/2014 3,403.74 3,483.74FUTA Payable 157 11/26/2014 3,403.74 80.00
Period Totals 3,403.74 3,419.74 80.00
2160.00 SUTA Payable Balance Forward 40.00Paycheck Jimmy Praum 147 11/11/2014 10.00 50.00SUTA Payable 157 11/26/2014 553.80 603.80SUTA Payable 157 11/26/2014 553.80 50.00
Period Totals 553.80 563.80 50.00
2210.00 401(K) Contributions Payable Balance Forward 0.00401(K) Contributions Withheld 157 11/26/2014 2,434.03 2,434.03401(K) Contributions Payable 157 11/26/2014 2,434.03 0.00
Period Totals 2,434.03 2,434.03 0.00
Retained Earnings Information
Retained Earnings account balances are always calculated.
The Balance Forward and Ending Balance for the Retained Earnings account are calculated figures based on Assets - Liabilities. For example, ifyou are running a General Ledger Report or Trial Balance for the month of November 2013, to get the Balance Forward, General Ledgercalculates the current balance of all asset accounts as of October 31, 2013 and then deducts the current balance of all liability accounts as ofOctober 31, 2013. This calculated figure represents the Balance Forward as of November 1. Likewise, the Ending Balance for the RetainedEarnings account is also calculated. Using the previous November 2013 example, General Ledger calculates the current balance of all assetaccounts as of November 30, 2013 and then deducts the current balance of all liability accounts as of November 30, 2013. This figure representsthe Ending Balance as of November 30, 2013.
(continued from the previous page)
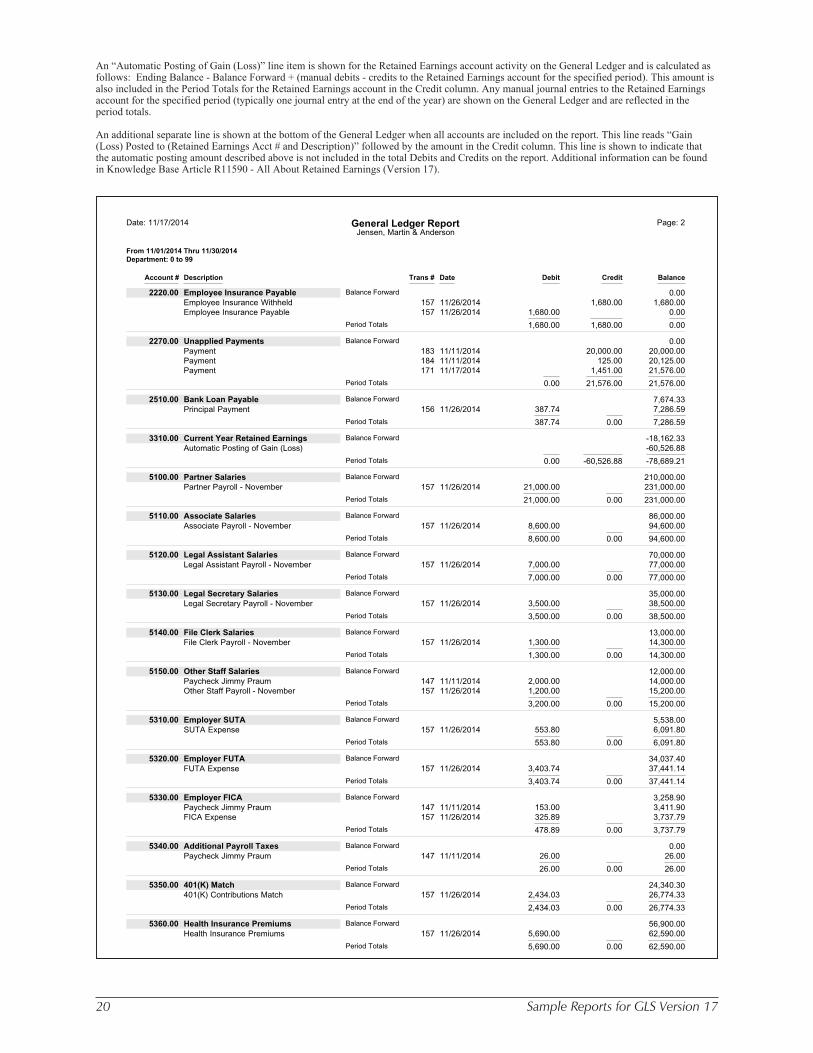
20 Sample Reports for GLS Version 17
Date: 11/17/2014 General Ledger Report Page: 2Jensen, Martin & Anderson
From 11/01/2014 Thru 11/30/2014Department: 0 to 99
Account # Description Trans # Date Debit Credit Balance
2220.00 Employee Insurance Payable Balance Forward 0.00Employee Insurance Withheld 157 11/26/2014 1,680.00 1,680.00Employee Insurance Payable 157 11/26/2014 1,680.00 0.00
Period Totals 1,680.00 1,680.00 0.00
2270.00 Unapplied Payments Balance Forward 0.00Payment 183 11/11/2014 20,000.00 20,000.00Payment 184 11/11/2014 125.00 20,125.00Payment 171 11/17/2014 1,451.00 21,576.00
Period Totals 0.00 21,576.00 21,576.00
2510.00 Bank Loan Payable Balance Forward 7,674.33Principal Payment 156 11/26/2014 387.74 7,286.59
Period Totals 387.74 0.00 7,286.59
3310.00 Current Year Retained Earnings Balance Forward -18,162.33Automatic Posting of Gain (Loss) -60,526.88
Period Totals 0.00 -60,526.88 -78,689.21
5100.00 Partner Salaries Balance Forward 210,000.00Partner Payroll - November 157 11/26/2014 21,000.00 231,000.00
Period Totals 21,000.00 0.00 231,000.00
5110.00 Associate Salaries Balance Forward 86,000.00Associate Payroll - November 157 11/26/2014 8,600.00 94,600.00
Period Totals 8,600.00 0.00 94,600.00
5120.00 Legal Assistant Salaries Balance Forward 70,000.00Legal Assistant Payroll - November 157 11/26/2014 7,000.00 77,000.00
Period Totals 7,000.00 0.00 77,000.00
5130.00 Legal Secretary Salaries Balance Forward 35,000.00Legal Secretary Payroll - November 157 11/26/2014 3,500.00 38,500.00
Period Totals 3,500.00 0.00 38,500.00
5140.00 File Clerk Salaries Balance Forward 13,000.00File Clerk Payroll - November 157 11/26/2014 1,300.00 14,300.00
Period Totals 1,300.00 0.00 14,300.00
5150.00 Other Staff Salaries Balance Forward 12,000.00Paycheck Jimmy Praum 147 11/11/2014 2,000.00 14,000.00Other Staff Payroll - November 157 11/26/2014 1,200.00 15,200.00
Period Totals 3,200.00 0.00 15,200.00
5310.00 Employer SUTA Balance Forward 5,538.00SUTA Expense 157 11/26/2014 553.80 6,091.80
Period Totals 553.80 0.00 6,091.80
5320.00 Employer FUTA Balance Forward 34,037.40FUTA Expense 157 11/26/2014 3,403.74 37,441.14
Period Totals 3,403.74 0.00 37,441.14
5330.00 Employer FICA Balance Forward 3,258.90Paycheck Jimmy Praum 147 11/11/2014 153.00 3,411.90FICA Expense 157 11/26/2014 325.89 3,737.79
Period Totals 478.89 0.00 3,737.79
5340.00 Additional Payroll Taxes Balance Forward 0.00Paycheck Jimmy Praum 147 11/11/2014 26.00 26.00
Period Totals 26.00 0.00 26.00
5350.00 401(K) Match Balance Forward 24,340.30401(K) Contributions Match 157 11/26/2014 2,434.03 26,774.33
Period Totals 2,434.03 0.00 26,774.33
5360.00 Health Insurance Premiums Balance Forward 56,900.00Health Insurance Premiums 157 11/26/2014 5,690.00 62,590.00
Period Totals 5,690.00 0.00 62,590.00
An “Automatic Posting of Gain (Loss)” line item is shown for the Retained Earnings account activity on the General Ledger and is calculated asfollows: Ending Balance - Balance Forward + (manual debits - credits to the Retained Earnings account for the specified period). This amount isalso included in the Period Totals for the Retained Earnings account in the Credit column. Any manual journal entries to the Retained Earningsaccount for the specified period (typically one journal entry at the end of the year) are shown on the General Ledger and are reflected in theperiod totals.
An additional separate line is shown at the bottom of the General Ledger when all accounts are included on the report. This line reads “Gain(Loss) Posted to (Retained Earnings Acct # and Description)” followed by the amount in the Credit column. This line is shown to indicate thatthe automatic posting amount described above is not included in the total Debits and Credits on the report. Additional information can be foundin Knowledge Base Article R11590 - All About Retained Earnings (Version 17).

Sample Reports for GLS Version 17 21
Date: 11/17/2014 General Ledger Report Page: 3Jensen, Martin & Anderson
From 11/01/2014 Thru 11/30/2014Department: 0 to 99
Account # Description Trans # Date Debit Credit Balance
5390.00 Workers Comp Insurance Balance Forward 1,533.60Workers' Comp. Expense 157 11/26/2014 153.36 1,686.96
Period Totals 153.36 0.00 1,686.96
7050.00 Publicity (Ads, Brochures) Balance Forward 720.00Business Cards - KIM, JIM, JAN 153 11/18/2014 270.00 990.00
Period Totals 270.00 0.00 990.00
8020.00 Utilities Balance Forward 1,777.10Lincoln Electric Systems 148 11/11/2014 125.89 1,902.99Lincoln Water & Waste 152 11/14/2014 150.00 2,052.99
Period Totals 275.89 0.00 2,052.99
8040.00 Office Supplies Balance Forward 1,312.78ABC Office Supplies 154 11/21/2014 152.36 1,465.14
Period Totals 152.36 0.00 1,465.14
8060.00 Office Equipment Lease Balance Forward 3,500.00Equipment Lease 151 11/13/2014 600.00 4,100.00Equipment Lease 155 11/28/2014 110.00 4,210.00
Period Totals 710.00 0.00 4,210.00
8090.00 Telephone Balance Forward 7,390.09Lincoln Telephone Company 154 11/21/2014 756.55 8,146.64
Period Totals 756.55 0.00 8,146.64
8100.00 Internet/Online Charges Balance Forward 950.00Eastern Nebraska Cable Company 154 11/21/2014 95.00 1,045.00
Period Totals 95.00 0.00 1,045.00
8120.00 Postage Balance Forward 3,500.00Postage 148 11/11/2014 250.00 3,750.00
Period Totals 250.00 0.00 3,750.00
8150.00 Payroll Services Balance Forward 650.00Payroll Service 157 11/26/2014 65.00 715.00
Period Totals 65.00 0.00 715.00
8170.00 Interest Expense Balance Forward 7,419.33Interest Expense on Bank Loan 156 11/26/2014 612.26 8,031.59
Period Totals 612.26 0.00 8,031.59
Total Debits and Credits: 129,374.05 129,374.05
Gain (Loss) Posted to 3310.00 Current Year Retained Earnings: -60,526.88
Date: 11/17/2014 General Ledger Report Page: 1Jensen, Martin & Anderson
From 11/01/2014 Thru 11/30/2014Department: 0 to 99
Account # DP Description Trans # JR Date Reference Check # Src Debit Credit Net Change Balance
1130.00 0 Payroll Balance Forward 10,000.00Paycheck Jimmy Praum 147 4 11/11/2014 Payroll 23328 M 1,647.00 8,353.00Payroll Deposit 157 4 11/26/2014 M 32,026.96 40,379.96Payroll - November 157 4 11/26/2014 M 32,026.96 8,353.00
Period Totals 32,026.96 33,673.96 -1,647.00 8,353.00
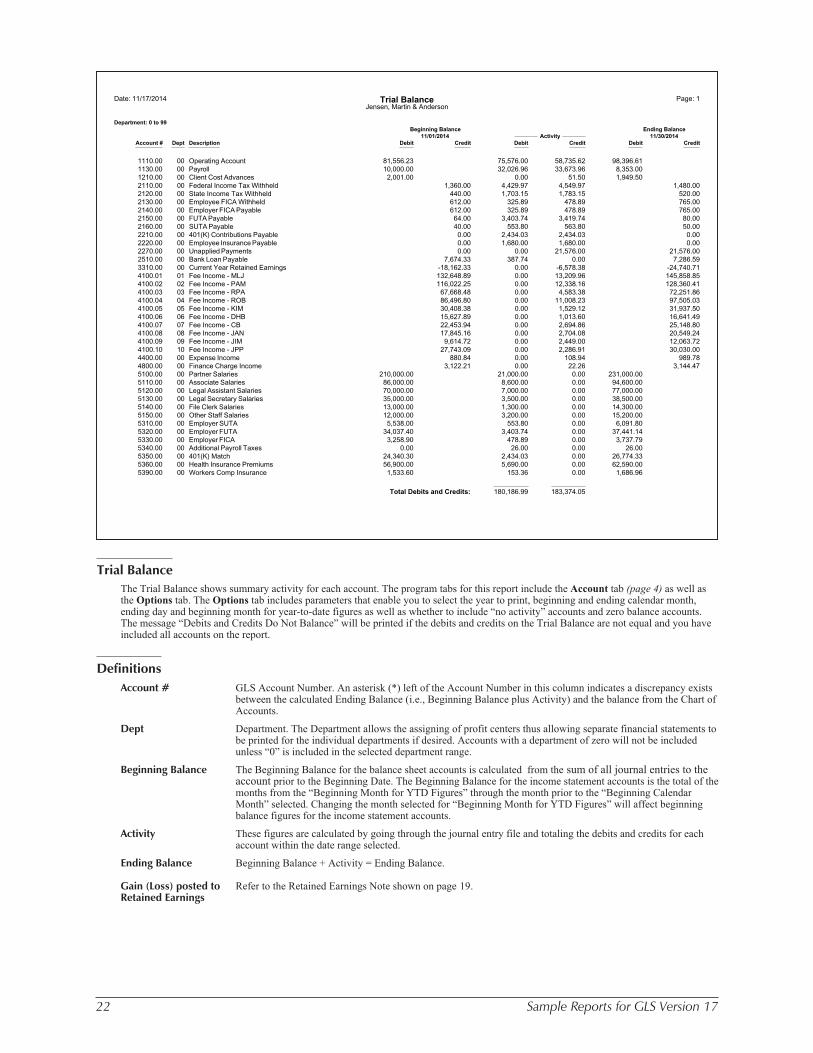
22 Sample Reports for GLS Version 17
Date: 11/17/2014 Trial Balance Page: 1Jensen, Martin & Anderson
Department: 0 to 99Beginning Balance Ending Balance
11/01/2014 Activity 11/30/2014Account # Dept Description Debit Credit Debit Credit Debit Credit
81,556.23 98,396.611110.00 00 Operating Account 75,576.00 58,735.6210,000.00 8,353.001130.00 00 Payroll 32,026.96 33,673.962,001.00 1,949.501210.00 00 Client Cost Advances 0.00 51.50
1,360.00 1,480.002110.00 00 Federal Income Tax Withheld 4,429.97 4,549.97440.00 520.002120.00 00 State Income Tax Withheld 1,703.15 1,783.15612.00 765.002130.00 00 Employee FICA Withheld 325.89 478.89612.00 765.002140.00 00 Employer FICA Payable 325.89 478.8964.00 80.002150.00 00 FUTA Payable 3,403.74 3,419.7440.00 50.002160.00 00 SUTA Payable 553.80 563.800.00 0.002210.00 00 401(K) Contributions Payable 2,434.03 2,434.030.00 0.002220.00 00 Employee Insurance Payable 1,680.00 1,680.000.00 21,576.002270.00 00 Unapplied Payments 0.00 21,576.00
7,674.33 7,286.592510.00 00 Bank Loan Payable 387.74 0.00-18,162.33 -24,740.713310.00 00 Current Year Retained Earnings 0.00 -6,578.38132,648.89 145,858.854100.01 01 Fee Income - MLJ 0.00 13,209.96116,022.25 128,360.414100.02 02 Fee Income - PAM 0.00 12,338.1667,668.48 72,251.864100.03 03 Fee Income - RPA 0.00 4,583.3886,496.80 97,505.034100.04 04 Fee Income - ROB 0.00 11,008.2330,408.38 31,937.504100.05 05 Fee Income - KIM 0.00 1,529.1215,627.89 16,641.494100.06 06 Fee Income - DHB 0.00 1,013.6022,453.94 25,148.804100.07 07 Fee Income - CB 0.00 2,694.8617,845.16 20,549.244100.08 08 Fee Income - JAN 0.00 2,704.089,614.72 12,063.724100.09 09 Fee Income - JIM 0.00 2,449.00
27,743.09 30,030.004100.10 10 Fee Income - JPP 0.00 2,286.91880.84 989.784400.00 00 Expense Income 0.00 108.94
3,122.21 3,144.474800.00 00 Finance Charge Income 0.00 22.26210,000.00 231,000.005100.00 00 Partner Salaries 21,000.00 0.0086,000.00 94,600.005110.00 00 Associate Salaries 8,600.00 0.0070,000.00 77,000.005120.00 00 Legal Assistant Salaries 7,000.00 0.0035,000.00 38,500.005130.00 00 Legal Secretary Salaries 3,500.00 0.0013,000.00 14,300.005140.00 00 File Clerk Salaries 1,300.00 0.0012,000.00 15,200.005150.00 00 Other Staff Salaries 3,200.00 0.005,538.00 6,091.805310.00 00 Employer SUTA 553.80 0.00
34,037.40 37,441.145320.00 00 Employer FUTA 3,403.74 0.003,258.90 3,737.795330.00 00 Employer FICA 478.89 0.00
0.00 26.005340.00 00 Additional Payroll Taxes 26.00 0.0024,340.30 26,774.335350.00 00 401(K) Match 2,434.03 0.0056,900.00 62,590.005360.00 00 Health Insurance Premiums 5,690.00 0.001,533.60 1,686.965390.00 00 Workers Comp Insurance 153.36 0.00
Total Debits and Credits: 180,186.99 183,374.05
Trial Balance
The Trial Balance shows summary activity for each account. The program tabs for this report include the Account tab (page 4) as well asthe Options tab. The Options tab includes parameters that enable you to select the year to print, beginning and ending calendar month,ending day and beginning month for year-to-date figures as well as whether to include “no activity” accounts and zero balance accounts.The message “Debits and Credits Do Not Balance” will be printed if the debits and credits on the Trial Balance are not equal and you haveincluded all accounts on the report.
Definitions
Account # GLS Account Number. An asterisk (*) left of the Account Number in this column indicates a discrepancy existsbetween the calculated Ending Balance (i.e., Beginning Balance plus Activity) and the balance from the Chart ofAccounts.
Dept Department. The Department allows the assigning of profit centers thus allowing separate financial statements tobe printed for the individual departments if desired. Accounts with a department of zero will not be includedunless “0” is included in the selected department range.
Beginning Balance The Beginning Balance for the balance sheet accounts is calculated from the sum of all journal entries to theaccount prior to the Beginning Date. The Beginning Balance for the income statement accounts is the total of themonths from the “Beginning Month for YTD Figures” through the month prior to the “Beginning CalendarMonth” selected. Changing the month selected for “Beginning Month for YTD Figures” will affect beginningbalance figures for the income statement accounts.
Activity These figures are calculated by going through the journal entry file and totaling the debits and credits for eachaccount within the date range selected.
Ending Balance Beginning Balance + Activity = Ending Balance.
Gain (Loss) posted toRetained Earnings
Refer to the Retained Earnings Note shown on page 19.

Sample Reports for GLS Version 17 23
Financial Statements OverviewGLS offers you flexibility with numerousoptions for printing the financialstatements—the Balance Sheet and theIncome Statement. There are hundreds offormats possible when combining all of thedifferent options. The following samplefinancial statements portray some of theoptions available in GLS.
The ability to use multiple departments(profit centers) allows each financialstatement to be printed by individualdepartment or as a combined statement of alldepartments. Examples of departmentalizedfinancial statements can be seen later in thissection.
Much of the flexibility in printing yourfinancial statements is due to the userdefined chart of accounts. A detail orsummary financial statement can be printed.The detail financial statement includes allaccounts. The summary financial statementtypically includes header, total and commentaccounts only—detail accounts can beexcluded. The Report Options tab inAccount Setup allows you to definewhether an account will be printed on adetail and/or summary report. This givesyou flexibility in selecting which accounts
you want to print or not print on the detailand summary financial statements. You canalso define the number of blank lines aftertotal accounts and before heading accounts,the type of underscore desired (if any at all),and where the page breaks occur.
Options to include zero balance accounts, toprint account numbers, and to include centsand/or commas on the financial statementsare offered.
The Balance Sheet can include currentbalance, last month’s balance, last year’sbalance, and the amount of change alongwith percentages.
The Income Statement can includemonth-to-date figures, quarter-to-datefigures, year-to-date figures, and can alsoinclude budget figures, budget variance,annual budget figures, percentages, and lastyear comparison figures.
All financial statements can be printed inportrait or landscape orientation, displayedon the screen, or saved to a file. Saving thereport to a file enables you to edit the filewith a word processing program before
printing it or possibly use it withanother software program.
Rounding Note: If you configure areport not to print cents, individualamounts may not add up to the total onthe report because of rounding. Forexample, 1.50 + 1.50 equals 3.00.However, if you elect to not printcents, GLS will print 2 + 2 = 3. Whencalculating a total, GLS adds the entireamount including cents and thenrounds the total.
Options Tab for the Balance Sheet Options Tab for the Income Statement
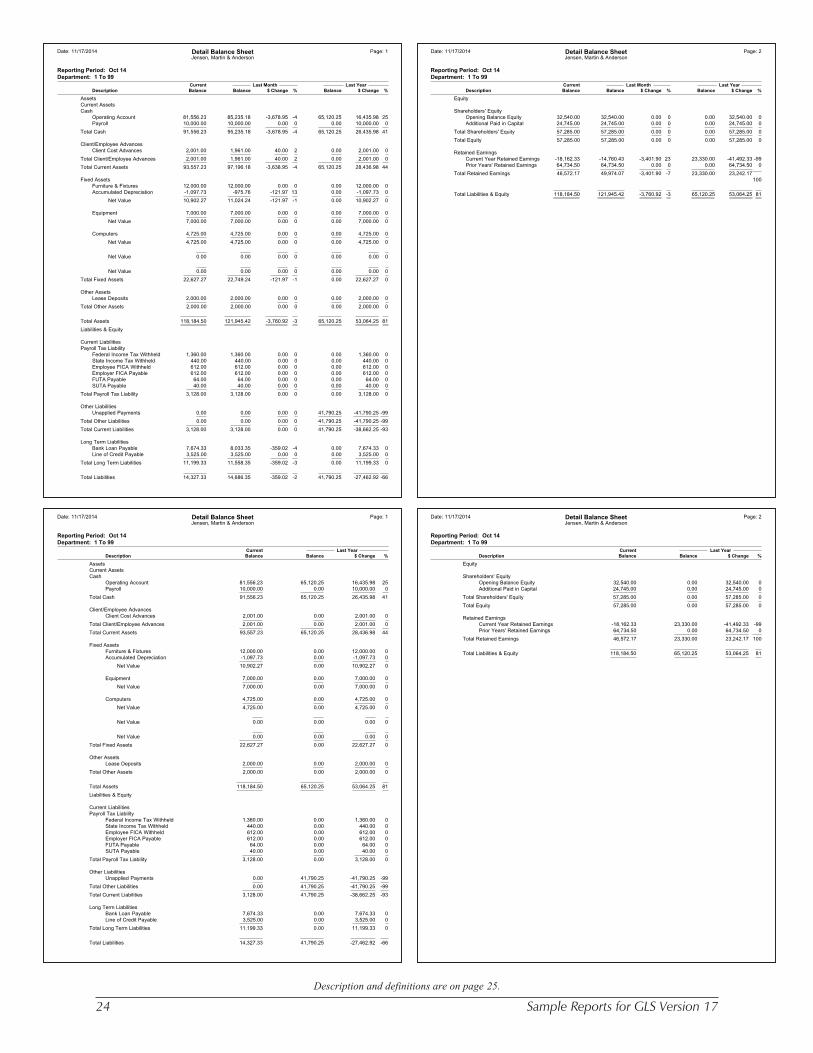
24 Sample Reports for GLS Version 17
Description and definitions are on page 25.
Date: 11/17/2014 Detail Balance Sheet Page: 1Jensen, Martin & Anderson
Reporting Period: Oct 14Department: 1 To 99
Current Last Month Last YearDescription Balance Balance $ Change % Balance $ Change %
AssetsCurrent AssetsCash
Operating Account 81,556.23 85,235.18 -3,678.95 -4 65,120.25 16,435.98 25Payroll 10,000.00 10,000.00 0.00 0 0.00 10,000.00 0
Total Cash 91,556.23 95,235.18 -3,678.95 -4 65,120.25 26,435.98 41
Client/Employee AdvancesClient Cost Advances 2,001.00 1,961.00 40.00 2 0.00 2,001.00 0
Total Client/Employee Advances 2,001.00 1,961.00 40.00 2 0.00 2,001.00 0
Total Current Assets 93,557.23 97,196.18 -3,638.95 -4 65,120.25 28,436.98 44
Fixed AssetsFurniture & Fixtures 12,000.00 12,000.00 0.00 0 0.00 12,000.00 0Accumulated Depreciation -1,097.73 -975.76 -121.97 13 0.00 -1,097.73 0
Net Value 10,902.27 11,024.24 -121.97 -1 0.00 10,902.27 0
Equipment 7,000.00 7,000.00 0.00 0 0.00 7,000.00 0
Net Value 7,000.00 7,000.00 0.00 0 0.00 7,000.00 0
Computers 4,725.00 4,725.00 0.00 0 0.00 4,725.00 0
Net Value 4,725.00 4,725.00 0.00 0 0.00 4,725.00 0
Net Value 0.00 0.00 0.00 0 0.00 0.00 0
Net Value 0.00 0.00 0.00 0 0.00 0.00 0
Total Fixed Assets 22,627.27 22,749.24 -121.97 -1 0.00 22,627.27 0
Other AssetsLease Deposits 2,000.00 2,000.00 0.00 0 0.00 2,000.00 0
Total Other Assets 2,000.00 2,000.00 0.00 0 0.00 2,000.00 0
Total Assets 118,184.50 121,945.42 -3,760.92 -3 65,120.25 53,064.25 81
Liabilities & Equity
Current LiabilitiesPayroll Tax Liability
Federal Income Tax Withheld 1,360.00 1,360.00 0.00 0 0.00 1,360.00 0State Income Tax Withheld 440.00 440.00 0.00 0 0.00 440.00 0Employee FICA Withheld 612.00 612.00 0.00 0 0.00 612.00 0Employer FICA Payable 612.00 612.00 0.00 0 0.00 612.00 0FUTA Payable 64.00 64.00 0.00 0 0.00 64.00 0SUTA Payable 40.00 40.00 0.00 0 0.00 40.00 0
Total Payroll Tax Liability 3,128.00 3,128.00 0.00 0 0.00 3,128.00 0
Other LiabilitiesUnapplied Payments 0.00 0.00 0.00 0 41,790.25 -41,790.25 -99
Total Other Liabilities 0.00 0.00 0.00 0 41,790.25 -41,790.25 -99
Total Current Liabilities 3,128.00 3,128.00 0.00 0 41,790.25 -38,662.25 -93
Long Term LiabilitiesBank Loan Payable 7,674.33 8,033.35 -359.02 -4 0.00 7,674.33 0Line of Credit Payable 3,525.00 3,525.00 0.00 0 0.00 3,525.00 0
Total Long Term Liabilities 11,199.33 11,558.35 -359.02 -3 0.00 11,199.33 0
Total Liabilities 14,327.33 14,686.35 -359.02 -2 41,790.25 -27,462.92 -66
Date: 11/17/2014 Detail Balance Sheet Page: 2Jensen, Martin & Anderson
Reporting Period: Oct 14Department: 1 To 99
Current Last Month Last YearDescription Balance Balance $ Change % Balance $ Change %
Equity
Shareholders' EquityOpening Balance Equity 32,540.00 32,540.00 0.00 0 0.00 32,540.00 0Additional Paid in Capital 24,745.00 24,745.00 0.00 0 0.00 24,745.00 0
Total Shareholders' Equity 57,285.00 57,285.00 0.00 0 0.00 57,285.00 0
Total Equity 57,285.00 57,285.00 0.00 0 0.00 57,285.00 0
Retained EarningsCurrent Year Retained Earnings -18,162.33 -14,760.43 -3,401.90 23 23,330.00 -41,492.33 -99Prior Years' Retained Earnings 64,734.50 64,734.50 0.00 0 0.00 64,734.50 0
Total Retained Earnings 46,572.17 49,974.07 -3,401.90 -7 23,330.00 23,242.17100
Total Liabilities & Equity 118,184.50 121,945.42 -3,760.92 -3 65,120.25 53,064.25 81
Date: 11/17/2014 Detail Balance Sheet Page: 1Jensen, Martin & Anderson
Reporting Period: Oct 14Department: 1 To 99
Current Last YearDescription Balance Balance $ Change %
AssetsCurrent AssetsCash
Operating Account 81,556.23 65,120.25 16,435.98 25Payroll 10,000.00 0.00 10,000.00 0
Total Cash 91,556.23 65,120.25 26,435.98 41
Client/Employee AdvancesClient Cost Advances 2,001.00 0.00 2,001.00 0
Total Client/Employee Advances 2,001.00 0.00 2,001.00 0
Total Current Assets 93,557.23 65,120.25 28,436.98 44
Fixed AssetsFurniture & Fixtures 12,000.00 0.00 12,000.00 0Accumulated Depreciation -1,097.73 0.00 -1,097.73 0
Net Value 10,902.27 0.00 10,902.27 0
Equipment 7,000.00 0.00 7,000.00 0
Net Value 7,000.00 0.00 7,000.00 0
Computers 4,725.00 0.00 4,725.00 0
Net Value 4,725.00 0.00 4,725.00 0
Net Value 0.00 0.00 0.00 0
Net Value 0.00 0.00 0.00 0
Total Fixed Assets 22,627.27 0.00 22,627.27 0
Other AssetsLease Deposits 2,000.00 0.00 2,000.00 0
Total Other Assets 2,000.00 0.00 2,000.00 0
Total Assets 118,184.50 65,120.25 53,064.25 81
Liabilities & Equity
Current LiabilitiesPayroll Tax Liability
Federal Income Tax Withheld 1,360.00 0.00 1,360.00 0State Income Tax Withheld 440.00 0.00 440.00 0Employee FICA Withheld 612.00 0.00 612.00 0Employer FICA Payable 612.00 0.00 612.00 0FUTA Payable 64.00 0.00 64.00 0SUTA Payable 40.00 0.00 40.00 0
Total Payroll Tax Liability 3,128.00 0.00 3,128.00 0
Other LiabilitiesUnapplied Payments 0.00 41,790.25 -41,790.25 -99
Total Other Liabilities 0.00 41,790.25 -41,790.25 -99
Total Current Liabilities 3,128.00 41,790.25 -38,662.25 -93
Long Term LiabilitiesBank Loan Payable 7,674.33 0.00 7,674.33 0Line of Credit Payable 3,525.00 0.00 3,525.00 0
Total Long Term Liabilities 11,199.33 0.00 11,199.33 0
Total Liabilities 14,327.33 41,790.25 -27,462.92 -66
Date: 11/17/2014 Detail Balance Sheet Page: 2Jensen, Martin & Anderson
Reporting Period: Oct 14Department: 1 To 99
Current Last YearDescription Balance Balance $ Change %
Equity
Shareholders' EquityOpening Balance Equity 32,540.00 0.00 32,540.00 0Additional Paid in Capital 24,745.00 0.00 24,745.00 0
Total Shareholders' Equity 57,285.00 0.00 57,285.00 0
Total Equity 57,285.00 0.00 57,285.00 0
Retained EarningsCurrent Year Retained Earnings -18,162.33 23,330.00 -41,492.33 -99Prior Years' Retained Earnings 64,734.50 0.00 64,734.50 0
Total Retained Earnings 46,572.17 23,330.00 23,242.17 100
Total Liabilities & Equity 118,184.50 65,120.25 53,064.25 81
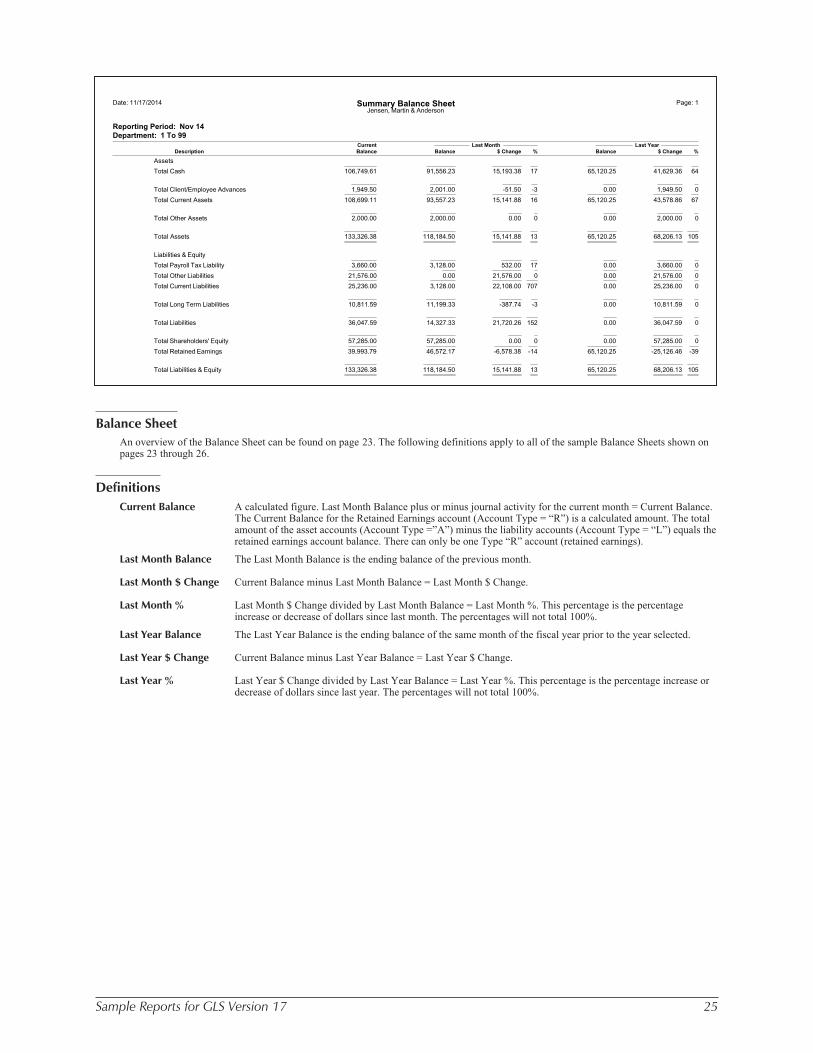
Sample Reports for GLS Version 17 25
Balance Sheet
An overview of the Balance Sheet can be found on page 23. The following definitions apply to all of the sample Balance Sheets shown onpages 23 through 26.
Definitions
Current Balance A calculated figure. Last Month Balance plus or minus journal activity for the current month = Current Balance.The Current Balance for the Retained Earnings account (Account Type = “R”) is a calculated amount. The totalamount of the asset accounts (Account Type =”A”) minus the liability accounts (Account Type = “L”) equals theretained earnings account balance. There can only be one Type “R” account (retained earnings).
Last Month Balance The Last Month Balance is the ending balance of the previous month.
Last Month $ Change Current Balance minus Last Month Balance = Last Month $ Change.
Last Month % Last Month $ Change divided by Last Month Balance = Last Month %. This percentage is the percentageincrease or decrease of dollars since last month. The percentages will not total 100%.
Last Year Balance The Last Year Balance is the ending balance of the same month of the fiscal year prior to the year selected.
Last Year $ Change Current Balance minus Last Year Balance = Last Year $ Change.
Last Year % Last Year $ Change divided by Last Year Balance = Last Year %. This percentage is the percentage increase ordecrease of dollars since last year. The percentages will not total 100%.
Date: 11/17/2014 Summary Balance Sheet Page: 1Jensen, Martin & Anderson
Reporting Period: Nov 14Department: 1 To 99
Current Last Month Last YearDescription Balance Balance $ Change % Balance $ Change %
Assets
Total Cash 106,749.61 91,556.23 15,193.38 17 65,120.25 41,629.36 64
Total Client/Employee Advances 1,949.50 2,001.00 -51.50 -3 0.00 1,949.50 0
Total Current Assets 108,699.11 93,557.23 15,141.88 16 65,120.25 43,578.86 67
Total Other Assets 2,000.00 2,000.00 0.00 0 0.00 2,000.00 0
Total Assets 133,326.38 118,184.50 15,141.88 13 65,120.25 68,206.13 105
Liabilities & Equity
Total Payroll Tax Liability 3,660.00 3,128.00 532.00 17 0.00 3,660.00 0
Total Other Liabilities 21,576.00 0.00 21,576.00 0 0.00 21,576.00 0
Total Current Liabilities 25,236.00 3,128.00 22,108.00 707 0.00 25,236.00 0
Total Long Term Liabilities 10,811.59 11,199.33 -387.74 -3 0.00 10,811.59 0
Total Liabilities 36,047.59 14,327.33 21,720.26 152 0.00 36,047.59 0
Total Shareholders' Equity 57,285.00 57,285.00 0.00 0 0.00 57,285.00 0
Total Retained Earnings 39,993.79 46,572.17 -6,578.38 -14 65,120.25 -25,126.46 -39
Total Liabilities & Equity 133,326.38 118,184.50 15,141.88 13 65,120.25 68,206.13 105
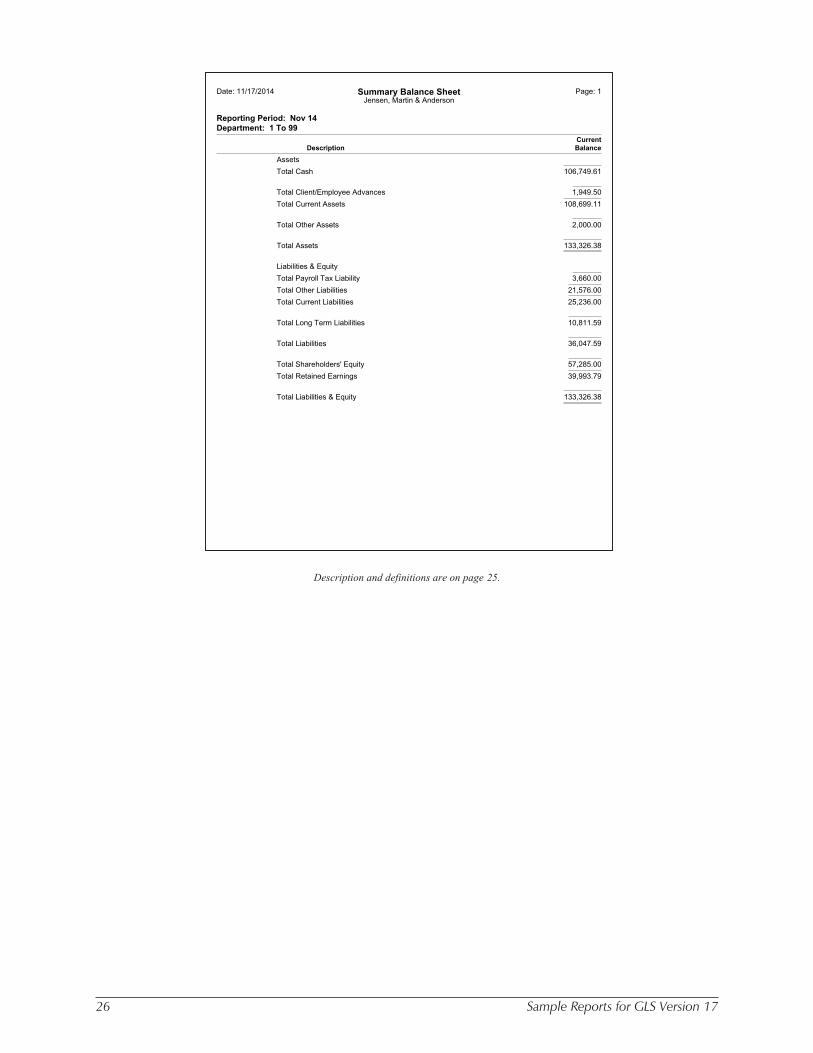
26 Sample Reports for GLS Version 17
Description and definitions are on page 25.
Date: 11/17/2014 Summary Balance Sheet Page: 1Jensen, Martin & Anderson
Reporting Period: Nov 14Department: 1 To 99
CurrentDescription Balance
Assets
Total Cash 106,749.61
Total Client/Employee Advances 1,949.50
Total Current Assets 108,699.11
Total Other Assets 2,000.00
Total Assets 133,326.38
Liabilities & Equity
Total Payroll Tax Liability 3,660.00
Total Other Liabilities 21,576.00
Total Current Liabilities 25,236.00
Total Long Term Liabilities 10,811.59
Total Liabilities 36,047.59
Total Shareholders' Equity 57,285.00
Total Retained Earnings 39,993.79
Total Liabilities & Equity 133,326.38
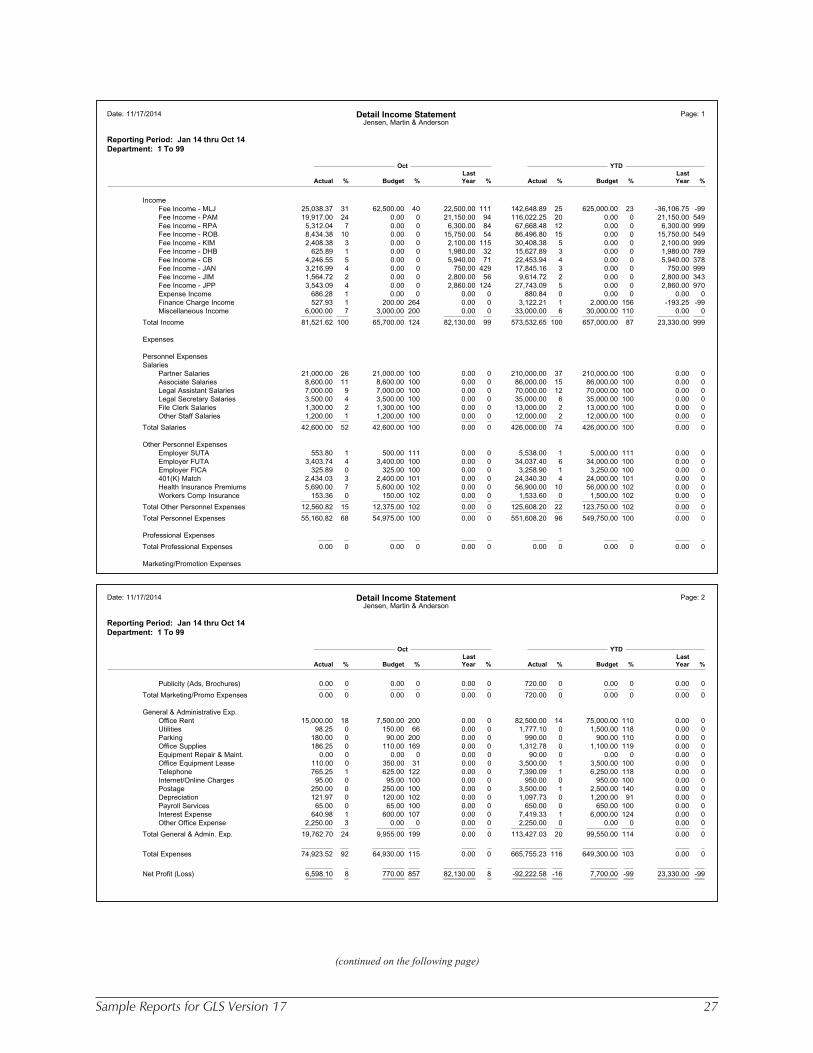
Sample Reports for GLS Version 17 27
(continued on the following page)
Date: 11/17/2014 Detail Income Statement Page: 1Jensen, Martin & Anderson
Reporting Period: Jan 14 thru Oct 14Department: 1 To 99
Oct YTDLast Last
Actual % Budget % Year % Actual % Budget % Year %
IncomeFee Income - MLJ 25,038.37 31 62,500.00 40 22,500.00 111 142,648.89 25 625,000.00 23 -36,106.75 -99Fee Income - PAM 19,917.00 24 0.00 0 21,150.00 94 116,022.25 20 0.00 0 21,150.00 549Fee Income - RPA 5,312.04 7 0.00 0 6,300.00 84 67,668.48 12 0.00 0 6,300.00 999Fee Income - ROB 8,434.38 10 0.00 0 15,750.00 54 86,496.80 15 0.00 0 15,750.00 549Fee Income - KIM 2,408.38 3 0.00 0 2,100.00 115 30,408.38 5 0.00 0 2,100.00 999Fee Income - DHB 625.89 1 0.00 0 1,980.00 32 15,627.89 3 0.00 0 1,980.00 789Fee Income - CB 4,246.55 5 0.00 0 5,940.00 71 22,453.94 4 0.00 0 5,940.00 378Fee Income - JAN 3,216.99 4 0.00 0 750.00 429 17,845.16 3 0.00 0 750.00 999Fee Income - JIM 1,564.72 2 0.00 0 2,800.00 56 9,614.72 2 0.00 0 2,800.00 343Fee Income - JPP 3,543.09 4 0.00 0 2,860.00 124 27,743.09 5 0.00 0 2,860.00 970Expense Income 686.28 1 0.00 0 0.00 0 880.84 0 0.00 0 0.00 0Finance Charge Income 527.93 1 200.00 264 0.00 0 3,122.21 1 2,000.00 156 -193.25 -99Miscellaneous Income 6,000.00 7 3,000.00 200 0.00 0 33,000.00 6 30,000.00 110 0.00 0
Total Income 81,521.62 100 65,700.00 124 82,130.00 99 573,532.65 100 657,000.00 87 23,330.00 999
Expenses
Personnel ExpensesSalaries
Partner Salaries 21,000.00 26 21,000.00 100 0.00 0 210,000.00 37 210,000.00 100 0.00 0Associate Salaries 8,600.00 11 8,600.00 100 0.00 0 86,000.00 15 86,000.00 100 0.00 0Legal Assistant Salaries 7,000.00 9 7,000.00 100 0.00 0 70,000.00 12 70,000.00 100 0.00 0Legal Secretary Salaries 3,500.00 4 3,500.00 100 0.00 0 35,000.00 6 35,000.00 100 0.00 0File Clerk Salaries 1,300.00 2 1,300.00 100 0.00 0 13,000.00 2 13,000.00 100 0.00 0Other Staff Salaries 1,200.00 1 1,200.00 100 0.00 0 12,000.00 2 12,000.00 100 0.00 0
Total Salaries 42,600.00 52 42,600.00 100 0.00 0 426,000.00 74 426,000.00 100 0.00 0
Other Personnel ExpensesEmployer SUTA 553.80 1 500.00 111 0.00 0 5,538.00 1 5,000.00 111 0.00 0Employer FUTA 3,403.74 4 3,400.00 100 0.00 0 34,037.40 6 34,000.00 100 0.00 0Employer FICA 325.89 0 325.00 100 0.00 0 3,258.90 1 3,250.00 100 0.00 0401(K) Match 2,434.03 3 2,400.00 101 0.00 0 24,340.30 4 24,000.00 101 0.00 0Health Insurance Premiums 5,690.00 7 5,600.00 102 0.00 0 56,900.00 10 56,000.00 102 0.00 0Workers Comp Insurance 153.36 0 150.00 102 0.00 0 1,533.60 0 1,500.00 102 0.00 0
Total Other Personnel Expenses 12,560.82 15 12,375.00 102 0.00 0 125,608.20 22 123,750.00 102 0.00 0
Total Personnel Expenses 55,160.82 68 54,975.00 100 0.00 0 551,608.20 96 549,750.00 100 0.00 0
Professional Expenses
Total Professional Expenses 0.00 0 0.00 0 0.00 0 0.00 0 0.00 0 0.00 0
Marketing/Promotion Expenses
Date: 11/17/2014 Detail Income Statement Page: 2Jensen, Martin & Anderson
Reporting Period: Jan 14 thru Oct 14Department: 1 To 99
Oct YTDLast Last
Actual % Budget % Year % Actual % Budget % Year %
Publicity (Ads, Brochures) 0.00 0 0.00 0 0.00 0 720.00 0 0.00 0 0.00 0
Total Marketing/Promo Expenses 0.00 0 0.00 0 0.00 0 720.00 0 0.00 0 0.00 0
General & Administrative Exp.Office Rent 15,000.00 18 7,500.00 200 0.00 0 82,500.00 14 75,000.00 110 0.00 0Utilities 98.25 0 150.00 66 0.00 0 1,777.10 0 1,500.00 118 0.00 0Parking 180.00 0 90.00 200 0.00 0 990.00 0 900.00 110 0.00 0Office Supplies 186.25 0 110.00 169 0.00 0 1,312.78 0 1,100.00 119 0.00 0Equipment Repair & Maint. 0.00 0 0.00 0 0.00 0 90.00 0 0.00 0 0.00 0Office Equipment Lease 110.00 0 350.00 31 0.00 0 3,500.00 1 3,500.00 100 0.00 0Telephone 765.25 1 625.00 122 0.00 0 7,390.09 1 6,250.00 118 0.00 0Internet/Online Charges 95.00 0 95.00 100 0.00 0 950.00 0 950.00 100 0.00 0Postage 250.00 0 250.00 100 0.00 0 3,500.00 1 2,500.00 140 0.00 0Depreciation 121.97 0 120.00 102 0.00 0 1,097.73 0 1,200.00 91 0.00 0Payroll Services 65.00 0 65.00 100 0.00 0 650.00 0 650.00 100 0.00 0Interest Expense 640.98 1 600.00 107 0.00 0 7,419.33 1 6,000.00 124 0.00 0Other Office Expense 2,250.00 3 0.00 0 0.00 0 2,250.00 0 0.00 0 0.00 0
Total General & Admin. Exp. 19,762.70 24 9,955.00 199 0.00 0 113,427.03 20 99,550.00 114 0.00 0
Total Expenses 74,923.52 92 64,930.00 115 0.00 0 665,755.23 116 649,300.00 103 0.00 0
Net Profit (Loss) 6,598.10 8 770.00 857 82,130.00 8 -92,222.58 -16 7,700.00 -99 23,330.00 -99
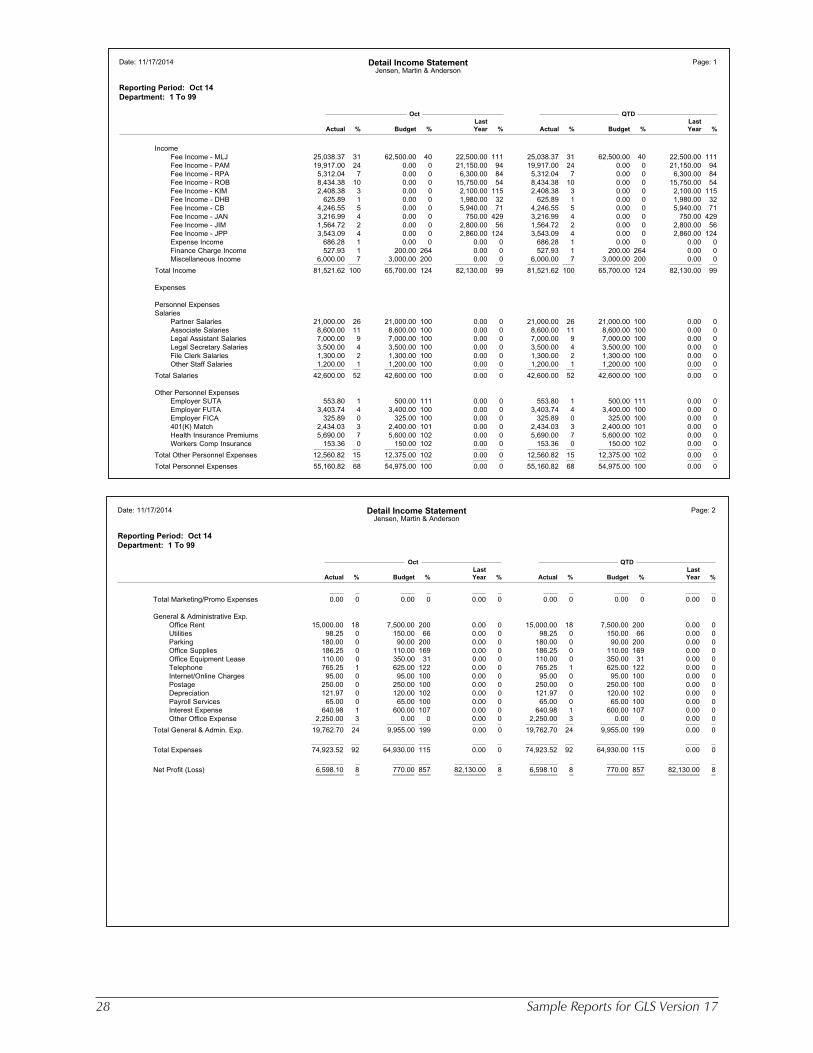
28 Sample Reports for GLS Version 17
Date: 11/17/2014 Detail Income Statement Page: 1Jensen, Martin & Anderson
Reporting Period: Oct 14Department: 1 To 99
Oct QTDLast Last
Actual % Budget % Year % Actual % Budget % Year %
IncomeFee Income - MLJ 25,038.37 31 62,500.00 40 22,500.00 111 25,038.37 31 62,500.00 40 22,500.00 111Fee Income - PAM 19,917.00 24 0.00 0 21,150.00 94 19,917.00 24 0.00 0 21,150.00 94Fee Income - RPA 5,312.04 7 0.00 0 6,300.00 84 5,312.04 7 0.00 0 6,300.00 84Fee Income - ROB 8,434.38 10 0.00 0 15,750.00 54 8,434.38 10 0.00 0 15,750.00 54Fee Income - KIM 2,408.38 3 0.00 0 2,100.00 115 2,408.38 3 0.00 0 2,100.00 115Fee Income - DHB 625.89 1 0.00 0 1,980.00 32 625.89 1 0.00 0 1,980.00 32Fee Income - CB 4,246.55 5 0.00 0 5,940.00 71 4,246.55 5 0.00 0 5,940.00 71Fee Income - JAN 3,216.99 4 0.00 0 750.00 429 3,216.99 4 0.00 0 750.00 429Fee Income - JIM 1,564.72 2 0.00 0 2,800.00 56 1,564.72 2 0.00 0 2,800.00 56Fee Income - JPP 3,543.09 4 0.00 0 2,860.00 124 3,543.09 4 0.00 0 2,860.00 124Expense Income 686.28 1 0.00 0 0.00 0 686.28 1 0.00 0 0.00 0Finance Charge Income 527.93 1 200.00 264 0.00 0 527.93 1 200.00 264 0.00 0Miscellaneous Income 6,000.00 7 3,000.00 200 0.00 0 6,000.00 7 3,000.00 200 0.00 0
Total Income 81,521.62 100 65,700.00 124 82,130.00 99 81,521.62 100 65,700.00 124 82,130.00 99
Expenses
Personnel ExpensesSalaries
Partner Salaries 21,000.00 26 21,000.00 100 0.00 0 21,000.00 26 21,000.00 100 0.00 0Associate Salaries 8,600.00 11 8,600.00 100 0.00 0 8,600.00 11 8,600.00 100 0.00 0Legal Assistant Salaries 7,000.00 9 7,000.00 100 0.00 0 7,000.00 9 7,000.00 100 0.00 0Legal Secretary Salaries 3,500.00 4 3,500.00 100 0.00 0 3,500.00 4 3,500.00 100 0.00 0File Clerk Salaries 1,300.00 2 1,300.00 100 0.00 0 1,300.00 2 1,300.00 100 0.00 0Other Staff Salaries 1,200.00 1 1,200.00 100 0.00 0 1,200.00 1 1,200.00 100 0.00 0
Total Salaries 42,600.00 52 42,600.00 100 0.00 0 42,600.00 52 42,600.00 100 0.00 0
Other Personnel ExpensesEmployer SUTA 553.80 1 500.00 111 0.00 0 553.80 1 500.00 111 0.00 0Employer FUTA 3,403.74 4 3,400.00 100 0.00 0 3,403.74 4 3,400.00 100 0.00 0Employer FICA 325.89 0 325.00 100 0.00 0 325.89 0 325.00 100 0.00 0401(K) Match 2,434.03 3 2,400.00 101 0.00 0 2,434.03 3 2,400.00 101 0.00 0Health Insurance Premiums 5,690.00 7 5,600.00 102 0.00 0 5,690.00 7 5,600.00 102 0.00 0Workers Comp Insurance 153.36 0 150.00 102 0.00 0 153.36 0 150.00 102 0.00 0
Total Other Personnel Expenses 12,560.82 15 12,375.00 102 0.00 0 12,560.82 15 12,375.00 102 0.00 0
Total Personnel Expenses 55,160.82 68 54,975.00 100 0.00 0 55,160.82 68 54,975.00 100 0.00 0
Date: 11/17/2014 Detail Income Statement Page: 2Jensen, Martin & Anderson
Reporting Period: Oct 14Department: 1 To 99
Oct QTDLast Last
Actual % Budget % Year % Actual % Budget % Year %
Total Marketing/Promo Expenses 0.00 0 0.00 0 0.00 0 0.00 0 0.00 0 0.00 0
General & Administrative Exp.Office Rent 15,000.00 18 7,500.00 200 0.00 0 15,000.00 18 7,500.00 200 0.00 0Utilities 98.25 0 150.00 66 0.00 0 98.25 0 150.00 66 0.00 0Parking 180.00 0 90.00 200 0.00 0 180.00 0 90.00 200 0.00 0Office Supplies 186.25 0 110.00 169 0.00 0 186.25 0 110.00 169 0.00 0Office Equipment Lease 110.00 0 350.00 31 0.00 0 110.00 0 350.00 31 0.00 0Telephone 765.25 1 625.00 122 0.00 0 765.25 1 625.00 122 0.00 0Internet/Online Charges 95.00 0 95.00 100 0.00 0 95.00 0 95.00 100 0.00 0Postage 250.00 0 250.00 100 0.00 0 250.00 0 250.00 100 0.00 0Depreciation 121.97 0 120.00 102 0.00 0 121.97 0 120.00 102 0.00 0Payroll Services 65.00 0 65.00 100 0.00 0 65.00 0 65.00 100 0.00 0Interest Expense 640.98 1 600.00 107 0.00 0 640.98 1 600.00 107 0.00 0Other Office Expense 2,250.00 3 0.00 0 0.00 0 2,250.00 3 0.00 0 0.00 0
Total General & Admin. Exp. 19,762.70 24 9,955.00 199 0.00 0 19,762.70 24 9,955.00 199 0.00 0
Total Expenses 74,923.52 92 64,930.00 115 0.00 0 74,923.52 92 64,930.00 115 0.00 0
Net Profit (Loss) 6,598.10 8 770.00 857 82,130.00 8 6,598.10 8 770.00 857 82,130.00 8

Sample Reports for GLS Version 17 29
Income Statement
An overview of the Income Statement can be found on page 23. The following definitions apply to all of the sample Income Statementsshown on the subsequent pages. The columns that appear on the Income Statement are determined by the parameters selected when theIncome Statement is processed.
Definitions
MTD Actual Month-to-Date Actual. Total amount incurred for the month only.
MTD Actual % Month-to-Date percentage comparison to Total Income or [Total Expenses + Profit (Loss)].Income/Expense Account MTD Actual divided by Total Income or [Total Expenses + Profit (Loss)] = MTDActual %.
MTD Budget Month-to-Date Budget. Amount budgeted for the month only.
MTD Budget % Month-to-Date Budget Percentage. Percentage comparison to budget.MTD Actual divided by MTD Budget = MTD Budget %.
MTD Variance MTD Actual minus MTD Budget = MTD Variance.
MTD Last Year Month-to-Date Last Year. Actual amount for the same month last year.
MTD Last Year % Month-to-Date Last Year Percentage. Percentage comparison to the same month last year.MTD Actual divided by MTD Last Year = MTD Last Year %.
YTD Actual Year-to-Date Actual. Total amount for the fiscal year through the month selected.
YTD Actual % Year-to-Date Percentage comparison to Total Income or [Total Expenses + Profit (Loss)].Income/Expense Account divided by Total Income or [Total Expenses + Profit (Loss)] = YTD Actual %.
YTD Budget Year-to-Date Budget. Amount budgeted for the year through the month selected.
YTD Budget % Year-to-Date Budget Percentage. Percentage comparison to budget.YTD Actual divided by YTD Budget = YTD Budget %.
YTD Variance YTD Actual minus YTD Budget = YTD Variance.
YTD Last Year Year-to-Date Last Year. Year-to-Date amount for the same period last year.
YTD Last Year % Year-to-Date Last Year Percentage. Percentage comparison to the same period last year.YTD Actual divided by YTD Last Year = YTD Last Year %.
Total Budget Total budget for entire fiscal year or entire fiscal quarter.
QTD Actual Quarter-to-Date Actual. Total amount for a fiscal quarter. For example, if you are on a calendar year and it is themonth of April and you print an Income Statement for the month of February including QTD figures, the QTDfigures will include January and February figures only.
QTD Actual % Quarter-to-Date percentage comparison to Total Income or [Total Expenses + Profit (Loss)].Income/Expense Account divided by Total Income or [Total Expenses + Profit (Loss)] = QTD Actual %.
QTD Budget Quarter-to-Date Budget. Amount budgeted for the quarter only. For example, if you are on a calendar year and itis the month of April and you print an Income Statement for the month of February including budget figures, theQTD budget figures will include January and February budget figures only.
QTD Budget % Quarter-to-Date Budget Percentage. Percentage comparison to budget.QTD Actual divided by QTD Budget = QTD Budget %.
QTD Variance QTD Actual minus QTD Budget = QTD Variance.
QTD Last Year Quarter-to-Date Last Year. Actual amount for the same quarter last year.
QTD Last Year % Quarter-to-Date Last Year Percentage. Percentage comparison to the same quarter last year.QTD Actual divided by QTD Last Year = QTD Last Year %.
(continued from the previous page)
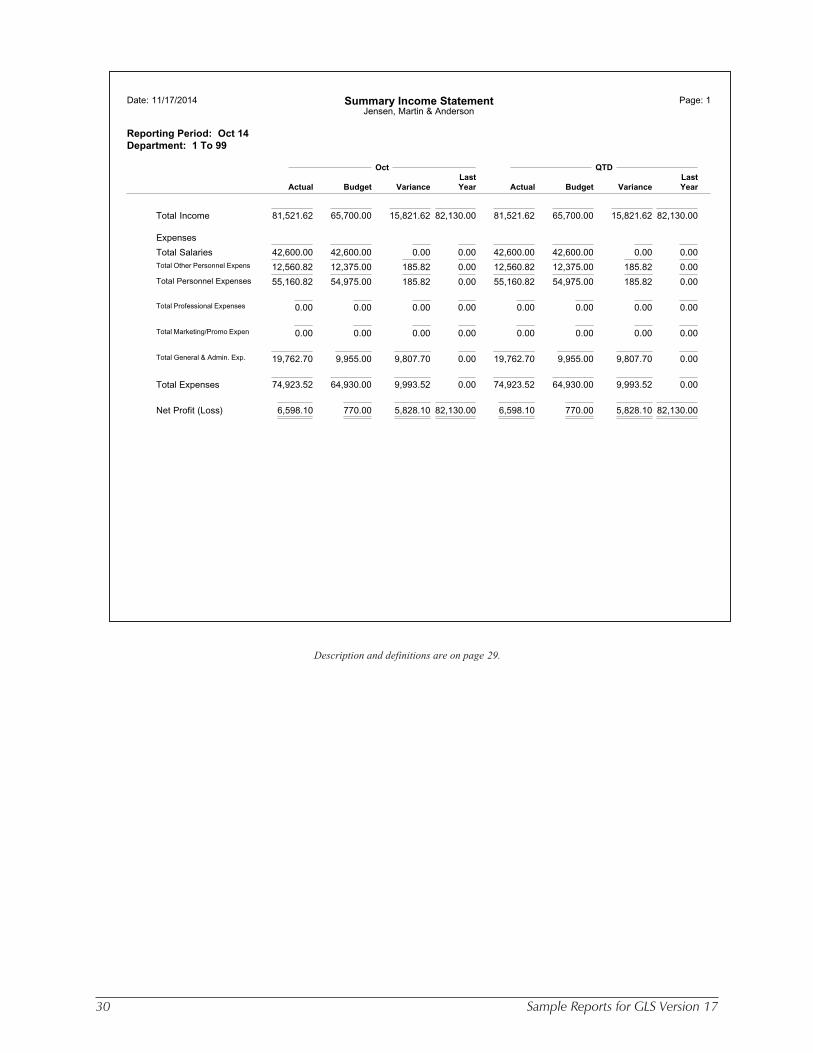
30 Sample Reports for GLS Version 17
Description and definitions are on page 29.
Date: 11/17/2014 Summary Income Statement Page: 1Jensen, Martin & Anderson
Reporting Period: Oct 14Department: 1 To 99
Oct QTDLast Last
Actual Budget Variance Year Actual Budget Variance Year
Total Income 81,521.62 65,700.00 15,821.62 82,130.00 81,521.62 65,700.00 15,821.62 82,130.00
Expenses
Total Salaries 42,600.00 42,600.00 0.00 0.00 42,600.00 42,600.00 0.00 0.00Total Other Personnel Expens 12,560.82 12,375.00 185.82 0.00 12,560.82 12,375.00 185.82 0.00
Total Personnel Expenses 55,160.82 54,975.00 185.82 0.00 55,160.82 54,975.00 185.82 0.00
Total Professional Expenses 0.00 0.00 0.00 0.00 0.00 0.00 0.00 0.00
Total Marketing/Promo Expen 0.00 0.00 0.00 0.00 0.00 0.00 0.00 0.00
Total General & Admin. Exp. 19,762.70 9,955.00 9,807.70 0.00 19,762.70 9,955.00 9,807.70 0.00
Total Expenses 74,923.52 64,930.00 9,993.52 0.00 74,923.52 64,930.00 9,993.52 0.00
Net Profit (Loss) 6,598.10 770.00 5,828.10 82,130.00 6,598.10 770.00 5,828.10 82,130.00
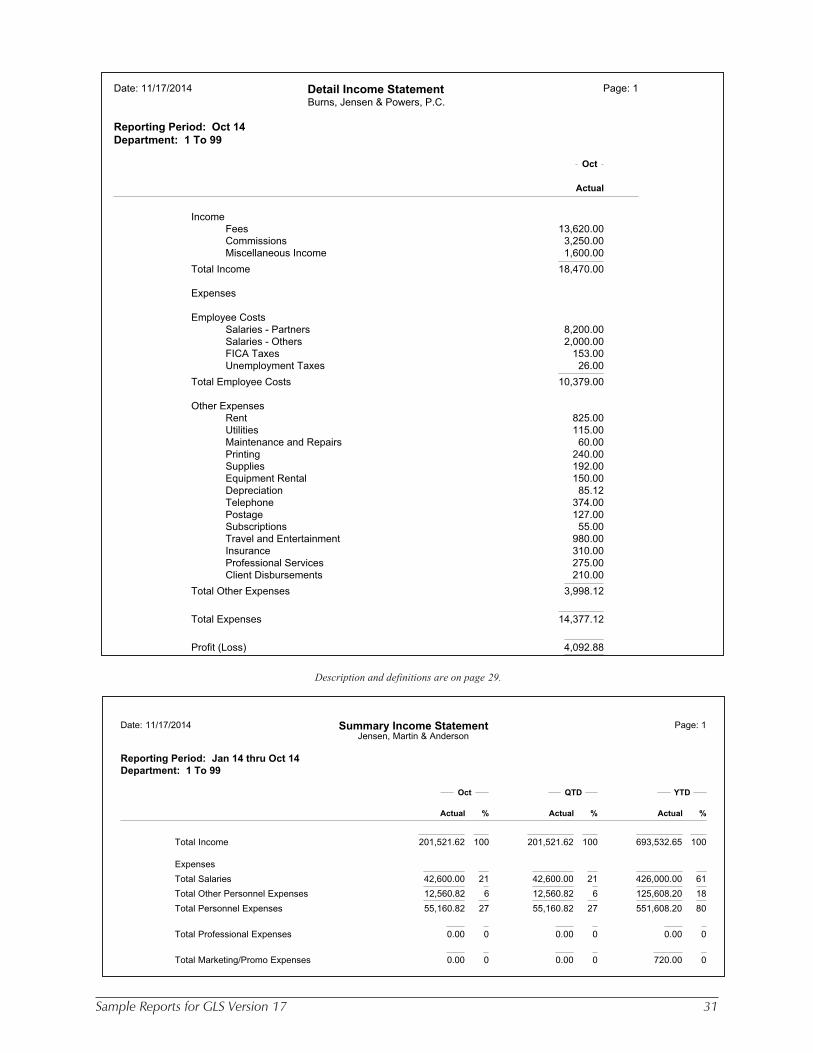
Sample Reports for GLS Version 17 31
Description and definitions are on page 29.
Date: 11/17/2014 Detail Income Statement Page: 1
Burns, Jensen & Powers, P.C.
Reporting Period: Oct 14Department: 1 To 99
Oct
Actual
Income
Fees 13,620.00
Commissions 3,250.00
Miscellaneous Income 1,600.00
Total Income 18,470.00
Expenses
Employee Costs
Salaries - Partners 8,200.00
Salaries - Others 2,000.00
FICA Taxes 153.00
Unemployment Taxes 26.00
Total Employee Costs 10,379.00
Other Expenses
Rent 825.00
Utilities 115.00
Maintenance and Repairs 60.00
Printing 240.00
Supplies 192.00
Equipment Rental 150.00
Depreciation 85.12
Telephone 374.00
Postage 127.00
Subscriptions 55.00
Travel and Entertainment 980.00
Insurance 310.00
Professional Services 275.00
Client Disbursements 210.00
Total Other Expenses 3,998.12
Total Expenses 14,377.12
Profit (Loss) 4,092.88
Date: 11/17/2014 Summary Income Statement Page: 1Jensen, Martin & Anderson
Reporting Period: Jan 14 thru Oct 14Department: 1 To 99
Oct QTD YTD
Actual % Actual % Actual %
Total Income 201,521.62 100 201,521.62 100 693,532.65 100
Expenses
Total Salaries 42,600.00 21 42,600.00 21 426,000.00 61
Total Other Personnel Expenses 12,560.82 6 12,560.82 6 125,608.20 18
Total Personnel Expenses 55,160.82 27 55,160.82 27 551,608.20 80
Total Professional Expenses 0.00 0 0.00 0 0.00 0
Total Marketing/Promo Expenses 0.00 0 0.00 0 720.00 0
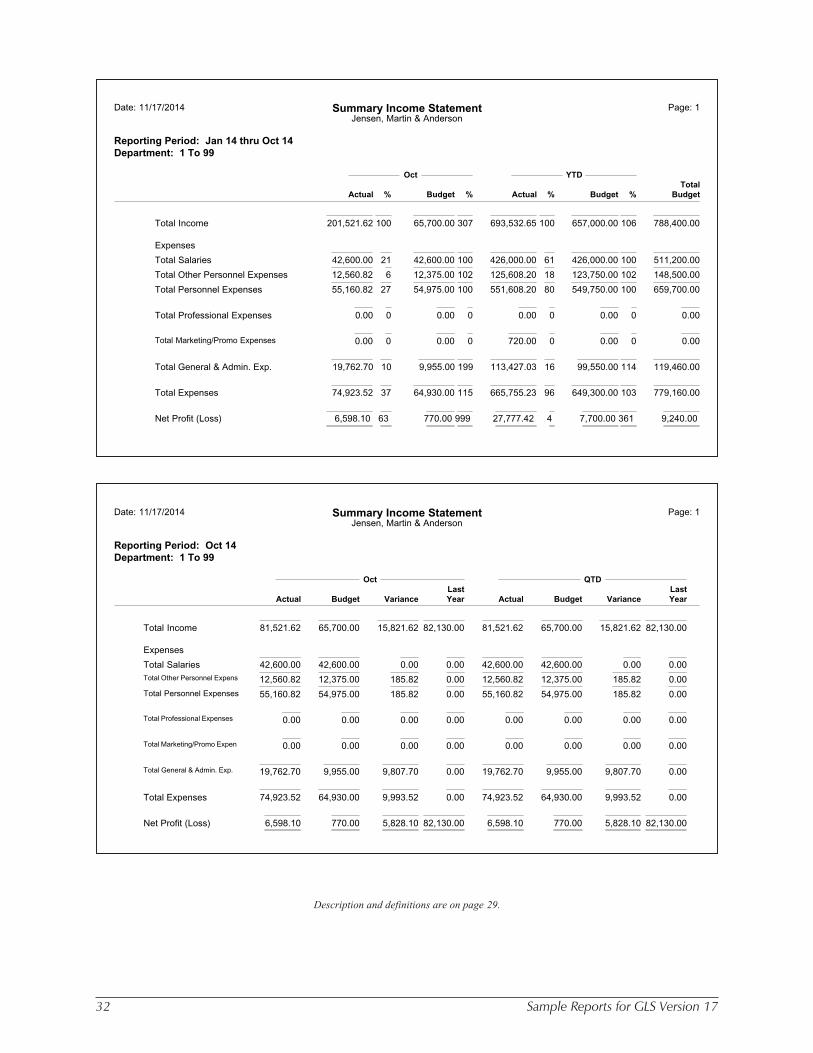
32 Sample Reports for GLS Version 17
Description and definitions are on page 29.
Date: 11/17/2014 Summary Income Statement Page: 1Jensen, Martin & Anderson
Reporting Period: Oct 14Department: 1 To 99
Oct QTDLast Last
Actual Budget Variance Year Actual Budget Variance Year
Total Income 81,521.62 65,700.00 15,821.62 82,130.00 81,521.62 65,700.00 15,821.62 82,130.00
Expenses
Total Salaries 42,600.00 42,600.00 0.00 0.00 42,600.00 42,600.00 0.00 0.00Total Other Personnel Expens 12,560.82 12,375.00 185.82 0.00 12,560.82 12,375.00 185.82 0.00
Total Personnel Expenses 55,160.82 54,975.00 185.82 0.00 55,160.82 54,975.00 185.82 0.00
Total Professional Expenses 0.00 0.00 0.00 0.00 0.00 0.00 0.00 0.00
Total Marketing/Promo Expen 0.00 0.00 0.00 0.00 0.00 0.00 0.00 0.00
Total General & Admin. Exp. 19,762.70 9,955.00 9,807.70 0.00 19,762.70 9,955.00 9,807.70 0.00
Total Expenses 74,923.52 64,930.00 9,993.52 0.00 74,923.52 64,930.00 9,993.52 0.00
Net Profit (Loss) 6,598.10 770.00 5,828.10 82,130.00 6,598.10 770.00 5,828.10 82,130.00
Date: 11/17/2014 Summary Income Statement Page: 1Jensen, Martin & Anderson
Reporting Period: Jan 14 thru Oct 14Department: 1 To 99
Oct YTDTotal
Actual % Budget % Actual % Budget % Budget
Total Income 201,521.62 100 65,700.00 307 693,532.65 100 657,000.00 106 788,400.00
Expenses
Total Salaries 42,600.00 21 42,600.00 100 426,000.00 61 426,000.00 100 511,200.00
Total Other Personnel Expenses 12,560.82 6 12,375.00 102 125,608.20 18 123,750.00 102 148,500.00
Total Personnel Expenses 55,160.82 27 54,975.00 100 551,608.20 80 549,750.00 100 659,700.00
Total Professional Expenses 0.00 0 0.00 0 0.00 0 0.00 0 0.00
Total Marketing/Promo Expenses 0.00 0 0.00 0 720.00 0 0.00 0 0.00
Total General & Admin. Exp. 19,762.70 10 9,955.00 199 113,427.03 16 99,550.00 114 119,460.00
Total Expenses 74,923.52 37 64,930.00 115 665,755.23 96 649,300.00 103 779,160.00
Net Profit (Loss) 6,598.10 63 770.00 999 27,777.42 4 7,700.00 361 9,240.00

Sample Reports for GLS Version 17 33
Examples of the Owner EquityPortion of the Chart of Accounts
for Different Types of Accounting Entities
There are many ways to set up an accounting entity. The following pages show examples of how the owners’ equityportion of the chart of accounts can be set up. Also shown are the corresponding Balance Sheets for each samplechart of accounts. These examples are provided to demonstrate the flexibility that GLS offers in setting up charts ofaccounts for different types of accounting entities. Keep in mind that these are only examples and can be modifiedas required for your firm’s needs.
The two examples on page are examples for a partnership and the two examples on page are examples for acorporation.
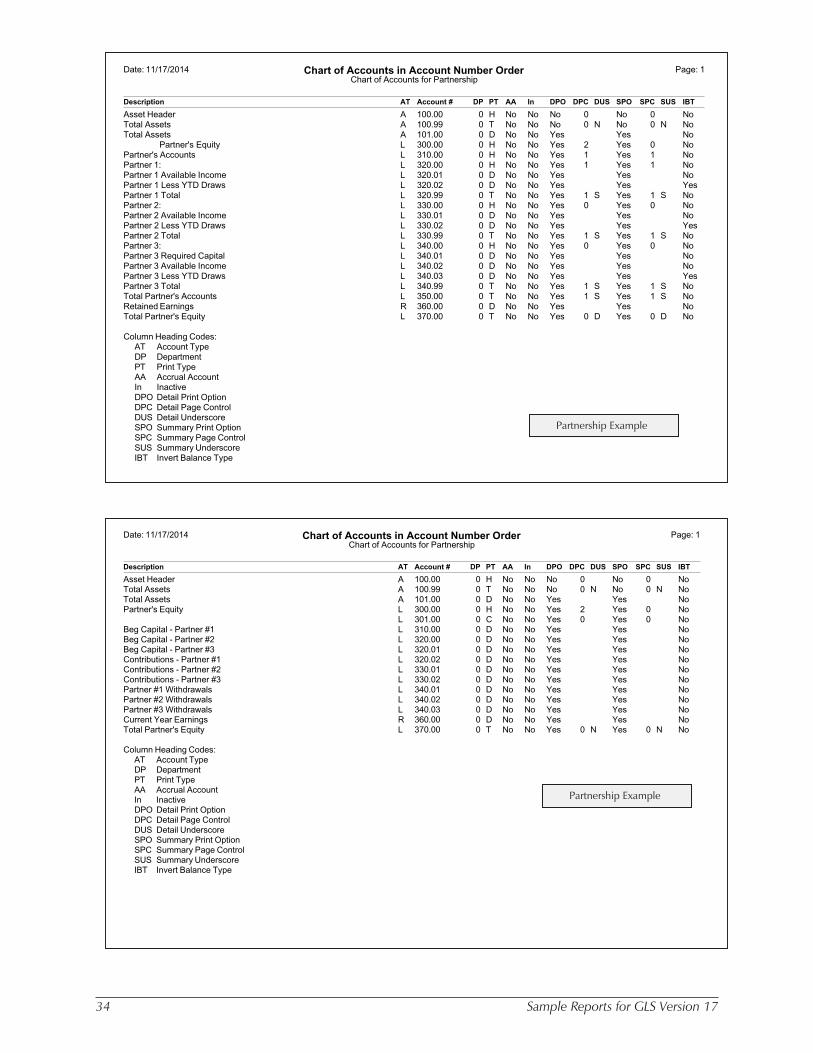
34 Sample Reports for GLS Version 17
Date: 11/17/2014 Chart of Accounts in Account Number Order Page: 1Chart of Accounts for Partnership
Description AT Account # DP PT AA In DPO DPC DUS SPO SPC SUS IBT
Asset Header A 100.00 0 H No No No 0 No 0 NoTotal Assets A 100.99 0 T No No No 0 N No 0 N NoTotal Assets A 101.00 0 D No No Yes Yes No Partner's Equity L 300.00 0 H No No Yes 2 Yes 0 NoPartner's Accounts L 310.00 0 H No No Yes 1 Yes 1 NoPartner 1: L 320.00 0 H No No Yes 1 Yes 1 NoPartner 1 Available Income L 320.01 0 D No No Yes Yes NoPartner 1 Less YTD Draws L 320.02 0 D No No Yes Yes YesPartner 1 Total L 320.99 0 T No No Yes 1 S Yes 1 S NoPartner 2: L 330.00 0 H No No Yes 0 Yes 0 NoPartner 2 Available Income L 330.01 0 D No No Yes Yes NoPartner 2 Less YTD Draws L 330.02 0 D No No Yes Yes YesPartner 2 Total L 330.99 0 T No No Yes 1 S Yes 1 S NoPartner 3: L 340.00 0 H No No Yes 0 Yes 0 NoPartner 3 Required Capital L 340.01 0 D No No Yes Yes NoPartner 3 Available Income L 340.02 0 D No No Yes Yes NoPartner 3 Less YTD Draws L 340.03 0 D No No Yes Yes YesPartner 3 Total L 340.99 0 T No No Yes 1 S Yes 1 S NoTotal Partner's Accounts L 350.00 0 T No No Yes 1 S Yes 1 S NoRetained Earnings R 360.00 0 D No No Yes Yes NoTotal Partner's Equity L 370.00 0 T No No Yes 0 D Yes 0 D No
Column Heading Codes:AT Account TypeDP DepartmentPT Print TypeAA Accrual AccountIn InactiveDPO Detail Print OptionDPC Detail Page ControlDUS Detail UnderscoreSPO Summary Print OptionSPC Summary Page ControlSUS Summary UnderscoreIBT Invert Balance Type
Date: 11/17/2014 Chart of Accounts in Account Number Order Page: 1Chart of Accounts for Partnership
Description AT Account # DP PT AA In DPO DPC DUS SPO SPC SUS IBT
Asset Header A 100.00 0 H No No No 0 No 0 NoTotal Assets A 100.99 0 T No No No 0 N No 0 N NoTotal Assets A 101.00 0 D No No Yes Yes NoPartner's Equity L 300.00 0 H No No Yes 2 Yes 0 No
L 301.00 0 C No No Yes 0 Yes 0 NoBeg Capital - Partner #1 L 310.00 0 D No No Yes Yes NoBeg Capital - Partner #2 L 320.00 0 D No No Yes Yes NoBeg Capital - Partner #3 L 320.01 0 D No No Yes Yes NoContributions - Partner #1 L 320.02 0 D No No Yes Yes NoContributions - Partner #2 L 330.01 0 D No No Yes Yes NoContributions - Partner #3 L 330.02 0 D No No Yes Yes NoPartner #1 Withdrawals L 340.01 0 D No No Yes Yes NoPartner #2 Withdrawals L 340.02 0 D No No Yes Yes NoPartner #3 Withdrawals L 340.03 0 D No No Yes Yes NoCurrent Year Earnings R 360.00 0 D No No Yes Yes NoTotal Partner's Equity L 370.00 0 T No No Yes 0 N Yes 0 N No
Column Heading Codes:AT Account TypeDP DepartmentPT Print TypeAA Accrual AccountIn InactiveDPO Detail Print OptionDPC Detail Page ControlDUS Detail UnderscoreSPO Summary Print OptionSPC Summary Page ControlSUS Summary UnderscoreIBT Invert Balance Type
Partnership Example
Partnership Example
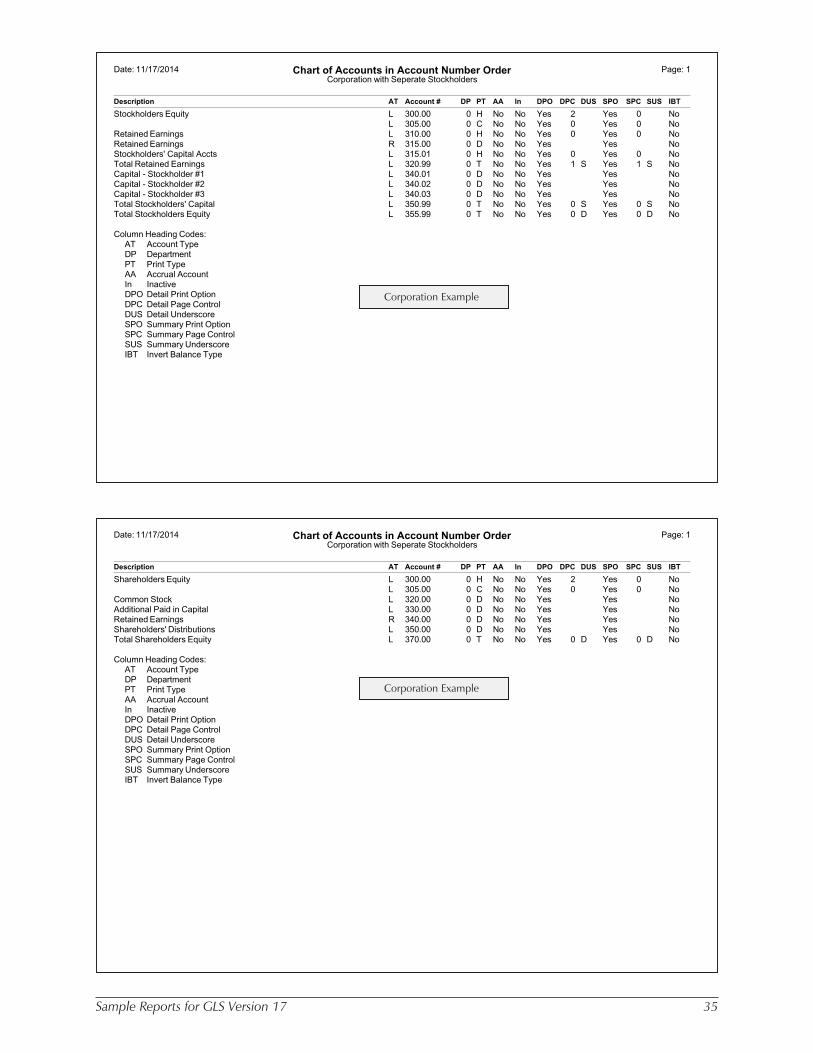
Sample Reports for GLS Version 17 35
Date: 11/17/2014 Chart of Accounts in Account Number Order Page: 1Corporation with Seperate Stockholders
Description AT Account # DP PT AA In DPO DPC DUS SPO SPC SUS IBT
Shareholders Equity L 300.00 0 H No No Yes 2 Yes 0 NoL 305.00 0 C No No Yes 0 Yes 0 No
Common Stock L 320.00 0 D No No Yes Yes NoAdditional Paid in Capital L 330.00 0 D No No Yes Yes NoRetained Earnings R 340.00 0 D No No Yes Yes NoShareholders' Distributions L 350.00 0 D No No Yes Yes NoTotal Shareholders Equity L 370.00 0 T No No Yes 0 D Yes 0 D No
Column Heading Codes:AT Account TypeDP DepartmentPT Print TypeAA Accrual AccountIn InactiveDPO Detail Print OptionDPC Detail Page ControlDUS Detail UnderscoreSPO Summary Print OptionSPC Summary Page ControlSUS Summary UnderscoreIBT Invert Balance Type
Date: 11/17/2014 Chart of Accounts in Account Number Order Page: 1Corporation with Seperate Stockholders
Description AT Account # DP PT AA In DPO DPC DUS SPO SPC SUS IBT
Stockholders Equity L 300.00 0 H No No Yes 2 Yes 0 NoL 305.00 0 C No No Yes 0 Yes 0 No
Retained Earnings L 310.00 0 H No No Yes 0 Yes 0 NoRetained Earnings R 315.00 0 D No No Yes Yes NoStockholders' Capital Accts L 315.01 0 H No No Yes 0 Yes 0 NoTotal Retained Earnings L 320.99 0 T No No Yes 1 S Yes 1 S NoCapital - Stockholder #1 L 340.01 0 D No No Yes Yes NoCapital - Stockholder #2 L 340.02 0 D No No Yes Yes NoCapital - Stockholder #3 L 340.03 0 D No No Yes Yes NoTotal Stockholders' Capital L 350.99 0 T No No Yes 0 S Yes 0 S NoTotal Stockholders Equity L 355.99 0 T No No Yes 0 D Yes 0 D No
Column Heading Codes:AT Account TypeDP DepartmentPT Print TypeAA Accrual AccountIn InactiveDPO Detail Print OptionDPC Detail Page ControlDUS Detail UnderscoreSPO Summary Print OptionSPC Summary Page ControlSUS Summary UnderscoreIBT Invert Balance Type
Corporation Example
Corporation Example
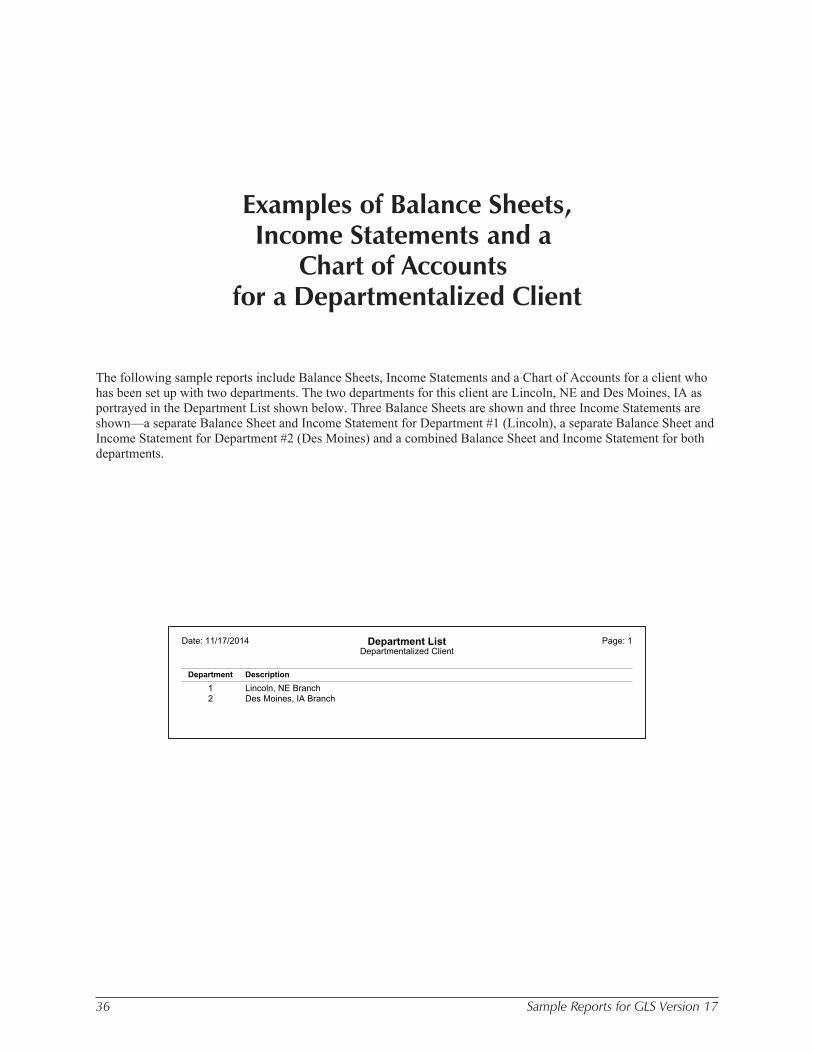
36 Sample Reports for GLS Version 17
Examples of Balance Sheets,Income Statements and a
Chart of Accountsfor a Departmentalized Client
The following sample reports include Balance Sheets, Income Statements and a Chart of Accounts for a client whohas been set up with two departments. The two departments for this client are Lincoln, NE and Des Moines, IA asportrayed in the Department List shown below. Three Balance Sheets are shown and three Income Statements areshown—a separate Balance Sheet and Income Statement for Department #1 (Lincoln), a separate Balance Sheet andIncome Statement for Department #2 (Des Moines) and a combined Balance Sheet and Income Statement for bothdepartments.
Date: 11/17/2014 Department List Page: 1Departmentalized Client
Department Description
1 Lincoln, NE Branch2 Des Moines, IA Branch

Sample Reports for GLS Version 17 37
Date: 11/17/2014 Chart of Accounts in Account Number Order Page: 2Departmentalized Client
Description AT Account # DP PT AA In DPO DPC DUS SPO SPC SUS IBT
Interest Income - NE I 840 1 D No No Yes Yes NoInterest Income - IA I 841 2 D No No Yes Yes NoMisc Income - NE I 850 1 D No No Yes Yes NoMisc Income - IA I 851 2 D No No Yes Yes NoTotal Income I 860 0 T No No Yes 2 S Yes 2 S NoExpenses E 900 0 H No No Yes 0 Yes 0 NoPayroll and Related Costs E 910 0 H No No Yes 0 Yes 0 NoProfessional Salaries - NE E 920 1 D No No Yes Yes NoProfessional Salaries - IA E 921 2 D No No Yes Yes NoOther Salaries - NE E 930 1 D No No Yes Yes NoOther Salaries - IA E 931 2 D No No Yes Yes NoPayroll Taxes - NE E 940 1 D No No Yes Yes NoPayroll Taxes - IA E 941 2 D No No Yes Yes NoTotal Payroll and Costs E 960 0 T No No Yes 2 N Yes 2 N NoOther Taxes - NE E 970 1 D No No Yes Yes NoOther Taxes - IA E 971 2 D No No Yes Yes NoClient Costs Advanced - NE E 980 1 D No No Yes Yes NoClient Costs Advanced - IA E 981 1 D No No Yes Yes NoGroup Health Insurance - NE E 990 1 D No No Yes Yes NoGroup Health Insurance - IA E 991 2 D No No Yes Yes NoLiability Insurance - NE E 1000 1 D No No Yes Yes NoLiability Insurance - IA E 1001 2 D No No Yes Yes NoUtilities - NE E 1050 1 D No No Yes Yes NoUtilities - IA E 1051 2 D No No Yes Yes NoTelephone Costs - NE E 1060 1 D No No Yes Yes NoTelephone Costs - IA E 1061 2 D No No Yes Yes NoEducation and Seminars - NE E 1140 1 D No No Yes Yes NoEducation and Seminars - IA E 1141 2 D No No Yes Yes NoContributions and Gifts - NE E 1190 1 D No No Yes Yes NoContributions and Gifts - IA E 1191 2 D No No Yes Yes NoTravel and Entertainment - NE E 1200 1 D No No Yes Yes NoTravel and Entertainment - IA E 1201 2 D No No Yes Yes NoTotal Expenses E 1290 0 T No No Yes 1 S Yes 1 S NoProfit (Loss) I 1300 0 T No No Yes 0 D Yes 0 D No
Column Heading Codes:AT Account TypeDP DepartmentPT Print TypeAA Accrual AccountIn InactiveDPO Detail Print OptionDPC Detail Page ControlDUS Detail UnderscoreSPO Summary Print OptionSPC Summary Page ControlSUS Summary UnderscoreIBT Invert Balance Type
Date: 11/17/2014 Chart of Accounts in Account Number Order Page: 1Departmentalized Client
Description AT Account # DP PT AA In DPO DPC DUS SPO SPC SUS IBT
Assets A 1 0 H No No Yes 1 Yes 1 NoCurrent Assets A 90 0 H No No Yes 1 Yes 1 No Cash A 100 0 H No No Yes 1 Yes 1 NoCash - Checking FNB B 110 1 D No No Yes Yes NoCash - Checking ISB - IA B 112 2 D No No Yes Yes NoCash - Money Market NE B 115 1 D No No Yes Yes NoCash - Money Market IA B 116 2 D No No Yes Yes NoEmployee Advances - NE A 120 1 D No No Yes Yes NoEmployee Advances - IA A 121 2 D No No Yes Yes NoTotal Cash A 160 0 T No No Yes 1 S Yes 1 S NoTotal Current Assets A 195 0 T No No Yes 2 S Yes 2 S NoNet Fixed Assets A 199 0 H No No No 0 No 0 NoFixed Assets A 200 0 H No No Yes 0 Yes 0 NoFurniture and Fixtures - NE A 210 1 D No No Yes Yes NoFurniture and Fixtures - IA A 215 2 D No No Yes Yes NoVehicles - NE A 220 1 D No No Yes Yes NoVehicles - IA A 221 2 D No No Yes Yes NoLess: A 229 0 C No No Yes 0 Yes 0 NoAccumulated Depreciation A 230 0 H No No No 0 No 0 NoTotal Fixed Assets A 245 0 T No No Yes 1 S Yes 1 N NoOther Assets A 249 0 H No No Yes 0 Yes 0 NoSecurity Deposits - NE A 250 1 D No No Yes Yes NoSecurity Deposits - IA A 255 2 D No No Yes Yes NoAccum. Deprec. (F&F) - NE A 260 1 D No No Yes Yes NoAccum. Deprec. (F&F) - IA A 261 2 D No No Yes Yes NoAccum. Deprec. (Vehicles) - NE A 270 1 D No No Yes Yes NoAccum. Deprec. (Vehicles) - IA A 271 2 D No No Yes Yes NoTotal Accumulated Depreciation A 275 0 T No No Yes 1 N Yes 1 N NoNet Fixed Assets A 279 0 T No No Yes 2 S Yes 2 S NoTotal Other Assets A 289 0 T No No Yes 0 N Yes 0 N NoTOTAL ASSETS A 390 0 T No No Yes 2 D Yes 2 D NoLiabilities and Owner Equity L 400 0 H No No Yes 0 Yes 0 No Liabilities L 405 0 H No No Yes 0 Yes 0 NoCurrent Liabilities L 420 0 H No No Yes 0 Yes 0 NoAccounts Payable - NE L 430 1 D No No Yes Yes NoAccounts Payable - IA L 431 2 D No No Yes Yes No401k Payable - NE L 470 1 D No No Yes Yes No401k Payable - IA L 471 2 D No No Yes Yes NoHealth Insurance Withheld - NE L 480 1 D No No Yes Yes NoHealth Insurance Withhheld - IA L 481 2 D No No Yes Yes NoTaxes Payable L 500 0 H No No Yes 0 Yes 0 NoSales Tax Collected - NE L 510 1 D No No Yes Yes NoSales Tax Collected - IA L 511 2 D No No Yes Yes NoFederal Tax Withheld - NE L 520 1 D No No Yes Yes NoFederal Tax Withheld - IA L 521 2 D No No Yes Yes NoTotal Taxes Payable L 570 0 T No No Yes 1 S Yes 1 S NoTotal Current Liabilities L 575 0 T No No Yes 0 S Yes 0 S NoTotal Liabilities L 699 0 T No No Yes 1 S Yes 1 S No Owners Equity L 700 0 H No No Yes 1 Yes 1 NoPartner's Capital and Draw Accts. L 710 0 H No No Yes 2 Yes 2 NoJJJ Capital Acct. L 711 1 D No No Yes Yes NoJJJ Draw Acct. L 712 1 D No No Yes Yes NoRWJ Capital Acct. L 720 1 D No No Yes Yes NoRWJ Draw Acct. L 721 1 D No No Yes Yes NoLHP Capital Acct. L 722 2 D No No Yes Yes NoLHP Draw Acct. L 723 2 D No No Yes Yes NoSTB Capital Acct. L 724 2 D No No Yes Yes NoSTB Draw Acct. L 725 2 D No No Yes Yes NoTotal Partner's Equity L 765 0 T No No Yes 0 S Yes 0 S NoRetained Earnings L 770 0 H No No Yes 2 Yes 2 NoRetained Earnings R 780 0 D No No Yes Yes NoPrior Year Retained Earnings L 781 1 D No No Yes Yes NoTotal Retained Earnings L 785 0 T No No Yes 0 S Yes 0 S NoTotal Owners Equity L 790 0 T No No Yes 1 S Yes 1 S NoTotal Liabilities and Owner Equity L 795 0 T No No Yes 1 D Yes 1 D No(Profit/Loss Heading) I 800 0 H No No No 0 No 0 NoIncome I 810 0 H No No Yes 0 Yes 0 No
I 815 0 C No No Yes 0 Yes 0 NoFee Income - NE I 820 1 D No No Yes Yes NoFee Income - IA I 821 2 D No No Yes Yes NoCosts Advanced Income - NE I 830 1 D No No Yes Yes NoCosts Advanced Income - IA I 831 2 D No No Yes Yes No
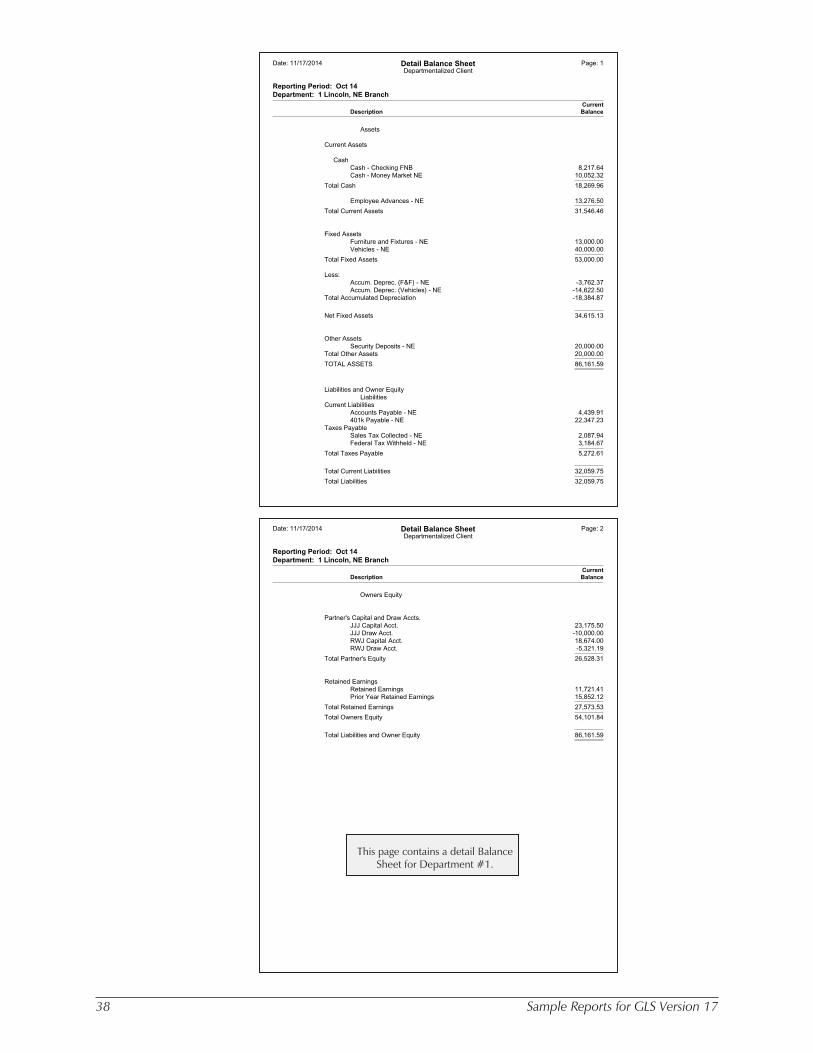
38 Sample Reports for GLS Version 17
Date: 11/17/2014 Detail Balance Sheet Page: 2Departmentalized Client
Reporting Period: Oct 14Department: 1 Lincoln, NE Branch
CurrentDescription Balance
Owners Equity
Partner's Capital and Draw Accts.JJJ Capital Acct. 23,175.50JJJ Draw Acct. -10,000.00RWJ Capital Acct. 18,674.00RWJ Draw Acct. -5,321.19
Total Partner's Equity 26,528.31
Retained EarningsRetained Earnings 11,721.41Prior Year Retained Earnings 15,852.12
Total Retained Earnings 27,573.53
Total Owners Equity 54,101.84
Total Liabilities and Owner Equity 86,161.59
Date: 11/17/2014 Detail Balance Sheet Page: 1Departmentalized Client
Reporting Period: Oct 14Department: 1 Lincoln, NE Branch
CurrentDescription Balance
Assets
Current Assets
CashCash - Checking FNB 8,217.64Cash - Money Market NE 10,052.32
Total Cash 18,269.96
Employee Advances - NE 13,276.50
Total Current Assets 31,546.46
Fixed AssetsFurniture and Fixtures - NE 13,000.00Vehicles - NE 40,000.00
Total Fixed Assets 53,000.00
Less:Accum. Deprec. (F&F) - NE -3,762.37Accum. Deprec. (Vehicles) - NE -14,622.50
Total Accumulated Depreciation -18,384.87
Net Fixed Assets 34,615.13
Other AssetsSecurity Deposits - NE 20,000.00
Total Other Assets 20,000.00
TOTAL ASSETS 86,161.59
Liabilities and Owner Equity LiabilitiesCurrent Liabilities
Accounts Payable - NE 4,439.91401k Payable - NE 22,347.23
Taxes PayableSales Tax Collected - NE 2,087.94Federal Tax Withheld - NE 3,184.67
Total Taxes Payable 5,272.61
Total Current Liabilities 32,059.75
Total Liabilities 32,059.75
This page contains a detail BalanceSheet for Department #1.
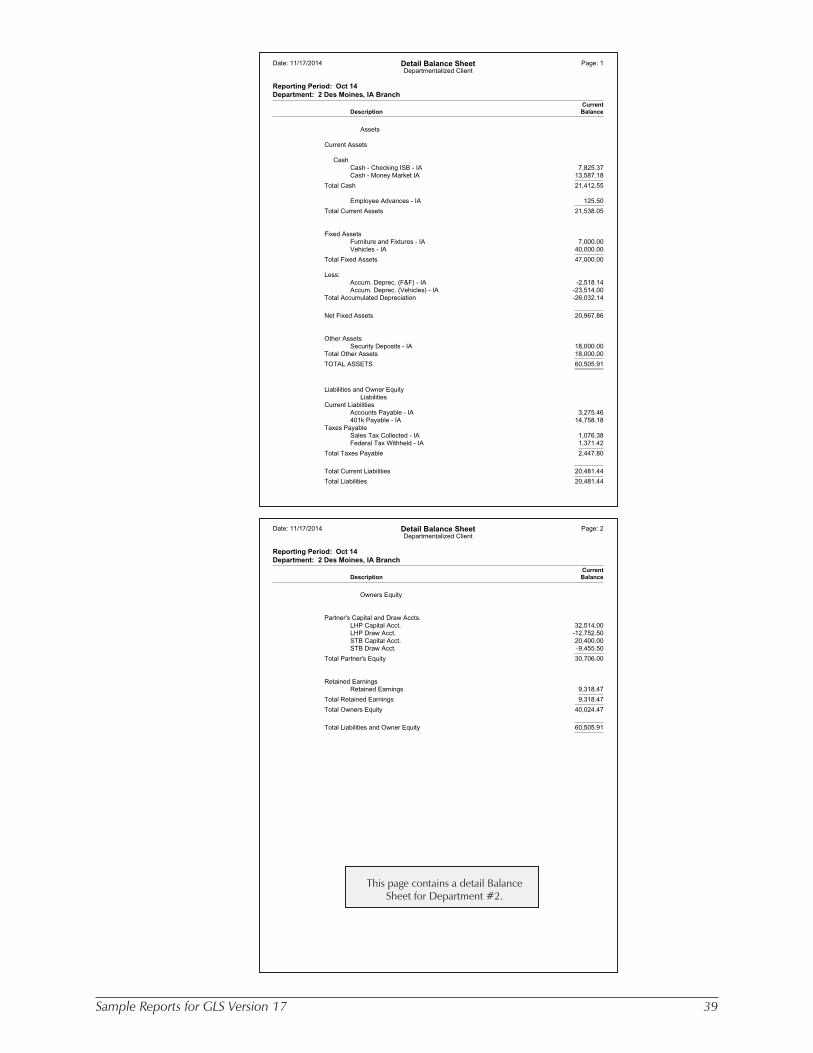
Sample Reports for GLS Version 17 39
Date: 11/17/2014 Detail Balance Sheet Page: 2Departmentalized Client
Reporting Period: Oct 14Department: 2 Des Moines, IA Branch
CurrentDescription Balance
Owners Equity
Partner's Capital and Draw Accts.LHP Capital Acct. 32,514.00LHP Draw Acct. -12,752.50STB Capital Acct. 20,400.00STB Draw Acct. -9,455.50
Total Partner's Equity 30,706.00
Retained EarningsRetained Earnings 9,318.47
Total Retained Earnings 9,318.47
Total Owners Equity 40,024.47
Total Liabilities and Owner Equity 60,505.91
Date: 11/17/2014 Detail Balance Sheet Page: 1Departmentalized Client
Reporting Period: Oct 14Department: 2 Des Moines, IA Branch
CurrentDescription Balance
Assets
Current Assets
CashCash - Checking ISB - IA 7,825.37Cash - Money Market IA 13,587.18
Total Cash 21,412.55
Employee Advances - IA 125.50
Total Current Assets 21,538.05
Fixed AssetsFurniture and Fixtures - IA 7,000.00Vehicles - IA 40,000.00
Total Fixed Assets 47,000.00
Less:Accum. Deprec. (F&F) - IA -2,518.14Accum. Deprec. (Vehicles) - IA -23,514.00
Total Accumulated Depreciation -26,032.14
Net Fixed Assets 20,967.86
Other AssetsSecurity Deposits - IA 18,000.00
Total Other Assets 18,000.00
TOTAL ASSETS 60,505.91
Liabilities and Owner Equity LiabilitiesCurrent Liabilities
Accounts Payable - IA 3,275.46401k Payable - IA 14,758.18
Taxes PayableSales Tax Collected - IA 1,076.38Federal Tax Withheld - IA 1,371.42
Total Taxes Payable 2,447.80
Total Current Liabilities 20,481.44
Total Liabilities 20,481.44
This page contains a detail BalanceSheet for Department #2.
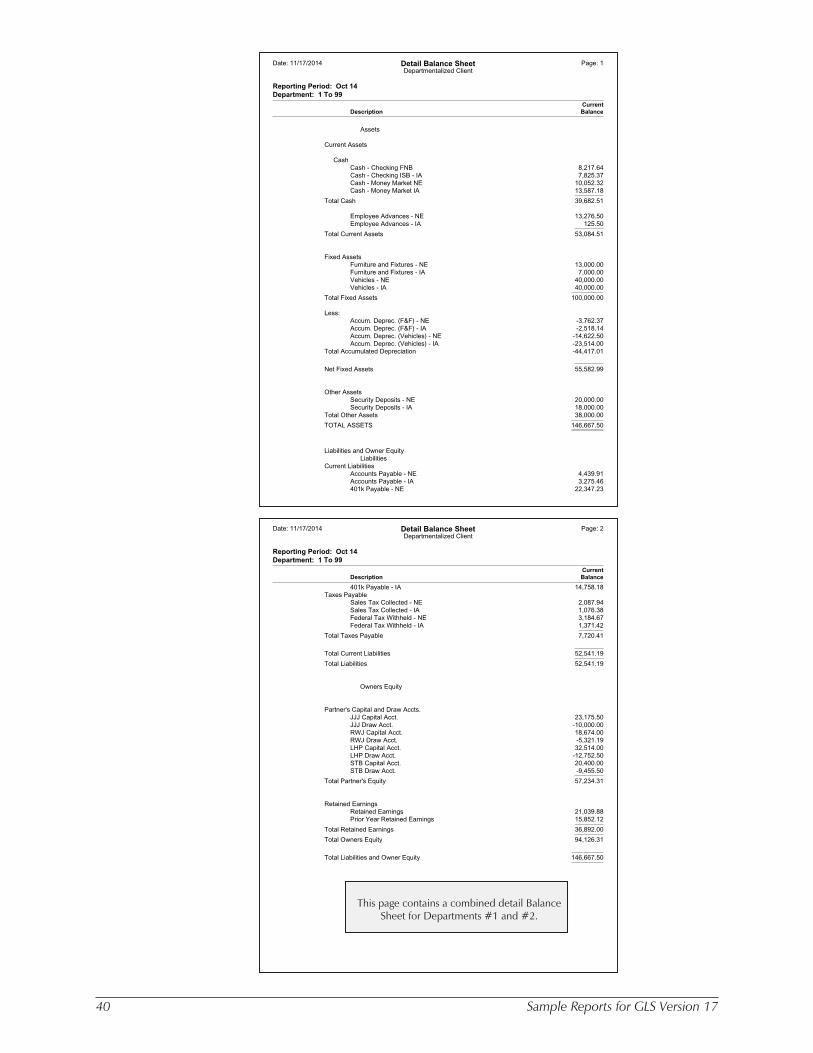
40 Sample Reports for GLS Version 17
Date: 11/17/2014 Detail Balance Sheet Page: 2Departmentalized Client
Reporting Period: Oct 14Department: 1 To 99
CurrentDescription Balance
401k Payable - IA 14,758.18Taxes Payable
Sales Tax Collected - NE 2,087.94Sales Tax Collected - IA 1,076.38Federal Tax Withheld - NE 3,184.67Federal Tax Withheld - IA 1,371.42
Total Taxes Payable 7,720.41
Total Current Liabilities 52,541.19
Total Liabilities 52,541.19
Owners Equity
Partner's Capital and Draw Accts.JJJ Capital Acct. 23,175.50JJJ Draw Acct. -10,000.00RWJ Capital Acct. 18,674.00RWJ Draw Acct. -5,321.19LHP Capital Acct. 32,514.00LHP Draw Acct. -12,752.50STB Capital Acct. 20,400.00STB Draw Acct. -9,455.50
Total Partner's Equity 57,234.31
Retained EarningsRetained Earnings 21,039.88Prior Year Retained Earnings 15,852.12
Total Retained Earnings 36,892.00
Total Owners Equity 94,126.31
Total Liabilities and Owner Equity 146,667.50
Date: 11/17/2014 Detail Balance Sheet Page: 1Departmentalized Client
Reporting Period: Oct 14Department: 1 To 99
CurrentDescription Balance
Assets
Current Assets
CashCash - Checking FNB 8,217.64Cash - Checking ISB - IA 7,825.37Cash - Money Market NE 10,052.32Cash - Money Market IA 13,587.18
Total Cash 39,682.51
Employee Advances - NE 13,276.50Employee Advances - IA 125.50
Total Current Assets 53,084.51
Fixed AssetsFurniture and Fixtures - NE 13,000.00Furniture and Fixtures - IA 7,000.00Vehicles - NE 40,000.00Vehicles - IA 40,000.00
Total Fixed Assets 100,000.00
Less:Accum. Deprec. (F&F) - NE -3,762.37Accum. Deprec. (F&F) - IA -2,518.14Accum. Deprec. (Vehicles) - NE -14,622.50Accum. Deprec. (Vehicles) - IA -23,514.00
Total Accumulated Depreciation -44,417.01
Net Fixed Assets 55,582.99
Other AssetsSecurity Deposits - NE 20,000.00Security Deposits - IA 18,000.00
Total Other Assets 38,000.00
TOTAL ASSETS 146,667.50
Liabilities and Owner Equity LiabilitiesCurrent Liabilities
Accounts Payable - NE 4,439.91Accounts Payable - IA 3,275.46401k Payable - NE 22,347.23
This page contains a combined detail BalanceSheet for Departments #1 and #2.
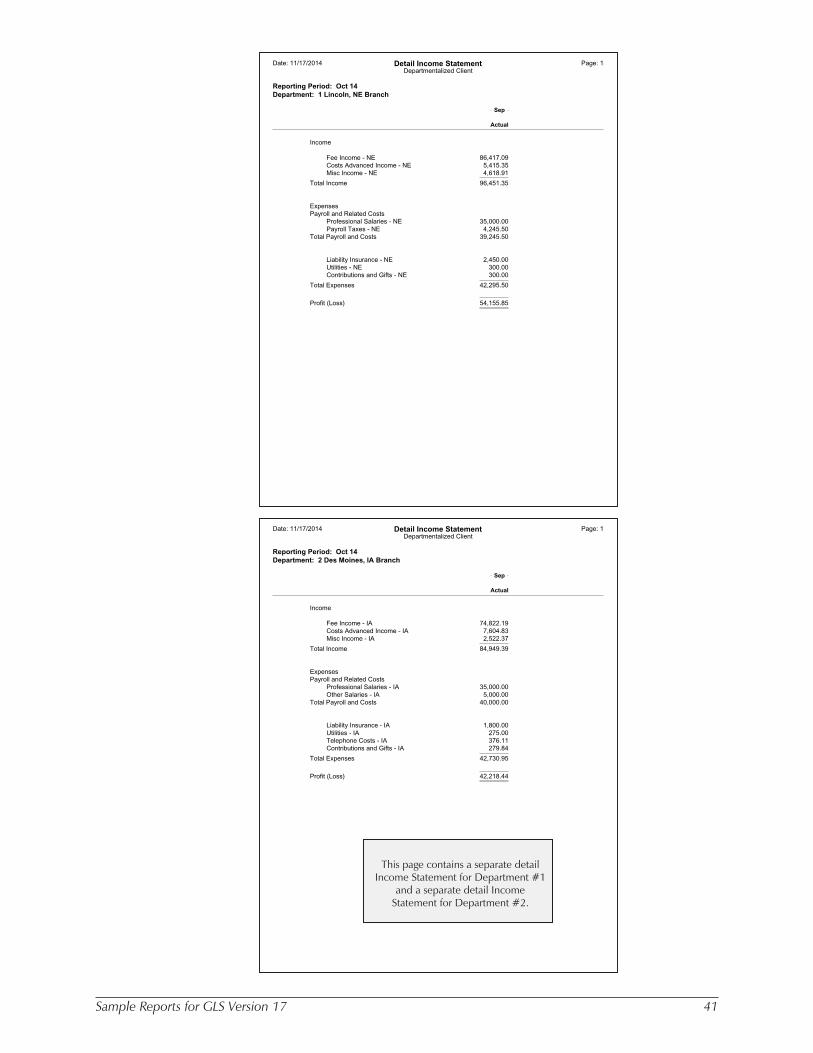
Sample Reports for GLS Version 17 41
Date: 11/17/2014 Detail Income Statement Page: 1Departmentalized Client
Reporting Period: Oct 14Department: 2 Des Moines, IA Branch
Sep
Actual
Income
Fee Income - IA 74,822.19Costs Advanced Income - IA 7,604.83Misc Income - IA 2,522.37
Total Income 84,949.39
ExpensesPayroll and Related Costs
Professional Salaries - IA 35,000.00Other Salaries - IA 5,000.00
Total Payroll and Costs 40,000.00
Liability Insurance - IA 1,800.00Utilities - IA 275.00Telephone Costs - IA 376.11Contributions and Gifts - IA 279.84
Total Expenses 42,730.95
Profit (Loss) 42,218.44
Date: 11/17/2014 Detail Income Statement Page: 1Departmentalized Client
Reporting Period: Oct 14Department: 1 Lincoln, NE Branch
Sep
Actual
Income
Fee Income - NE 86,417.09Costs Advanced Income - NE 5,415.35Misc Income - NE 4,618.91
Total Income 96,451.35
ExpensesPayroll and Related Costs
Professional Salaries - NE 35,000.00Payroll Taxes - NE 4,245.50
Total Payroll and Costs 39,245.50
Liability Insurance - NE 2,450.00Utilities - NE 300.00Contributions and Gifts - NE 300.00
Total Expenses 42,295.50
Profit (Loss) 54,155.85
This page contains a separate detailIncome Statement for Department #1
and a separate detail IncomeStatement for Department #2.
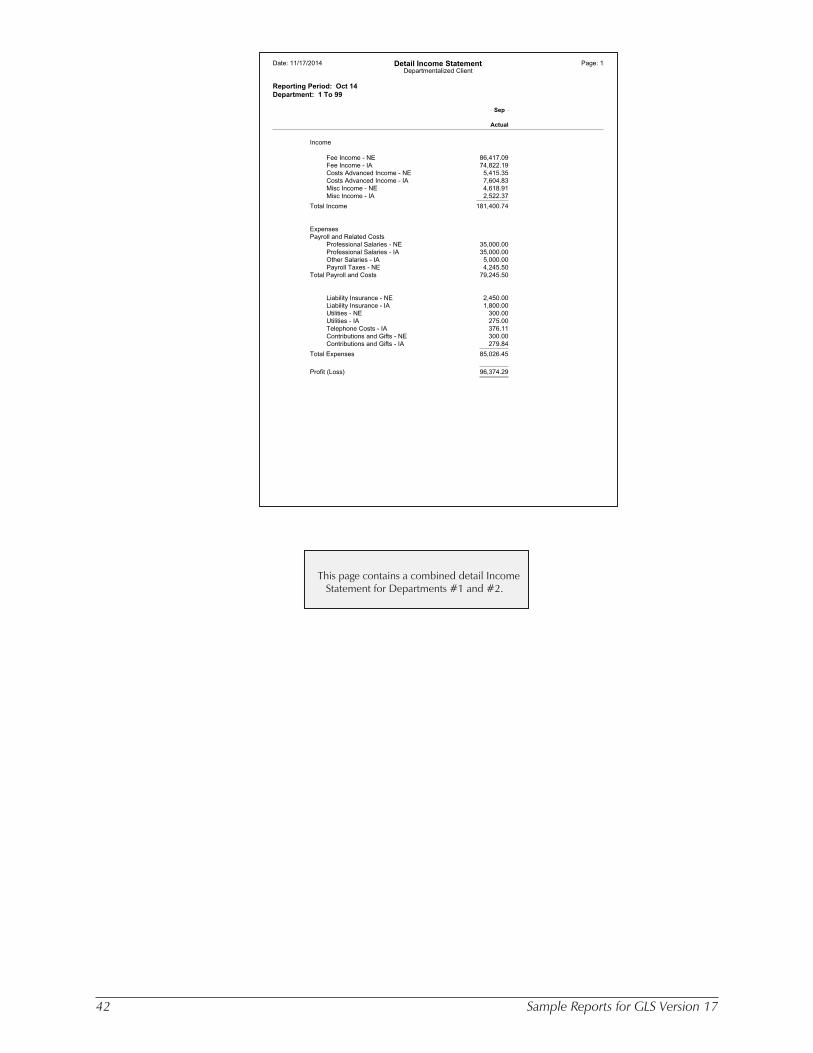
42 Sample Reports for GLS Version 17
Date: 11/17/2014 Detail Income Statement Page: 1Departmentalized Client
Reporting Period: Oct 14Department: 1 To 99
Sep
Actual
Income
Fee Income - NE 86,417.09Fee Income - IA 74,822.19Costs Advanced Income - NE 5,415.35Costs Advanced Income - IA 7,604.83Misc Income - NE 4,618.91Misc Income - IA 2,522.37
Total Income 181,400.74
ExpensesPayroll and Related Costs
Professional Salaries - NE 35,000.00Professional Salaries - IA 35,000.00Other Salaries - IA 5,000.00Payroll Taxes - NE 4,245.50
Total Payroll and Costs 79,245.50
Liability Insurance - NE 2,450.00Liability Insurance - IA 1,800.00Utilities - NE 300.00Utilities - IA 275.00Telephone Costs - IA 376.11Contributions and Gifts - NE 300.00Contributions and Gifts - IA 279.84
Total Expenses 85,026.45
Profit (Loss) 96,374.29
This page contains a combined detail IncomeStatement for Departments #1 and #2.