Embed Size (px)
Citation preview
International Journal of Engineering and Technology Innovation, vol . 7, no. 3, 2017, pp. 143 - 156
General Lighting in Offices Building: Techno-Economic Considerations
on the Fluorescent Tubes Replacement with LED Tubes
Fabio Fantozzi1, Lucien Le Bail2, Francesco Leccese1, Michele Rocca1, Giacomo Salvadori1,*
1Department of Energy, Systems, Territory and Construction Engineering (DESTeC), University of Pisa, Pisa, Italy .
2Institute of Engineering Science and Technologies, University of Angers, Angers, France .
Received 25 November 2016; received in revised form 17 March 2016; accepted 10 April 2017
Abstract
The use of LED light sources is nowadays an attractive solution because it can easily lead to lower operating
costs of artificial lighting. In the last years , the replacement of fluorescent lamps with LED tubes for lighting of
workp laces have been frequently proposed. The aim of the Authors is to analyze, from techno-economic’s point of
view, the fluorescent tubes replacement of a typical office building with LED tubes. Using t he evaluation of the
Lighting Energy Numeric Indicator has been possible to point out that the replacement of the fluorescent tubes
allows a reduction in energy consumption for lighting h igher than 50% with an obvious reduction in the annual
operating cost. For the lamps replacement, in the case study have been estimated a simple payback time of less than
5 years. The methodological approach used by the Authors , although based on a case study, can be extended to
numerous office buildings because the analyzed configurations (use and dimension of the rooms, type and features of
the luminaires) can be considered significantly representative of this type of buildings. The choice of the LED
sources that are suitable for the fluorescent lamps replacement must be preceded by a careful lighting analysis in
order to ensure the compliance with the standards requirements.
Keywords: LED lighting; lamps replacement; office buildings lighting; energy consumptions evaluation; operating
costs of lighting systems
1. Introduction
The attention to energy consumption due to the artificial lighting for bu ild ings was decisively brought to the attention of
the European technical community by means of the well-known European Directive 2002/91 on the energy performance of
buildings. Later the European Direct ive 2010/31/UE has introduced the concept of "near Zero Energy Building" pointing out
the importance of the calculat ion of the lighting energy demand for non -residential buildings. Very recently the EU
Commission Recommendation 2016/1318 [1] of July 2016 reiterated the importance of the gradual transformation of existing
buildings into nearly zero-energy build ings. In [1] it is indicated that the objective to be achieved in the primary energy
consumption for office build ings located in the Mediterranean area is in the range of 20 to 30 kWh/m2year. Nowadays, in most
European office buildings, the above indicated values are reached by considering only the energy consumption due to artificial
lighting [2]. Unlike what happens in residential build ings, it can be estimated that the electrical uses in well insulated office
buildings account for 60 to 70% of the total primary energy consumption, while the thermal uses (i.e. heating, cooling, DHW)
account for the remaining 30 to 40% [3-7].
Due to the expectation regarding the recent evolution of the technologies, the potential for energy saving deriving from a
progressive replacement of lighting devices (i.e. lamps, luminaires, and control systems) is considered to be relevant [8-11]. In
* Corresponding author. E-mail address: [email protected]
Tel.: +39.050.2217144
International Journal of Engineering and Technology Innovation, vol. 7, no. 3, 2017, pp. 143 - 156
Copyright © TAETI
144
general, using new technologies both for source types and control systems, a reduction of 50% of electrical energy
consumptions for an office build ing is considered a realistic target, these values give a clear idea of the enormous potential of
artificial lighting in offices [8-11].
The remarkable evolution that involves the lighting industry has resulted in the growth of the interest in energy
performance of art ificial lighting systems both existing and new. The use of LED light s ources is nowadays an attractive
solution because it can lead to lower operating costs of lighting systems and a major sustainability , but it generally required
higher initial investment [12]. In the last years the manufacturers and the maintainers frequently have proposed the substitution
of fluorescent lamps with LED tubes in order to obtain an immediate reduction in energy consumption. However, in some
cases such substitution may lead to lower quality of lighting and to uncomfortable non -visual effect often underestimate or
ignored [13-16].
The aim of the Authors is to study, through a techno-economic analysis based on field measurements and software
simulations, the lighting system of an office building equipped in the current state with fluorescent tubes, for which the
replacement of lamps with LED tubes is proposed. The results of the techno-economic analysis have been discussed by using
several parameters. In particular, in order to discuss the results about the energy saving due to the use of LED technology, the
Lighting Energy Numeric Ind icator (LENI) has been employed. This indicator was defined by the European Standard EN
15193 [17] for the purpose of providing informat ion on energy consumptions of different lighting systems in indoor
environments. In order to discuss the actual convenience of fluorescent tubes replacement with LED tubes, the Pay Back Time
(PBT) and the Net Present Value (NPV) have been employed. These latter indicators are the most commonly used to
economically quantify the benefits obtained by energy improvement actions [18]. The evaluation of: the operative cost saving,
the expected payback time and the net present value due to the lamps replacement, has been evaluated considering the average
cost per kWh of the electrical energy, the purchase and the installation costs of LED tubes and the maintenance costs over a
ten-year time period. The results of the evaluations described in the paper, although based on a case study, can be extended to
numerous office buildings, g iven that the geometry and the characteristics of use can be considered significantly representative
of this type of buildings.
2. Lighting Requirements in Office Workplaces
Proper lighting is an essential aspect to fulfill important human needs: lighting should be comfortable, convey a sense of
safety and not cause visual fatigue or, worse, discomfort. In a workplace these needs are represented by different basic visual
requirements, i.e.: v isual comfort (the workers have a feeling of well-being, this also contributes to a higher productivity level
and a higher quality of work), visual performance (the workers are ab le to perform their visual tasks, even under difficu lt
circumstances and during longer periods) and safety [19, 20]. To determine the fulfillment of the basic visual requirements, the
evaluation of some lighting parameters, both qualitative and quantitative, should be done. The most relevant qualitative
lighting parameters are specified in [20], they are: the d irectionality of light, the variab ility of light, and the flicker. They can be
evaluated on the basis of the photometric features of the luminaires and on the characteristics of the lighting sources. For the
quantitative lighting parameters, the following limit values are specified in function of the type of area, task or activity [20]:
minimum average maintained illuminance (Em) on the reference surface, maximum Unified Glare Rating (UGRL), min imum
illuminance uniformity (U0) on the reference surface, and minimum co lor rendering index (Ra). The limit values specified in
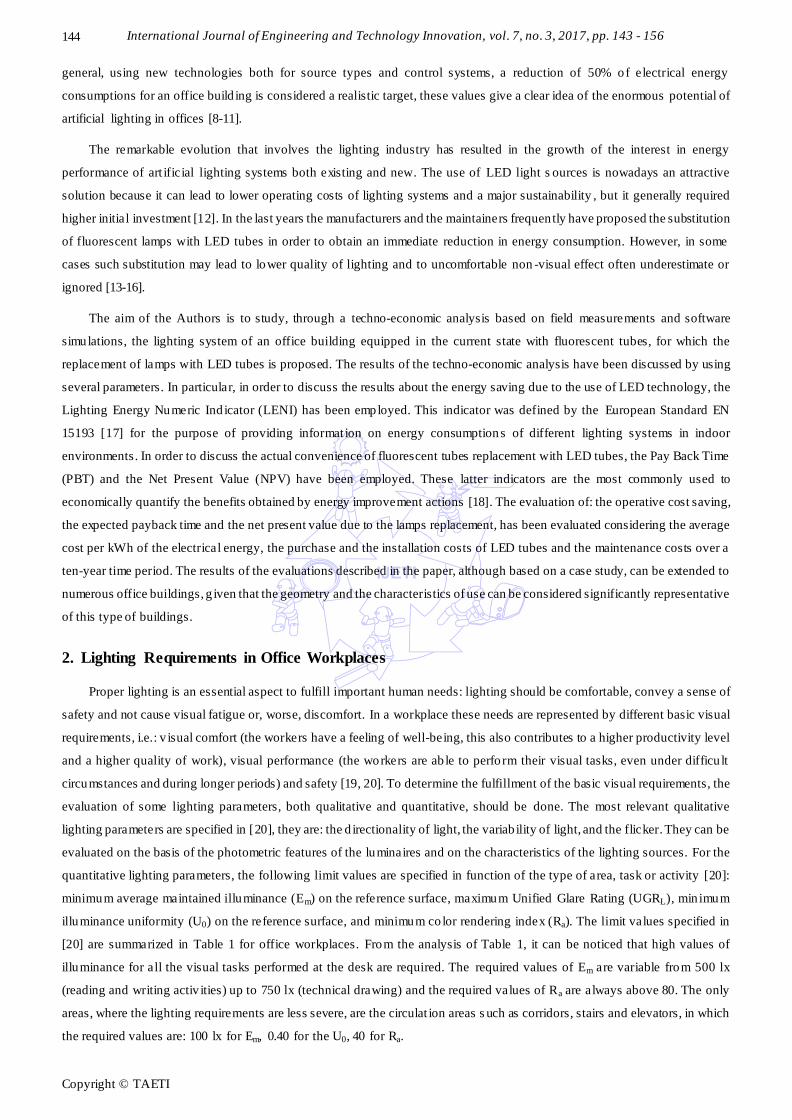
[20] are summarized in Table 1 for office workplaces. From the analysis of Table 1, it can be noticed that high values of
illuminance for all the visual tasks performed at the desk are required. The required values of Em are variable from 500 lx
(reading and writing activ ities) up to 750 lx (technical drawing) and the required values of Ra are always above 80. The only
areas, where the lighting requirements are less severe, are the circulat ion areas s uch as corridors, stairs and elevators, in which
the required values are: 100 lx for Em, 0.40 for the U0, 40 for Ra.
International Journal of Engineering and Technology Innovation, vol. 7, no. 3, 2017, pp. 143 - 156
Copyright © TAETI
145
Since the Authors carried out a techno-economic analysis, the compliance with the standard limit values shown in Table 1
has been verified only with the aim to identify a suitable solution for the fluorescent tubes replacement, among the LED tubes
commercially available.
Table 1 Lighting requirements for office workplaces [19]
Type of areas, task or activities Em (lx) U0(1)
UGRL Ra G
en
era
l
area
s Circulation areas and corridors
(2) 100 0.40 28 40
Stairs, escalators, travolators (3)
100 0.40 25 40
Elevators, lifts (4)
100 0.40 25 40
Loading ramps/bays 150 0.40 25 40
Off
ices
Flying, copying, etc. 300 0.40 19 80
Writing, typing, reading and processing (5)
500 0.60 19 80
Technical drawing 750 0.70 16 80
CAD work stations 500 0.60 19 80
Conference and meeting rooms (6)
500 0.60 19 80
Reception desk 300 0.60 22 80
Archives 200 0.40 25 80
Su
rfa
ces Walls (in office) 75 0.10 - -
Walls (in other rooms) 50 0.10 - -
Ceiling (in office) 50 0.10 - -
Ceiling (in other rooms) 25 0.10 - - (1) Illuminance uniformity: U0=Emin/Em. (2) Illuminance at floor level; Ra and UGRL similar to
adjacent areas; the lighting of exits and entrance shall provide a transition zone to avoid sudden changes in illuminance between inside and outside by day or night. (3) Requires
enhanced contrast on the steps. (4) Light level in front of the lift should be at least Em=200 lx. (5)
See lighting of work stations with DSE. (6) Lighting should be controllable.
3. The Office Building Used as Case Study
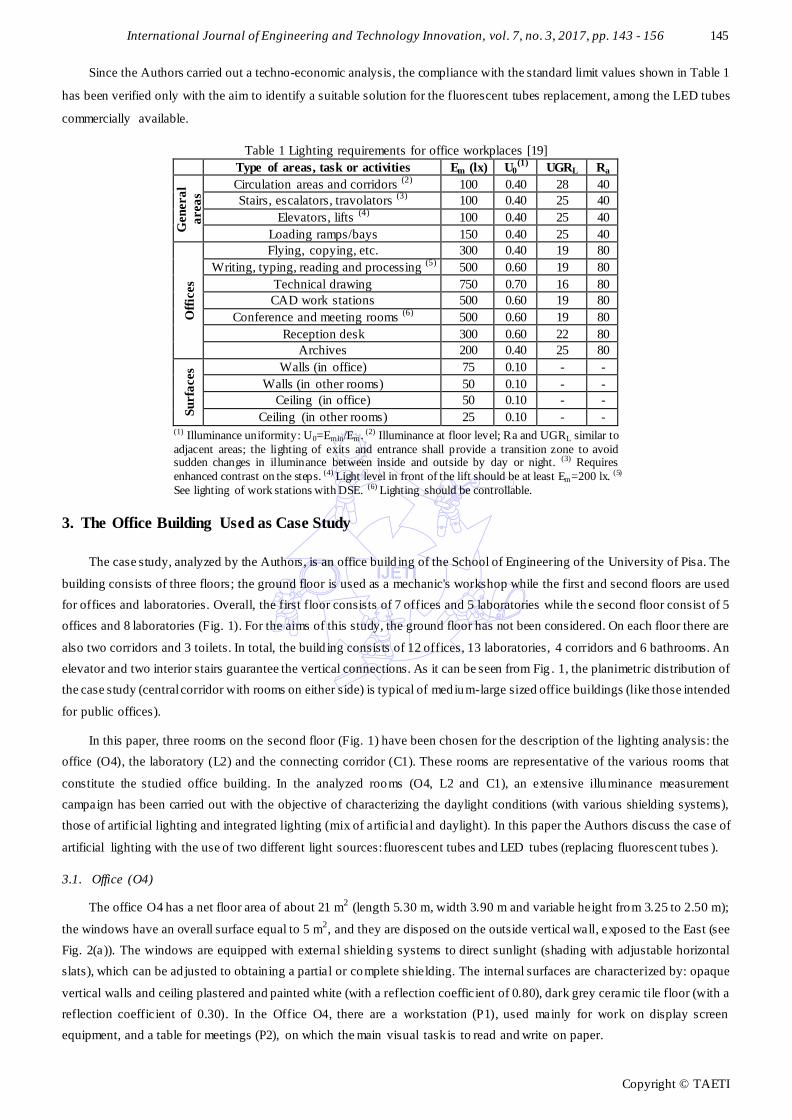
The case study, analyzed by the Authors, is an office build ing of the School of Engineering of the University of Pisa. The
building consists of three floors; the ground floor is used as a mechanic's workshop while the first and second floors are used
for offices and laboratories. Overall, the first floor consists of 7 offices and 5 laboratories while th e second floor consist of 5
offices and 8 laboratories (Fig. 1). For the aims of this study, the ground floor has not been considered. On each floor there are
also two corridors and 3 toilets. In total, the build ing consists of 12 offices, 13 laboratories, 4 corridors and 6 bathrooms. An
elevator and two interior stairs guarantee the vertical connections. As it can be seen from Fig . 1, the planimetric distribution of
the case study (central corridor with rooms on either side) is typical of medium-large sized office buildings (like those intended
for public offices).
In this paper, three rooms on the second floor (Fig. 1) have been chosen for the description of the lighting analysis: the
office (O4), the laboratory (L2) and the connecting corridor (C1). These rooms are representative of the various rooms that
constitute the studied office building. In the analyzed rooms (O4, L2 and C1), an extensive illuminance measurement
campaign has been carried out with the objective of characterizing the daylight conditions (with various shielding systems),
those of artificial lighting and integrated lighting (mix of artificial and daylight). In this paper the Authors discuss the case of
artificial lighting with the use of two different light sources: fluorescent tubes and LED tubes (replacing fluorescent tubes ).
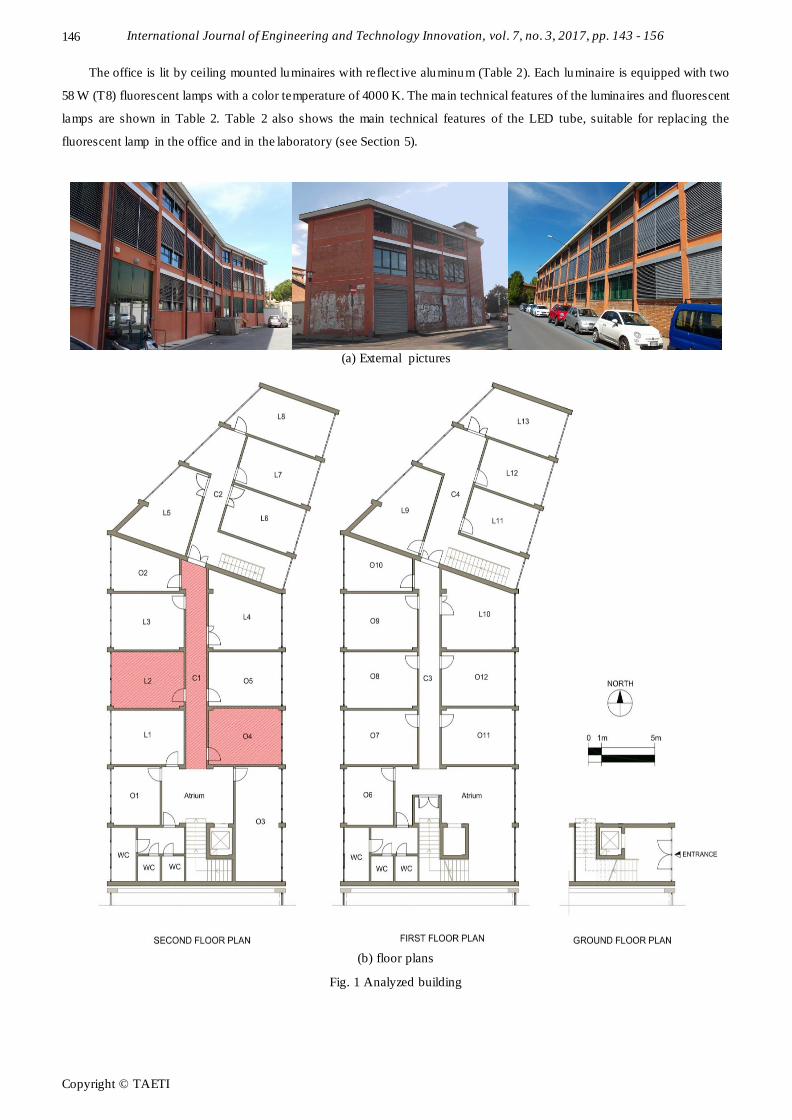
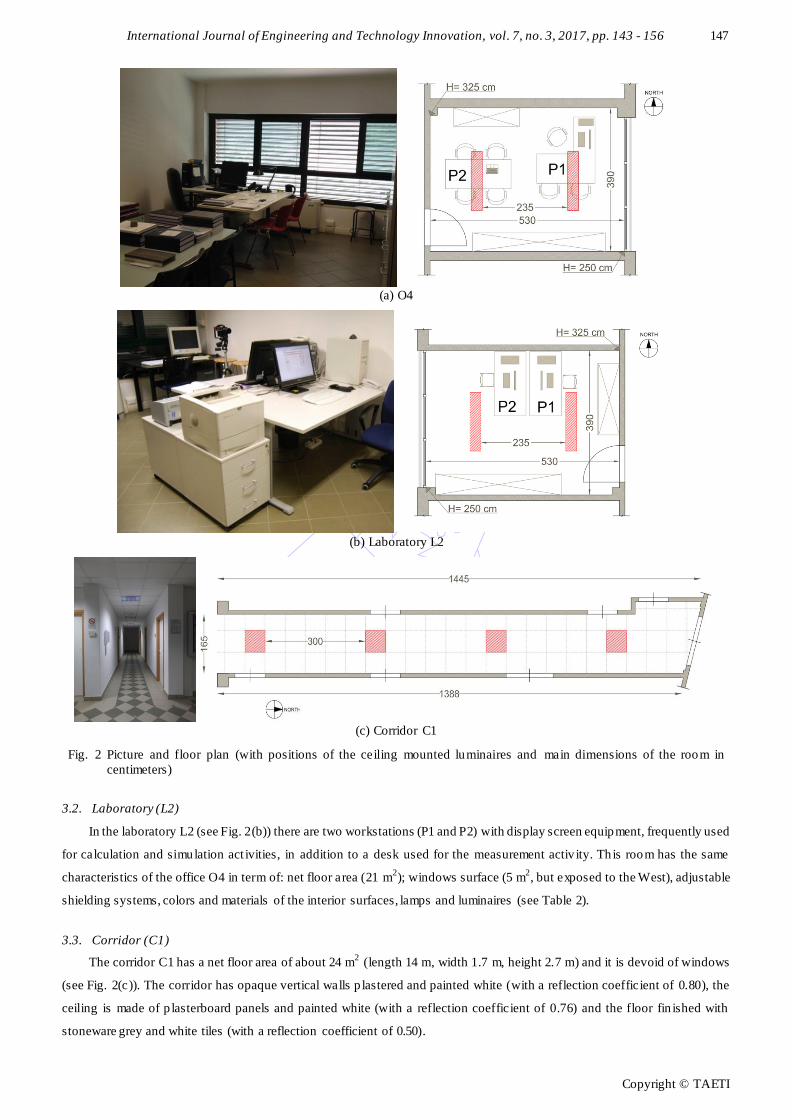
3.1. Office (O4)
The office O4 has a net floor area of about 21 m2 (length 5.30 m, width 3.90 m and variable height from 3.25 to 2.50 m);
the windows have an overall surface equal to 5 m2, and they are disposed on the outside vertical wall, exposed to the East (see
Fig. 2(a)). The windows are equipped with external shielding systems to direct sunlight (shading with adjustable horizontal
slats), which can be ad justed to obtaining a partial or complete shielding. The internal surfaces are characterized by: opaque
vertical walls and ceiling plastered and painted white (with a reflection coefficient of 0.80), dark grey ceramic tile floor (with a
reflection coefficient of 0.30). In the Office O4, there are a workstation (P1), used mainly for work on display screen
equipment, and a table for meetings (P2), on which the main visual task is to read and write on paper.
International Journal of Engineering and Technology Innovation, vol. 7, no. 3, 2017, pp. 143 - 156
Copyright © TAETI
146
The office is lit by ceiling mounted luminaires with reflect ive aluminum (Table 2). Each luminaire is equipped with two
58 W (T8) fluorescent lamps with a color temperature of 4000 K. The main technical features of the luminaires and fluorescent
lamps are shown in Table 2. Table 2 also shows the main technical features of the LED tube, suitable for replacing the
fluorescent lamp in the office and in the laboratory (see Section 5).
(a) External pictures
(b) floor plans
Fig. 1 Analyzed building
International Journal of Engineering and Technology Innovation, vol. 7, no. 3, 2017, pp. 143 - 156
Copyright © TAETI
147
(a) O4
(b) Laboratory L2
(c) Corridor C1
Fig. 2 Picture and floor plan (with positions of the ceiling mounted luminaires and main dimensions of the room in centimeters)
3.2. Laboratory (L2)
In the laboratory L2 (see Fig. 2(b)) there are two workstations (P1 and P2) with display screen equipment, frequently used
for calculation and simulation act ivities, in addition to a desk used for the measurement activ ity. Th is room has the same
characteristics of the office O4 in term of: net floor area (21 m2); windows surface (5 m
2, but exposed to the West), adjustable
shielding systems, colors and materials of the interior surfaces, lamps and luminaires (see Table 2).
3.3. Corridor (C1)
The corridor C1 has a net floor area of about 24 m2 (length 14 m, width 1.7 m, height 2.7 m) and it is devoid of windows
(see Fig. 2(c)). The corridor has opaque vertical walls p lastered and painted white (with a reflection coefficient of 0.80), the
ceiling is made of p lasterboard panels and painted white (with a reflection coefficient of 0.76) and the floor fin ished with
stoneware grey and white tiles (with a reflection coefficient of 0.50).
International Journal of Engineering and Technology Innovation, vol. 7, no. 3, 2017, pp. 143 - 156
Copyright © TAETI
148
The corridor is lighted by recessed luminaires installed in the ceiling and fitted with louver reflective aluminum (Table 3).
Each luminaire is equipped with four 18 W (T8) fluorescent lamps with co lor temperature o f 4000 K. The main technical
features of the luminaires and of the fluorescent lamps are shown in Table 3. Table 3 also shows the main technical features of
the 8 W LED tube, suitable for the replacement of the fluorescent lamp in the corridor (see Section 5).
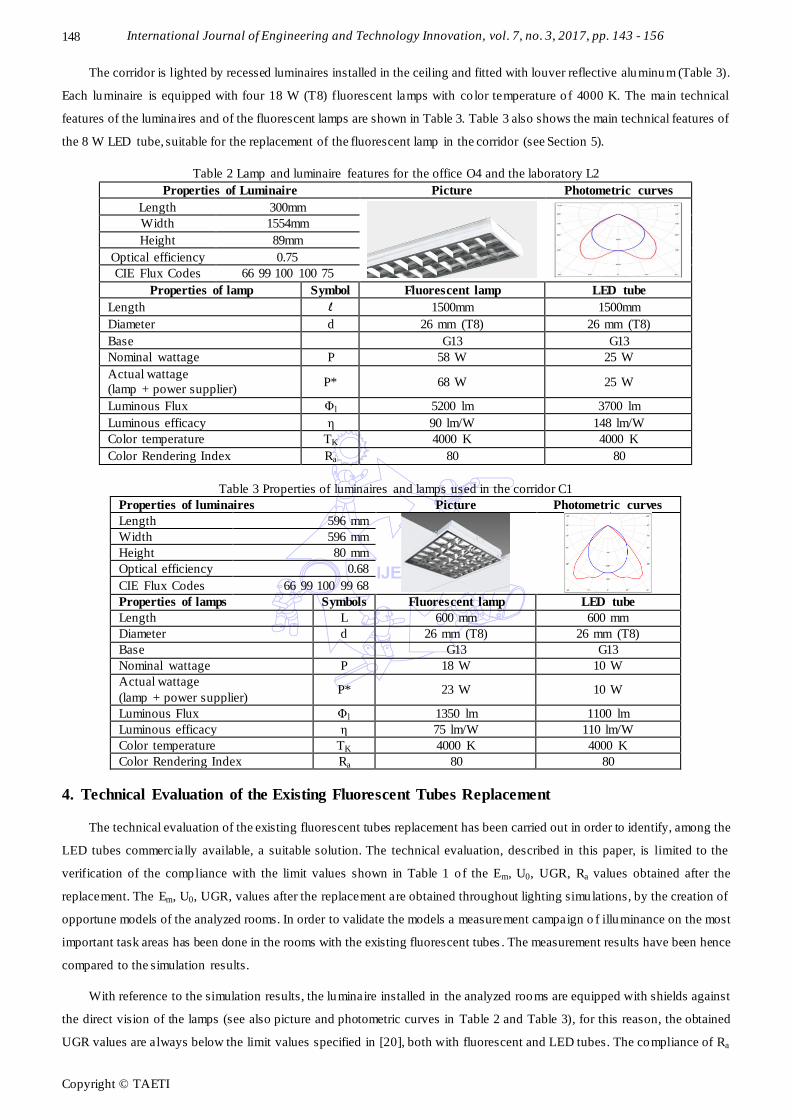
Table 2 Lamp and luminaire features for the office O4 and the laboratory L2
Properties of Luminaire Picture Photometric curves
Length 300mm
Width 1554mm
Height 89mm
Optical efficiency 0.75
CIE Flux Codes 66 99 100 100 75
Properties of lamp Symbol Fluorescent lamp LED tube
Length l 1500mm 1500mm
Diameter d 26 mm (T8) 26 mm (T8)
Base G13 G13
Nominal wattage P 58 W 25 W
Actual wattage
(lamp + power supplier) P* 68 W 25 W
Luminous Flux Φl 5200 lm 3700 lm
Luminous efficacy η 90 lm/W 148 lm/W
Color temperature TK 4000 K 4000 K
Color Rendering Index Ra 80 80
Table 3 Properties of luminaires and lamps used in the corridor C1
Properties of luminaires Picture Photometric curves
Length 596 mm
Width 596 mm
Height 80 mm
Optical efficiency 0.68
CIE Flux Codes 66 99 100 99 68
Properties of lamps Symbols Fluorescent lamp LED tube
Length L 600 mm 600 mm
Diameter d 26 mm (T8) 26 mm (T8)
Base G13 G13
Nominal wattage P 18 W 10 W
Actual wattage
(lamp + power supplier) P* 23 W 10 W
Luminous Flux Φl 1350 lm 1100 lm
Luminous efficacy η 75 lm/W 110 lm/W
Color temperature TK 4000 K 4000 K
Color Rendering Index Ra 80 80
4. Technical Evaluation of the Existing Fluorescent Tubes Replacement
The technical evaluation of the existing fluorescent tubes replacement has been carried out in order to identify, among the
LED tubes commercially available, a suitable solution. The technical evaluation, described in this paper, is limited to the
verification of the compliance with the limit values shown in Table 1 o f the Em, U0, UGR, Ra values obtained after the
replacement. The Em, U0, UGR, values after the replacement are obtained throughout lighting simulations, by the creation of
opportune models of the analyzed rooms. In order to validate the models a measurement campaign o f illuminance on the most
important task areas has been done in the rooms with the existing fluorescent tubes . The measurement results have been hence
compared to the simulation results.
With reference to the simulation results, the luminaire installed in the analyzed rooms are equipped with shields against
the direct vision of the lamps (see also picture and photometric curves in Table 2 and Table 3), for this reason, the obtained
UGR values are always below the limit values specified in [20], both with fluorescent and LED tubes. The compliance of Ra
International Journal of Engineering and Technology Innovation, vol. 7, no. 3, 2017, pp. 143 - 156
Copyright © TAETI
149
values of the LED tubes with the standard limit values has been verified by checking the technical data declared by the
manufacturer (see Table 2 and Table 3).
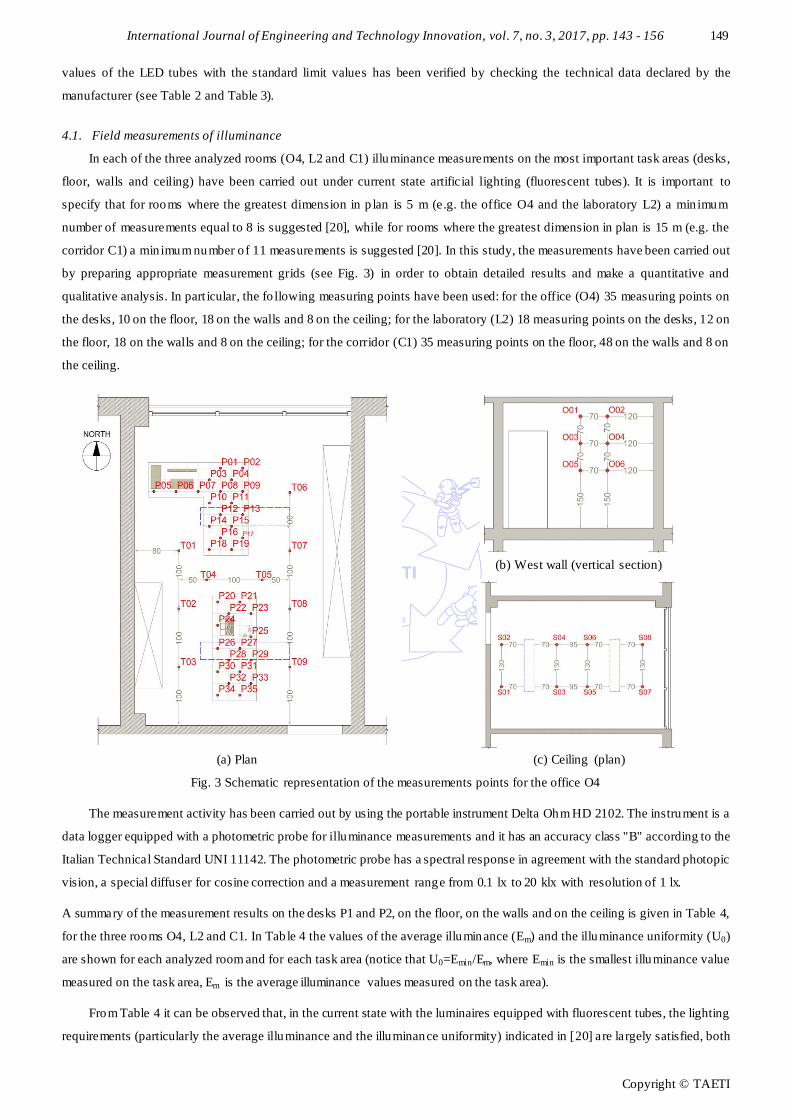
4.1. Field measurements of illuminance
In each of the three analyzed rooms (O4, L2 and C1) illuminance measurements on the most important task areas (desks,
floor, walls and ceiling) have been carried out under current state artificial lighting (fluorescent tubes). It is important to
specify that for rooms where the greatest dimension in p lan is 5 m (e.g. the office O4 and the laboratory L2) a min imum
number of measurements equal to 8 is suggested [20], while for rooms where the greatest dimension in plan is 15 m (e.g. the
corridor C1) a min imum number o f 11 measurements is suggested [20]. In this study, the measurements have been carried out
by preparing appropriate measurement grids (see Fig. 3) in order to obtain detailed results and make a quantitative and
qualitative analysis. In part icular, the fo llowing measuring points have been used: for the office (O4) 35 measuring points on
the desks, 10 on the floor, 18 on the walls and 8 on the ceiling; for the laboratory (L2) 18 measuring points on the desks, 12 on
the floor, 18 on the walls and 8 on the ceiling; for the corridor (C1) 35 measuring points on the floor, 48 on the walls and 8 on
the ceiling.
(b) West wall (vertical section)
(a) Plan (c) Ceiling (plan)
Fig. 3 Schematic representation of the measurements points for the office O4
The measurement activity has been carried out by using the portable instrument Delta Ohm HD 2102. The instrument is a
data logger equipped with a photometric probe for illuminance measurements and it has an accuracy class "B" according to the
Italian Technical Standard UNI 11142. The photometric probe has a spectral response in agreement with the standard photopic
vision, a special diffuser for cosine correction and a measurement range from 0.1 lx to 20 klx with resolution of 1 lx.
A summary of the measurement results on the desks P1 and P2, on the floor, on the walls and on the ceiling is given in Table 4,
for the three rooms O4, L2 and C1. In Tab le 4 the values of the average illuminance (Em) and the illuminance uniformity (U0)
are shown for each analyzed room and for each task area (notice that U0=Emin/Em, where Emin is the smallest illuminance value
measured on the task area, Em is the average illuminance values measured on the task area).
From Table 4 it can be observed that, in the current state with the luminaires equipped with fluorescent tubes, the lighting
requirements (particularly the average illuminance and the illuminance uniformity) indicated in [20] are largely satisfied, both
International Journal of Engineering and Technology Innovation, vol. 7, no. 3, 2017, pp. 143 - 156
Copyright © TAETI
150
on the desks (where the most demanding v isual tasks are performed) and on other surfaces (see Table 1). This large satisfaction
of normat ive values is not surprising, because the lamps are newly installed. In order to ensure the compliance with the
minimum lighting levels (in particular illuminance level and illuminance uniformity level) required by the standard for all t he
time interval that elapses between two successive interventions of lamps rep lacement (scheduled maintenance), in the design
stage it is necessary to provide an adequate over-sizing of the lighting system. The extent of the over-sizing depends on the
characteristics of the considered lamp type, in particular it depends on the variation of the photometric characteristics (main ly
reduction of the emitted luminous flux) in time.
Table 4 Current state (luminaires equipped with fluorescent tubes): measurement results for
average illuminance (Em) and illuminance uniformity (U0)
Desks
Floor Walls
Ceiling P1 P2 North South West East
O4 Em (lx) 748 739 556 186 137 116 333 113
U0 0.71 0.81 0.82 0.56 0.71 0.91 0.26 0.83
L2 Em (lx) 625 565 490 163 339 89 - 105
U0 0.71 0.64 0.71 0.48 0.67 0.96 - 0.83
C1 Em (lx) - - 404 133 - 256 286 132
U0 - - 0.70 0.84 - 0.56 0.50 0.91
4.2. Lighting simulations
The lighting market generally offers more solutions, also with significantly d ifferent technical characteristics, for the
replacement of each single existing fluorescent lamp. By way of example, the replacement of a 58 W fluorescent tube with
5200 lm of luminous flux (such as that indicated in Table 2) can be carried out with different LED tubes, with electric power in
the range from 20 W to 30 W and with luminous fluxes in the range f rom 1900 lm to 4000 lm. Therefore, choosing the right
lamp with which to make the rep lacement has to be preceded by a careful lighting analysis. For example , the choice of a lamp
with too low luminous flux may result in a failure to meet the standard requirements, on the contrary, the choice of a lamp with
a luminous flux comparable to that rep laced may be redundant, reducing the extent of the energy saving linked to the
replacement.
For the purpose of identifying the right lamps for the substitution in the case study, the authors have conducted a series of
simulations using DIALux Evo 4 lighting simulat ion software (www.dial.de). With this purpose, a model able to faithfully
reproduce the analyzed rooms has been created, the reflect ion coefficients of the interior surfaces have been set, the
photometric files related to luminaires have been imported and a maintenance factor (MF) eq ual to 0.80 has been assumed [21].
In order to validate the model, the calculation points were fixed in correspondence with all the points used for the field
measurements (e.g. see Fig. 3). In these points, in the current configuration (fluorescent lamps), the measured and simulated
values of illuminance were compared. The model (particularly the reflection coefficients of walls and furniture) was changed
according to the results of the comparison and it was validated when a standard deviation lower than the 5% was reached.
Table 5 The case of luminaires equipped with LED tubes: simulation results
for average illuminance (Em) and illuminance uniformity (U0)
Desks
Floor Walls
Ceiling P1 P2 North South West East
O4 Em (lx) 569 711 472 117 114 85 171 78
U0 0.67 0.69 0.79 0.72 0.69 0.94 0.44 0.86
L2 Em (lx) 680 612 414 140 269 89 - 77
U0 0.65 0.62 0.84 0.64 0.56 0.96 - 0.81
C1 Em (lx) - - 305 130 - 258 283 125
U0 - - 0.79 0.88 - 0.59 0.52 0.94
The results of the lighting simulations have allowed to identify the LED tubes indicated in Tables 2 and 3 as the most
suitable solutions present in the market for the replacement in the case study. A summary of the simulation results on the desks
International Journal of Engineering and Technology Innovation, vol. 7, no. 3, 2017, pp. 143 - 156
Copyright © TAETI
151
P1 and P2, on the floor, on the walls and on the ceiling is given in Table 5, for the analyzed rooms, similarly to what reported
for the measurement results (see Table 4). From the results of the simulations is evident the respect of the standard
requirements for illuminance and illuminance uniformity (see Table 5 and Table 1).
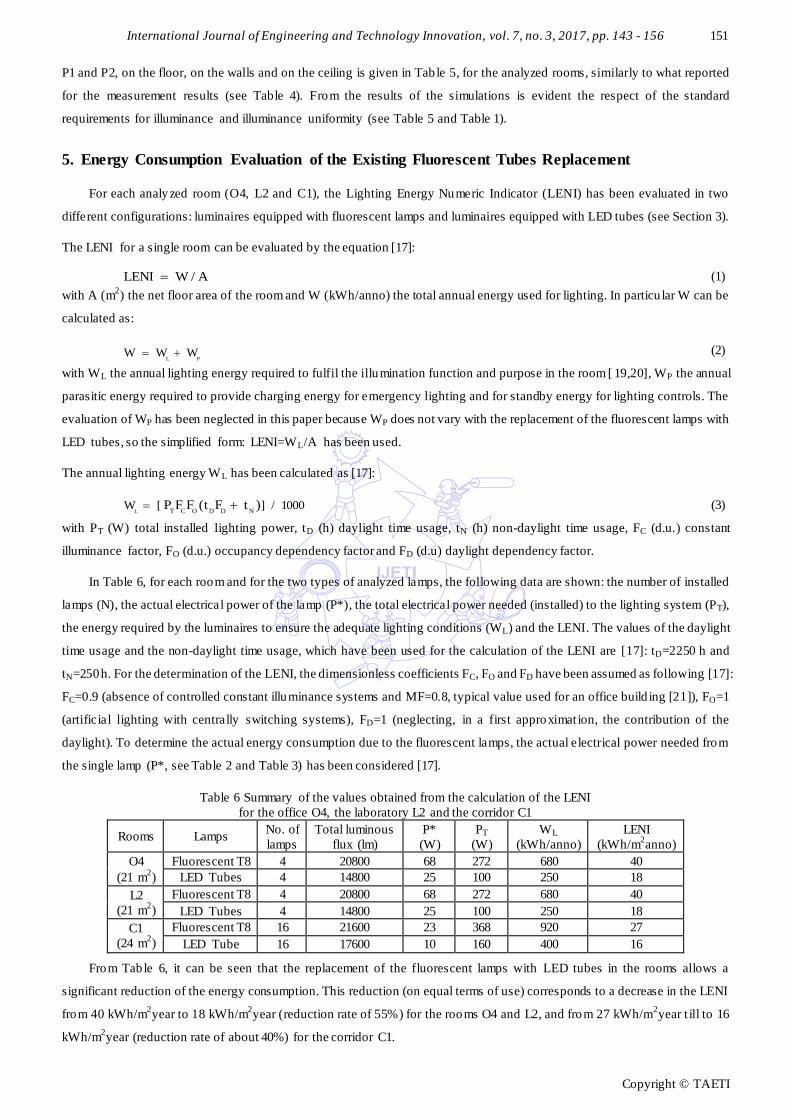
5. Energy Consumption Evaluation of the Existing Fluorescent Tubes Replacement
For each analy zed room (O4, L2 and C1), the Lighting Energy Numeric Indicator (LENI) has been evaluated in two
different configurations: luminaires equipped with fluorescent lamps and luminaires equipped with LED tubes (see Section 3).
The LENI for a single room can be evaluated by the equation [17]:
LENI W / A (1)
with A (m2) the net floor area of the room and W (kWh/anno) the total annual energy used for lighting. In particu lar W can be
calculated as:
L PW W W (2)
with WL the annual lighting energy required to fulfil the illumination function and purpose in the room [ 19,20], WP the annual
parasitic energy required to provide charging energy for emergency lighting and for standby energy for lighting controls. The
evaluation of WP has been neglected in this paper because WP does not vary with the replacement of the fluorescent lamps with
LED tubes, so the simplified form: LENI=WL/A has been used.
The annual lighting energy WL has been calculated as [17]:
L T C O D D NW [ ] / 1000P F F (t F t ) (3)
with PT (W) total installed lighting power, tD (h) daylight time usage, tN (h) non-daylight time usage, FC (d.u.) constant
illuminance factor, FO (d.u.) occupancy dependency factor and FD (d.u) daylight dependency factor.
In Table 6, for each room and for the two types of analyzed lamps, the following data are shown: the number of installed
lamps (N), the actual electrical power of the lamp (P*), the total electrical power needed (installed) to the lighting system (PT),
the energy required by the luminaires to ensure the adequate lighting conditions (WL) and the LENI. The values of the daylight
time usage and the non-daylight time usage, which have been used for the calculation of the LENI are [17]: tD=2250 h and
tN=250 h. For the determination of the LENI, the dimensionless coefficients FC, FO and FD have been assumed as following [17]:
FC=0.9 (absence of controlled constant illuminance systems and MF=0.8, typical value used for an office build ing [21]), FO=1
(artificial lighting with centrally switching systems), FD=1 (neglecting, in a first approximat ion, the contribution of the
daylight). To determine the actual energy consumption due to the fluorescent lamps, the actual electrical power needed from
the single lamp (P*, see Table 2 and Table 3) has been considered [17].
Table 6 Summary of the values obtained from the calculation of the LENI
for the office O4, the laboratory L2 and the corridor C1
Rooms Lamps No. of
lamps
Total luminous
flux (lm)
P*
(W)
PT
(W)
WL
(kWh/anno)
LENI
(kWh/m2anno)
O4
(21 m2)
Fluorescent T8 4 20800 68 272 680 40
LED Tubes 4 14800 25 100 250 18
L2
(21 m2)
Fluorescent T8 4 20800 68 272 680 40
LED Tubes 4 14800 25 100 250 18
C1
(24 m2)
Fluorescent T8 16 21600 23 368 920 27
LED Tube 16 17600 10 160 400 16
From Table 6, it can be seen that the replacement of the fluorescent lamps with LED tubes in the rooms allows a
significant reduction of the energy consumption. This reduction (on equal terms of use) corresponds to a decrease in the LENI
from 40 kWh/m2year to 18 kWh/m
2year (reduction rate of 55%) for the rooms O4 and L2, and from 27 kWh/m
2year t ill to 16
kWh/m2year (reduction rate of about 40%) for the corridor C1.
International Journal of Engineering and Technology Innovation, vol. 7, no. 3, 2017, pp. 143 - 156
Copyright © TAETI
152
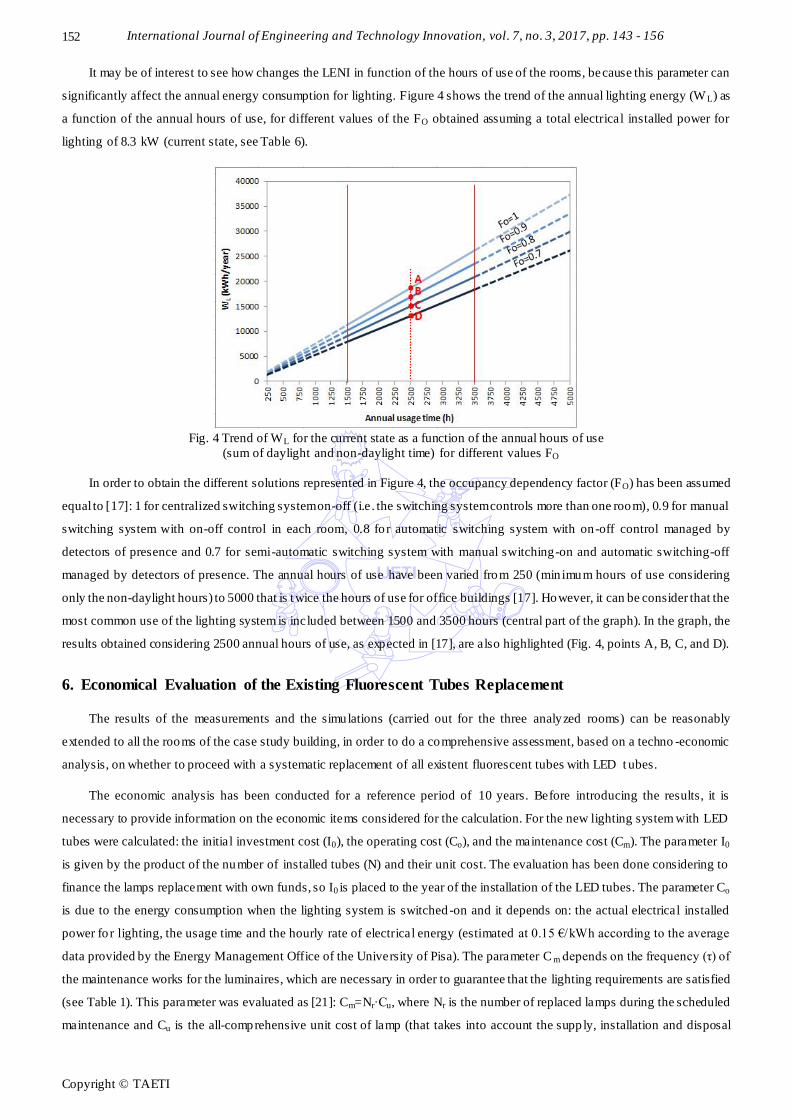
It may be of interest to see how changes the LENI in function of the hours of use of the rooms, because this parameter can
significantly affect the annual energy consumption for lighting. Figure 4 shows the trend of the annual lighting energy (W L) as
a function of the annual hours of use, for different values of the FO obtained assuming a total electrical installed power for
lighting of 8.3 kW (current state, see Table 6).
Fig. 4 Trend of WL for the current state as a function of the annual hours of use
(sum of daylight and non-daylight time) for different values FO
In order to obtain the different solutions represented in Figure 4, the occupancy dependency factor (FO) has been assumed
equal to [17]: 1 for centralized switching system on-off (i.e . the switching system controls more than one room), 0.9 for manual
switching system with on-off control in each room, 0.8 fo r automatic switching system with on-off control managed by
detectors of presence and 0.7 for semi-automatic switching system with manual switching-on and automatic switching-off
managed by detectors of presence. The annual hours of use have been varied from 250 (min imum hours of use considering
only the non-daylight hours) to 5000 that is twice the hours of use for office buildings [17]. However, it can be consider that the
most common use of the lighting system is included between 1500 and 3500 hours (central part of the graph). In the graph, the
results obtained considering 2500 annual hours of use, as expected in [17], are also highlighted (Fig. 4, points A, B, C, and D).
6. Economical Evaluation of the Existing Fluorescent Tubes Replacement
The results of the measurements and the simulations (carried out for the three analyzed rooms) can be reasonably
extended to all the rooms of the case study building, in order to do a comprehensive assessment, based on a techno -economic
analysis, on whether to proceed with a systematic replacement of all existent fluorescent tubes with LED t ubes.
The economic analysis has been conducted for a reference period of 10 years. Before introducing the results, it is
necessary to provide information on the economic items considered for the calculation. For the new lighting system with LED
tubes were calculated: the initial investment cost (I0), the operating cost (Co), and the maintenance cost (Cm). The parameter I0
is given by the product of the number of installed tubes (N) and their unit cost. The evaluation has been done considering to
finance the lamps replacement with own funds, so I0 is placed to the year of the installation of the LED tubes. The parameter Co
is due to the energy consumption when the lighting system is switched -on and it depends on: the actual electrical installed
power fo r lighting, the usage time and the hourly rate of electrical energy (estimated at 0.15 €/kWh according to the average
data provided by the Energy Management Office of the University of Pisa). The parameter C m depends on the frequency (τ) of
the maintenance works for the luminaires, which are necessary in order to guarantee that the lighting requirements are satisfied
(see Table 1). This parameter was evaluated as [21]: Cm=Nr∙Cu, where Nr is the number of replaced lamps during the scheduled
maintenance and Cu is the all-comprehensive unit cost of lamp (that takes into account the supp ly, installation and disposal
International Journal of Engineering and Technology Innovation, vol. 7, no. 3, 2017, pp. 143 - 156
Copyright © TAETI
153
costs usually applied in Italy). Co and Cm are referred to different years, respect to the year of the installation of the LED tubes
(base year). For this reason, they have to be reported to the base year by discounting proced ure. The discounting procedure
depends on discount rate (r). The discount rate is defined as the rate at which the investment revenues and costs are discoun ted
in order to calculate its present value. The choice of the r value should be based on the evaluator expert ise and done case by
case. Considering the type of intervention (lamps replacement) and the variability of electric energy costs, discount rates equal
to 2% and 4% are very commonly used [18] and then they have been applied to the present study. The discounting of the
individual cost parameter has been done by using the following equation: Cd=Ck/(1+r)k, where Cd (€) is the discounted cash
flow, Ck (€) is the cash flow expected in the k-year and r is the discount rate.
In order to consider the different usages of the lighting system, five scenarios have been defined (see Tab le 7). Each
scenario is characterized by a different value of the annual usage time of the lighting system that varies between 1500 and 3 500
hours.
To better understand the economic analysis and the Figs . 5 and 6, it is necessary to provide some indications on the
maintenance cost Cm. The frequency (τ) of the scheduled maintenance varies in function of the lamp type and the environment
type, it is influenced by the lighting requirements, which need to be satisfied, and by the technical data about the lamp survival
and lamp lumen maintenance provided by the manufacturers. Assuming MF=0.8 (see Section 6) and the data provided by the
manufacturer, for the case study the values of the maximum usage time (maximum t ime beyond which the lamps must be
replaced) are: 8000 hours for the fluorescent tubes and 16000 hours for the LED tubes. Through these calculated values, it has
been possible to evaluate τ for each scenario, the evaluation res ults are reported in Table 7.
Table 7 Evaluation of the frequency (τ) of the scheduled maintenance
for each lighting scenario in function of the annual usage time
1 2 3 4 5
Annual usage time (h) 1500 2000 2500 3000 3500
τ Fluorescent tubes
(years) 5 4 3 3 2
LED tubes 10 8 6 5 4
To properly assess the economic feasibility of the replacing linear fluorescent lamps with LED tubes , it is necessary to
take into account the benefits that can be achieved from the economic point of view, in addit ion to the in itial investment,
operating and maintenance costs. The expected benefits have been assessed in terms of economic benefit related t o the
electrical energy saving (Bo) and to the reduced maintenance (Bm) associated with the different type of lamps. The economic
costs and benefits, assessed for the reference period of 10 years, are shown on an annual basis in Table 8 for the five analyzed
scenarios (see Table 7). For each scenario, there are both the incoming and outgoing cash flows and it is possible to calcula te
the payback time (PBT) and the net present value (NPV). The intervention of refurb ishment is sustainable when NPV has
positive values during the analyzed period.
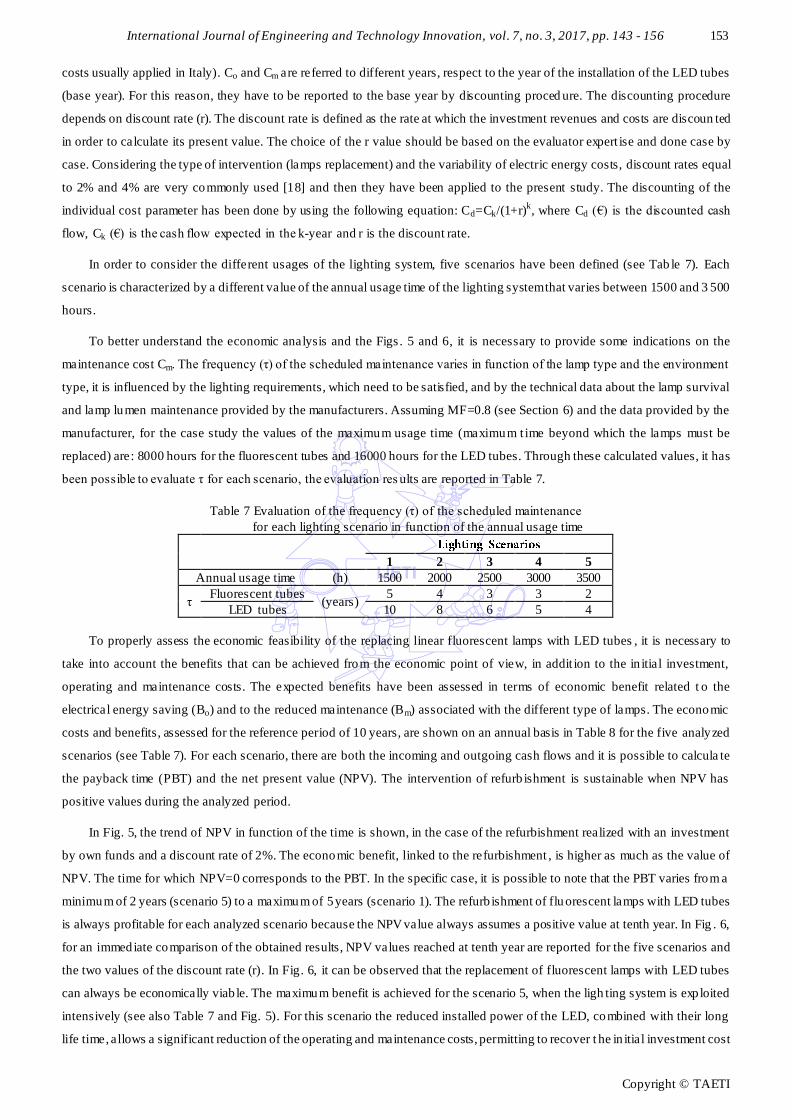
In Fig. 5, the trend of NPV in function of the time is shown, in the case of the refurbishment realized with an investment
by own funds and a discount rate of 2%. The economic benefit, linked to the refurbishment , is higher as much as the value of
NPV. The time for which NPV=0 corresponds to the PBT. In the specific case, it is possible to note that the PBT varies from a
minimum of 2 years (scenario 5) to a maximum of 5 years (scenario 1). The refurb ishment of flu orescent lamps with LED tubes
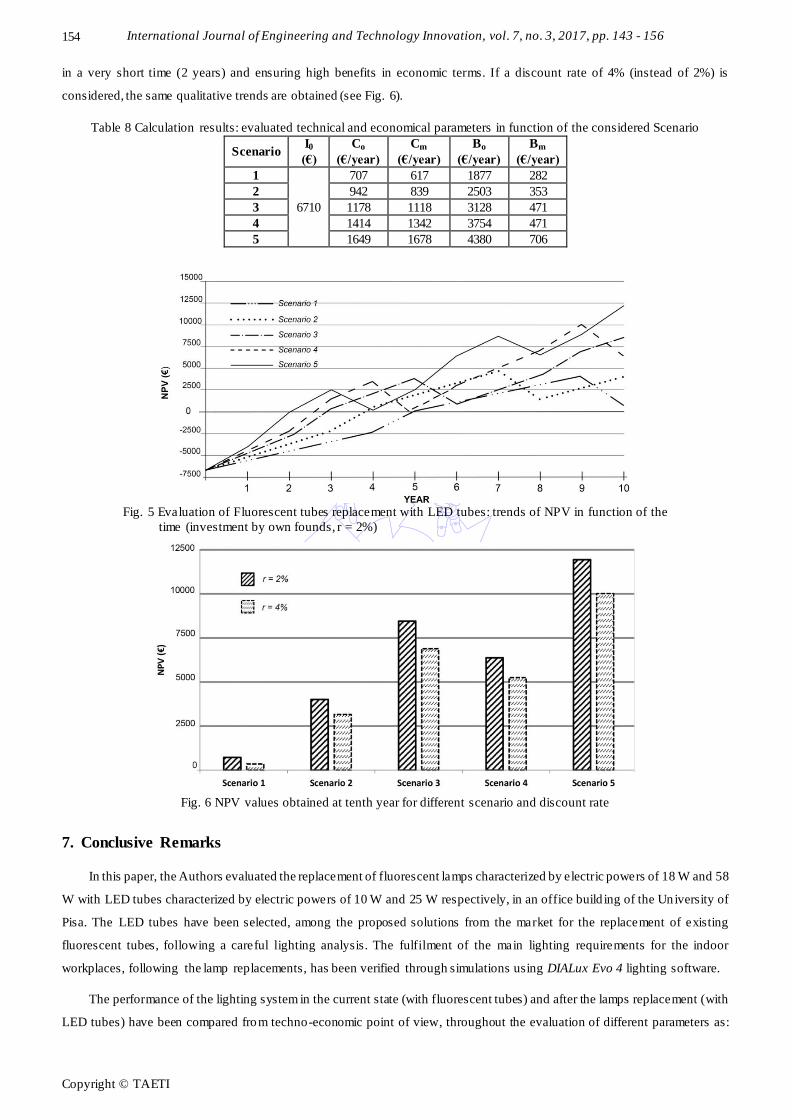
is always profitable for each analyzed scenario because the NPV value always assumes a positive value at tenth year. In Fig . 6,
for an immediate comparison of the obtained results, NPV values reached at tenth year are reported for the five scenarios and
the two values of the discount rate (r). In Fig. 6, it can be observed that the replacement of fluorescent lamps with LED tubes
can always be economically viab le. The maximum benefit is achieved for the scenario 5, when the ligh ting system is exp loited
intensively (see also Table 7 and Fig. 5). For this scenario the reduced installed power of the LED, combined with their long
life time, allows a significant reduction of the operating and maintenance costs, permitting to recover t he in itial investment cost
International Journal of Engineering and Technology Innovation, vol. 7, no. 3, 2017, pp. 143 - 156
Copyright © TAETI
154
in a very short time (2 years) and ensuring high benefits in economic terms. If a discount rate of 4% (instead of 2%) is
considered, the same qualitative trends are obtained (see Fig. 6).
Table 8 Calculation results: evaluated technical and economical parameters in function of the considered Scenario
Scenario I0
(€)
Co
(€/year)
Cm
(€/year)
Bo
(€/year)
Bm
(€/year)
1
6710
707 617 1877 282
2 942 839 2503 353
3 1178 1118 3128 471
4 1414 1342 3754 471
5 1649 1678 4380 706
Fig. 5 Evaluation of Fluorescent tubes replacement with LED tubes: trends of NPV in function of the
time (investment by own founds, r = 2%)
Fig. 6 NPV values obtained at tenth year for different scenario and discount rate
7. Conclusive Remarks
In this paper, the Authors evaluated the replacement of fluorescent lamps characterized by electric powers of 18 W and 58
W with LED tubes characterized by electric powers of 10 W and 25 W respectively, in an office build ing of the University of
Pisa. The LED tubes have been selected, among the proposed solutions from the market for the replacement of existing
fluorescent tubes, following a careful lighting analysis. The fulfilment of the main lighting requirements for the indoor
workplaces, following the lamp replacements, has been verified through simulations using DIALux Evo 4 lighting software.
The performance of the lighting system in the current state (with fluorescent tubes) and after the lamps replacement (with
LED tubes) have been compared from techno-economic point of view, throughout the evaluation of different parameters as:
International Journal of Engineering and Technology Innovation, vol. 7, no. 3, 2017, pp. 143 - 156
Copyright © TAETI
155
the Lighting Energy Numeric Indicator (LENI), the Net Present Value (NPV) and the Pay Back Time (PBT) related to the
lamps replacement. The evaluation has been carried out considering d ifferent values of the annual usage time, from 1500 hours
to 3500 hours. From the results it has been possible to point out the replacement of the fluorescent tubes with LED tubes
allowing a reduction in energy consumption for lighting higher than 50% with an obvious reduction in the annual operating
cost. The maximum benefit related to the lamps replacement is achieved when the lighting system is exp loited intensively
(annual usage time equal to 3500 hours). In this case the reduced installed power of the LED, combined with their long life time,
allows a significant reduction of the operating and maintenance costs, permitt ing to recover the initial investment cost in a very
short time (2 years) and ensuring high benefits in economic terms. The maximum benefit related to the lamps replacement may
be further improved as the quality and life of LED can be improved in the future.
The results of the evaluations described in the paper, although based on a case study, can be extended to numerous office
buildings, given that the geometry and the characteristics of use can be considered significantly representative of this type of
buildings. However it is important to remark that, since the solution proposed by the market for the replacement of each
fluorescent lamp is not unambiguous; the correct choice of the LED source must be made after a carefu l lighting analysis to be
conducted case by case.
References
[1] Guidelines for the promotion of nearly zero-energy build ings and best practices to ensure that, by 2020, all new buildings
are nearly zero-energy buildings, European Union, Commission Recommendation 2016/1318, 2016.
[2] Energy Consumption Guide 19-Energy use in Offices, Build ing Research Energy Conservation Support Unit (BRECSU),
Watford (UK), 2000.
[3] C. Aghemo, L. Blaso, and A. Pellegrino, “Building automation and control systems: a case study to evaluate the Energy
and environmental performances of a lighting control systems in offices,” Automation in Construction, vol. 43, pp. 10-22,
2014.
[4] F. Fantozzi, P. Galbiati, F. Leccese, G. Salvadori, and M. Rocca, “Thermal analysis of the building envelope of
lightweight temporary housing,” Journal of Physics: Conference Series, vol. 547, pp. 1-10, November 2014.
[5] M. C. Dubois and A. Blomsteberg, “Energy saving potential and strategies for electric lighting in future North Europe,
low energy office buildings: a literature review,” Energy and Buildings, vol. 43, no. 10, pp. 2572-2582, October 2011.
[6] F. Fantozzi, F. Leccese, G. Salvadori, and G. Tuoni, “Energy demand analysis and energy labelling of new residential
buildings in Tuscany (Italy),” WIT Transactions on Ecology and the Environment, vol. 122, pp. 217-229, 2009.
[7] Energy Efficiency Trends in Residential and Commercial Buildings , U.S. Department of Energy, October 2008.
[8] G. Salvadori, F. Fantozzi, M. Rocca, and F. Leccese, “The energy audit activity focused on the lighting systems in
historical buildings,” Energies, vol. 9, no. 12, pp. 1-13, November 2016.
[9] N. Khan and N. Abas, “Comparative study of energy saving light sources ,” Renewable and Sustainable Energy Reviews,
vol. 15, no. 1, pp. 296-309, January 2011.
[10] T. M. I. Mahlia, H. Abdul Razak, and M. A. Nursahida, “Life cycle cost analysis and payback period of lighting retrofit at
the University of Malaya,” Renewable and Sustainable Energy Reviews , vol. 15, no. 2, pp. 1125-1132, February 2011.
[11] A. Allouhi, Y. El Fouih, A. Jamil, Y. Zeraouili, and Y. Mourad, “Energy consumption and efficiency in buildings: current
status and future trends,” Journal of Cleaner Production, vol. 109, pp. 118-130, 2015.
[12] F. P. Vahl, L. M. S. Campos, and N. Casarotto Filho, “Sustainability constraints in techno-economic analysis of general
lighting retrofits ,” Energy and Buildings, vol. 67, pp. 500-507, 2013.
[13] W. R. Ryckaert, K. A. G. Smet, I. A. A. Roelandts, M. Van Gils, and P. Hanselaer, “Linear LED tubes versus fluorescent
lamps: An evaluation,” Energy and Buildings, vol. 49, pp. 429-436, June 2012.
[14] F. Leccese, G. Salvadori, M. Casini, and M. Bertozzi, “Analysis and measurements of artificial optical radiation (AOR)
emitted by lighting sources found in offices,” Sustainability, vol. 6, no. 9, pp. 5941-5954, September 2014.
[15] F. Leccese, V. Vandelanotte, G. Salvadori, and M. Rocca, “Blue light hazard and risk group class ification of 8 W LED
tubes, replacing fluorescent tubes, through optical radiation measurements,” Sustainability, vol. 7, no. 10, pp.
13454-13468, September 2015.
International Journal of Engineering and Technology Innovation, vol. 7, no. 3, 2017, pp. 143 - 156
Copyright © TAETI
156
[16] D. N. Berlov, T. I. Baranova, F. Bisegna, L. P. Pav lova, A. V. A ladov, A. L. Zakgeim, M. N. Mizerov, and Y. A. Chiligina,
“Research perspectives of the influence of lighting modes on changes of human functional state by means of smart
lighting,” IEEE 15th International Conf. Environment and Electrical Engineering, IEEE Press, July 2015, pp. 1426-1430.
[17] Energy performance of build ings - Energy requirements for lighting, European Committee for Standardization EN 15193,
Brussels 2007 (in Italy UNI EN 15193, March 2008).
[18] G. Dall'O', Green energy audit of build ings - A guide for a sustainable energy audit of buildings , Berlin; Springer-Verlag
GmbH, 2013.
[19] F. Leccese, G. Salvadori, M. Casini, and M. Bertozzi, “Lighting of indoor work p laces: risk assessment procedure,” WIT
Transactions and Communication Technologies, vol. 44, pp. 89-101, 2012.
[20] Light and lighting - Lighting of work places, European Committee for Standardization EN 12464-1, Brussels, 2011 (in
Italy UNI EN 12464-1, July 2011).
[21] International Commission on illumination (CIE), Guide on the Maintenance of Indoor Electric Lighting Systems , CIE:
Vienna (A), 2005.