Embed Size (px)
Citation preview
General Manager’s Report
November 13, 2019 Page 1
Training Technicians for an Electric Bus Fleet– On October 22, 2019, the American Public Transportation Association’s Bus
Technical Maintenance Committee hosted a zero emission bus training webinar for nearly 100 registered participants. The three‐
agency transit panel included AC Transit, Metro Transit (Minneapolis), and LA Metro. AC Transit staff Michael Flocchini – Training
and Education Manager and Jose Vega – Lead ZEB Maintenance Trainer, started the panel discussion. AC Transit presented
information on how best to create a ZEB training plan, develop and track progress, identify training challenges, and the value of
partnerships with original equipment manufacturer (OEM) and sub‐component suppliers.
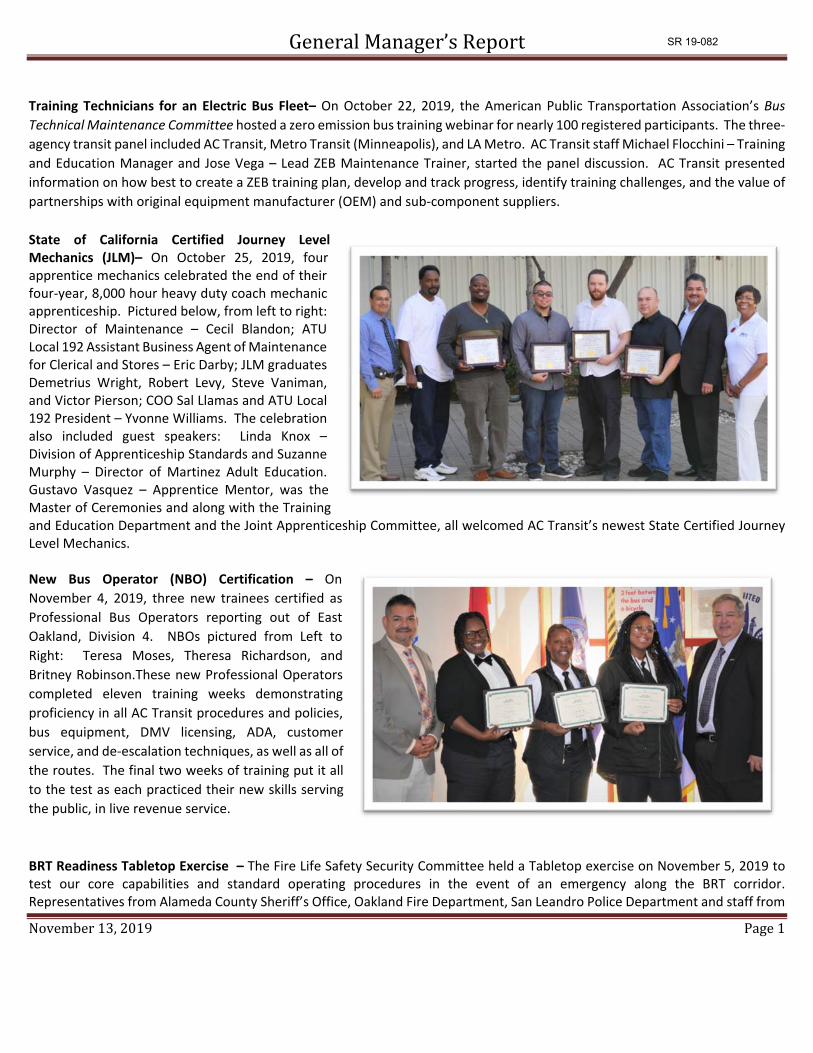
State of California Certified Journey Level Mechanics (JLM)– On October 25, 2019, four apprentice mechanics celebrated the end of their four‐year, 8,000 hour heavy duty coach mechanic apprenticeship. Pictured below, from left to right: Director of Maintenance – Cecil Blandon; ATU Local 192 Assistant Business Agent of Maintenance for Clerical and Stores – Eric Darby; JLM graduates Demetrius Wright, Robert Levy, Steve Vaniman, and Victor Pierson; COO Sal Llamas and ATU Local 192 President – Yvonne Williams. The celebration also included guest speakers: Linda Knox – Division of Apprenticeship Standards and Suzanne Murphy – Director of Martinez Adult Education. Gustavo Vasquez – Apprentice Mentor, was the Master of Ceremonies and along with the Training and Education Department and the Joint Apprenticeship Committee, all welcomed AC Transit’s newest State Certified Journey Level Mechanics.
New Bus Operator (NBO) Certification – On
November 4, 2019, three new trainees certified as
Professional Bus Operators reporting out of East
Oakland, Division 4. NBOs pictured from Left to
Right: Teresa Moses, Theresa Richardson, and
Britney Robinson.These new Professional Operators
completed eleven training weeks demonstrating
proficiency in all AC Transit procedures and policies,
bus equipment, DMV licensing, ADA, customer
service, and de‐escalation techniques, as well as all of
the routes. The final two weeks of training put it all
to the test as each practiced their new skills serving
the public, in live revenue service.
BRT Readiness Tabletop Exercise – The Fire Life Safety Security Committee held a Tabletop exercise on November 5, 2019 to test our core capabilities and standard operating procedures in the event of an emergency along the BRT corridor. Representatives from Alameda County Sheriff’s Office, Oakland Fire Department, San Leandro Police Department and staff from
SR 19-082

General Manager’s Report
November 13, 2019 Page 2
AC Transit Operations Control Center worked through a predetermined incident that involved a serious collision involving injuries and a possible fatality. Serving as observes and advisors were staff from Transportation, Maintenance and the Training and Education Center. The exercise proved beneficial for AC Transit staff and First Responders and reinforced our commitment to operating a safe and reliable service to our community.
Transportation Division of the Quarter– Every Quarter, the Transportation Department recognizes the Division of the Quarter. This recognition is based on Key Performance Indicator weighted scores on the following: On Time Performance, Log on Rate, Operator Unscheduled Availability; and Accident Rate (Vehicle/Passenger Falls). The Division winner is awarded with a celebration for the team along with the trophy. At this celebration, the last Division winner passes the trophy to the new winning Division team. All divisions have strived to earn this prestigious award and the competitive fire amongst the teams is exciting. For the 1st Quarter of FY 2020, the Richmond Division 3 put up some impressive stats and won the Transportation Division of the Quarter Award. Congratulations Division 3!
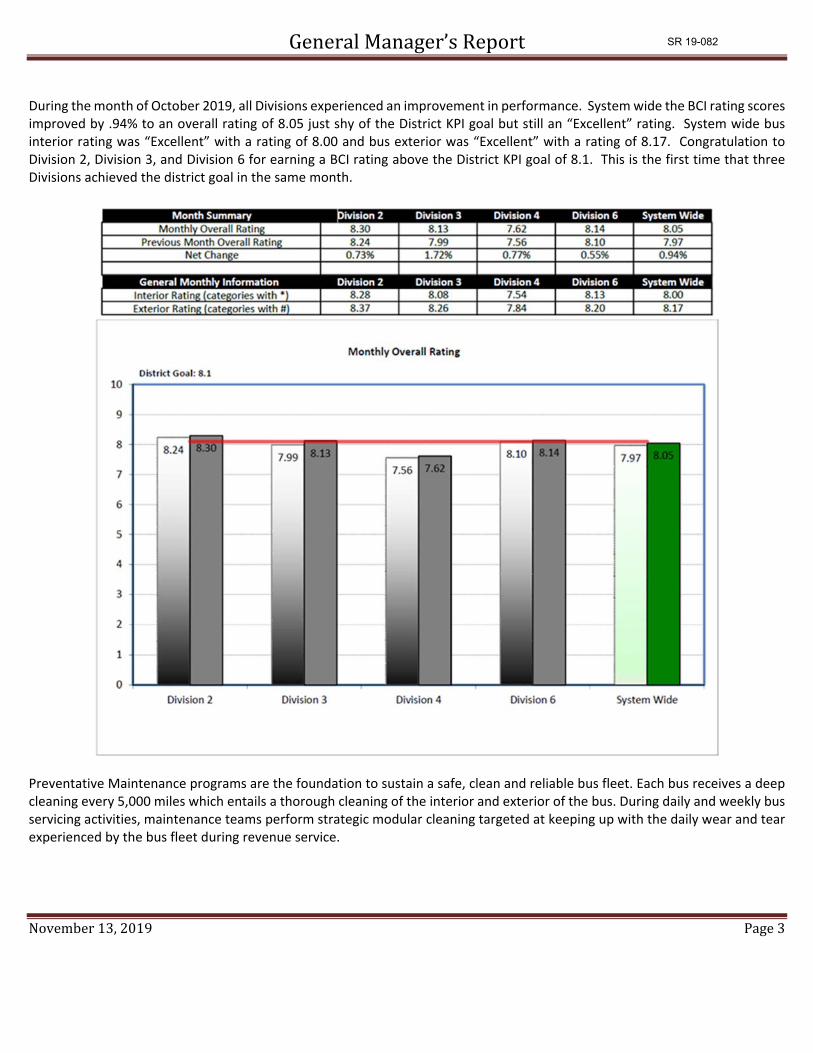
Bus Cleanliness Inspection (BCI)– Quality Assurance performs monthly Division Bus Cleanliness Inspections (BCI) using a grading criterion focused on 19 areas of the bus (14 internal and 5 external) to allow Division staff to align resources and programs to improve the overall cleanliness and appearance of the fleet. Ratings of 1‐4 are listed as Unsatisfactory, 5‐7 is Satisfactory, and 8‐10 is Excellent.
SR 19-082
General Manager’s Report
November 13, 2019 Page 3
During the month of October 2019, all Divisions experienced an improvement in performance. System wide the BCI rating scores improved by .94% to an overall rating of 8.05 just shy of the District KPI goal but still an “Excellent” rating. System wide bus interior rating was “Excellent” with a rating of 8.00 and bus exterior was “Excellent” with a rating of 8.17. Congratulation to Division 2, Division 3, and Division 6 for earning a BCI rating above the District KPI goal of 8.1. This is the first time that three Divisions achieved the district goal in the same month.
Preventative Maintenance programs are the foundation to sustain a safe, clean and reliable bus fleet. Each bus receives a deep cleaning every 5,000 miles which entails a thorough cleaning of the interior and exterior of the bus. During daily and weekly bus servicing activities, maintenance teams perform strategic modular cleaning targeted at keeping up with the daily wear and tear experienced by the bus fleet during revenue service.
SR 19-082
General Manager’s Report
November 13, 2019 Page 4
Zero Loss Injury– Congratulations to Maintenance Departments at D3, D4, D6 and CMF as they had ZERO loss time injuries for the first quarter for FY20. The team in maintenance continues to successfully conduct repairs to the fleet and facilities in a safe manner. In acknowledgement of this accomplishment, each division will be having a celebration to promote this milestone. Blue Shield Building Opening and Employee Welcome To Oakland‐ On November 5th, Legislative Affairs Representative, Chantal Reynolds, attended Blue Shield’s Building opening in Downtown Oakland. Blue Shield relocated to Oakland from San Franciso after 80 years of doing business from its headquarters in San Franscico. Employees attended a Ribbon Cutting ceremeny that included Tatyana Kalinga, District Director for Congresswoman Barbara Lee, Mayor Libby Schaaff, and District 3 Oakland City Councilmember Lynette Gibson McElhaney. The welcome celebration also included resource tables, food vendors, games and a host other activities and festivities. AC Transit and BART shared a booth providing giveaways and information about transportation options for the new employees.
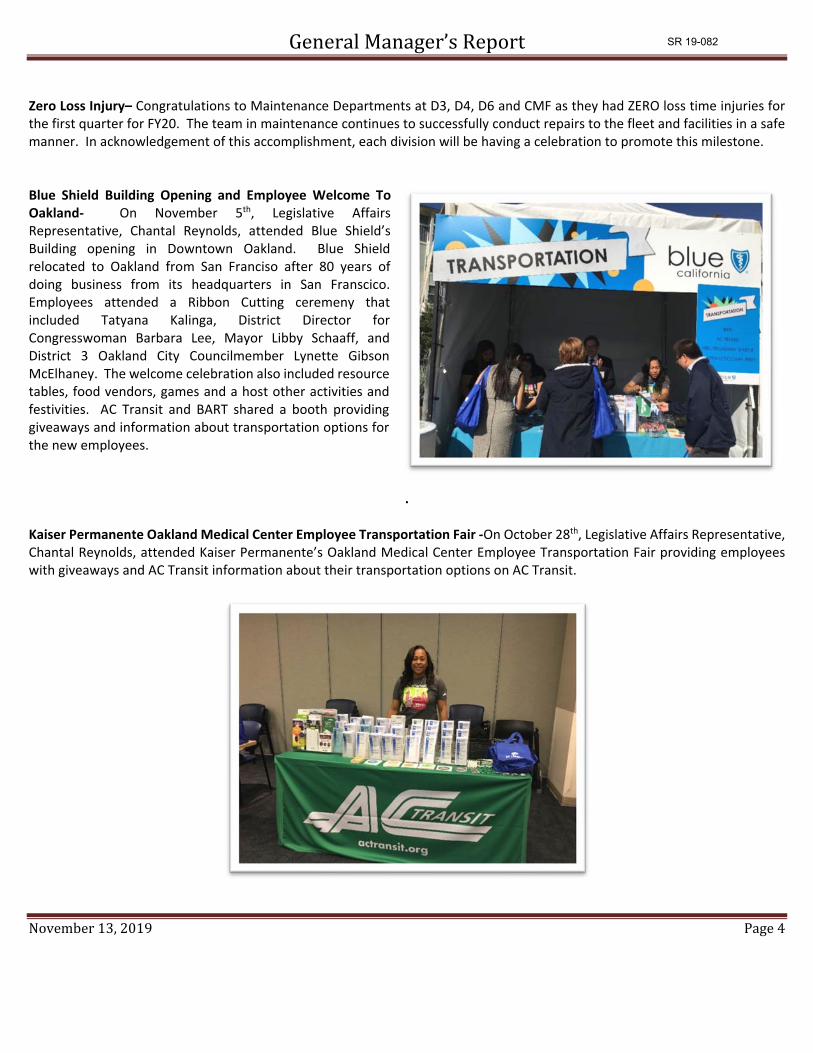
. Kaiser Permanente Oakland Medical Center Employee Transportation Fair ‐On October 28th, Legislative Affairs Representative, Chantal Reynolds, attended Kaiser Permanente’s Oakland Medical Center Employee Transportation Fair providing employees with giveaways and AC Transit information about their transportation options on AC Transit.
SR 19-082
General Manager’s Report
November 13, 2019 Page 5
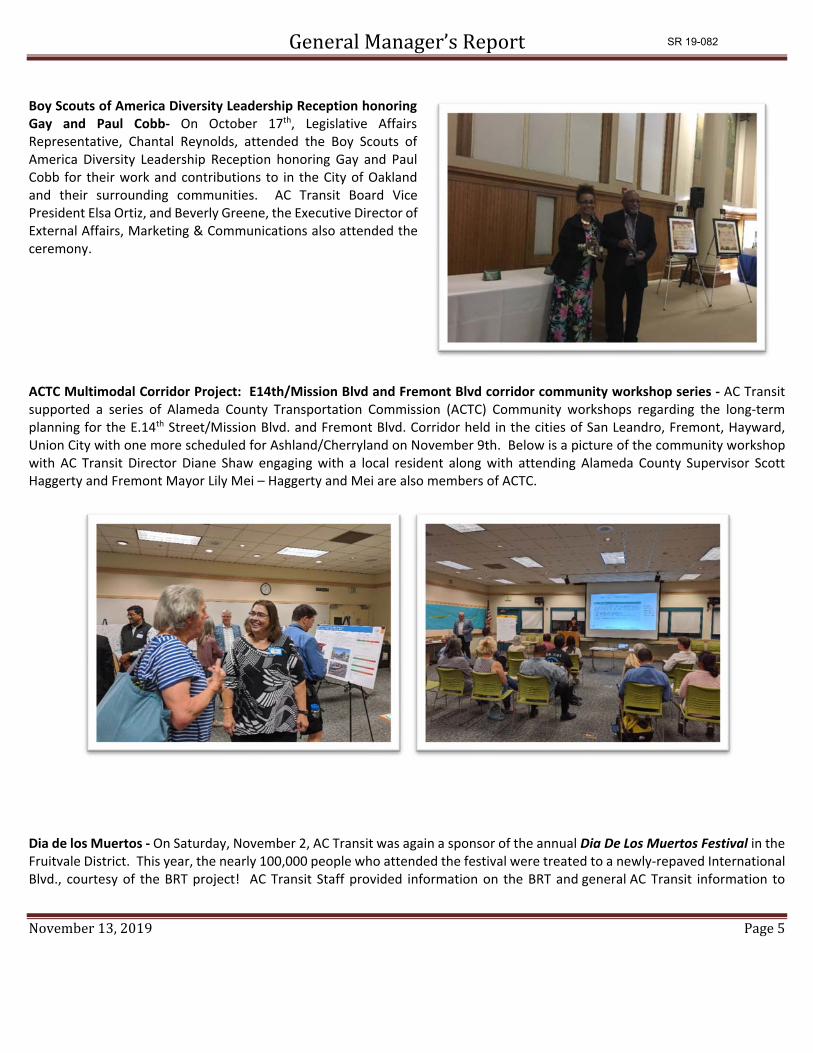
Boy Scouts of America Diversity Leadership Reception honoring Gay and Paul Cobb‐ On October 17th, Legislative Affairs Representative, Chantal Reynolds, attended the Boy Scouts of America Diversity Leadership Reception honoring Gay and Paul Cobb for their work and contributions to in the City of Oakland and their surrounding communities. AC Transit Board Vice President Elsa Ortiz, and Beverly Greene, the Executive Director of External Affairs, Marketing & Communications also attended the ceremony.
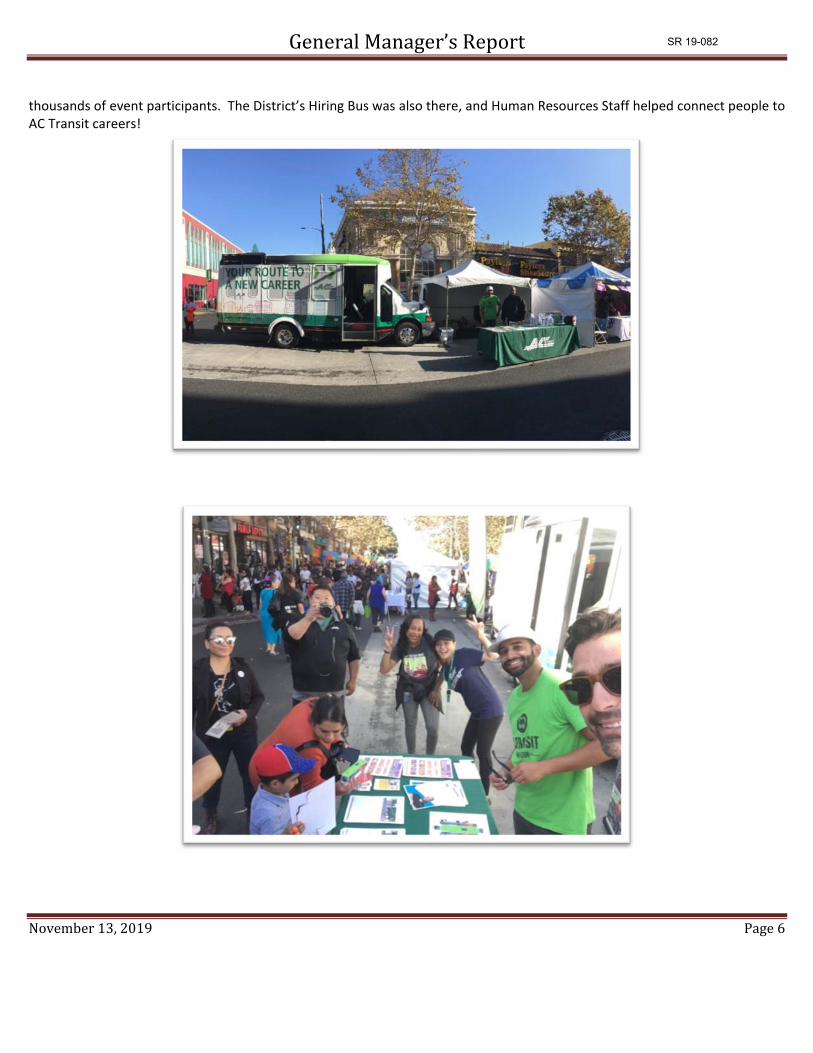
ACTC Multimodal Corridor Project: E14th/Mission Blvd and Fremont Blvd corridor community workshop series ‐ AC Transit supported a series of Alameda County Transportation Commission (ACTC) Community workshops regarding the long‐term planning for the E.14th Street/Mission Blvd. and Fremont Blvd. Corridor held in the cities of San Leandro, Fremont, Hayward, Union City with one more scheduled for Ashland/Cherryland on November 9th. Below is a picture of the community workshop with AC Transit Director Diane Shaw engaging with a local resident along with attending Alameda County Supervisor Scott Haggerty and Fremont Mayor Lily Mei – Haggerty and Mei are also members of ACTC.
Dia de los Muertos ‐ On Saturday, November 2, AC Transit was again a sponsor of the annual Dia De Los Muertos Festival in the Fruitvale District. This year, the nearly 100,000 people who attended the festival were treated to a newly‐repaved International Blvd., courtesy of the BRT project! AC Transit Staff provided information on the BRT and general AC Transit information to
SR 19-082
General Manager’s Report
November 13, 2019 Page 6
thousands of event participants. The District’s Hiring Bus was also there, and Human Resources Staff helped connect people to AC Transit careers!
SR 19-082
Executive Reporting
As of September 30, 2019
Contents
1. Budget Summary – Overview 2. Budget Summary – Chart 3. Positions Summary 4. Farebox Revenue and Ridership
SR 19-082

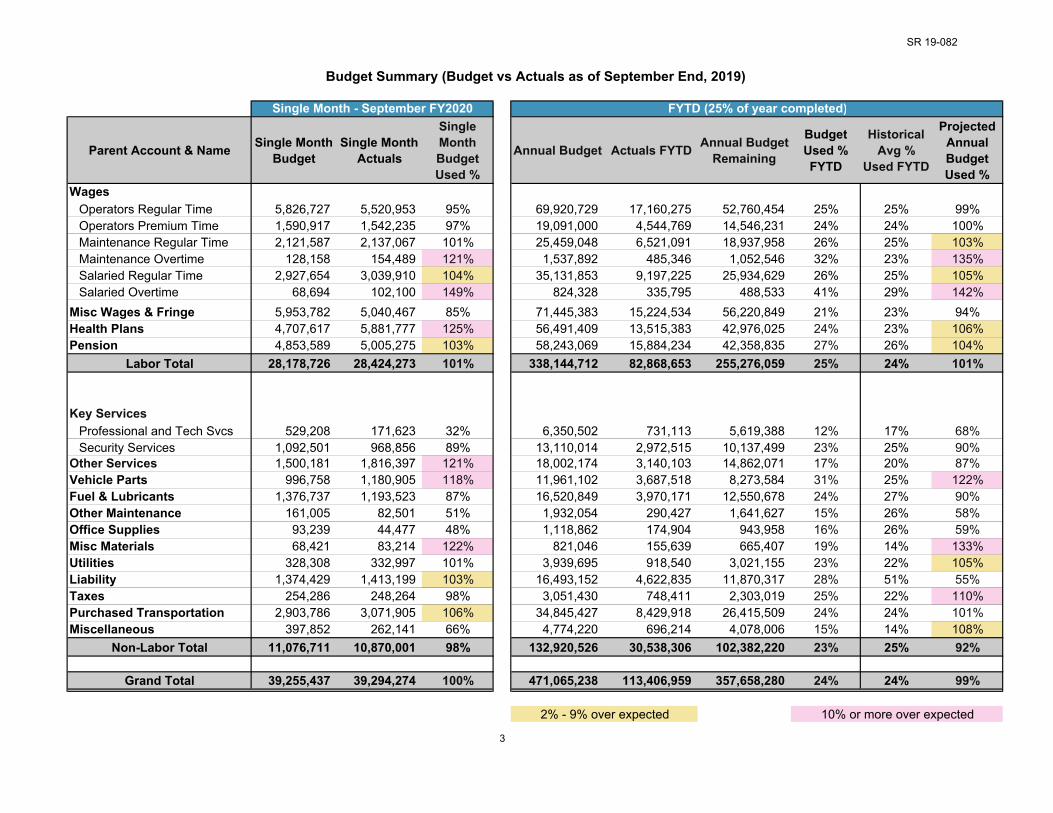
Budget Summary - Overview
Overview
• Overall o Overall the District is on track for expenses, with the projected annual budget used for both Labor and non-Labor
tracking closely to the annual budget. • Total Labor
o Total Labor expenses are slightly above the monthly budget projection, mostly because of the Labor Day holiday and the need to pay Overtime for employees who work on the holiday.
o Regular Time is slightly above budget for the monthly projection due to September having a higher number of weekdays than the average month.
o Maintenance Overtime is over budget due to vacancies in janitor and service employee positions. o Salaried Overtime is over budget due to a high proportion of vacant supervisory positions in Operations, the Salesforce
Transit Center re-start in early August, and work related to an upgrade of PeopleSoft o Miscellaneous Wages and Fringe are under budget, primarily due to lower use of Worker’s Compensation. o Health Plan expenses are over budget due to timing. The month of August was under budget for this category.
• Total Non-Labor o Total Non-Labor expenses are below budget. It is common for non-labor expenses to lag due to billing delays with the
new fiscal year. o Other Services are higher than the monthly budget due to the quarterly payment schedule of the District’s share of
operations and maintenance expenses for the Salesforce Transit Center. The annual projection is expected to stay within budget.
o Vehicle Parts expenses are over budget due to the timing of expenses. o Miscellaneous Materials is over budget due to timing of annual payments for two contracts (for Bottled Water and
Clipper Cards) occurring in September.
SR 19-082
Parent Account & Name Single Month Budget
Single Month Actuals
Single Month Budget Used %
Annual Budget Actuals FYTD Annual Budget Remaining
Budget Used % FYTD
Historical Avg %
Used FYTD
Projected Annual Budget Used %
WagesOperators Regular Time 5,826,727 5,520,953 95% 69,920,729 17,160,275 52,760,454 25% 25% 99%Operators Premium Time 1,590,917 1,542,235 97% 19,091,000 4,544,769 14,546,231 24% 24% 100%Maintenance Regular Time 2,121,587 2,137,067 101% 25,459,048 6,521,091 18,937,958 26% 25% 103%Maintenance Overtime 128,158 154,489 121% 1,537,892 485,346 1,052,546 32% 23% 135%Salaried Regular Time 2,927,654 3,039,910 104% 35,131,853 9,197,225 25,934,629 26% 25% 105%Salaried Overtime 68,694 102,100 149% 824,328 335,795 488,533 41% 29% 142%
Misc Wages & Fringe 5,953,782 5,040,467 85% 71,445,383 15,224,534 56,220,849 21% 23% 94%Health Plans 4,707,617 5,881,777 125% 56,491,409 13,515,383 42,976,025 24% 23% 106%Pension 4,853,589 5,005,275 103% 58,243,069 15,884,234 42,358,835 27% 26% 104%
Labor Total 28,178,726 28,424,273 101% 338,144,712 82,868,653 255,276,059 25% 24% 101%
Key ServicesProfessional and Tech Svcs 529,208 171,623 32% 6,350,502 731,113 5,619,388 12% 17% 68%Security Services 1,092,501 968,856 89% 13,110,014 2,972,515 10,137,499 23% 25% 90%
Other Services 1,500,181 1,816,397 121% 18,002,174 3,140,103 14,862,071 17% 20% 87%Vehicle Parts 996,758 1,180,905 118% 11,961,102 3,687,518 8,273,584 31% 25% 122%Fuel & Lubricants 1,376,737 1,193,523 87% 16,520,849 3,970,171 12,550,678 24% 27% 90%Other Maintenance 161,005 82,501 51% 1,932,054 290,427 1,641,627 15% 26% 58%Office Supplies 93,239 44,477 48% 1,118,862 174,904 943,958 16% 26% 59%Misc Materials 68,421 83,214 122% 821,046 155,639 665,407 19% 14% 133%Utilities 328,308 332,997 101% 3,939,695 918,540 3,021,155 23% 22% 105%Liability 1,374,429 1,413,199 103% 16,493,152 4,622,835 11,870,317 28% 51% 55%Taxes 254,286 248,264 98% 3,051,430 748,411 2,303,019 25% 22% 110%Purchased Transportation 2,903,786 3,071,905 106% 34,845,427 8,429,918 26,415,509 24% 24% 101%Miscellaneous 397,852 262,141 66% 4,774,220 696,214 4,078,006 15% 14% 108%
Non-Labor Total 11,076,711 10,870,001 98% 132,920,526 30,538,306 102,382,220 23% 25% 92%
Grand Total 39,255,437 39,294,274 100% 471,065,238 113,406,959 357,658,280 24% 24% 99%
3
Single Month - September FY2020 FYTD (25% of year completed)
Budget Summary (Budget vs Actuals as of September End, 2019)
10% or more over expected2% - 9% over expected
SR 19-082
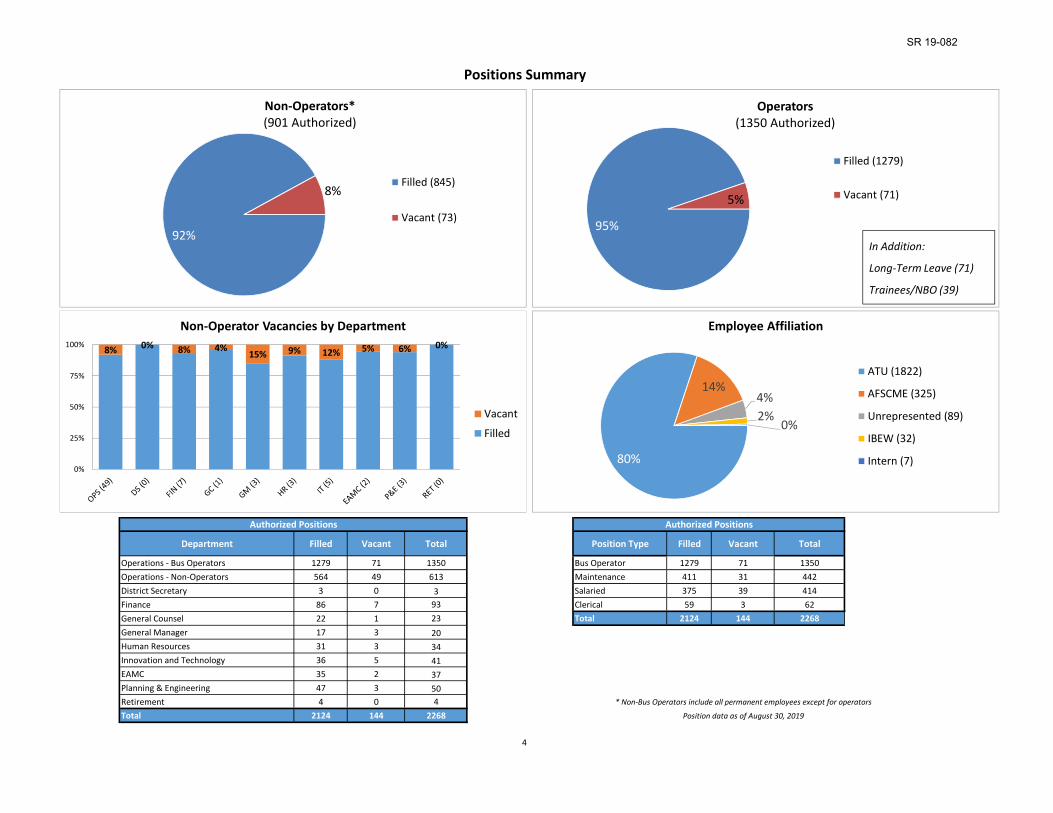
Department Filled Vacant Total Position Type Filled Vacant Total
Operations ‐ Bus Operators 1279 71 1350 Bus Operator 1279 71 1350Operations ‐ Non‐Operators 564 49 613 Maintenance 411 31 442District Secretary 3 0 3 Salaried 375 39 414Finance 86 7 93 Clerical 59 3 62General Counsel 22 1 23 Total 2124 144 2268General Manager 17 3 20Human Resources 31 3 34Innovation and Technology 36 5 41EAMC 35 2 37Planning & Engineering 47 3 50Retirement 4 0 4Total 2124 144 2268
4
Positions Summary
Authorized Positions Authorized Positions
Position data as of August 30, 2019
* Non‐Bus Operators include all permanent employees except for operators
95%
5%
Operators(1350 Authorized)
Filled (1279)
Vacant (71)
In Addition:
Long‐Term Leave (71)
Trainees/NBO (39)
92%
8%
Non‐Operators*(901 Authorized)
Filled (845)
Vacant (73)
8% 0% 8% 4%15% 9% 12% 5% 6% 0%
0%
25%
50%
75%
100%
Non‐Operator Vacancies by Department
Vacant
Filled
80%
14%4%2%
0%
Employee Affiliation
ATU (1822)
AFSCME (325)
Unrepresented (89)
IBEW (32)
Intern (7)
SR 19-082
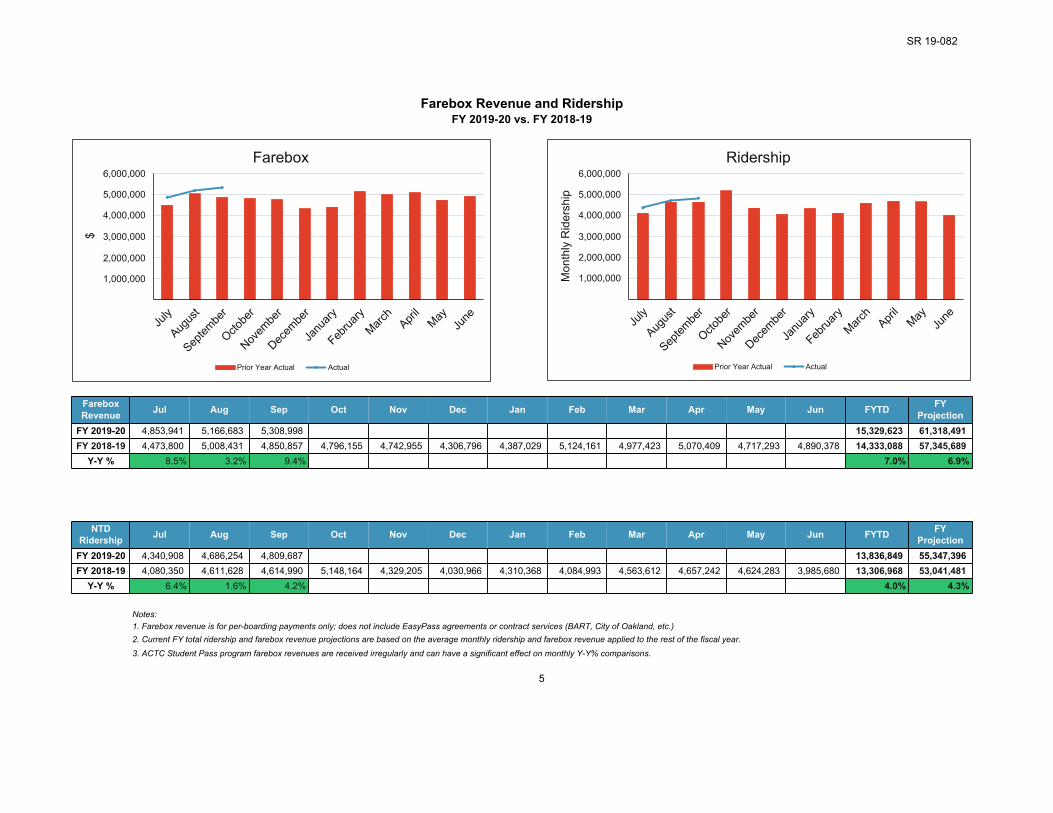
Farebox Revenue and RidershipFY 2019-20 vs. FY 2018-19
FareboxRevenue Jul Aug Sep Oct Nov Dec Jan Feb Mar Apr May Jun FYTD FY
ProjectionFY 2019-20 4,853,941 5,166,683 5,308,998 15,329,623 61,318,491FY 2018-19 4,473,800 5,008,431 4,850,857 4,796,155 4,742,955 4,306,796 4,387,029 5,124,161 4,977,423 5,070,409 4,717,293 4,890,378 14,333,088 57,345,689
Y-Y % 8.5% 3.2% 9.4% 7.0% 6.9%
NTDRidership Jul Aug Sep Oct Nov Dec Jan Feb Mar Apr May Jun FYTD FY
ProjectionFY 2019-20 4,340,908 4,686,254 4,809,687 13,836,849 55,347,396FY 2018-19 4,080,350 4,611,628 4,614,990 5,148,164 4,329,205 4,030,966 4,310,368 4,084,993 4,563,612 4,657,242 4,624,283 3,985,680 13,306,968 53,041,481
Y-Y % 6.4% 1.6% 4.2% 4.0% 4.3%
Notes:1. Farebox revenue is for per-boarding payments only; does not include EasyPass agreements or contract services (BART, City of Oakland, etc.) 2. Current FY total ridership and farebox revenue projections are based on the average monthly ridership and farebox revenue applied to the rest of the fiscal year.
3. ACTC Student Pass program farebox revenues are received irregularly and can have a significant effect on monthly Y-Y% comparisons.
5
Farebox
July
Augus
t
Septem
ber
Octobe
r
Novem
ber
Decem
ber
Janu
ary
Februa
ryMarc
hApri
lMay
June
1,000,000
2,000,000
3,000,000
4,000,000
5,000,000
6,000,000
$
Prior Year Actual Actual
Ridership
July
Augus
t
Septem
ber
Octobe
r
Novem
ber
Decem
ber
Janu
ary
Februa
ryMarc
hApri
lMay
June
1,000,000
2,000,000
3,000,000
4,000,000
5,000,000
6,000,000
Mon
thly
Rid
ersh
ip
Prior Year Actual Actual
SR 19-082