Embed Size (px)
Citation preview
To appear in: Technological Forecasting & Social Change: Special Issue on General Morphological Analysis,
2018. Pre-publication version. ________________________________________________________________________________________
1
General Morphological Analysis as a
Basic Scientific Modelling Method
Tom Ritchey Swedish Morphological Society
Abstract: General Morphological Analysis (GMA) is a method for structuring a conceptual problem space
– called a morphospace – and, through a process of existential combinatorics, synthesising a solution
space. As such, it is a basic modelling method, on a par with other scientific modelling methods includ-
ing System Dynamics Modelling, Bayesian Networks and various types graph-based “influence dia-
grams”. The purpose of this article is 1) to present the theoretical and methodological basics of morpho-
logical modelling; 2) to situate GMA within a broader modelling theoretical framework by developing a
(morphological) model representing different modelling methods, and 3) to demonstrate some of the
basic modelling techniques that can be carried out with GMA using dedicated computer support.
Keywords: General morphological analysis; morphological modelling; modelling theory; analysis and
synthesis; existential combinatorics
1. Introduction
This article is about General Morphological Analysis (GMA) as a basic, conceptual (non-quantified)
modelling method. As such, it can be compared with a wide range of other scientific modelling
methods, including System Dynamics Modelling (SDM), Bayesian Networks (BN) and various forms
of “influence diagrams”. As will be shown, all of these modelling methods are based on variations
among a common set of components and properties, and are developed through the same iterative
process involving cycles of analysis and synthesis (Ritchey, 1991, 2012). Indeed, these variations in
modelling properties can themselves be modelled morphologically.
Firstly, the theoretical and methodological foundations of GMA as a modelling method are pre-
sented. This will include the task of providing a general operational definition of a (scientific) model,
in order to identify its components and properties. Next, GMA will be situated within a wider mod-
elling theoretical framework by developing a morphology of modelling methods, which will allow
for the systematic identification, classification and comparison of different such methods. The con-
struction of this morphological (meta-) model will also serve as an example of how to “build” mor-
phological models in general. The meta-model also gives us a graphical representation of how a
given modelling method can be transformed into another by altering one or more of its parametric
values. Finally, a number of GMA modelling techniques will be demonstrated that have been made
possible by the introduction of dedicated computer support in the early 1990’s.
We begin by discussing the basic nature of a “scientific model”, in order to identify those modelling
properties by which to create a morphospace of modelling methods.
2. What is a scientific model?
The notion of a model, like that of a system or a theory, belongs to a class of concepts which essen-
tially encompass an unbounded domain. The open-ended nature of these concepts makes it diffi-
cult to give them both an all inclusive and a precise definition (cf. Portides, 2014; Koperski, 2016).
From the perspective of the philosophy of science it is understandable to opt for an all-inclusive
T. Ritchey / Technological Forecasting & Social Change / 2018
_________________________________________________________________________________________
2
account, and we often find the concept of a model being based on the notion of “representation”,
e.g. a model is a (mathematical, symbolic or conceptual) representation of the thing being mod-
elled. This is certainly all inclusive, but is only a nominal designation. For our present purposes a
”real” or operational definition needs to put forward – even if it is not “all-inclusive” – in order to
better clarify how models are actually developed and how they do their work, i.e. their means of
representation.
Here, the notion of a (scientific) model is defined on the basis of 1) its components and structure
(variables and links) and 2) its method of generation (analysis and synthesis). There is nothing es-
sentially new in this operational description, but since we claim that GMA is a fundamental model-
ling method itself, with its own unique place in the menagerie of such methods, a review of these
formal principles is warranted. (The following text is a further development of work appearing in
Ritchey 2011a & 2012).
The following criteria are posited as necessary and sufficient for at least a minimal definition of a
scientific model. (At this point I am going to drop the “scientific” qualifier and ask that this be un-
derstood.) The two criteria are:
A. A model must contain two or more (mental) constructs that can serve as variables which
can support a range of states or values – otherwise called the variable’s domain or value
range (since we are not necessarily working with directed mathematical functions here,
these two terms are interchangeable). Such variables represent those aspects of reality (or
abstract system) one wants to treat, and which make up the dimensions of the modelling
space to be developed. We shall call these variables the model’s parameters. [The term pa-
rameter is being used here in its broader “systems science” sense, as being one of a set of
factors that defines a system and determines its behaviour, and which can be varied in an
experiment – including a Gedankenexperiment.]
B. One must be able to establish relationships (e.g. causal, statistical, logical, modal, norma-
tive) between the different parameters, such that each parameter is “connected to” (i.e.
constrained or influenced by) at least one of the other parameters.
The development of these two components (variables and connective links) into a model is essen-
tially an iterative process of analysis and synthesis. In the analysis phase, variables and their respec-
tive domains are formulated which represent the model’s initial problem space. In the synthesis
phase, connective relationships between parameters are defined which bind the modelling space
and determine its topological properties. It also constrains the total modelling space in order to
produce a solution or outcome space.
Thus the basic framework for a model is an internally connected, n-dimensional conceptual space
which goes under a number of different names depending on the nature of the model, its area of
application and the properties of the space to be emphasised: e.g. parameter space, configuration
space, state space or phase space, or, in the case of GMA, a morphospace.
At this point we need to distinguish between so-called static and dynamic models. (These terms are
used somewhat differently in different modelling contexts, but are here generalised.) In dynamic
models, the variables have explicitly defined, specified domains; and the connective links between
variables are connections between their respective domains. This means that the modelling space
can be manipulated by treating one or more of the model’s variables as “independent”, varying its
values (as inputs) and realising the results on the remaining “dependent” variables (as outputs).
This is what we usually think of as a proper “model” in science. Included here are SDM, BN and
GMA.
T. Ritchey / Technological Forecasting & Social Change / 2018
_________________________________________________________________________________________
3
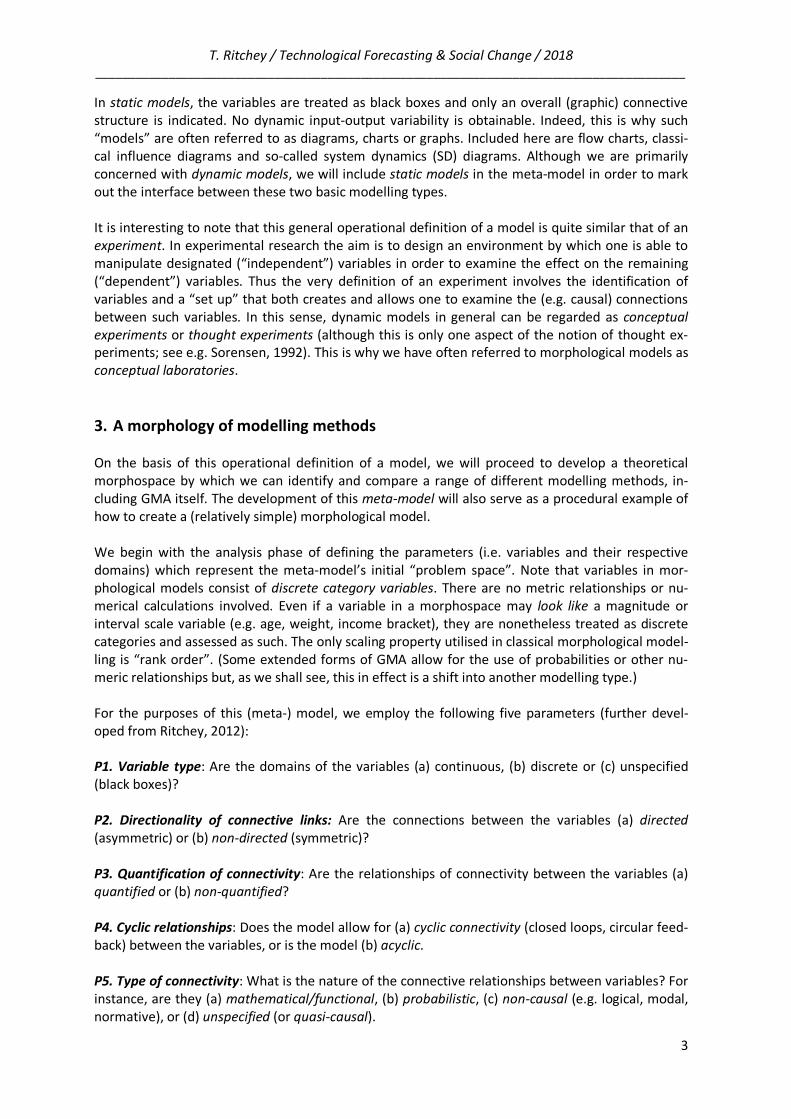
In static models, the variables are treated as black boxes and only an overall (graphic) connective
structure is indicated. No dynamic input-output variability is obtainable. Indeed, this is why such
“models” are often referred to as diagrams, charts or graphs. Included here are flow charts, classi-
cal influence diagrams and so-called system dynamics (SD) diagrams. Although we are primarily
concerned with dynamic models, we will include static models in the meta-model in order to mark
out the interface between these two basic modelling types.
It is interesting to note that this general operational definition of a model is quite similar that of an
experiment. In experimental research the aim is to design an environment by which one is able to
manipulate designated (“independent”) variables in order to examine the effect on the remaining
(“dependent”) variables. Thus the very definition of an experiment involves the identification of
variables and a “set up” that both creates and allows one to examine the (e.g. causal) connections
between such variables. In this sense, dynamic models in general can be regarded as conceptual
experiments or thought experiments (although this is only one aspect of the notion of thought ex-
periments; see e.g. Sorensen, 1992). This is why we have often referred to morphological models as
conceptual laboratories.
3. A morphology of modelling methods
On the basis of this operational definition of a model, we will proceed to develop a theoretical
morphospace by which we can identify and compare a range of different modelling methods, in-
cluding GMA itself. The development of this meta-model will also serve as a procedural example of
how to create a (relatively simple) morphological model.
We begin with the analysis phase of defining the parameters (i.e. variables and their respective
domains) which represent the meta-model’s initial “problem space”. Note that variables in mor-
phological models consist of discrete category variables. There are no metric relationships or nu-
merical calculations involved. Even if a variable in a morphospace may look like a magnitude or
interval scale variable (e.g. age, weight, income bracket), they are nonetheless treated as discrete
categories and assessed as such. The only scaling property utilised in classical morphological model-
ling is “rank order”. (Some extended forms of GMA allow for the use of probabilities or other nu-
meric relationships but, as we shall see, this in effect is a shift into another modelling type.)
For the purposes of this (meta-) model, we employ the following five parameters (further devel-
oped from Ritchey, 2012):
P1. Variable type: Are the domains of the variables (a) continuous, (b) discrete or (c) unspecified
(black boxes)?
P2. Directionality of connective links: Are the connections between the variables (a) directed
(asymmetric) or (b) non-directed (symmetric)?
P3. Quantification of connectivity: Are the relationships of connectivity between the variables (a)
quantified or (b) non-quantified?
P4. Cyclic relationships: Does the model allow for (a) cyclic connectivity (closed loops, circular feed-
back) between the variables, or is the model (b) acyclic.
P5. Type of connectivity: What is the nature of the connective relationships between variables? For
instance, are they (a) mathematical/functional, (b) probabilistic, (c) non-causal (e.g. logical, modal,
normative), or (d) unspecified (or quasi-causal).
T. Ritchey / Technological Forecasting & Social Change / 2018
_________________________________________________________________________________________
4
First of all, one may ask why just these five particular parameters have been chosen to represent
the basic properties of the meta-model. They were chosen because 1) we have to start somewhere
and 2) they make up some of the simplest and fundamental operational properties that can be
identified (note that P1 is given, and P2, 3 & 4 are basic parameters in mathematical graph theory,
the skeletal form of a modelling theory). A more complete morphology could certainly treat a wider
range of modelling properties, including the distinctions between e.g. different scaling types; open
vs. closed modelling contexts; hierarchical vs. non-hierarchical variable structure; the distinction
between different types of uncertainty; and whether or not mereological (whole-part) interactions
and self-reference is accounted for. However, the present five variables will provide a relatively
broad field of modelling methods which will give a first illustration of how GMA can be situated
within such a meta-modelling framework.
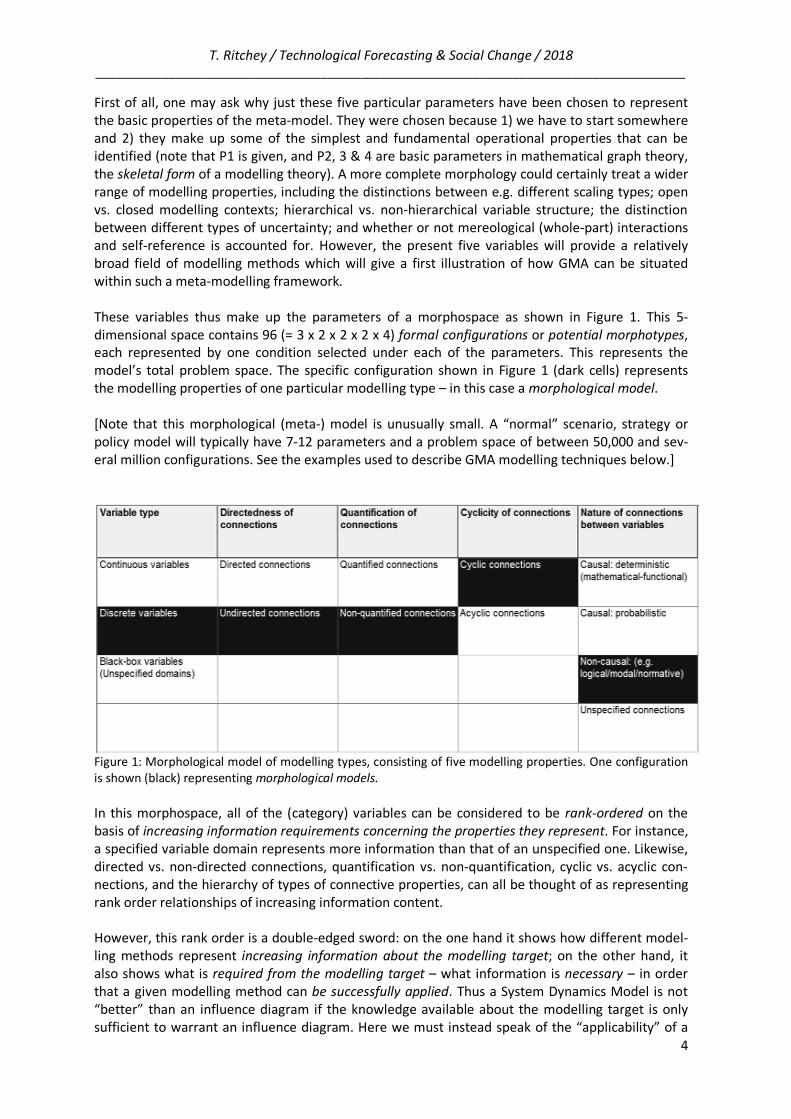
These variables thus make up the parameters of a morphospace as shown in Figure 1. This 5-
dimensional space contains 96 (= 3 x 2 x 2 x 2 x 4) formal configurations or potential morphotypes,
each represented by one condition selected under each of the parameters. This represents the
model’s total problem space. The specific configuration shown in Figure 1 (dark cells) represents
the modelling properties of one particular modelling type – in this case a morphological model.
[Note that this morphological (meta-) model is unusually small. A “normal” scenario, strategy or
policy model will typically have 7-12 parameters and a problem space of between 50,000 and sev-
eral million configurations. See the examples used to describe GMA modelling techniques below.]
Figure 1: Morphological model of modelling types, consisting of five modelling properties. One configuration
is shown (black) representing morphological models.
In this morphospace, all of the (category) variables can be considered to be rank-ordered on the
basis of increasing information requirements concerning the properties they represent. For instance,
a specified variable domain represents more information than that of an unspecified one. Likewise,
directed vs. non-directed connections, quantification vs. non-quantification, cyclic vs. acyclic con-
nections, and the hierarchy of types of connective properties, can all be thought of as representing
rank order relationships of increasing information content.
However, this rank order is a double-edged sword: on the one hand it shows how different model-
ling methods represent increasing information about the modelling target; on the other hand, it
also shows what is required from the modelling target – what information is necessary – in order
that a given modelling method can be successfully applied. Thus a System Dynamics Model is not
“better” than an influence diagram if the knowledge available about the modelling target is only
sufficient to warrant an influence diagram. Here we must instead speak of the “applicability” of a
T. Ritchey / Technological Forecasting & Social Change / 2018
_________________________________________________________________________________________
5
given modelling type vis á vis the quantity and quality of the (empirical) information available con-
cerning the object to be modelled (for a detailed discussion see Ritchey, 1991; 2012).
Furthermore, modelling methods employing connective links involving not only logical and empiri-
cal categories, but also modal logical categories (necessity, possibility, contingency) and normative
relationships are in fact quite information laden. Modelling policy-driven problems necessarily in-
volves “subjective” information, e.g. values, motivations and ideologies. In this sense, it is difficult
to ascribe a simple measuring rod concerning the quantity and quality of information.
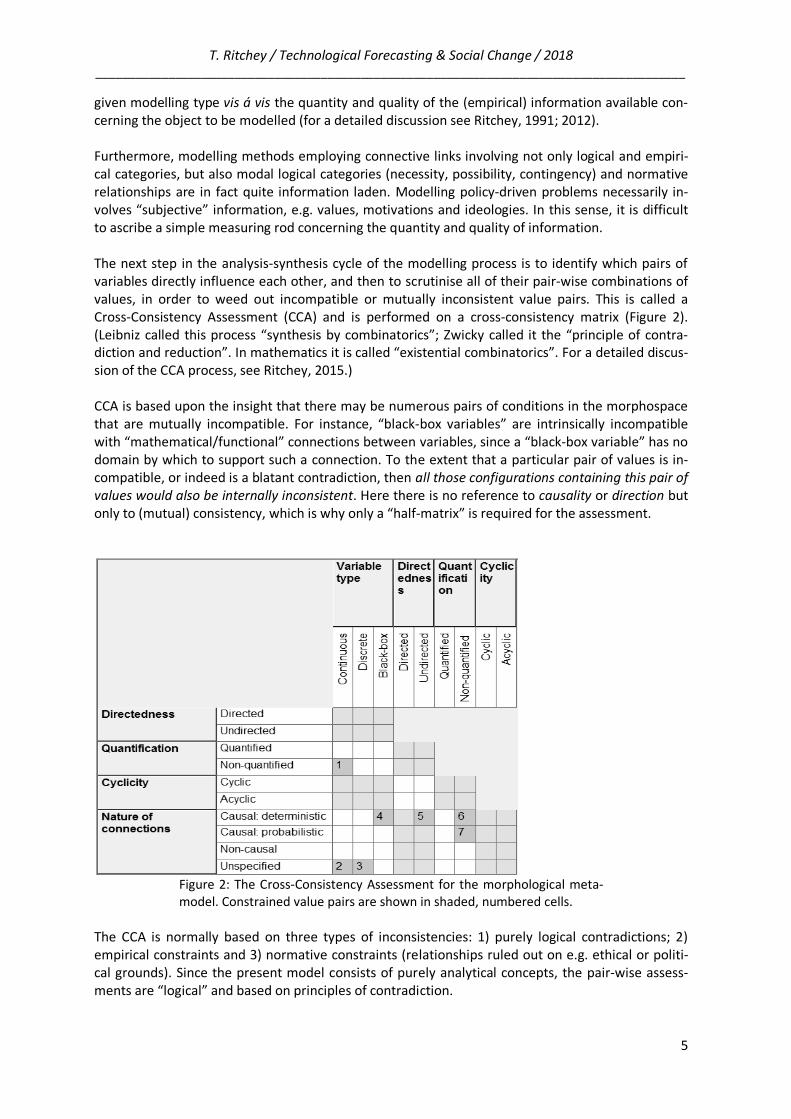
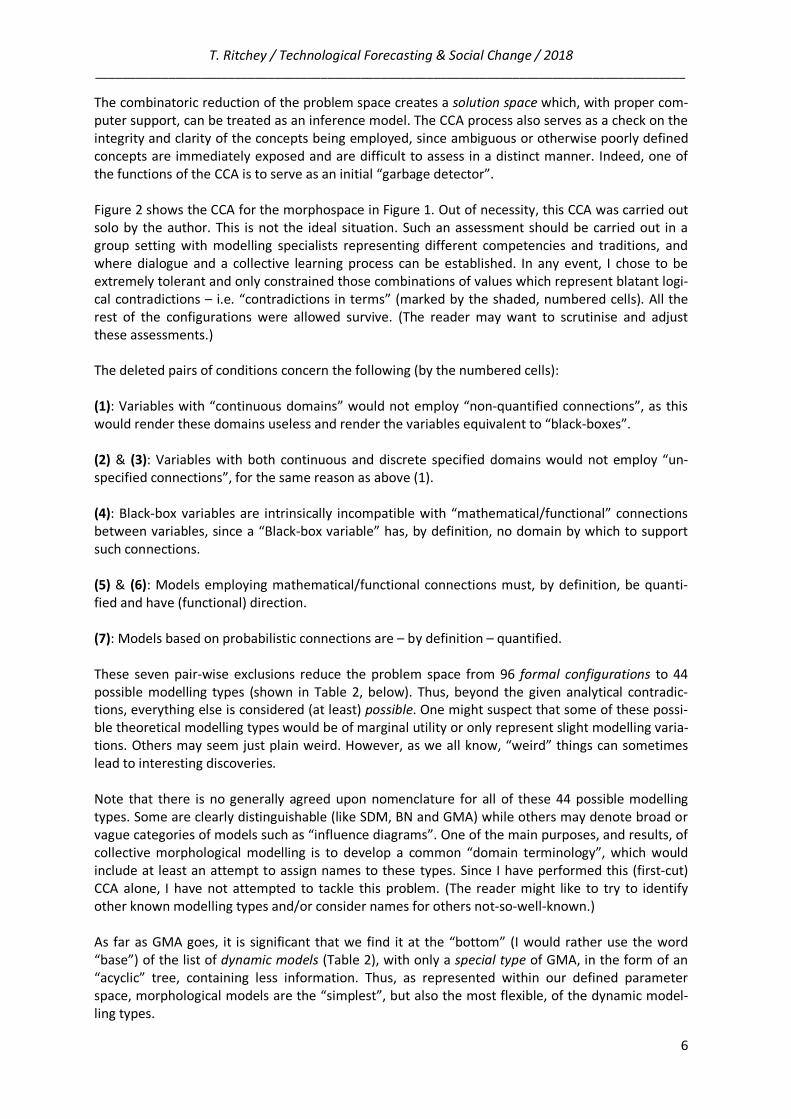
The next step in the analysis-synthesis cycle of the modelling process is to identify which pairs of
variables directly influence each other, and then to scrutinise all of their pair-wise combinations of
values, in order to weed out incompatible or mutually inconsistent value pairs. This is called a
Cross-Consistency Assessment (CCA) and is performed on a cross-consistency matrix (Figure 2).
(Leibniz called this process “synthesis by combinatorics”; Zwicky called it the “principle of contra-
diction and reduction”. In mathematics it is called “existential combinatorics”. For a detailed discus-
sion of the CCA process, see Ritchey, 2015.)
CCA is based upon the insight that there may be numerous pairs of conditions in the morphospace
that are mutually incompatible. For instance, “black-box variables” are intrinsically incompatible
with “mathematical/functional” connections between variables, since a “black-box variable” has no
domain by which to support such a connection. To the extent that a particular pair of values is in-
compatible, or indeed is a blatant contradiction, then all those configurations containing this pair of
values would also be internally inconsistent. Here there is no reference to causality or direction but
only to (mutual) consistency, which is why only a “half-matrix” is required for the assessment.
Figure 2: The Cross-Consistency Assessment for the morphological meta-
model. Constrained value pairs are shown in shaded, numbered cells.
The CCA is normally based on three types of inconsistencies: 1) purely logical contradictions; 2)
empirical constraints and 3) normative constraints (relationships ruled out on e.g. ethical or politi-
cal grounds). Since the present model consists of purely analytical concepts, the pair-wise assess-
ments are “logical” and based on principles of contradiction.
T. Ritchey / Technological Forecasting & Social Change / 2018
_________________________________________________________________________________________
6
The combinatoric reduction of the problem space creates a solution space which, with proper com-
puter support, can be treated as an inference model. The CCA process also serves as a check on the
integrity and clarity of the concepts being employed, since ambiguous or otherwise poorly defined
concepts are immediately exposed and are difficult to assess in a distinct manner. Indeed, one of
the functions of the CCA is to serve as an initial “garbage detector”.
Figure 2 shows the CCA for the morphospace in Figure 1. Out of necessity, this CCA was carried out
solo by the author. This is not the ideal situation. Such an assessment should be carried out in a
group setting with modelling specialists representing different competencies and traditions, and
where dialogue and a collective learning process can be established. In any event, I chose to be
extremely tolerant and only constrained those combinations of values which represent blatant logi-
cal contradictions – i.e. “contradictions in terms” (marked by the shaded, numbered cells). All the
rest of the configurations were allowed survive. (The reader may want to scrutinise and adjust
these assessments.)
The deleted pairs of conditions concern the following (by the numbered cells):
(1): Variables with “continuous domains” would not employ “non-quantified connections”, as this
would render these domains useless and render the variables equivalent to “black-boxes”.
(2) & (3): Variables with both continuous and discrete specified domains would not employ “un-
specified connections”, for the same reason as above (1).
(4): Black-box variables are intrinsically incompatible with “mathematical/functional” connections
between variables, since a “Black-box variable” has, by definition, no domain by which to support
such connections.
(5) & (6): Models employing mathematical/functional connections must, by definition, be quanti-
fied and have (functional) direction.
(7): Models based on probabilistic connections are – by definition – quantified.
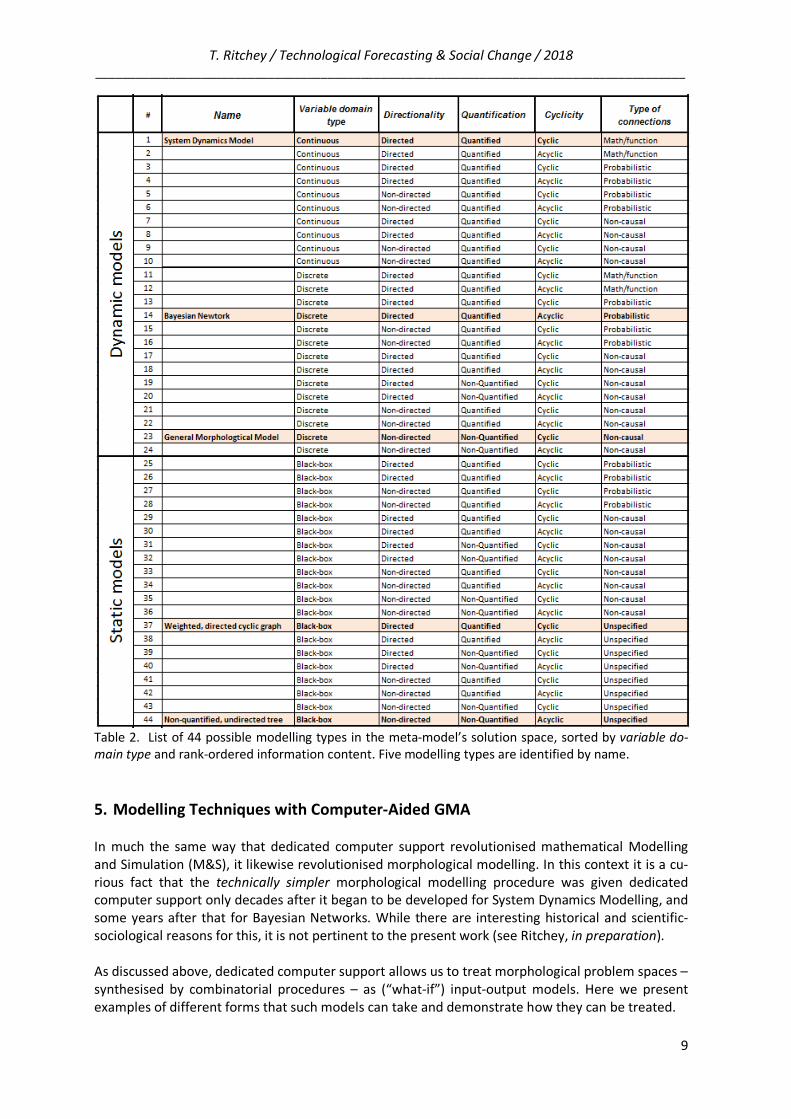
These seven pair-wise exclusions reduce the problem space from 96 formal configurations to 44
possible modelling types (shown in Table 2, below). Thus, beyond the given analytical contradic-
tions, everything else is considered (at least) possible. One might suspect that some of these possi-
ble theoretical modelling types would be of marginal utility or only represent slight modelling varia-
tions. Others may seem just plain weird. However, as we all know, “weird” things can sometimes
lead to interesting discoveries.
Note that there is no generally agreed upon nomenclature for all of these 44 possible modelling
types. Some are clearly distinguishable (like SDM, BN and GMA) while others may denote broad or
vague categories of models such as “influence diagrams”. One of the main purposes, and results, of
collective morphological modelling is to develop a common “domain terminology”, which would
include at least an attempt to assign names to these types. Since I have performed this (first-cut)
CCA alone, I have not attempted to tackle this problem. (The reader might like to try to identify
other known modelling types and/or consider names for others not-so-well-known.)
As far as GMA goes, it is significant that we find it at the “bottom” (I would rather use the word
“base”) of the list of dynamic models (Table 2), with only a special type of GMA, in the form of an
“acyclic” tree, containing less information. Thus, as represented within our defined parameter
space, morphological models are the “simplest”, but also the most flexible, of the dynamic model-
ling types.
T. Ritchey / Technological Forecasting & Social Change / 2018
_________________________________________________________________________________________
7
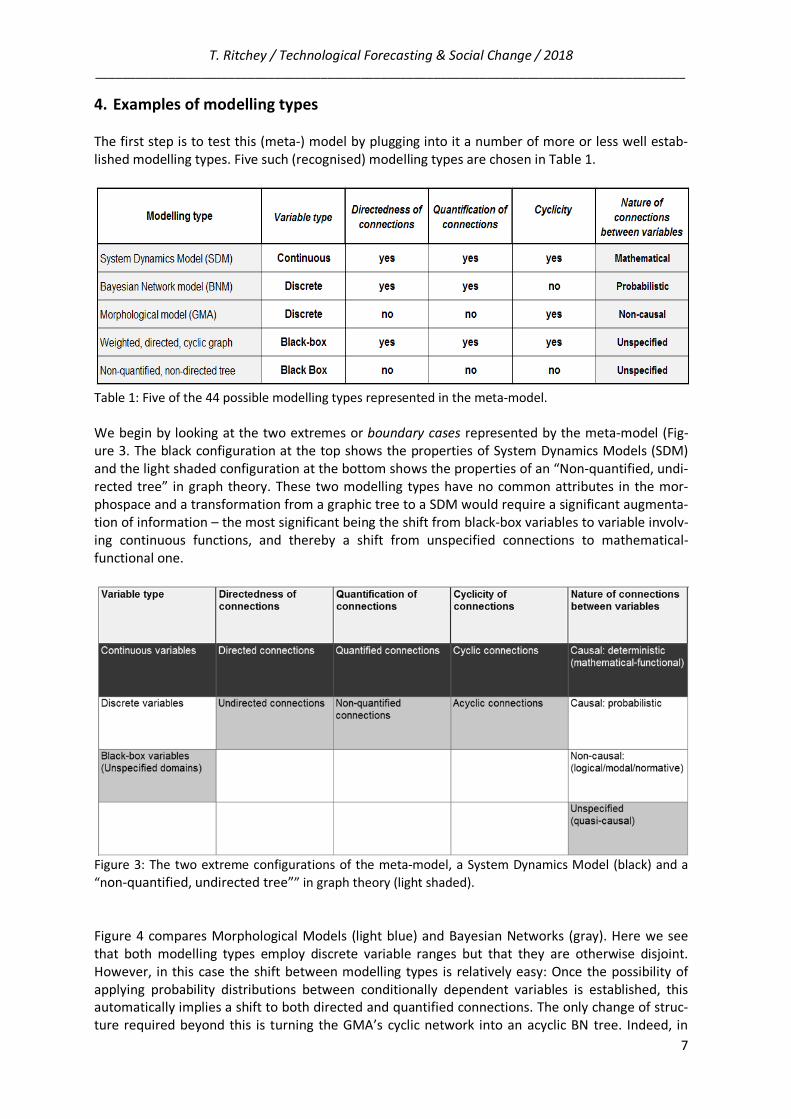
4. Examples of modelling types
The first step is to test this (meta-) model by plugging into it a number of more or less well estab-
lished modelling types. Five such (recognised) modelling types are chosen in Table 1.
Table 1: Five of the 44 possible modelling types represented in the meta-model.
We begin by looking at the two extremes or boundary cases represented by the meta-model (Fig-
ure 3. The black configuration at the top shows the properties of System Dynamics Models (SDM)
and the light shaded configuration at the bottom shows the properties of an “Non-quantified, undi-
rected tree” in graph theory. These two modelling types have no common attributes in the mor-
phospace and a transformation from a graphic tree to a SDM would require a significant augmenta-
tion of information – the most significant being the shift from black-box variables to variable involv-
ing continuous functions, and thereby a shift from unspecified connections to mathematical-
functional one.
Figure 3: The two extreme configurations of the meta-model, a System Dynamics Model (black) and a
“non-quantified, undirected tree”” in graph theory (light shaded).
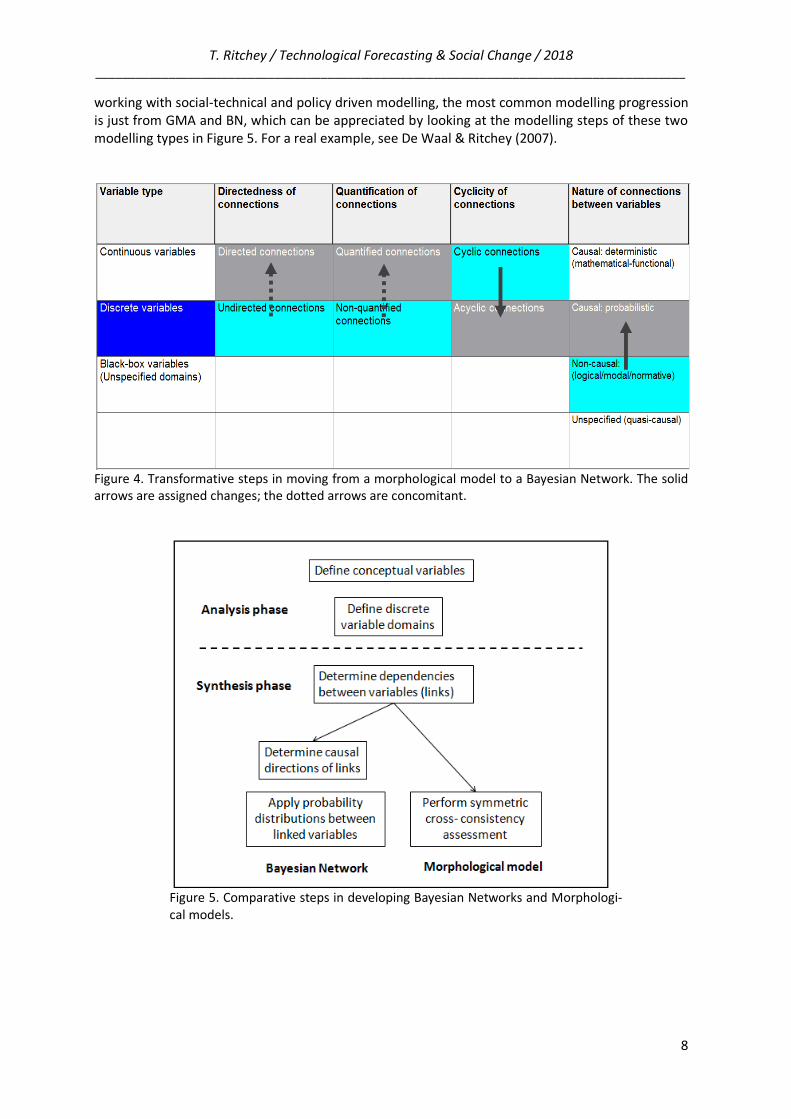
Figure 4 compares Morphological Models (light blue) and Bayesian Networks (gray). Here we see
that both modelling types employ discrete variable ranges but that they are otherwise disjoint.
However, in this case the shift between modelling types is relatively easy: Once the possibility of
applying probability distributions between conditionally dependent variables is established, this
automatically implies a shift to both directed and quantified connections. The only change of struc-
ture required beyond this is turning the GMA’s cyclic network into an acyclic BN tree. Indeed, in
T. Ritchey / Technological Forecasting & Social Change / 2018
_________________________________________________________________________________________
8
working with social-technical and policy driven modelling, the most common modelling progression
is just from GMA and BN, which can be appreciated by looking at the modelling steps of these two
modelling types in Figure 5. For a real example, see De Waal & Ritchey (2007).
Figure 4. Transformative steps in moving from a morphological model to a Bayesian Network. The solid
arrows are assigned changes; the dotted arrows are concomitant.
Figure 5. Comparative steps in developing Bayesian Networks and Morphologi-
cal models.
T. Ritchey / Technological Forecasting & Social Change / 2018
_________________________________________________________________________________________
9
Table 2. List of 44 possible modelling types in the meta-model’s solution space, sorted by variable do-
main type and rank-ordered information content. Five modelling types are identified by name.
5. Modelling Techniques with Computer-Aided GMA
In much the same way that dedicated computer support revolutionised mathematical Modelling
and Simulation (M&S), it likewise revolutionised morphological modelling. In this context it is a cu-
rious fact that the technically simpler morphological modelling procedure was given dedicated
computer support only decades after it began to be developed for System Dynamics Modelling, and
some years after that for Bayesian Networks. While there are interesting historical and scientific-
sociological reasons for this, it is not pertinent to the present work (see Ritchey, in preparation).
As discussed above, dedicated computer support allows us to treat morphological problem spaces –
synthesised by combinatorial procedures – as (“what-if”) input-output models. Here we present
examples of different forms that such models can take and demonstrate how they can be treated.
T. Ritchey / Technological Forecasting & Social Change / 2018
_________________________________________________________________________________________
10
As with all “dynamic” models – and especially with morphological models which are quite “visual” –
it is difficult to demonstrate their dynamic features on paper. We can only show individual “snap-
shots” of given configurations. Note also that these examples are presented in order to demon-
strate modelling technical principles, not to elaborate on the content of the studies involved. If the
reader is interested in this content, the articles in which they appear can be downloaded from the
designated URLs.
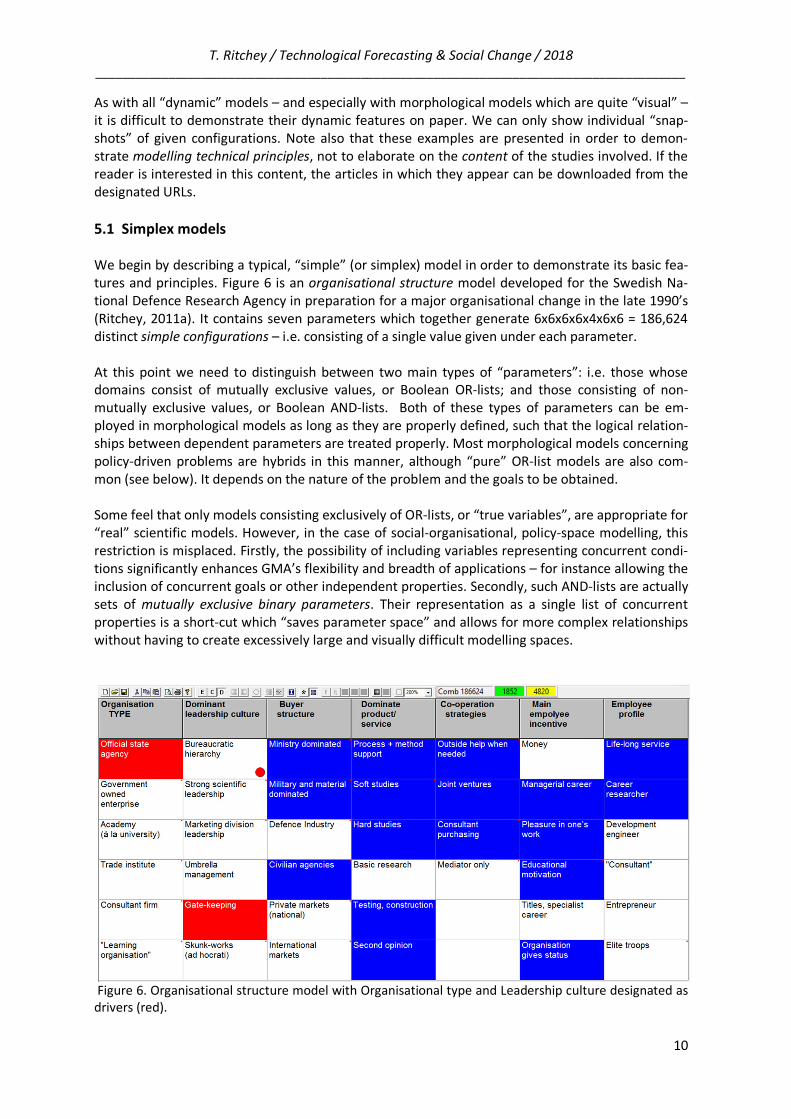
5.1 Simplex models
We begin by describing a typical, “simple” (or simplex) model in order to demonstrate its basic fea-
tures and principles. Figure 6 is an organisational structure model developed for the Swedish Na-
tional Defence Research Agency in preparation for a major organisational change in the late 1990’s
(Ritchey, 2011a). It contains seven parameters which together generate 6x6x6x6x4x6x6 = 186,624
distinct simple configurations – i.e. consisting of a single value given under each parameter.
At this point we need to distinguish between two main types of “parameters”: i.e. those whose
domains consist of mutually exclusive values, or Boolean OR-lists; and those consisting of non-
mutually exclusive values, or Boolean AND-lists. Both of these types of parameters can be em-
ployed in morphological models as long as they are properly defined, such that the logical relation-
ships between dependent parameters are treated properly. Most morphological models concerning
policy-driven problems are hybrids in this manner, although “pure” OR-list models are also com-
mon (see below). It depends on the nature of the problem and the goals to be obtained.
Some feel that only models consisting exclusively of OR-lists, or “true variables”, are appropriate for
“real” scientific models. However, in the case of social-organisational, policy-space modelling, this
restriction is misplaced. Firstly, the possibility of including variables representing concurrent condi-
tions significantly enhances GMA’s flexibility and breadth of applications – for instance allowing the
inclusion of concurrent goals or other independent properties. Secondly, such AND-lists are actually
sets of mutually exclusive binary parameters. Their representation as a single list of concurrent
properties is a short-cut which “saves parameter space” and allows for more complex relationships
without having to create excessively large and visually difficult modelling spaces.
Figure 6. Organisational structure model with Organisational type and Leadership culture designated as
drivers (red).
T. Ritchey / Technological Forecasting & Social Change / 2018
_________________________________________________________________________________________
11
Another issue concerns the distinction between independent variables and dependent variables.
With morphological models this is an open question: any of the variables can be designated (tem-
porarily) as either/or. More specifically, the user examines the solution space of the model by
choosing alternative input variables (or drivers) on order to scrutinize the resultant outputs. The
models are completely flexible in this context.
Thus the organisational structure model in Figure 6 is a mix of OR-lists (the first two variables “Or-
ganisation type” and “Dominant leadership culture”) and AND-lists (the rest of the variables). The
first two variables have been temporarily designated as the independent variables or “drivers”, and
the rest are treated (temporarily) as dependent. The red cells under the first two parameters have
been selected as inputs, and the cluster of dark blue cells is the output along the remaining pa-
rameters. The red “dot” in the “Bureaucratic hierarchy” cell tells us that this was the only other
“Leadership culture” value available for an “Official state agency”. (Note that inputs, outputs and
other properties of these computer supported models are colour coded – which can be applied in
the PDF version of this article, but not to the paper version.)
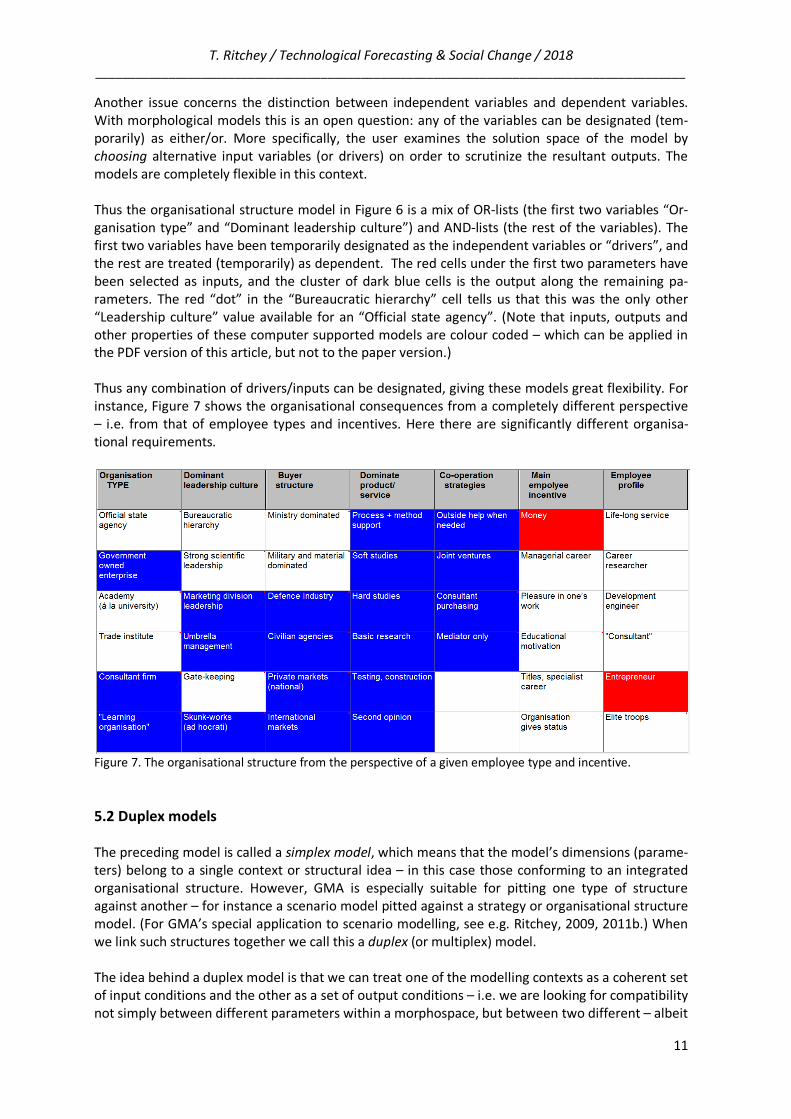
Thus any combination of drivers/inputs can be designated, giving these models great flexibility. For
instance, Figure 7 shows the organisational consequences from a completely different perspective
– i.e. from that of employee types and incentives. Here there are significantly different organisa-
tional requirements.
Figure 7. The organisational structure from the perspective of a given employee type and incentive.
5.2 Duplex models
The preceding model is called a simplex model, which means that the model’s dimensions (parame-
ters) belong to a single context or structural idea – in this case those conforming to an integrated
organisational structure. However, GMA is especially suitable for pitting one type of structure
against another – for instance a scenario model pitted against a strategy or organisational structure
model. (For GMA’s special application to scenario modelling, see e.g. Ritchey, 2009, 2011b.) When
we link such structures together we call this a duplex (or multiplex) model.
The idea behind a duplex model is that we can treat one of the modelling contexts as a coherent set
of input conditions and the other as a set of output conditions – i.e. we are looking for compatibility
not simply between different parameters within a morphospace, but between two different – albeit
T. Ritchey / Technological Forecasting & Social Change / 2018
_________________________________________________________________________________________
12
mutually dependent -- morphospaces. This is illustrated by in the following duplex model repre-
senting the relationship between, on the one hand, an organisation’s resource structure and, on the
other hand, the demands placed upon this structure by various stressor events (scenarios).
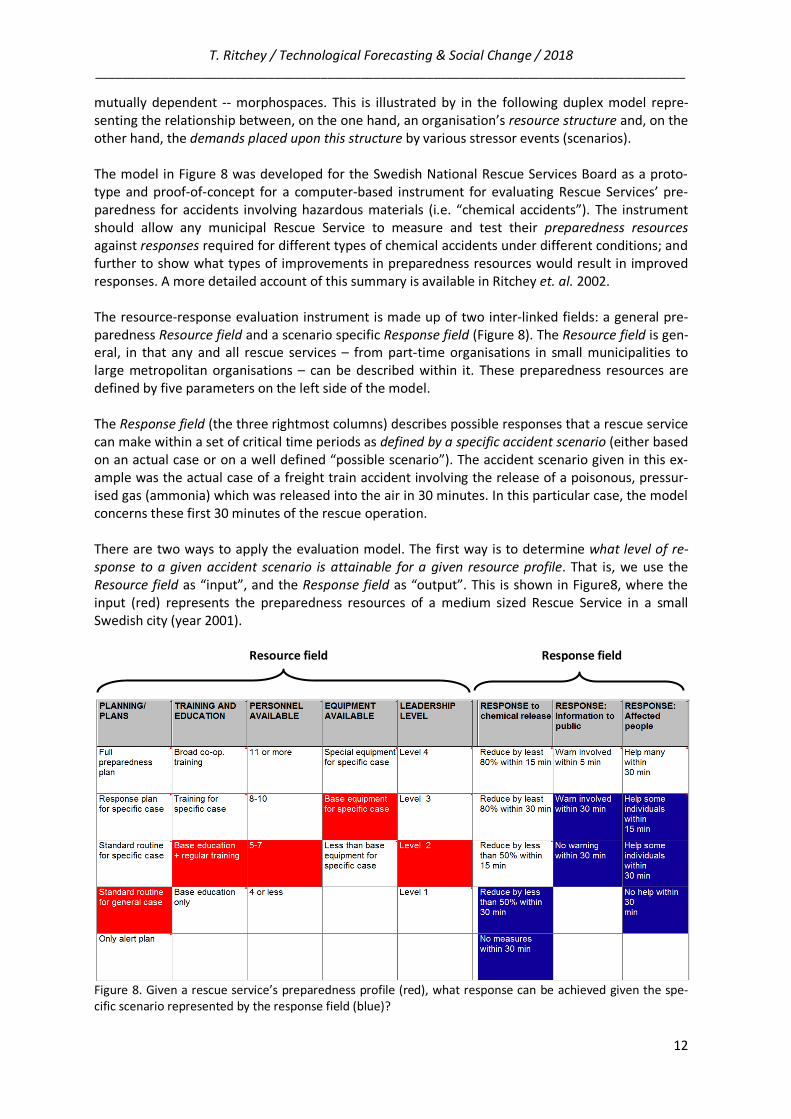
The model in Figure 8 was developed for the Swedish National Rescue Services Board as a proto-
type and proof-of-concept for a computer-based instrument for evaluating Rescue Services’ pre-
paredness for accidents involving hazardous materials (i.e. “chemical accidents”). The instrument
should allow any municipal Rescue Service to measure and test their preparedness resources
against responses required for different types of chemical accidents under different conditions; and
further to show what types of improvements in preparedness resources would result in improved
responses. A more detailed account of this summary is available in Ritchey et. al. 2002.
The resource-response evaluation instrument is made up of two inter-linked fields: a general pre-
paredness Resource field and a scenario specific Response field (Figure 8). The Resource field is gen-
eral, in that any and all rescue services – from part-time organisations in small municipalities to
large metropolitan organisations – can be described within it. These preparedness resources are
defined by five parameters on the left side of the model.
The Response field (the three rightmost columns) describes possible responses that a rescue service
can make within a set of critical time periods as defined by a specific accident scenario (either based
on an actual case or on a well defined “possible scenario”). The accident scenario given in this ex-
ample was the actual case of a freight train accident involving the release of a poisonous, pressur-
ised gas (ammonia) which was released into the air in 30 minutes. In this particular case, the model
concerns these first 30 minutes of the rescue operation.
There are two ways to apply the evaluation model. The first way is to determine what level of re-
sponse to a given accident scenario is attainable for a given resource profile. That is, we use the
Resource field as “input”, and the Response field as “output”. This is shown in Figure8, where the
input (red) represents the preparedness resources of a medium sized Rescue Service in a small
Swedish city (year 2001).
Resource field Response field
Figure 8. Given a rescue service’s preparedness profile (red), what response can be achieved given the spe-
cific scenario represented by the response field (blue)?
T. Ritchey / Technological Forecasting & Social Change / 2018
_________________________________________________________________________________________
13
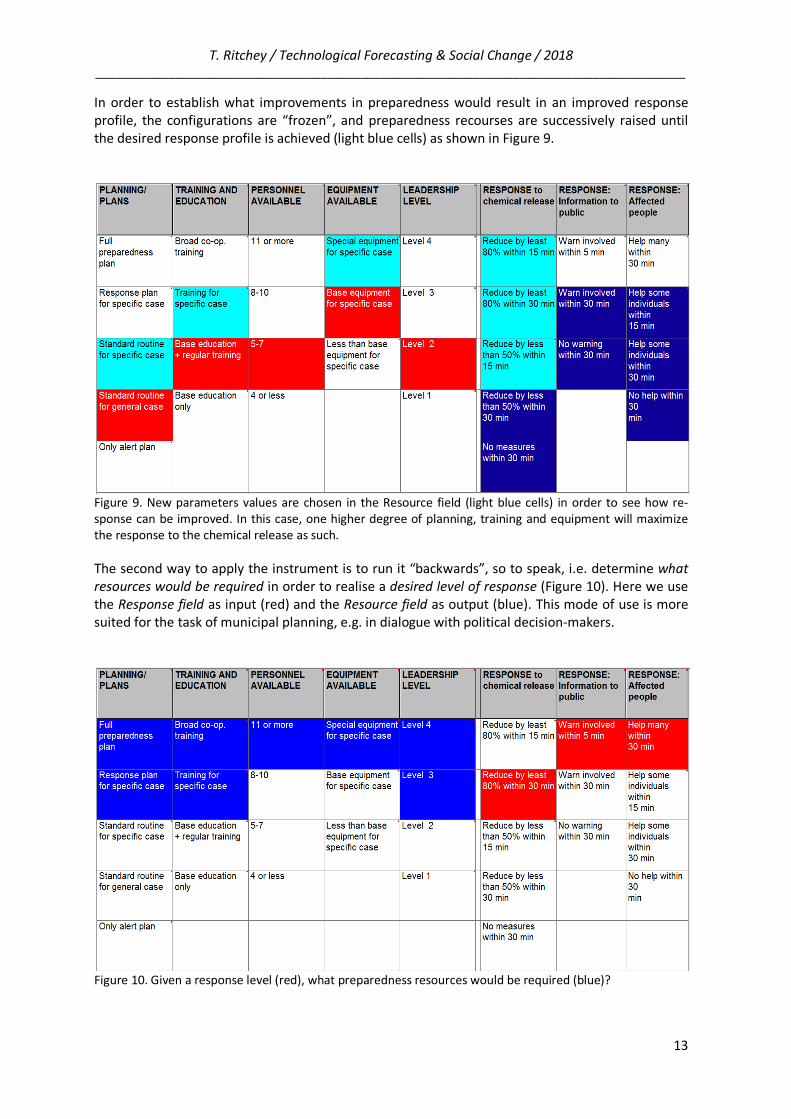
In order to establish what improvements in preparedness would result in an improved response
profile, the configurations are “frozen”, and preparedness recourses are successively raised until
the desired response profile is achieved (light blue cells) as shown in Figure 9.
Figure 9. New parameters values are chosen in the Resource field (light blue cells) in order to see how re-
sponse can be improved. In this case, one higher degree of planning, training and equipment will maximize
the response to the chemical release as such.
The second way to apply the instrument is to run it “backwards”, so to speak, i.e. determine what
resources would be required in order to realise a desired level of response (Figure 10). Here we use
the Response field as input (red) and the Resource field as output (blue). This mode of use is more
suited for the task of municipal planning, e.g. in dialogue with political decision-makers.
Figure 10. Given a response level (red), what preparedness resources would be required (blue)?
T. Ritchey / Technological Forecasting & Social Change / 2018
_________________________________________________________________________________________
14
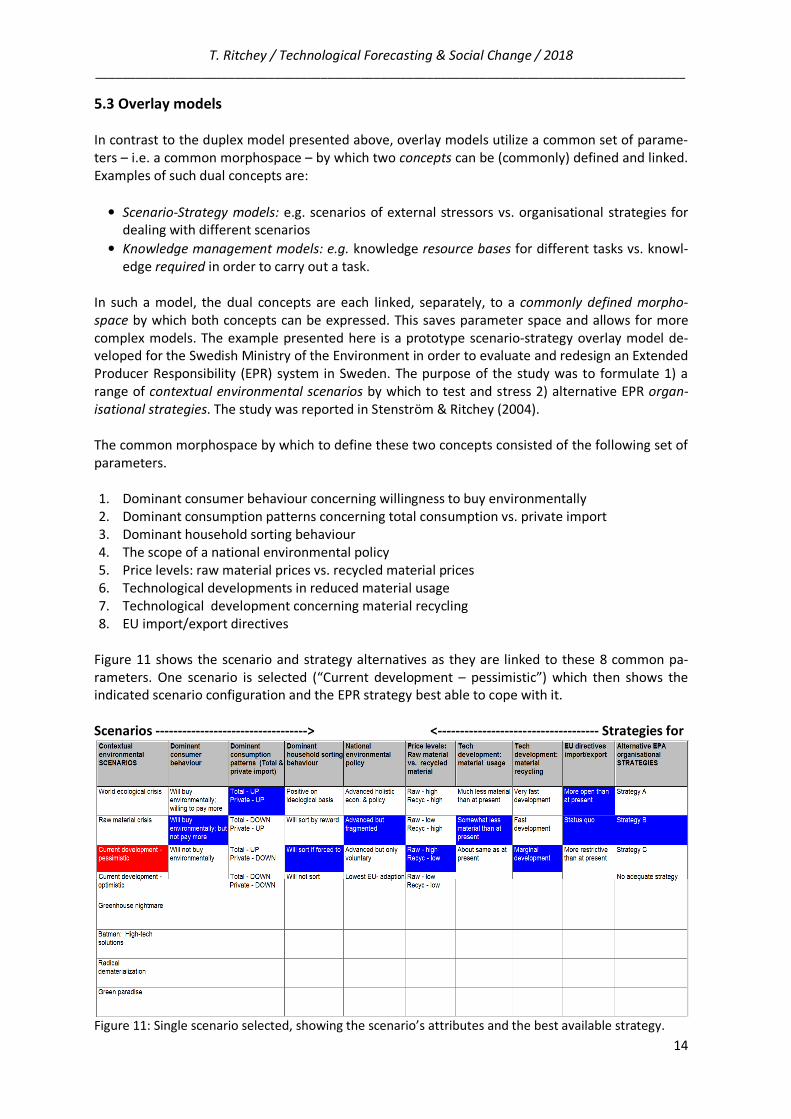
5.3 Overlay models
In contrast to the duplex model presented above, overlay models utilize a common set of parame-
ters – i.e. a common morphospace – by which two concepts can be (commonly) defined and linked.
Examples of such dual concepts are:
• Scenario-Strategy models: e.g. scenarios of external stressors vs. organisational strategies for
dealing with different scenarios
• Knowledge management models: e.g. knowledge resource bases for different tasks vs. knowl-
edge required in order to carry out a task.
In such a model, the dual concepts are each linked, separately, to a commonly defined morpho-
space by which both concepts can be expressed. This saves parameter space and allows for more
complex models. The example presented here is a prototype scenario-strategy overlay model de-
veloped for the Swedish Ministry of the Environment in order to evaluate and redesign an Extended
Producer Responsibility (EPR) system in Sweden. The purpose of the study was to formulate 1) a
range of contextual environmental scenarios by which to test and stress 2) alternative EPR organ-
isational strategies. The study was reported in Stenström & Ritchey (2004).
The common morphospace by which to define these two concepts consisted of the following set of
parameters.
1. Dominant consumer behaviour concerning willingness to buy environmentally
2. Dominant consumption patterns concerning total consumption vs. private import
3. Dominant household sorting behaviour
4. The scope of a national environmental policy
5. Price levels: raw material prices vs. recycled material prices
6. Technological developments in reduced material usage
7. Technological development concerning material recycling
8. EU import/export directives
Figure 11 shows the scenario and strategy alternatives as they are linked to these 8 common pa-
rameters. One scenario is selected (“Current development – pessimistic”) which then shows the
indicated scenario configuration and the EPR strategy best able to cope with it.
Scenarios ----------------------------------> <------------------------------------ Strategies for
Figure 11: Single scenario selected, showing the scenario’s attributes and the best available strategy.
T. Ritchey / Technological Forecasting & Social Change / 2018
_________________________________________________________________________________________
15
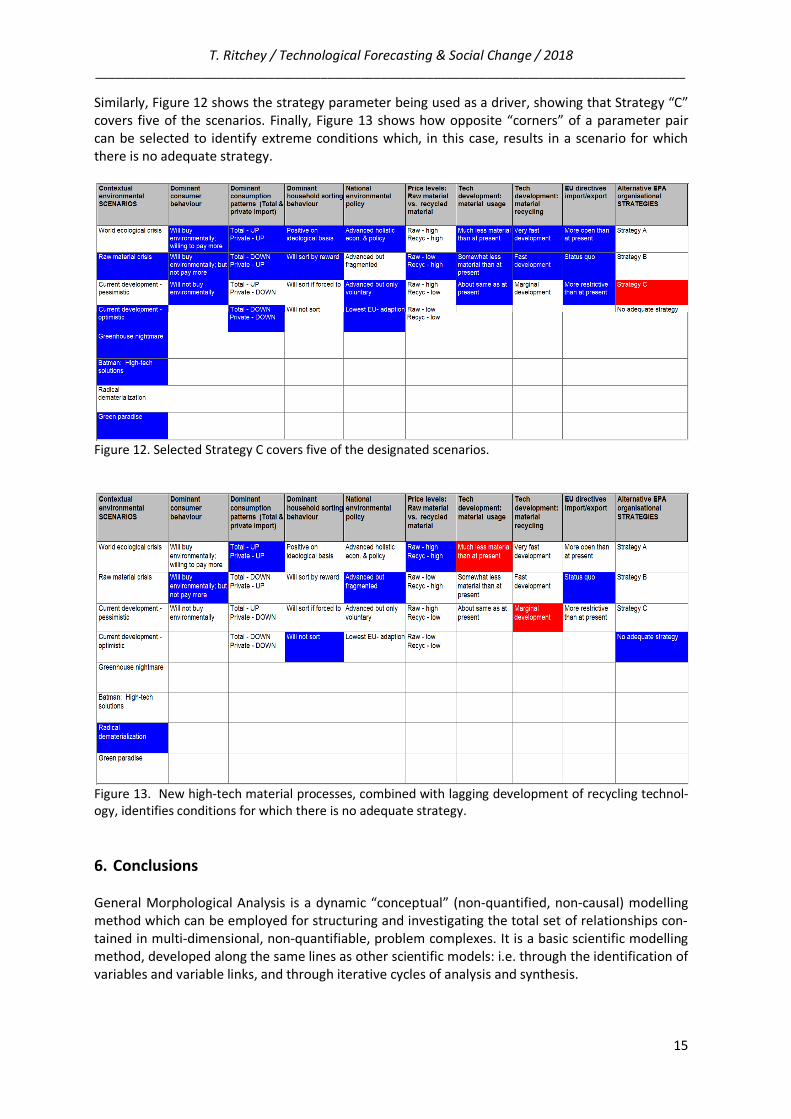
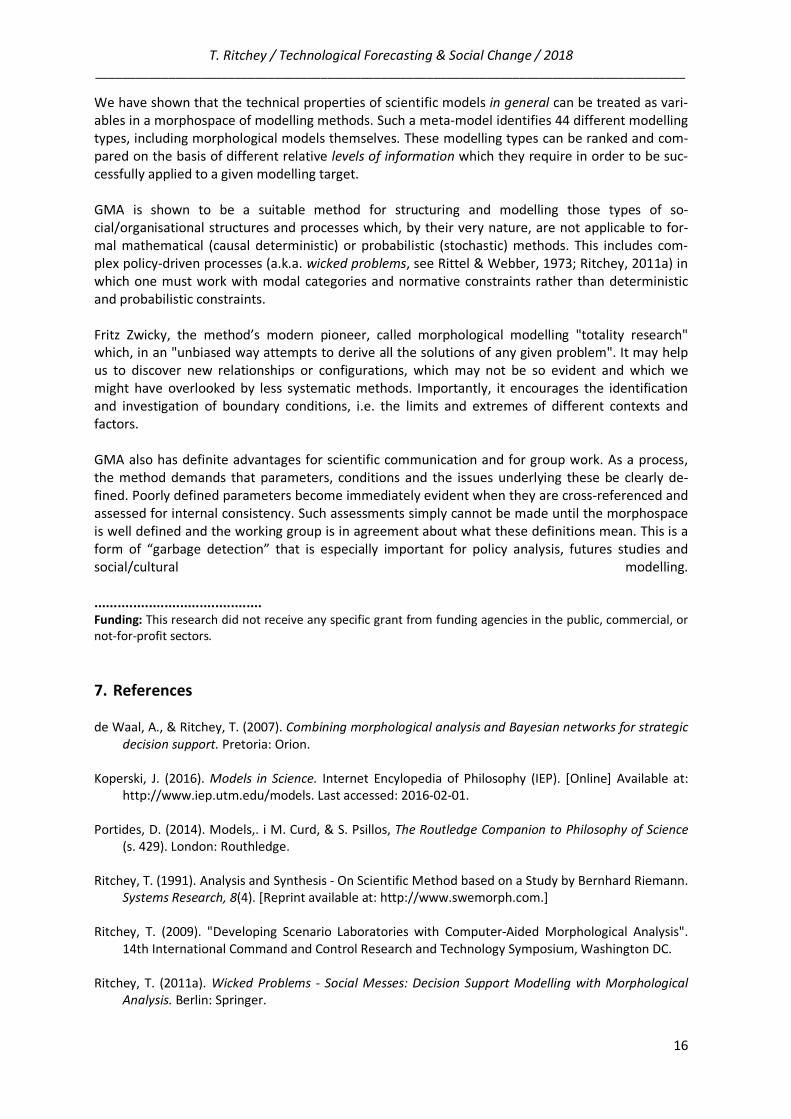
Similarly, Figure 12 shows the strategy parameter being used as a driver, showing that Strategy “C”
covers five of the scenarios. Finally, Figure 13 shows how opposite “corners” of a parameter pair
can be selected to identify extreme conditions which, in this case, results in a scenario for which
there is no adequate strategy.
Figure 12. Selected Strategy C covers five of the designated scenarios.
Figure 13. New high-tech material processes, combined with lagging development of recycling technol-
ogy, identifies conditions for which there is no adequate strategy.
6. Conclusions
General Morphological Analysis is a dynamic “conceptual” (non-quantified, non-causal) modelling
method which can be employed for structuring and investigating the total set of relationships con-
tained in multi-dimensional, non-quantifiable, problem complexes. It is a basic scientific modelling
method, developed along the same lines as other scientific models: i.e. through the identification of
variables and variable links, and through iterative cycles of analysis and synthesis.
T. Ritchey / Technological Forecasting & Social Change / 2018
_________________________________________________________________________________________
16
We have shown that the technical properties of scientific models in general can be treated as vari-
ables in a morphospace of modelling methods. Such a meta-model identifies 44 different modelling
types, including morphological models themselves. These modelling types can be ranked and com-
pared on the basis of different relative levels of information which they require in order to be suc-
cessfully applied to a given modelling target.
GMA is shown to be a suitable method for structuring and modelling those types of so-
cial/organisational structures and processes which, by their very nature, are not applicable to for-
mal mathematical (causal deterministic) or probabilistic (stochastic) methods. This includes com-
plex policy-driven processes (a.k.a. wicked problems, see Rittel & Webber, 1973; Ritchey, 2011a) in
which one must work with modal categories and normative constraints rather than deterministic
and probabilistic constraints.
Fritz Zwicky, the method’s modern pioneer, called morphological modelling "totality research"
which, in an "unbiased way attempts to derive all the solutions of any given problem". It may help
us to discover new relationships or configurations, which may not be so evident and which we
might have overlooked by less systematic methods. Importantly, it encourages the identification
and investigation of boundary conditions, i.e. the limits and extremes of different contexts and
factors.
GMA also has definite advantages for scientific communication and for group work. As a process,
the method demands that parameters, conditions and the issues underlying these be clearly de-
fined. Poorly defined parameters become immediately evident when they are cross-referenced and
assessed for internal consistency. Such assessments simply cannot be made until the morphospace
is well defined and the working group is in agreement about what these definitions mean. This is a
form of “garbage detection” that is especially important for policy analysis, futures studies and
social/cultural modelling.
...........................................
Funding: This research did not receive any specific grant from funding agencies in the public, commercial, or
not-for-profit sectors.
7. References
de Waal, A., & Ritchey, T. (2007). Combining morphological analysis and Bayesian networks for strategic
decision support. Pretoria: Orion.
Koperski, J. (2016). Models in Science. Internet Encylopedia of Philosophy (IEP). [Online] Available at:
http://www.iep.utm.edu/models. Last accessed: 2016-02-01.
Portides, D. (2014). Models,. i M. Curd, & S. Psillos, The Routledge Companion to Philosophy of Science
(s. 429). London: Routhledge.
Ritchey, T. (1991). Analysis and Synthesis - On Scientific Method based on a Study by Bernhard Riemann.
Systems Research, 8(4). [Reprint available at: http://www.swemorph.com.]
Ritchey, T. (2009). "Developing Scenario Laboratories with Computer-Aided Morphological Analysis".
14th International Command and Control Research and Technology Symposium, Washington DC.
Ritchey, T. (2011a). Wicked Problems - Social Messes: Decision Support Modelling with Morphological
Analysis. Berlin: Springer.
T. Ritchey / Technological Forecasting & Social Change / 2018
_________________________________________________________________________________________
17
Ritchey, T. (2011b). "Modelling Alternative Futures with General Morphological Analysis", World Future
Review, Spring 2011, pp. 83-94.
Ritchey, T. (2012). Outline for a Morphology of Modelling Methods: Contribution to a General Theory of
Modelling. Acta Morphologica Generalis, 1(1).
Ritchey, T. (2013). Wicked Problems - Modellinmg Social Messes with Morphological Analysis. Acta
Morphologica Generalis, 2(1).
Ritchey, T. (2015). Principles of Cross-Consistency Assessment in Morphological Modelling, Acta Mor-
phologica Generalis, 4(2).
Ritchey, T. (in preparation) “Ars Morphologica: A History of Morphological Modelling from Plato to
Zwicky”.
Ritchey, T., Stenström, M., & Eriksson, H. (2002). Using Morphological Analysis to Evaluate Preparedness
for Accidents Involving Hazardous Materials. Shanghai: 4th International Conference for Local
Authorities.
Rittel, H., & Webber, M. (1973). Dilemmas in a General Theory of Planning. Policy Sciences(4).
Sorensen, R. (1992). Thought Experiments. New York: Oxford University Press.
Stenström, M., & Ritchey, T. (2004). Scenario and Strategy Laboratories for an Extended Producer
Responsibility System. Stockholm: Swedish Morphological Society.