Embed Size (px)
Citation preview
General Population Norms for the Functional Assessment of
Cancer Therapy–Kidney Symptom Index (FKSI)
Zeeshan Butt, PhD1,2,3; John Peipert, MS1; Kimberly Webster, MA1; Connie Chen, PharmD4; and David Cella, PhD1,2,3
BACKGROUND: Metastatic renal cell cancer is associated with poor long-term survival and has no cure. Traditional clinical endpoints
are best supplemented by patient-reported outcomes designed to assess symptoms and function. Normative data was obtained on
the National Comprehensive Cancer Network-Functional Assessment of Cancer Therapy–Kidney Symptom Index (NFKSI) to aid in
score interpretation and planning of future trials. METHODS: General population data were obtained from 2000 respondents, who
completed the 19-item NFKSI-19, as well the SF-36 (Short Form 36-item instrument) and the PROMIS-29 (29-item Patient Reported
Outcomes Measurement Information System), both general health status measures. Basic demographic and self-reported comorbidity
data were also collected. RESULTS: The sample was 50% female, 85.7% caucasian, with an equal distribution across age bands from
18 years to 75 years and older. Most respondents (62.8%) had more than a high school education and reported an Eastern Coopera-
tive Oncology Group performance status of normal activity without symptoms (63.4%). Score distributions on the NFKSI-19, its sub-
scales, and individual items are summarized. CONCLUSIONS: The NFKSI-19 and its subscales now have scores for the general US
population, allowing comparability to generic questionnaires such as the SF-36 and PROMIS-29. These data can be used to guide
treatment expectations and plan future comparative effectiveness research using the scales. Cancer 2012;000:000–000. VC 2012
American Cancer Society.
KEYWORDS: quality of life, questionnaire, renal cell cancer, general population, patient-reported outcome.
Although there are new, effective agents in the treatment of metastatic renal cell cancer, it is still associated with poor long-term survival and has no cure. The disease and its treatment can have significant impact on a patient, making relief ofsymptoms and maintenance of function key goals of any medical intervention.1,2 Traditional endpoints in clinical oncol-ogy, such as patient survival and tumor response, are important, but must be supplemented by patient-reported outcomes(PROs) designed to assess symptoms and function. One such PRO measure is the Functional Assessment of CancerTherapy–Kidney Symptom Index (FKSI).3
The 15-item FKSI (FKSI-15)3 and its 9-item subset of disease-related symptoms (FKSI-DRS)4 were originallydeveloped with input from patients with kidney cancer and from clinical experts,5 who prioritized important symptomsand concerns.6 We recently sought to further verify adequate coverage of items to address regulatory guidance on thedevelopment of patient-reported outcomes.7 To do so, we solicited open-ended input from patients with advanced kidneycancer. Participants’ responses in that study were used to modify the original FKSI instrument to produce the NationalComprehensive Cancer Network FKSI-19 (NFKSI-19), assessing symptoms of importance to patients with advanced kid-ney cancer.8 The NFKSI-19 contains all of the items of the original FKSI-15 and the FKSI-DRS. Open-ended patientinput as part of the NFKSI-19 development resulted in the addition to the assessment of items on weakness, nausea, diar-rhea, and being content with quality of life (Table 1).
Currently, FKSI scores can be used, for example, to compare groups within a cross-sectional study or to compareoutcomes between randomized groups in a clinical trial. However, scores obtained in any given study are not easily refer-enced to a larger population due to a lack of normative data. External reference data on the same instrument in larger sam-ples can place the results of a specific study in context. To that end, the objective of the present project was to obtaingeneral population reference values for the FKSI to aid in the interpretation and understanding of clinical research data.
We present normative data for the FKSI based on data from a sample of the general US adult population.These norms enhance the usefulness and interpretability of the FKSI by allowing scores obtained by patients to becompared to those of a reference group, by offering data on the distribution of scores, and through use of T-scores,
DOI: 10.1002/cncr.27688, Received: January 31, 2012; Revised: April 7, 2012; Accepted: April 25, 2012, Published online in Wiley Online Library
(wileyonlinelibrary.com)
Corresponding author: Zeeshan Butt, PhD, Departments of Medical Social Sciences and Surgery, Northwestern University Feinberg School of Medicine, 750
North Lake Shore Drive, 10th Floor, Chicago, IL 60611; Fax: (312) 503-2777; [email protected]
1Department of Medical Social Sciences, Northwestern University Feinberg School of Medicine, Chicago, Illinois; 2Comprehensive Transplant Center, Northwestern
University Feinberg School of Medicine, Chicago, Illinois; 3Institute for Healthcare Studies, Northwestern University Feinberg School of Medicine, Chicago, Illinois;4Global Health Outcomes Research, Pfizer, New York
John Peipert’s current address: Division of General Medical Sciences, Washington University School of Medicine, St. Louis, Missouri
Cancer Month 00, 2012 1
Original Article

allowing comparisons of scores measured on differentscales. Furthermore, normative data for the generalpopulation on the FKSI allows for calculation of stand-ardized effect sizes, which facilitate comparisons ofeffect sizes across studies.
MATERIALS AND METHODS
Participant Recruitment and SurveyAdministration
We contracted with an Internet panel company, Toluna/Greenfield, for participant recruitment and data collec-tion. Toluna/Greenfield maintains 33 actively managedproprietary panel communities around the world, exclu-sively for marketing and opinion research. Members arerecruited from a broad array of online and offlineapproaches that best represent the online community as awhole in each country.
Toluna/Greenfield employs several procedures toconfirm the identity of their panelists, some of which areoutlined below. At registration, a user’s e-mail must beboth valid and unique within the panel. In addition, theUS panel is checked regularly against third-party data-bases for the verification of the existence of the panelist atthe address used at enrollment. The company also regu-larly runs consistency checks between the basic registra-tion data given and ongoing profiling data, and theyinclude questions in profiling questionnaires to identifyinconsistencies in responses.
Toluna/Greenfield sent e-mail invitations to eligiblepanel members from among its 536,000 US members inorder to obtain data from 2000 participants. Panelistswere given a link that took them to a secure Web sitewhere the survey was administered, after they providedconsent. Participants’ survey responses cannot be linkedin any way to any identifying information.
Measures
Participants completed the NFKSI-19, the SF-36 (ShortForm 36, version 2), the 29-item Patient Reported Out-comes Measurement Information System (PROMIS-29)instrument, as well as a brief set of demographic questionsand items asking about self-reported chronic conditions.
The NFKSI-19 is described above and in a recentpublication (see Table 1 for item content).8 From theNFKSI-19, one can derive scores for the original 15-itemFKSI (FKSI-15), the original 9-item Disease-RelatedSymptoms Scale (FKSI-DRS-9), and the expanded 13-item Disease-Related Symptoms Scale (NFKSI-DRS-13)drawn from the NFKSI-19. (A 12-item DRS focused onphysical symptoms can also be derived.) Higher scores arebetter; lower scores indicate a more symptomatic respond-ent. The NFKSI-19 and scoring instructions can be foundat www.facit.org.
The SF-36, version 2,9 is one of the most widelyused general measures of health status. The 36-iteminstrument provides a profile of 8 health subscale scoresand 2 aggregate higher order scores from these 8
Table 1. FKSI Item Content and Descriptive Statistics (N ¼ 2000)
Item Content FKSI-15? NFKSI-DRS-13?
FKSI-DRS-9?
Meana SD
I have a lack of energy Yes Yes Yes 2.64 1.18
I have pain Yes Yes Yes 2.71 1.24
I am losing weight Yes Yes Yes 3.47 0.89
I feel fatigued Yes Yes Yes 2.74 1.20
I have been short of breath Yes Yes Yes 3.32 1.00
I am bothered by fevers Yes Yes Yes 3.85 0.55
I have bone pain Yes Yes Yes 3.45 1.03
I have been coughing Yes Yes Yes 3.95 0.98
I feel weak all over No Yes No 3.46 0.97
I have had blood in my urine Yes Yes Yes 3.91 0.45
I worry that my condition will get worse Yes Yes No 3.27 1.14
I have a good appetite Yes Yes No 2.68 1.22
I am sleeping well Yes Yes No 2.08 1.27
I have nausea No No No 3.74 0.68
I have diarrhea No No No 3.69 0.55
I am bothered by side effects of treatment Yes No No 3.68 0.83
I am able to work (include work at home) Yes No No 2.62 1.49
I am able to enjoy life Yes No No 2.74 1.52
I am content with the quality of my life right now No No No 2.30 1.31
a These are not raw data values; some items have been reverse-scored per FACIT convention so that higher scores indicate better outcomes.
All items in Table 1 comprise the NFKSI-19. Specific items administered as part of other FKSI scales are indicated.
Abbreviations: DRS, disease-related symptoms; FKSI, Functional Assessment of Cancer Therapy–Kidney Symptom Index; SD, standard deviation.
Original Article
2 Cancer Month 00, 2012

subscales, the physical component summary and mentalcomponent summary, which explain 80% to 85% of thereliable variance. Higher scores represent better health-related quality of life.
The Patient Reported Outcomes Measurement In-formation System (PROMIS) network (www.nihpromi-s.org) developed several profile measures, such as thePROMIS-29, which assesses fatigue, depression, anxiety,sleep, physical function, social function, and pain (inten-
sity and interference with function).10 Norm-based scoresare available so that scores of 50 � 10 represent the mean� standard deviation of the general population. Higherscores on the symptom-oriented domains indicate worsesymptoms, and higher scores on the function-orienteddomains indicate better functioning.
Sample
Data collection occurred in fall 2011. A total of 2000 par-ticipants were successfully surveyed from the Internetpanel of the general population. We established quotas bysex and age (Table 2), leading to an equal sex split andequal age bands of 18-29, 30-44, 45-59, 60-74, and 75years of age and older. Our sample was primarily non-Hispanic (94.5%), white (85.7%), and married (46.8%).Many respondents had some college or a technical degree(41.9%), and more than half had an income of less than$40,000. Most respondents reported that they had nor-mal activity without symptoms (63.4%), although, nota-bly, 30.8% indicated experiencing symptoms that did notrequire bed rest during the waking day.
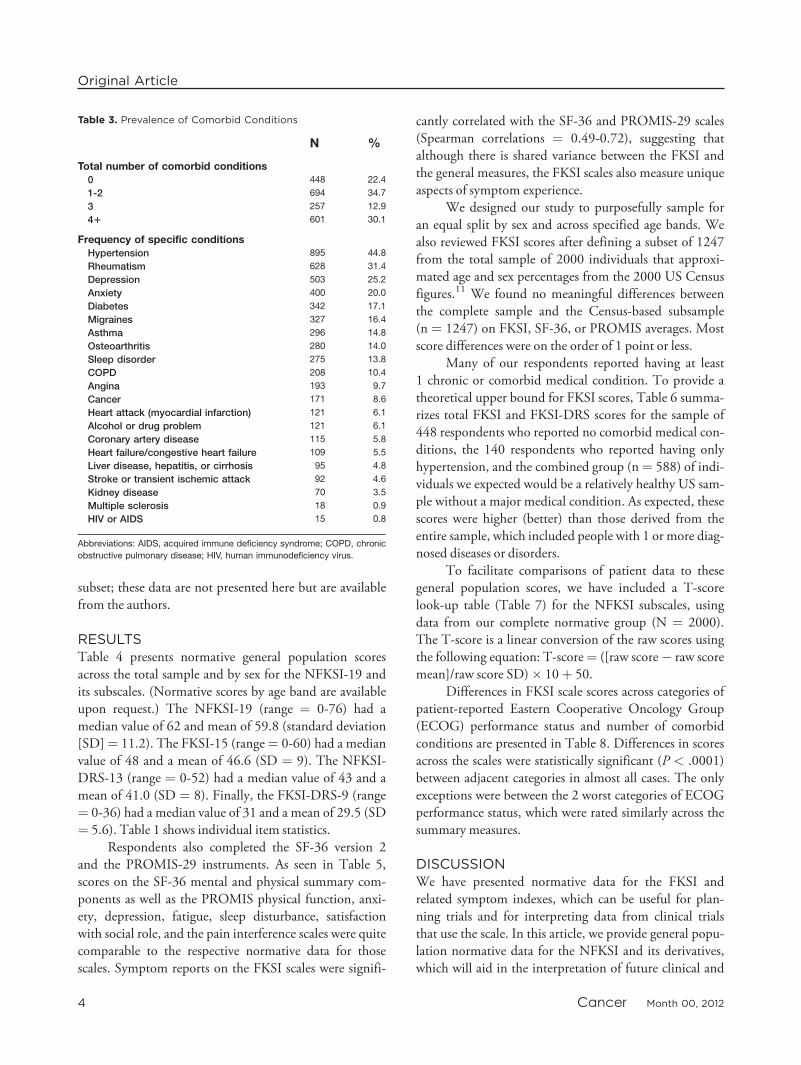
We polled respondents regarding specific healthconditions, using an investigator-developed checklist. Asummary of those data is provided in Table 3. Manyrespondents (22.4%) reported no comorbid conditions,and just more than one-third (34.7%) reported 1 or 2comorbid conditions. The most common conditionsendorsed were rheumatism (eg, arthritis; n ¼ 628) anddepression (n¼ 503).
Data Analysis
Responses on the FKSI were scored using the standardFACT (Functional Assessment of Cancer Therapy) scor-ing methodology. If > 50% of items were completed, theFKSI scores were calculated as the sum of the itemresponses divided by the number of items completed mul-tiplied by the total number of items in the scale (eg, 19 inthe case of the NFKSI-19). If fewer than 50% of the itemswere completed, the scores were considered missing.
Within each age and sex subgroup, on the FKSI, wecalculated mean, standard deviation, percentage scoringthe lowest possible score, percentage scoring the highestpossible score, the lowest and highest observed scores, and25th, 50th (median), and 75th percentiles.
We also assessed how well our sample representedthe US population by comparing the age, sex, and race todata from the 2000 US Census. We identified a subset ofour sample that matched the demographic profile of thegeneral US population, using disproportionate sampling(‘‘raking’’) in the manner applied by Liu et al.11 Descrip-tive statistics of the FKSI scores were recalculated for this
Table 2. General US Population Sample (N ¼ 2000)
Characteristic n %
SexFemale 1000 50.0
Male 1000 50.0
Age, y18-29 400 20.0
30-44 400 20.0
45-59 400 20.0
60-74 400 20.0
751 400 20.0
EthnicityHispanic 110 5.5
Non-Hispanic 1890 94.5
Racea
White 1713 85.7
Black or African American 160 8.0
American Indian/Alaska Native 34 1.7
Asian 74 3.7
Native Hawaiian or other Pacific Islander 5 0.3
Other 55 2.8
Marital statusNever married 401 20.1
Married 935 46.8
In committed relationship 189 9.5
Separated 44 2.2
Divorced 231 11.6
Widowed 200 10.0
Education<High school grad/GED 68 3.6
High school grad/GED 501 25.1
Some college/technical degree/AA 837 41.9
College degree (BA/BS) 418 20.9
Advanced degree (MA, MS, MBA,
PhD, MD, JD)
176 8.8
Patient ECOG performance statusI have normal activity without symptoms 1268 63.4
I have some symptoms but do
not require bed rest during the waking day
615 30.8
I require bed rest for less than 50% of the
waking day
87 4.4
I require bed rest for more than 50% of the
waking day
25 1.3
I am unable to get out of bed 5 0.3
a Participants could endorse more than 1 race.
Abbreviation: ECOG, Eastern Cooperative Oncology Group.
General Population Norms for the FKSI/Butt et al
Cancer Month 00, 2012 3
subset; these data are not presented here but are availablefrom the authors.
RESULTSTable 4 presents normative general population scoresacross the total sample and by sex for the NFKSI-19 andits subscales. (Normative scores by age band are availableupon request.) The NFKSI-19 (range ¼ 0-76) had amedian value of 62 and mean of 59.8 (standard deviation[SD]¼ 11.2). The FKSI-15 (range¼ 0-60) had a medianvalue of 48 and a mean of 46.6 (SD ¼ 9). The NFKSI-DRS-13 (range ¼ 0-52) had a median value of 43 and amean of 41.0 (SD ¼ 8). Finally, the FKSI-DRS-9 (range¼ 0-36) had a median value of 31 and a mean of 29.5 (SD¼ 5.6). Table 1 shows individual item statistics.
Respondents also completed the SF-36 version 2and the PROMIS-29 instruments. As seen in Table 5,scores on the SF-36 mental and physical summary com-ponents as well as the PROMIS physical function, anxi-ety, depression, fatigue, sleep disturbance, satisfactionwith social role, and the pain interference scales were quitecomparable to the respective normative data for thosescales. Symptom reports on the FKSI scales were signifi-
cantly correlated with the SF-36 and PROMIS-29 scales(Spearman correlations ¼ 0.49-0.72), suggesting thatalthough there is shared variance between the FKSI andthe general measures, the FKSI scales also measure uniqueaspects of symptom experience.
We designed our study to purposefully sample foran equal split by sex and across specified age bands. Wealso reviewed FKSI scores after defining a subset of 1247from the total sample of 2000 individuals that approxi-mated age and sex percentages from the 2000 US Censusfigures.11 We found no meaningful differences betweenthe complete sample and the Census-based subsample(n ¼ 1247) on FKSI, SF-36, or PROMIS averages. Mostscore differences were on the order of 1 point or less.
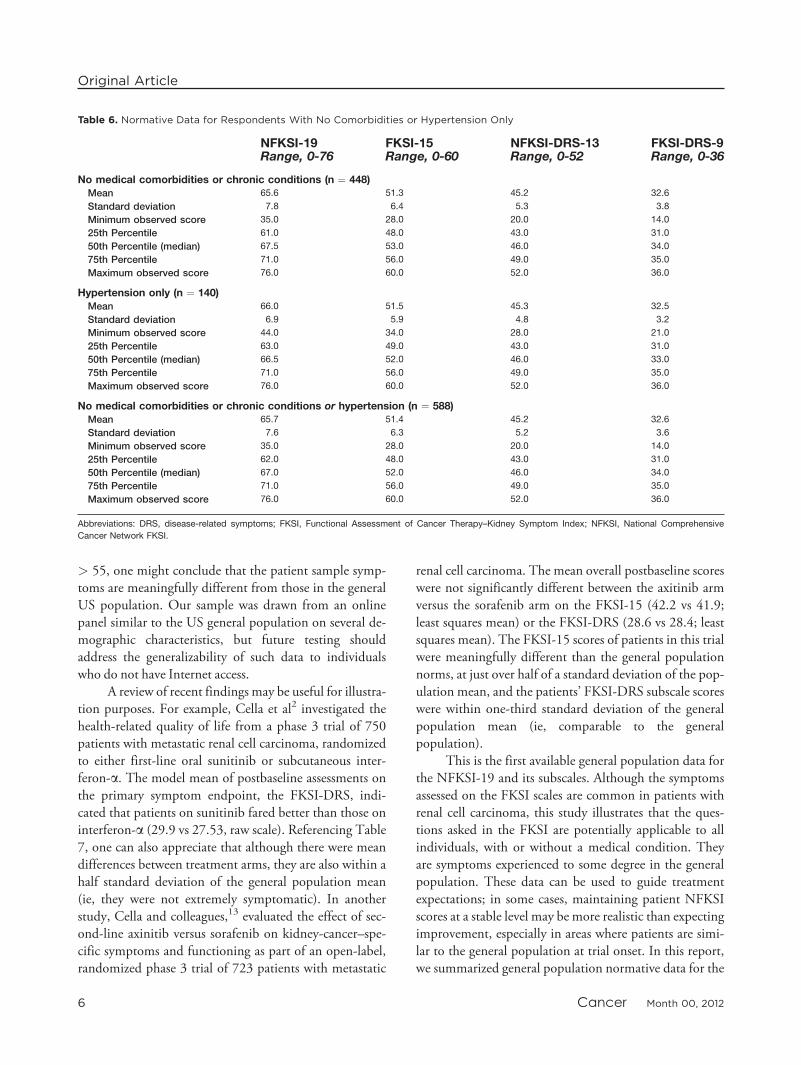
Many of our respondents reported having at least1 chronic or comorbid medical condition. To provide atheoretical upper bound for FKSI scores, Table 6 summa-rizes total FKSI and FKSI-DRS scores for the sample of448 respondents who reported no comorbid medical con-ditions, the 140 respondents who reported having onlyhypertension, and the combined group (n¼ 588) of indi-viduals we expected would be a relatively healthy US sam-ple without a major medical condition. As expected, thesescores were higher (better) than those derived from theentire sample, which included people with 1 or more diag-nosed diseases or disorders.
To facilitate comparisons of patient data to thesegeneral population scores, we have included a T-scorelook-up table (Table 7) for the NFKSI subscales, usingdata from our complete normative group (N ¼ 2000).The T-score is a linear conversion of the raw scores usingthe following equation: T-score¼ ([raw score� raw scoremean]/raw score SD)� 10þ 50.
Differences in FKSI scale scores across categories ofpatient-reported Eastern Cooperative Oncology Group(ECOG) performance status and number of comorbidconditions are presented in Table 8. Differences in scoresacross the scales were statistically significant (P < .0001)between adjacent categories in almost all cases. The onlyexceptions were between the 2 worst categories of ECOGperformance status, which were rated similarly across thesummary measures.
DISCUSSIONWe have presented normative data for the FKSI andrelated symptom indexes, which can be useful for plan-ning trials and for interpreting data from clinical trialsthat use the scale. In this article, we provide general popu-lation normative data for the NFKSI and its derivatives,which will aid in the interpretation of future clinical and
Table 3. Prevalence of Comorbid Conditions
N %
Total number of comorbid conditions0 448 22.4
1-2 694 34.7
3 257 12.9
41 601 30.1
Frequency of specific conditionsHypertension 895 44.8
Rheumatism 628 31.4
Depression 503 25.2
Anxiety 400 20.0
Diabetes 342 17.1
Migraines 327 16.4
Asthma 296 14.8
Osteoarthritis 280 14.0
Sleep disorder 275 13.8
COPD 208 10.4
Angina 193 9.7
Cancer 171 8.6
Heart attack (myocardial infarction) 121 6.1
Alcohol or drug problem 121 6.1
Coronary artery disease 115 5.8
Heart failure/congestive heart failure 109 5.5
Liver disease, hepatitis, or cirrhosis 95 4.8
Stroke or transient ischemic attack 92 4.6
Kidney disease 70 3.5
Multiple sclerosis 18 0.9
HIV or AIDS 15 0.8
Abbreviations: AIDS, acquired immune deficiency syndrome; COPD, chronic
obstructive pulmonary disease; HIV, human immunodeficiency virus.
Original Article
4 Cancer Month 00, 2012

research data that use these scales. We also provide validitydata to show that in the general population, symptomseverity increases with worsening ECOG performance sta-tus and with increased medical comorbidity. FKSI scoresalso measure aspects of health-related quality of life thatare not assessed by the SF-36 or PROMIS-29, such asnausea, diarrhea, bone pain, and being bothered by fevers.
We provide raw score distributions for our generalpopulation FKSI data and also provide a convenient look-up table to convert raw score values to the T-score metric.T-scores have the advantage of being easy to use and inter-pret (M ¼ 50, SD ¼ 10) and can facilitate comparisonswith other scales when placed on the same metric. A dif-ference in T-scores of one-half standard deviation, or5 points on the T-score template can be interpreted aslikely to reflect a meaningful difference, with the under-standing that the minimally important difference is likelyless than 5 points.12 For example, if the mean raw scorefor a patient sample corresponds to a T-score < 45 or
Table 4. Normative Data of General US Adult Population
NFKSI-19Range, 0-76
FKSI-15Range, 0-60
NFKSI-DRS-13Range, 0-52
FKSI-DRS-9Range, 0-36
Total Sample (N ¼ 2000)Mean 59.8 46.6 41.0 29.5
Standard deviation 11.2 9.0 8.0 5.6
Percent at floor 0.0 0.0 0.0 0.1
Percent at ceiling 2.5 2.9 3.45 10.3
Minimum observed score 13.0 10.0 5.0 0
25th Percentile 54.0 41.0 37.0 27.0
50th Percentile (median) 62.0 48.0 43.0 31.0
75th Percentile 68.0 53.0 47.0 34.0
Maximum observed score 76.0 60.0 52.0 36.0
Males (N ¼ 1000)Mean 59.7 46.6 41.1 29.7
Standard deviation 11.2 9.0 8.0 5.8
Percent at floor 0.0 0.0 0.0 0.0
Percent at ceiling 2.6 3.3 3.9 13.3
Minimum observed score 13.0 10.0 5.0 1.0
25th Percentile 54.0 41.0 37.0 27.0
50th Percentile (median) 62.0 48.0 43.0 31.0
75th Percentile 68.0 53.0 47.0 34.0
Maximum observed score 76.0 60.0 52.0 36.0
Females (N ¼ 1000)Mean 59.8 46.5 40.8 29.3
Standard deviation 11.2 9.0 8.0 5.5
Percent at floor 0.0 0.0 0.0 0.2
Percent at ceiling 2.4 2.5 3.0 7.2
Minimum observed score 16.0 12.0 8.0 0
25th Percentile 53.5 41.0 36.0 26.0
50th Percentile (median) 62.0 48.0 43.0 31.0
75th Percentile 68.0 54.0 47.0 33.0
Maximum observed score 76.0 60.0 52.0 36.0
Abbreviations: DRS, disease-related symptoms; FKSI, Functional Assessment of Cancer Therapy–Kidney Symptom Index; NFKSI, National Comprehensive
Cancer Network FKSI; SD, standard deviation.
Table 5. General Health-Related Quality of Life (N ¼ 2000)a
Mean (SD) Median
SF-36 version 2 scores(standardized)Mental component summary 47.7 (12.3) 50.8
Physical component summary 46.1 (11.2) 48.6
PROMIS-29 scores(standardized)Physical function 50.5 (10.0) 49.0
Anxiety 50.1 (10.3) 48.9
Depression 47.3 (9.7) 46.4
Fatigue 47.9 (9.2) 48.1
Sleep disturbance 52.0 (10.0) 52.4
Satisfaction with social role 49.3 (10.1) 49.9
Pain disturbance 49.2 (9.2) 49.6
Pain intensity 3.0 (2.6) 2.0
a Except for pain intensity, all scores standardized to mean (standard devia-
tion [SD]) ¼ 50 (10), based on respective normative samples. Pain intensity
score, based on a single 0 to 10 rating, was not transformed.
Abbreviations: PROMIS-29, 29-item Patient Reported Outcomes Measure-
ment Information System instrument; SF-36, Short Form 36.
General Population Norms for the FKSI/Butt et al
Cancer Month 00, 2012 5
> 55, one might conclude that the patient sample symp-toms are meaningfully different from those in the generalUS population. Our sample was drawn from an onlinepanel similar to the US general population on several de-mographic characteristics, but future testing shouldaddress the generalizability of such data to individualswho do not have Internet access.
A review of recent findings may be useful for illustra-tion purposes. For example, Cella et al2 investigated thehealth-related quality of life from a phase 3 trial of 750patients with metastatic renal cell carcinoma, randomizedto either first-line oral sunitinib or subcutaneous inter-feron-a. The model mean of postbaseline assessments onthe primary symptom endpoint, the FKSI-DRS, indi-cated that patients on sunitinib fared better than those oninterferon-a (29.9 vs 27.53, raw scale). Referencing Table7, one can also appreciate that although there were meandifferences between treatment arms, they are also within ahalf standard deviation of the general population mean(ie, they were not extremely symptomatic). In anotherstudy, Cella and colleagues,13 evaluated the effect of sec-ond-line axinitib versus sorafenib on kidney-cancer–spe-cific symptoms and functioning as part of an open-label,randomized phase 3 trial of 723 patients with metastatic
renal cell carcinoma. The mean overall postbaseline scoreswere not significantly different between the axitinib armversus the sorafenib arm on the FKSI-15 (42.2 vs 41.9;least squares mean) or the FKSI-DRS (28.6 vs 28.4; leastsquares mean). The FKSI-15 scores of patients in this trialwere meaningfully different than the general populationnorms, at just over half of a standard deviation of the pop-ulation mean, and the patients’ FKSI-DRS subscale scoreswere within one-third standard deviation of the generalpopulation mean (ie, comparable to the generalpopulation).
This is the first available general population data forthe NFKSI-19 and its subscales. Although the symptomsassessed on the FKSI scales are common in patients withrenal cell carcinoma, this study illustrates that the ques-tions asked in the FKSI are potentially applicable to allindividuals, with or without a medical condition. Theyare symptoms experienced to some degree in the generalpopulation. These data can be used to guide treatmentexpectations; in some cases, maintaining patient NFKSIscores at a stable level may be more realistic than expectingimprovement, especially in areas where patients are simi-lar to the general population at trial onset. In this report,we summarized general population normative data for the
Table 6. Normative Data for Respondents With No Comorbidities or Hypertension Only
NFKSI-19Range, 0-76
FKSI-15Range, 0-60
NFKSI-DRS-13Range, 0-52
FKSI-DRS-9Range, 0-36
No medical comorbidities or chronic conditions (n ¼ 448)Mean 65.6 51.3 45.2 32.6
Standard deviation 7.8 6.4 5.3 3.8
Minimum observed score 35.0 28.0 20.0 14.0
25th Percentile 61.0 48.0 43.0 31.0
50th Percentile (median) 67.5 53.0 46.0 34.0
75th Percentile 71.0 56.0 49.0 35.0
Maximum observed score 76.0 60.0 52.0 36.0
Hypertension only (n ¼ 140)Mean 66.0 51.5 45.3 32.5
Standard deviation 6.9 5.9 4.8 3.2
Minimum observed score 44.0 34.0 28.0 21.0
25th Percentile 63.0 49.0 43.0 31.0
50th Percentile (median) 66.5 52.0 46.0 33.0
75th Percentile 71.0 56.0 49.0 35.0
Maximum observed score 76.0 60.0 52.0 36.0
No medical comorbidities or chronic conditions or hypertension (n ¼ 588)Mean 65.7 51.4 45.2 32.6
Standard deviation 7.6 6.3 5.2 3.6
Minimum observed score 35.0 28.0 20.0 14.0
25th Percentile 62.0 48.0 43.0 31.0
50th Percentile (median) 67.0 52.0 46.0 34.0
75th Percentile 71.0 56.0 49.0 35.0
Maximum observed score 76.0 60.0 52.0 36.0
Abbreviations: DRS, disease-related symptoms; FKSI, Functional Assessment of Cancer Therapy–Kidney Symptom Index; NFKSI, National Comprehensive
Cancer Network FKSI.
Original Article
6 Cancer Month 00, 2012
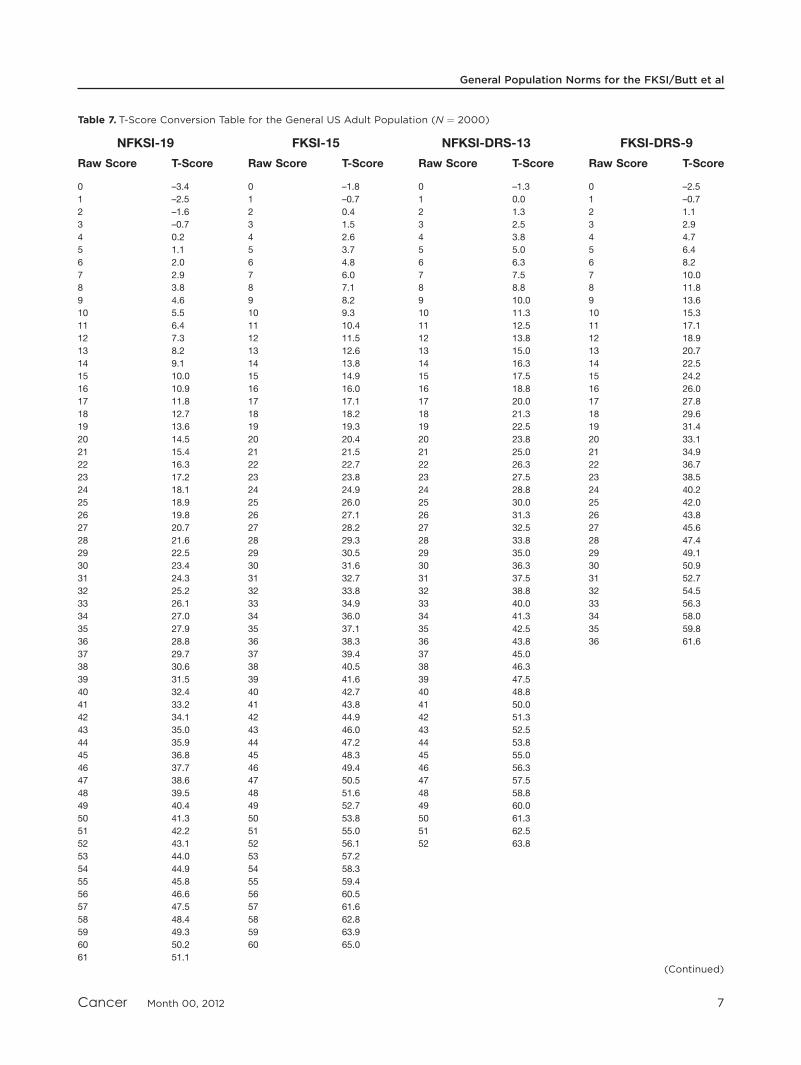
Table 7. T-Score Conversion Table for the General US Adult Population (N ¼ 2000)
NFKSI-19 FKSI-15 NFKSI-DRS-13 FKSI-DRS-9
Raw Score T-Score Raw Score T-Score Raw Score T-Score Raw Score T-Score
0 –3.4 0 –1.8 0 –1.3 0 –2.5
1 –2.5 1 –0.7 1 0.0 1 –0.7
2 –1.6 2 0.4 2 1.3 2 1.1
3 –0.7 3 1.5 3 2.5 3 2.9
4 0.2 4 2.6 4 3.8 4 4.7
5 1.1 5 3.7 5 5.0 5 6.4
6 2.0 6 4.8 6 6.3 6 8.2
7 2.9 7 6.0 7 7.5 7 10.0
8 3.8 8 7.1 8 8.8 8 11.8
9 4.6 9 8.2 9 10.0 9 13.6
10 5.5 10 9.3 10 11.3 10 15.3
11 6.4 11 10.4 11 12.5 11 17.1
12 7.3 12 11.5 12 13.8 12 18.9
13 8.2 13 12.6 13 15.0 13 20.7
14 9.1 14 13.8 14 16.3 14 22.5
15 10.0 15 14.9 15 17.5 15 24.2
16 10.9 16 16.0 16 18.8 16 26.0
17 11.8 17 17.1 17 20.0 17 27.8
18 12.7 18 18.2 18 21.3 18 29.6
19 13.6 19 19.3 19 22.5 19 31.4
20 14.5 20 20.4 20 23.8 20 33.1
21 15.4 21 21.5 21 25.0 21 34.9
22 16.3 22 22.7 22 26.3 22 36.7
23 17.2 23 23.8 23 27.5 23 38.5
24 18.1 24 24.9 24 28.8 24 40.2
25 18.9 25 26.0 25 30.0 25 42.0
26 19.8 26 27.1 26 31.3 26 43.8
27 20.7 27 28.2 27 32.5 27 45.6
28 21.6 28 29.3 28 33.8 28 47.4
29 22.5 29 30.5 29 35.0 29 49.1
30 23.4 30 31.6 30 36.3 30 50.9
31 24.3 31 32.7 31 37.5 31 52.7
32 25.2 32 33.8 32 38.8 32 54.5
33 26.1 33 34.9 33 40.0 33 56.3
34 27.0 34 36.0 34 41.3 34 58.0
35 27.9 35 37.1 35 42.5 35 59.8
36 28.8 36 38.3 36 43.8 36 61.6
37 29.7 37 39.4 37 45.0
38 30.6 38 40.5 38 46.3
39 31.5 39 41.6 39 47.5
40 32.4 40 42.7 40 48.8
41 33.2 41 43.8 41 50.0
42 34.1 42 44.9 42 51.3
43 35.0 43 46.0 43 52.5
44 35.9 44 47.2 44 53.8
45 36.8 45 48.3 45 55.0
46 37.7 46 49.4 46 56.3
47 38.6 47 50.5 47 57.5
48 39.5 48 51.6 48 58.8
49 40.4 49 52.7 49 60.0
50 41.3 50 53.8 50 61.3
51 42.2 51 55.0 51 62.5
52 43.1 52 56.1 52 63.8
53 44.0 53 57.2
54 44.9 54 58.3
55 45.8 55 59.4
56 46.6 56 60.5
57 47.5 57 61.6
58 48.4 58 62.8
59 49.3 59 63.9
60 50.2 60 65.0
61 51.1
(Continued)
General Population Norms for the FKSI/Butt et al
Cancer Month 00, 2012 7

FKSI that should be useful in guiding future comparativeeffectiveness research using the scales.
FUNDING SOURCESThis study was sponsored by Pfizer, Incorporated.
CONFLICT OF INTEREST DISCLOSUREPfizer paid Northwestern University for the scientific and
consultative expertise of Zeeshan Butt, John Peipert, KimberlyWebster, and David Cella in connection with the development ofthis manuscript. Zeeshan Butt was also supported in part by grantKL2RR025740 from the National Center for Research Resources(National Institutes of Health). Connie Chen is an employee andstockholder of Pfizer. The authors made no additional financialdisclosures related to this manuscript.
REFERENCES
1. Beaumont JL, Butt Z, Baladi J, et al. Patient-reported outcomes ina phase iii study of everolimus versus placebo in patients with meta-static carcinoma of the kidney that has progressed on vascular endo-thelial growth factor receptor tyrosine kinase inhibitor therapy.Oncologist. 2011;16:632-640.
2. Cella D, Michaelson MD, Bushmakin AG, et al. Health-relatedquality of life in patients with metastatic renal cell carcinomatreated with sunitinib vs interferon-alpha in a phase III trial: finalresults and geographical analysis. Br J Cancer. 2010;102:658-664.
3. Cella D, Yount S, Du H, et al. Development and validation of theFunctional Assessment of Cancer Therapy-Kidney Symptom Index(FKSI). J Support Oncol. 2006;4:191-199.
4. Cella D, Yount S, Brucker PS, et al. Development and validation ofa scale to measure disease-related symptoms of kidney cancer. ValueHealth. 2007;10:285-293.
Table 7. (Continued)
NFKSI-19 FKSI-15 NFKSI-DRS-13 FKSI-DRS-9
Raw Score T-Score Raw Score T-Score Raw Score T-Score Raw Score T-Score62 52.0
63 52.9
64 53.8
65 54.7
66 55.6
67 56.5
68 57.4
69 58.3
70 59.2
71 60.1
72 60.9
73 61.8
74 62.7
75 63.6
76 64.5
Abbreviations: DRS, disease-related symptoms; FKSI, Functional Assessment of Cancer Therapy–Kidney Symptom Index; NFKSI, National Comprehensive
Cancer Network FKSI.
Table 8. FKSI Comparisons by ECOG Performance Status and Number of Comorbid Conditions
NFKSI-19 FKSI-15 NFKSI-DRS-13 FKSI-DRS-9
n M SD Pa M SD Pa M SD Pa M SD Pa
ECOG
I have normal activity without symptoms 1268 63.7 9.0 <.0001 49.8 7.2 <.0001 43.7 6.3 <.0001 31.4 4.6 <.0001
I have some symptoms but do not require
bed rest during the waking day
615 54.4 10.6 <.0001 42.0 8.5 <.0001 37.1 7.8 <.001 26.8 5.5 <.0001
I require bed rest for less than 50%
of the waking day
87 45.4 11.7 .66 35.2 9.3 .77 31.3 8.6 .85 23.2 6.1 .76
I require bed rest for more than 50%
of the waking day
25 44.4 12.3 34.7 9.4 31.6 8.8 23.5 6.3
Comorbid Conditions0 448 65.6 7.8 .0002 51.3 6.4 .0001 45.2 5.3 <.0001 32.6 3.8 <.0001
1-2 694 63.4 8.6 <.0001 49.5 6.9 <.0001 43.6 6.0 <.0001 31.2 4.2 <.0001
3 257 58.9 8.9 <.0001 45.8 7.2 <.0001 40.6 6.4 <.0001 29.2 4.4 <.0001
41 601 51.6 12.0 39.9 9.5 35.0 8.6 25.3 6.2
aP values are tests for differences between adjacent categories.
Abbreviations: DRS, disease-related symptoms; ECOG, Eastern Cooperative Oncology Group; FKSI, Functional Assessment of Cancer Therapy–Kidney Symp-
tom Index; M, mean; NFKSI, National Comprehensive Cancer Network FKSI; SD, standard deviation.
Original Article
8 Cancer Month 00, 2012

5. Cella D, Paul D, Yount S, et al. What are the most importantsymptom targets when treating advanced cancer? A survey of pro-viders in the National Comprehensive Cancer Network (NCCN).Cancer Invest. 2003;21:526-535.
6. Cella D, Nowinski CJ. Measuring quality of life in chronicillness: the functional assessment of chronic illness therapy mea-surement system. Arch Phys Med Rehabil. 2002;83(12 suppl2):S10-S17.
7. US Food and Drug Administration. Guidance for Industry. Patient-Reported Outcome Measures: Use in Medical Product Develop-ment to Support Labeling Claims. Silver Spring, MD: US Foodand Drug Administration; 2009. http://www.fda.gov/downloads/Drugs/GuidanceComplianceRegulatoryInformation/Guidances/UCM071975.pdf. Accessed November 26, 2011.
8. Rao D, Butt Z, Rosenbloom S, et al. A comparison of the RenalCell Carcinoma-Symptom Index (RCC-SI) and the FunctionalAssessment of Cancer Therapy-Kidney Symptom Index (FKSI).J Pain Symptom Manage. 2009;38:291-298.
9. McHorney CA, Ware JE Jr, Raczek AE. The MOS 36-Item Short-Form Health Survey (SF-36): II. Psychometric and clinical tests ofvalidity in measuring physical and mental health constructs. MedCare. 1993;31:247-263.
10. Cella D, Beaumont JL, Liu Z, Phan AT, Choi S, Yao JC. Neuroen-docrine tumor disease state and PROMIS health-related quality oflife scores [abstract]. J Clin Oncol. 2010;28:15s.
11. Liu H, Cella D, Gershon R, et al. Representativeness of thePatient-Reported Outcomes Measurement Information SystemInternet panel. J Clin Epidemiol. 2010;63:1169-1178.
12. Farivar SS, Liu H, Hays RD. Half standard deviation estimate ofthe minimally important difference in HRQOL scores? Expert RevPharmacoecon Outcomes Res. 2004;4:515-523.
13. Cella D, Escudier B, Rini BI, et al. Patient-reported outcomes(PROs) in a phase III AXIS trial of axitinib versus sorafenib as asecond-line therapy for metastatic renal cell carcinoma (mRCC).Proceedings of the 2011 ASCO Annual Meeting. J Clin Oncol.2011;29(15 suppl): abstract 4504.
General Population Norms for the FKSI/Butt et al
Cancer Month 00, 2012 9