Embed Size (px)
Citation preview

Generated on 03/03/2019
Microbiome Reportרינת אישק Client ID 8617

Overview
DayTwo™ provides solutions based on the DayTwoTM Microbiome Platform
aiming to prevent and treat metabolic diseases, primarily diabetes and
obesity. The DayTwo™ App provides personally tailored nutrition guidelines
aimed at balancing blood sugar levels post meal. As high blood sugar is
linked to energy dips, excessive hunger, weight gain, and increased risk for
metabolic diseases like obesity and diabetes, balancing blood sugar levels
presents a significant health benefit. Users provide personal and clinical
information, a stool sample (we use full shotgun next generation
sequencing technology to sequence the DNA of the gut microbiome),
blood tests etc. - all this data is used to create for each user their
personalized cloud-based DayTwo predictor. Users get a personalized
report that includes details of their better and worse foods and complex
meals; the ability to search and receive a prediction for various foods and
meals; and a detailed report on their microbiome.
2

Introduction to the Microbiome ReportIntroWhat is the Gut Microbiome?The importance of your Gut MicrobiomeTaxonomic ClassificationInterpretation of your Results
3

Intro
Microbes are everywhere, they live in and on all animals and plants and
they fill our oceans. Right now, they are on your phone, your hands (even if
you wash them), in your drinking water (about a million per one milliliter!),
in aerosols around you and present at any moment in time. In fact, the
ecosystem of planet earth, which is composed of a multitude of habitats,
contains different sets of microbes that are essential for proper ecosystem
functioning. As the ecosystems of planet Earth have a series of habitats
with specific organisms that are essential for a proper ecosystem
functioning, so does the human body. On a smaller scale, the human body
is also an ecosystem, with different body sites providing different habitats
for microbial communities. The microbial communities living in and on our
body are collectively called the microbiome and we have distinct
microbiomes at each of our body sites.
4

What is the Gut Microbiome?
The gut microbiome is a collective name for the 40 trillion cells and up to
1000 microbial species that include bacteria, viruses, fungi, parasites and
archaea and reside in our gut. The number of gut bacterial cells is
approximately equal to the total number of human cells in our body, so if
we consider only cell counts, we are only about half human. In terms of
gene counts, the microbiome contains about 200 times more genes than
the human genome, making bacterial genes responsible for over 99% of
our bodies’ gene content! Of all the microbial communities in the human
body, the gut microbiome is by far the most dense, diverse and
physiologically important ecosystem to our overall health.
5

The importance of your Gut Microbiome
Our body lives in a symbiotic relationship with the microbes within us,
which are significant contributors to our health and overall wellness.
Health: In recent years science has discovered various associations
between the microbiome and various health conditions including obesity(1),
allergies and autoimmune conditions(2-4), vascular diseases(5),
gastrointestinal diseases and disorders (IBS, IBD, Crohn's, colitis)(6-8) and
even neurodegenerative disorders and mental conditions(9-10).
Energy: Bacterial breakdown of food provides approximately 10-20% of our
energy supplies(11). The extent of energy extracted from foods depends on
the microbiome, and it can differ dramatically between people(12).
6

Essential Nutrients: The human body cannot produce all the nutrients
required for its proper functioning, so some nutrients must be either
acquired from diet, or produced by the gut microbiome. For example, the
gut microbiome is a key producer of essential vitamins, like vitamin K and
many vitamin B derivatives(13-14). Additionally, while many food components
are absorbed early in our digestive tract (i.e the small intestine), some
kinds of dietary fiber can only be broken down in the large intestines by
specific members of the gut microbiome. Important products of this
process include short chain fatty acids (SCFA) that are important for
energizing colon cells, have anti-inflammatory properties and are even
associated with hunger levels and the release of the hunger hormone,
Leptin(15-16).
Immunity: There is growing evidence that the microbiome is regulating
our immune system(17). Our microbiome is important in developing our
immune system, helps by making our body tolerate food molecules and
harmless substances, helps in recognizing invaders and protects against
pathogens by constantly communicating with the immune system in the
intestines(18).
7

Taxonomic Classification
Taxonomy is the science of organisms classification into
groups based on shared characteristics or evolutionary
relatedness. All living organisms are classified using
taxonomic classifications.
Ranks or Levels of Microbial Taxonomy:
Taxonomic classification is a hierarchical grouping of
organisms in ranks of decreasing similarity. Organism
groups can be aggregated with other relatively similar
groups of the same rank, to create a super-group of
higher rank. In bacterial taxonomy, the most commonly
used ranks or levels in their ascending order are: strains,
species, genera, families, orders, classes, phyla and
domain (see table).
Species is the basic taxonomic group in bacterial
taxonomy. Groups of species are then collected into
genera. Groups of genera are collected into families (sing.
family), families into orders, orders into classes, classes
into phyla (sing., phylum), and phyla into domain (the
highest rank or level). Groups of bacteria at each rank or
level have names with endings or suffixes characteristic
to that rank or level.
8

Taxonomic Hierarchy
GENERAL
SPECIFIC
KINGDOM
PHYLUM
CLASS
ORDER
FAMILY
GENUS
SPECIES
STRAIN
Taxonomic Hierarchy
Homo sapiens Bacteroides fragilis
KINGDOM Animalia Bacteria
PHYLUM Chordata Bacteroidetes
CLASS Mammalia Bacteroidia
ORDER Primates Bacteroidales
FAMILY Hominidae Bacteroidaceae
GENUS Homo Bacteroides
SPECIES H. sapiens B. fragilis
STRAIN gcf_000297735
9

Interpretation of your Results
The results in this report are based of identification and quantification of
microbial DNA sequences from your stool sample. In some cases, your
results are compared to microbiome compositions of others in DayTwo’s
cohort. Therefore, some of the analyses provide relative scores with
respect to the entire DayTwo cohort (for example, diversity score of 10 will
be given to the individual with the most diverse microbiome in our cohort
while a grade of 1 will be given to the individual with the least diverse
microbiome in our cohort).
The Microbiome Report provides an analysis for gut bacteria for general wellness informational purposes only. It is based only on the available science to date.The information provided in this report is NOT intended to be used for clinical diagnostic purposes and should not be used in formulating treatment recommendations.This test was developed and its performance characteristics validated by the laboratory. It has not been cleared or approved by the FDA.
The report includes:
Ecological analysis of your gut microbiome composition (Richness, Evenness, Diversity)Your Microbiome composition in the phylum and genus levelImportant bacterial ratios in the phylum and genus levelProbiotic Bacteria abundance and compositionImportant Microbiome members abundanceUnique bacteria from your gut microbiomeImportant nutritional functions by your microbiome (B-Vitamins and Short Chain Fatty Acids).In cases where multiple stool samples are provided, comparative analyses of the changes are performed so you can track and see how your microbiome changes with time.
10

Client רינת אישק
Client ID 8617
Phylum Composition Above AVG
Average
Below AVG
Bacterial Phyla YouRelative Abundance %
PopulationRelative Abundance %
Bacteroidetes 83.83 37.13
Firmicutes 13.11 49.01
Proteobacteria 2.4 1.42
Actinobacteria 0.65 3.68
12

Client רינת אישק
Client ID 8617
Genus Composition
Bacteroides 74.18
Faecalibacterium 4.77
Alistipes 4.71
Parabacteroides 2.8
Roseburia 1.87
Sutterella 1.52
Subdoligranulum 1.38
Barnesiella 1.28
Acidaminococcus 1.12
Above AVG
Average
Below AVG
Bacterial Genus YouRelative Abundance %
PopulationRelative Abundance %
Bacteroides 74.18 13.51
Faecalibacterium 4.77 6.18
Alistipes 4.71 3.71
Parabacteroides 2.8 1.66
Roseburia 1.87 1.48
Sutterella 1.52 0.18
Subdoligranulum 1.38 3.60
Barnesiella 1.28 0.68
Acidaminococcus 1.12 0.00
Blautia 0.81 1.55
13

Your 50 most abundant species listThis list will present the fifty most prevalent species found in your gut, and
their abundance compared to population average.
14

Client רינת אישק
Client ID 8617
Bacterial Specie YouRelative Abundance %
PopulationRelative Abundance %
Bacteroides stercoris 27.45 0.18
Bacteroides ovatus 13.61 0.38
Bacteroides uniformis 11.35 1.17
Bacteroides massiliensis 7.95 0.54
Bacteroides sp_2_1_22 5.49 0.00
Faecalibacterium prausnitzii 4.77 6.18
Bacteroides vulgatus 4.21 1.17
Alistipes putredinis 3.51 1.86
Bacteroides thetaiotaomicron 2.38 0.16
Parabacteroides distasonis 1.77 0.14
Roseburia intestinalis 1.69 0.27
Sutterella wadsworthensis 1.52 0.18
Subdoligranulum unclassified 1.38 3.58
Barnesiella intestinihominis 1.28 0.68
Alistipes shahii 1.14 0.49
Acidaminococcus unclassified 1.09 0.00
Parabacteroides merdae 1.03 0.80
Odoribacter splanchnicus 0.72 0.45
Bacteroides dorei 0.58 0.52
Oscillibacter unclassified 0.52 0.11
Dorea longicatena 0.44 0.89
Eubacterium biforme 0.43 0.00
Bilophila unclassified 0.42 0.16
Ruminococcus gnavus 0.41 0.00
15

Client רינת אישק
Client ID 8617
Bacterial Specie YouRelative Abundance %
PopulationRelative Abundance %
Bacteroides clarus 0.41 0.00
Bacteroides cellulosilyticus 0.37 0.08
Enterococcus faecium 0.35 0.00
Lachnospiraceae bacterium_1_1_57faa 0.32 0.03
Bifidobacterium longum 0.32 0.41
Ruminococcus torques 0.32 0.78
Bacteroides caccae 0.31 0.61
Bifidobacterium bifidum 0.31 0.00
Escherichia coli 0.29 0.04
Eubacterium hallii 0.23 0.96
Dorea formicigenerans 0.2 0.39
Roseburia inulinivorans 0.16 0.32
Bacteroidales bacterium_ph8 0.13 0.32
Coprococcus comes 0.12 0.51
Flavonifractor plautii 0.1 0.00
Megasphaera unclassified 0.09 0.00
Ruminococcus obeum 0.08 0.59
Bilophila wadsworthia 0.07 0.01
Lachnospiraceae bacterium_7_1_58faa 0.07 0.01
Enterobacter cloacae 0.06 0.00
Dialister succinatiphilus 0.06 0.00
Bacteroides xylanisolvens 0.06 0.04
Lachnospiraceae bacterium_5_1_63faa 0.04 0.13
Coprobacillus unclassified 0.04 0.00
16

Bacterial Abundance RatiosThe abundance ratios for certain bacterial taxa may provide insights on
health and diet.
Phylum LevelGenus Level
17

Client רינת אישק
Client ID 8617
Bacteroidetes/Firmicutes ratioFirmicutes & Bacteroidetes are the two most abundant phyla in the human gut microbiome. High ratio was linked in several studies to (21,22) overweight and obese individuals (however, this ratio is still debatable in the scientific community).
You Overall Population
Bacteroidetes Firmicutes Other
Your most up-to-date Bacteroidetes abundance is high compared to its average abundance in the population.
Your most up-to-date Firmicutes abundance is low compared to its average abundance in the population.
Your Bacteroidetes to Firmicutes ratio is high compared to the population.High ratio was reported to be inversely correlated with obesity, though
studies are inconclusive.
18
Client רינת אישק
Client ID 8617
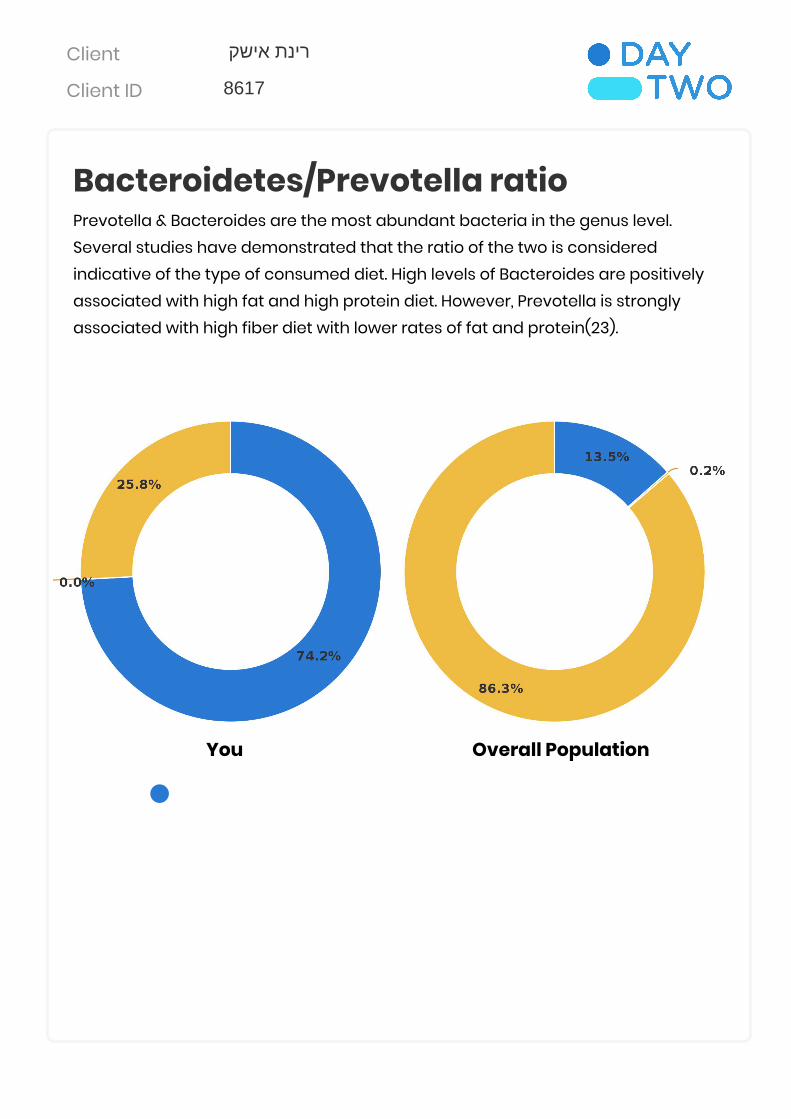
Bacteroidetes/Prevotella ratioPrevotella & Bacteroides are the most abundant bacteria in the genus level. Several studies have demonstrated that the ratio of the two is considered indicative of the type of consumed diet. High levels of Bacteroides are positively associated with high fat and high protein diet. However, Prevotella is strongly associated with high fiber diet with lower rates of fat and protein(23).
You Overall Population
Bacteroidetes Prevotella Other
Your most up-to-date Bacteroidetes abundance is high compared to its average abundance in the population.
Your most up-to-date Prevotella abundance is low compared to its average abundance in the population.
Your Bacteroidetes to Prevotella ratio is high compared to the population.High ratios are associated with western diets (high protein and fat diets).
19

Important Microbiome Members
Akkermansia muciniphilaAlistipes sp.Eubacterium sp.Roseburia sp.Faecalibacterium prausnitzii
According to several studies, these bacterial genus and species have
been associated with beneficial health marker,obtain important
functional roles and have been negatively associated with various
disease when found in high abundance in the human gut.
20

Client רינת אישק
Client ID 8617
Eubacterium sp.Play an important role in the gut microbiome and are known as a core bacteria in the human gut (Appears in more than 95% of the population). They are among the first gut colonizers after birth. Important in digestion of complex carbohydrates originated from beans, legumes and whole grains.(24,25)
Alistpies sp.Are known as a core bacteria in the human gut (appears in more than 95% of the population).Their abundance increases in plant based diet and decreases in a diet rich with fat and meat. It is negatively associated with Colitis, Crohn's and IBD disease(26). On the other hand, very high rates of Alistipes were associated with abdominal pain in children(27)
Roseburia sp.Are part of the commensal bacterial community that that resides in humans gut. They are known to produce short-chain fatty acids, especially butyrate, which possibly affects colonic motility, immunity maintenance and anti-inflammatory properties.This genus was observed to be positively associated with Mediterranean diet, and negatively associated with metabolic disease, immune disorders and neurological diseases(28)
You
0.2
Population
7.6
You
4.7Population
3.7
You
1.9Population
1.5
21

Client רינת אישק
Client ID 8617
Akkermansia muciniphilaAkkermansia muciniphila are positively associated with greater microbial gene richness and with a healthier metabolic status. Moreover, A. muciniphila
are associated with greater improvement in glucose homoeostasis, blood lipids and waist circumference after calorie restriction(29)
Faecalibacterium prausnitziiAre highly abundant species in the human gut microbiome. In healthy adults, F. prausnitzii represents more than 5% of the bacteria in the intestine, making it one of the most common gut bacteria and It is known to boosts our immune system and reduce inflammation. Lower than normal levels of F. prausnitzii in the intestines have been associated with Crohn's Disease, obesity, asthma and Major Depressive Disorder. (30,31). On the other hand, very high rates of Alistipes were associated with abdominal pain in children(27)
You
0.0Population
0.1
You
4.8
Population
6.2
22

Rare SpeciesRare species are defined as bacterial species which are absent or present
at low abundance in the total population cohort, but are present or
relatively abundant in your gut, respectively.
In other words, these are the bacteria whose abundance in your gut is
markedly different than in the general population.
23

Client רינת אישק
Client ID 8617
Rare Species
Bacterial Genus YouRelative Abundance %
PopulationRelative Abundance %
Ratio
Bacteroides stercoris 27.45 0.18 > 30
Acidaminococcus unclassified 1.09 0.00 > 30
Bacteroides ovatus 13.61 0.38 > 30
Bacteroides sp_2_1_22 5.49 0.00 > 30
Bacteroides thetaiotaomicron 2.38 0.16 14.875
Bacteroides massiliensis 7.95 0.54 14.722
Parabacteroides distasonis 1.77 0.14 12.643
Bacteroides uniformis 11.35 1.17 9.701
Sutterella wadsworthensis 1.52 0.18 8.444
Roseburia intestinalis 1.69 0.27 6.259
Oscillibacter unclassified 0.52 0.11 4.727
24

Client רינת אישק
Client ID 8617
Rare Species
Bacterial Genus YouRelative Abundance %
PopulationRelative Abundance %
Ratio
Bacteroides vulgatus 4.21 1.17 3.598
Alistipes shahii 1.14 0.49 2.327
25

Important Gut Microbiome Functional MetabolitesShort Chain Fatty Acids (SCFA)SCFA are key bacterial fermentation products that are produced when available non-digestive carbohydrates and dietary fiber are fermented in the colon. They play a significant role in providing energy to the colonocytes and have an important role in central appetite regulation. The main SCFA produced in the gut are Acetate, Butyrate and Propionate. High values in SCFA production meters indicate a strong potential of SCFA production in your gut.
Vitamin B BiosynthesisB-vitamins are necessary cofactors for various aspects of human metabolism, including fat and carbohydrate metabolism and DNA synthesis. Human cells are not capable of producing B-vitamins in sufficient amounts; Thus, we obtain such vitamins either from directly from diet, or by utilizing vitamins produced by gut microbiota (36). B vitamins are indeed present in many food products, but they are water-soluble and many of them are temperature sensitive. Therefore, these vitamins are easily washed off or destroyed during the cooking process therefore, there is great interest in the B-vitamin production by the gut microbiota.
Although the gut microbiome os producing vitamin B's in different amounts, there is ongoing research about its association to these vitamin's levels in the blood.
26
Client רינת אישק
Client ID 8617
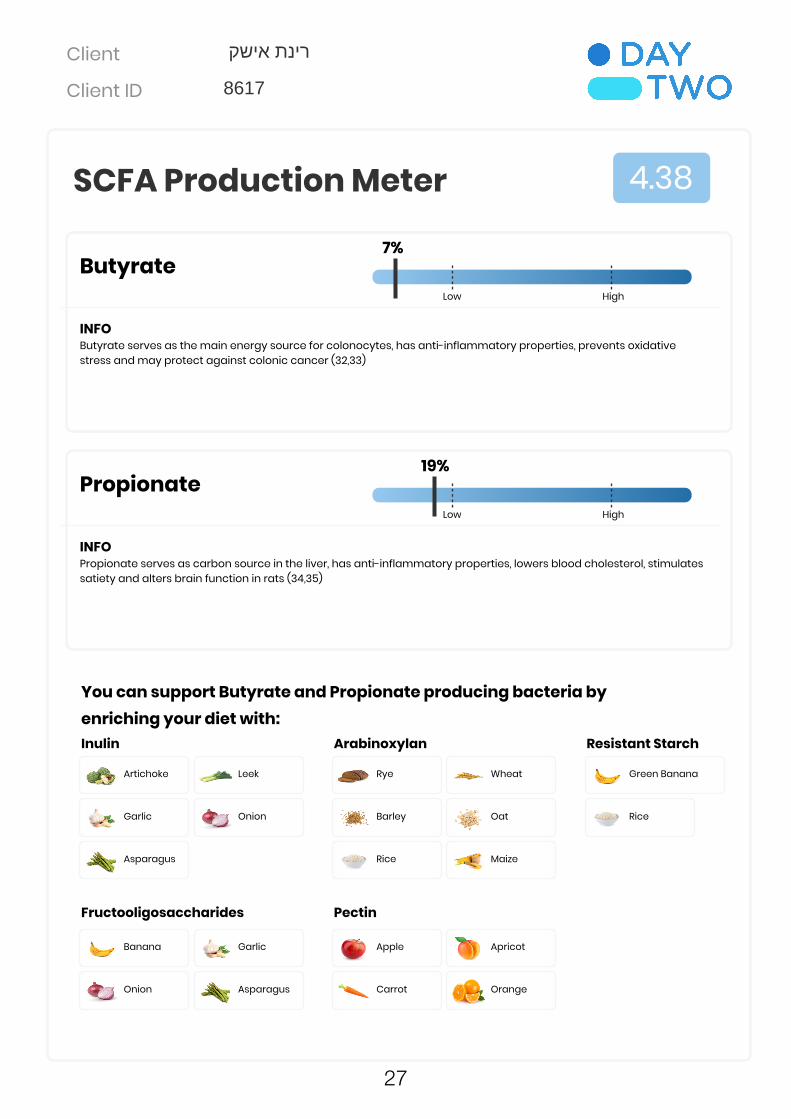
SCFA Production Meter 4.38
ButyrateLow High
7%
INFOButyrate serves as the main energy source for colonocytes, has anti-inflammatory properties, prevents oxidative stress and may protect against colonic cancer (32,33)
PropionateLow High
19%
INFOPropionate serves as carbon source in the liver, has anti-inflammatory properties, lowers blood cholesterol, stimulates satiety and alters brain function in rats (34,35)
You can support Butyrate and Propionate producing bacteria by enriching your diet with:Inulin
Artichoke Leek
Garlic Onion
Asparagus
Arabinoxylan
Rye Wheat
Barley Oat
Rice Maize
Resistant Starch
Green Banana
Rice
Fructooligosaccharides
Banana Garlic
Onion Asparagus
Pectin
Apple Apricot
Carrot Orange
27
Client רינת אישק
Client ID 8617
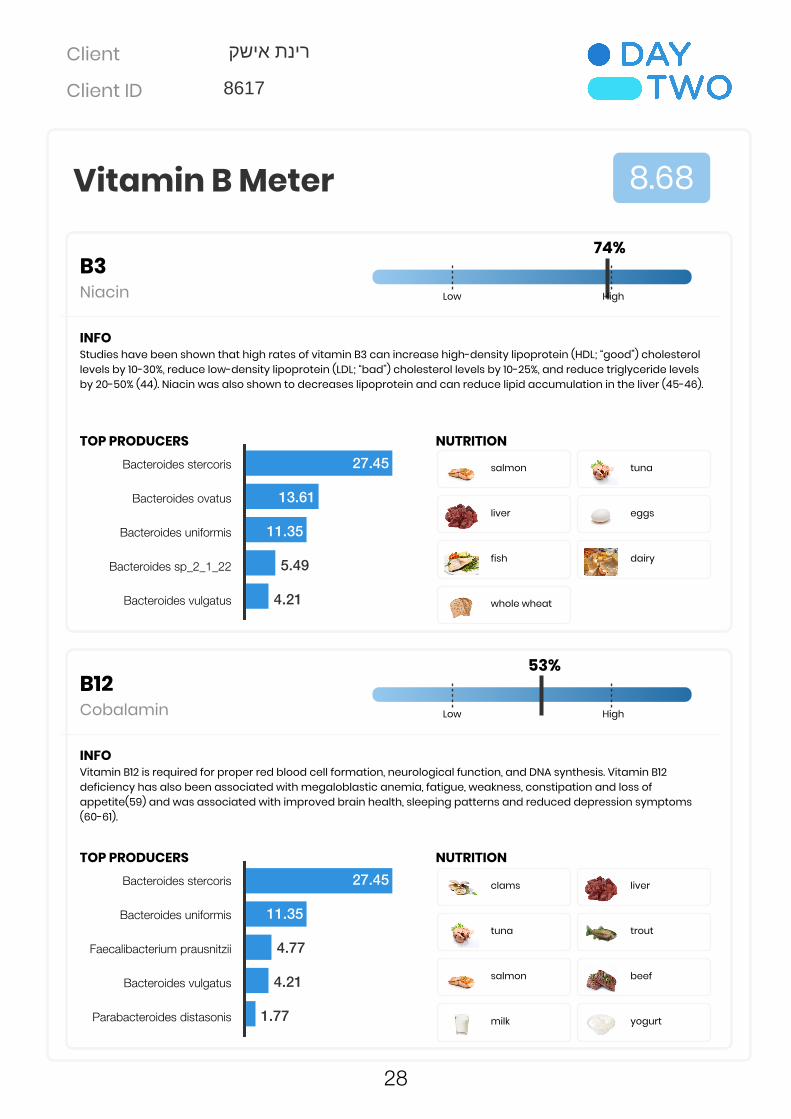
Vitamin B Meter 8.68
B3Niacin Low High
74%
INFOStudies have been shown that high rates of vitamin B3 can increase high-density lipoprotein (HDL; “good”) cholesterol levels by 10-30%, reduce low-density lipoprotein (LDL; “bad”) cholesterol levels by 10-25%, and reduce triglyceride levels by 20-50% (44). Niacin was also shown to decreases lipoprotein and can reduce lipid accumulation in the liver (45-46).
TOP PRODUCERSBacteroides stercoris 27.45
Bacteroides ovatus 13.61
Bacteroides uniformis 11.35
Bacteroides sp_2_1_22 5.49
Bacteroides vulgatus 4.21
NUTRITION
salmon tuna
liver eggs
fish dairy
whole wheat
B12Cobalamin Low High
53%
INFOVitamin B12 is required for proper red blood cell formation, neurological function, and DNA synthesis. Vitamin B12 deficiency has also been associated with megaloblastic anemia, fatigue, weakness, constipation and loss of appetite(59) and was associated with improved brain health, sleeping patterns and reduced depression symptoms (60-61).
TOP PRODUCERSBacteroides stercoris 27.45
Bacteroides uniformis 11.35
Faecalibacterium prausnitzii 4.77
Bacteroides vulgatus 4.21
Parabacteroides distasonis 1.77
NUTRITION
clams liver
tuna trout
salmon beef
milk yogurt
28

Client רינת אישק
Client ID 8617
Vitamin B Meter 8.68
B1Thiamin Low High
73%
INFOVitamin B1 helps to make ATP, the body’s main energy-carrying molecule. Thiamine is essential for a metabolic pathway called pyruvate dehydrogenase, which works to metabolize sugars that we eat(37).Additionally, thiamine levels in plasma have been shown to be lower in people with type 2 diabetes(38) and it was also has been shown to improve cardiac function in people with heart failure(39).
TOP PRODUCERSBacteroides stercoris 27.45
Bacteroides ovatus 13.61
Bacteroides uniformis 11.35
Bacteroides sp_2_1_22 5.49
Bacteroides vulgatus 4.21
NUTRITION
lentils green peas
pecans oranges
cantaloupe milk
eggs pork
B9Folate Low High
70%
INFOFolate has an important role in nucleic acid synthesis, stability and in DNA repair mechanisms. It has great importance in normal brain development and function, cognitive function and depression disorders(54-56) and several studies have shown that high rates of folate might reduce the risk of some forms of cancer(57-58).
TOP PRODUCERSBacteroides stercoris 27.45
Bacteroides ovatus 13.61
Bacteroides uniformis 11.35
Bacteroides sp_2_1_22 5.49
Bacteroides vulgatus 4.21
NUTRITION
asparagus broccoli
brussel sprouts avocado
citrus fruits
29

Client רינת אישק
Client ID 8617
Vitamin B Meter 8.68
B2Riboflavin Low High
79%
INFOVitamin B2 was shown to have anti-inflammatory properties in several studies(40,41). It has been shown to be produced in the gut in larger amounts after ingestion of vegetable-based than meat-based foods (42). Riboflavin is required for mitochondrial function (Mitochondrial dysfunction is thought to play a causal role in some types of migraine), researchers are studying the potential use of riboflavin to prevent or treat migraine headaches (43).
TOP PRODUCERSBacteroides stercoris 27.45
Bacteroides ovatus 13.61
Bacteroides uniformis 11.35
Bacteroides sp_2_1_22 5.49
Faecalibacterium prausnitzii 4.77
NUTRITION
lean meat eggs
tomatoes cabbage
cereals squash
milk nuts
B7Biotin Low High
69%
INFOHigh rates of biotin are often promoted for hair, skin, and nail health(52). In several studies Biotin has been inversely associated with disease progression and associated with improve symptoms in patients with progressive multiple sclerosis(53).
TOP PRODUCERSBacteroides stercoris 27.45
Bacteroides ovatus 13.61
Bacteroides uniformis 11.35
Bacteroides sp_2_1_22 5.49
Bacteroides vulgatus 4.21
NUTRITION
chickpeas liver
tuna salmon
chicken breast cereals
30

Client רינת אישק
Client ID 8617
Vitamin B Meter 8.68
B6Pyridoxin Low High
73%
INFOVitamin B6 might reduce cardiovascular disease risk by lowering homocysteine levels to reduce heart disease risk (48-49). Several studies have shown that higher rates of B6 were associated with nausea and vomiting in the first few months of pregnancy(50-51).
TOP PRODUCERSBacteroides stercoris 27.45
Bacteroides ovatus 13.61
Bacteroides uniformis 11.35
Bacteroides sp_2_1_22 5.49
Bacteroides vulgatus 4.21
NUTRITION
chickpeas beef liver
tuna salmon
chicken breast cereals
B5Pantothenate Low High
72%
INFOPantothenic acid has a role in triglyceride synthesis and lipoprotein metabolism so it was hypothesized that pantothenic acid supplementation might reduce lipid levels in patients with hyperlipidemia(47).
TOP PRODUCERSBacteroides stercoris 27.45
Bacteroides ovatus 13.61
Bacteroides uniformis 11.35
Bacteroides sp_2_1_22 5.49
Bacteroides vulgatus 4.21
NUTRITION
beef fish
lobster pork chicken
sunflower seeds dairy products
yogurt milk
31

Analysis of Ecological ParametersMicrobial Diversity is a measure combining both bacterial Richness and
Evenness
Gut Microbial Diversity is associated with a healthy microbiome and overall
wellness.(19,20)
Species RichnessThe number of different species represented in your bacterial community
Species EvennessRefers to how close in abundance are each species in the microbiome.
Species Diversitya quantitative measure that reflects the richness of species in the
microbiome and how evenly they are distributed
32

Client רינת אישק
Client ID 8617
Gut Diversity Index 3.88 Above AVG
Average
Below AVG
Your microbial diversity measures are somewhat above average in relation
to the total population.
High microbial diversity and richness were shown to be positively correlated
with various health measures. Eating more fiber and frequent exercise can
help with increasing gut microbial diversity.
33

Probiotic BacteriaBacteria who are believed to provide health benefits to their host, including
better regulation of inflammatory and hypersensitivity responses,
reduction of serum cholesterol levels and alleviation of ulcerative colitis.
You can find probiotic bacteria in various kinds of food as: Yogurt, Cheese,
Sauerkraut, Pickles, Beer, Cider, Kimchi, Cocoa, Kefir, Miso and Kombucha.
34

Client רינת אישק
Client ID 8617
Probiotic Bacteria Meter 3.88 Above AVG
Average
Below AVG
Akkermansia muciniphila Below Average
Streptococcus thermophilus Below Average
Lactobacillus Above Average
Bifidobacterium Average
Ruminococcus bromii Average
Faecalibacterium prausnitzii Average
35

DayTwo Uses Shotgun Metagenomics SequencingTaxonomic ResolutionShotgun Metagenomics sequencing allows the identification of bacterial taxonomy at the highest resolution possible (strain level), while 16S rRNA sequencing generally allows for a much lower resolution (mostly at the genus level). This is important since species and even in their pathogenicity (ability to cause disease). Unlike Shotgun Metagenomics Sequencing that allows detection of all DNA in the sample, 16S does not allow for identification of viruses and fungi, as the 16S gene is not present in those. in the same genus can vary greatly in their metabolic capabilities
Functional profilingWhole Genome Sequencing allows for accurate characterization of the metabolic capabilities of the microbial community. In contrast, 16S rRNA sequencing does not allow this, as only a very small fraction of the genomes present are sequenced. In cases where a functional profile is presented based on 16S data, it is important to know that this characterization is based on publicly available, sequenced genomes, and not based on genes actually found in the sample, and can thus be very inaccurate.
36

Company Overview
DayTwo™ provides solutions based on the DayTwo™ Microbiome Platform
aiming to prevent and treat metabolic diseases, primarily diabetes and
obesity. The DayTwo™ App provides personally tailored nutrition guidelines
aimed at balancing blood sugar levels post meal. As high blood sugar is
linked to energy dips, excessive hunger, weight gain, and increased risk for
metabolic diseases like obesity and diabetes, balancing blood sugar levels
presents a significant health benefit. Users provide personal and clinical
information, a stool sample (we use full shotgun next generation
sequencing technology to sequence the DNA of the gut microbiome),
blood tests etc. - all this data is used to create for each user their
personalized cloud-based DayTwo predictor.
Users get a personalized report that includes details of their better and
worse foods and complex meals; the ability to search and receive a
prediction for various foods and meals; and a detailed report on their
microbiome.
37

References
38

V. K. Ridaura et al. “Gut Microbiota from Twins Discordant for Obesity Modulate Metabolism in Mice.” 1. Science 341, no. 6150 (2013). http://science.sciencemag.org/content/341/6150/1241214.
M. Noval Rivas et al. “A Microbiota Signature Associated with Experimental Food Allergy Promotes Allergic 2. Sensitization and Anaphylaxis.” Journal of Allergy and Clinical Immunology 131, no. 1 (2013): 201–212. http://www.jacionline.org/article/S0091-6749(12)01694-6/abstract.
M. C. de Goffau et al. “Fecal Microbiota Composition Differs between Children with B-Cell Autoimmunity and 3. Those Without.” Diabetes 62, no. 4 (2013): 1238–1244. http://diabetes.diabetesjournals.org/content/62/4/1238.
A. Giongo et al. “Toward Defining the Autoimmune Microbiome for Type 1 Diabetes.” ISME Journal 5 (2011): 4. 82–91. http://www.nature.com/ismej/journal/v5/n1/full/ismej201092a.html.
Z. Wang et al. “Gut Flora Metabolism of Phosphatidylcholine Promotes Cardiovascular Disease.” Nature 472, 5. no. 7341 (2011): 57–63. http://www.nature.com/nature/journal/v472/n7341/full/nature09922.html.
S. Michail et al. “Alterations in the Gut Microbiome of Children with Severe Ulcerative Colitis.” Inflammatory 6. Bowel Diseases 18, no. 10 (2012): 1799–1808. https://www.ncbi.nlm.nih.gov/pubmed/22170749.
Manichanh, C., Borruel, N., Casellas, F., & Guarner, F. (2012). The Gut Microbiota In IBD. Nature reviews 7. Gastroenterology & hepatology, 9(10), 599. https://www.nature.com/articles/nrgastro.2012.152
Noor, S. O., Ridgway, K., Scovell, L., Kemsley, E. K., Lund, E. K., Jamieson, C., ... & Narbad, A. (2010). 8. Ulcerative colitis and irritable bowel patients exhibit distinct abnormalities of the gut microbiota. BMC gastroenterology, 10(1), 134. https://bmcgastroenterol.biomedcentral.com/articles/10.1186/1471-230X-10-134
A. Keshavarzian et al. “Colonic Bacterial Composition in Parkinson’s Disease.” Movement Disorders 30, no. 10 9. (2015): 1351–1360. http://onlinelibrary.wiley.com/doi/10.1002/mds.26307/abstract.
J. M. Hill et al. “Pathogenic Microbes, the Microbiome, and Alzheimer’s Disease (AD).” Frontiers in Aging 10. Neuroscience 6 (2014): 127. https://www.ncbi.nlm.nih.gov/pmc/articles/PMC4058571/.
McNeil, N. I. (1984). The contribution of the large intestine to energy supplies in man. The American journal of 11. clinical nutrition, 39(2), 338-342. https://academic.oup.com/ajcn/article-abstract/39/2/338/4691042.
P. J. Turnbaugh et al. “An Obesity-Associated Gut Microbiome with Increased Capacity for Energy Harvest.” 12. Nature 444 (2006): 1027–1031. http://www.nature.com/nature/journal/v444/n7122/abs/nature05414.html
LeBlanc, J. G., Milani, C., de Giori, G. S., Sesma, F., Van Sinderen, D., & Ventura, M. (2013). Bacteria as 13. vitamin suppliers to their host: a gut microbiota perspective. Current opinion in biotechnology, 24(2), 160-168. https://www.sciencedirect.com/science/article/pii/S095816691200119X
Magnúsdóttir, S., Ravcheev, D., de Crécy-Lagard, V., & Thiele, I. (2015). Systematic genome assessment of B-14. vitamin biosynthesis suggests co-operation among gut microbes. Frontiers in genetics, 6, 148. https://www.frontiersin.org/articles/10.3389/fgene.2015.00148/full
Frost, G., Sleeth, M. L., Sahuri-Arisoylu, M., Lizarbe, B., Cerdan, S., Brody, L., ... & Carling, D. (2014). The 15. short-chain fatty acid acetate reduces appetite via a central homeostatic mechanism. Nature communications, 5, 3611. https://www.nature.com/articles/ncomms4611
Schwiertz, A., Taras, D., Schäfer, K., Beijer, S., Bos, N. A., Donus, C., & Hardt, P. D. (2010). Microbiota and 16. SCFA in lean and overweight healthy subjects. Obesity,18(1),190-195. https://onlinelibrary.wiley.com/doi/abs/10.1038/oby.2009.167
39

Ost, K. S., & Round, J. L. (2018). Communication Between the Microbiota and Mammalian Immunity. Annual 17. review of microbiology, 72. https://www.annualreviews.org/doi/abs/10.1146/annurevmicro-090817-062307
Macpherson, A. J., de Agu�ero, M. G., & Ganal-Vonarburg, S. C. (2017). How nutrition and the maternal 18. microbiota shape the neonatal immune system. Nature Reviews Immunology, 17(8), 508. https://www.nature.com/articles/nri.2017.58
Le Chatelier, E., Nielsen, T., Qin, J., Prifti, E., Hildebrand, F., Falony, G., ... & Leonard, P. (2013). Richness of 19. human gut microbiome correlates with metabolic markers. Nature, 500(7464), 541.
Huttenhower, C., Gevers, D., Knight, R., Abubucker, S., Badger, J. H., Chinwalla, A. T., ... & Giglio, M. G. 20. (2012). Structure, function and diversity of the healthy human microbiome. Nature, 486(7402), 207.
Wu, G. D., Chen, J., Hoffmann, C., Bittinger, K., Chen, Y. Y., Keilbaugh, S. A., ... & Sinha, R. (2011). Linking 21. long-term dietary patterns with gut microbial enterotypes. Science, 334(6052), 105-108.
Schwiertz, A., Taras, D., Schäfer, K., Beijer, S., Bos, N. A., Donus, C., & Hardt, P. D. (2010). Microbiota and 22. SCFA in lean and overweight healthy subjects. Obesity, 18(1), 190-195.
Jumpertz, R., Le, D. S., Turnbaugh, P. J., Trinidad, C., Bogardus, C., Gordon, J. I., & Krakoff, J. (2011). Energy-23. balance studies reveal associations between gut microbes, caloric load, and nutrient absorption in humans. The American journal of clinical nutrition, 94(1), 58-65.
Flint, H. J., Scott, K. P., Louis, P., & Duncan, S. H. (2012). The role of the gut microbiota in nutrition and health. 24. Nature Reviews Gastroenterology and Hepatology, 9(10), 577.
Flint, H. J., Scott, K. P., Duncan, S. H., Louis, P., & Forano, E. (2012). Microbial degradation of complex 25. carbohydrates in the gut. Gut microbes, 3(4), 289-306.
Willing, B. P., Dicksved, J., Halfvarson, J., Andersson, A. F., Lucio, M., Zheng, Z., ... & Engstrand, L. (2010). A 26. pyrosequencing study in twins shows that gastrointestinal microbial profiles vary with inflammatory bowel disease phenotypes. Gastroenterology, 139(6), 1844-1854.
Saulnier, D. M., Riehle, K., Mistretta, T. A., Diaz, M. A., Mandal, D., Raza, S., ... & Petrosino, J. F. (2011). 27. Gastrointestinal microbiome signatures of pediatric patients with irritable bowel syndrome. Gastroenterology, 141(5), 1782-1791.
Tamanai-Shacoori, Z., Smida, I., Bousarghin, L., Loreal, O., Meuric, V., Fong, S. B., ... & Jolivet-Gougeon, A. 28. (2017). Roseburia spp.: a marker of health?. Future microbiology, 12(2), 157-170.
Everard, A., Belzer, C., Geurts, L., Ouwerkerk, J. P., Druart, C., Bindels, L. B., ... & De Vos, W. M. (2013). 29. Cross-talk between Akkermansia muciniphila and intestinal epithelium controls diet-induced obesity. Proceedings of the National Academy of Sciences, 110(22), 9066-9071.
Miquel, S., Martin, R., Rossi, O., Bermudez-Humaran, L. G., Chatel, J. M., Sokol, H., ... & Langella, P. (2013). 30. Faecalibacterium prausnitzii and human intestinal health. Current opinion in microbiology, 16(3), 255-261.
Fujimoto, T., Imaeda, H., Takahashi, K., Kasumi, E., Bamba, S., Fujiyama, Y., & Andoh, A. (2013). Decreased 31. abundance of Faecalibacterium prausnitzii in the gut microbiota of Crohn's disease. Journal of gastroenterology and hepatology, 28(4), 613-619.
Tremaroli, V., & Bäckhed, F. (2012). Functional interactions between the gut microbiota and host metabolism. 32. Nature, 489(7415), 242.
40

Macfarlane, G. T., & Macfarlane, S. (2012). Bacteria, colonic fermentation, and gastrointestinal health. Journal 33. of AOAC International, 95(1), 50-60.
Russell, W. R., Hoyles, L., Flint, H. J., & Dumas, M. E. (2013). Colonic bacterial metabolites and human health. 34. Current opinion in microbiology, 16(3), 246-254.
Rowland, I., Gibson, G., Heinken, A., Scott, K., Swann, J., Thiele, I., & Tuohy, K. (2017). Gut microbiota 35. functions: metabolism of nutrients and other food components. European journal of nutrition, 1-24.
Magnúsdóttir, S., Ravcheev, D., de Crécy-Lagard, V., & Thiele, I. (2015). Systematic genome assessment of B-36. vitamin biosynthesis suggests co-operation among gut microbes. Frontiers in genetics, 6, 148.
41