Embed Size (px)
Citation preview

UNIVERSIDADE DE LISBOA
FACULDADE DE CIÊNCIAS
DEPARTAMENTO DE FÍSICA
Generation and Characterization of a Cerl2-KO Embryonic Stem Cell
Line
Ana Mafalda Alves Costa e Silva
Mestrado Integrado em Engenharia Biomédica e Biofísica
Perfil Engenharia Clínica e Instrumentação Médica
Dissertação Orientada por:
Prof. Dr. José António H. Belo, Stem Cells and Development, Chronic Diseases Research Center
(CEDOC), Faculdade de Ciências Médicas da Universidade Nova de Lisboa
Prof. Dr. Hugo Alexandre Ferreira, Instituto de Biofísica e Engenharia Biomédica, Departamento
de Física da Faculdade de Ciências, Universidade de Lisboa
2017

II

III
“Imagination is more important than knowledge.
Knowledge is limited. Imagination encircles the world.”
Albert Einstein

IV

V
Acknowledgements
Firstly, I would like to thank Professor José Belo for accepting me in his team and for the opportunity
to develop this fantastic and ambitious project. Also, for all the support, guidance and important
discussions during the last year. I would like to thank Professor Hugo Ferreira for the relevant comments
to the written work.
A very special thanks for José Inácio for all the patience and willingness to teach me the experimental
techniques and for the motivation given in the first months that demonstrated to be frustrating until the
first positive results appeared. Still, for all the revisions and comments given during the writing of this
Dissertation.
To the other members of the team: Fernando Cristo, Oriol Bover, Graça Rosas, Sara Marques and
Fernando Bonet thanks for having received me so well and for all the help given every time that I needed.
I am especially and eternally grateful to my Parents for all the support during the last few years and,
mainly, for never ceasing to believe that I would achieve my dreams even the craziest. With them I
learned that dreaming has no limits or barriers but only with work, dedication and love, dreams become
memorable experiences.

VI
Resumo
Até aos dias de hoje, a Embriogénese é considerada um dos mecanismos mais fascinantes e complexos
de decifrar. Os processos que medeiam a origem, desenvolvimento e especialização de um oócito até
este formar um organismo completo são exaustivamente estudados de forma a entender a origem das
doenças congénitas.
Nos vertebrados, o coração é o primeiro órgão a ser formado tendo a funcionalidade de bombear o
sangue e, desta forma, suprimir as constantes necessidades nutritivas do embrião. Por detrás da sua
formação, várias vias de sinalização moleculares necessitam de estar intimamente relacionadas entre si.
A mais pequena alteração numa delas leva ao surgimento de doenças cardíacas congénitas, afetando
desde à nascença a qualidade de vida do Ser vivo. Deste modo, é crucial que sejam decifrados os
mecanismos e moléculas por detrás da origem destas doenças, culminando na descoberta de terapias
específicas bem como na sua prevenção.
Durante o desenvolvimento embrionário, são vários os mecanismos que determinam o correto
posicionamento do coração através da origem sequenciada dos três eixos principais: o Anterior-Posterior
(A-P), o Dorso-Ventral (D-V) e o Esquerdo-Direito (E-D). Este último, está implicado na definição do
posicionamento do coração na caixa torácica, na sua rotação final bem como na correta morfologia dos
ventrículos e aurículas. Uma das principais vias de sinalização que inicialmente medeia a diferenciação
da mesoderme e o estabelecimento do eixo E-D é a via Nodal, integrante da família TGF-β composta
por vários outros membros também fatores de crescimento. No ratinho, nas etapas iniciais, as proteínas
Nodal deslocam-se assimetricamente para o lado esquerdo do nó, uma estrutura embrionária transiente,
e aí interagem com várias proteínas antagonistas capazes de direcionar o seu fluxo para a Placa Lateral
Esquerda da Mesoderme. Quando se verifica uma mutação em algum dos genes codificadores destas
proteínas antagonistas do Nodal, a indução da sua cascata de sinalização é rapidamente afetada
resultando em defeitos de lateralidade dos órgãos, nomeadamente do coração e das suas artérias.
Nas últimas décadas, vários modelos animais e celulares têm sido usados para mimetizar o fenótipo e
genótipo característico de algumas patologias cardíacas humanas resultantes de anomalias de
lateralidade. Nomeadamente, ratinhos knockout para o gene Cerberus-like 2 (Cerl2) foram
anteriormente desenvolvidos de forma a estudar as implicações por detrás da perda de função deste gene.
Este mesmo gene é expresso assimetricamente no lado direito do nó, codificando a proteína Cerl2
identificada como uma relevante antagonista da via de sinalização Nodal. Aquando a ausência da sua
atividade antagonista, verifica-se uma anormal ativação da sinalização Nodal também na Placa Lateral
Direita da Mesoderme. Tendo em conta as suas funções moleculares, seria de esperar que os ratinhos
mutantes apresentassem fenótipos de lateralidade anormal. Deste modo, foram descritos defeitos na
orientação do eixo cardíaco (looping randomizado), falhas na formação do septo ventricular e auricular,
transposição das grandes artérias, hipertrofia ventricular, entre outros. Ainda, verificou-se uma taxa de
morte neonatal considerável, no primeiro dia após o nascimento, tendo sido estabelecida uma relação
direta entre a perda de função deste gene e o fenótipo mortal nestes ratinhos. No entanto, entre a
população de ratinhos knockout foram identificadas ligeiras diferenças nos fenótipos apresentados,
sendo alguns livres de malformações no estabelecimento do eixo E-D.
Posteriormente, estudos de eletrocardiografia realizados a embriões e ratinhos neonatais Cerl2-/-
permitiram estudar a eletrofisiologia e morfologia dos seus corações. De forma a ser independentemente

VII
estudado o mecanismo de ação molecular do Cerl2, foram considerados apenas ratinhos sem fenótipo
anormal de lateralidade. Os resultados revelaram um aumento do índice de massa ventricular esquerda,
uma redução do pico de velocidade da artéria pulmonar e uma diminuição do ritmo cardíaco,
comparativamente com a população wild-type. Com o intuito de desvendar o papel deste gene, foram
realizadas análises histológicas a amostras de corações em diversas fases de desenvolvimento
embrionário e fetal. O estudo revelou um aumento significativo da espessura do miocárdio constituinte
do ventrículo esquerdo demonstrando ainda que este fenómeno se deve a hiperplasia dos cardiomiócitos,
com um aumento associado do número de eventos mitóticos. Verificou-se, ainda, um aumento dos níveis
de fosforilação Smad2 sugerindo que a via de sinalização Nodal/Activin/Smad2 poderá estar super
estimulada na ausência de proteínas Cerl2. Salientando, esta via de sinalização foi identificada como
uma das principais reguladoras do processo de cardiogénese.
No presente projeto, com o objetivo de analisar o papel do Cerl2 no processo de cardiomiogénese,
células estaminais embrionárias foram derivadas de blastocistos dos ratinhos knockout. Foram usados
os protocolos chave para a confirmação da estabilidade e propriedades de pluripotência das células
geradas, podendo posteriormente ser usadas como um modelo de doença fiável. Análises ao cariótipo
demonstraram que as linhas celulares derivadas apresentam estabilidade cromossómica, tanto a nível
numérico como estrutural. Ao recorrer à técnica de imunofluorescência as células Estaminais
Embrionárias revelaram marcação positiva para os marcadores NANOG, OCT4 e SSEA1 indicando a
existência de expressão proteica dos mesmos. Corroborando estes resultados, níveis de expressão génica
positivos foram identificados através da técnica de PCR quantitativo em tempo real (RT-PCR). Assim,
foram amplificadas de forma significativa, amostras da sequência genética de Nanog, Oct4 e Sox2,
revelando uma vez mais a existência de propriedades de pluripotência. De forma a demonstrar a
capacidade de diferenciação em todas as linhagens celulares que compõem um organismo, procedeu-se
à diferenciação espontânea das células Estaminais Embrionárias Cerl2-/- através do método de cultura
de Corpos Embrióides (EBs). Recorrendo uma vez mais a testes de imunofluorescência, verificou-se a
capacidade de diferenciação nas três camadas germinativas – endoderme, mesoderme e ectoderme –
através da presença de marcadores proteicos específicos para cada uma delas.
Usando o protocolo de diferenciação cardíaca por EBs, testou-se a hipótese de nas células estaminais
Cerl2-/- a capacidade de diferenciação na mesoderme estar aumentada, comparativamente com células
estaminais controlo (linha comercial E14). Observou-se um aumento substancial da capacidade de
adesão, às placas de cultura, dos EBs derivados da linha mutante. Constatou-se, o surgimento de regiões
com atividade cardíaca nos EBs knockout a partir do dia 6 de diferenciação, enquanto nos EBs derivados
da linha wild-type estas regiões com contratilidade cardíaca apenas eram visíveis a partir dos dias 7 ou
8 de diferenciação. Durante este processo, foram contabilizadas as áreas de contratilidade verificando-
se que, em média, no dia 10 do protocolo de diferenciação, cada EB knockout continha o dobro do
número de áreas comparativamente com um EB da linha controlo. Estudando as variações temporais da
expressão de genes característicos das várias etapas de diferenciação desde a mesoderme até à formação
de cardiomiócitos maduros, através de RT-PCR, verificou-se um aumento da expressão de Mesp-1, Isl1
e Nkx2.5 indicando um incremento no número de células progenitoras cardíacas geradas. Analisando os
níveis de expressão de genes implicados na maturação dos cardiomiócitos, verificou-se um aumento da
regulação de α-MHC e uma diminuição na regulação de cTnT nas células diferenciadas Cerl2-/-. Conclui-
se que as células KO têm uma maior capacidade de diferenciação mesodérmica, levando à produção de
um maior número de progenitores cardíacos e, consequentemente, a um aumento no número de
cardiomiócitos gerados. No entanto, estes aparentam ter uma maturação incompleta.
Em conclusão, os resultados desenvolvidos neste projeto possibilitaram o estabelecimento e
caracterização de linhas estaminais Cerl2-/- de ratinho servindo estas como um modelo para estudar as
patologias congénitas relacionadas com este gene. Foram reveladas as primeiras descobertas sobre as

VIII
alterações nos mecanismos de cardiomiogénese resultantes da perda de função do gene Cerl2.
Futuramente, poderão ser usadas como ferramenta para a descoberta de novos mecanismos biológicos
das proteínas Cerl2 ou mesmo até para o desenvolvimento de terapias celulares.
Palavras-Chave: Cerl2, eixo Esquerdo-Direito, células Estaminais Embrionárias, diferenciação em
cardiomiócitos.

IX
Abstract
Embryogenesis is a well-organized process capable of originating the complex mammalian organisms.
Even a slight change in the signaling pathways is capable of significantly altering the biological
mechanisms leading to a mutant phenotype. The heart is the first organ to be formed during this process,
according to its vital functions since the first days of an embryo’s life throughout the entire life of the
mammalian organism. Sporadically, cardiogenesis does not occur with the normal coordination and
some signaling pathways are altered resulting in congenital heart diseases. Thus, it is crucial to uncover
the molecular and morphogenetic mechanisms that lead to these pathologies in order to discover new
therapies’ insights and provide genetic prevention.
A Cerberus/Dan family member, the mouse Cerberus-like 2 (Cerl2) gene, has been studied and
identified as a Nodal antagonist, capable of interfering in the most relevant steps during Left-Right (L-
R) axis establishment that lead to the asymmetric patterning of the heart. Its function consists to spatially
regulate Nodal proteins to the Left Lateral Plate Mesoderm, at the embryonic stage of development. In
Cerl2 knockout mice, it was reported a wide range of laterality defects with associated cardiac failure
and significant death rate on the first day after birth. Previously, a massive increase of the ventricle walls
was observed as a consequence of cardiomyocytes’ hyperplasia, verified by an increase in their mitotic
index.
In order to uncover the possible roles of Cerl2 in the regulation of the signaling pathways underlying
cardiomyocyte proliferation and differentiation, three Cerl2-/- Embryonic Stem cell (ES cell) lines were
derived from blastocysts of the mutant mice. Using this disease model, it was possible to begin the study
of the implications of Cerl2 in the spatiotemporal control of cardiac progenitors’ proliferation and its
differentiation into mature cardiomyocytes. Firstly, the normal chromosomic number and structural
stability of the derived lines was confirmed by G-banding staining. Then, pluripotency properties were
verified using standard protocols, such as immunofluorescence microscopy that demonstrate positive
protein expression for NANOG, OCT4 and SSEA1 markers. Also, through real-time amplification of
endogenous RNA expression for Nanog, Oct4 and Sox2 genes it was confirmed the presence of
pluripotency properties. In order to prove the differentiation capacity in the three germ layers, the ES
cells were spontaneously differentiated and positive protein expression for endoderm, mesoderm and
ectoderm was confirmed through immunostaining.
Using the Embryoid Bodies culture, the Cerl2-/- ES cells were differentiated into cardiac cells. It was
notorious a significant change in the number of produced beating foci areas compared to the control
line: the knockout cells originated the double of the cardiac foci compared to the wild type cells, even
at day 10 of the differentiation protocol. Using the real-time PCR technique, the levels of early cardiac
genes expression were studied, showing a statistical upregulation of Mesp-1, Nkx2.5 and Isl1 genes in
the differentiated Cerl2-/- cells. Also, the expression of mature cardiac markers was evaluated resulting
in increased levels of α-MHC and reduced levels of cTnT in these cells. Concluding, loss-of-function of
Cerl2 leads to a possible increase in the cardiac progenitor cells resulting in a higher number of derived
cardiomyocytes. However, despite of showing early beating actions they did not reveal a complete
maturation.

X
Ultimately, the present project uncovers the first insights in the Cerl2 role during mouse
cardiomyogenesis, mainly in the specification of the number of cardiomyocytes that will populate the
mature myocardium.
Keywords: Cerl2, Left-Right axis, Embryonic Stem cells, cardiomyocytes’ differentiation.

XI
Contents
Acknowledgements ................................................................................................................................ V
Resumo .................................................................................................................................................. VI
Abstract ................................................................................................................................................. IX
List of Tables ...................................................................................................................................... XIII
List of Figures .................................................................................................................................... XIV
Abbreviations .................................................................................................................................... XVII
Chemical Symbols .............................................................................................................................. XIX
Units ..................................................................................................................................................... XX
Introduction ..................................................................................................................................... 1
1.1 Aims of the Project .................................................................................................................. 2
1.2 Organization of the Thesis ...................................................................................................... 3
Background ..................................................................................................................................... 4
2.1 Early Mouse Development ...................................................................................................... 4
2.2 The Establishment of the Three Embryonic Body Axes ......................................................... 5
2.2.1 The Anterior-Posterior and the Dorso-Ventral Axes ....................................................... 5
2.2.2 The Left-Right Axis ........................................................................................................ 5
2.3 The Cerberus Family ............................................................................................................... 7
2.3.1 Cerberus-like 2 ................................................................................................................ 7
2.4 Mouse Heart Development ...................................................................................................... 8
2.4.1 Failure in L/R Axis Leads to Laterality Defects.............................................................. 9
2.5 Mouse Embryonic Stem Cells ............................................................................................... 10
2.5.1 In Vitro Culture Conditions ........................................................................................... 10
2.5.2 From Pluripotency to Cardiac Differentiation ............................................................... 11
2.6 From Cerberus-like 2 Gene to a Disease Model ................................................................... 14
Materials and Methods .................................................................................................................. 16
3.1 Mice ....................................................................................................................................... 16
3.2 Derivation and culture of Mouse Embryonic Fibroblasts (MEFs) ........................................ 16
3.2.1 Mitotic Inactivation of MEFs ........................................................................................ 17
3.3 Derivation and Primary Culture of Mouse Cerl2-/- ES Cell Lines ......................................... 17
3.4 Subsequent Passaging and Culture of Mouse Cerl2-/- ES Cells ............................................. 18
3.5 Polymerase Chain Reaction (PCR) ....................................................................................... 18

XII
3.5.1 Mutant Genotyping ........................................................................................................ 19
3.5.2 Gender Determination ................................................................................................... 19
3.6 Karyotyping ........................................................................................................................... 20
3.7 Immunostaining for Markers of Pluripotency ....................................................................... 20
3.8 Embryoid Bodies Formation ................................................................................................. 21
3.9 Immunostaining for Markers of Germ Layers’ Differentiation ............................................. 21
3.10 Cardiac Differentiation of ES cells........................................................................................ 22
3.11 RNA Extraction and cDNA Synthesis .................................................................................. 22
3.12 qRT-PCR ............................................................................................................................... 23
3.13 Statistical Analysis ................................................................................................................ 24
Results and Discussion .................................................................................................................. 25
4.1 Generation of Mouse Cerl2-/- ES Cell Lines .......................................................................... 25
4.2 Characterization of the Derived Mouse Cerl2-/- ES Cell Lines ............................................. 27
4.2.1 Karyotype ...................................................................................................................... 29
4.2.2 Pluripotency Properties ................................................................................................. 30
4.2.3 Spontaneous Differentiation Capacity into the Three Germ Layers ............................. 32
4.3 Differentiation into Cardiomyocytes ..................................................................................... 34
Conclusions and Future Perspectives ............................................................................................ 42
References ............................................................................................................................................. 44
Appendix ............................................................................................................................................... 54

XIII
List of Tables
Table 3.1: Primers nucleotide sequences for PCR to determine the cells’ genotyping. ................ 19
Table 3.2: Primers nucleotide sequences for PCR to determine the cells’ gender. ....................... 19
Table 3.3: Primary and secondary antibodies used for staining markers of pluripotency. ......... 21
Table 3.4: Primary and secondary antibodies used for staining markers of germ layers’
differentiation. ..................................................................................................................................... 22
Table 3.5: qRT-PCR primers used. ................................................................................................... 23

XIV
List of Figures
Figure 2.1: Overview of the early mouse development. The zygote consists in a totipotent cell capable
of subsequently dividing in smaller cells called blastomeres, until the morula stage its reached. At E3.5,
the blastocyst is composed by two different cell lineages: the inner cell mass (ICM) and the
trophectoderm (TE). Ultimately, the ICM is responsible for the embryo formation (figure taken from
http://www.devbio.biology.gatech.edu/?page_id=8796, consulted on 8th October 2016). .................... 4
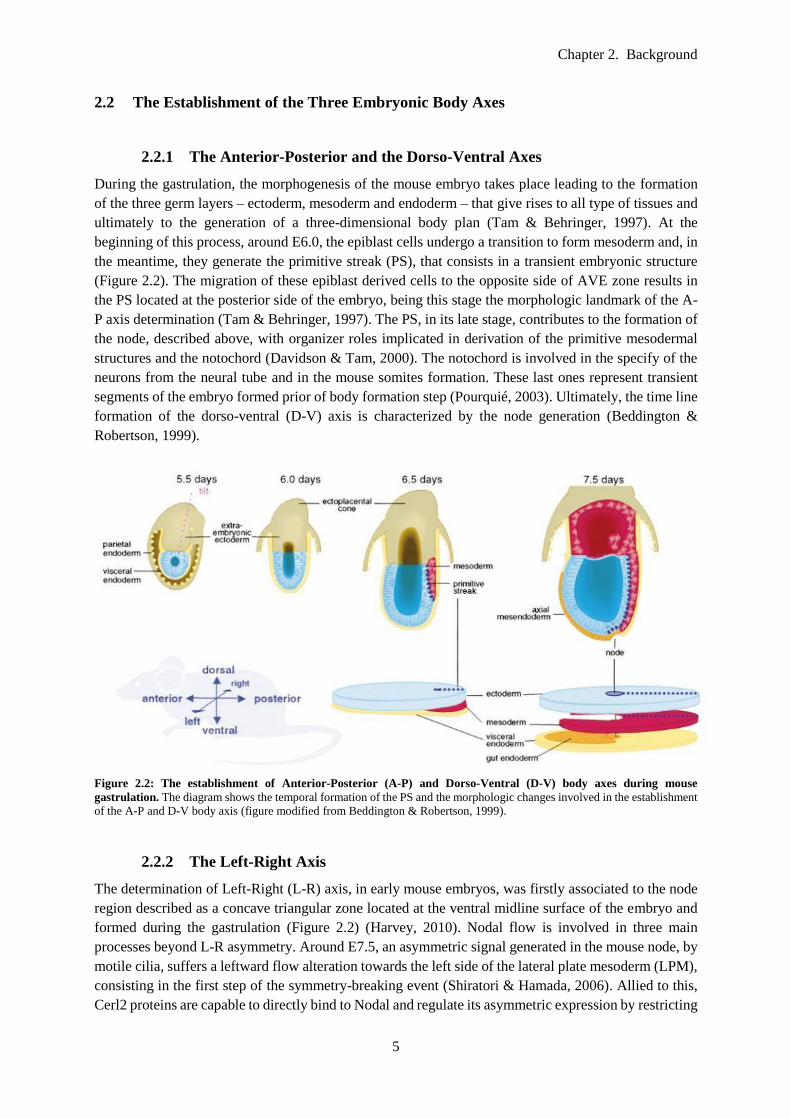
Figure 2.2: The establishment of Anterior-Posterior (A-P) and Dorso-Ventral (D-V) body axes
during mouse gastrulation. The diagram shows the temporal formation of the PS and the morphologic
changes involved in the establishment of the A-P and D-V body axis (figure modified from Beddington
& Robertson, 1999). ................................................................................................................................ 5
Figure 2.3: Nodal Signaling. Cerl2 and Lefty1/2 proteins interact with Nodal to regulate its levels and
prevent its signaling migration to the incorrect side of the LPM (figure modified from Kalyan et al.,
2017)........................................................................................................................................................ 7
Figure 2.4: First (FHF) and second (SHF) heart fields formation and subsequent derivative tissues
in mature heart and head in mouse. The FHF (red) and the SHF (green) are shown at different
development stages during heart formation. The FHF progenitors will give rise to left ventricle (LV)
and atria while SHF progenitors are involved in derivation of the outflow tract (OFT), right ventricle
(RV) and atria. Also, some SHF progenitors are involved in formation of facial muscles of the head
(figure modified from Meilhac et al., 2014). ........................................................................................... 9
Figure 2.5: Morphological spectrum of laterality defects. The situs solitus consist in normal L-R
body asymmetry. On the other hand, patients showing situs inversus totalis display a complete reversion
of organs’ symmetry. The isomerisms are a heterotaxia type, classified as left isomerism or right
isomerism (figure modified from Fliegauf et al., 2007). ....................................................................... 10
Figure 2.6: Schematic representation of the cardiomyocytes’ differentiation using the hanging
drop technique. The undifferentiated cells are maintained in culture for several passages with ES cell
medium supplemented with LIF. Then, the desired cell suspensions are prepared in single drops,
separated between each other’s, and the plate lid is inverted. By gravity stimulus, ES cells start to
aggregate in Embryoid Bodies (EBs), during 2 days, and then they continue to grow in suspension
culture. At day 5, EBs are plated in gelatin-coated 6-well plates leading to cardiomyocytes
differentiation and maturation until day 10 (figure modified from Bai et al., 2015). ........................... 13
Figure 3.1: Overview of mouse blastocysts collection from female uterus. Embryos were flushed
from the female uteri at E3.5 using M2 medium and washed in a series of M2 drops in order to remove
maternal tissue debris (figure modified from Czechanski et al., 2014). ................................................ 18
XV
Figure 4.1: First steps of ES cells derivation from Cerl2 KO mouse blastocysts. (A) Morphology of
mouse blastocyst at stage E3.5, with well-defined ICM and blastocyst cavity; (B) Morphology of
blastocyst hatched on MEF feeder at day 3 after collection; (C) At day 7, outgrowths were completely
formed. Scale bars: 100 μm. .................................................................................................................. 26
Figure 4.2: Morphology of Cerl2-/- ES cell colonies cocultured with MEFs at Passage 1 and Passage
2 from the derived lines. (A) ES cells from Embryo 1 at P1; (B) ES cells from Embryo 1 at P2; (C) ES
cells from Embryo 5 at P1; (D) ES cells from Embryo 5 at P2; (E) ES cells from Embryo 6 at P1; (F)
ES cells from Embryo 6 at P2. In the present images, the colonies show an oval morphology with lightly
boundaries characteristic of ES cells. Spontaneous differentiation is not significantly notorious. Scale
bars: 100 μm. ......................................................................................................................................... 27
Figure 4.3: Mutant genotyping of the derived Cerl2-/- ES cells confirmed by PCR. Product bands
with 500 bp size were detected in the three lines of Cerl2-/- ES cells derived and, also, in the adult KO
mouse used as positive control. In opposition, the PCR product for the sample of the WT mouse resulted
in a 300 bp band. ................................................................................................................................... 28
Figure 4.4: Sry gene expression revealed by PCR. A product band with 247 bp size was detected in
male Cerl2-/- ES cells derived from Embryos 1 and 5 and, also, in both male mouse controls. So, it is
shown that the absence of a band in DNA sample from Embryo 6 revealed a female gender in
concordance with the two negative controls (from adult female mice). ............................................... 29
Figure 4.5: Karyograms of the derived Cerl2-/- ES cell lines, obtained by G-banding staining at
Passage 7: (A) from Embryo 1; (B) from Embryo 5; and (C) from Embryo 6. ................................... 30
Figure 4.6: Expression of NANOG, OCT4 and SSEA-1 in Cerl2-/- ES cells. Immunofluorescence
analysis show positive protein expression for the referred regulator markers of pluripotency in mouse
Cerl2-/- ES cells derived from: (A) Embryo 1; (B) Embryo 5; (C) Embryo 6. Scale bars: 20 µm. ....... 31
Figure 4.7: Relative expression of Nanog, Oct4 and Sox2 of the derived mouse Cerl2-/- ES cells by
qRT-PCR. Samples were collected from Cerl2-/- ES cells of the three lines at P6 and the qRT-PCR
experiments were performed in triplicate for each one. The expression level of each pluripotency gene
is represented relative to the referred E14 ES cell line, used as a positive control. The one-way ANOVA
test was used to compare the means of the various cell lines and statistical significant differences where
considered when ****P<0.0001. ........................................................................................................... 32
Figure 4.8: Embryoid Bodies, formed from the derived Cerl2-/- ES cell lines, differentiate
spontaneously into the three germ layers. The ES cells were cultured in suspension and, at day 2 of
differentiation, well-developed EBs were formed from: (A) Embryo 1; (C) Embryo 5; and (E) Embryo
6. Scale bars: 100 μm. Then, at day 10 of differentiation, immunofluorescence was performed to the
EBs and the presence of AFP (endoderm), α-Actinin sarcomeric (mesoderm) and Vimentin (ectoderm)
markers was positively detected from: (B) Embryo 1; (D) Embryo 5; and (F) Embryo 6. Scale bars: 20
µm. ........................................................................................................................................................ 34
Figure 4.9: Morphology of: (A) KO and (B) WT ES cell lines at day 0 of the differentiation
protocol. The ES cells at this stage were cultured without 2i supplementation, showing some events of

XVI
spontaneous differentiation represented by the black arrows. However, this was a normal consequence
of the progressively adaptation of the cells to the absence of the chemical inhibitors. Scale bars: 100 μm.
............................................................................................................................................................... 35
Figure 4.10: Morphology of the derived: (A) KO and (B) WT EBs at day 2 of the differentiation
protocol. All the EBs showed a round shape, with irregular surface protrusions. Scale bars: 100 μm. 36
Figure 4.11: Morphology of: (A) three KO EBs and (B) one WT EB at day 10 of the differentiation
protocol. It is notorious a significant difference in the adhesion capacity between the mutant and the
control lines. Scale bars: 100 μm. ......................................................................................................... 36
Figure 4.12: Measurement of beating foci per KO and WT EBs. Results are expressed as the total
number of beating foci with respect to the total number of plated EBs and represent the mean ± SD of
three independent experiments. Unpaired Student’s t-test was applied to compare the differences
between WT and KO groups in each day of differentiation. Statistical significant results were considered
when ***P<0.001 and ****P<0.0001. .................................................................................................. 37
Figure 4.13: Relative mRNA expression of cardiac genes in Cerl2-/- and WT differentiated cells.
qRT-PCR experiments were performed in triplicate for (A) Cerl2, (B) Mesp-1, (C) Nkx2.5, (D) Isl1, (E)
α-MHC, (F) cTnT, (G) Ccnd1. Results are represented as mean ± SD of three independent biological
experiments. Unpaired Student’s t-test was applied to compare the differences between WT and KO
groups in each day of differentiation. Statistical significant results were considered when *P<0.05 and
****P<0.0001. ...................................................................................................................................... 40
Figure A1: Control staining of the secondary antibodies used during the immunofluorescence
microscopy for pluripotency markers. Images were taken in a sequence mode and the same confocal
microscope settings were used for the corresponding first and second antibodies pair. Scale bars: 20 µm.
............................................................................................................................................................... 54
Figure A1: Control staining of the secondary antibodies used during the immunofluorescence
microscopy for germ layer markers. Images were taken in a sequence mode and the same confocal
microscope settings were used for the corresponding first and second antibodies pair. Scale bars: 20 µm.
............................................................................................................................................................... 54

XVII
Abbreviations
Afp Alpha Fetoprotein
α-MHC Alpha Myosin Heavy Chain
A-P Anterior-Posterior
AVE Anterior Visceral Endoderm
BMP Bone Morphogenetic Protein
cDNA Complementary Deoxyribonucleic Acid
Cerl2 Cerberus-like 2
CMC Cardiogenic Mesodermal Cells
cTnT Cardiac Troponin T
DMEM Dulbecco’s Modified Eagle Medium
DMSO Dimethyl Sulfoxide
DNA Deoxyribonucleic Acid
dNTP Deoxynucleotide
D-V Dorso-Ventral
DVE Distal Visceral Endoderm
E Embryonic Day
EB Embryoid Body
EGF-CFC Epidermal Growth Factor-cripto, frl-1, cryptic
ES Embryonic Stem
FBS Fetal Bovine Serum
FGF Fibroblast Growth Factor
FHF First Heart Field
Fwd Forward
Gapdh Glyceraldehyde-3-Phosphate Dehydrogenase
Gdf1 Growth/ Differentiation Factor 1
GSK3 Glycogen Synthase Kinase 3
ICM Inner Cell Mass
IgG Immunoglobulin G
Isl1 Isl1 Transcription Factor, LIM Homeobox 1
KO Knockout
XVIII
LIF Leukemia Inhibitor Factor
LPM Lateral Plate Mesoderm
L-R Left-Right
MEF Mouse Embryonic Fibroblast
Mesp-1 Mesoderm Posterior 1
NEAA Non-Essential Amino Acids
Nkx2.5 NK2 Homeobox 5
NOD Non-Obese Diabetic
Oct4 Octamer 4
OFT Outflow Tract
PBS Phosphate-Buffered Saline
PCR Polymerase Chain Reaction
PFA Paraformaldehyde
Pitx2 Paired-like Homeodomain Transcription Factor 2
PrE Primitive Endoderm
PS Primitive Streak
qRT-PCR Quantitative Real-Time Polymerase Chain Reaction
RNA Ribonucleic Acid
Rv Reverse
SHF Second Heart Field
Sox2 SRY-Related High Mobility Group Box 2
Sry Sex-determining Region Y
SSEA-1 Stage-Specific Embryonic Antigen-1
Stat3 Signal Transducer and Activator of Transcription 3
TAE Tris-Acetate-EDTA
TE Trophectoderm
TGF-β Transforming Growth Factor β
UV Ultraviolet
Wnt Wingless/ Integrated Family Members
WT Wild Type

XIX
Chemical Symbols
CaCl2.2H2O Calcium Chloride Dihydrate
CO2 Carbon Dioxide
MgCl2.6H2O Magnesium Chloride Hexahydrate
NaCl Sodium Chloride
KCl Potassium Chloride

XX
Units
% Percentage
μg Microgram
μg/mL Microgram per Milliliter
μL Microliter
μM Micromolar
bp Base Pair
ºC Degree Celsius
kb Kilobase Pair
mL Milliliter
mM Milimolar
ng Nanogram
pH Potential of Hydrogen
rpm Rotations per Minute
U/μL Units/Microliter
V Volt
v/v % Volume/ Volume Percentage
xg Times Gravity
w/v % Weight/ Volume Percentage

Chapter 1. Introduction
1
Introduction
In the last decades, cardiovascular diseases have become the first cause of morbidity and mortality, in
developed countries, adversely affecting the patients’ quality of life (Naghavi et al., 2015). Just in
Europe, more than 4 million of people die every year mainly due to ischaemic heart disease and
congestive heart failure (Townsend et al., 2016). Unfortunately, still nowadays, scientific data indicate
that regeneration capacity in human heart is limited, and the only body response for these conditions
consist in an inflammatory process, originating a non-contractile scar (Coulombe et al., 2014) (Czubryt,
2012). Consequently, myocardium tissue is permanently damaged caused by a dysfunctional remodel
tissue leading to the loss of cardiomyocytes’ number and decrease of their function with associated
electrophysiological instability (Braunwald & Pfeffer, 1991).
According to the available therapies, the pharmacologic solutions and mechanical support advices, could
not allow the functional regeneration of cardiomyocytes and they did not offer a positive long-term
solution in the majority of the patients. So, heart transplantation is still the only definitive treatment for
heart failure despite of its associated complications.
In the last two decades, a lot of effort has been done to develop an efficient protocol to derive
cardiomyocytes from pluripotent and multipotent stem cells with the purpose to recover the function of
patients’ cardiomyocytes (Le et al., 2017). The possibility that these two cell lineages could induce
differentiation and repopulation of new cardiac precursor cells or cardiomyocytes in the damaged
myocardium allowed to start testing these protocols in human patients. The adult bone marrow-derived
cells have been used in the majority of the cell-therapy trials because of the high number of obtained
cells as well as the safety and feasibility of its use (Cambria et al., 2016). Attending to meta-analysis
studies, considering more than 2600 patients, this cell-based therapy improves around 3.96% of the left
ventricular ejection fraction with a reduction in the size of infarct scar, as well as exercise capacity
improvement (Jeevanantham et al., 2012) (Fisher et al., 2015). Another promising therapy approach
uses the potential of the cardiac progenitor cells’ population, present in postnatal mouse and human
hearts, to promote cardiomyocytes differentiation. By the emerging of controversial evidences showing
that the human heart repairs about 1% per year, this type of cells have been used in the attempt to
stimulate this low natural renewal rate (Bergmann et al., 2009) (Bergmann et al., 2015). However, this
regeneration potential declines with age and it is not sufficient to promote myocardium replacement
after an injury, so the next milestone consisted in the first clinical attempt to infuse the c-kit+ population
of cardiac stem cells in patients suffering with ischemic cardiomyopathy (Bergmann et al., 2009) (Bolli
et al., 2011). This phase I trial, denominated SCIPIO – Cardiac Stem Cell Infusion in Patients with
Ischemic Cardiomyopathy – , showed significant improvements in the left ventricular ejection fraction
and reduction in size of the infarct scar tissue after several months from the infusion of autologous cells
expanded in vitro (Bolli et al., 2011) (Chugh et al., 2012). Other phase I trials appeared in the same year
(e.g., CADUCEUS and ALCADIA), demonstrating relevant clues about the safety and feasibility of the
use of injection of autologous cardiac stem cells (Yacoub & Terrovitis, 2013). Despite of the promising
results, these cardiac repair therapies have been under an exhaustive scrutiny related to their efficacy in
the promise of long-awaited myocardium regeneration. Still, there is a long journey until their outcomes
could strongly influence the use of stem cells in the currently medical practice for myocardium renewal.

Chapter 1. Introduction
2
Until then, clinical trials with larger number of patients and a longer time follow up of the treatment
need to be carry out.
In meantime, Embryonic Stem cells have been widely used as an in vitro model to uncover mechanisms
and signaling pathways involved during mouse and human early cardiomyogenesis (Habib et al., 2008)
(Dambrot et al., 2011). They have been demonstrated to be a useful model because of the excellent
abilities to mimic the most relevant mechanisms that occur in vivo during embryogenesis. Thus, the
Cerberus-like 2 (Cerl2) gene has been studied because of its implication on critical mechanisms during
mouse embryonic heart development. Its role is crucial for an appropriate asymmetric positioning of the
organs and a correct development of them, especially the heart (Marques et al., 2004). In humans, the
homologous gene is denominated DAND5. It is medical documented that a loss of asymmetry is
implicated in several human diseases, such as heterotaxia syndrome and congenital heart disease
(Ramsdell, 2005). So, a recent study started to link these diseases with the DAND5 abnormal expression
in patients culminating in new molecular insights and classifying this gene as a determinant candidate
for the referred congenital heart defects (Cristo et al., 2017).
Recent data show that a loss of function of Cerl2, in knockout mice, leads to massive increase of
ventricular walls being a consequence of an increase in mitotic index of the cardiomyocytes (Araújo et
al., 2014). Also, this increasing proliferation in these mutant mice was associated with extension of
TGF-β/Nodal/Wnt signaling in heart, being these signaling pathways well known to be involved in
cardiac differentiation and proliferation (Araújo et al., 2014) (Parikh et al., 2015). In this way, it is
reasonable to hypothesize that Cerl2 proteins control both signaling pathways in the mouse heart by
being a master regulator of them during embryogenesis. This leads to the possibility of secreted Cerl2
proteins are involved in the mechanism responsible for the cardiomyocytes proliferation and, probably,
be involved in the decision mechanism of the number of originated cells.
1.1 Aims of the Project
To improve the cell-based therapies for myocardium repair in currently clinical progress, it is firstly
necessary to clearly understand the molecular mechanisms and signaling pathways involved behind
cardiomyogenesis. Also, several disease models are created in the laboratory environment as a tool to
study the molecular and genetic mechanisms that lead to pathogenesis of cardiac human diseases with
the ultimate propose to find new therapeutics. Along the years, the mouse has been used as a preferred
animal model to mimic cardiac human diseases taking the advantage of the physiologic and genetic
similarities between these two species. So, knockout mutant mice are routinely produced in order to
investigators obtain a model for study the loss-of-function genes.
According to these information, Cerl2 knockout mice had already been produced and their abnormal
phenotype was quite studied by echocardiography and morphogenetic experiments. The obtained results
led to the emergence of several important questions. Does Cerl2 proteins control TGF-β and Wnt
pathways during heart development? If Cerl2 is responsible for the dual regulation of these signaling
pathways, could be possible to improve cardiomyocyte proliferation? Also, does the loss-of-function of
Cerl2 gene change the number of differentiated cardiomyocytes?
To answer these questions, the first objective of the present Dissertation consists in deriving a Cerl2
knockout mouse Embryonic Stem cell line. Using this in vitro model of congenital heart disease, it will
be possible to examine the mechanism underlying of Cerl2 role and discover how it could modulates
the signaling cascades involved in the inducing of cardiomyocyte proliferation. Then, using the derived
line, the others main objectives will consist in:

Chapter 1. Introduction
3
(i) Determine if proliferation capacity is increased in the Cerl2 knockout Embryonic Stem cell-
derived cardiomyocytes comparing with a control line;
(ii) Determine how targeting Cerl2 function could be translated in production of a high number of
cardiomyocytes that could be, posteriorly, used for regenerative medicine;
(iii) Address the fundamental roles of Cerl2 during cardiomyocyte differentiation process, mainly
related to TGF-β and Wnt pathways.
1.2 Organization of the Thesis
The present dissertation is organized in five Chapters. Firstly, the present Chapter exposes the
contextualization of the cardiovascular disease problem, the offered solutions of treatment with its
inherent limitations and a brief introduction of the main process in which the Cerl2 gene is involved,
culminating in the main motivations and objectives of this Dissertation.
Chapter 2 provides essential background information related with early mouse development and the
mechanisms behind heart embryology. Some studies and results related to the most important genes
involved in cardiogenesis signaling pathways are described for a clearly understanding and correlation
of the role of Cerl2. To complement this introductory knowledge, this Chapter will also contain the
state-of-art of Embryonic Stem cells field, focusing in the main steps of generation and maintenance of
these cells from the first successfully attempt until the relevant recent achievements. At the end of this
Chapter, the significance of a Cerl2 knockout Embryonic Stem cell line will clearly be understood as a
tool for cardiac disease models in order to study its embryonic roles during cardiogenesis.
In Chapter 3 the methods and materials used during the entire project are exposed in detail. Also,
commercial references of the reagents are indicated.
In Chapter 4, the results obtained from all the experiments are presented as well as discussion allied
with some important steps performed to reach them.
Finally, the Chapter 5 is composed of the conclusions and suggestions for future work that could
complement the knowledge developed so far.

Chapter 2. Background
4
Background
2.1 Early Mouse Development
The journey of mouse embryogenesis starts with a fertilized cell, the zygote, that consist in a totipotent
cell capable to subsequently divide in smaller ones – the blastomeres. After several mitotic divisions,
through a compaction process, the morula is capable to generate the blastocyst that is composed by two
different cell lineages, the trophectoderm (TE) and the inner cell mass (ICM) (Figure 2.1) (Johnson &
Ziomek, 1981). It is known that the first contact of the embryo with the maternal uterine walls is due to
the TE, also giving rise to specific tissues in placenta, and the ICM is mainly involved in the embryo
formation, by a cell population that will form the pluripotent epiblast (Marikawa & Alarcón, 2009).
Then, at Embryonic day 3.75 (E3.75), the ICM differentiates into the epiblast and the primitive
endoderm (PrE). Studies using lineage-tracing of mouse embryos revealed that upregulation of Cdx2
gene is necessary for the proliferation of TE cells’ population while Nanog and Oct3/4 participate in the
early cell fate of ICM cells (Morris et al., 2010) (Niwa et al., 2005). Thus, the epiblast gives rise to the
entire embryo as well as some extraembryonic structures through its pluripotency properties. On the
other hand, the PrE cells are known to contribute to the distal visceral endoderm (DVE) formation,
originating later the anterior visceral endoderm (AVE) (Takaoka & Hamada, 2012). At this stage, for a
correct establishment of the primitive Anterior-Posterior (A-P) axis, it is crucial the positive expression
of the Nodal antagonists Lefty1 and Cer1 in the DVE cells (Takaoka et al., 2011).
Figure 2.1: Overview of the early mouse development. The zygote consists in a totipotent cell capable of subsequently
dividing in smaller cells called blastomeres, until the morula stage its reached. At E3.5, the blastocyst is composed by two
different cell lineages: the inner cell mass (ICM) and the trophectoderm (TE). Ultimately, the ICM is responsible for the embryo
formation (figure taken from http://www.devbio.biology.gatech.edu/?page_id=8796, consulted on 8th October 2016).
Chapter 2. Background
5
2.2 The Establishment of the Three Embryonic Body Axes
2.2.1 The Anterior-Posterior and the Dorso-Ventral Axes
During the gastrulation, the morphogenesis of the mouse embryo takes place leading to the formation
of the three germ layers – ectoderm, mesoderm and endoderm – that give rises to all type of tissues and
ultimately to the generation of a three-dimensional body plan (Tam & Behringer, 1997). At the
beginning of this process, around E6.0, the epiblast cells undergo a transition to form mesoderm and, in
the meantime, they generate the primitive streak (PS), that consists in a transient embryonic structure
(Figure 2.2). The migration of these epiblast derived cells to the opposite side of AVE zone results in
the PS located at the posterior side of the embryo, being this stage the morphologic landmark of the A-
P axis determination (Tam & Behringer, 1997). The PS, in its late stage, contributes to the formation of
the node, described above, with organizer roles implicated in derivation of the primitive mesodermal
structures and the notochord (Davidson & Tam, 2000). The notochord is involved in the specify of the
neurons from the neural tube and in the mouse somites formation. These last ones represent transient
segments of the embryo formed prior of body formation step (Pourquié, 2003). Ultimately, the time line
formation of the dorso-ventral (D-V) axis is characterized by the node generation (Beddington &
Robertson, 1999).
Figure 2.2: The establishment of Anterior-Posterior (A-P) and Dorso-Ventral (D-V) body axes during mouse
gastrulation. The diagram shows the temporal formation of the PS and the morphologic changes involved in the establishment
of the A-P and D-V body axis (figure modified from Beddington & Robertson, 1999).
2.2.2 The Left-Right Axis
The determination of Left-Right (L-R) axis, in early mouse embryos, was firstly associated to the node
region described as a concave triangular zone located at the ventral midline surface of the embryo and
formed during the gastrulation (Figure 2.2) (Harvey, 2010). Nodal flow is involved in three main
processes beyond L-R asymmetry. Around E7.5, an asymmetric signal generated in the mouse node, by
motile cilia, suffers a leftward flow alteration towards the left side of the lateral plate mesoderm (LPM),
consisting in the first step of the symmetry-breaking event (Shiratori & Hamada, 2006). Allied to this,
Cerl2 proteins are capable to directly bind to Nodal and regulate its asymmetric expression by restricting

Chapter 2. Background
6
it to the left LPM (Marques et al., 2004). When an asymmetric Nodal expression starts to occur in left
LPM’s cells, the second step of the L-R axis patterning is stablished (Shiratori & Hamada, 2006).
However, the exact mechanism beyond this molecular signaling migration still remains unclear.
The L-R asymmetric morphogenesis of visceral organs completes the third step beyond this axis
patterning. During this step, Pitx2 acts as a master regulator gene in a conserved and altered activity
patterning in some species. In order for this process to be triggered, the asymmetric expression of Pitx2
needs to be initiated in the left LPM (Shiratori & Hamada, 2006). This Nodal target gene is described
as a bicoid-type homeobox transcription factor and its known to act as a downstream of Nodal proteins
(Yoshioka et al., 1998) (Ryan et al., 1998) (Piedra et al., 1998) (Logan et al., 1998). Moreover, anomalies
in the L-R axis establishment leads, in most cases, to laterality defects known as situs inversus,
isomerism and heterotaxia, which will be discussed below. Still, combining these knowledge, some
studies of patients suffering with congenital laterality defects indicate that Nodal signaling is potentially
extended to human. Also, some of these human mutations are related to the loss-of-function of proteins
that interact with Nodal. For example, human mutations in the LEFTY genes, homologous to Lefty1 and
Lefty 2 in the mouse, were found in patients with associated L-R axis malformation, mainly left
pulmonary isomerism and cardiac malformations (Kosaki et al., 1999). Also, patients showing an
abnormal phenotype characterized by tetralogy of Fallot and transposition of the great arteries
demonstrated to have a heterozygous mutation in the GDF1 gene (Karkera et al., 2007).
2.2.2.1 The Nodal Signaling
Nodal is a member of the Transforming Growth Factor type β (TGF-β) superfamily of secreted signaling
factors, playing essential roles during embryogenesis mainly the mesoderm and endoderm induction, as
well as in specification of the primary body axes, as explained before (Kawasumi et al., 2011). Previous
study, using mouse Nodal mutants, showed the absence of PS formation in these animals leading to a
sporadic development of some posterior mesoderm and its randomly position (Conlon et al., 1994).
Several molecules, also included in the TGF-β superfamily, have been implicated in the mechanisms of
the Nodal signaling pathway that are mainly involved in the process of a successful L/R axis
establishment. Two of them are the Lefty genes that, despite of being integrated in the TGF-β
superfamily, present a different structure compared to the other molecules. During the nodal flow, Lefty1
and Lefty2 show the capacity to act as spatial and temporal antagonists, preventing excessive Nodal
expression and blocking its migration to the right LPM, through a negative feedback loop (Meno et al.,
2001) (Hamada et al., 2001). In parallel with this, the Gdf1 gene starts to be expressed in the mouse
node. It is thought that the Gdf1 is directly involved in transferring its signal from the node to the LPM
interacting, in this way, with Nodal proteins. This could be explained according to the inexistence of
asymmetric Nodal expression in the LPM and presence of right isomerism saw in Gdf1-/- mice (Rankin
et al., 2000).
On the other hand, the EGF-CFC gene family encodes proteins that act as competence factors recruited
during Nodal signaling in various species as Xenopus, zebrafish, mouse and humans. These extracellular
proteins are composed by an altered epidermal growth factor (EGF)-like motif and a cysteine-rich (CFC)
domain (Salomon et al., 2000). Data demonstrate that function of cripto proteins, comprised in this
family, have similarities with Nodal proteins. Using tracing studies with mutant crypto mice, the resulted
abnormal phenotype was characterized by absence of PS formation and therefore defects on embryonic
mesoderm suggestive of loss of Nodal proteins (Ding et al., 1998). These findings are explained by
posterior data showing that, when Nodal receptors bind to the EGF-CFC factors, its proteins are likely
to specifically interact with Alk4 and ActRIIB activin receptors (Yeo & Whitman, 2001). When its

Chapter 2. Background
7
occur, Nodal signaling is activated and transduced by phosphorylation of Smad2/Smad3 in an
intracellularly mechanism. Its association with Smad4 is known to originate transcriptional complexes
that with association with FoxH1 transcription factor leads to expression regulation of some downstream
Nodal target genes like Lefty1/2 and Pitx2 in the nuclear cells region (Figure 2.3) (Shen, 2007). Another
important member of the Nodal signaling cascade, the Cerberus-like family, plays an essential role in
order to maintain its signaling, specially through an antagonistic activity.
Figure 2.3: Nodal Signaling. Cerl2 and Lefty1/2 proteins interact with Nodal to regulate its levels and prevent its signaling
migration to the incorrect side of the LPM (figure modified from Kalyan et al., 2017).
2.3 The Cerberus Family
The Cerberus-like (Cer-l) family is part of the cysteine-knot superfamily (Belo et al., 2009). It encodes
for small secreted proteins – 272 a.a., Cerl-1 and Xcer, and 185 a.a., Cerl2 – that act as antagonists of
Nodal, BMP and Wnt proteins (Marques et al., 2004). In terms of its protein domains, the Cer-l family
is composed by 9 cysteines, where at the N-terminal a signal peptide is bind and at the C-terminal region
a Cystein-Rich Domain (CRD) is formed (Belo et al., 2009).
The Xenopus embryos were the first animal model used to study Cerberus expression. Cer-l was initial
identified in this species (Xcer), being this novel secreted protein expressed in the yolky anterior
endomesoderm located in Spemann’s organizer (Bouwmeester et al., 1996). Studies performed by
injecting Xcer mRNA into blastomeres have resulted in formation of ectopic heads and duplicated
internal organs, leading this phenotype to the designation of this gene (Bouwmeester et al., 1996).
Besides the mentioned Cerberus-associated proteins for mouse (Cerl1 and Cerl2) and Xenopus (Xcer),
others have been discovered in vertebrate species: the cCer in chicken, the zCharon in zebrafish and the
Dand5 in humans.
2.3.1 Cerberus-like 2
Cerberus-like 2 (Cerl2) is a member of the Cerberus/Dan family, located on chromosome 8 in mouse,
and was identified as a Nodal antagonist playing an important role in the L/R axis establishment during
the mouse gastrulation (Marques et al., 2004). Studies showed that Cerl2 encodes for a secreted 20-kDa
protein, capable to directly bind to Nodal and, according to its small size, shows a dynamic localization
on the node during early somitogenesis (Marques et al., 2004) (Inácio et al., 2013). Analysis to the in
vivo subcellular localization of the Cerl2 protein demonstrated that, in early somite stage, its expression

Chapter 2. Background
8
is limited to both sides of node presented in perinodal crown cells (Inácio et al., 2013). However, the
level of expression of Cerl2 in the right side of the node is notorious at 2-somite stage being dynamically
transposed to the left side of the node at 3-4-somite stage (Inácio et al., 2013). After 6-somite stage,
Cerl2 expression extinct in this location. According to these results, the hypothesis of Cerl2 be
dependent of nodal flow was taking into account. And, the same study showed that both expression and
localization of Cerl2 protein in the node is, indeed, dependent of nodal-flow signaling (Inácio et al.,
2013).
2.4 Mouse Heart Development
The heart is the first organ to be formed during early development, immediately after gastrulation, being
a master source of complexity and vital functions (Brand, 2003). Most of the cardiac progenitor cells
are descendent from the mesoderm germ layer (Buckingham et al., 2005). The processes involved during
this mesoderm derivation are primarily controlled by the Wnt, FGF and TGF-β families of signaling
molecules (Später et al., 2014).
Early cardiogenesis starts with the migration of naïve cardiogenic mesoderm cells (CMCs) from the PS
that will populate the splanchnic mesoderm layer located in the LPM region (Brade et al., 2013). Here,
these heart cell precursors started to form a primitive heart structure called cardiac crescent (Figure 2.4).
At E7.5 this structure is completely formed being a result of the first recruitment of CMCs-derived
progenitors also commonly designated as first heart field (FHF) (Galdos et al., 2017). At the same time,
the second heart field (SHF) progenitors, recruited from the pharyngeal mesoderm layer in the LPM,
place medially and anteriorly to the FHF (Xin et al., 2013). By E8.0-E8.5, a primordial and linear heart
tube is originated by the fusing of these FHF progenitors at the midline of the embryo, marking the start
of beating function and acting as a scaffold to heart maturation (Nishii & Shibata, 2006). At this stage,
cells migrated from the SHF lead to its elongation and expansion, in posteriorly and anteriorly regions,
until give rise to arterial and venous poles (Meilhac et al., 2014). Then, the heart tube undergoes
rightward looping mediated by L-R signaling information (Kathiriya & Srivastava, 2000). Ultimately,
the SHF progenitors will derive to the outflow tract, right ventricle and both atria of developing heart
while the FHF progenitors contribute to the left ventricle and atria (Figure 2.4) (Buckingham et al.,
2005). The growing, differentiation and specialization steps lead to the correct positioning of the four
cardiac chambers, at stage E10.5, continuing the complex process of heart maturation with septation and
valve formation until E15.0 (Xin et al., 2013).
Despite of most of cells derived from FHF and SHF will turn on mature cardiomyocytes, these
progenitor cell lineages also will give rise to other cell types that compose the mature heart and
contribute to vessels composition: smooth muscle cells (SMCs), cardiac fibroblasts (CFs) and
endothelial cells (Waldo et al., 2005) (Moretti et al., 2006).

Chapter 2. Background
9
Figure 2.4: First (FHF) and second (SHF) heart fields formation and subsequent derivative tissues in mature heart and
head in mouse. The FHF (red) and the SHF (green) are shown at different development stages during heart formation. The
FHF progenitors will give rise to left ventricle (LV) and atria while SHF progenitors are involved in derivation of the outflow
tract (OFT), right ventricle (RV) and atria. Also, some SHF progenitors are involved in formation of facial muscles of the head
(figure modified from Meilhac et al., 2014).
2.4.1 Failure in L/R Axis Leads to Laterality Defects
As described previously, a correct position of the internal organs is mainly due to the presence of an
asymmetric signaling of the mentioned target genes of Nodal. When Nodal signaling undergoes a change
or break in its temporal and spatial activation, regular organ’s positioning is altered (Shiratori &
Hamada, 2014). This medical condition is designed as laterality defects and, normally, its abnormal
phenotype leads to a decrease in health conditions in humans (Shiraishi & Ichikawa, 2012). According
to the most common types, laterality defects can be classified as: situs inversus totalis when a complete
reversion of organs’ symmetry occurs; heterotaxia when only some organs are reversed while others
show a normal position (also designed as a partial situs inversus); and isomerism when organ’s
asymmetry is not present and can be divided in two types, the left isomerism when both sides become
with left symmetry and right isomerism when both sides have a right symmetry (Figure 2.5) (Fujinaga,
1997).
The first abnormal signal of these phenotypes can be verified in the orientation of the cardiac loop, that
shows an incorrect L-R axis positioning (Ramsdell, 2005). Since this deficiency is originated in the
initial stages of cardiac embryogenesis, consequently several cardiac defects are also present in patients.
The most typical ones are the atrioventricular septal defects, single atrium and right ventricle, aortic arch
malformations and malposition of great arteries (Shiraishi & Ichikawa, 2012). In this way, laterality
defects are commonly related with congenital heart diseases involving mutations in NODAL gene or any
of its regulator genes.

Chapter 2. Background
10
Figure 2.5: Morphological spectrum of laterality defects. The situs solitus consist in normal L-R body asymmetry. On the
other hand, patients showing situs inversus totalis display a complete reversion of organs’ symmetry. The isomerisms are a
heterotaxia type, classified as left isomerism or right isomerism (figure modified from Fliegauf et al., 2007).
2.5 Mouse Embryonic Stem Cells
The Embryonic Stem (ES) cells are a very singular type of stem cells, derived from human or mouse
embryos, characterized by their capacity to give rise to all the cell types of the three primordial germ
layers. Using specific culture conditions, ES cells can be derived from the ICM of the mouse blastocyst
maintain their unlimited or prolonged capacity to self-renew.
2.5.1 In Vitro Culture Conditions
Since the first successfully mouse ES cell line was derived from mouse blastocyst, various other ES cell
lines have been derived and characterized in order to study the early mammalian development and used
as disease models (Evans & Kaufman, 1981) (Martin, 1981). Inspired by previously studies of
generation of teratocarcinoma cells, Evans and Kaufman as well as Martin, in independently
investigations, established the basic principles to derive mouse ES cells, that consisted in coculture
blastocysts with mouse embryonic fibroblast (MEF) cells using calf serum. With these culture
conditions, they aimed to promote proliferation of ES cells colonies and retain an undifferentiated
phenotype.
However, for many years, some ES cell lines were inefficiently derived or impossible to be produce
from some mice strains. It became apparent, by some studies, that the facility and efficiency of ES cells
derivation was dependent on the mice strain used; the 129 strain was determined as the most permissive
while using others, like CBA and NOD strains, was not possible without a discovery of some molecules
capable to overcame this experimental issue (Batlle-Morera et al., 2008) (Ying et al., 2008). Thus, a new
stem cell culture system was reported bringing a huge step forward to solve this problem. This culture
regime, called the “2i medium” is composed by two chemical kinase inhibitors, the CHIRON99021 and
the PD0325901, capable to promote long-term self-renewal of mouse ES cells (Ying et al., 2008). There,
by using the 2i condition medium, was possible to derive ES cells from strains previously impossible,
including the NOD strain with satisfactory efficiency (Hanna et al., 2009) (Ying et al., 2008).The first
one, the CHIRON99021, inhibits the glycogen synthase kinase 3 (GSK3), a central molecule modulator
in Wnt signaling, stabilizing the cells proliferation by regulation of pluripotency and epigenetic factor
(Ying et al., 2008). Prior study show that neural differentiation is repressed using this GSK3 inhibitor,
consistent with the stemness maintaining resulted from Wnt activity (Aubert et al., 2002). The second,
the PD0325901, is described as a MEK inhibitor, capable to block the Erk1/2 signaling (Ying et al.,
2008). Recent study, reveal the main consequences of Erk activation in ES cells translated in endodermal
lineage differentiation, mimetizing the PrE differentiation program in vivo (Hamilton & Brickman,
2014).

Chapter 2. Background
11
One of the in vitro critical conditions to initial sustain the efficiently derivation of ES cells consist in
cocultured them with mitotically inactivated MEFs, denoted as feeder layers, since these cells have the
ability to release important factors and increase the ES cells seeding and growing (Evans & Kaufman,
1981) (Martin, 1981). The most relevant one, the secreted leukemia inhibitor factor (LIF), is an
important cytokine belonging to the interleukin 6 (Il-6) family, with the capacity to enable mouse ES
cells self-renewal for prolonged time in culture (Rose-John, 2002) (Williams et al., 1988) . This ability
is due to the binding of LIF with gp130 receptor that will activate the transcription of the Stat3 factor
(Yoshida et al., 1994). This Stat3 activation represents a key transcriptional factor for ES cells self-
renewal through activation of some target genes transcription after its translocation into the cells’
nucleus (Niwa et al., 1998). So, using a culture medium supplemented with LIF and the 2i conditions,
it is possible to maintain ES cells in culture, for prolonged time, retaining their self-renewing capacity
and reducing significantly spontaneous differentiation events along time.
2.5.2 From Pluripotency to Cardiac Differentiation
The pluripotency properties in ES cells are maintained due to the expression and interactions between
specific transcription factors. When we aim to characterize a ES cell line it is crucial to assess to the
presence of some markers that will give us the true notion of the existence of pluripotency properties in
the line. In this way, the Oct4, Sox2, SSEA1 and Nanog are common used markers to characterize a
mouse ES cell line and they are integrated in the panel of pluripotency markers of choice (Morey et al.,
2015).
Oct4 belongs to the POU transcription factor family being highly expressed in the early embryos and
germ cells, decreasing its protein expression during differentiation (Shi & Jin, 2010). The first data
defining it as a regulatory candidate gene for pluripotent stem cell lineage show that, in Oct4-mutant
mice, the blastocysts were well developed but the ICM was not composed by pluripotent cells, as
opposed to what occurs in wild type mice (Nichols et al., 1998). Thus, the expression of Oct4 is crucial
to trigger the initial development of pluripotency properties in the ICM. Also, other study demonstrate
that a critical amount of Oct4 is required in order to sustain the ES cells self-renewal, and up- or
downregulation of this factor leads to primitive endoderm and mesoderm formation or loss of
pluripotency consequently leading to dedifferentiation towards TE (Niwa et al., 2000). So, Oct4 either
can leads to pluripotency maintenance or to cell lineage specification.
Sox2 is defined as the transcription factor SRY-type high mobility group box 2, belonging to the SoxB1
subgroup which includes the Sox1 and Sox3 factors (Kamachi et al., 2000). Like in Oct4 transcription
factor, Sox2 expression levels need to be kept within a certain range of values to maintain the self-
renewal of ES cells. Using the downregulation and overexpression of this factor, it was showed that
lower levels of Sox2 promote the differentiation of mouse ES cells into cells from the trophectoderm
linage, and its overexpression could promote neuroectodermal differentiation (Zhao et al., 2004). Its
expression is observed not only in the pluripotent lineage cells but also in multipotent cells derived from
extraembryonic ectoderm (Avilion et al., 2003).
SSEA-1 (stage-specific embryonic antigen-1), also known as CD15, is classified as a cell surface antigen
with a Lewisx carbohydrate structure. Its expression is restricted to the early stage of mouse development
starting at the 8-cell stage (Solter & Knowles, 1978). Also, it is a good cell surface marker to control ES
cell differentiation because its expression is only verified in teratocarcinoma stem cells and ES cells
and, consequently, absent in their differentiated cell lineages (Cui, 2004). SSEA-1 is often used as a
negative surface marker to test pluripotency in human stem cells (Martí et al., 2013).

Chapter 2. Background
12
Nanog consist in a homeodomain transcription factor critical for early embryo development according
to its role in ICM cells’ fate, as referred before, as well as regulating the maintenance of the pluripotent
epiblast phase (Pan & Thomson, 2007). The level of Nanog proteins reaches the maximum peak at the
morula stage until late blastocyst, and then become restricted to the epiblast and excluded from the
primitive endoderm area. When implantation stage occurs, it is verified a downregulation in Nanog
expression. However, it’s still could be found in germ cells of E11.5 mouse embryos (Chambers et al.,
2003). In vitro, Nanog is expressed in mouse and human ES cells and when low levels are detected, it
is a signal that ES cells are starting to suffer differentiation (Pan & Thomson, 2007). Previous studies,
proved that Nanog is one of the most important master regulators of the pluripotency state by discover
its ability to maintain self-renewal of ES cells in absence of the LIF/gp130/Stat3 pathway in mouse cells
(Chambers et al., 2003) (Mitsui et al., 2003). Also, Oct4 and Sox2 have been implicated in Nanog
transcription process, during pluripotency maintenance, by the direct binding to its promoter verified
both in vivo and in vitro (Rodda et al., 2005).
2.5.2.1 Cardiac Differentiation Program in vitro
Cardiac differentiation from mouse ES cells has become a routine and useful technique in many
laboratories to study cardiovascular diseases and characterize diseases models. Since 1985, when was
firstly prove that ES cells could spontaneous differentiate to cardiac functional cells in vitro, that
culturing these cells as aggregates become an often used protocol (Doetschman et al., 1985). These ES
cells’ aggregates, called as Embryoid Bodies (EBs), consist in 3-dimensional structures capable to form
the three germ layers (Doetschman et al., 1985). Using this capacity, EBs have been used to serve as
models to recapitulate the early events of mammalian embryogenesis and study a range of differentiated
cells derived from the germ layers (Desbaillets 2000) (Itskovitz-Eldor et al., 2000).
The differentiation protocol starts with the removal of LIF and other antidifferentiation factors from the
culture medium. This step, allied to the hanging drop culture technique, will allow ES cells to encounter
each other, as a stochastic event, forming the 3-dimentional EBs (Kurosawa, 2007). Usually, cells are
cultured with a chosen precise density in hanging drops, in inverted bacterial-grade dishes, allowing the
ES cells aggregation by gravity stimulus and by no adherence to the culture dishes (Figure 2.6) (Weitzer,
2006). However, this suspension culture technique has some inherent limitations and disadvantages,
such as the heterogeneously in size and shape of the EBs that could led to lose of differentiation
synchrony and a lower percentage of cardiomyocytes’ production. Also, the culture conditions used for
generation and maintenance of the ES cell lines (e.g. type of feeder cells, the medium, the source or
batch of supplementation serum and even the characteristic handling of the scientist) could influence
the EB development leading to unclear results (Weitzer, 2006). In this way, it is critical that the chosen
culture protocol to form EBs led to a reproducible and homogeneous morphology. In order to get around
this, in the last years, some investigators start to use a direct protocol to differentiate mouse and human
cardiomyocytes in monolayer by adding a specific set of supplements (Activin A, BMP4, VEGF, and
others) to the culture medium resulting in a high percentage of functional derived cardiomyocytes (Lian
et al., 2013) (Kokkinopoulos et al., 2016). Nevertheless, this monolayer protocol approach could not be
used to differentiate the Cerl2-/- ES cells, derived in this project, because the regular growth factors
added possibly will masker the effect of the Cerl2 KO gene by the direct cardiac pathways’ stimulation.
Also, the EB differentiation system seems to be the correct protocol in the present project, to mimic
early cardiomyogenesis, according to the main role of the Cerl2 during the embryonic developmental
window in mouse.

Chapter 2. Background
13
Figure 2.6: Schematic representation of the cardiomyocytes’ differentiation using the hanging drop technique. The
undifferentiated cells are maintained in culture for several passages with ES cell medium supplemented with LIF. Then, the
desired cell suspensions are prepared in single drops, separated between each other’s, and the plate lid is inverted. By gravity
stimulus, ES cells start to aggregate in Embryoid Bodies (EBs), during 2 days, and then they continue to grow in suspension
culture. At day 5, EBs are plated in gelatin-coated 6-well plates leading to cardiomyocytes differentiation and maturation until
day 10 (figure modified from Bai et al., 2015).
After 24 hours, in hanging drops, ES cells are arranged in 3D aggregates resembling to the early morula
structure in embryos, with irregular surfaces (Weitzer, 2006). During day 2, occurs a process of surface
smoothness analogous to the morula compaction steps until blastocyst conformation. EBs continue to
increase in size by the origin of primitive endodermal cells at its outer side, at day 3, through
downregulation of the pluripotency genes and upregulation of α-Fetoprotein (AFP) gene (Weitzer,
2006). By days 4-5, its entire surface is covered with endoderm cells and the ES cells, situated in the
inner side, start to differentiate to primitive ectoderm cells expressing positively Vimentin gene (Boheler
et al., 2002). Meanwhile, mesoderm formation is induced confirmed by Mesp-1 expression around day
4. This expression pattern occurs in the embryo at the E6.5 stage during PS establishment, marking the
first cardiac progenitors that will populate the FHF and SHF (Saga et al., 1996). As a master regulator
of cardiac cell-fate determination, previously studies clarified that overexpression of Mesp-1, in EBs
culture, leads to an accelerated specific myocardial cell fate differentiation by regulating specific set of
genes involved in cardiac specification (Lindsley et al., 2008) (Bondue et al., 2008). Then, after day 4,
its expression in cardiac mesoderm specification become downregulated and specific early cardiac
markers become upregulated. Isl1 and Nkx2.5 are the next transient genes to became highly expressed
in EBs, giving the information of positive differentiation of cardiac progenitor cells. Comparing to the
embryo model, Nkx2.5 and Isl1 are critical transcription markers against FHF and SHF cells’ lineage,
respectively (Kelly et al., 2014) (Cai et al., 2003). In vitro, within 4-6 days, progenitors expressing Isl1+
and Nkx2.5+ could originate cardiomyocytes, smooth muscle, pacemaker and endothelial cells being
classified these as multipotent cardiovascular progenitors (Moretti et al., 2006).
At day 6, after plating, EBs are completely attached to the surface by the primarily proliferation of
endoderm outer layer (Weitzer, 2006). Beating foci started to be visible in different areas, indicating the
first signs of mature cardiac differentiation. These rhythmic areas are characterized by having a thick
and elongated structure with arch-shaped ridges, phenotypically identical to those find in vivo
myocardium (Doetschman et al., 1985). Until day 10, the spontaneously beating foci show identical
action potentials’ shape compared to those measured in primary cultures of embryonic cardiomyocytes
and display the ability to develop adrenoreceptors (Wobus et al., 1991). Victor Maltsev and his
colleagues, specifically isolated cardiomyocytes derived from EBs and, using the batch-clamp system,
proved that these cells create different shapes of action potentials according to their spontaneous
differentiation stage (Maltsev et al., 1993). This is explained by the maturation and increased number of
ionic channels along the lineage specification. So, the most common genes used to specifically identify
mature cardiomyocytes are cTnT and α-MHC, reaching its expression peak at day 10 of differentiation
(Weitzer, 2006). It was proved that EBs transcribe α-MHC and tropomyosin isoforms (α-tropomyosin

Chapter 2. Background
14
and β-tropomyosin) in an appropriate developmental stage identical correlated to what occurs in vivo
mouse embryos (Robbins et al., 1990) (Muthuchamy et al., 1993).
2.6 From Cerberus-like 2 Gene to a Disease Model
Since the first ES cells derivation from early mouse embryos, as explained before, these cells have been
reached an important role in understanding some human diseases. And more important, it was through
them discover and correct derivation that Capecchi and Smithies, some years later, independently,
discovered how homologous recombination between DNA segments can be used to modify regions of
interest in mammalian genes (Thomas et al., 1986) (Smithies et al., 1985). Then, they used this
knowledge to produce knockout (KO) mice. Since that time, the use of this mutant mice has become a
useful tool in biomedical studies, being routinely used.
So, through a generation of mouse models containing specific null alleles, that were Mendelian-
inheritable traits, it is possible to mimic, in mice, human diseases involved in deficient heart formation.
Despite the differences in complexity between human heart and the mouse heart, both are composed by
the same number of chambers: two ventricles and two atria. Still, the mouse is considered a useful model
to study human diseases since 99% of its genes have equivalents in human genes with highly conserved
biological pathways between them (Waterston et al., 2002).
According to these developments, KO mice started to be used in order to study the roles of Cerl2 gene
during heart formation in the early mouse development. These particularly mice were generated through
the chimera technique using ES cells derived from 129-strain. Firstly, a cDNA clonal vector was
isolated, by screening the 129/Ola genomic mouse library, containing only partial sequence information
for the Cerl2 gene (Marques et al., 2004). Using a cDNA clonal vector, its second exon fragment was
replaced by insertion of a gene-selection marker in the targeting vector, leading to the inactivation of
the Cerl2 gene sequence (Marques et al., 2004). The most common one, the gene that confers resistance
to neomycin toxic agent, was used in this step allied with the lacZ sequence. This lacZ cassette is derived
from Escherichia coli, encoding enzyme β-galactosidase, and acts like a reporter gene helping to track
the target gene’s expression patterning in the mutant ES cells (Hall et al., 2009). Using the
electroporation technique for the ES cells, the complex machinery of its nucleus start to activate
homologous recombination that will replace the endogenous gene for the corresponding region of the
insert target vector (Capecchi, 2005). Then, one KO ES cell clone was inserted by blastocyst cavity
injection in a host mouse and implanted into the uterus of a female mouse. However, recently a new
genetic reprogramming approach called CRISPR/Cas9 emerged in the scientific community. Quickly,
this novel technique become the first choice tool for modeling disease in mouse according to the
simplicity and less consuming time compared to the described chimera protocol (Cong et al., 2013)
(Jinek et al., 2013) (Mali et al., 2013).
Previous studies showed that a significant number of Cerl2-/- mutants mice died within 48 hours after
birth, displaying various laterality defects such as pulmonary isomerism, thoracic situs inversus and
cardiovascular malformations, like ventricular septation and incomplete atrial (Marques et al., 2004).
So, it was important to study the consequences involved beyond Cerl2 loss of function, independently
of the presence of laterality defects that could influence the cardiac structure and function in mice and
confound the true implications of this gene. And, recently, Cerl2-/- mice without this type of
malformations were investigated, showing left ventricular hypertrophy with enlarged myocardial walls
comparing with the wild-type mice (Araújo et al., 2014). Cardiac function in Cerl2-/- neonates was
evaluated, using echocardiography exams, showing a compromise in cardiac electrophysiology –
decreased in heart rate and left ventricular mass index as well as reduced ascending aorta artery peak

Chapter 2. Background
15
velocity (Araújo et al., 2014). In this way, it is notorious the implication of the characteristic phenotype
in Cerl2-/- neonates with impaired left ventricular systolic function. Surprisingly, this phenotype was
associated to an increment in cardiomyocyte proliferation that was translated in an increased mitotic
index (Araújo et al., 2014). Also, the results prove that the increment in cardiomyocyte mitotic events
is translated in hyperplasia and did not occur as a response to a stimulus from cardiac cell’s apoptosis
discarding the myocardial hypertrophy through excessive deposition of extracellular matrix
components. This was demonstrated by increased levels of Ccnd1 relative expression, consisting in
cyclin-D1 that normally regulates the decision of G1 mitosis progression (Araújo et al., 2014) (Quelle
et al., 1993). Allied to these, the team detected an increase of Smad2 phosphorylated levels in hearts at
neonatal and E13 stage. In the absence of Cerl2 antagonist for Nodal signaling, the molecular pathway
continue its positive looping leading to more Smad2 proteins activation (Araújo et al., 2014).
To further clarify the role of Cerl2 during embryogenesis, a generation of a corresponding KO ES cell
line would be a useful in vitro model. Using these tool, cardiomyocytes could be differentiated providing
valuable information to answer to the remain questions related to the possible role of this gene in
cardiomyogenesis pathways.

Chapter 3. Materials and Methods
16
Materials and Methods
3.1 Mice
The animals were maintained in an air-conditioned room at 21ºC, in a 12-hour light-dark cycle, and fed
with autoclaved mouse food and tap water in microisolator cages for housing.
The mouse line used in this project was the Cerl2 knockout (Cerl2-/-) on background 129/Sv, previously
generated by the team using the chimera technique explained in Chapter 2 (Marques et al., 2004). Two
heterozygous Cerl2-/- females were mate with one heterozygous Cerl2-/- male, in each cage, at afternoon.
Normally, copulation occurs around midnight (Suckow et al., 2001). In the following morning, vaginal
plugs were checked to confirm successful mating. The plug consists in a whitish mass occluding the
entrance of the mouse vagina. It’s a consequence of the coagulation of some proteins present in the
ejaculated semen from the male mouse (Suckow et al., 2001). These structures start to disappear for 8-
24 hours after copulation, so the vaginal plug detection was always performed before noon. Embryonic
stage E0.5 was considered at noon of the plugs detection day.
3.2 Derivation and culture of Mouse Embryonic Fibroblasts (MEFs)
Pregnant females at E13.5 were sacrificed by cervical dislocation and the uterine horns were surgically
removed. The embryos were removed and placed into a Petri dish containing ice-cold PBS (Gibco® Life
Technologies). Using forceps, amniotic sacs were cut in order to discard the head, internal and thoracic
organs from the embryos.
The eviscerated embryos were washed again in 2 mL of PBS, in a clean 6-well culture plate, and were
diced into small fragments. An incubation with 700 µL of trypsin 1x (Gibco® Life Technologies) was
performed, for 5 minutes, to break cells’ ligations and get cells into suspension, and 7 mL of DMEM
medium (Dulbecco’s Modified Eagle Medium, Gibco® Life Technologies), supplemented with 10%
(v/v%) FBS (Sigma-Aldrich), 1x Penicillin/Streptomycin (Gibco® Life Technologies) and 2mM L-
glutamine (Invitrogen Life Technologies), was added in each one. Resuspension, up and down, was
performed to improve cells detachment and, then, cells were centrifuged at 1000 rpm for 5 minutes, at
room temperature. Carefully, the supernatant was removed and the cells’ pellet was resuspended in
freshly DMEM medium. The remaining cells from each embryo were plated on an individual 10-cm
culture dish and incubated in a humidified atmosphere at 37ºC and 5% CO2. This was considered
Passage 0 (P0). After 24 hours, the cells’ medium was renewed.
When 70-80% of confluence was reached, MEFs were frozen at P1. Firstly, the cells were incubated,
for 5 minutes, with 1 mL of trypsin 1x and were put in 1 mL vials (1.0 × 10⁶ cells) using 1 mL of freezing
medium composed by 45% FBS, 10% DMSO (D2650, Sigma-Aldrich) and 45% DMEM medium, per
vial, and they were maintained at -80ºC, until used.

Chapter 3. Materials and Methods
17
3.2.1 Mitotic Inactivation of MEFs
At least 2 days before using as feeder layers for the ES cells, MEFs were defrosted resuspending them
in 7 mL of DMEM medium and centrifuged at 1000 rpm for 5 minutes to discard the remaining freezing
medium. Then, the pellets were again resuspended in fresh DMEM medium and plated onto previously
0.1% gelatin-coated 6-well culture plate (Sigma). Cells were incubated at 37ºC and 5% CO2 and medium
was changed every day.
When the cells reached 70-80% confluence, the medium was replaced with supplemented DMEM
medium containing 10 μg/mL of mitomycin C (Sigma) and incubated for 2-3 hours. After, the cells were
washed three times with PBS, freshly DMEM medium was added and then the MEFs were incubated at
37ºC and 5% CO2 until used as feeder cells for mouse ES cells. The medium was renewed daily.
3.3 Derivation and Primary Culture of Mouse Cerl2-/- ES Cell Lines
Three days after vaginal plug detection, pregnant females were sacrificed by cervical dislocation and
the uterine horns were surgically removed and immediately placed on pre-heated M2 culture medium
(EmbryoMax®, Millipore).
The uterine horns were separated and the ovaries were removed, cutting near to the oviduct, under a
stereomicroscope (Zeiss Stemi DV4). Then, blastocysts were flushed, using a pipette with M2 medium,
and collected onto a Petri dish (Figure 3.1). To remove remaining maternal tissues, the blastocysts were
washed twice, using M2 drops. An incubation with Acidic Tyrode’s solution (137 mM NaCl; 2.7 mM
KCl; 1.6 mM CaCl2.2H2O; 0.5 mM MgCl2.6H2O; 5.6 mM glucose; 0.4% Polyvinylpyrrolidone (PVP),
pH 2.5) was done, for 1-2 minutes, to remove the zona pellucida.
One blastocyst was plated per well, in a 6-well plate, on mitotically inactivated MEF feeders, containing
ES cell medium composed by Knockout-DMEM medium (Gibco® Life Technologies) supplemented
with 15% FBS (HyClone, Thermo Scientific), 1% MEM Non-Essential Amino Acids (Gibco® Life
Technologies), 1% Penicillin/Streptomycin, 2 mM L-glutamine and 0.1 mM β-Mercaptoethanol
(Gibco® Life Technologies). In order to maintain pluripotency conditions, 5 x 10⁴ U mouse LIF
(ESGRO® Millipore) was added as well as 1 µM PD0325901 (Calbiochem® Millipore) and 2 µM
CHIRON99021 (Calbiochem® Millipore) inhibitors. Blastocysts were incubated at 37ºC, 5% CO2 for
48 hours, avoiding any disturbance during this period in order to allow its attachment to the feeder layer.
On day 3, after flushing, half of the medium was replaced with fresh one. During days 3-7, the
outgrowths were monitored daily under an inverted microscope (10x objective, Axiovert 40 CFL, Zeiss)
until they adapt the right morphology for performing the first passage. Also, medium was renewed every
day.
At day 7, medium was removed and the cells were rinsed once with PBS. And, 500 µL of enzyme
TrypLETM Select 1x (Gibco® Life Technologies) was added, incubating for 5 minutes at 37ºC to allow
dissociation of cells. After, 5 mL of medium was added to inactivate the enzymatic process. The cells
were transferred onto new inactivated feeder layers. The incipient ES cell line is at Passage 1 (P1), and
medium was replaced every day. After 3-4 days, ES cell colonies started to be observable.
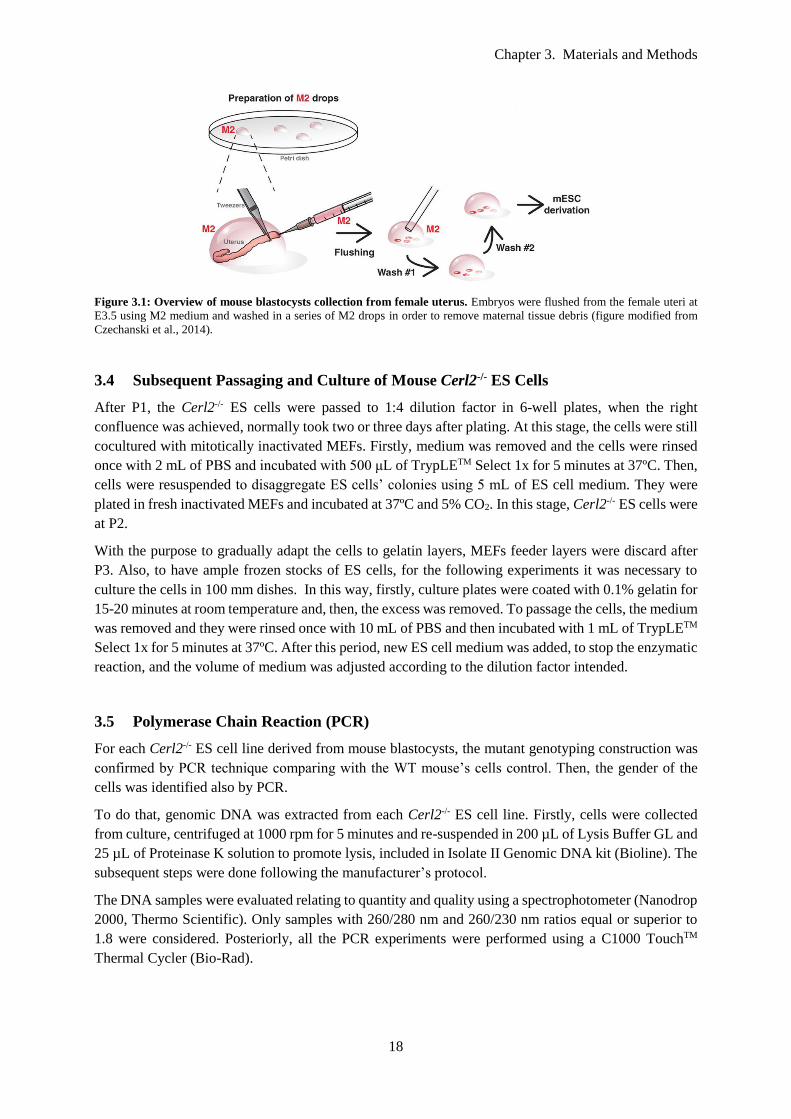
Chapter 3. Materials and Methods
18
Figure 3.1: Overview of mouse blastocysts collection from female uterus. Embryos were flushed from the female uteri at
E3.5 using M2 medium and washed in a series of M2 drops in order to remove maternal tissue debris (figure modified from
Czechanski et al., 2014).
3.4 Subsequent Passaging and Culture of Mouse Cerl2-/- ES Cells
After P1, the Cerl2-/- ES cells were passed to 1:4 dilution factor in 6-well plates, when the right
confluence was achieved, normally took two or three days after plating. At this stage, the cells were still
cocultured with mitotically inactivated MEFs. Firstly, medium was removed and the cells were rinsed
once with 2 mL of PBS and incubated with 500 μL of TrypLETM Select 1x for 5 minutes at 37ºC. Then,
cells were resuspended to disaggregate ES cells’ colonies using 5 mL of ES cell medium. They were
plated in fresh inactivated MEFs and incubated at 37ºC and 5% CO2. In this stage, Cerl2-/- ES cells were
at P2.
With the purpose to gradually adapt the cells to gelatin layers, MEFs feeder layers were discard after
P3. Also, to have ample frozen stocks of ES cells, for the following experiments it was necessary to
culture the cells in 100 mm dishes. In this way, firstly, culture plates were coated with 0.1% gelatin for
15-20 minutes at room temperature and, then, the excess was removed. To passage the cells, the medium
was removed and they were rinsed once with 10 mL of PBS and then incubated with 1 mL of TrypLETM
Select 1x for 5 minutes at 37ºC. After this period, new ES cell medium was added, to stop the enzymatic
reaction, and the volume of medium was adjusted according to the dilution factor intended.
3.5 Polymerase Chain Reaction (PCR)
For each Cerl2-/- ES cell line derived from mouse blastocysts, the mutant genotyping construction was
confirmed by PCR technique comparing with the WT mouse’s cells control. Then, the gender of the
cells was identified also by PCR.
To do that, genomic DNA was extracted from each Cerl2-/- ES cell line. Firstly, cells were collected
from culture, centrifuged at 1000 rpm for 5 minutes and re-suspended in 200 µL of Lysis Buffer GL and
25 µL of Proteinase K solution to promote lysis, included in Isolate II Genomic DNA kit (Bioline). The
subsequent steps were done following the manufacturer’s protocol.
The DNA samples were evaluated relating to quantity and quality using a spectrophotometer (Nanodrop
2000, Thermo Scientific). Only samples with 260/280 nm and 260/230 nm ratios equal or superior to
1.8 were considered. Posteriorly, all the PCR experiments were performed using a C1000 TouchTM
Thermal Cycler (Bio-Rad).

Chapter 3. Materials and Methods
19
3.5.1 Mutant Genotyping
In order to confirm the mutant genotyping in the mouse Cerl2-/- ES cell lines, a PCR was performed.
The process consisted in an initial denaturation step at 95ºC for 4 minutes, followed by 30 cycles of
denaturation at 95ºC for 1 minute, annealing step at 60ºC for 45 seconds and extension at 72ºC for 45
seconds. Also, the last extension step was done at 72ºC for 10 minutes. The reactions were prepared for
a final volume of 25 µL, composed by 0.2 mM dNTPs, 1 µM of forward primer, 1 µM of primer lower
2, 1 µM of primer AA289c P3, 0.1 U/µL DreamTaq DNA polymerase, 2.5 µL of DreamTaqTM Buffer
10x and 50-70 ng of DNA sample. Details for each primer used for cells’ genotyping are given in Table
3.1.
The PCR products were then separated on a 1% (w/v%) agarose (Grisp Research Solutions) gel
dissolved in TAE 1x buffer. In order to intercalate between DNA chains, 5 µL of GreenSafe Premium
(NZYTech) was added for a final volume of 100 mL of agarose gel. Agarose gel electrophoresis was
performed in TAE 1x buffer, at a constant voltage of 80 V, running in parallel with the samples a 1Kb
Plus DNA ladder. Then, the separated PCR products were visualized using Chemidoc (Bio-Rad) by UV-
light exposure.
Table 3.1: Primers nucleotide sequences for PCR to determine the cells’ genotyping.
Gene Primers
Cerl2
GenCer2-fwd: 5’ GGA AGA TTT TAT GCA AGC AAG AGT GTG G 3’
Lower2: 5’ GGT GAC TTC TTT TTT GCT TTA GCA GG 3’
AA289c P3: 5’ CAC ACA GCT GTT GCA GAA GAC 3’
3.5.2 Gender Determination
PCR was performed to amplify a specific region of Sry gene located on the Y-chromosome. The
amplification process was performed through an initial denaturation step at 95ºC for 3 minutes to break
hydrogen bonds, followed by 30 cycles of denaturation at 95ºC for 30 seconds, annealing of primers at
54.7ºC for 45 seconds and extension at 72ºC for 30 seconds. Then, a last extension step was done at
72ºC for 5 minutes allowing the complete amplification of the new strands which may have been
incomplete. The reactions were prepared for a final volume of 25 µL, composed by 0.2 mM dNTPs, 1
µM of forward primer, 1 µM of reverse primer, 0.1 U/µL of DreamTaq DNA polymerase, 2.5 µL of
DreamTaqTM Buffer 10x and 50-70 ng of DNA sample. Details for each primer used for gender
determination are given in Table 3.2.
The PCR products were then separated on a 1% (w/v%) agarose (Grisp Research Solutions) gel
dissolved in TAE 1x buffer. In order to intercalate between DNA chains, 5 µL of GreenSafe Premium
(NZYTech) was added for a final volume of 100 mL of agarose gel. Agarose gel electrophoresis was
performed in TAE 1x buffer, at a constant voltage of 80 V, running in parallel with the samples a 1Kb
Plus DNA ladder. Then, the separated PCR products were visualized using Chemidoc (Bio-Rad) by UV-
light exposure.
Table 3.2: Primers nucleotide sequences for PCR to determine the cells’ gender.
Gene Primers
Sry Fwd: 5’ AT GGA GGG CCA TGT CAA 3’
Rev: 5’ AC ACT TTA GCC CTC CGA 3’

Chapter 3. Materials and Methods
20
3.6 Karyotyping
Firstly, the mouse Cerl2-/- ES cell lines were cultured until reached 50-70% confluency in the same
conditions as described before. They were incubated with 20 ng/mL of colcemid (Invitrogen) in ES cell
medium for 5 hours at 37ºC, to arrest cells in metaphase. Then, they were washed in PBS and incubated
with 1 mL TrypLETM Select 1x for 5 minutes at 37ºC. The detached cells were resuspended in 9 mL ES
cell medium and centrifuged for 5 minutes at 1000 rpm. Supernatant was discard and the pellet was
resuspended in 500 µL ES cell medium. After, 5 mL of preheated KCl 0.075 M were added in a drop-
by-drop manner, to prevent cells’ lysis, and the tube was carefully inverted to mix the solution. The
mixture was incubated at 37ºC for 20 minutes. Three drops of fixation solution 3:1 methanol: glacial
acetic acid were slowly added and cells were homogenized by tube inversion. Cells were again
centrifuged for 5 minutes at 1000 rpm, the supernatant was discarded and the pellet slowly resuspended
in 7 mL of fixative solution, drop-by-drop. Then, they were centrifuged for 5 minutes at 1000 rpm. The
cells were re-fixed and re-centrifuged twice as described above before final re-suspension of the pellet
in 2 mL of fixative solution. Samples were store at -20ºC until the subsequent steps were performed.
The G-banding technique and karyotype analysis were performed by cytogenetic technologists at the
Department of Genetics, Faculty of Medicine of the University of Porto - São João Hospital. In total, 15
metaphases were evaluated for each ES cell line. And, only one final image was generated for each line.
3.7 Immunostaining for Markers of Pluripotency
The mouse Cerl2-/- ES cells from the derived lines were cultured in 24-well glass bottom plates, coated
with 0.1% gelatin. Then, the cells were incubated until reached 50% confluency at 37ºC and 5% CO2.
The cells were rinsed with 1 mL room-temperature PBS 1x and fixated with 4% PFA in PBS 1x for 15
minutes, at room temperature. Three washes with PBS 1x for 5 minutes each were performed to remove
PFA remains. After, cells were incubated with PBS containing 0.1% Triton-X 100 (Sigma) for 30
minutes at room temperature. This incubation step is important when we want to access to intracellular
and/or intraorganellar antigens, like NANOG and OCT4. The Triton-X 100 acts as detergent disrupting
the hydrogen bonding in the phospholipid bilayer, improving the penetration of the antibodies (Fallis,
2010) . However, cells that would be incubated with the primary antibody against the membranal marker
SSEA-1 were not permeabilized with Triton X-100 because that step would remove lipids from the
cell’s membrane causing its disruption of structure and, consequently, the loss of its specific antigens.
Then, to block nonspecific antibody-binding sites, cells were incubated with Blocking Solution (1x PBS,
1% BSA, 0.05% sodium azide) for 30 minutes at room temperature.
Then, cells were incubated with the primary antibodies anti-OCT4, anti-NANOG and anti-SSEA1
overnight at 4ºC. After, four washes with Blocking Solution were performed for 10 minutes each and,
then, cells were incubated with secondary antibodies at 4ºC overnight. Next day, cells were washed four
times with Blocking Solution for 10 minutes, and incubated with DAPI for 40 minutes. The dilutions
used for each antibody are listed in Table 3.3.
The cells were visualized and imaged with a Zeiss LSM 710 confocal microscope using a 40x water
immersion objective. Images were taken in sequential mode and posteriorly adjusted in ImageJ program.

Chapter 3. Materials and Methods
21
Table 3.3: Primary and secondary antibodies used for staining markers of pluripotency.
Antibody Dilution Source
Nanog anti-rabbit 1:150 Abcam
Oct4 anti-rabbit 1:150 Abcam
SSEA-1 anti-mouse 1:50 Abcam
DAPI 1:1000 Panreac AppliChem
Alexa Fluor® 594 Donkey anti-mouse
IgG 1:300
Jackson ImmunoResearch
Laboratories
Alexa Fluor® 594 Donkey anti-rabbit IgG 1:300 Jackson ImmunoResearch
Laboratories
3.8 Embryoid Bodies Formation
The undifferentiated Cerl2-/- ES cells in culture were used to test the pluripotency potential and
spontaneous differentiation by the hanging droplet method. Firstly, cells were washed with 10 ml of
PBS 1x and then incubated with 1 mL of TrypLETM Select 1x for 5 minutes at 37ºC. After, 9 ml of ES
cell medium was added and cells were dissociated into a single cell suspension. Cells were centrifuged
for 5 minutes at 1000 rpm and resuspended in fresh ES cell medium without LIF and the 2i. Also, cells
were counted using a Neubauer chamber and a cell suspension solution was prepared with a final
concentration of 2.5x10⁴ cells/mL. Cells were plated as 20 µL drops (500 cells), using a multichannel
pipette, on the base of an anti-adherent Petri dish and it was inverted into the lid to allow growing of
EBs in drop suspension (day 0). Also, 8 mL of PBS 1x was added to the lid to provide a humidified
environment. The cells were incubated at 37ºC and 5% CO2 for 48 hours (days 1 and 2). Then, Petri
dishes were inverted to the original position and 10 mL of fresh ES cell medium without LIF and 2i was
added. EBs were cultured in suspension until day 5 changing half of the medium and, then, they were
plated onto 0.1% gelatin coated wells and incubated until day 10 to promote spontaneous differentiation.
The culture medium was renewed every day.
3.9 Immunostaining for Markers of Germ Layers’ Differentiation
The mouse Cerl2-/- ES cells from the derived lines were cultured in hanging drops on the base of an anti-
adherent Petri dish and, the, inverted into the lid. The cell suspension solution was prepared as described
in the previous topic.
At the day 10 of differentiation, EBs were rinsed with 1 mL room-temperature PBS 1x and fixated with
4% PFA in PBS 1x for 30 minutes, at room temperature. Three washes with PBS 1x for 5 minutes each
were performed to remove PFA remains. After, cells were incubated with PBS containing 0.1% Triton-
X 100 (Sigma) for 1 hour at room temperature. Then, to block nonspecific antibody-binding sites, cells
were incubated with Blocking Solution for 30 minutes at room temperature.
Then, cells were incubated with the primary antibodies anti-AFP, anti-α-ACTININ and anti-
VIMENTIN overnight at 4ºC. After, six washes with Blocking Solution was done for 10 minutes each,
and cells were incubated in secondary antibodies at 4ºC overnight. Next day, cells were washed six
times with Blocking Solution for 10 minutes, and incubated with DAPI for 40 minutes. The dilutions
used for each antibody are listed in Table 3.4.

Chapter 3. Materials and Methods
22
The cells were visualized and imaged with a Zeiss LSM 710 confocal microscope using a 40x water
immersion objective. Images were taken in sequential mode and posteriorly adjusted in ImageJ program.
Table 3.4: Primary and secondary antibodies used for staining markers of germ layers’ differentiation.
Antibody Dilution Source
AFP anti-goat 1:100 Santa Cruz Biotechnology, Inc.
α-Actinin (Sarcomeric) anti-mouse 1:100 Sigma-AldrichTM
Vimentin anti-rabbit 1:50 Sigma-AldrichTM
DAPI 1:1000 Panreac AppliChem
Alexa Fluor® 594 Donkey anti-mouse
IgG 1:300
Jackson ImmunoResearch
Laboratories
Alexa Fluor® 594 Donkey anti-rabbit IgG 1:300 Jackson ImmunoResearch
Laboratories
Alexa Fluor® 488 anti-goat IgG 1:1000 Thermo Fisher Scientific
3.10 Cardiac Differentiation of ES cells
E14 ES cells and Cerl2-/- ES cells were cultured through several passages with decreasing doses of 2i,
dividing the dose volume of these inhibitors by two at each passage. Then, the ES cells were cultured
and maintained using only the LIF supplementation without 2i.
Then, to initiate the cardiomyocytes’ differentiation the EBs protocol was used, as described before.
Firstly, the ES cells were cultured in hanging drops for 48 hours (days 1 and 2 of differentiation) until
formed the EBs aggregations. From day 2 to day 5, EBs derived from the KO line and the control line
(E14) were cultured in suspension and its growth was daily monitored with an inverted microscope (10x
objective, Axiovert 40 CFL, Zeiss). Then, EBs were plated onto each 0.1% gelatin coated 6-wells and
incubated until day 10 of differentiation. During this period, the morphology of proliferative outgrowths
was regularly observed and beating foci areas were counted under the inverted microscope at different
time points of differentiation.
3.11 RNA Extraction and cDNA Synthesis
RNA was extracted from mouse Cerl2-/- ES cells, MEF cells and EBs, at several days of differentiation,
using 350 µL TRI Reagent® (Sigma-Aldrich) to promote lysis. An equal volume of 100% ethanol was
added and samples were centrifuged at 12000 xg for 30 seconds, to precipitate the DNA and RNA.
After, the samples were treated using the Direct-zolTM RNA MiniPrep Kit (Zymo Research) by
following the manufacturer’s protocol and using the solutions provided in the kit. The purified RNA
samples were eluted in 40 μL of RNase free water, available in the indicated Kit.
The RNA samples were evaluated relating to quantity and quality using a spectrophotometer (Nanodrop
2000, Thermo Scientific). Only samples with 260/280 nm and 260/230 nm ratios equal or superior to
2.0 were considered. Then, the isolated total RNA for all samples were immediately stored at -80ºC for
future experiments.
First strands cDNA were synthesized through reverse transcription reaction, which is composed by two
steps. Firstly, each reaction composed by 1 µg of RNA, 0.5 µg of Oligo (dT) primers and RNase-free
water up to 11.5 μL were incubated at 65ºC for 5 minutes. This step consists in the annealing of the

Chapter 3. Materials and Methods
23
Oligo (dT) primers with the single strand of RNA template. Then, a master mix solution was added to
the previous reaction, containing 4 µL of 5x Reaction Buffer, 40 U/µL of RiboLock RNase Inhibitor,
200 U/µL of RevertAid Reverse Transcriptase and 10 mM of dNTP, making a total 20 μL volume per
each. In this stage, the PCR tubes were incubated at 42ºC for 1 hour followed by the step of Reverse
Transcriptase enzyme denaturation at 70ºC for 10 minutes. At this stage, DNA strands were polymerized
followed by the deactivation of the reverse transcriptase enzyme. Finally, cDNA samples were 1:10
diluted with RNase-free water and stored at -21ºC until used.
3.12 qRT-PCR
Triplicate reactions were performed in 96-well plates using optical sealing tape for a 15µL total volume
for each. Each qRT-PCR reaction contained 7.5 µL of power SYBR® Green Master Mix (Applied
Biosystems), 2 μL of cDNA, 0.1 µM of each forward and reverse primers and ultrapure water up to the
final desired volume. The oligonucleotide primer sequences used and their annealing temperatures are
listed in Table 3.4. The amplification and fluorescent detection was performed with Applied Biosystems
7300 Real-Time PCR machine. The conditions of amplification of target sequences were as follow:
initial step of denaturation at 95ºC for 10 minutes, followed by 40 cycles of denaturation step at 95ºC
for 30 seconds, annealing for 15 seconds at the gene-specific annealing temperature (Table 3.5) and an
extension step at 72ºC for 30 seconds. Relative quantification of expression was performed using the
ddCt method (Bustin, 2000) and normalized to GAPDH as housekeeping gene and with E14 ES cell line
as reference.
Table 3.5: qRT-PCR primers used.
Gene Primers
Annealing
Temperature
(ºC)
Nanog Fwd 5’ AGG GTC TGC TAC TGA GAT GCT CTG 3’
Rv 5’ CAA CCA CTG GTT TTT CTG CCA CCG 3’ 61
Oct4 Fwd 5’ AGT ATG AGG CTA CAG GGA CA 3’
Rv 5’ CAA AGC TCC AGG TTC TCT TG 3’ 61
Sox2 Fwd 5’ CGA GAT AAA CAT GGC AAT CAA ATG 3’
Rv 5’ AAC GTT TGC CTT AAA CAA GAC CAC 3’ 56
Mesp-1 Fwd 5’ TGT ACG CAG AAA CAG CAT CC 3’
Rv 5’ TTG TCC CCT CCA CTC TTC AG 3’ 61
Isl1 Fwd 5’ CCT GTG TGT TGG TTG CGG CA 3’
Rv 5’ GGG CAC GCA TCA CGA AGT CG 3’ 61
Cerl2 Fwd 5’ GCA GAG AGT AGC TGC TGG TGT GCC TTT 3’
Rv 5’ CGG CAC ACA GCT GTT GCA GAA GAC TAC 3’ 68.3
Ccnd1 Fwd 5’ CAA ATG GAA CTG CTT CTG GTG AAC AA 3’
Rv 5’ GGA GGG TGG GTT GGA AAT GAA CTT 3’ 63
cTnT Fwd 5’ GGA AAT CCA AGA TCA CTG CCT CC 3’
Rv 5’ GGG CAC TGA GGG ACA GAC CA 3’ 60
Nkx2.5 Fwd 5’ CCA CTC TCT GCT ACC CAC CT 3’
Rv 5’ CCA GGT TCA GGA TGT CTT TGA 3’ 60

Chapter 3. Materials and Methods
24
α-Mhc Fwd 5’ GAT GGC ACA GAA GAT GCT GA 3’
Rv 5’ CTG CCC CTT GGT GAC ATA CT 3’ 60
Gapdh Fwd 5’ AAG AAG GTG GTG AAG CAG GC 3’
Rv 5’ GCC TCT CTT GCT CAG TGT CC 3’ 61
3.13 Statistical Analysis
Statistical Analysis was performed using GraphPad Prism 6 software for Windows (GraphPad
Software, Inc; San Diego California, USA). All the experimental values are reported as mean ± SD.
In case of the RT-PCR experiments, statistical differences between the two groups (mutant and control
groups) were determined applying the unpaired Student’s t-test. Also, one-way ANOVA test was
applied when more than two groups were compared. To reject the null hypothesis, the probability values
of *P<0.05 were considered statistically significant.

Chapter 4. Results and Discussion
25
Results and Discussion
4.1 Generation of Mouse Cerl2-/- ES Cell Lines
According to the reported functions of Cerl2 proteins for a correct establishment of the L-R axis during
cardiogenesis, also it was hypothesized that these molecules could be involved in the main processes of
cardiomyogenesis. With the purpose to uncover the role of Cerl2 in the mechanisms of cardiac
mesoderm differentiation, ES cells were used as the preferred disease model. Taking advantage of their
capacity to differentiate into all cell lineages, it is possible to mimic in vitro the biological mechanisms
that lead to the abnormal phenotype previously reported in the mutant mice (Nishikawa et al., 2007).
So, to study the possible roles of Cerl2 on the number of in vitro produced cardiomyocytes, three
independent mouse ES cell lines were successfully derived from knockout (KO) mouse blastocysts. To
improve chances of positive copulation, two females were mated with one male, at afternoon, in each
cage. In the morning after, plugs were checked and detected by the presence of a whitish mass occluding
the entrance of the mouse vagina. Then, it was considered that successful copulation occurred and
pregnant females were separated into new cages defining stage E0.5. To take access to the blastocysts,
pregnant females were sacrificed three days after plugs detection, i.e. at stage E3.5. Performing a
flushing technique was possible to remove the blastocysts from inside the female uterus, using M2
medium that allows the collection and handling of embryos for a prolonged time, at room temperature,
without the risk of damaged their biological properties. Then, the blastocysts were incubated with Acidic
Tyrode’s solution to disrupt the zona pellucida (Khalifa et al., 1992). After several trials, this
demonstrated to be a crucial step to promote blastocyst hatching, because without using this solution it
was observed that blastocysts continued to grow in suspension culture and eventually lost the desired
properties. The mouse blastocysts were plated in mitotically MEFs and incubated until completely
attached to the feeder layers, with ES cell medium supplemented with LIF and the 2i to improve the
efficiency of retaining their pluripotency properties (Figure 4.1). Despite the amount of LIF naturally
secreted by the MEF cells, it was necessary to perform the medium supplementation with chemical LIF
(Ma et al., 2012). This was a necessary step to achieve the minimum concentration value required for
maintenance of self-renew and pluripotency state because feeder layers secret factors in variable
amounts during culturing. The optimal concentration value used was corresponding to the commercial
product datasheet.

Chapter 4. Results and Discussion
26
Figure 4.1: First steps of ES cells derivation from Cerl2 KO mouse blastocysts. (A) Morphology of mouse blastocyst at
stage E3.5, with well-defined ICM and blastocyst cavity; (B) Morphology of blastocyst hatched on MEF feeder at day 3 after
collection; (C) At day 7, outgrowths were completely formed. Scale bars: 100 μm.
Until day 7, blastocysts expanded in culture and clusters of outgrowths started to be visible. Then, it was
time to trypsinized the aggregation of pluripotent cells allowing the expansion of the first Cerl2-/- ES
cells that will aggregate in colonies. As it is well documented, ES cells grow as packed colonies and
show specific morphologic characteristics when they are visualized in an inverted microscope
(Czechanski et al., 2014). Cells morphology was daily accessed during culture using an inverted
microscope: Cerl2-/- ES cell colonies, from the three different lines, show oval morphology with clear
light boundaries with a large nucleus compared with a reduced cytoplasm (Figure 4.2). Also, it was
notable that some cells started to spontaneous differentiate in an insignificant frequency being this a
positive factor of the action of the 2 inhibitors used in the culture medium system. Through the use of
the chemical CHIR99021 inhibitor, the activity of GSK3 is blocked and self-renewal in ES cells is
maintained, while the addition of the chemical PD0325901 inhibitor reduces cells differentiation by
targeting MEK proteins and blocking the activation of Erk signaling cascade (Ying et al., 2008).
The Cerl2-/- ES cells were cocultured with freshly MEFs feeders up to Passage 3 to promote an efficient
derivation with a lower spontaneous differentiation rate due to the sustentation and release of cytokines
that inhibit ES cells’ differentiation (Llames et al., 2015). For subsequent passages, the cells were
cultured on 0.1% gelatin-coated plates to gradually adapt to this layer type allowing the decrease of
contaminations risk and consuming time and money compared to the feeder layers. But the main reason
for this change was to discard false results during the future experiments of differentiation. It is known
the target function of some of the soluble factors released by the MEFs, but others are still unknown
(Tamm et al., 2013). In this way, the continued use of these cells as feeder layers could possibly mask
some normal process occurring during cardiomyogenesis or even cause inhibition/stimulation of some
undesirable signaling pathways.
During these experiments, about 19 blastocysts were collected in total from pregnant females. However,
just 8 blastocysts were at the pretended morphology stage and correctly attached to the inactivated MEF
feeder layers forming outgrowths. During the entire protocol, only 3 of them could successfully originate
Cerl2-/- ES cells. Taking this account, this in vitro derivation technique showed a lower efficiency
(approximately 16%) in establishing ES cells from in vivo developed blastocysts.
(A) (B) (C)

Chapter 4. Results and Discussion
27
Figure 4.2: Morphology of Cerl2-/- ES cell colonies cocultured with MEFs at Passage 1 and Passage 2 from the derived
lines. (A) ES cells from Embryo 1 at P1; (B) ES cells from Embryo 1 at P2; (C) ES cells from Embryo 5 at P1; (D) ES cells
from Embryo 5 at P2; (E) ES cells from Embryo 6 at P1; (F) ES cells from Embryo 6 at P2. In the present images, the colonies
show an oval morphology with lightly boundaries characteristic of ES cells. Spontaneous differentiation is not significantly
notorious. Scale bars: 100 μm.
4.2 Characterization of the Derived Mouse Cerl2-/- ES Cell Lines
To use a derived KO ES cell line for future experiments it is crucial to characterize it relating to its
chromosomic and genetic stability, pluripotency and differentiation capacities (Czechanski et al., 2014).
To define Cerl2-/- ES cells populations demonstrating their pluripotency, standard protocols were
performed on the three successfully derived lines.
(A) (B)
(C) (D)
(E) (F)

Chapter 4. Results and Discussion
28
Firstly, to confirm the KO genotype of the Cerl2-/- ES cells, the PCR technique was performed. Using
specific pairs of forward and reverse primers, it was amplified the KO allele of the Cerl2 gene from
genomic DNA of KO and wild type (WT) cells, this last used as a negative control (Figure 4.3). The
primer GenCer2-fwd was previously designed as a common forward primer annealing with both WT
and KO alleles (Marques et al., 2004). Its starting annealing point is located upstream of the lacZ cassette
insertion point. The reverse primer Lower2 was designed to anneal with the Cerl2 WT allele, starting
the annealing process in the 3’ region of the corresponding end insertion point of the neomycin
replacement cassette in the KO allele (Marques et al., 2004). As a reverse primer, specifically against
the KO allele, the AA289c-P3 primer was used. This annealed in the 5’ region within the lacZ cassette
(Marques et al., 2004). In this experiment, a genomic DNA template from an adult Cerl2 KO mouse
was used as a positive control and a genomic DNA template from an adult WT mouse was used as a
negative control. Also, a control without DNA was applied to discard false amplifications in PCR
reactions. The results confirm the expected mutant genotyping for the three ES cell lines by the resulting
product band of 500 bp, similar to the band obtained for the positive KO control. In case of the WT
mouse, the resulting band size is 300 bp. Although the same amount of genomic DNA (70 ng) used in
all samples, a product band with lower intensity in the Cerl2-/- ES cells derived from the Embryo 1 is
evident. It could be caused by temporal degradation of the DNA sample or initial contamination that
was not determined by the spectrophotometer reading.
Figure 4.3: Mutant genotyping of the derived Cerl2-/- ES cells confirmed by PCR. Product bands with 500 bp size were
detected in the three lines of Cerl2-/- ES cells derived and, also, in the adult KO mouse used as positive control. In opposition,
the PCR product for the sample of the WT mouse resulted in a 300 bp band.
Then, a quickly and simply gender identification was also done by a PCR experiment. The male gender
identification resulted by the positive amplification of a specific region of the Sry gene classified as the
master regulator involved in early male phenotype (Polanco & Koopman, 2007). The product size is
247 bp and the results were visible through an existence of a band of this size, when ran in 1% agarose
gel. With this technique, it was possible to simply identify that two Cerl2-/- ES cell lines are male
(derived from Embryos 1 and 5) and the other one is female (derived from Embryo 6) (Figure 4.4). As
positive and negative controls, genomic DNA samples from two adult male mice and two adult female
mice were used. Again, to discard false amplifications, a PCR reaction control without DNA was used.
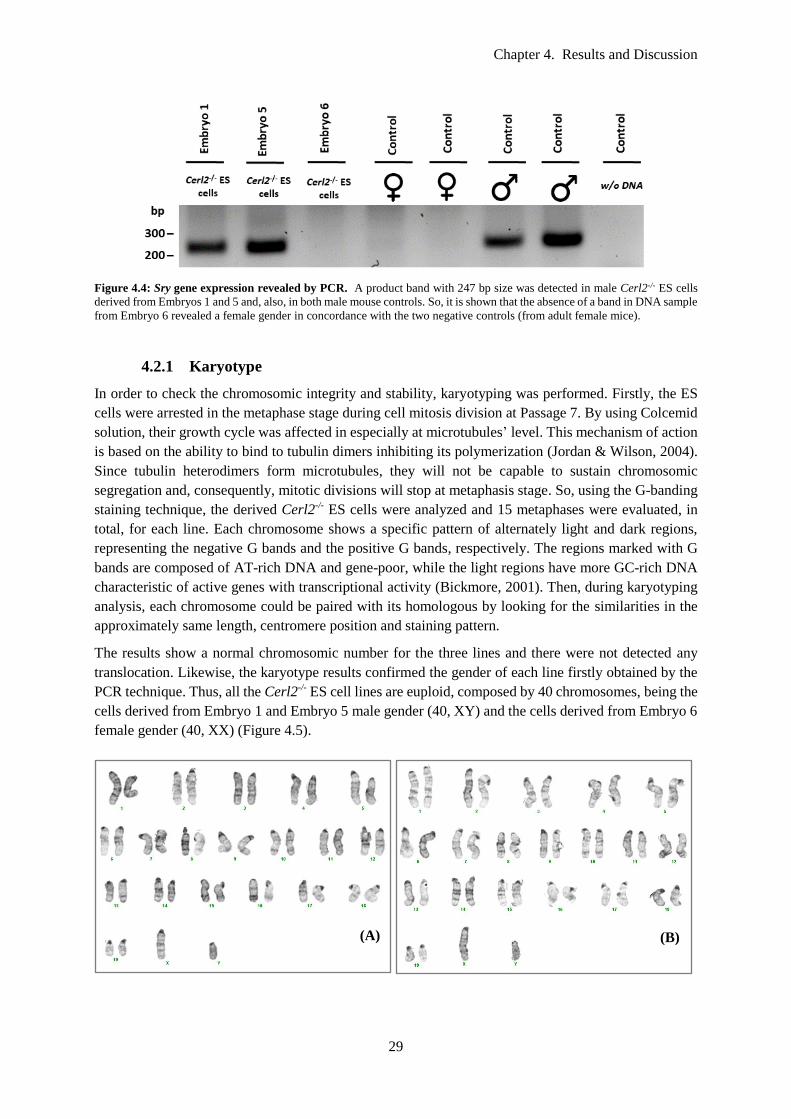
Chapter 4. Results and Discussion
29
Figure 4.4: Sry gene expression revealed by PCR. A product band with 247 bp size was detected in male Cerl2-/- ES cells
derived from Embryos 1 and 5 and, also, in both male mouse controls. So, it is shown that the absence of a band in DNA sample
from Embryo 6 revealed a female gender in concordance with the two negative controls (from adult female mice).
4.2.1 Karyotype
In order to check the chromosomic integrity and stability, karyotyping was performed. Firstly, the ES
cells were arrested in the metaphase stage during cell mitosis division at Passage 7. By using Colcemid
solution, their growth cycle was affected in especially at microtubules’ level. This mechanism of action
is based on the ability to bind to tubulin dimers inhibiting its polymerization (Jordan & Wilson, 2004).
Since tubulin heterodimers form microtubules, they will not be capable to sustain chromosomic
segregation and, consequently, mitotic divisions will stop at metaphasis stage. So, using the G-banding
staining technique, the derived Cerl2-/- ES cells were analyzed and 15 metaphases were evaluated, in
total, for each line. Each chromosome shows a specific pattern of alternately light and dark regions,
representing the negative G bands and the positive G bands, respectively. The regions marked with G
bands are composed of AT-rich DNA and gene-poor, while the light regions have more GC-rich DNA
characteristic of active genes with transcriptional activity (Bickmore, 2001). Then, during karyotyping
analysis, each chromosome could be paired with its homologous by looking for the similarities in the
approximately same length, centromere position and staining pattern.
The results show a normal chromosomic number for the three lines and there were not detected any
translocation. Likewise, the karyotype results confirmed the gender of each line firstly obtained by the
PCR technique. Thus, all the Cerl2-/- ES cell lines are euploid, composed by 40 chromosomes, being the
cells derived from Embryo 1 and Embryo 5 male gender (40, XY) and the cells derived from Embryo 6
female gender (40, XX) (Figure 4.5).
(A) (B)

Chapter 4. Results and Discussion
30
Figure 4.5: Karyograms of the derived Cerl2-/- ES cell lines, obtained by G-banding staining at Passage 7: (A) from
Embryo 1; (B) from Embryo 5; and (C) from Embryo 6.
4.2.2 Pluripotency Properties
To validate pluripotency properties of the derived cells, firstly protein expression was confirmed using
the immunofluorescence technique at Passage 5. At this stage, some inactivated MEFs were still present
in the mouse Cerl2-/- ES cell cultures, and they were used as a negative control, in this experiment,
because this type of cells does not express pluripotency markers. All ES cell colonies derived from
Embryo 1, Embryo 5 and Embryo 6 expressed stem cell positive nucleus markers – NANOG and OCT4
– and the surface marker SSEA-1 (Figure 4.6 and Appendix A1). These markers were similarly
expressed between the three lines, without a notorious difference in pluripotency properties. As a control
of cellular quantification, cells were stained with DAPI that exclusively marks DNA in the nucleus,
more specifically the A-T rich regions.
Comparing the merged staining images, it is noticed that some cells present outside of the colonies’
region do not show positive signal for the NANOG and OCT4 markers, being these nuclei of the mouse
fibroblasts. In the other side, in the case of a sporadic number of cells, localized at the colonies’ borders,
that do not express NANOG and OCT4 markers it is an indication of spontaneous differentiation and
start losing of pluripotency expression.
Then, the expression of pluripotency genes was tested by quantitative RT-PCR at Passage 6. Using this
technique, relative gene level for Nanog, Oct4 and Sox2 was evaluated for the Cerl2-/- ES cells for each
derived line. All gene expression levels are relative to RNA extracted from a stabilized ES cell line,
commercially named E14, and currently used in our Lab as a control line. It was selected for these
experiments and posterior ones as a control line according to its 129/Sv background, the same as the
Cerl2-/- ES cells, and its wild-type genotype. Also, RNA extracted from MEFs was used as a negative
control. All values were normalized using GAPDH gene as an endogenous control, because its
expression level does not diverge significantly between samples extracted from different types of cells.
GAPDH is considered a housekeeping gene, since it is involved in mechanisms that maintain basal
cellular functions such as glycosylation, so is expected that cells express it at a constant level (Eisenberg
& Levanon, 2013). The values of the relative mRNA expression, for each cell line, was calculated
considering the mean of Ct levels referred for each gene and normalized to the corresponding mean of
Ct levels for the GAPDH gene. The Ct values correspond to the cycle where the amplification curves
intersect the threshold line (Nolan et al., 2006). So, lower Ct values indicate a rapid amplification
reaction by the presence of high amounts of the target cDNA sample while higher Ct levels show time-
delayed cDNA amplification reactions, resulted by the lower or inexistent amount of the desired
nucleotide template (Nolan et al., 2006).
(C)

Chapter 4. Results and Discussion
31
Figure 4.6: Expression of NANOG, OCT4 and SSEA-1 in Cerl2-/- ES cells. Immunofluorescence analysis show positive
protein expression for the referred regulator markers of pluripotency in mouse Cerl2-/- ES cells derived from: (A) Embryo 1;
(B) Embryo 5; (C) Embryo 6. Scale bars: 20 µm.
It is notable a significant statistical difference between the relative gene levels for the mouse fibroblasts
compared with the Cerl2-/- ES cells from all the embryos (Figure 4.7). These results were the expected
because mouse fibroblast cells do not express these pluripotency genes. Relatively to the derived cells,
all the three lines show comparable or slight higher expression levels compared with the ES cells control
for all the endogenous pluripotency genes (Figure 4.7). This could be explained by existence of minor
genetic and epigenetic variations of the embryos from ES cell lines were derived or, even, slight
alterations during culturing (Allegrucci & Young, 2006). Despite of the protocol standardization, during
the first steps of ES cells’ derivation, even a small variation in temperature, CO2 values or disturbance
of the plates could lead to differences during the establishment of the cell lines.
(A) (B)
(C)

Chapter 4. Results and Discussion
32
Figure 4.7: Relative expression of Nanog, Oct4 and Sox2 of the derived mouse Cerl2-/- ES cells by qRT-PCR. Samples
were collected from Cerl2-/- ES cells of the three lines at P6 and the qRT-PCR experiments were performed in triplicate for
each one. The expression level of each pluripotency gene is represented relative to the referred E14 ES cell line, used as a
positive control. The one-way ANOVA test was used to compare the means of the various cell lines and statistical significant
differences where considered when ****P<0.0001.
4.2.3 Spontaneous Differentiation Capacity into the Three Germ Layers
Test the capacity of spontaneous differentiation in the three germ layers is a crucial validation step to
guarantee the pluripotency properties of the derived mouse Cerl2-/- ES cells (Czechanski et al., 2014).
To perform this, the cells were prepared in order to form embryoid bodies using the hanging drop
technique. During the first two days of the differentiation protocol (D0-D2), in static suspension culture,
the Cerl2-/- ES cells tend to aggregate to each other’s forming a spheroid body composed by several
layers of cells. Through cellular signaling, endoderm, mesoderm and ectoderm started to differentiate.
In this way, the resulted embryoid bodies show a homogeneity in the morphology shape and size
between the same line and compared to the embryoid bodies from the other two lines (Figure 4.8). This
is an important issue because significant differences between the size of the embryoid bodies could
influence the number and quality of the differentiated cells from the three germ layers or, even,
compromise the correct formation of one of them (Weitzer, 2006).
Using immunofluorescence microscopy, the presence of AFP, α-Actinin sarcomeric and Vimentin were
examined. The results show clearly the presence of the three mentioned markers, showing that some

Chapter 4. Results and Discussion
33
cells spontaneous differentiate to the endoderm lineage, positive marked with AFP, while others
differentiate to the cardiac lineage, positive marked with α-Actinin sarcomeric, and others differentiate
to the ectoderm lineage, positive marked with Vimentin (Figure 4.8). This could be compared with the
total number of cells in each montage by the nucleus’ staining with DAPI.
Thus, all the three lines show similar capability to differentiate into the lineage derivatives of the three
germ layers confirming the second key feature of pluripotency ability – the differentiation in all cell
lineages that compose an organism.
(A)
(B)
(C)
(D)

Chapter 4. Results and Discussion
34
Figure 4.8: Embryoid Bodies, formed from the derived Cerl2-/- ES cell lines, differentiate spontaneously into the three
germ layers. The ES cells were cultured in suspension and, at day 2 of differentiation, well-developed EBs were formed from:
(A) Embryo 1; (C) Embryo 5; and (E) Embryo 6. Scale bars: 100 μm. Then, at day 10 of differentiation, immunofluorescence
was performed to the EBs and the presence of AFP (endoderm), α-Actinin sarcomeric (mesoderm) and Vimentin (ectoderm)
markers was positively detected from: (B) Embryo 1; (D) Embryo 5; and (F) Embryo 6. Scale bars: 20 µm.
4.3 Differentiation into Cardiomyocytes
After the pluripotency properties and stability of the derived cell lines have been positively proved, they
could be used as a reliable model to study the role of Cerl2 behind cardiomyogenesis in vitro. Before
the implementation of the protocol for cardiac differentiation, it was necessary to reduce the
concentration of the MEK and GSK3 inhibitors used in the culture medium supplementation. This
occurred as a gradually reduction process, along various passages of the Cerl2-/- ES cells, to allow the
progressively adaptation of the cells to less amounts of the inhibitors and reduce the likelihood of abrupt
differentiation. So, in each passage, the concentration amounts of the 2i were reduced by half the
previous concentration value used. Then, Cerl2-/- ES cells were maintained in culture only with LIF
supplementation to prevent spontaneous differentiation. The described system was chosen in order to
avoid the possibility of extension of the Wnt and other signaling pathways, that mediate the pluripotency
stage, during the differentiation protocol. Recently, it was demonstrated that when mouse pluripotent
cells are cultured in the 2i system for prolonged time, their epigenetic and genomic stability undergoes
irreversible changes leading to commitment of their normal development potential (Choi et al., 2017).
Consequently, this was carefully considered during the design of the differentiation experiments and the
two chemical inhibitors were used only for short-period of time.
The cardiac differentiation experiments were performed only for one Cerl2-/- ES cell line in parallel with
the WT ES cell line (E14). The KO ES cells derived from Embryo 1 were the chosen ones to serve as
the in vitro disease model taking in consideration the following motives: it is a male gender line,
commonly preferred in studies of gene targeting, because of the presence of all the existing
chromosomes in the mouse species; and it demonstrate to have better colonies’ morphology, under an
inverted microscope, along various passages (Shah et al., 2014). Before starting the cardiac
differentiation studies, both KO and WT ES cells were maintained and passaged at least twice without
2i supplementation. The morphology was daily monitored and it was verified a slight pointy change in
(E)
(F)

Chapter 4. Results and Discussion
35
the KO colonies’ boundaries compared to the morphology shown during initial derivation steps as well
as some uncontrolled differentiation events (Figure 4.9). The differentiated cells could be distinguished
from the compacted ES cell’ colonies by looking for its elongated morphology and single position.
However, this was expected according to a lower native pluripotent stage caused by the withdrawal of
the 2i chemicals.
Figure 4.9: Morphology of: (A) KO and (B) WT ES cell lines at day 0 of the differentiation protocol. The ES cells at this
stage were cultured without 2i supplementation, showing some events of spontaneous differentiation represented by the black
arrows. However, this was a normal consequence of the progressively adaptation of the cells to the absence of the chemical
inhibitors. Scale bars: 100 μm.
The differentiation of pluripotent KO and WT cells into mature cardiomyocytes was induced by the
hanging drop method leading to the Embryoid Bodies’ formation. This protocol was performed in three
independent experiments. Through a spontaneous differentiation process, along 10 days, cardiac cells
were originated with observable rhythmic beating foci. Firstly, cells’ suspension without LIF was
pipetted in a specific and comparable concentration (500 cells per drop) in each Petri dish for the KO
and WT ES cell lines. Within 48 hours, ES cells were capable to aggregate in 3D structures through
stochastic events stimulated by the gravity effect (Figure 4.10) (Kurosawa, 2007). Then, the formed EBs
were maintained in suspension culture until day 5 of differentiation, to allow its size growing, to
stimulates the specific differentiation of their cell layers into each specific germ layer lineage and,
consequently, leads to their surface smoothness. The evolution on size and shape of EBs were daily
monitored in order to control the progression of the differentiation protocol and discard cases in which
two or more EBs tend to aggregate when too close together, forming a single deformed and large
structure. This constant control is decisive because when this occur, the abnormal EBs did not proliferate
and differentiate as expected and cell’s death phenomena are increased (Rungarunlert et al., 2009). With
a reduction in the EBs viability, apoptosis signals are released and could induce slightly changes in the
neighbor EBs affecting the efficiency of cardiomyogenesis (Rungarunlert et al., 2009).
(A) (B)

Chapter 4. Results and Discussion
36
Figure 4.10: Morphology of the derived: (A) KO and (B) WT EBs at day 2 of the differentiation protocol. All the EBs
showed a round shape, with irregular surface protrusions. Scale bars: 100 μm.
At day 5 of differentiation, the KO and WT EBs were plated onto gelatin-coated 6-well plates. In each
well, an equal number of EBs were plated to perform a normalized comparison between cardiac
mesoderm differentiation capacity from the KO and the control lines. Once again, the adherence and
cells’ spread to the plate’ surfaces were monitored every day. During days 6-10, it was notorious a
significant difference in the adhesion capacity between the EBs derived from the KO and the control
lines (Figure 4.11). In the case of the Cerl2 mutants, the rate of cells’ adhesion was higher and it was
observable that the EBs’ bodies do not disperse in the plate’s surface as much as the control ones (Figure
4.11 – A). They continue to grow, until the end of the protocol, mainly as a compact body with slightly
regions composed by dispersed cell’ layers.
Figure 4.11: Morphology of: (A) three KO EBs and (B) one WT EB at day 10 of the differentiation protocol. It is
notorious a significant difference in the adhesion capacity between the mutant and the control lines. Scale bars: 100 μm.
Interestingly, beating foci areas started to be prior visible in the KO differentiated cells. At day 6, their
contractile movements were notorious in all the plated EBs at different rhythmic rates, like as in vivo
(Wobus et al., 1991). In the case of the control line, the beating foci areas start to show contractile
movements only between day 7 and day 8 in sporadic number of EBs. From day 6 until day 10 of the
differentiation, the number of beating foci were counted, under an inverted microscope, for the KO and
WT lines.
In the three cardiac differentiation experiments were observed the same mentioned alterations between
the KO and WT cells. Performing the statistical analysis to the counted contractile areas, it was revealed
that each KO EB originates the double of beating foci areas compared to the WT EBs along the entire
(A) (B)
(A) (B)
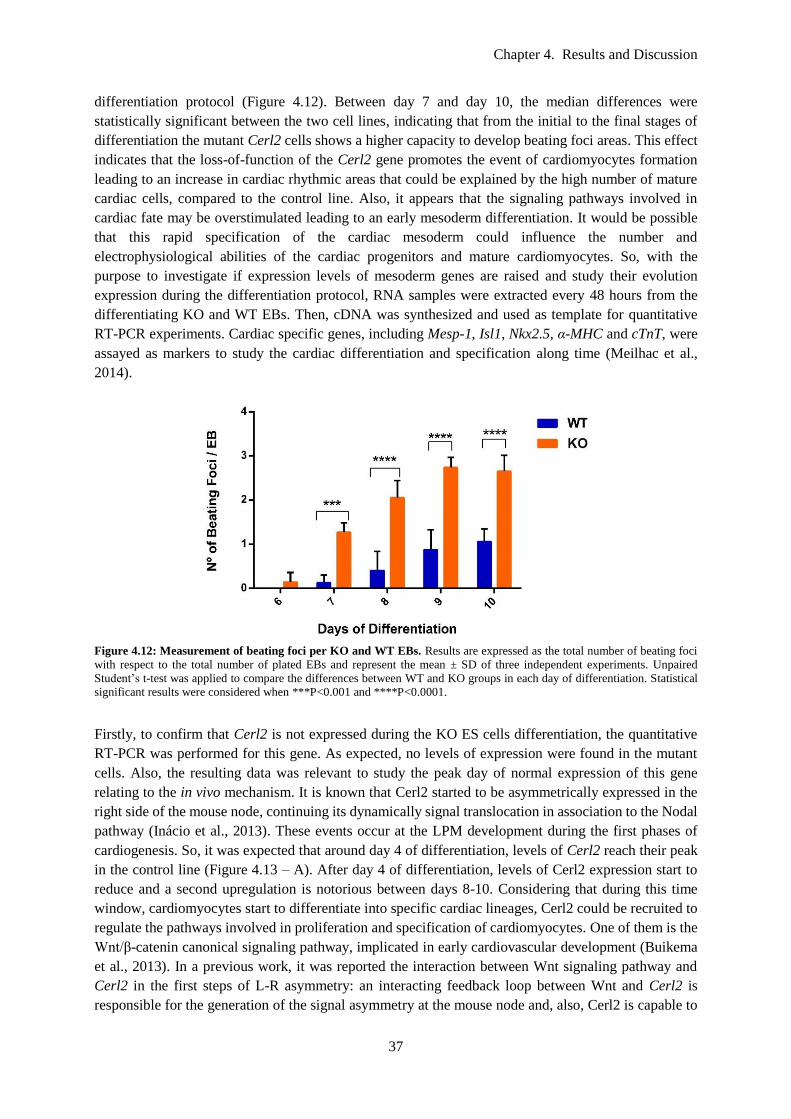
Chapter 4. Results and Discussion
37
differentiation protocol (Figure 4.12). Between day 7 and day 10, the median differences were
statistically significant between the two cell lines, indicating that from the initial to the final stages of
differentiation the mutant Cerl2 cells shows a higher capacity to develop beating foci areas. This effect
indicates that the loss-of-function of the Cerl2 gene promotes the event of cardiomyocytes formation
leading to an increase in cardiac rhythmic areas that could be explained by the high number of mature
cardiac cells, compared to the control line. Also, it appears that the signaling pathways involved in
cardiac fate may be overstimulated leading to an early mesoderm differentiation. It would be possible
that this rapid specification of the cardiac mesoderm could influence the number and
electrophysiological abilities of the cardiac progenitors and mature cardiomyocytes. So, with the
purpose to investigate if expression levels of mesoderm genes are raised and study their evolution
expression during the differentiation protocol, RNA samples were extracted every 48 hours from the
differentiating KO and WT EBs. Then, cDNA was synthesized and used as template for quantitative
RT-PCR experiments. Cardiac specific genes, including Mesp-1, Isl1, Nkx2.5, α-MHC and cTnT, were
assayed as markers to study the cardiac differentiation and specification along time (Meilhac et al.,
2014).
Figure 4.12: Measurement of beating foci per KO and WT EBs. Results are expressed as the total number of beating foci
with respect to the total number of plated EBs and represent the mean ± SD of three independent experiments. Unpaired
Student’s t-test was applied to compare the differences between WT and KO groups in each day of differentiation. Statistical
significant results were considered when ***P<0.001 and ****P<0.0001.
Firstly, to confirm that Cerl2 is not expressed during the KO ES cells differentiation, the quantitative
RT-PCR was performed for this gene. As expected, no levels of expression were found in the mutant
cells. Also, the resulting data was relevant to study the peak day of normal expression of this gene
relating to the in vivo mechanism. It is known that Cerl2 started to be asymmetrically expressed in the
right side of the mouse node, continuing its dynamically signal translocation in association to the Nodal
pathway (Inácio et al., 2013). These events occur at the LPM development during the first phases of
cardiogenesis. So, it was expected that around day 4 of differentiation, levels of Cerl2 reach their peak
in the control line (Figure 4.13 – A). After day 4 of differentiation, levels of Cerl2 expression start to
reduce and a second upregulation is notorious between days 8-10. Considering that during this time
window, cardiomyocytes start to differentiate into specific cardiac lineages, Cerl2 could be recruited to
regulate the pathways involved in proliferation and specification of cardiomyocytes. One of them is the
Wnt/β-catenin canonical signaling pathway, implicated in early cardiovascular development (Buikema
et al., 2013). In a previous work, it was reported the interaction between Wnt signaling pathway and
Cerl2 in the first steps of L-R asymmetry: an interacting feedback loop between Wnt and Cerl2 is
responsible for the generation of the signal asymmetry at the mouse node and, also, Cerl2 is capable to

Chapter 4. Results and Discussion
38
inhibit the Wnt self-activating loop (Nakamura et al., 2012). Thus, in view of the second increase in
Cerl2 levels it may be possible that Wnt pathway and Cerl2 could be connected again during the cardiac
cells proliferation.
Relative Mesp-1 mRNA expression was found in the EBs at day 4 of differentiation, in both lines. The
high levels of expression are consistent with the period of cardiac mesoderm formation. When correlated
to the in vivo cardiogenesis, Mesp-1 proteins start to be recruited to the mouse primitive streak at E6.5
(Meilhac et al., 2014). Its expression is observed transiently during the phase of mesoderm formation,
consequently marking all the cardiac progenitors regardless of their future lineage specification
(Meilhac et al., 2014). It was found that the KO cells show a statistically significant higher level of
Mesp-1 expression, relatively to the WT cells (Figure 4.13 – B). This data suggests that in the absence
of Cerl2, ES cells demonstrated to have an increased capacity for mesoderm formation towards the
Mesp-1 cardiogenic mesoderm lineage. Also, it suggests the production of a higher number of cardiac
progenitors by the Cerl2-/- ES cells, resulted in a superior number of Mesp-1 mRNA templates available
during the reactions of amplification in real-time. The quickly amplification leads to lower Ct values
resulting in higher levels of relative Mesp-1 expression for the KO EBs.
The First Heart Field progenitors can be identified through the positive expression marker of Nkx2.5
gene. This first cardiac lineage contributes primarily to the formation of the linear heart tube and
ultimately to the origin of the mature cardiac cells that will populate the left ventricle (Buckingham et
al., 2005). This heart chamber can be structurally and morphologically affected by slightly perturbances
in the normal development of the FHF cell lineage. Prior investigations demonstrated the myocardium
enlargement of the left ventricle walls in the Cerl2 KO mice caused by cardiomyocytes’ hyperplasia
(Araújo et al., 2014). Correlating these facts, it would be possible that an increase of the Nkx2.5
expression during mouse cardiogenesis could coincide with the origin of a higher number of FHF
progenitors capable to form a robust myocardium tissue, comparatively to control levels. Indeed, in the
quantitative RT-PCR results, Nkx2.5 is upregulated in the differentiated Cerl2-/- ES cells (Figure 4.13 –
C). At day 6, its levels increased significantly marking the stage of cells’ commitment into the first
myocardial lineage. In addition, levels of Isl1 expression increased substantially at day 4, reaching the
peak at day 6 for the mutant and the control lines. Second Heart Field cells are often identified by the
positive expression of Isl1 being these cells the late cardiac progenitors for myocardial, endothelial and
smooth muscle cells (Moretti et al., 2006). Comparing the relative levels of Isl1 expression at day 6, the
differentiation of Cerl2-/- ES cells leads to statistically higher levels of gene expression compared to the
control line (Figure 4.13 – D). Once again, these results corroborate the hypothesis that loss-of-function
of Cerl2 gene increases proliferation of cardiomyocytes explained by a higher production of SHF
progenitor cells. Curiously, it is verified that even in the last days of differentiation relative Isl1
expression was maintained in similar high levels. This could be an indicator of an incomplete mechanism
of cardiomyocytes’ differentiation and, consequently, their phenotypic maturation could be affected.
Then, to investigate the functionality state of cardiomyocytes’ maturation, levels of α-MHC and cTnT
expression were quantified. Myosin is the principal protein that contribute to the generation of the
contractile movements during heart function, through mediation of ATP molecules (Ng et al., 2010).
Among its constituent elements, its structure is composed by two myosin heavy chains (MHC). During
the early mouse development, the expression of α-MHC start to be evident in the cardiac crescent with
progressing augmented levels throughout the heart tube structure (Brade et al., 2013). Considering the
qRT-PCR results, it was identified a significant alteration for the α-MHC gene expression since day 6
until day 10 of the differentiation protocol (Figure 4.13 – E). It is evident a statistical difference between
the relative expression levels of the two differentiated cell lines, mainly at day 10: the Cerl2-/-
cardiomyocytes revealed upregulation of this structural protein. This data could be a consequence of an
intensified stimulation of KO cardiomyogenesis resulted from the loss-of-function of Cerl2. On the other

Chapter 4. Results and Discussion
39
hand, it is known that cTnT is one of the principal regulatory proteins capable to control the ionic Ca2+
variations and anchor the other troponin components, essential for myocardium contraction (Nishii et
al., 2008). Also, its roles are related to the assembly of sarcomeres’ structure capable to influence the
systolic and diastolic functions (Tardiff et al., 1999). Analysis of the cTnT expression revealed decreased
levels in the differentiated Cerl2-/- ES cells at day 10, comparatively with the WT cells (Figure 4.13 –
F). The results indicate a possible structural commitment of the derived Cerl2-/- cardiomyocytes
characterized by a reduced number of cTnT proteins at the sarcomeres level. This is in agreement with
prior results that demonstrated a decrease in cTnT expression in the mutant mouse embryos at E13 and
E15 (Araújo et al., 2014).
Previously, cyclins and cyclin-dependent kinase (CDKs) were defined as regulatory molecules during
embryonic cardiomyocytes division (Ikenishi et al., 2012). During this development process, it was
reported that the Wnt/β-catenin pathway is capable to interfere in the proliferation capacity, mainly in
the ventricular cardiomyocytes (Buikema et al., 2013). The recruitment of Ccnd1 and Ccnd2 (Cyclin D1
and Cyclin D2) proteins is one of the key source of the cardiac cell cycle. With the purpose to study if
there is a change in the number of mitotic events, levels of Ccnd1 were tested. Only this cell cycle
regulator was tried, considering that in previous results only upregulated levels of Ccnd1 were found in
left ventricular cardiomyocytes from the mutant Cerl2 neonatal mice (Araújo et al., 2014). In the present
data, a statistical increase of Ccnd1 was only found in the Cerl2-/- cells at day 10 (Figure 4.13 – G). An
increase in Ccdn1 expression in the differentiated Cerl2-/- ES cells could explain the high number of
derived-cardiomyocytes. Perhaps, the Wnt signaling pathway is altered in the absence of Cerl2 proteins
demonstrated by the increased in Ccdn1 expression levels, considering that is one of its target genes.
Furthermore, to confirm the present data, it will be necessary to perform Flow Cytometry experiments
to the differentiated Cerl2-/- ES cell populations. Using this technique, it is possible to have a reliable
quantitative result related to the number of derived cardiac progenitor cells and cardiomyocytes.
However, due to time issues it was not possible to perform these experiences in order to confirm the
results obtained so far.

Chapter 4. Results and Discussion
40
Figure 4.13: Relative mRNA expression of cardiac genes in Cerl2-/- and WT differentiated cells. qRT-PCR experiments
were performed in triplicate for (A) Cerl2, (B) Mesp-1, (C) Nkx2.5, (D) Isl1, (E) α-MHC, (F) cTnT, (G) Ccnd1. Results are
represented as mean ± SD of three independent biological experiments. Unpaired Student’s t-test was applied to compare the
(A) (B)
(C) (D)
(G)
(E) (F)

Chapter 4. Results and Discussion
41
differences between WT and KO groups in each day of differentiation. Statistical significant results were considered when
*P<0.05 and ****P<0.0001.
Chapter 5. Conclusions and Future Perspectives
42
Conclusions and Future Perspectives
The generation of cardiomyocytes through differentiation of ES cells demonstrate to have several
applications in the scientific field. During the last decades, mutant ES cells have been used as disease
models to study specificities and uncover the biological mechanisms that lead to the origin of congenital
heart diseases (Habib et al., 2008) (Dambrot et al., 2011). Exploring their abilities to differentiate in all
the cell lineages of the mammalian organism, it is possible to mimic in vitro the first stages of
embryogenesis and follow important molecules. One of the central step is the establishment of the L-R
asymmetric morphogenesis of the organs, which will influence the subsequent mechanisms during
cardiogenesis.
The Cerl2 gene, member of the Cerberus/Dan family, encodes for a protein capable to regulate Nodal
with an important role in the L-R axis establishment (Marques et al., 2004). The proper positioning of
the heart and great vessels in the rib cage is intimately dependent of its regulation activity on Nodal
signaling pathway. When loss-of-function of Cerl2 is verified, the resulted mutant phenotype is
described by congenital laterality disorders (Marques et al., 2004). Previously, studies performed in
Cerl2-/- mice demonstrated that these animals have a compromise in cardiac electrophysiology with an
associated significant mortality rate within a few hours after birth (Araújo et al., 2014) (Marques et al.,
2004). Also, an enlargement on the ventricular walls was observed allied with an increase in mitotic
index of cardiomyocytes.
In the present Dissertation, with the purpose to discover if Cerl2 is involved in the mechanisms that
control proliferation and differentiation of cardiomyocytes during the first stages of life, three Cerl2-/-
ES cell lines were derived and characterized to serve as a heart disease model. For this, blastocysts were
collected from the Cerl2 knockout mice after three days of pregnancy. Performing the standard
protocols, it was demonstrated that the derived lines show a stable karyotype, are capable to maintain
unlimited capacity to self-renew, by expression of Nanog, Oct4, Sox2 and SSEA1 pluripotency genes,
and can originate the three primordial germ layers. Then, the hypothesis of alteration in cardiac
mesoderm induction was tested using the protocol of EBs formation to differentiate the Cerl2-/- ES cells.
During the differentiation experiments, it was observed an early appearance of beating foci areas in a
high number, compared to the control line. Also, in the mutant cells, the adhesion capacity was
compromised showed by the compact growing of the EBs through the culture plate surface. These results
demonstrate that mesoderm differentiation is overstimulated resulting in the early appearance of
contractile areas associated with an increased number of them. Also, the obvious increase in adhesion
capacity could be caused by this rapid cardiac mesoderm formation that could influence the
differentiation capability of endoderm or ectoderm. Taking into account that primitive endoderm is the
first cells’ layer of the EBs to attached and spread to the plate surface, it could be possible that this germ
layer is the most compromised. In future work, it will be important to perform immunofluorescence tests
to check E-cadherin expression. Using this marker, it will be possible to investigate if cell-cell adhesion,
proliferation and/or mobility are altered during germ layers’ differentiation (Maître & Heisenberg,
2013).

Chapter 5. Conclusions and Future Perspectives
43
Concerning the expression of cardiac genes during the Cerl2-/- ES cells differentiation, it was observed
an upregulation of Mesp-1, Isl1 and Nkx2.5. Once again, these data demonstrate that cardiac mesoderm
differentiation is highly stimulated in case of Cerl2 loss-of-function. Also, the high levels of relative
Isl1 and Nkx2.5 expression revealed that the production of cardiac progenitors, derived from the First
and Second Heart Fields, could be increased. The upregulation of Nkx2.5, at day 6 of differentiation, is
a suggestion of a high number of FHF progenitors that could explain the robust myocardium of the left
ventricles’ walls observed in the Cerl2-/- mice. Also, alterations in levels of expression of genes essential
for proper cardiomyocytes contraction (α-MHC and cTnT) were observed. If the loss-of-function of
Cerl2 leads to an increase in production of cardiac progenitor cells, it will be expected that more mature
cardiomyocytes are produced. Indeed, high levels of relative α-MHC expression were detected in the
knockout cells leading to the possibility of a high number of derived-cardiomyocytes. However,
decreased levels of cTnT expression were found in the differentiated Cerl2-/- ES cells. These data
indicate that the produced cardiomyocytes were not fully mature possible resulted from a commitment
in cTnT proteins that compose their sarcomeres structure. A statistical significant difference was
observed, at day 10 of differentiation, for levels of Ccdn1 expression between the mutant and the control
lines. An increase in Ccdn1 expression in the differentiated Cerl2-/- ES cells could explain the high
number of derived-cardiomyocytes. According to the cell cycle regulator role of Ccdn1, its upregulation
could be translated in a high number of mitotic divisions for cardiomyocytes (Ikenishi et al., 2012). Still,
Ccdn1 is one of the Wnt canonical signaling target genes, being this pathway involved in early
cardiovascular development (Buikema et al., 2013). Perhaps, the Wnt signaling pathway is altered in
the absence of Cerl2 proteins demonstrated by the increased in one of its target molecules. In order to
clearly prove that the loss-of-function of Cerl2 leads to an improvement in the cardiomyocytes
production, it is crucial to analyze, in the future, the differentiated Cerl2-/- ES cell populations using
Flow Cytometry experiments. Using this technique, it is possible to have a reliable quantitative result
related to the number of derived cardiac progenitor cells and cardiomyocytes. In addition, it will be
relevant to perform proliferation assays to assess the proliferation capacity of the Cerl2-/- derived-
cardiomyocytes by performing a BrdU labelling assay.
This project also revealed the normal temporal changes in the expression levels of Cerl2 throughout the
cardiac differentiation protocol. In the control line, the differentiated ES cells demonstrated a high
expression of Cerl2 at day 4, corresponding to the in vivo stage when its proteins are recruited to direct
Nodal proteins and maintain the normal Nodal flow during the L-R axis patterning. Still, it was notorious
a second upregulation at the end of the differentiation protocol. This data could indicate that Cerl2 is
also promoted to regulate cardiac lineage fate and proliferation. A previous study reported feedback
loops interlinking the Wnt signaling pathway and Cerl2 capable to generate together the L-R asymmetry
at the mouse node and revealed the capacity of Cerl2 in inhibition of the Wnt self-activating loop
(Nakamura et al., 2012). Thus, in view of the second increase in Cerl2 levels it may be possible that Wnt
pathway and Cerl2 could be connected during the cardiac cells proliferation. In the case of mutation in
the Cerl2 gene, Wnt signaling pathway could be prolonged also explained by the increased levels of
Ccdn1. However, further experiments need to be performed to confirm the possible role of Cerl2 as a
regulator of Wnt canonical signaling.
As final conclusions, the present Dissertation uncovers the first insights related to the Cerl2 role as a
possible regulator of the mechanisms involved in specification of the produced number of cardiac cells
during mouse cardiomyogenesis.

References
44
References
Allegrucci, C., & Young, L. E. (2006). Differences between human embryonic stem cell lines. Human
Reproduction Update, 13(2), 103–120.
Araújo, A. C., Marques, S., & Belo, J. A. (2014). Targeted inactivation of cerberus like-2 leads to left
ventricular cardiac hyperplasia and systolic dysfunction in the mouse. PLoS ONE, 9(7), 1-12.
Aubert, J., Dunstan, H., Chambers, I., & Smith, A. (2002). Functional gene screening in embryonic stem
cells implicates Wnt antagonism in neural differentiation. Nature Biotechnology, 20(12), 1240–
1245.
Avilion, A. A., Nicolis, S. K., Pevny, L. H., Perez, L., Vivian, N., & Lovell-Badge, R. (2003).
Multipotent cell lineages in early mouse development on SOX2 function. Genes Dev., 17, 126–
140.
Bai, F., Ho Lim, C., Jia, J., Santostefano, K., Simmons, C., Kasahara, H., Wu, W., Terada, N., & Jin, S.
(2015). Directed Differentiation of Embryonic Stem Cells Into Cardiomyocytes by Bacterial
Injection of Defined Transcription Factors. Scientific Reports, 5(15014), 1-19.
Batlle-Morera, L., Smith, A., & Nichols, J. (2008). Parameters influencing derivation of embryonic stem
cells from murine embryos. Genesis, 46(12), 758–767.
Beddington, R. S. P., & Robertson, E. J. (1999). Axis development and early asymmetry in mammals.
Cell, 96(2), 195–209.
Belo, J. A., Silva, A. C., Borges, A. C., Filipe, M., Bento, M., Gonçalves, L., Vitorino, M., Salgueiro,
A., Teixeira, V., Tavares, A. T., & Marques, S. (2009). Generating asymmetries in the early
vertebrate embryo : the role of the Cerberus-like family. International Journal of Developmental
Biology, 53, 1399–1407.
Bergmann, O., Bhardwaj, R. D., Bernard, S., Zdunek, S., Barnabé-Heider, F., Walsh, S., Zupicich, J.,
Alkass, K., Buchholtz, B. A., Druid, H., Jovinge, S., & Frisén, J. (2009). Evidence for
cardiomyocyte renewal in humans. Science, 324(5923), 98–102.
Bergmann, O., Zdunek, S., Felker, A., Salehpour, M., Alkass, K., Bernard, S., Sjostrom, S. L.,
Szewczykowska, M., Jackowska, T., dos Remedios, C., Malm, T., Andrã, M., Jashari, R.,
Nyengaard, J. R., Possnert, G., Jovinge, S., Druid, H., & Frisén, J. (2015). Dynamics of Cell
Generation and Turnover in the Human Heart. Cell, 161(7), 1566–75.
Bickmore, W. A. (2001). Karyotype Analysis and Chromosome Banding. In Nature (Ed.), Encyclopedia
of Life Sciences (pp. 1–7). Chichester, UK: John Wiley & Sons, Ltd.
Boheler, K. R., Czyz, J., Tweedie, D., Yang, H. T., Anisimov, S. V., & Wobus, A. M. (2002).
Differentiation of pluripotent embryonic stem cells into cardiomyocytes. Circulation Research,
91(3), 189–201.
Bolli, R., Chugh, A. R., D’Amario, D., Loughran, J. H., Stoddard, M. F., Ikram, S., … & Anversa, P.
(2011). Cardiac stem cells in patients with ischaemic cardiomyopathy (SCIPIO): initial results of

References
45
a randomised phase 1 trial. The Lancet, 378(9806), 1847–1857.
Bondue, A., Lapouge, G., Paulissen, C., Semeraro, C., Iacovino, M., Kyba, M., & Blanpain, C. (2008).
Mesp1 acts as a master regulator of multipotent cardiovascular progenitor specification. Cell Stem
Cell, 3(1), 69–84.
Bouwmeester, T., Kim, S., Sasai, Y., Lu, B., & De Robertis, E. M. (1996). Cerberus is a head-inducing
secreted factor expressed in the anterior endoderm of Spemann’s organizer. Nature, 382(6592),
595-601.
Brade, T., Pane, L. S., Moretti, A., Chien, K. R., & Laugwitz, K. L. (2013). Embryonic heart progenitors
and cardiogenesis. Cold Spring Harbor Perspectives in Medicine, 3(10), 1-17.
Brand, T. (2003). Heart development: Molecular insights into cardiac specification and early
morphogenesis. Developmental Biology, 258(1), 1–19.
Braunwald, E., & Pfeffer, M. A. (1991). Ventricular enlargement and remodeling following acute
myocardial infarction: mechanisms and management. The American Journal of Cardiology,
68(14), 1D–6D.
Buckingham, M., Meilhac, S., & Zaffran, S. (2005). Building the mammalian heart from two sources of
myocardial cells. Nature Reviews Genetics, 6, 826–835.
Buikema, J. W., Mady, A. S., Mittal, N. V, Atmanli, A., Caron, L., Doevendans, P. A., Sluijter, J. P. G.,
& Domian, I. J. (2013). Wnt/β-catenin signaling directs the regional expansion of first and second
heart field-derived ventricular cardiomyocytes. Development, 140(20), 4165–4176.
Bustin, S. A. (2000). Absolute quantification of mrna using real-time reverse transcription polymerase
chain reaction assays. Journal of Molecular Endocrinology, 25(2), 169–193.
Cai, C. L., Liang, X., Shi, Y., Chu, P. H., Pfaff, S. L., Chen, J., & Evans, S. (2003). Isl1 identifies a
cardiac progenitor population that proliferates prior to differentiation and contributes a majority of
cells to the heart. Developmental Cell, 5(6), 877–889.
Cambria, E., Steiger, J., Günter, J., Bopp, A., Wolint, P., Hoerstrup, S. P., & Emmert, M. Y. (2016).
Cardiac Regenerative Medicine: The Potential of a New Generation of Stem Cells. Transfusion
Medicine and Hemotherapy, 43(4), 275–281.
Capecchi, M. R. (2005). Gene targeting in mice: functional analysis of the mammalian genome for the
twenty-first century. Nature Reviews. Genetics, 6(6), 507–512.
Chambers, I., Colby, D., Robertson, M., Nichols, J., Lee, S., Tweedie, S., & Smith, A. (2003). Functional
expression cloning of Nanog, a pluripotency sustaining factor in embryonic stem cells. Cell,
113(5), 643–655.
Choi, J., Huebner, A. J., Clement, K., Walsh, R. M., Savol, A., Lin, K., … & Hochedlinger, K. (2017).
Prolonged Mek1/2 suppression impairs the developmental potential of embryonic stem cells.
Nature, 1, 1–7.
Chugh, A. R., Beache, G. M., Loughran, J. H., Mewton, N., Elmore, J. B., Kajstura, J., … & Bolli, R.
(2012). Administration of Cardiac Stem Cells in Patients With Ischemic Cardiomyopathy: The
SCIPIO Trial: Surgical Aspects and Interim Analysis of Myocardial Function and Viability by
Magnetic Resonance. Circulation, 126(11_suppl_1), S54–S64.
Cong, L., Ran, F. A., Cox, D., Lin, S., Barretto, R., Hsu, P. D., … & Marraffini, L. A. (2013). Multiplex

References
46
Genome Engineering Using CRISPR/VCas Systems. Science, 339(6121), 819–823.
Conlon, F. L., Lyons, K. M., Takaesu, N., Barth, K. S., Kispert, A., Herrmann, B., & Robertson, E. J.
(1994). A primary requirement for nodal in the formation and maintenance of the primitive streak
in the mouse. Development, 120, 1919–1928.
Coulombe, K. L. K., Bajpai, V. K., Andreadis, S. T., & Murry, C. E. (2014). Heart regeneration with
engineered myocardial tissue. Annual Review of Biomedical Engineering, 16, 1–28.
Cristo, F., Inácio, J. M., de Almeida, S., Mendes, P., Martins, D. S., Maio, J., Anjos, R., & Belo, J. A.
(2017). Functional study of DAND5 variant in patients with Congenital Heart Disease and
laterality defects. BMC Medical Genetics, 18(1), 1-9.
Cui, L. (2004). Spatial Distribution and Initial Changes of SSEA-1 and Other Cell Adhesion-related
Molecules on Mouse Embryonic Stem Cells Before and During Differentiation. Journal of
Histochemistry and Cytochemistry, 52(11), 1447–1457.
Czechanski, A., Byers, C., Greenstein, I., Schrode, N., Donahue, L. R., Hadjantonakis, A.-K., &
Reinholdt, L. G. (2014). Derivation and characterization of mouse embryonic stem cells from
permissive and nonpermissive strains. Nature Protocols, 9(3), 559–74.
Czubryt, M. P. (2012). Common threads in cardiac fibrosis, infarct scar formation, and wound healing.
Fibrogenesis & Tissue Repair, 5(1), 1-11.
Dambrot, C., Passier, R., Atsma, D., & Mummery, C. L. (2011). Cardiomyocyte differentiation of
pluripotent stem cells and their use as cardiac disease models. The Biochemical Journal, 434(1),
25–35.
Davidson, B. P., & Tam, P. P. L. (2000). The node of the mouse embryo. Current Biology, 10(17), 617–
619.
Desbaillets, I., Ziegler, U., Groscurth, P., & Gassmann, M. (2000). Embryoid bodies: an in vitro model
of mouse embryogenesis. Experimental Physiology, 85(6), 645–651.
Ding, J., Yang, L., Yan, Y. T., Chen, A., Desai, N., Wynshaw-Boris, A., & Shen, M. M. (1998). Cripto
is required for correct orientation of the anterior-posterior axis in the mouse embryo. Nature,
395(6703), 702–707.
Doetschman, T. C., Eistetter, H., Katz, M., Schmidt, W., & Kemler, R. (1985). The in vitro development
of blastocyst-derived embryonic stem cell lines: formation of visceral yolk sac, blood islands and
myocardium. Journal of Embryology and Experimental Morphology, 87, 27–45.
Eisenberg, E., & Levanon, E. Y. (2013). Human housekeeping genes, revisited. Trends in Genetics,
29(10), 569–574.
Evans, M. J., & Kaufman, M. H. (1981). Establishment in culture of pluripotential cells from mouse
embryos. Nature, 292(5819), 154-156.
Fallis, A. . (2010). Immunocytochemical Methods and Protocols. Journal of Chemical Information and
Modeling, 588(9), 1689–1699.
Fisher, S. A., Doree, C., Mathur, A., & Martin-Rendon, E. (2015). Meta-analysis of cell therapy trials
for patients with heart failure. Circulation Research, 116(8), 1361–1377.
Fliegauf, M., Benzing, T., & Omran, H. (2007). When cilia go bad: cilia defects and ciliopathies. Nature

References
47
Reviews. Molecular Cell Biology, 8(11), 880–93.
Fujinaga, M. (1997). Development of sidedness of asymmetric body structures in vertebrates.
International Journal of Developmental Biology, 41(2), 153–186.
Galdos, F. X., Guo, Y., Paige, S. L., VanDusen, N. J., Wu, S. M., & Pu, W. T. (2017). Cardiac
Regeneration. Circulation Research, 120(6), 941–959.
Habib, M., Caspi, O., & Gepstein, L. (2008). Human embryonic stem cells for cardiomyogenesis.
Journal of Molecular and Cellular Cardiology, 45(4), 462–474.
Hall, B., Limaye, A., & Kulkarni, A. B. (2009). Overview: Generation of Gene Knockout Mice. Current
Protocols in Cell Biology, (SUPPL. 44), 1–17.
Hamada, H., Meno, C., Saijoh, Y., Adachi, H., Yashiro, K., Sakuma, R., & Shiratori, H. (2001). Role
of asymmetric signals in left-right patterning in the mouse. American Journal of Medical Genetics,
101(4), 324–327.
Hamilton, W. B., & Brickman, J. M. (2014). Erk Signaling Suppresses Embryonic Stem Cell Self-
Renewal to Specify Endoderm. Cell Reports, 9(6), 2056–2070.
Hanna, J., Markoulaki, S., Mitalipova, M., Cheng, A. W., Cassady, J. P., Staerk, J., … & Jaenisch, R.
(2009). Metastable Pluripotent States in NOD Mouse Derived ES Cells. Cell Stem Cell, 4(6), 513–
524.
Harvey, R. P. (1998). Links in the Left / Right Axial Pathway. Cell Press, 94, 273–276.
Ikenishi, A., Okayama, H., Iwamoto, N., Yoshitome, S., Tane, S., Nakamura, K., Obayashi, T., Hayashi,
T., & Takeuchi, T. (2012). Cell cycle regulation in mouse heart during embryonic and postnatal
stages. Development, Growth & Differentiation, 54(8), 731–738.
Inácio, J. M., Marques, S., Nakamura, T., Shinohara, K., Meno, C., Hamada, H., & Belo, J. A. (2013).
The Dynamic Right-to-Left Translocation of Cerl2 Is Involved in the Regulation and Termination
of Nodal Activity in the Mouse Node. PLoS ONE, 8(3).
Itskovitz-Eldor, J., Schuldiner, M., Karsenti, D., Eden, A., Yanuka, O., Amit, M., Soreq, H., &
Benvenisty, N. (2000). Differentiation of human embryonic stem cells into embryoid bodies
compromising the three embryonic germ layers. Molecular Medicine (Cambridge, Mass.), 6(2),
88–95.
Jeevanantham, V., Butler, M., Saad, A., Abdel-Latif, A., Zuba-Surma, E. K., & Dawn, B. (2012). Adult
bone marrow cell therapy improves survival and induces long-term improvement in cardiac
parameters: A systematic review and meta-analysis. Circulation, 126(5), 551–568.
Jinek, M., East, A., Cheng, A., Lin, S., Ma, E., & Doudna, J. (2013). RNA-programmed genome editing
in human cells. eLife, 2013(2), 1–9.
Johnson, M. H., & Ziomek, C. A. (1981). The foundation of two distinct cell lineages within the mouse
morula. Cell, 24(1), 71–80.
Jordan, M. A., & Wilson, L. (2004). Microtubules as a target for anticancer drugs. Nat. Rev. Cancer,
4(4), 253–265.
Kalyan, A., Carneiro, B. A., Chandra, S., Kaplan, J., Chae, Y. K., Matsangou, M., Hendrix, M. J. C., &
Giles, F. (2017). Nodal Signaling as a Developmental Therapeutics Target in Oncology. Molecular

References
48
Cancer Therapeutics, 16(5), 787–792.
Kamachi, Y., Uchikawa, M., & Kondoh, H. (2000). Pairing SOX off: with partners in the regulation of
embryonic development. Trends in Genetics : TIG, 16(4), 182–7.
Karkera, J. D., Lee, J. S., Roessler, E., Banerjee-Basu, S., Ouspenskaia, M. V, Mez, J., … Muenke, M.
(2007). Loss-of-function mutations in growth differentiation factor-1 (GDF1) are associated with
congenital heart defects in humans. American Journal of Human Genetics, 81(5), 987–994.
Kathiriya, I. S., & Srivastava, D. (2000). Left-right asymmetry and cardiac looping: Implications for
cardiac development and congenital heart disease. American Journal of Medical Genetics -
Seminars in Medical Genetics, 97(4), 271–279.
Kawasumi, A., Nakamura, T., Iwai, N., Yashiro, K., Saijoh, Y., Belo, J. A., Shiratori, H., & Hamada,
H. (2011). Left-right asymmetry in the level of active Nodal protein produced in the node is
translated into left-right asymmetry in the lateral plate of mouse embryos. Developmental Biology,
353(2), 321–330.
Kelly, R. G., Buckingham, M. E., & Moorman, A. F. (2014). Heart fields and cardiac morphogenesis.
Cold Spring Harbor Perspectives in Medicine, 4(10).
Khalifa, E. A., Tucker, M. J., & Hunt, P. (1992). Cruciate thinning of the zona pellucida for more
successful enhancement of blastocyst hatching in the mouse. Human Reproduction (Oxford,
England), 7(4), 532–6.
Kokkinopoulos, I., Ishida, H., Saba, R., Coppen, S., Suzuki, K., & Yashiro, K. (2016). Cardiomyocyte
differentiation from mouse embryonic stem cells using a simple and defined protocol.
Developmental Dynamics, 245(2), 157–165.
Kosaki, K., Bassi, M. T., Kosaki, R., Lewin, M., Belmont, J., Schauer, G., & Casey, B. (1999).
Characterization and mutation analysis of human LEFTY A and LEFTY B, homologues of murine
genes implicated in left-right axis development. American Journal of Human Genetics, 64(3), 712–
21.
Kurosawa, H. (2007). Methods for inducing embryoid body formation: in vitro differentiation system
of embryonic stem cells. Journal of Bioscience and Bioengineering, 103(5), 389–398.
Lian, X., Zhang, J., Azarin, S. M., Zhu, K., Hazeltine, L. B., Bao, X., Hsiao, C., Kamp, T. J., & Palecek,
S. P. (2013). Directed cardiomyocyte differentiation from human pluripotent stem cells by
modulating Wnt/beta-catenin signaling under fully defined conditions. Nat Protoc, 8(1), 162–175.
Lindsley, R. C., Gill, J. G., Murphy, T. L., Langer, E. M., Cai, M., Mashayekhi, M., … Murphy, K. M.
(2008). Mesp1 coordinately regulates cardiovascular fate restriction and epithelial-mesenchymal
transition in differentiating ESCs. Cell Stem Cell, 3(1), 55–68.
Llames, S., García-Pérez, E., Meana, Á., Larcher, F., & del Río, M. (2015). Feeder Layer Cell Actions
and Applications. Tissue Engineering Part B: Reviews, 21(4), 345–353.
Logan, M., Pagán-Westphal, S. M., Smith, D. M., Paganessi, L., & Tabin, C. J. (1998). The transcription
factor pitx2 mediates situs-specific morphogenesis in response to left-right asymmetric signals.
Cell, 94(3), 307–317.
Ma, Y., Gu, J., Li, C., Wei, X., Tang, F., Shi, G., … Jin, Y. (2012). Human foreskin fibroblast produces
interleukin-6 to support derivation and self-renewal of mouse embryonic stem cells. Stem Cell

References
49
Research & Therapy, 3(4), 29.
Maître, J.-L., & Heisenberg, C.-P. (2013). Three Functions of Cadherins in Cell Adhesion. Current
Biology, 23(14), R626–R633.
Mali, P., Yang, L., Esvelt, K. M., Aach, J., Guell, M., DiCarlo, J. E., … Church, G. M. (2013). RNA-
Guided Human Genome Engineering via Cas9 Prashant. Science, 339(6121), 823–826.
Maltsev, V. A., Rohwedel, J., Hescheler, J., & Wobus, A. M. (1993). Embryonic stem cells differentiate
in vitro into cardiomyocytes representing sinusnodal, atrial and ventricular cell types. Mechanisms
of Development, 44(1), 41–50.
Marikawa, Y., & Alarcón, V. B. (2009). Establishment of trophectoderm and inner cell mass lineages
in the mouse embryo. Molecular Reproduction and Development, 76(11), 1019–1032.
Marques, S., Borges, A. C., Silva, A. C., Freitas, S., Cordenonsi, M., & Belo, J. A. (2004). The activity
of the Nodal antagonist Cerl-2 in the mouse node is required for correct L/R body axis. Genes and
Development, 18(19), 2342–2347.
Martí, M., Mulero, L., Pardo, C., Morera, C., Carrió, M., Laricchia-Robbio, L., Esteban, C. R., & Izpisua
Belmonte, J. C. (2013). Characterization of pluripotent stem cells. Nature Protocols, 8(2), 223–
253.
Martin, G. R. (1981). Isolation of a pluripotent cell line from early mouse embryos cultured in medium
conditioned by teratocarcinoma stem cells. Proceedings of the National Academy of Sciences of
the United States of America, 78(12), 7634–7638.
Meilhac, S. M., Lescroart, F., Blanpain, C. D., & Buckingham, M. E. (2014). Cardiac cell lineages that
form the heart. Cold Spring Harbor Perspectives in Medicine, 4(9), 1–14.
Meno, C., Takeuchi, J., Sakuma, R., Koshiba-Takeuchi, K., Ohishi, S., Saijoh, Y., … Hamada, H.
(2001). Diffusion of Nodal Signaling Activity in the Absence of the Feedback Inhibitor Lefty2.
Developmental Cell, 1(1), 127–138.
Mitsui, K., Tokuzawa, Y., Itoh, H., Segawa, K., Murakami, M., Takahashi, K., … Yamanaka, S. (2003).
The homeoprotein Nanog is required for maintenance of pluripotency in mouse epiblast and ES
cells. Cell, 113(5), 631–42.
Moretti, A., Caron, L., Nakano, A., Lam, J. T., Bernshausen, A., Chen, Y., … Chien, K. R. (2006).
Multipotent Embryonic Isl1+ Progenitor Cells Lead to Cardiac, Smooth Muscle, and Endothelial
Cell Diversification. Cell, 127(6), 1151–1165.
Morey, L., Santanach, A., & Di Croce, L. (2015). Pluripotency and Epigenetic Factors in Mouse
Embryonic Stem Cell Fate Regulation. Molecular and Cellular Biology, 35(16), 2716–28.
Morris, S. A., Teo, R. T., Li, H., Robson, P., Glover, D. M., & Zernicka-Goetz, M. (2010). Origin and
formation of the first two distinct cell types of the inner cell mass in the mouse embryo. Proc Natl
Acad Sci U S A, 107(14), 6364–6369.
Muthuchamy, M., Pajak, L., Howles, P., Doetschman, T., & Wieczorek, D. F. (1993). Developmental
Analysis of Tropomyosin Gene Expression in Embryonic Stem Cells and Mouse Embryos.
Molecular and Cellular Biology, 13(6), 3311–3323.
Naghavi, M., Wang, H., Lozano, R., Davis, A., Liang, X., Zhou, M., … Temesgen, A. M. (2015). Global,
regional, and national age-sex specific all-cause and cause-specific mortality for 240

References
50
causes of death, 1990-2013: A systematic analysis for the Global Burden of Disease
Study 2013. The Lancet, 385(9963), 117–171.
Nakamura, T., Saito, D., Kawasumi, A., Shinohara, K., Asai, Y., Takaoka, K., … Hamada, H. (2012).
Fluid flow and interlinked feedback loops establish left–right asymmetric decay of Cerl2 mRNA.
Nature Communications, 3, 1322.
Ng, S. Y., Wong, C. K., & Tsang, S. Y. (2010). Differential gene expressions in atrial and ventricular
myocytes: insights into the road of applying embryonic stem cell-derived cardiomyocytes for
future therapies. AJP: Cell Physiology, 299(6), C1234–C1249.
Nichols, J., Zevnik, B., Anastassiadis, K., Niwa, H., Klewe-Nebenius, D., Chambers, I., … Smith, A.
(1998). Formation of pluripotent stem cells in the mammalian embryo dependes on the POU
transcription factor Oct4. Cell, 95(3), 379–391.
Nichols, M., Townsend, N., Scarborough, P., & Rayner, M. (2013). Cardiovascular disease in Europe:
Epidemiological update. European Heart Journal, 34(39), 3028–3034.
Nishii, K., Morimoto, S., Minakami, R., Miyano, Y., Hashizume, K., Ohta, M., … Shibata, Y. (2008).
Targeted disruption of the cardiac troponin T gene causes sarcomere disassembly and defects in
heartbeat within the early mouse embryo. Developmental Biology, 322(1), 65–73.
Nishii, K., & Shibata, Y. (2006). Mode and determination of the initial contraction stage in the mouse
embryo heart. Anatomy and Embryology, 211(2), 95–100.
Nishikawa, S.-I., Jakt, L. M., & Era, T. (2007). Embryonic stem-cell culture as a tool for developmental
cell biology. Nature Reviews Molecular Cell Biology, 8(6), 502–507.
Niwa, H., Burdon, T., Chambers, I., & Smith, A. (1998). Self-renewal of pluripotent embryonic stem
cells is mediated via activation of STAT3. Genes & Development, 12(13), 2048–60.
Niwa, H., Miyazaki, J., & Smith, A. G. (2000). Quantitative expression of Oct-3/4 defines
differentiation, dedifferentiation or self-renewal of ES cells. Nature Genetics, 24(4), 372–376.
Niwa, H., Toyooka, Y., Shimosato, D., Strumpf, D., Takahashi, K., Yagi, R., & Rossant, J. (2005).
Interaction between Oct3/4 and Cdx2 determines trophectoderm differentiation. Cell, 123(5), 917–
929.
Nolan, T., Hands, R. E., & Bustin, S. A. (2006). Quantification of mRNA using real-time RT-PCR.
Nature Protocols, 1(3), 1559–1582.
Pan, G., & Thomson, J. A. (2007). Nanog and transcriptional networks in embryonic stem cell
pluripotency. Cell Research, 17(1), 42–9.
Parikh, A., Wu, J., Blanton, R. M., & Tzanakakis, E. S. (2015). Signaling Pathways and Gene Regulatory
Networks in Cardiomyocyte Differentiation. Tissue Engineering Part B: Reviews, 21(4), 377–392.
Piedra, M. E., Icardo, J. M., Albajar, M., Rodriguez-Rey, J. C., & Ros, M. A. (1998). Pitx2 participates
in the late phase of the pathway controlling left- right asymmetry. Cell, 94(3), 319–324.
Polanco, J. C., & Koopman, P. (2007). Sry and the hesitant beginnings of male development.
Developmental Biology, 302(1), 13–24.
Pourquié, O. (2003). Vertebrate somitogenesis: A novel paradigm for animal segmentation?
International Journal of Developmental Biology, 47(7-8), 597–603.

References
51
Quelle, D. E., Ashmun, R. A., Shurtleff, S. A., Kato, J. Y., Bar-Sagi, D., Roussel, M. F., & Sherr, C. J.
(1993). Overexpression of mouse D-type cyclins accelerates G1 phase in rodent fibroblasts. Genes
and Development, 7(8), 1559–1571.
Ramsdell, A. F. (2005). Left-right asymmetry and congenital cardiac defects: Getting to the heart of the
matter in vertebrate left-right axis determination. Developmental Biology, 288(1), 1–20.
Rankin, C. T., Bunton, T., Lawler, a M., & Lee, S. J. (2000). Regulation of left-right patterning in mice
by growth/differentiation factor-1. Nature Genetics, 24(3), 262–265.
Robbins, J., Gulick, J., Sanchez, A., Howles, P., & Doetschman, T. (1990). Mouse embryonic stem cells
express the cardiac myosin heavy chain genes during development in vitro. J Biol Chem, 265(20),
11905–11909.
Rodda, D. J., Chew, J. L., Lim, L. H., Loh, Y. H., Wang, B., Ng, H. H., & Robson, P. (2005).
Transcriptional regulation of Nanog by OCT4 and SOX2. Journal of Biological Chemistry,
280(26), 24731–24737.
Rose-John, S. (2002). GP130 stimulation and the maintenance of stem cells. Trends in Biotechnology,
20(10), 417–419.
Rungarunlert, S., Techakumphu, M., Pirity, M. K., & Dinnyes, A. (2009). Embryoid body formation
from embryonic and induced pluripotent stem cells: Benefits of bioreactors. World Journal of Stem
Cells, 1(1), 11–21.
Ryan, a K., Blumberg, B., Rodriguez-Esteban, C., Yonei-Tamura, S., Tamura, K., Tsukui, T., … Izpisúa
Belmonte, J. C. (1998). Pitx2 determines left-right asymmetry of internal organs in vertebrates.
Nature, 394(6693), 545–551.
Saga, Y., Hata, N., Kobayashi, S., Magnuson, T., Seldin, M. F., & Taketo, M. M. (1996). MesP1: a
novel basic helix-loop-helix protein expressed in the nascent mesodermal cells during mouse
gastrulation. Development (Cambridge, England), 122, 2769–2778.
Salomon, D. S., Bianco, C., Ebert, A. D., Khan, N. I., De Santis, M., Normanno, N., … Persico, G.
(2000). The EGF-CFC family: Novel epidermal growth factor-related proteins in development and
cancer. Endocrine-Related Cancer, 7(4), 199–226.
Shah, K., McCormack, C. E., & Bradbury, N. A. (2014). Do you know the sex of your cells? AJP: Cell
Physiology, 306(1), C3–C18.
Shen, M. M. (2007). Nodal signaling: developmental roles and regulation. Development, 134(6), 1023–
34.
Shi, G., & Jin, Y. (2010). Role of Oct4 in maintaining and regaining stem cell pluripotency. Stem Cell
Research & Therapy, 1(5), 39.
Shiraishi, I., & Ichikawa, H. (2012). Human Heterotaxy Syndrome. Circulation Journal, 76(9), 2066–
2075.
Shiratori, H., & Hamada, H. (2006). The left-right axis in the mouse: from origin to morphology.
Development, 133(11), 2095–104.
Shiratori, H., & Hamada, H. (2014). TGF-β signaling in establishing left-right asymmetry. Seminars in
Cell and Developmental Biology, 32, 80–84.

References
52
Smithies, O., Gregg, R. G., Boggs, S. S., Koralewski, M. A., & Kucherlapati, R. S. (1985). Insertion of
DNA sequences into the human chromosomal beta-globin locus by homologous recombination.
Nature, 317(6034), 230–4.
Solter, D., & Knowles, B. B. (1978). Monoclonal antibody defining a stage-specific mouse embryonic
antigen (SSEA-1). Proceedings of the National Academy of Sciences of the United States of
America, 75(11), 5565–9.
Später, D., Hansson, E. M., Zangi, L., & Chien, K. R. (2014). How to make a cardiomyocyte.
Development, 141(23), 4418–31.
Suckow, M., Danneman, P., & Brayton, C. (2001). The laboratory mouse. CRC Press LLC.
Takaoka, K., & Hamada, H. (2012). Cell fate decisions and axis determination in the early mouse
embryo. Development, 139(1), 3–14.
Takaoka, K., Yamamoto, M., & Hamada, H. (2011). Origin and role of distal visceral endoderm, a group
of cells that determines anterior-posterior polarity of the mouse embryo. Nature Cell Biology,
13(7), 743–752.
Tam, P. P. L., & Behringer, R. R. (1997). Mouse gastrulation: The formation of a mammalian body
plan. Mechanisms of Development, 68(1-2), 3–25.
Tamm, C., Pijuan Galitó, S., & Annerén, C. (2013). A Comparative Study of Protocols for Mouse
Embryonic Stem Cell Culturing. PLoS ONE, 8(12), e81156.
Tardiff, J. C., Hewett, T. E., Palmer, B. M., Olsson, C., Factor, S. M., Moore, R. L., … Leinwand, L. A.
(1999). Cardiac troponin T mutations result in allele-specific phenotypes in a mouse model for
hypertrophic cardiomyopathy. Journal of Clinical Investigation, 104(4), 469–481.
Thomas, K. R., Folger, K. R., & Capecchi, M. R. (1986). High frequency targeting of genes to specific
sites in the mammalian genome. Cell, 44(3), 419–428.
Townsend, N., Wilson, L., Bhatnagar, P., Wickramasinghe, K., Rayner, M., & Nichols, M. (2016).
Cardiovascular disease in Europe: epidemiological update 2016. European Heart Journal, 37(42),
3232-3245.
Waldo, K. L., Hutson, M. R., Ward, C. C., Zdanowicz, M., Stadt, H. A., Kumiski, D., … & Kirby, M.
L. (2005). Secondary heart field contributes myocardium and smooth muscle to the arterial pole
of the developing heart. Developmental Biology, 281(1), 78–90.
Waterston, R. H., Lindblad-Toh, K., Birney, E., Rogers, J., Abril, J. F., Agarwal, P., … & Lander, E. S.
(2002). Initial sequencing and comparative analysis of the mouse genome. Nature, 420(6915),
520–562.
Weitzer, G. (2006). Embryonic stem cell-derived embryoid bodies: an in vitro model of eutherian
pregastrulation development and early gastrulation. Handbook of Experimental Pharmacology,
174, 21-51.
Williams, R. L., Hilton, D. J., Pease, S., Willson, T. a, Stewart, C. L., Gearing, D. P., … & Gough, N.
M. (1988). Myeloid leukaemia inhibitory factor maintains the developmental potential of
embryonic stem cells. Nature, 336(6200), 684–687.
Wobus, A. M., Wallukat, G., & Hescheler, J. (1991). Pluripotent mouse embryonic stem cells are able
to differentiate into cardiomyocytes expressing chronotropic responses to adrenergic and

References
53
cholinergic agents and Ca2+ channel blockers. Differentiation, 48(3), 173–182.
Xin, M., Olson, E. N., & Bassel-Duby, R. (2013). Mending broken hearts: cardiac development as a
basis for adult heart regeneration and repair. Nature Publishing Group, 14(8), 529–541.
Yacoub, M. H., & Terrovitis, J. (2013). CADUCEUS, SCIPIO, ALCADIA: Cell therapy trials using
cardiac-derived cells for patients with post myocardial infarction LV dysfunction, still evolving.
Global Cardiology Science and Practice, 2013(1), 3.
Yeo, C. Y., & Whitman, M. (2001). Nodal signals to Smads through Cripto-dependent and Cripto-
independent mechanisms. Molecular Cell, 7(5), 949–957.
Ying, Q.-L., Wray, J., Nichols, J., Batlle-Morera, L., Doble, B., Woodgett, J., … & Smith, A. (2008).
The ground state of embryonic stem cell self-renewal. Nature, 453(May), 519–23.
Yoshida, K., Chambers, I., Nichols, J., Smith, A., Saito, M., Yasukawa, K., … & Kishimoto, T. (1994).
Maintenance of the pluripotential phenotype of embryonic stem cells through direct activation of
gp130 signalling pathways. Mechanisms of Development, 45(2), 163–171.
Yoshioka, H., Meno, C., Koshiba, K., Sugihara, M., Itoh, H., Ishimaru, Y., … & Noji, S. (1998). Pitx2,
a bicoid-type homeobox gene, is involved in a lefty-signaling pathway in determination of left-
right asymmetry. Cell, 94(3), 299–305.
Zhao, S., Nichols, J., Smith, A. G., & Li, M. (2004). SoxB transcription factors specify neuroectodermal
lineage choice in ES cells. Molecular and Cellular Neuroscience, 27(3), 332–342.

Appendix
54
Appendix
Figure A1: Control staining of the secondary antibodies used during the immunofluorescence microscopy for
pluripotency markers. Images were taken in a sequence mode and the same confocal microscope settings were used for the
corresponding first and second antibodies pair. Scale bars: 20 µm.
Figure A1: Control staining of the secondary antibodies used during the immunofluorescence microscopy for germ
layer markers. Images were taken in a sequence mode and the same confocal microscope settings were used for the
corresponding first and second antibodies pair. Scale bars: 20 µm.