Embed Size (px)
Citation preview

American Institute of Aeronautics and Astronautics
1
Generation of Fullspan Leading-Edge 3D Ice Shapes for Swept-Wing Aerodynamic Testing
Stephanie C. Camello*
University of Washington, Seattle, Washington, 98195
Sam Lee† Vantage Partners, LLC, Cleveland, OH, 44135
Christopher Lum‡, and Michael B. Bragg§ University of Washington, Seattle, Washington 98195
The deleterious effect of ice accretion on aircraft is often assessed through dry-air flight and wind-tunnel testing with artificial ice shapes. This paper describes a method to create fullspan swept-wing artificial ice shapes from partial span ice segments acquired in the NASA Glenn Icing Reserch Tunnel for aerodynamic wind-tunnel testing. Full-scale ice accretion segments were laser scanned from the Inboard, Midspan, and Outboard wing station models of the 65%-scale Common Research Model (CRM65) aircraft configuration. These were interpolated and extrapolated using a weighted averaging method to generate fullspan ice shapes from the root to the tip of the CRM65 wing. The results showed that this interpolation method was able to preserve many of the highly three dimensional features typically found on swept-wing ice accretions. The interpolated fullspan ice shapes were then scaled to fit the leading edge of a 8.9% scale version of the CRM65 wing for aerodynamic wind-tunnel testing. Reduced fidelity versions of the fullspan ice shapes were also created where most of the local three-dimensional features were removed. The fullspan artificial ice shapes and the reduced fidelity versions were manufactured using stereolithography.
Nomenclature CRM = Common Research Model IRT = NASA Icing Research Tunnel T0 = total temperature V = velocity MVD = median volumetric diameter LWC = liquid water content AoA = angle of attack t = icing spray time TS = static temperature η = spanwise location MAC = mean aerodynamic chord STL = stereolithography OD = outer diameter ID = inner diameter
I. Introduction ce accretions on swept wings create unfavorable flight conditions, and the effects they have on a swept wing’s aerodynamic performance are not well understood. These effects are important to the design, testing, and
certification of aircraft. There is currently a collaborative research program underway involving NASA, FAA, ONERA, Boeing, and university partners to better understand the effects of icing on swept-wing aerodynamics.1 An
* Graduate Research Assistant, Department of Aeronautics and Astronautics, University of Washington † Research Engineer, Icing Branch, NASA Glenn Research Center, Senior Member AIAA ‡ Research Assistant Professor, Department of Aeronautics and Astronautics, University of Washington § Dean, College of Engineering, Professor of Aeronautics and Astronautics, University of Washington, Fellow AIAA
I
https://ntrs.nasa.gov/search.jsp?R=20170000239 2018-06-28T02:09:37+00:00Z
American Institute of Aeronautics and Astronautics
2
important component of this program is the high- and low-Reynolds number aerodynamic wind-tunnel testing of fullspan ice shapes that are created with ice accretions obtained in an icing wind tunnel utilizing wing models with full-scale leading edges.
For this research program, a 65% scale Common Research Model (CRM65)1 was used as the baseline configuration. The 1-g wing loading was removed so that there is no dihedral and the leading edge is nearly a straight line. To generate the full-scale artificial ice shapes for aerodynamic testing, ice accretion testing was conducted in the Icing Research Tunnel at NASA Glenn Research Center utilizing hybrid models representing the η = 20%, η = 64%, and η = 83% spanwise locations (referred from here on as the Inboard, Midspan, and Outboard stations). The models had full-scale leading edges with a truncated chord length to fit within the IRT test section. The necessity for truncating the models is shown in Figure 1, which depicts the IRT test section compared to the CRM65 wing. The hybrid models matched the leading-edge geometry and flowfield of full-scale wing, allowing the generation of full-scale ice accretions with models that could be tested in the IRT. The procedure used to design these hybrid models is described in more detail by Fujiwara.2,3,4 Seven ice accretions from IRT test results were chosen to capture a large range of ice-accretion geometry variation. They are shown in Table 1 along with the IRT tunnel conditions used to generate them. Fujiwara et al.5 provides more details on the test conditions. Images of the ice accretions collected on the Inboard, Midspan, and Outboard models from the IRT tests results are shown in Figs. 2-8. These ice shapes varied significantly with different icing conditions. However, they did not vary significantly between the icing stations for a given condition. Details of the ice-accretion testing can be found in Broeren et al.6 The experimental ice shapes were captured using a commercially available 3D laser scanner. The scanner generated a point cloud of the ice shape surface which was then processed into a “water-tight” surface mesh composed of triangles. This is a relatively new method to measure ice accretions in a wind tunnel, and a detailed description of this methodology and its capabilities can be found in Lee et al.7 During the test, only the center 1 ft span, out of 6 ft model span, of the ice was scanned because acquiring more than 1 ft of the span would have been prohibitively time consuming. Also, the hybrid models were desgined to match the flowfield of the full-scale wing only at the model centerline, and anything outside of the center 1 ft of the span was not necessarily representative of the full-scale wing ice.
Figure 1. IRT test section compared to the CRM65. Courtesy of Fujiwara.7
As stated previously, an important component of the current work is aerodynamic wind-tunnel testing of the CRM65 wing model with fullspan ice shapes. The current methodology for creating artificial ice shapes from experimental ice accretions for aerodynamic testing is based upon approaches developed for straight wings without any twist or taper.8,9 A spanwise segment of ice accretion is acquired in the icing tunnel utilizing the same geometry of the aerodynamic wind tunnel model. For example, in the IRT, only the ice accretion in the center 1-2 ft is utilized even though the vertically mounted model has a span of 6 ft, due to variables such as icing cloud uniformity and difficulty in measuring ice accretions over a larger span. If the aerodynamic wind tunnel model has a span greater than the span of the measured ice accretion, then the ice shape has to be manipulated to fill the span. Since there is no twist or taper for simple straight wing, this spanwise segment can simply be repeated in a quasi-2D fashion with the necessary number of sections to fill the span of the aerodynamic model. There may be highly localized spanwise variations in the ice shape geometry, but in a global sense, it can be considered almost two dimensional.
American Institute of Aeronautics and Astronautics
3
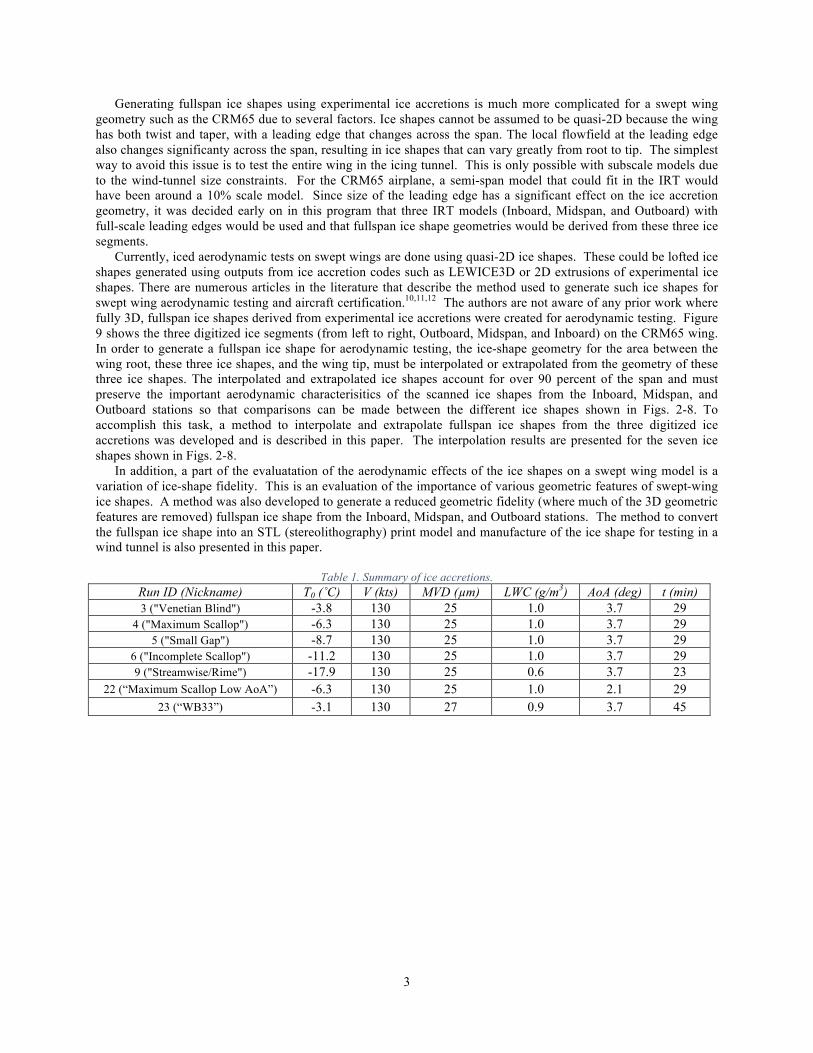
Generating fullspan ice shapes using experimental ice accretions is much more complicated for a swept wing geometry such as the CRM65 due to several factors. Ice shapes cannot be assumed to be quasi-2D because the wing has both twist and taper, with a leading edge that changes across the span. The local flowfield at the leading edge also changes significanty across the span, resulting in ice shapes that can vary greatly from root to tip. The simplest way to avoid this issue is to test the entire wing in the icing tunnel. This is only possible with subscale models due to the wind-tunnel size constraints. For the CRM65 airplane, a semi-span model that could fit in the IRT would have been around a 10% scale model. Since size of the leading edge has a significant effect on the ice accretion geometry, it was decided early on in this program that three IRT models (Inboard, Midspan, and Outboard) with full-scale leading edges would be used and that fullspan ice shape geometries would be derived from these three ice segments. Currently, iced aerodynamic tests on swept wings are done using quasi-2D ice shapes. These could be lofted ice shapes generated using outputs from ice accretion codes such as LEWICE3D or 2D extrusions of experimental ice shapes. There are numerous articles in the literature that describe the method used to generate such ice shapes for swept wing aerodynamic testing and aircraft certification.10,11,12 The authors are not aware of any prior work where fully 3D, fullspan ice shapes derived from experimental ice accretions were created for aerodynamic testing. Figure 9 shows the three digitized ice segments (from left to right, Outboard, Midspan, and Inboard) on the CRM65 wing. In order to generate a fullspan ice shape for aerodynamic testing, the ice-shape geometry for the area between the wing root, these three ice shapes, and the wing tip, must be interpolated or extrapolated from the geometry of these three ice shapes. The interpolated and extrapolated ice shapes account for over 90 percent of the span and must preserve the important aerodynamic characterisitics of the scanned ice shapes from the Inboard, Midspan, and Outboard stations so that comparisons can be made between the different ice shapes shown in Figs. 2-8. To accomplish this task, a method to interpolate and extrapolate fullspan ice shapes from the three digitized ice accretions was developed and is described in this paper. The interpolation results are presented for the seven ice shapes shown in Figs. 2-8. In addition, a part of the evaluatation of the aerodynamic effects of the ice shapes on a swept wing model is a variation of ice-shape fidelity. This is an evaluation of the importance of various geometric features of swept-wing ice shapes. A method was also developed to generate a reduced geometric fidelity (where much of the 3D geometric features are removed) fullspan ice shape from the Inboard, Midspan, and Outboard stations. The method to convert the fullspan ice shape into an STL (stereolithography) print model and manufacture of the ice shape for testing in a wind tunnel is also presented in this paper.
Table 1. Summary of ice accretions.
Run ID (Nickname) T0 (˚C) V (kts) MVD (µm) LWC (g/m3) AoA (deg) t (min) 3 ("Venetian Blind") -3.8 130 25 1.0 3.7 29
4 ("Maximum Scallop") -6.3 130 25 1.0 3.7 29 5 ("Small Gap") -8.7 130 25 1.0 3.7 29
6 ("Incomplete Scallop") -11.2 130 25 1.0 3.7 29 9 ("Streamwise/Rime") -17.9 130 25 0.6 3.7 23
22 (“Maximum Scallop Low AoA”) -6.3 130 25 1.0 2.1 29 23 (“WB33”) -3.1 130 27 0.9 3.7 45

American Institute of Aeronautics and Astronautics
4
Figure 2. Run ID 3 ("Venetian Blind"): Inboard, Midspan, and Outboard model ice accretions, respectively.
Figure 3. Run ID 4 ("Maximum Scallop"): Inboard, Midspan, and Outboard model ice accretions, respectively.

American Institute of Aeronautics and Astronautics
5
Figure 4. Run ID 5 ("Small Gap"): Inboard, Midspan, and Outboard model ice accretions, respectively.
Figure 5. Run ID 6 ("Incomplete Scallop"): Inboard, Midspan, and Outboard model ice accretions, respectively.

American Institute of Aeronautics and Astronautics
6
Figure 6. Run ID 9 ("Streamwise/Rime"): Inboard, Midspan, and Outboard model ice accretions, respectively.
Figure 7. Run ID 22(“Maximum Scallop Low AoA”): Inboard, Midspan, and Outboard model ice accretions, respectively.
American Institute of Aeronautics and Astronautics
7
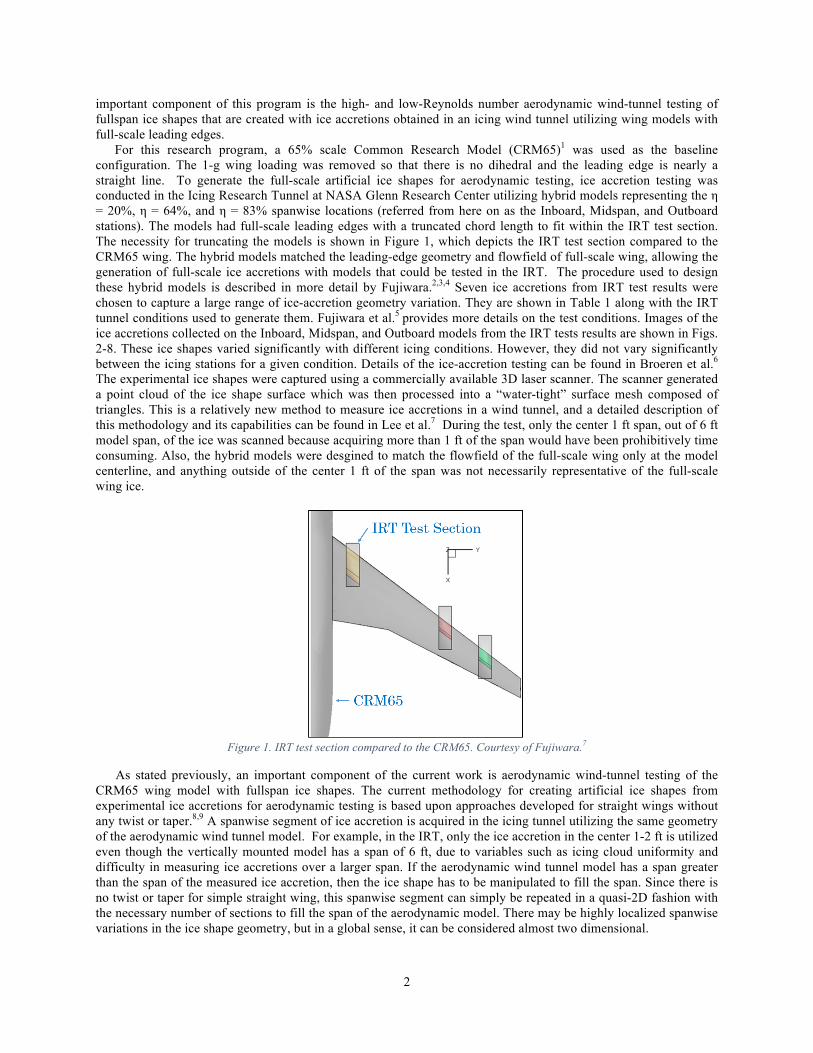
Figure 8. Run ID 23(“WB33”): Inboard, Midspan, and Outboard model ice accretions, respectively.
Figure 9. Outboard, Midspan, and Inboard IRT shapes on CRM65 wing.
II. Ice Shape Interpolation and Extrapolation Method The method devised to generate fullspan ice shapes involved interpolating between the scanned sections of the Inboard, Midspan, and Outboard CRM65 ice shapes using the weighted averaging function in Geomagic Studio.13 This is the same commercially available software that was used to scan the ice accretions and generate a water-tight surface mesh, which is a mesh that includes all complete surfaces and connects all surfaces without any discontinuities. Again, it is important to point out that the 1-g cruise condition loading on the CRM65 wing was removed for simplicity. This resulted in a straight leading edge along the span of the wing model without any shear, allowing for much simpler interpolation of the ice shape.
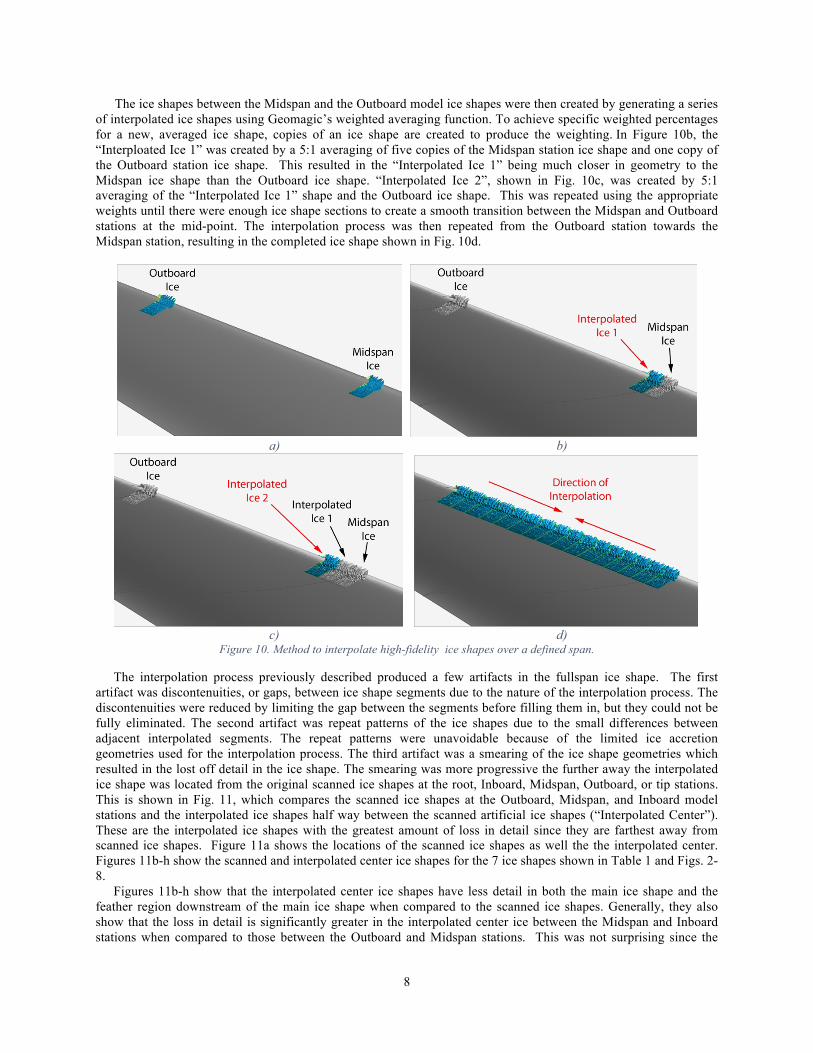
Figure 10 details the interpolation process using the Midspan and the Outboard ice shapes of the run ID 4 (“Maximum Scallop”) ice shape accretion as an example. The first step was to trim the spanwise length of the orginal ice-shape scans of the Midspan and Outboard model ice shapes so they are the same spanwise length and to eliminate any poorly scanned regions at the edge of the scanned areas. For the weighted averaging technique to work properly, the scanned ice shapes must have the same spanwise length. Typically 9 inch spanwise ice segments were used. Then, the mesh size of the scanned ice shapes was reduced from the original mesh size of approximately 2 million trianges to approximately 0.2 million triangles due to computing constraints. It was impractical at the current desktop computer processing capability to generate fullspan ice shapes at the original mesh density. Figure 10a shows the trimmed Midspan and Outboard ice shapes at the corresponding locations on the CRM65 wing.
American Institute of Aeronautics and Astronautics
8
The ice shapes between the Midspan and the Outboard model ice shapes were then created by generating a series of interpolated ice shapes using Geomagic’s weighted averaging function. To achieve specific weighted percentages for a new, averaged ice shape, copies of an ice shape are created to produce the weighting. In Figure 10b, the “Interploated Ice 1” was created by a 5:1 averaging of five copies of the Midspan station ice shape and one copy of the Outboard station ice shape. This resulted in the “Interpolated Ice 1” being much closer in geometry to the Midspan ice shape than the Outboard ice shape. “Interpolated Ice 2”, shown in Fig. 10c, was created by 5:1 averaging of the “Interpolated Ice 1” shape and the Outboard ice shape. This was repeated using the appropriate weights until there were enough ice shape sections to create a smooth transition between the Midspan and Outboard stations at the mid-point. The interpolation process was then repeated from the Outboard station towards the Midspan station, resulting in the completed ice shape shown in Fig. 10d.
a) b)
c) d)
Figure 10. Method to interpolate high-fidelity ice shapes over a defined span.
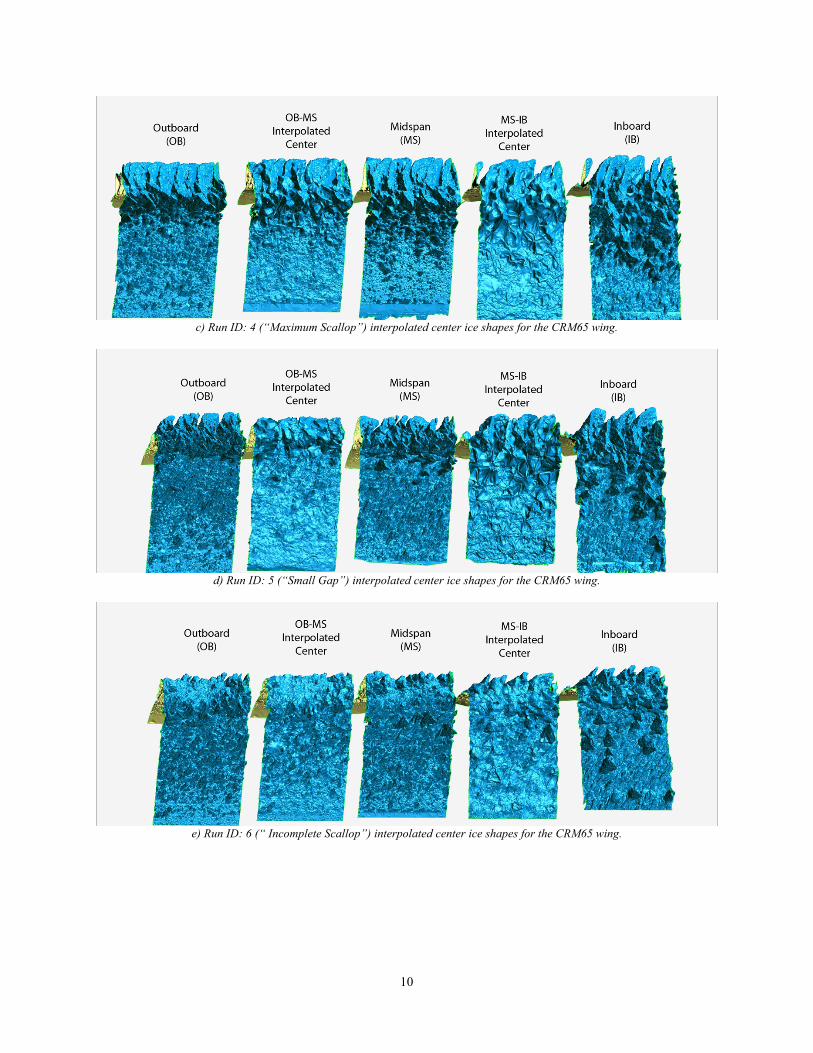
The interpolation process previously described produced a few artifacts in the fullspan ice shape. The first artifact was discontenuities, or gaps, between ice shape segments due to the nature of the interpolation process. The discontenuities were reduced by limiting the gap between the segments before filling them in, but they could not be fully eliminated. The second artifact was repeat patterns of the ice shapes due to the small differences between adjacent interpolated segments. The repeat patterns were unavoidable because of the limited ice accretion geometries used for the interpolation process. The third artifact was a smearing of the ice shape geometries which resulted in the lost off detail in the ice shape. The smearing was more progressive the further away the interpolated ice shape was located from the original scanned ice shapes at the root, Inboard, Midspan, Outboard, or tip stations. This is shown in Fig. 11, which compares the scanned ice shapes at the Outboard, Midspan, and Inboard model stations and the interpolated ice shapes half way between the scanned artificial ice shapes (“Interpolated Center”). These are the interpolated ice shapes with the greatest amount of loss in detail since they are farthest away from scanned ice shapes. Figure 11a shows the locations of the scanned ice shapes as well the the interpolated center. Figures 11b-h show the scanned and interpolated center ice shapes for the 7 ice shapes shown in Table 1 and Figs. 2-8.
Figures 11b-h show that the interpolated center ice shapes have less detail in both the main ice shape and the feather region downstream of the main ice shape when compared to the scanned ice shapes. Generally, they also show that the loss in detail is significantly greater in the interpolated center ice between the Midspan and Inboard stations when compared to those between the Outboard and Midspan stations. This was not surprising since the

American Institute of Aeronautics and Astronautics
9
distance between the Midspan and Inboard model stations was more than twice the distance between the Outboard and Midspan model stations (Fig. 11a) and the differences in geometry between the Midspan and Inboard station ice shapes was significantly greater than the differences between the Outboard and Midspan station ice shapes. Both of these factors resulted in the higher degree of interpolation that was required for the interpolated center ice shapes between the Inboard and Midspan station ice shapes. Even at the interpolated center the overall 3D features, including the scallop shapes, were preserved.
a) Scanned and interpolated center ice locations on the CRM65 wing.
b) Run ID: 3 (“Venetian Blind”) interpolated center ice shapes for the CRM65 wing.
American Institute of Aeronautics and Astronautics
10
c) Run ID: 4 (“Maximum Scallop”) interpolated center ice shapes for the CRM65 wing.
d) Run ID: 5 (“Small Gap”) interpolated center ice shapes for the CRM65 wing.
e) Run ID: 6 (“ Incomplete Scallop”) interpolated center ice shapes for the CRM65 wing.

American Institute of Aeronautics and Astronautics
11
f) Run ID: 9 (“Streamwise/Rime”) interpolated center ice shapes for the CRM65 wing.
g) Run ID: 22 (“Maximum Scallop Low AoA”) interpolated center ice shapes for the CRM65 wing.
h) Run ID: 23 (“WB33”) interpolated center ice shapes for the CRM65 wing.
Figure 11. Interpolated ice shapes at midway between scanned ice shapes.
The interpolation procedure described above is only applicable to spanwise locations between existing ice shape accretions. As Fig. 9 shows, experimental ice accretions do not exist inboard of the Inboard model station or outboard of the Outboard model station. A method was devised to extrapolate ice shapes at the root and tip stations using the Inboard and Outboard model station ice shapes, respectively. LEWICE3D14 results were avalible for a

American Institute of Aeronautics and Astronautics
12
limited set of icing conditions, but not at conditions identical to the experimental ice accretions. These results were used as an approximate guide to extrapolate the root and tip ice shapes. Figure 11 shows the LEWICE3D results from the CRM65 wing/body for WB33T-13.7 The red line depicts the horn thickness, defined as the distance from tip of the horn to the airfoil surface, and the blue line depicts the angle of the horn compared to its spanwise location. The spanwise location η = 10% corresponds to the side of the fuselage body of the CRM65. Because individual fullspan LEWICE 3D runs were not peformed from all of the experimental icing conditions, the LEWICE3D results for WB33T-13 were used as a guide to extrapolate the root and tip ice shapes for all of the experimental conditions. Figure 11 shows that the horn thickness increased slightly from the Outboard model station (η = 83%) of the CRM65 wing to the tip of the CRM65 wing so a 10% increase in the horn thickness was used from the Outboard model station to the tip. Near the wing root, there was initially a slight decrease in the horn thickness going from the Inboard model station to the wing root before increasing again which produces an unrealistic spike in the data. Therefore, the simplest solution was to keep the extrapolated root ice shape the same horn thickness as the Inboard model horn thickness. Figure 11 also shows that the horn angle increases slightly from the Outboard model location to the wing tip. For extrapolation, the tip ice-shape horn angle was increased from the Outboard model section by 5 degrees. In addition, the LEWICE3D results showed a more substantial increase in the horn angle from the Inboard model station to the root of the wing. For extrapolation, the Inboard model ice shape angle was increased by 20 degrees. The lower-surface chordwise extent of the ice shape at the root was also extended by approximately 30% over the Inboard model section to account for the extra chordwise extent shown in the LEWICE3D results 1,2 near the wing root.
Figure 11. LEWICE3D computational ice accretions generated for the CRM65. 5, 8
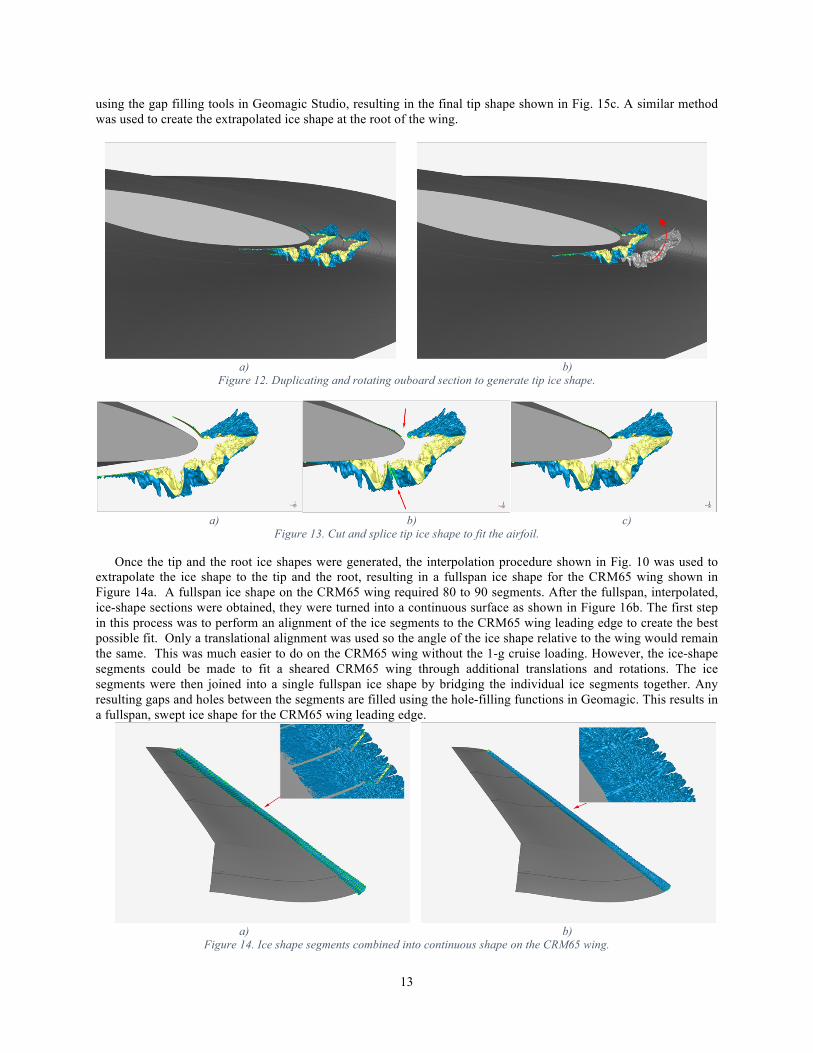
Figure 12 and Fig. 13 show the procedure that was used to generate the extrapolated tip section. The tip section started off as a copy of the Outboard station ice shape, as shown in Fig. 14a, and was translated from the leading edge to an ice-shape horn height approximately 10% higher than the Outboard station ice shape. It was rotated 5 degrees to a higher horn angle than the Outboard station ice shape, as shown in Fig. 14b. At this stage, the ice shape did not fit on the leading edge at the tip because the wing leading edge is smaller than at the Outboard station, as shown in Fig. 15a. To create an ice shape that would fit the smaller tip leading edge, it was split spanwise at multiple locations and rotated to decrease the radius of curvature. The split locations are specified by red arrows in Fig 15b. and were downstream of the main ice shape typically over the roughness/feather area so that the shape of the main ice shape remained intact. This process ensured that the angle and thickness of the main ice shape feature were not altered in order to fit the airfoil leading edge. The split segments were then reconnected and the gaps were filled
American Institute of Aeronautics and Astronautics
13
using the gap filling tools in Geomagic Studio, resulting in the final tip shape shown in Fig. 15c. A similar method was used to create the extrapolated ice shape at the root of the wing.
a) b)
Figure 12. Duplicating and rotating ouboard section to generate tip ice shape.
a) b) c)
Figure 13. Cut and splice tip ice shape to fit the airfoil.
Once the tip and the root ice shapes were generated, the interpolation procedure shown in Fig. 10 was used to extrapolate the ice shape to the tip and the root, resulting in a fullspan ice shape for the CRM65 wing shown in Figure 14a. A fullspan ice shape on the CRM65 wing required 80 to 90 segments. After the fullspan, interpolated, ice-shape sections were obtained, they were turned into a continuous surface as shown in Figure 16b. The first step in this process was to perform an alignment of the ice segments to the CRM65 wing leading edge to create the best possible fit. Only a translational alignment was used so the angle of the ice shape relative to the wing would remain the same. This was much easier to do on the CRM65 wing without the 1-g cruise loading. However, the ice-shape segments could be made to fit a sheared CRM65 wing through additional translations and rotations. The ice segments were then joined into a single fullspan ice shape by bridging the individual ice segments together. Any resulting gaps and holes between the segments are filled using the hole-filling functions in Geomagic. This results in a fullspan, swept ice shape for the CRM65 wing leading edge.
a) b)
Figure 14. Ice shape segments combined into continuous shape on the CRM65 wing.

American Institute of Aeronautics and Astronautics
14
III. Low-Fidelity Ice Shapes In addition to the high-fidelity artificial ice shapes previously described, several versions of reduced geometric
fidelity artificial ice shapes were created for aerodynamic testing. The reduced fidelity ice shapes are ice shape models that do not maintain the highly detailed, 3D characteristics and roughness of the original ice accretion, and are referred to as low-fidelity ice shapes. They were created to help evaluate the degree of geometric detail that is required to accurately represent the impact of ice accretion on the aerodynamics of the CRM65 swept wing geometry in this project. An example of a low-fidelity version of a high-fidelity ice shape is shown in Figure 15.
Figure 15. High-fidelity ice shape compared to its reduced fidelity ice shape.
One method for creating a low-fidelity ice shape is an extrustion. This method can be applied across the entire span of a high-fidelity interpolated ice shape to generate a fullspan reduced fidelity ice shape. At a variety of locations along the span of the high-fidelity interpolated ice shape a series of three 2D cuts are made about 1 inch apart to capture the spanwise variation of the artificial ice shape. Because the resulting 2D cut needs to be a single, smooth geometry for each location along the span of the high-fidelity artificial ice shape, a simpliflied outline of these 3 cuts is created by placing a spline along large, key features on the 3 cuts. This outline compared to the 3 cuts is shown in orange in Figure 16.
Figure 16. Smoothed, simplified outline geometry.
Once a series of approximately 30 of these smoothed, outlined 2D cuts have been made evenly spaced along the span of a high-fidelity interpolated ice shape, they are lofted using a CAD program to create a solid geometry.
IV. Creating Ice Shape Geometries for Wind-Tunnel Testing The low-Reynolds number aerodynamic testing of the fullspan artificial ice shapes was performed at the 7x10 ft
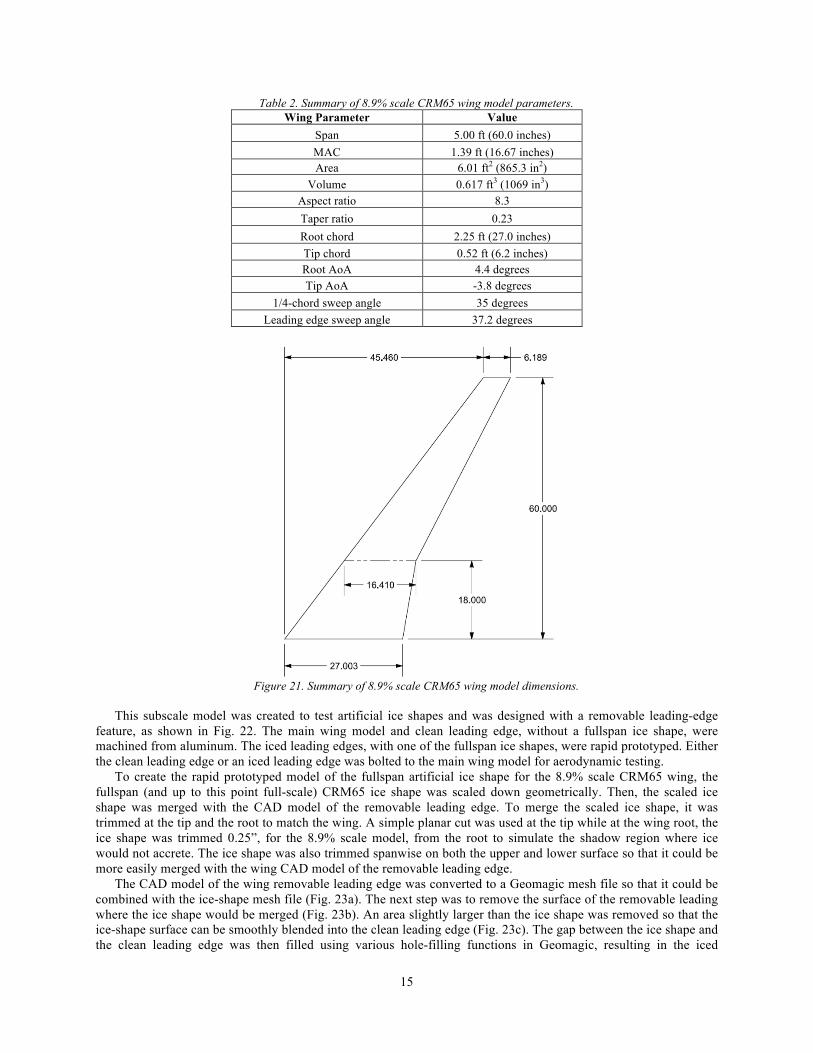
Beech Memorial Wind Tunnel at Wichita State University. An 8.9% scale CRM65 wing model was used for this testing. As stated before, the 1-g cruise condition loading was removed from the CRM65 to create this subscale model, but the subscale wing still maintains the twist and taper geometry of the CRM65. A summary of the subscale model parameters and dimensions are shown in Table 2 and Fig. 21.
American Institute of Aeronautics and Astronautics
15
Table 2. Summary of 8.9% scale CRM65 wing model parameters. Wing Parameter Value
Span 5.00 ft (60.0 inches) MAC 1.39 ft (16.67 inches) Area 6.01 ft2 (865.3 in2)
Volume 0.617 ft3 (1069 in3) Aspect ratio 8.3 Taper ratio 0.23 Root chord 2.25 ft (27.0 inches) Tip chord 0.52 ft (6.2 inches) Root AoA 4.4 degrees Tip AoA -3.8 degrees
1/4-chord sweep angle 35 degrees Leading edge sweep angle 37.2 degrees
Figure 21. Summary of 8.9% scale CRM65 wing model dimensions.
This subscale model was created to test artificial ice shapes and was designed with a removable leading-edge
feature, as shown in Fig. 22. The main wing model and clean leading edge, without a fullspan ice shape, were machined from aluminum. The iced leading edges, with one of the fullspan ice shapes, were rapid prototyped. Either the clean leading edge or an iced leading edge was bolted to the main wing model for aerodynamic testing.
To create the rapid prototyped model of the fullspan artificial ice shape for the 8.9% scale CRM65 wing, the fullspan (and up to this point full-scale) CRM65 ice shape was scaled down geometrically. Then, the scaled ice shape was merged with the CAD model of the removable leading edge. To merge the scaled ice shape, it was trimmed at the tip and the root to match the wing. A simple planar cut was used at the tip while at the wing root, the ice shape was trimmed 0.25”, for the 8.9% scale model, from the root to simulate the shadow region where ice would not accrete. The ice shape was also trimmed spanwise on both the upper and lower surface so that it could be more easily merged with the wing CAD model of the removable leading edge. The CAD model of the wing removable leading edge was converted to a Geomagic mesh file so that it could be combined with the ice-shape mesh file (Fig. 23a). The next step was to remove the surface of the removable leading where the ice shape would be merged (Fig. 23b). An area slightly larger than the ice shape was removed so that the ice-shape surface can be smoothly blended into the clean leading edge (Fig. 23c). The gap between the ice shape and the clean leading edge was then filled using various hole-filling functions in Geomagic, resulting in the iced

American Institute of Aeronautics and Astronautics
16
removable leading edge (Fig. 23d). The final step was to create the 0.036” OD holes required for surface pressure taps. On the clean wing model there are a total of 219 pressure tap locations, with the configuration of the pressure taps shown in Fig. 22. Due to the complex geometry of the artificial ice shapes, it was not practical to maintain the pressure taps located directly on the artificial ice shape geometry, and the holes in these locations were removed. The final 8.9% scale, high-fidelity, iced removable leading edge is shown in Fig. 24 and the final 8.9% scale low-fidelity iced removable leading edge is shown in Fig. 25.
Figure 22. 8.9% subscale CRM65 wing model and pressure tap locations.
a) b)
c) d)
Figure 23. Merging of scaled, high-fidelity ice shape with clean leading edge.

American Institute of Aeronautics and Astronautics
17
Figure 24. Fullspan, high-fidelity ice shape merged with the 8.9% subscale CRM65 removable leading edge.
Figure 25. Fullspan, low-fidelity ice shape merged with the 8.9% subscale CRM65 removable leading edge.
V. Manufacture of Artificial Iced Leading Edge Once the iced leading edges were designed, they were manufactured for aerodynamic testing. The artificial iced
removable leading edges were 3D printed using a stereolithography (SLA) rapid prototype manufacturing technique using the Somos® NeXt15 material. This material was selected due to manufacturer capabilities and its properties. Somos® NeXt was designed for testing applications that require high-quality, detailed parts. It has improved moisture resistance and thermal properties compared the previous material used, Accura 60,16 and a greater durability and accuracy than many other stereolithography resins. A rapid prototyped artificial iced removable leading edge is shown in Fig. 26. The selected rapid-prototype manufacturer used an iPro™ 9000 SLA® Center17 and both high- and low-fidelity ice shapes were rapid prototyped using this method.
American Institute of Aeronautics and Astronautics
18
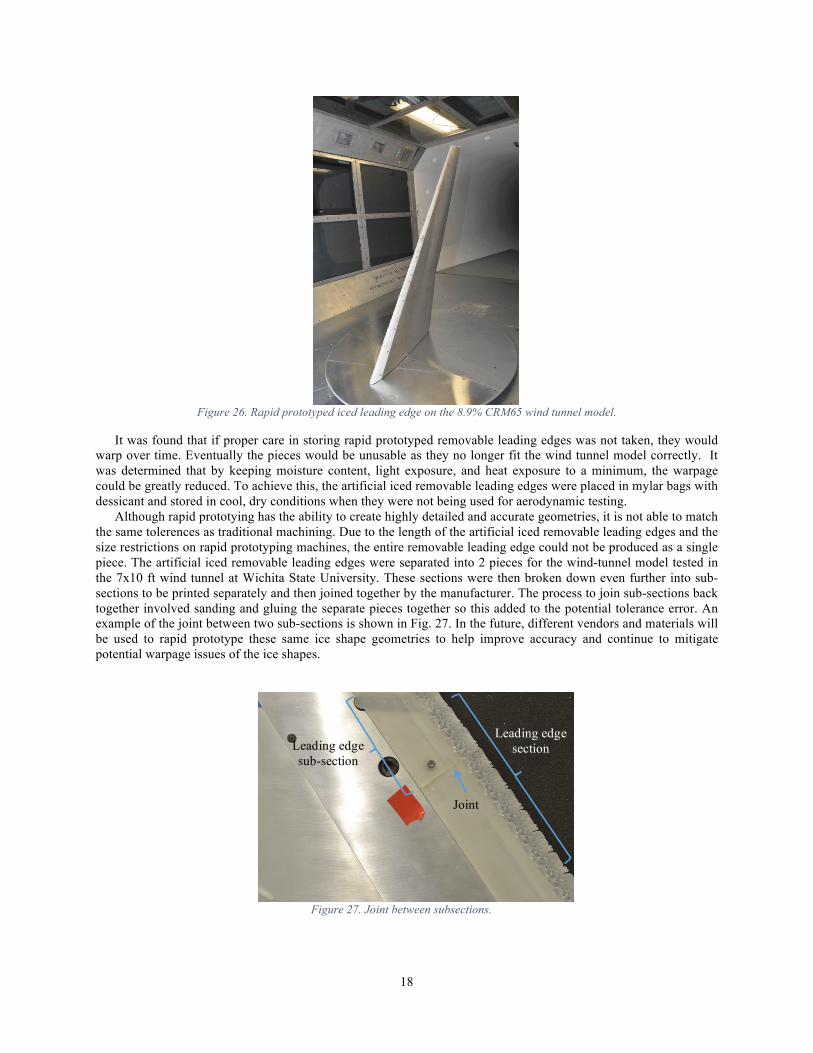
Figure 26. Rapid prototyped iced leading edge on the 8.9% CRM65 wind tunnel model.
It was found that if proper care in storing rapid prototyped removable leading edges was not taken, they would warp over time. Eventually the pieces would be unusable as they no longer fit the wind tunnel model correctly. It was determined that by keeping moisture content, light exposure, and heat exposure to a minimum, the warpage could be greatly reduced. To achieve this, the artificial iced removable leading edges were placed in mylar bags with dessicant and stored in cool, dry conditions when they were not being used for aerodynamic testing.
Although rapid prototying has the ability to create highly detailed and accurate geometries, it is not able to match the same tolerences as traditional machining. Due to the length of the artificial iced removable leading edges and the size restrictions on rapid prototyping machines, the entire removable leading edge could not be produced as a single piece. The artificial iced removable leading edges were separated into 2 pieces for the wind-tunnel model tested in the 7x10 ft wind tunnel at Wichita State University. These sections were then broken down even further into sub-sections to be printed separately and then joined together by the manufacturer. The process to join sub-sections back together involved sanding and gluing the separate pieces together so this added to the potential tolerance error. An example of the joint between two sub-sections is shown in Fig. 27. In the future, different vendors and materials will be used to rapid prototype these same ice shape geometries to help improve accuracy and continue to mitigate potential warpage issues of the ice shapes.
Figure 27. Joint between subsections.
Leading edge sub-section
Joint
Leading edge section

American Institute of Aeronautics and Astronautics
19
Once the artificial iced removable leading-edge geometries were printed they were instrumented with static pressure taps. These are standard pressure taps that are flush with the material surface to measure static pressure at a given location. Up to 67 pressure taps arranged in 6 streamwise rows were installed on each artificial iced removable leading edge. The number of pressure taps differed for each artificial iced removable leading edge because the pressure tap holes directly on the artificial ice shape geometry were removed for simplicity. The pressure taps were constructed using 19 gauge regular wall stainless steel tubing (0.042” OD x 0.0255” ID) which was annealed to allow the tubing to be shaped to the necessary internal geometry. It was then secured to the artificial iced removable leading edge using a combination of cyanoacrylate glue and 2-part epoxy. Vinyl or urethane tubing (0.040” OD x 0.034” ID) was attached to the stainless steel steel pressure tap and the free end of the urethane was attached to pneumatic connector, such as a Scanivalve 31F560 shown in Fig. 28, to allow rapid installation with a pressure scanning system. A picture of a fully instrumented ice shape is shown in Fig. 29.
Figure 28. Close up picture of a pressure tap row with associated pneumatic connector.
Figure 29.. Fully instrumented set of ice shapes.
VI. Conclusion A method was developed to generate fullspan artificial ice shapes from limited partial span segments of experimental ice accretions. A weighted averaging technique, using copies of an ice shape to produce the weighting,

American Institute of Aeronautics and Astronautics
20
was used to interpolate the ice shapes from one scanned section to another scanned section. This interpolation method was applied over the length of the full-scale leading edge of the CRM65 using the high-fidelity ice shapes from the Inboard, Midspan, and Outboard models that were tested in the IRT. An extrapolation method was also developed to generate artificial ice shapes at the root and tip of the wing using the artificial ice shapes at the Outboard and Inboard model stations and results from the LEWICE3D ice-prediction code. The interpolation method was then applied between the root and Inboard model ice shapes and the Outboard and tip ice shapes. Reduced geometric fidelity artificial ice shapes were created for aerodynamic testing, as well. These low-fidelity artificial ice shapes were used to determine the degree of geometric detail that is required to accurately represent the impact of ice accretions on the aerodynamics of the swept wing geometry tested. To generate a low-fidelity ice-shape geometry, evenly spaced 2D cuts along the span of a high-fidelity interpolated ice shape were lofted through to create a solid geometry. Once fullspan, artificial ice shapes were created for the high and low-fidelity artificial ice shapes, they were scaled so they could be used for subcale aerodynamic testing. These scaled artificial ice shapes were merged with the removable leading edge of a wind-tunnel model using functions in Geomagic Studio. The iced removable leading edges were manufactured for aerodynamic testing. The iced removable leading edges were 3D printed using a stereolithography (SLA) rapid prototype manufacturing technique using the Somos® NeXt material. Both high- and low-fidelity ice shapes were rapid prototyped using this method.
References 1 Broeren, A.P., Potapczuk, M.G., Riley, J.T., Villiedieu, P., Moens, F., Bragg, M.B., “Swept-Wing Ice Accretion Characterization and Aerodynamics,” AIAA Paper 2013-2824, June 2013, also NASA TM—2013-216555, Sept. 2013. 2 Fujiwara, G.E.C., “Design of 3D Swept Wing Hybrid Models for Icing Wind Tunnel Tests,” M.S. Thesis, Dept. of Aerospace Eng., Univ. of Illinois, Urbana, IL, 2015. 3 Fujiwara, G.E.C., Woodard, B.S., Wiberg, B.D., Mortonson, A.J., Bragg, M.B., “A Hybrid Airfoil Design Method for Icing Wind Tunnel Tests,” AIAA Paper 2013-2826. 4 Wiberg, B.D., Fujiwara, G.E.C., Woodard, B.S., and Bragg, M.B., “Large-Scale, Swept-Wing Icing Simulations in the NASA Glenn Icing Research Tunnel Using LEWICE3D,” AIAA Paper 2014-2617, June 2014. 5 Fujiwara, G.E.C., Bragg, M.B., Camello, S. C., Lum, C., “Computational and Experimental Ice Accretions of Large Swept Wings in the Icing Research Tunnel," AIAA 8th Atmospheric and Space Environments Conference, Washington D.C., June 13-17, 2016 (submitted for publication), 2016. 6 Broeren, A.P., Potapczuk, M.G., Lee, S., Malone, A.M., Paul, B.P., Jr. and Woodard, B.S., “Ice-Accretion Test Results for Three Large-Scale Swept-Wing Models in the NASA Icing Research Tunnel," AIAA 8th Atmospheric and Space Environments Conference, Washington D.C., June 13-17, 2016 (submitted for publication), 2016 7 Lee, S., Broeren, A.P., Addy, H.E., Sills, R., and Pifer, E., “Development of 3D Ice Accretion Measurement Method,” AIAA 4th Atmospheric and Space Environments Conference, New Orleans, LA, June 25-28, 2012, AIAA Paper 2012-2938. 8 Broeren, A.P., Bragg, M.B., Addy, H.E., Lee, S., Moens, F., and Guffond, D., “Effect of High-Fidelity Ice Accretion Simulations on the Performance of a Full-Scale Airfoil Model,” 46th AIAA Aerospace Sciences Meeting and Exhibit, January 7-10, 2008, Reno, Nevada, AIAA Paper AIAA 2008-434. 9 Broeren, AP, Addy, H.E., Lee, S., and Monastero, M.C., “Validation of 3-D Ice Accretion Measurement Methodology for Experimental Aerodynamic Simulation,” AIAA 6th Atmospheric and Space Environments Conference, Atlanta, GA, June 16-20, 2014, AIAA Paper 2014-2614. 10 Lee, S., Barnhart, B., and Ratvasky, T.P., “Dynamic Wind-Tunnel Testing of a Sub-Scale Iced S-B Viking,” AIAA Atmospheric and Space Environments Conference, August 2-5, 2010, Toronto, Canada, AIAA Paper 2010-7986 11 Bosetti,C., Krueger, F.N., Gunter, I.M., and Walters, D., United States Patent Application Publication, US 2016/0076968A1, March 17, 2016. 12 Broeren, A.P., Lee, S., Shah, G.H., and Murphy, P.C., “Aerodynamic Effects of Simulated Ice Accretion on a Generic Transport Model,” SAE International Conference on Aircraft and Engine Icing and Ground Deicing, June 13-17, 2011, Chicago, IL, SAE Paper 2011–38–0065, NASA TM 2012-217246

American Institute of Aeronautics and Astronautics
21
13 “3D scanning, design and reverse engineering software from 3D systems”, Geomagic, URL: http://www.geomagic.com 14 Bidwell, C.S., and Potapczuk, M.G., "User’s Manual for the NASA Lewis Three-Dimensional Ice Accretion Code (LEWICE3D)," NASA TM 105974, December 1993. 15 “Product Data Sheet: Somos® NeXt,” Somos®, URL: https://www.dsm.com/ 16 “Accura® 60 Plastic”, 3D Systems, URL: http://www.paramountind.com/ 17 “iPro™ 8000 & 9000: SLA® Production 3D Printers,” 3D Systems, URL: http://www.3dsystems.com/