Embed Size (px)
Citation preview
AD-A250 390liI] II II1 il il liii I
DOT-VNTSC-FAA-91-16 Generation of Spectra and Stress HistoriesFAA Technical Center for Fatigue and Damage Tolerance AnalysisAtlantic City, NJ 08405 of Fuselage Repairs
David BroekFractuREsearchand Samuel H. SmithRichard C. RiceBattelleColumbus, Ohio 43201
DTI
Final ReportOctober 1991
This document is available to the publicthrough the National Technical InformationService Springfield, Virginia 22161
0U.S. Department of TransportationFederal Aviation Administration 92 -122 17
02 19CA12217

BestAvailable
Copy

NOTICE
This document is disseminated under the sponsorship of theDepartments of Transportation and Defense in the interestof information exchange. The United States Government
assumes no liability for its contents or use thereof.
NOTICE
The United States Government does not endorseproducts or manufacturers. Trade or manufacturers'
names appear herein solely because they are consideredessential to the object of this report

Technical Report Documentation Page
1. Report No. 2. Government Accession No. 3. Recipient's Catalog No.
4. Title and Subtitle 5. Report DateGeneration of Spectra and Stress Histories for October 1991
Fatigue and Damage Tolerance Analysis of
Fuselage Repairs 6. Performing Organization Code
DTS-71
7. Author(s) 8. Performing Organization Report No.D. Broek, S.H. Smith, R.C. Rice DOT-VNTSC-FAA-91-
9. Performing Organization Name and Address 10. Work Unit No. (TRAIS)
Battelle* FAlD8/AI061
505 King Avenue 11. Contractor Giant No.Columbus, OH 43201-2693
DTRS-57-89-C-00006
12. Sponsoring Agency Name and Address 13. Type of Report and Period Covered1. S. Department of Transportation Final Report
Federal Aviation Administration March 1990 - May 1991
Technical Center
Atlantic City, NJ 14. Sponsoring Agency Code
ACD-210
15. Supplementary Notes U.S. Department of Transportation
*Under contract to: Research and Special Programs AdministrationVolpe National Transportation Systems CenterCambridge, MA 02142-1093
16. Abstract-This report describes a simplified procedure for the development of stress histories
for use in the analysis of aircraft repairs.- Although repairs of all components of
the airframe are of i- 'st, -this report concentrates on stress histories for
fuselage skin repair, description of typical fuselage loadings is provided, and
basic fuselage stress nistories are described. A method for development of an
exceedance diagram for analysis of fuselage skin repairs is detailed. Subsequently, a
methodology for generating detailed stress histories is reviewed. Some of the key
features are 1) the inclusion of a range of flights of different severities, 2) the
inclusion of deterministic loads where they occur, e.g., ground-air-ground cycles, 3)
the use of a near-optimum number of stress levels (10-16 positive and negative), 4)
the combination of positive and negative excursions of equal frequency, and 5)
matching of the total number of flights and cycles with the total exceedance diagram.
Two methods of estimating fuselage skin stresses are presented, the first based on
static equilibrium requirements and the second based on a limit load analysis.
A comparison of the proposed history generation scheme with that of an airframe
manufacturer for the KC-135 is also presented. The predicted fatigue crack growth
patterns for a hypothetical through crack at a fastener hole are compared for the two
history generation schemes at three areas within a fuselage.7 Predicted crack growth
lives are within a factor of 1.5 for two of the three cases. For the third case
(which is predicted to be the least severe by both techniques), the proposed scheme
results in substantially longer crack growth life predictions. The probable reasons
for these differences are discussed.
17. Key Words 18. Distribution Statement
Aircraft, Fuselage Repairs, Spectra, DOCUMENT IS AVAILABLE TO THE PUBLIC THROUGH
Stress Histories, Stress Analysis THE NATIONAL TECHNICAL INFORMATION SERVICE,
Damage Tolerance, Fatigue SPRINGFIELD, VA 22161
19. Security Classification (of this report) 20. Security Classification (of this page) 21. No. of Pages 22. Price
UNCIASSIFIED UNCLASSIFIED 46
Form DOT F 1700.7 (872) Reproduction of this completed page authorized

METRIC / ENGLISH CONVERSION FACTORS
ENGLISH TO METRIC METRIC TO ENGLISH
LENGTH (APOROXIMAt LENGTH C(APACIVATEl1 inch (in) = 2.5 centimeters (cm) 1 millimeter (mm) = 0.04 inch (in)
1 foot (ft) = 30 centimeters (cm) 1 centimeter (cm) = 0,4 inch (in)
1 yard (yd) = 0.9 meter (m) 1 meter (i) = 3.3 feet (ft)1 mile (mi) = 1.6 kilometers (kin) 1 meter (m) = 1.1 yards (yd)
1 kilometer (kin) = 0.6 mile (mi)
AREA (APPACX IMATE) AREA APPCx:.ATE)
1 square inch (sq in, :n) = 6.S square centimeters(cm-) 1 square centimeter (cm) = 0.16 square inch (sq in, in)
1 square foot (sq ft,.4t) = 0.09 square meter (m2 ) 1 square meter (m:) = 1.2 square yards (sq yd, yd2)
1 square yard (sq yd, yd-) = C.8 square meter (rn) 1 square kilometer (km) = 0.4 square mile (sq ini, mi,)
I square mile (sq mi, mi,) = 2.6 square kilometers (kin2) 1 hectare (he) = 10,000 square meters (m 2
)= 2.5 acres
1 acre = 0.4 hectares (he) = 4,000 square meters (m-)
MASS - WEIGHT (APPROXIMATE) MASS -WEIGHT (APPROX>MA-E)
I ounce (c) = 28 grams (gr) 1 gram (gr) = 0.036 ounce (cz)
1 pound (lb) = .45 kilogram (kg) 1 kilogram (kg) = 2.2 pounds (Ib)
I shor- ton = 2,000 pounds (Ib) = 0.9 tonne (t) 1 tonne (t) = 1,000 kilograms (kg) = 1.1 short tons
VOLUME (APROX, MAE) VOLUME IAPPCX5.VAE)
I teaspoon (tsp) = 5 milliliters (ml) 1 milliliter (ml) = 0.03 fluid ounce (fl cz)1 tab;espoon (tbsp) = 15 milliliters (ml) 1 liter(!) = 2.1 pints (pt)
I fijid ounce (fi cz) = 30 milliliters (ml) I liter (I) = 1.06 quar-,s (q)
1 cup (c) = 0.24 liter (I) 1 liter (1) = 0.26 gallon (gal)
1 pint (pt) = 0.47 liter (I) 1 cubic meter (m-) = 36 cubicfeet (cu ft. 1-)
u q art (qt) = C.6 liter (1 I cubic meter (.n 3) = 1.3 cubic yards (cu yd, yd -)
I C.llon (gal) = 3.8 liters (I)
1 cbc ft (cu ft, ft3) = 0.03 cubic meter (m3)
I cubc ard cu yd, yd3 ) = 0.76 cubic meter (m")
TEMPERLATURE (!XAci TEMPERATURE (EXAC-
Ix-32)(5-911 F = y'C [(9,5) y+32]'C = F
QUICK INCH-CENTIMETER LENGTH CONVERSION
INC ES 0 1 2 3 4 5 6 7 8 9 10I ' I I I 1 I
CEN7!%,E7E RS 0 1 2 3 4 5 6 7 8 9 10 11 12 13 14 15 16 17 18 19 20 21 22 23 24 2,
25-40
QUICK FAHRENHEIT-CELCIUS TEMPERATURE CONVERSION
-40" -22' -4" 14* 32" 50 688 6 " 104* 122" 140" 158*1' 1 S4 212"* 9 I
S - 3 -:0* -10' 0. 10. 20 " 30" 40. 5.. 60- 70" s0 90 103
Fcr -,,e exaci and or cther convers;on factors, see NES Miscellaneous Publication 236, Units of Weights andVeasu,ess Price 52,53. 5 Catalog No. C1 3 10 2E6.
iv

Preface
Work reported in this document was accomplished under thedirection of the Volpe National Transportation Systems Center(VNTSC), Cambridge, Massachusetts and the sponsorship of theFederal Aviation Administration Technical Center, Atlantic City,New Jersey. Dr. John Brewer is the current VNTSC technicaltask initiator for this effort, which was conducted as Subtask 4 onTTD No. VA-0013 under Contract No. DTRS-57-89-C-00006.
This report describes a simplified procedure for thedevelopment of stress histories for use in the analysis of aircraftfuselage repairs. The work was performed by Dr. David Broek ofFractuResearch in conjunction with Messrs. Richard Rice andSamuel Smith of Battelle.
The authors acknowledge the support of Melanie Violette,formerly of the VNTSC, on this task. In addition, weacknowledge the efforts of the following reviewers - Mr. TomSwift, Los Angeles Aircraft Certification Office FAA, Long Beach,California; Dr. Jack Lincoln, ASD/ENFS, Wright Patterson AFB,Ohio; and Mr. Tom Disney. Marietta, Georgia.
A.Ss1OXZ For
075 PA&IDTIC 'TAB
l~~tr lbwt I ot!
Availll~tTx7 Cdas
Dist P0*.. ti i¢rQs

Table of Contents
Page
1. INTRODUCTION. .. .. .. .. .. .. .. .. ... .. .. ... .. .. ... .. .. ... .. .. 1
2. FUSELAGE LOADING............................................. 22.0 Loading Segments........................................ 22.1 Gust Loadings.......................................... 22.2 Maneuvers............................................ 62.3 Basic Fuselage Stress History................................ 6
3. THE EXCEEDANCE DIAGRAM......................................893. 1 Measured Spectra and the TWIST Standard...................... 83.2 Proposed Spectrum...................................... 11
4. STRESS HISTORY GENERATION.................................... 154.1 Stress Levels.......................................... 154.2 Different Flight Types.................................... 184.3 Issues of Importance..................................... 24
5. FUSLAG STRESSES............................................ 255.1 Scope...................................255.2 Approximate Fuselage Stress Analysis......................... 255.3 Limit Load Analysis............................. ........ 30
6. COM%,PARISON OF PROPOSED STRESS ti[STORYGENERATION SCHEME WITH MANUFACTURER'S...................... 31
7. REFERENCES .............................................. 45
V

List of Figures
Page
FIGURE 1. COORDINATE SYSTEM ................................. 3FIGURE 2. GUST LOADING AL .................................... 4FIGURE 3. MANEUVER LOADING TAKE-OFF ROLL ..................... 6FIGURE 4. MANEUVER LOADING BANKING IN CURVE ................... 7FIGURE 5. TYPICAL STRESS HISTORIES FOR AIRCRAFT FUSELAGE .......... 9FIGURE 6. LOAD SPECTRA PERTAINING TO 40,000 FLIGHTS FOR
DIFFERENT AIRCRAFT ................................. 10FIGURE 7. STANDARDIZED SPECTRUM FOR 40,000 FLIGHTS TWIST ......... 12FIGURE 8. PROPOSED SIMPLIFICATION TO STANDARDIZED TWIST
SPECTRUM FOR 40,000 FLIGHTS .......................... 13FIGURE 9. REPAIR SPECTRUM (SEE FIGURE 8) IN TERMS OF n. .......... . 14FIGURE 10. REPAIR SPECTRUM FOR 600 HRS (COMPARE TO FIGURE 9) ....... 15FIGURE 11. OBTAINING STRESS LEVELS AND EXCEEDANCES .............. 16FIGURE 12. EFFECT OF LEVELS IN EXCEEDANCE DIAGRAM
APPROXIMATION; COMPUTED NUMBER OF HOURS FORCRACK GROWTH AS A FUNCTION OF NUMBER OFLEVELS. ONE LEVEL IS CONSTANT AMPLITUDE ............... 17
FIGURE 13. TURBULENCE, GUSTS, AND CONTINUITY OF AIR;UP AND DOWN GUSTS OF ABOUT EQUAL MAGNITUDEOCCUR IN CLOSE SUCCESSION ........................... 19
FIGURE 14. REAL (SEMI-RANDOM) AND WRONG (RANDOM) HISTORIES ....... 21FIGLRE 15. STRESS HISTORY WITH DIFFERENT FLIGHTS
(SEM I RANDOM ) . .................................... 22FIGURE 16. FUSELAGE LOADING ............................. .... 26FIGURE 17. FUSELAGE BENDING . ................................. 27FIGURE 18. FUSELAGE STRESSES ................................. 28FIGURE 19. AREAS OVER WHICH STRESSES ARE ASSUMED THE SAME ....... 33FIGURE 20. BOEING SPECTRUM; ALL FLIGHTS ARE THE SAME.
LAST 3 CYCLES ARE MAKE UP CYCLES ..................... 34FIGURE 21. MISSION 3 ALTITUDE PROFILE . .......................... 35FIGURE 22. SHORTENED SPECTRUM, TOUCH AND GOES DELETED .......... 36FIGURE 23. FLIGHT TYPES, EVERY OCCURRENCE WITH DIFFERENT
SEQ U E N C E . . . . . . . . .. . .. .. .. . . . . .. . . . . . .. . . . . . . .. . . . 39FIGURE 24. CRACK GROWTH COMPAR;SON OF BOEING AND PRESENT
SPEC TR U M . ................ .... .................... 41FIGURE 25. CRACK GROWTH, PRESENT SPECTRUM FOR AREAS J, K.
A N D L . . . . . . . . . . . . . . . . . . . . . . . . . . . . . . . . . . . . . . . . . . . . . 43
vi
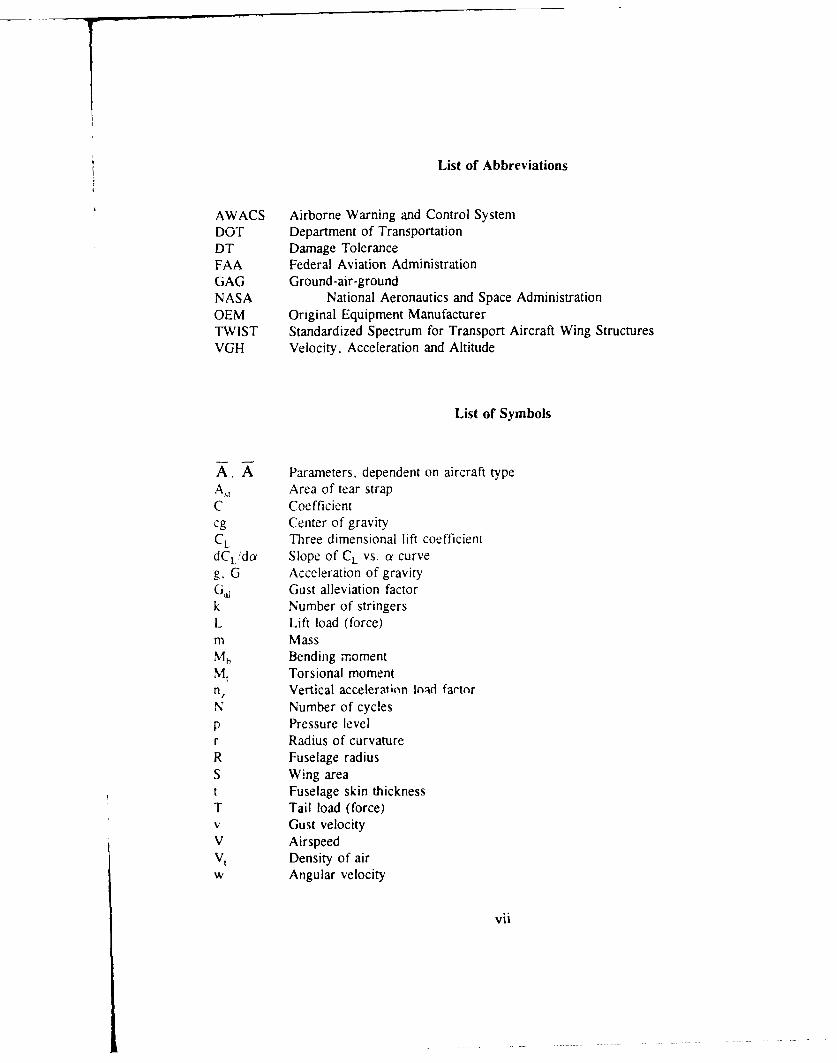
List of Abbreviations
AWACS Airborne Warning and Control SystemDOT Department of TransportationDT Damage ToleranceFAA Federal Aviation AdministrationGAG Ground-air-groundNASA National Aeronautics and Space AdministrationOEM Original Equipment ManufacturerTWIST Standardized Spectrum for Transport Aircraft Wing StructuresVGH Velocity, Acceleration and Altitude
List of Symbols
A, A Parameters, dependent on aircraft typeA, Area of tear strapC Coefficientcg Center of gravityCL Three dimensional lift coefficientdCLida Slope of CL vs. a curveg, G Acceleration of gravityG'j Gust alleviation factork Number of stringersL Lift load (force)m MassMh Bending momentMt Torsional momentn, Vertical acceleration loId fartorN Number of cyclesp Pressure levelr Radius of curvatureR Fuselage radiusS Wing areat Fuselage skin thicknessT Tail load (force)v Gust velocityV AirspeedVt Density of airw Angular velocity
vii
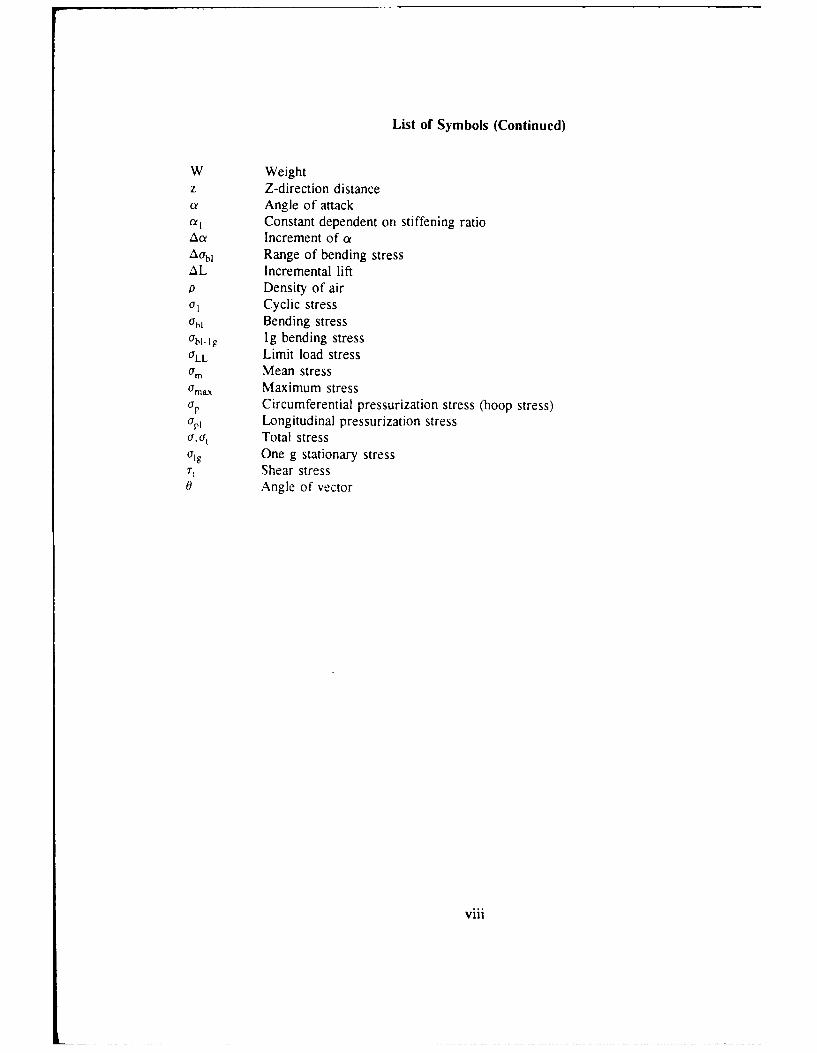
List of Symbols (Continued)
W Weightz Z-direction distanceot Angle of attack011 Constant dependent on stiffening ratioAU Increment of aAabl Range of bending stressAL Incremental liftp Density of aira, Cyclic stressOhl Bending stress
1bl-1g Ig bending stressaLL Limit load stressam Mean stressOmaX Maximum stressup Circumferential pressurization stress (hoop stress)ai Longitudinal pressurization stress0,at Total stressaig One g stationary stressTt Shear stress0 Angle of vector
viii

Executive Summary
This report describes a simplified procedure for the development of stress hstories for use
in the analysis of aircraft repairs. Although repairs of all components of the airframe are of
interest, this report concentrates on stress histories for fuselage skin repairs. A description of
typical fuselage loadings is provided, and basic fuselage stress histories are described. A method
for development of an exceedance diagram for analysis of fuselage skin repairs is detailed. A
methodology for generating detailed stress histories is also reviewed.
Some of the key features of this methodology are (1) the inclusion of a range of flights of
different severities, (2) the inclusion of deterministic loads where they occur, e.g. ground-air-
ground cycles, (3) the use of a near-optimum number of stress levels (10-16 positive and
negative). (4) the combination of positive and negative excursions of equal frequency, and (5)
matching of the total number of flights and cycles with the total exceedance diagram. Two
methods of estimating fuselage skin stresses are presented, the first based on static equilibrium
requirements and the second based on a limit load analysis.
A comparison of the proposed history generation scheme with that of an airframe
manufacturer for the KC-135 is also presented. The predicted fatigue crack growth patterns for a
hypothetical through crack at a fastener hole are compared for the two history generation schemes
it three areas within a fuse!age. Predicted crack growth lives are within a factor of 1.5 for two
J the three cases. For the third case (which is predicted to be the least severe by both
,cchniques) the proposed scheme results in substantially longer crack growth life predictions.
The probable reasons for these differences are discussed.
ix

L INTRODUCTION
Commercial aircraft operators arc required by FAA regulations to repair damaged
aircraft structure. This must be performed in a timely manner so that the aircraft downtimc is
kept to a minimum and the loss of revenue is small. In many instanc-s the airline operator
will not have enough time to obtain structural repair data, analysis or information from the
original equipment manufacture (OEM) and needs to perform the fatigue and damage
tolerance (DT) analysis of the repair himself using simple straightforward analytical tools and
the OEM repair manuals.
The FAA aging aircraft program has many programs and tasks directed at enhancing
the engineering evaluation of the structural integrity of aircraft repairs. In general the guiding
principle for an aircraft structural repair is to restore the structure to its original (or better)
static strengzth and stiffness capability. However, the repair must also be designed for
,dequatc fatigue resistance, damage tolerance and inspectability.
Fatiuue and DT analyses must be based on realistic stress histories, which, in turn. must
Ne derived from realistic load spectra. Therefore, an algorithm for the development of a stress
history must be included in an analysis of repairs. This report describes a simple and
straightforward method to obtain an approximate stress history for specific locations in an
;iircraft fusclage.
It is important to recognize that the structural analysis and stress
>pcctrum 'loadings development described here are approximate analyses and have certain
limitations. The results can be used to compare the quality of different repair options or to
compare the quality of a candidate repair with the original structure. If more precise and
quantitativc analyses are required. more detailed structural analysis and stress results for
,ecifie locations in the aircraft should either be obtained from the OEM or calculated
through the use of sophisticated structural anaysis codes such as finite element methods.
Although repairs of all compone-,,-, of the airframe are of interest, this report
concentrates on stress histories for f-.,,elage skin repairs. For other cases this basic approach
can be ceneralized for wings atW .mpennages with limited additional effort.
This report first conslders fuselage loading in Section 2. A realistic spectrum is derived
in Sc,:tion 3, and the algorithm for stress history generation follows in Section 4. Section S.
-rie flyaddresses ways to obtain estimates of actual fuselage stresses[l1. Finally, Section 0

offers a comparison of the proposed stress history generation scheme with that used by an
aircraft manufacturer.
2. FUSELAGE LOADING
2.0 Loading Segments
An aircraft fuselage is subjected to flight segments with different loading content
during a typical flight. The loading consists of the 1.0 g stationary load and dynamically
Induced loadings. The flight segments within which the dynamic loading occurs arc taxiing
and take-off, ascent/climb with pressurization, cruise, descent with depressurization, landing
impact and taxiing. Over the years NASA and the FAA have conducted several flight loading
survcvs on th,," response of commercial aircraft to gust and maneuver loadings. The
experimental data taken in the form of velocity, g-levels and altitude (VGH) are reduced to
ba'.ic cxcccdancc curves for the various types of aircraft such as large or medium size and
commuter aircraft. The cyclic content and magnitude of stresses at a particular fuselage
location arc determined from excecdance diagrams for gust and maneuver loadings.
Rctcrcncc 121 provides detailed data on the most recent NASADOT/,A_ program on VGH
t-,ht loadings data for the B727, L-1011, DC1O, and B747 aircraft.
The stress history development for a given location in the fuselage must consider the
prcssurization, gust and maneuver loadings. The primary loadings in the fuselage are the
pressure loads v ith superimposed maneuver and gust loadings. The stresses at the location
, ci!',.tcd for an analysis arc determined by structural load transfer functions which account for
:he response of the aircraft fuselage to gusts and maneuvers. The determination of
pressurization stresses is straightforward.
2.1 Gust Loadings
Ihe normal coordinate system for the aircraft structure is shown in Figure 1. Besides
prcssurization, the next primary source of cyclic loading on a commercial aircraft fuselage is
gust. Gust loads on the wing will cause cyclic fuselage bending: lateral gusts on the tail fin will
cau,, fuselage torsion. As such, the gust spectrum is relevant to the definition of fuselage

cvclic loads. Figure 2 explains the elements of gust loading. During normal stationary flight
the lift is equal to the aircraft's weight (L = W4 , regardless of altitude, airspeed or angle of
incidence, each of these being ,,propriately adjusted according to circumstances. Note that
the tail load, T, is generally small (positive or negative) and ideally equal to zero. The tail is
needed only to equilibrate the total moment and to account for maneuvers.
Y.. Center of Mass
Z
FIGURE 1. COORDINATE SYSTEM
A gust causes a AL up or down, as shown in Figure 2c. For a ramp-type or (I-cosizc)
a:. gust allcviation factor, Ga, must be included, which depends upon aerodynamic inertia.
A l.i-:, sluLccish aircraft (74" or DC10) has a lower Gai than a smaller one (737 or DC)).
IFu' t1 1) shows that for a particular aircraft type the AL is always proportional to the gust
it' . "'. -cd the airspeed, 11 recardless of altitude.
3

-JL) I >~> ~
1 U U
Ill II!
-J
+1
z
~JJ -
Cl)
-z1'I
I -, -~
I C.)
CT) ~N
-IN Cd)
-~
4

dCL
AL = -pV'S d Aa2 d'ca
I pV2 S GII dC_L U()
2 da V
IpS Gal S UV *,CUV2 da
p = Density of the airS = Wing areaG,,, = Gust alleviation factor depending on aircraft and altitudeCL = Three dimensional lift coefficienta = Anglc of attack, angle between free-stream and wing velocity and wing chord
linedCL
- Slope of CL vs. a curvedoa
C = L'2 product of above factors.
Substituting L (with L = W). one can also derive Equations (2a) and (2b), where A and A
depend u. ,n the aircraft type.
AL =L Ga L 1 U -A WU =XWU (2a)da CL V V
L , AL W + AL W + AWUnz ... 1 + A U (2b)S L W W
Note that most airliners basically fly at the same average airspeed. This leads to the equation
for vertical acceleration, n: as in Equation (2b). Hence. the bending moment, and, therefore
the cyclic stress (per Equation (3)), is proportional to U. where C depends upon the aircraft
type weight distribution and fuel load.
5

a = a g Co g (3)
It follows that fuselage cyclic loading can be derived directly from gust spectra,
especially wing spectra. as shown in Sections 3-5.
2.2 Maneuvers
Cyclic loads due to maneuvers are a consequence of inertia forces. As shown for two
typical maneuvers in Figures 3 and 4, the center of gravity (e.g.) acceleration, nz, can be
determined for any maneuver. Although maneuvers are the primary source of cyclic loads for
fiizhters and trainers, for commercial aircraft, maneuver loads are small and infrequent
compared to gust loads.
k + L =nzW
0 0 2..... ~ ~ ~ M "r% _ lm = mnV2/r
W7
nzW
FIGURE 3. MANEUVER LOADING TAKE-OFF ROLL
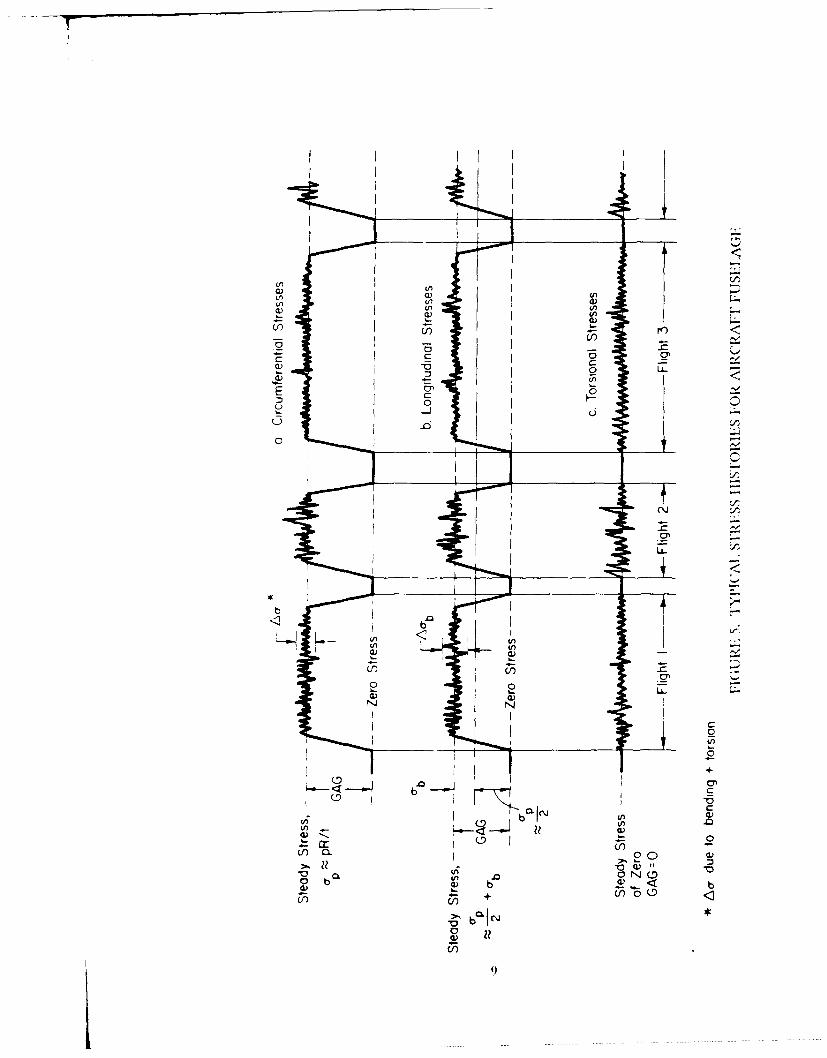
2.3 Basic Fuselage Stress History
Gust and maneuver loads are not the only source of cyclic stress on a fuselage. The
pressurization cycle, occurring once per flight, is a major contributor, especially for
circumferential stresses. Table I provides a summary of typical pressurization stresses for
common commercial aircraft. Combination of the appropriate pressurization stresses with the
gust and mancuvcr induced stresses discussed in Sections 2.1 and 2.2 leads to the stress
histories shown in Figure S.
6
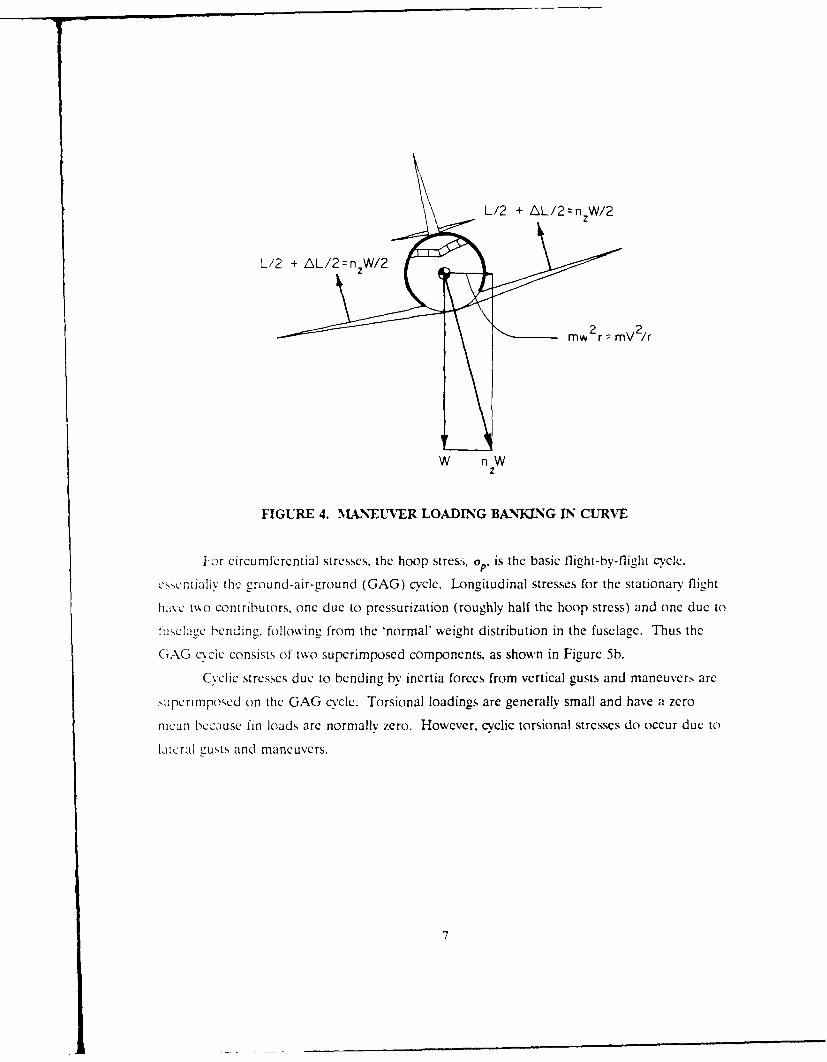
L/2 + z1L/2=nzW/2
L12 + LL/2=nzw / 2
m rV 2 /rmw r--V/
W nWz
FIGURE 4. MAINEUVER LOADING BANKING IN CURVE
For circumfcrcntial stresses, the hoop stress. op, is the basic flight-b-flight ccle.
cs,cntiallv the ground-air-ground (GAG) cycle. Longitudinal stresses for the stationary flight
fiivc two contributors, one due to pressurization (roughly half the hoop stress) and one due to
tuseluge,,c bending, following from the 'normal' weight distribution in the fuselage. Thus the
GAG c.-clc consists of two superimposed components. as shown in Figure 5b.
Cyclic stresses due to bending by inertia forces from vertical gusts and maneuvers arc
,upcrimpo-ed on the GAG cycle. Torsional loadings are generally small and have a zero
mcan because fin loads arc normally zero. However, cyclic torsional stresses do occur due to
lateral gusts and maneuvers.
7

TABLE L VARIATION LN AIRCRAFT HOOP STRESSES
Hoop Stress, Minimum Skinksi Aircraft Alloy Thickness, inches
9.8 DC9 2014/24-T6 0.050
12.8 DC-8 2014-T6 0.050
14.8 L-1011 7075-176 0.068
15 0 DC-10 2024-T3 0.068
15.7 737 2024-T3iT4 0.036
15.9 707/727 2024-T3/T4 0.040
18.3 747 2024-T3 0.063
3. THE EXCEEDANCE DIAGR.AM
3.1 Measured Spectra and the TWIST Standard
As demonstrated in Section 2, and especially in Figure 5, the major fuselage cycle is the
GAG cycle due to internal pressurization; the superimposed cyclic stresses arc due primarily
to the fusclage response to the wing, which is subjected to gust and maneuver loadings. The
fuselagc stresses are due to inertia loads, which in turn are due to wing loads. Thus, the
fuselage spectrum for the bending loads can be obtained from the wing spectrum using the
proper load-to-stress conversions (stress transfer functions) obtained from structural analvses-
The best way to obtain the cyclic stress spectrum due to gusts and maneuvers is from
measurements. Extensive measurements on wings were made[2,3]; they are shown in Figure 6
(many more arc presently available). Obviously, different aircraft types have somewhat
diffcrent spectra, which is mainly due to the difference in the gust alleviation factor G,,. Tr a
and C. the parameters shown in Equations (1) and (2). Also note that these measured spectra
inherently include maneuver loads. The latter are small compared with the gust loads. The
spectra arc essentially symmetric and nearly linear on a semi logarithmic scale.
8
00
- C:
C)~
-C-
CU Q)
0r0C
0c 0
C) Dn C0N
Ob b 2,<b+) <3)
U)

c el0 0.
C)
a) 11Wr-C V YIzE Q)
(n co >iCLC
- mHQK\
~ CCL
C/C I'0I < (W III I
IIL M U ) C)
,17
0 00
...... ..
These measured spectra were used[31 to establish a standard spectrum, called TWIST,
which is also shown in Figure 6 and in more detail in Figure 7. Note that the stresses are
expressed as a ratio to the Ig stationary flight stress, so that adjustments can be made for the
stress level: the stress axis can be obtained when the Ig stress level is known. It should be
pointed out that TWIST was developed for comparative testing. It is not a standard spectrum
for desikz. Nevertheless, it can serve very well as a basis for the present purpose provided the
stress levels are adjusted for fuselages of different aircraft systems.
Since TWIST is used for testing, detailed procedures have been developed to generate
stress histories from the exceedance diagram of Figure 6. Although such histories are useful
for testing, they are cumbersome. to say the least, for analysis; easier, but similar ways to
derive stress histories can be devised, as will be shown in Section 4.
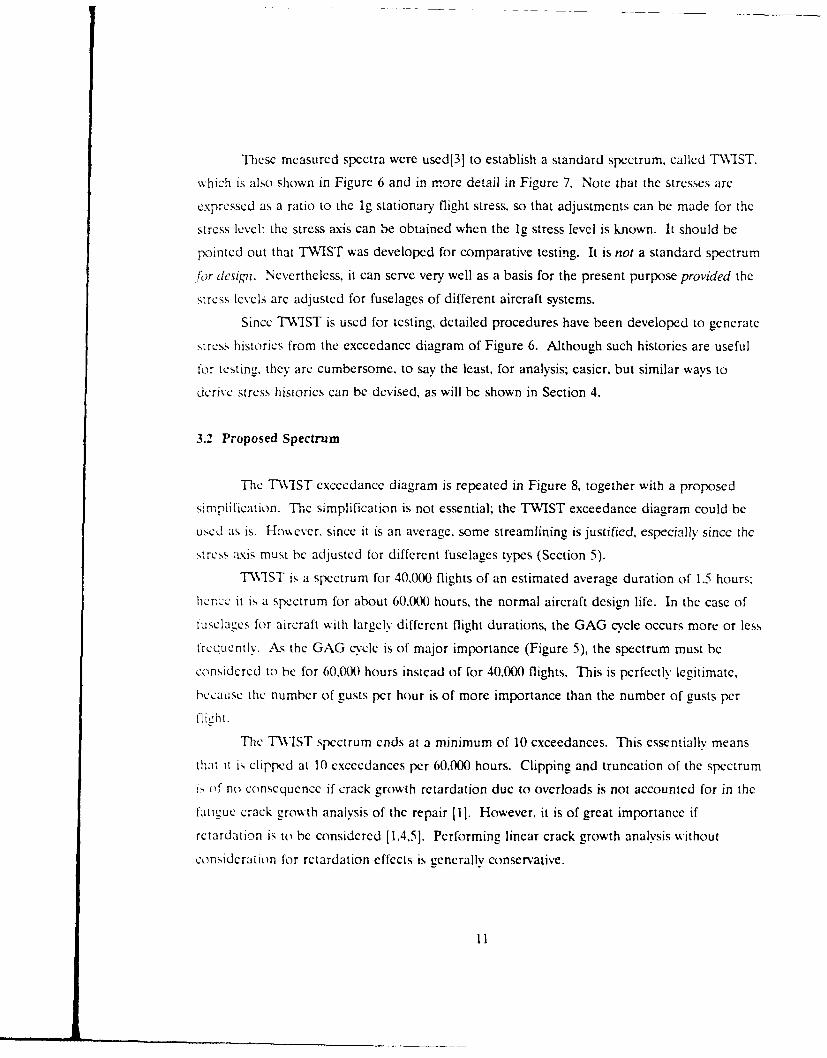
3.2 Proposed Spectrum
The TWIST exccedance diagram is repeated in Figure 8, together with a proposed
simplification. The simplification is not essential; the TWIST exceedance diagram could be
used as is. However, since it is an average, some streamlining is justified, especially since the
stress axis must be adjusted for different fuselages types (Section 5).
TWIST is a spectrum for 40,000 flights of an estimated average duration of 1.5 hours:
hence it is a spectrum for about 60.000 hours, the normal aircraft design life. In the case of
fusclages for aircraft with largely different flight durations, the GAG cycle occurs more or less
frcquently. As the GAG cycle is of major importance (Figure 5), the spectrum must be
considered to be for 60,0M0 hours instead of for 40,000 flights. This is perfectly legitimate,
because the number of gusts per hour is of more importance than the number of gusts per
11L h t.
The "TVIST spectrum ends at a minimum of 10 exceedances. This essentially means
that it is clipped at 10 exceedances per 60,000 hours. Clipping and truncation of the spectrum
i of' no consequence if crack growth retardation due to overloads is not accounted for in the
fatiLguc crack growth anaiysis of the repair 11]. However, it is of great importance if
retardation is to be considered [1.4,51. Performing linear crack growth analysis without
consideration for retardation effects is generally conservative.
11

InI
1 iII 111 jI I I I
I v
0 IJ Ij I I
112

00C
Cz CL
1 E
131

As discussed in Section 4, a 60.000 hour spectrum is unwieldy and unnecessary for
stress history generation, especially when it is clipped anyway. Therefore, the proposed
spectrum is reduced to one for 600 hours. The logic for the reduction can be understood by
comparing Figures 9 and 10. The 600 hour spectrum of Figure 10 is same as the one in
Figures 8 and 9, but is more suitable for the stress history generation explained in Section 4.
Note that this spectrum is "automatically" clipped at the once per 600 hours exceedancc
(100 times per 60,000 hours), which is more conservative if retardation is accounted for [1]
and i4. The spectrum shown in Figure 10 can be converted to stress quite easily, since the
fusclagc pressurization stress and the limit load stress are known for all certified aircraft. This
%ill he explaincd in Section 5.
Once in 60,000 hrs
08 -Clipping level
06 -
04 -
0 2
00 i0 1 0 210 104 0 106
-Exceedonces-02
FIGURE 9. REPAIR SPECTRUM (SEE FIGURE 8) IN TERMS OF nz
14

a"LL Once in 60,000 hrs
2 10; 0 102
Exceedances
I 'RE 10. REPAIR SPECTRUM FOR 000 HRS (COMPARE TO FIGU7RE 9)
4. STRESS HISTORY GENERATION
4.1 Stress Levels
DcpcndJing upon the counting procedure, the exceedance diagram shows the number of
tlimes a, positive or negative stress excursion is cxxceedd i.c.. it show,\s the size of the stress
rainuc and their frequencv. In the schematic example in Figure 11, stress Level 4 is exceeded
3)0times and Level 3 is exceeded 20.00(0 times. A-s a result. there vvill be 20,000 - 3.000=
V000 I)evnts In \%hieh the stress reaches a levecl somewhere between Levels 3and 4.
15

6
5C A
4D
3
u- 0 ceady
i01 102 10 4 06 10,
2 Exceedonces
3
4
5
6
Examplc of level approximation (only 6 levels shown for clarity)
Level Excecdances
6-0 30
300
4-4 3000
30000
300000
1-1 3000000
FIGURE 11. OBTAINING STRESS LEVELS AND EXCEEDANCES
16
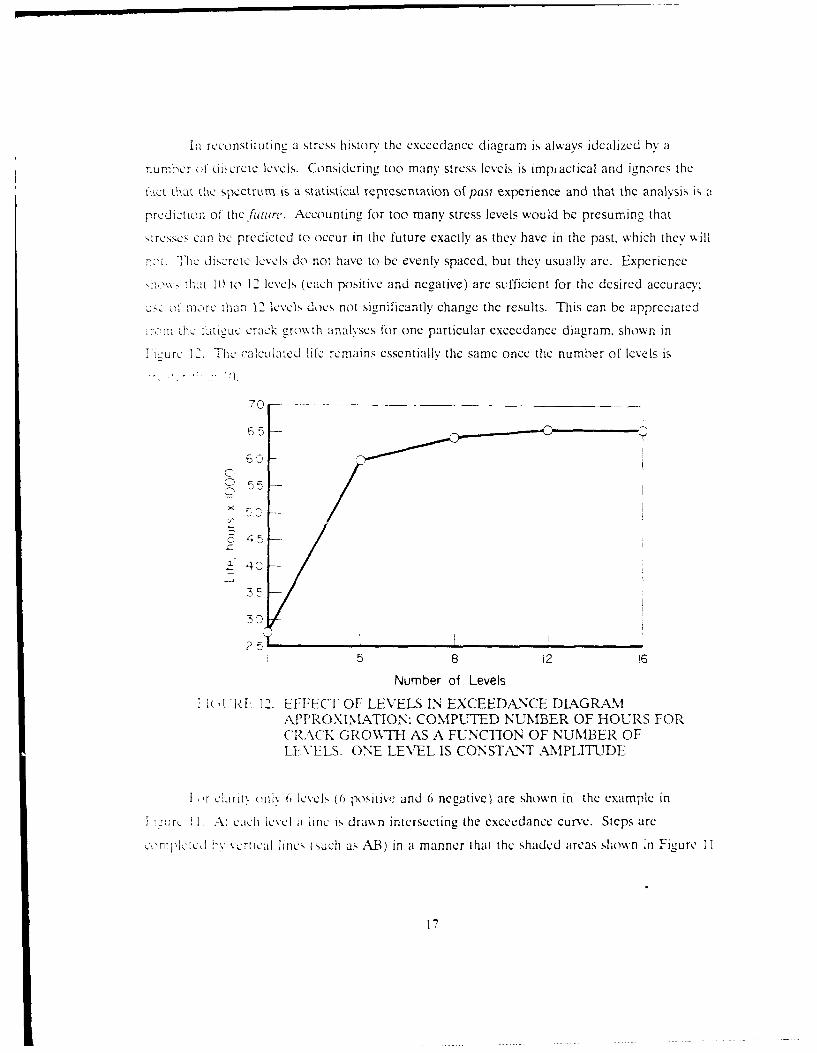
In reconstituting a stress history thc execedancc diagram is alwavs idealized bv a
numbcr of diycrctc levels. Considering too many stress levels is impiactical and ignores the
tact that the spectrum is a statistical representation of past experience and that the analysis is a
prediction of the future. Accounting for too many stress levels would be presuming that
stresses can be predicted to occur in the future exactly as they have in the past, which they will
Pw. I'he discrete levels do not have to be evenly spaced, but they usually arc. Experience
tow> th.it 10 to 12 levels (each positive and negative) are svfficient for the desired accuracy:
u ot more than I'2 levels does not significantly change the results. This can be appreciated
:ror'n thc atiguc crack grovth analyses for one particular exceedance diagram, shown in
Tigure 12. The :alculated life remains essentially the same once the number of levels is
70
6.
C
55
E 4~
30V
5 8 12 16
Number of Levels
T( I 'RE 12. EFFECT OF LEVELS IN EXCEEDANCE DLAGRAMAPPROXILATION: COMPUTED NUMBER OF HOURS FORCRACK GROWTH AS A FUNCTION OF NUMBER OFLEVELS. ONE LEVEL IS CONSTANT AMPLITUDE
I ,r clrity onkly , levels (6 positive and 6 necative) are shown in the example in
1 1:_.r¢ I. At ac:h level a line is drawvn intersecting the exceedance curve. Steps arc
c 'ipitrY:e % vcrtical lines (such as AB) in a manner that the shaded areas shown *n Figure 11
are equal. Figure 11 also shows how the exceedances, and from these the number of
occurrences of each level, arc obtained.
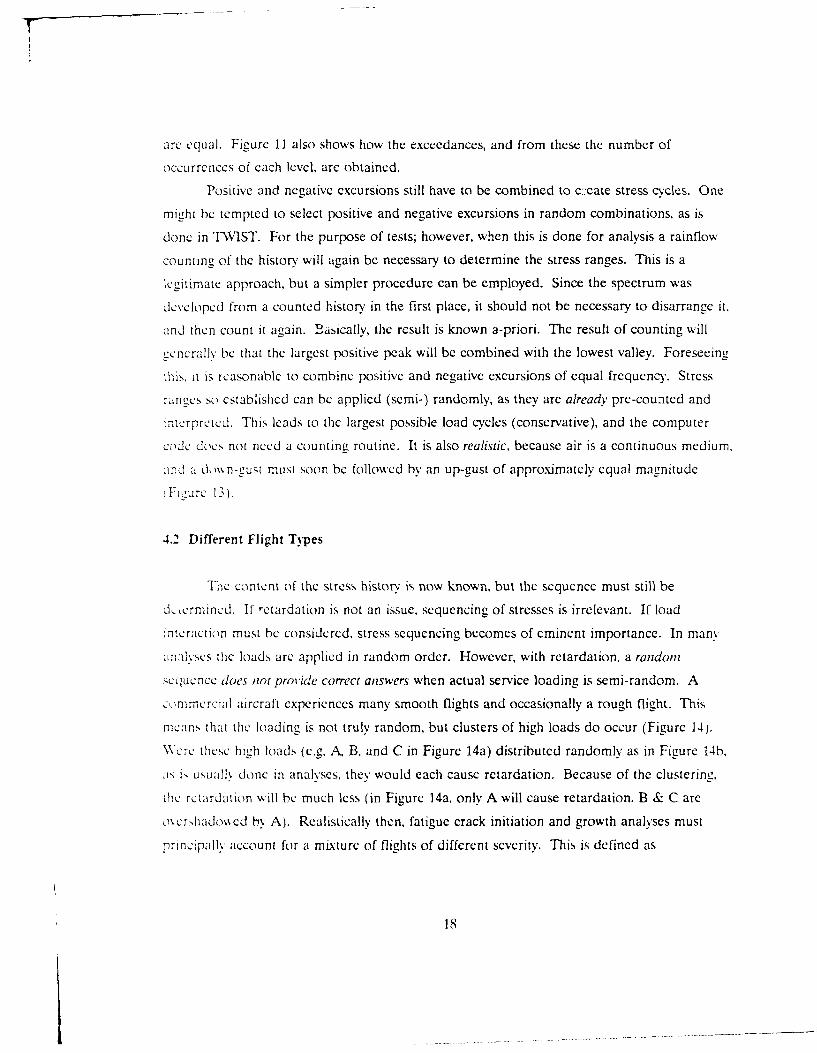
Positive and negative excursions still have to be combined to cr:eate stress cycles. One
might bc tempted to select positive and negative excursions in random combinations, as is
done in TWIST. For the purpose of tests; however, when this is done for analysis a rainflow
counting of the history will again be necessary to determine the stress ranges. This is a
legitimate approach, but a simpler procedure can be employed. Since the spectrum was
developed from a counted history in the first place, it should not be necessary to disarrange it.
and then count it again. Basically, the result is known a-priori. The result of counting will
generally be that the largest positive peak will be combined with the lowest valley. Foreseeing
this, it is reasonable to combine positive and negative excursions of equal frequency. Stress
ranges so established can be applied (semi-) randomly, as they are already pre-counted and
interpreted. This leads to the largest possible load cycles (conservative), and the computer
code does not need a counting routine. It is also realistic, because air is a continuous medium.
and a don-gust must soon be followed by an up-gust of approximately equal magnitudei :iurc 13).
4.2 Different Flight Types
The content of the stress history is now known, but the sequence must still be
dcermined. If -ctardation is not an issue, sequencing of stresses is irrelevant. If load
interaction must he considered, stress sequencing becomes of eminent importance. In many
amlyses the loads arc applied in random order. However, with retardation, a random
sequence does not provide correct answers when actual service loading is semi-random. A
ccommercial aircraft experiences many smooth flights and occasionally a rough flight. This
means that the loading is not truly random, but clusters of high loads do occur (Figure 14).
\\ere these high loads (c.a, A, B, and C in Figure 14a) distributed randomly as in Figure 14b.
:11 I, usually done in analyses, they would each cause retardation. Because of the clustering,
the retardation .ill be much less (in Figure 14a, only A will cause retardation, B & C are
oCrshadowced by A). Realistically then, fatigue crack initiation and growth analyses must
principally account for a mixture of flights of different severity. This is defined as
18

Upgust
Aircraft path
Downgust
FIGURE 13. TURBULENCE, GUSTS, AND CONTINUITY OF AIRUP AND DOWN GUST OF ABOUT EQUAL MAGNITUDEOCCUR IN CLOSE SUCCESSION
scmi-randorn loading. There will be fewer severe flights than mild flights, as shown in the
cxample Figure 14. In the computer analysis flights of different severity must be applied in
random scqucncc, and the cycles within each flight must be random. Such a semi-random
sequence can be developed in many ways. A simple algorithm is shown in Table 2 on the
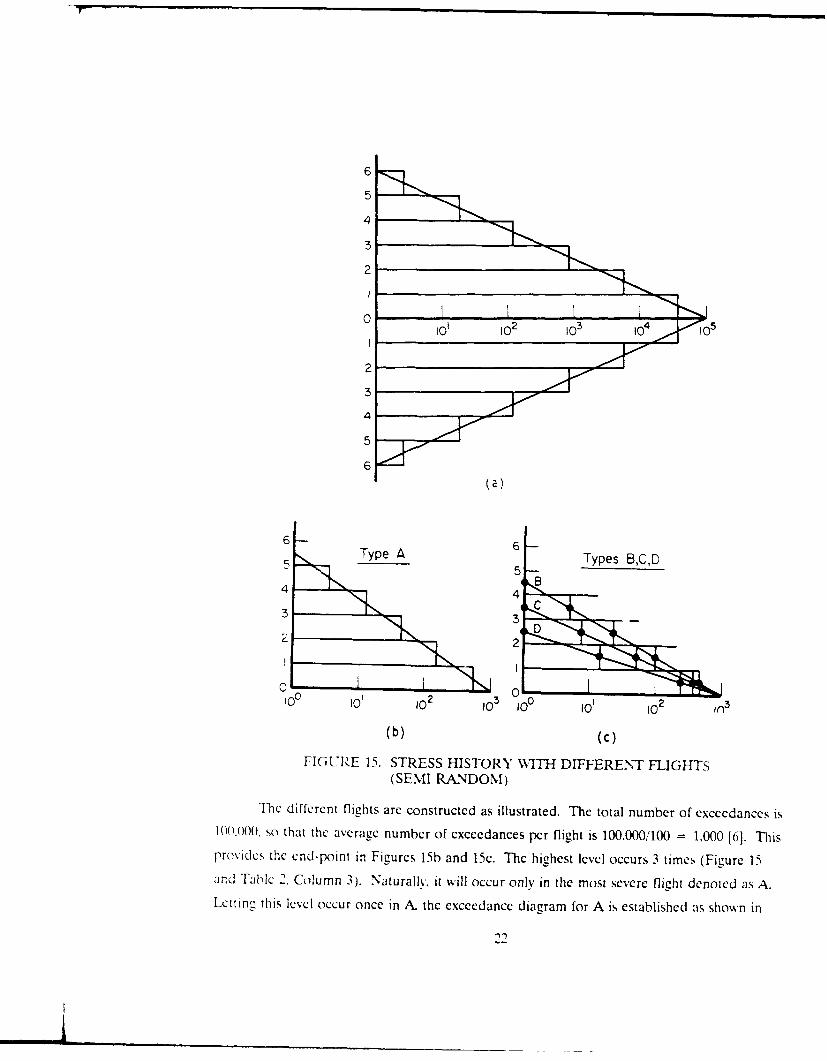
hasis of Figure 15. Mild and severe flights are constructed by recognizing that the excecdance
diagrams lor tie individual flights are of the same shape, as dcmonstrated bv Buller 161. but
ith different slopcs as shown in Figure 15c, their total making up the diagram of total
cxcccdanees (Fig.urc 15a). The following example is based upon a schematic exceedance
diagram tor 100 flights: again only 6 levels are used.
10

C)
200

uf C (n
E <
- I 0+
zr
-~ ~ ~ o Vo0 0 - -
r- 00 c,
Cl l O
Co 10 '0-
Cl 0 !- l 10-
-~e wl cc~Uo
Uc
-C -0 .2: 0 0.n l 'T :d
X mrA
2
- Cl uW) - - 0
o - ~ ~ I ~ C
6
5
4
3
2
0 10 i1 102 103 10e "15
2
34
5
6
(a)
6 --Type A Types B,C,D
5 5 -B
5 5' C
2 D
010 0 l0
0° 10r IO2 103 lop 01 10 2 i 3
(b) (c)
FIGURE 15. STRESS HISTORY WITH DIFFERENT FLIGHTS(SEMI RANDOM)
Thc diffcrent flights are constructed as illustrated. The total number of exceedances is10(1.100. so that the average number of exceedances per flight is 100.000/100 = 1,000 [6]. Thisprovidcs the end-point in Figures 15b and 15c. The highest level occurs 3 times (Figure 15and Table 2, Column 3). Naturally, it will occur only in the most severe flight denoted as A.Leting this level occur once in A. the exceedance diagram for A is established as shown in
,.22.

Figurc 15b, because the highest level (6) provides the point of I exceedance. Flight A can
occur only three times, because then the cycles of Level 6 are exhausted. The exceedances for
A are read from the exccedance diagram of A (Figure 15b), and from these the occurrences
(number of cycles) are determined as in Columns 4 and 5 of Table 2. There being three Type
A flights, the total cycles for all A flights are shown in Column 6. These cycles are subtracted
from the total so that the remainder for the other 97 flights is as shown in Column 7.
The next most severe flight is Type B. Its highest level will be Level 5. which will occur
once. This information permits construction of the exceedance diagram for B as shown in
Figure 15fe. Level 5 being at I exceedance. The exceedances and occurrences are determined
as in Columns , and 9 in Figure 15. Since there were only 12 cycles of Level 5 left after
subtraction of three flights A (Column 7), there can be 12 Type B flights. These 12 flights will
use the number of cyvcles shown in Column 10, which must be subtracted from those in
Column - to leave the remaining cycles in Column 11.
Flight C is constructed in the same manner. There can be 36 Type C severity flights
and then the cycles of Level 4 are exhausted. One could go on in this manner, but since there
no%, are only 49) flights left. it is better to divide the remaining cycles in Column 15 by 49 in
order to distribute them evenly over 49 Type D flights. This is done in Columns 15-17. There
arc some cycles unaccounted for, and a few too many cycles were used as shown in
Colum, 1,. These arc of lower magnitude, contributing little to crack initiation or growth -
and since the diagram is only a statistical average - this little discrepancy could be left as is.
Ho,,evcr. if one wants to be precise, they could be accounted for by a little change in the
contcnt 1Flight C. as shown in Columns 18-20.
Ir more than 6 levels are used, more (and different) types of flights can be generated.
tL Lexr. this %% as an example only, and there is no need to go to extremes as long as a
,emi-random history is obtained, recognizing that flights of different severity do occur and that
the he hcr load, are clustered in those flights. No matter how refined the procedure. the
A,:tU,'al load sequence in pracLice will be different. In accordance with the nature of the
loading, there arc only three Type A flights of a high severity in the total of 100. The majority
consists of mild flights of Types D (49) and C (36). Regardless of the number of levels chosen
and the number of flights, the above procedure will reflect this reality. Other procedures can
he dcx iscd. but the above is a rational one and easy to implement [4].
23

In crack initiation and growth analyses the various flights must be applied in random
order and the cycles within each flight applied randomly. Thus, the second occurrence of any
flight type will have a different sequence than its first occurrence, but the total cycle content
will bc the same. If the 'basket' with 100 flights is empty, it is 'refilled', and the process started
anew. vet because of the randomization the flights and the cycles within each flight will appear
in different order.
4.3 Issues of Importance
The stress history generated in the manner discussed provides the most realistic results
hen the total excccdances are on the order of 2,000 to 100.000 and the number of flights on
the ordcr of 5() to 1000. Therefore, it may be advantageous to reduce exceedance diagrams for
smallcr or larger numbers to the above ranges, as was done in Figure 10.
There are only a few issues of importance in the generation of a stress history, namely:
a. Flights of different severity must be applied. Random application of stressesderived by complicated means will negate all the efforts.
b. Deterministic loads must be applied at the point where they occur: GAG cyclesmust occur between flights; random application may defy all other sophisticatedprocedures.
c. A reasonable number of stress levels (10-16 positive and negative) must beselected. More levels will complicate the procedure without improving theresults and make the generation of different flight types much morecumbersome.
d. Positive and negative excursions of equal frequency must be combined.Random combinations will require subsequent counting, the result of which canbe foreseen, while the stress history was based on an already counted history inthe first place.
c. The total number of flights and cycles must be in accordance with the totalexceedance diagram.
The above criteria account for what may be called the signature of the loading. Small changes
in these, including clipping [1.4.51, will usually have more effect on crack initiation and growth
than any complicated means of establishing stress levels.
24

It is important to emphasize that the TWIST spectrum is based on measurements and
used for demonstration in this report, it should be compared with spectra furnished by the
OEM. Another important data source is the NASA/DOT/FAA aircraft loadings data [2]. In
dcveloping a stress history for a given repair in an aircraft fuselage, the repair engineer may be
wNcll advised to compare the stress history he or she develops with the proposed history and to
usc the most severe of the two.
5. FUSELAGE STRESSES
5.1 Scope
The basic. spectrum and stress history have now been established. What still needs to
K done i adjustment of the stress axis (actual stress) for the fuselage. There are two
rckitivc.-vsimpic ways to accomplish this:
a. Approximate fuselage stress analysis
!. Limit load analysis.
I1hs, : o possibilitics arc discussed in the following sub-sections.
5.2 Approximate Fuselage Stress Analysis
Ficure 1 shows an aircraft's weight distribution. Only the fuselage weight is of
z:mportancc for fuselaec bending: it is assumed to be evenly distributed. As shown inFigurc I'. local bending moments due to vertical gusts are determined from static equilibrium
rcquircmcnts. Given the Station No., x. of the repair, which is always known, the moments
14 and .,) are determined, and from this the approximate stresses can be readily calculated
;is sh,,n in Ficurc 18.
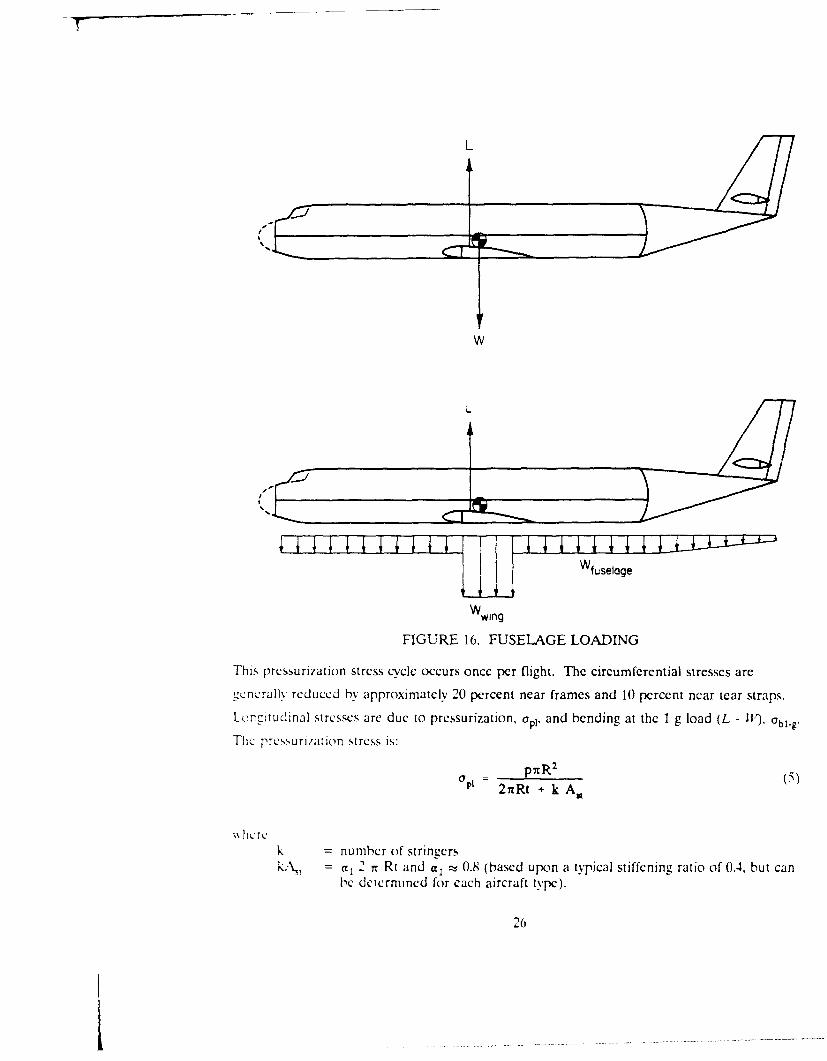
Circumicrcntial stresses can be calculated as follows:
_ pRP t
25
L
w
L
Wfuseloge
Wwing
FIGURE 16. FUSELAGE LOADING
This, pressurization stress cycle occurs once per flight. The circumferential stresses arepcncrallv rcdu ccJ by approximately 20 percent near frames and 10 percent near tear strans.
Lrnm!itudinal stresses arc due to pressurization, opl, and bending at the 1 g load (L - 11). abl-g-
The pressurizattion stress is:
= p~TR 2 ()
2trRt + k Ask
whCrCk = number of stringerskA,~ = a, 2 ~r Rt and a, -- 0.8 (based upon a typical stiffening ratio of 0.4, but can
be determined for each aircraft type).
26

IN
C-hj C fa
+ LI
u*)
C~0

CC)
C)C
b
C)
-o>
Gq.
A-r
b CL Q
.o: -0
) a)
n n 0',
4,' b

This lea'L ,o:
pitR 2 = pn R2 - p (6)o 2rRt(1 + a) 2TrRt(1 + 0.8) 3.6Rt
'he hendine stress is:
Mb Z Mb R sin 0 Mb sin 0°bl T-,R't - k Ast R' n R3t at 1t RtR2 1.8nt Rlt (7)
The total stress at I-c loading. a,. is then
p1+ { b1G I = Opl P+ Tbl()
' her c Is, the bending stress from Equation (7) for the 1-g bending moment. Superposed
;,), th> 1-g ,tress is the cyclic bending stress due to inertia during gust and maneuvers.
, ,,e spectrum (Figure S) shows that the once per 600 hours stress excursion (at I00)
e:xeCe,!ln:.cs in (,0,()00 hours) is 1.3 times the "'steady" stress, which in this case is the 1-g
.nJir, \ tre,,. Calculation of the 1-g bending stress therefore defines the entire cxccedance
J;,c-a ,o Figure 10} in terms of real stresses.
The stress historv can then be generated in accordance with the procedure described.
I\CrV .",,i xNill be an excursion due to bending from the 1-g steady stress Obl-g " so that the
>:ross tistor, is described as:
01(time) = (api + 0 bl). + AGbl(time) (Q)
b reaches r (O1 bl.g) once in 60(0 flights, as shown below:
O-s=sp + ctsb (GAG cycte)
0
"')0

If necessary the shear stresses due to torsion and bending can be included.
- AM, AM1 o=(0A'rt', -AK4 R = A • A at = A'rt (10)2 Rt 2T R3t
With the other stresses already obtained, this permits calculation of the largest principal
stress - the one to be used in the fatigue and crack growth analyses.
A complication that must be considered is that fuselage bending stresses due to wing
gusts and torsional stresses (due to lateral gusts) vary independently. It is likely, however, that
the torsion contribution will be small for circumferential cracks, and the bending contribution
ill he small for most longitudinal cracks.
Of course the value of a1 in api in Equation (6) can be adjusted in a stress analysis
program for different aircraft types. The effect of longitudinal stringers on bending stresses
and longitudinal pressurization stress is properly accounted for. Some adjustments to the
circumferential stresses to account for the effects of straps and frames must be made. and
apprOpriate adjustments must be made for door and window cut-outs and framing.
When the stresses in the basic structure are known in this manner, the stresses in the
repair can be calculated by compatible displacements (or other local stress analysis techniques)
fr any repair.
5.3 Limit Load Analysis
An alternative, but simplified, way to obtain the stress conversion it as follows:
Limit load is basically the load that is expected to occur once in the aircraft life
(i.e, once in 60,000 hours as shown in Figures 9 and 10). The structure is sized
such that the stress at ultimate load is equal to the material's design allowable
strength. The safety factor between ultimate and limit load is 1.5 (the
airworthiness requirement). Hence, the limit load stress follows immediately as
the design allowable stress divided by 1.5. One small limitation to this approach
is that different manufacturers do use different allowables, and these allowables
arc often lower than the "true" statistical allowable of the material.
30

In any case, given the material and hence the design allowable stress, thc limit load
;:ress follows as above. Since this is the stress which is assumed to occur once in about
it0.,0 h ours. the beginning points in Figures 9 and 10 are known, and hence the whole
excedance diagr:,m can be estimated. Another rule of thumb to consider in this analysis is
that limit load stresses (in 2024-T3) are usually set no higher than about 35 ksi.As aircraft structures are seldom designed exactly to the desin allowable limits (there
, \\* iv a margin of safety, which varies from location to location), the disadvantage of this
method 's a loss in accuracy, but the accuracy may suffice for comparative analyses. Its
: dvantue is that no special allowances have to be made for location and structural details.
i: sumption being that the original structure was dcigncd to conform to limit loadM ' , J- .
6.0 COMPARISON OF PROPOSED STRESS HISTORYGENERATION SCHEME WITH MANUFACTURER'S
To pro de an appreciation of how representative crack growth curves, as calculated
. h propsod stress history and spectrum, compare with those calculated by
rui:Aaturcr,. a comparison was made of crack growth computations based upon the
:<,,>,;Mi. procedure and those based on stress histories for the KC-135 and EC-135 [8]. The
..,cr kindly provided by the US Air Force. Only longitudinal stress estimates are
: .arcd in these xamplcs.
The ollo ing discussion is based on the word "spectrum" meaning the total load
c\per,,c (in terms of an exccedance diagram or otherwise), while the specific sequence of
Or stress used in an aralvsis or test is called a "'stress history". These definitions were
J;red to in the previous part of this report, but in the general literature they are often
or used alternatively without explanation. The two are essentially different - a
s::r.'. hi-,orv max be a very loose interpretation of the spectrum, as will be shown belo),. In
c the word "spectrum" is often used for both. which may lead to confusion.
B ,eorc presentation of the results ot the comparison, the stress histories for the militan
eersi(,)I the B-7h7-721()S require some discussion, because otherwise a fair comparison is
not possiie. The details of the analysis leading to the stress histories are not elaborated upon
iR crence [ l ihcrcforc, only the results are rcvicwcd briefly.
31

The fuselage of the aircraft is divided into Arcas A through 0, as shown in Figure 19.
Stress histories for these areas were derived, and these were assumed to be valid throughout
the area without regard to stress gradients or detail design. (It should be noted that the
bottom of Figure 19 roughly represents the neutral axis for fuselage bending.) Each of these
areas stress histories was derived on the basis of the load spectrum, taking into account flight
conditions (point-in-the-sky approach accounting for different flight segments as discussed).
Although details are not given, other cvidence[9] shows that the manufacturer used a loose
interpretation of TWIST (the spectrum proposed here) for the stress history in a recent full-
scale fatigue test: it is therefore reasonable to assume that similar considerations were used in
the derivation of the stress histories discussed here.
Apparently [8], stress histories for a variety of missions of the different military versions
of the aircraft were derived. By means of crack growth calculations, details of which arc not
specified, one particular mission (identified as Mission 3) was determined to be the most
severe. This led to a typical mission profile (stress history) as shown in Figure 20. Similar
stress histories were developed for all areas specified, using only Mission 3 for all areas. The
number of cycles in these missions, and the maximum stress in each area, are shown in
Figurc 19.
The first thing to be noted is that the most severe mission (which was taken as
representative for all versions) pertains to the AWACS version. The radar disk above the
tuselage may explain the fact that in Areas A through I the number of cycles is much larger
than elsewhere and that the stresses do not follow the anticipated pattern. For this reason.
Areas A through I could not be used for comparison with a commercial aircraft. This leaves
A-reas J through 0, from which Areas J, K, and L were selected as the basis for comparison.
The cycle numbers per m.ssion for these areas (Figure 19) do not seem to be
consistent. as (one must assume that) the cyclic stresses are due to bending cycles, the number
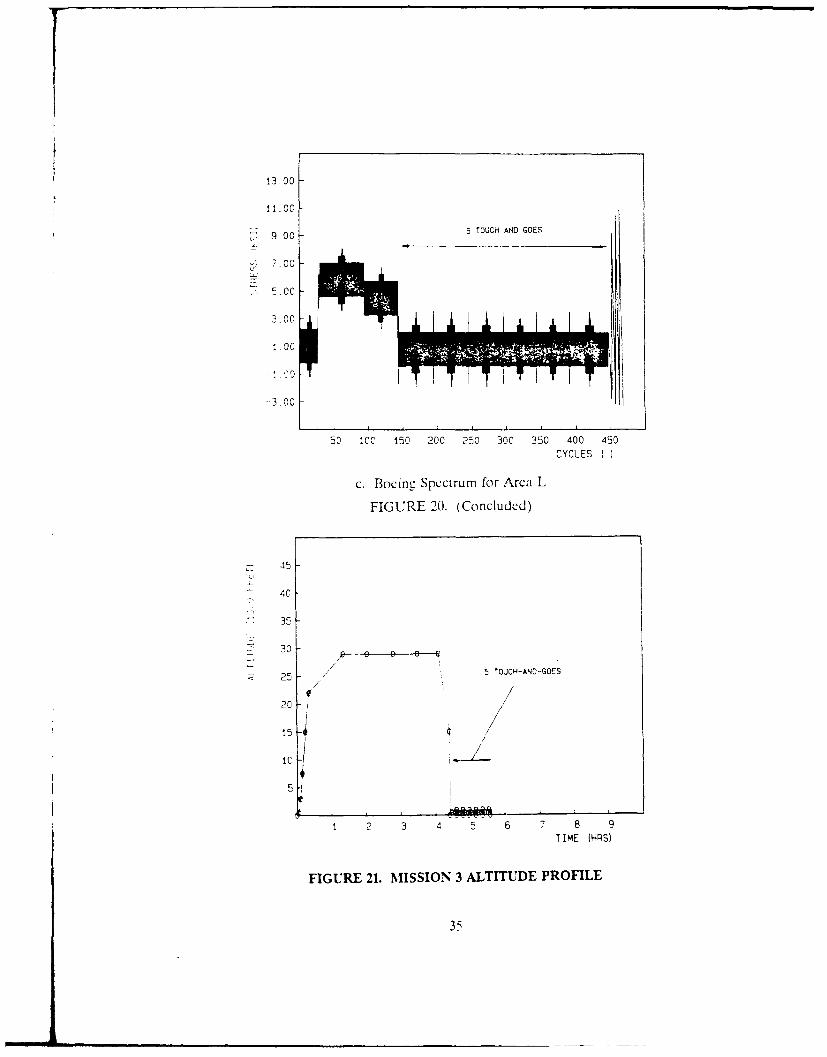
of which is the same for all areas in the fuselage. Be that as it may. Mission 3 includes 5
touch-and-co landings as illustrated in Figure 21. Because normal airline practice does not
incJude touch-and-gocs, the cycles concerned were eliminated. The stress histories for Areas J,
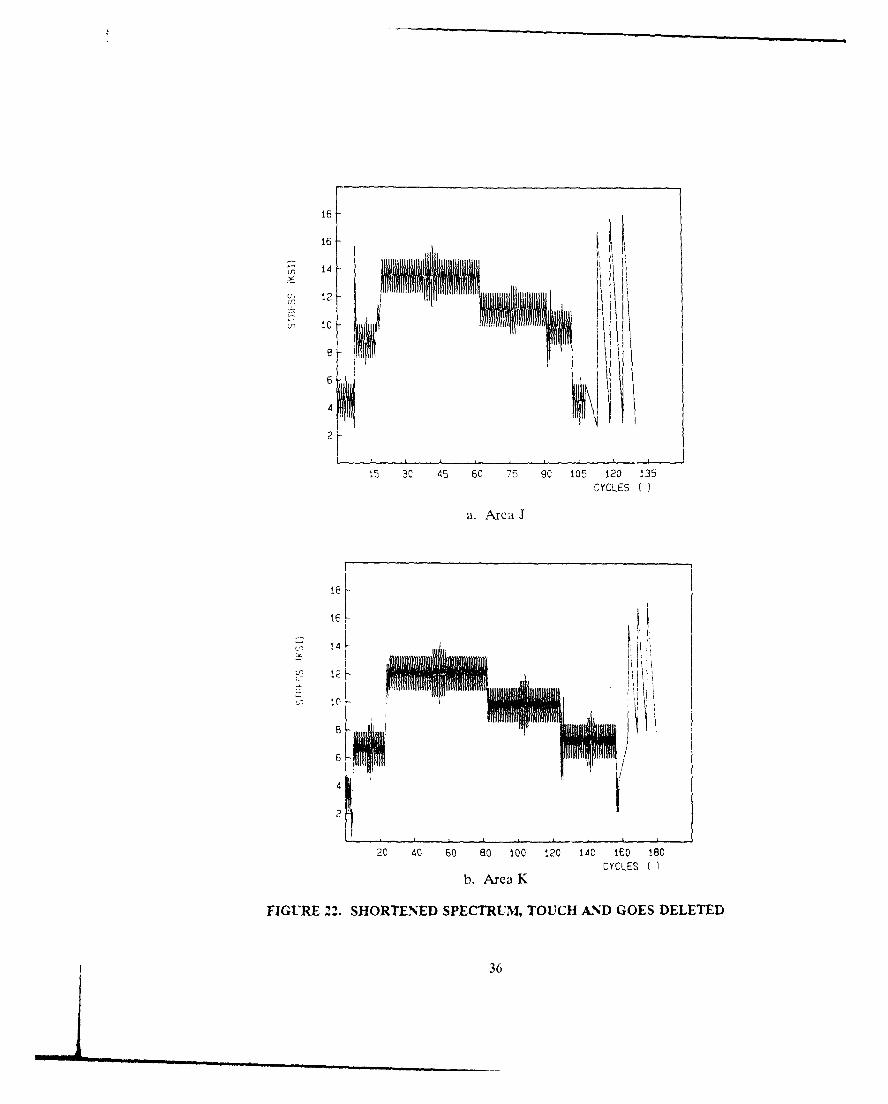
V- and L are shown in Figure 22. It seems reasonable to assume that the cycles for the five
touch-and-goes arc as indicated. Eliminating these leads to the stress histories shown in
Figure2
32

0
0 m )UU) U) U
C) )
bE b bE
cm
V') E-x: bE b
0 r"7
A m C
c-rA
0 OD
0 0 -z -
C U3EF
zA z PCE oA
E U) L
z 0E E
0 b b
co)

18 ~-5 TOUCH-AND-GOES
7 14
U~12
6
2
20 40 60 80 100 12C 14C 160 180CYCLES
a. Area J
18
1 4 5 TOUCH-AND-GOES
6
4
35 7 0 105 140 !75 210 245 280 315CYCLES
b. Arca K
FIGURE 20. BOEING SPECTRUM; ALL FLIGHTS ARE THE SAMlE,LAST 3 CYCLES ARE MLAKE UP CYCLES
34
11 .00
9.00 -5 TOUCH ANO GOES
7.00
-r .00
00
-3. OC
50 100 150 200 2 50 300 350 400 450CYCLES
c, Boeing Spectrum for Area L
FIGURE 20. (Concluded)
45 435
- 30 C
25 5 TOUCH-AND--GOES25 /
20
45,
10
5,
TIME (HRS)
FIGURE 21. IMISSION 3 ALTITUDE PROFILE
35
Ln 14
U, 12
2
I 3C 45 60 75 90 105 120 135CYCLES
a. Area J
le A
4
21
20 40 60 60 100 120 140 160 160CYCLES
b. Area K
FIGURE 22. SHORTENED SPECTRUM, TOUCH AND GOES DELETED
36

:3.00
S9.00
00
5.00
- .00
-.. 00
25 50 75 100 125 150 175 200 225CYCLES
c. Area L
FIGURE 22. (Concluded)
The total number of cycles per mission (flight) is still inconsistent and remains
unexplained. The stress histories in Figure 22 were considered representative for three areas
over %Ohich the stresses ,ar, appreciably. Also, the particular mission in the stress history is the
one: all flights arc assumed to be equal. However, it should be noted that a small
compcnsation is made for the fact that higher loads do occur from time to time. For this
rion the last three cycles in all histories in Figures 20 and 22 are what is called in the
ndu ,tr "make-up eclcs". The first of the three occurs once in every' 10 flights, the second
.'c'urs once in every 100l() flights, and the third occurs once in every 200 flights.
For a comparison with the stress histories proposed here the following conditions Nxcr,.n. s d red
* Mlximum differential pressure of 9 psi
• Fuselage weight of 65,(00 lbs (for the military version for which the comparison, made)
* -The critical pxiints covered by Areas J. K and L arc at the forward and top olthese areas which arc the worst, as the stresses will be decreasing from there.
37

The strcsses wcrc calculated for these conditions using the procedure in Scction 5.
From these the spectrum was obtained, and subsequently stress histories were determined, all
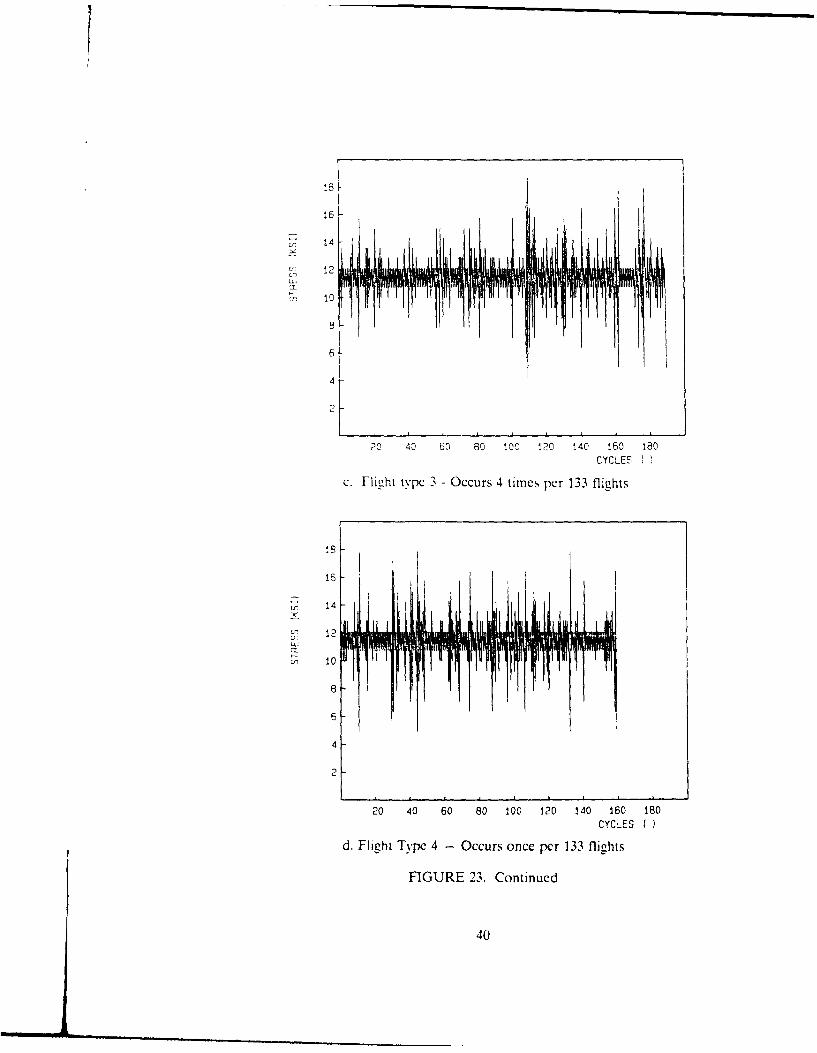
in accordance with the proccdurcs described in this report. The stress histories for Area J are
shown in Figure 23. Note that there arc five different types of flights. The stress histories for
Areas K and L are similar, except that the stress values are different.
The objective of the computations was to show the effect of different methods of
c:omputing stress histories on predicted crack growth behavior. Therefore, the confic:-ation
and basic crack growth rate data used are immaterial, as long as the same situation and data
arc considered for both stress histories. Nevertheless, a configuration was chosen that is
reasonably representative for aircraft structures, namely a through crack at a fastener hole (no
10ad transfer), while the rate data were presented by a Walker equation with a coefficient of
3-l~Q and cxponents of 2 and 1, respectively.
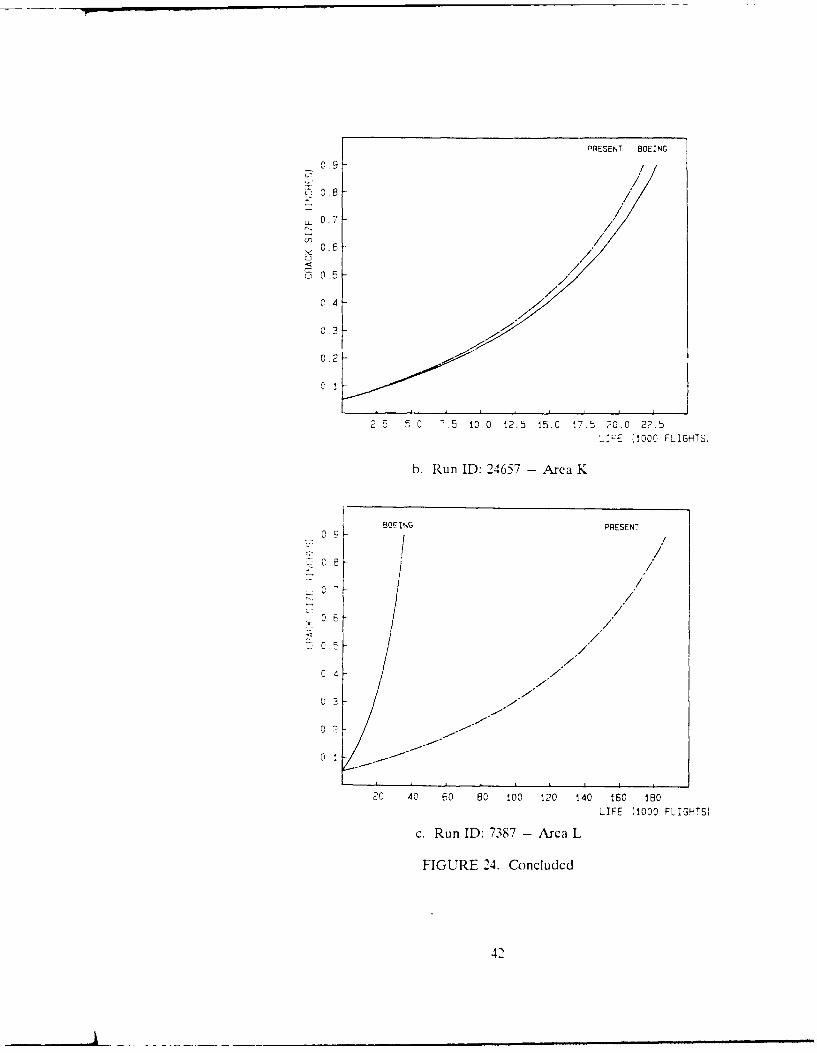
The results of the computations for the three areas are shown in Figure 24. For Area J
thc most critical for longitudinal stresses) the present history is conservative by a factor of two
'k ith regard to the manufacturer's history. For Area K they come out about the same, but f,,
Area L the manufacturer's spectrum is far more conservative. Anticipated crack growth in the
thrcc arcas according to the manufacturer's method of developing a stress history and
,.,.'cording to the proposcd method arc shown in Figure 25. The proposed stress history would
prodace a much longcr crack growth life in the area close to the neutral axis. This is
rcaoonahlc, but rather insignificant. because inspection intervals would be based on the most
cricl area (Area J). Ahcrc the proposed history is more conservative bv a factor of two.
Thcc relatively similar results must be considered with caution for the following
a. Thc manufacturer's stress history is the same in every flight: the proposedhistory recognizes that all flights are different.
h. The manufacturcr's stress history recognizes that some load cycles occur ataltitudes less that the cruising altitude, as shown in Figure 22, while theproposed histories implicitly assume that all cycles have the same mean stress.(It should be pointed out, however, that the cvcles at lower mean stresses donot occur at a fixed mean either as assumed by the manufacturer.)
C. The manufacturer keeps the stresses the same over large areas, w-hile theproposed history recognizes gradual stress gradients.
38
t

14
5 C 45 60 9C !05 120 135CYCLES
a. Fll-it Typc I - Occurs 100 times in 133 flights
7 14
12
4
20 4; C5 80 100 120 140 160 180CYCLES
h. Flight Type 2 - Occurs 21 times in 133 flights
FIGURE 23. FLIGHT TYES, EVERY OCCURRENCE WNITH DIFFERENT SEQUENCE
m 4
S 12
10
4
20 40 60 80 100 120 140 160 180CYCLES
c. Fligzht type 3 - Occurs 4 times per 133 flights
rn 14
12
4
2
20 40 60 80 200 120 140 160 180CYCLES
d. Flight Type 4 - Occurs once per 133 flights
FIGURE 23. Continued
40

4
5 i0 15 20 25 3C 25 40 45
CYCLES
c.Flichth Type 5 - occurs once per 1 33 flights
FIGURE 23. Concluded
PRESES7 BOEING
,n0.59
CA
0.3
0.2
CA 1
2,5 5.0 7.5 10.0 12.5 15.0 17.5 2D.0 22.5LIFE (1000 FLIGHTS!
a. Run ID: 5742 - Area J
FIGURE 24. CRACK GRONN-1H COMPARISON OF BOEING AIND PRESENT SPECTRUM
41
PRESENT BOEING
0.9
= /u 0.7"
~/0o6 /
L 0.5
0.2
2 5 5.0 7.5 10.0 12.5 15.0 17.5 20.0 22.5
LizE (1000 FLIGHTSi
b. Run ID: 24657 - Area K
BOEING PRESENT0 9 //
0 47 /7
04 47
- o7
--- /05/
0 4 /
20 40 60 80,0 20 14 10 8
c. Rn ID.738.-.Aea
FIGURE 24. Concluded
42

K J
0.9 /
;: 0.8 /
0.7 ///
Ln0.6 /
S0.4
0 2
5 io0 i5 20 25 30 35 40 45LIFE (1000 FLIGHTS)
a. Run ID: 14835
9 /
04- ////
03< //
0 2 A
20 40 0 1 2 0 2 0 35 160 450
LIFE (1000 FLIGHTS)
. Run ID: 1485
/
I ./
/.
20 40 60 80 100 120 :40 160 180
LIFE (1000 FLIGHTS)
b. Run ID: 7387
FIGURE 25. CRACK GROWTH, PRESENT SPECTRUM FOR AREAS , K, AND L
43

The stress history for Area J as shown in Figure 23 seems mor .e,"-c .Jve of
aircraft loading than the one shown in Figure 22a, despite the fact that Figure 22a reflects
altitude differences. In reality the cycles at lower altitude (mean stress) are spread ,-Cr
different altitudes. The manufacturer assumes that they will occu- --, ,, :Ied (lower) altitude,
wvhile the present procedure assumes them at a fixed higher altitude (conservative). In any
case, the issue is of secondary importance, because it affects only the R-ratio. The effect can
be assessed by estimating the relative number of cycles occurring at lower R; the result is that
the effect is at most a factor of 1.3. Considering the simplifications in taking all flights to be
the same in the history and by assuming this history is valid for large areas. the effect of R is
probably inconsequential.
Both stress histories are based on numerous assumptions; the proposed history is base(
uxn measurements. is conservative with regard to R-ratio effects, and is more realistic in
accounting for different flight profiles. While the proposed method derives the stresses from
cecralization and simplification of the structure, the manulacturer's method does also, and
results in essentially the same stress history.
44
REFERENCES
Brock, D.. The Practical Use of Fracture Mechanics. Kiuwecr Academic Publishers.I ')S S.
K'Craibll. Norman L., The NASA Gig-ital VGH Progvram- Explo ration of Methods andFinal Results. Volumei I-Deveclopment of Mlethods. Volume II-L 1011 Data 1978-1971):1 o 10 Flours, Volume 111-13727 Data 1978-1980: 1765 Hours, Volume IV-B3747 Data107-I-1 (6: 10,10 Hours. Volume V- DC]I0 Data 1981-1982: 129 Hours. NASAContract'or Report 181909, NASW 4430. Eagle Engineering Inc., December 1989.
3 Dc Jonc, J.B.. et al., A Standardized Load Sequence for Flight Simulation Tests onTranspo),rt A\ircraft WNing- Structures (TWIST), LBF-FB-106, NLR TR 73029U, 19713.
4:' 1%;.:v. J.. Thec An1,i of Random L-oad-Time Histories With Relation to FaTgue-Test and Lif1c Calculations, Fatigue of Aircraft Structure. p. 115, Pergamron. 1963-.
Br-,)ck. D.. and Smith. S.H.. FatigTue Crack Grow th Prediction Under Aircraft Spectrum
I ~ ~uccim~Fructurt Mech.. 11- pp. 122-142, 1979.
lin.N.J.. The Chane of a Rough Flight. R.AE TR 60039 (1965).
D. P cue bcx Icsan Damnaigc Tolerance Software, FractuREsearch Inc.,
1-~Igc oad Spectrum for Modification Design Per Damage ToleranceLn ajosurc to B%1AC letter No.3-KC-135-6483-1 130 to USAF.
K. P,., and Watainahc. R. T., Development of Jet Transport Airframe Tes"tN :.ri.13 cinL paiper without date or number.
45/46
![Best Available - DTICAD-A250 liI] II II1 il liii il 390I DOT-VNTSC-FAA-91-16 Generation of Spectra and Stress Histories FAA Technical Center for Fatigue and Damage Tolerance Analysis](https://img.pdfslide.net/doc/110x75/5e81279f4ea49a140661bd83/best-available-dtic-ad-a250-lii-ii-ii1-il-liii-il-390i-dot-vntsc-faa-91-16-generation.jpg)