Embed Size (px)
Citation preview

INVITATION
You are invited to attend the public defence of my doctoral thesis entitled:
GENERATION OF WEAR PARTICLES IN LUBRICATED CONTACTS DURING
RUNNING-IN
On Friday, 20th January
2017at 14:45
in the Prof. dr. G. Berkhoff-room ot the Waaier
building, University of Twente
Aydar [email protected]
AY
DA
R A
KC
HU
RIN
GE
NE
RA
TIO
N O
F WE
AR
PAR
TIC
LES IN
LUB
RIC
AT
ED
CO
NT
AC
TS D
UR
ING
RU
NN
ING
-IN
GENERATION OF WEAR PARTICLES IN LUBRICATED CONTACTS DURING
RUNNING-IN
AYDAR AKCHURIN
Generation of Wear Particles in Lubricated
Contacts during Running-In
Aydar Akchurin
Department of Mechanical Engineering
University of Twente

The research was carried out under project number M21.1.11450 in the framework of
the Research Program of the Materials innovation institute (M2i) in the Netherlands
(www.M2i.nl).
De promotiecommissie is als volgt samengesteld:
Voorzitter en secretaris:
Prof. dr. G.P.M.R. Dewulf University of Twente
Promotor:
Prof. dr.ir. P.M. Lugt University of Twente
Assistent promotor:
Dr. ir. R.Bosman University of Twente
Leden (in alfabetische volgorde):
Prof. dr. ir. A.H. van den Boogaard University of Twente
Prof. dr. G. E. Morales-Espejel, INSA Lyon
Prof. dr. B. Prakash, Luleå University of Technology
Prof. dr.ir. A. De Boer, University of Twente
Aydar Akchurin
Generation of Wear Particles in Lubricated Contacts during Running-In
PhD Thesis, University of Twente, Enschede, the Netherlands,
January, 2017
ISBN: 978-90-365-4266-1
Copyright © Aydar Akchurin, Enschede, the Netherlands
GENERATION OF WEAR PARTICLES IN
LUBRICATED CONTACTS DURING RUNNING-IN
PROEFSCHRIFT
ter verkrijging van de graad van doctor aan de Universiteit Twente,
op gezag van de rector magnificus, prof.dr. T.T.M. Palstra,
volgens besluit van het College voor Promoties in het openbaar te verdedigen
op vrijdag 20 january 2017 om 14:45 uur
door
Aydar Akchurin geboren op 17 feb 1986
te Ufa, Rusland

The doctoral thesis is approved by
Promotor:
Prof. dr.ir. P.M. Lugt University of Twente
Assistent promotor:
Dr. ir. R.Bosman University of Twente
The research was supported by M2i in Delft, in the Netherlands. The support is
gratefully acknowledged.
Summary
If tribological contacts are not operating under full film lubrication, wear particles
may be released which could significantly influence the lubrication performance and
therefore the lifetime of machine elements. In this thesis, a model for the generation of
wear particles in mixed lubrication will be described with emphasis on the running-in
phase. The operating conditions and material were chosen to simulate the contact
between a steel rolling element and cage (steel or brass) as can be found in rolling
bearings. This thesis includes an experimental wear particle analysis and an efficient
numerical algorithm (Boundary Element Methods, BEM) for the simulation of the
generation of wear particles.
First an efficient algorithm was developed for the calculation of friction in mixed
lubrication based on a load sharing concept. The model was used to calculate the
surface stresses that are needed for the wear model. It combined a finite difference
based numerical elasto-hydrodynamic solver for the calculation of the hydrodynamic
film and a BEM based solver for contact stress analysis. The friction model was
successfully validated using measurements under various conditions.
A (subsurface) stress-based BEM wear model was developed to calculate the
size of wear particles. A critical Von Mises stress criterion was employed for the
disruption of particles. The friction and wear models were combined to predict the
generation of wear particles under mixed lubricated conditions. The model calculations
show how friction reduces during running-in due to a smoothening of the surfaces.
Steel and brass particles were collected and analyzed using Dynamic Light
Scattering, Scanning Electron Microscopy and Atomic Force Microscopy and used for

model validation. The model fitted the experimental data reasonably well for both, the
steel and the brass materials.
Finally, the model was extended to the growth and wear of tribo-films to also
make it applicable if anti-wear additives are present. This effect was validated using
experimental data from the literature.
The thesis is divided into two parts. The first part (Part A) is a summary of the
work. The second part (Part B) consists of the journal articles in which the details are
described.

Samenvatting
Wanneer een tribologisch contact niet in volle-filmsmering opereert kan er
slijtage optreden en kunnen er deeltjes vrijkomen die de smering negatief beïnvloeden
en daardoor de levensduur van machine-onderdelen verkorten. In dit proefschrift wordt
een model beschreven voor het ontstaan van slijtagedeeltjes tijdens gemengde
smering, waarbij de nadruk wordt gelegd op de inloopfase. De gekozen condities
simuleren het contact tussen een rollend element van staal en een kooi (staal of
messing), zoals ook in wentellagers wordt gevonden. Dit proefschrift bevat een
experimentele analyse van slijtagedeeltjes en een efficiënt algoritme (Boundary
Element Method, BEM) om het genereren van slijtagedeeltjes te simuleren.
Eerst is er een efficiënt algoritme ontwikkeld om wrijving te kunnen berekenen
in gemengde smering, gebaseerd op een gedeelde belasting tussen smeermiddel en
oppervlakken. Dit model is gebruikt om de oppervlaktespanningen te berekenen die
nodig zijn voor het slijtagemodel. Het model combineert een numeriek model om de
hydrodynamische film te berekenen op basis van een eindige-verschil-methode met
een BEM-gebaseerde methode voor de berekening van de contactspanningen. Het
wrijvingsmodel is succesvol gevalideerd met metingen onder verschillende condities.
Er is een BEM-slijtagemodel ontwikkeld om de grootte van de slijtagedeeltjes te
berekenen gebaseerd op spanningen onder het oppervlak. Een Von Mises-
spanningscriterium is gebruikt voor de verstoring van deeltjes. De modellen voor
wrijving en slijtage zijn gecombineerd tot een model waarmee het ontstaan van
slijtagedeeltjes in gemengde smering kan worden voorspeld. De berekeningen uit het
model tonen aan hoe wrijving lager wordt tijdens de inloopfase door het glad maken
van de oppervlakken.

Staal en messing deeltjes zijn verzameld en geanalyseerd met Dynamic Light
Scattering, Scanning Electron Microscopy en Atomic Force Microscopy om het model
te kunnen valideren. Het model en de experimentele data komen redelijk goed overeen
voor zowel staal als messing.
Tenslotte is het model uitgebreid met een model voor de groei en slijtage van
tribofilms, zodat het model ook gebruikt kan worden als er anti-slijtage-additieven
aanwezig zijn. Dit effect is gevalideerd met experimentele data vanuit de literatuur.
Dit proefschrift bestaat uit twee delen. Het eerste deel (deel A) is een
samenvatting van het gedane werk. Het tweede deel (deel B) bevat de publicaties in
tijdschriften, waarin de details zijn beschreven.

Acknowledgements
Firstly, I would like to express my sincere gratitude to my supervisors Dr. Rob
Bosman and Prof. Piet M. Lugt for their motivation and immense support. Their
patience and guidance helped me to nurture as a scientist and inspired me to finish
the research on time.
The constant support and care provided by m2i is admiringly acknowledged. I
also extend my heartfelt gratitude to SKF Engineering & Research Centre, Nieuwegein
and Bosch Transmission Technology BV, Tilburg, the Netherlands for their technical
and financial support.
Furthermore, I gratefully acknowledge the support of Surface Technology and
Tribology group at the University of Twente. I am grateful to Erik de Vries and Walter
Lette for their laboratory support. I extend my appreciation to Dik Schipper, Emile van
der Heide, Mattijn de Rooij for the constructive discussions and suggestions. I am also
very thankful to Belinda and Debbie for their kind help and managerial support.
I thank my friend Febin and his wife Teena, my colleagues Matthijs, Michel,
Marina, Adriana, Yibo, Yuxin, Milad, Dariush, Shivam, Ida, Hilwa, Nadia, Agnieshka,
Mohammad, Xavier, Melkamu and Tanmaya.
Last but not least, I thank my family: my parents, my dearest wife Regina and
my little son Ernest.


Contents
Part A
Nomenclature .......................................................................................................... 2
1. Introduction ..................................................................................................... 3
1.1. Background ...................................................................................... 3
1.2. Tribological System .......................................................................... 4
2. Friction Model ................................................................................................. 7
3. Analysis of Wear Particles ............................................................................ 10
4. Wear Modeling ............................................................................................. 14
4.1. Running-in Wear Model .................................................................. 15
4.2. Mild Tribo-Chemical Wear Model ................................................... 21
5. Conclusions and Recommendations ............................................................ 26
5.1. Conclusions .................................................................................... 26
5.2. Recommendations ......................................................................... 28
Bibliography ........................................................................................................... 30
Part B
Paper A. On a Model for the Prediction of the Friction Coefficient in Mixed
Lubrication Based on a Load sharing Concept with Measured Surface Roughness,
A. Akchurin, R. Bosman, P.M. Lugt, M. van Drogen, Tribology Letters, 59 (1), 19-
30, 2015.
Paper B. Analysis of Wear Particles Formed in Boundary Lubricated Sliding
Contacts, A. Akchurin, R. Bosman, P.M. Lugt, M. van Drogen, Tribology Letters,
63(2), 2016.
Paper C. A Stress-Criterion-Based Model for the Prediction of the Size of Wear
Particles in Boundary Lubricated Contacts, A. Akchurin, R. Bosman, P.M. Lugt,
Tribology Letters, 64(3), 2016.
Paper D. Generation of Wear Particles and Running-In in Mixed Lubricated Sliding
Contacts, A. Akchurin, R. Bosman, P.M. Lugt, Tribology International, 2016.
Paper E. Deterministic Stress-Activated Model for Tribo-Film Growth and Wear
Simulation, A. Akchurin, R. Bosman, Submitted to Tribology Letters, 2016.

Part A

2
Nomenclature
𝑝 dry contact pressure, [𝑃𝑎]
𝐹𝐶 load carried by surface contacts, [𝑁]
𝐹𝐻 load carried by the hydrodynamic film,[𝑁]
𝐹𝑇 total applied load, [𝑁]
𝑓𝐶 friction coefficient, [−]
𝑓𝐶𝑏 friction coefficient in boundary lubrication, [−]
𝐻 hardness, [𝑃𝑎]
𝑅𝑞 surface roughness (standard deviation of surface
heights), [𝑚]
∆𝑈𝑎𝑐𝑡 Internal activation energy, [𝐽]
∆𝑉𝑎𝑐𝑡 Activation volume, [𝑚3]
𝑘𝐵 Boltzmann constant, [𝐽
𝐾]
𝑇 Temperature, [°C]
𝛤0̃ Pre-factor in Arrhenius equation, [𝑛𝑚
𝑠]

3
1. Introduction
1.1. Background
A wear process results in the generation of particles of various size, shape, color
and chemical composition [1-3]. The size distribution and the chemical composition of
the wear particles depends on the applied conditions [4] and wear mechanisms [5, 6].
The particles may consist of the substrate materials elements, various types of oxides
[7], lubricant additive constituents [8, 9] and/or their mixtures. The reported size of wear
particles varies from mm scale, which is typically attributed to severe wear [7, 10], to
nm scale in the range of 5nm [11, 12] in mild wear. The shape of the particles was
reported to vary from plate-like particles with aspect ratios of 2-10, ribbon-shaped with
aspect ratios higher than 10 to spherical particles [1, 13, 14]. Extensive experimental
investigations of these particles were described in Refs [9, 15, 16].
In general wear particles influence the lifetime of mechanical systems. For
example, the long-term lifetime of artificial joint replacements is largely influenced by
the size, shape and number of the generated wear particles [17-19]. Another adverse
effect is related to the environmental and health related issues due to metallic particles
which have become a concern recently [20, 21]. Airborne wear particles (generated in,
for example car engines, or disk brakes) were found to accumulate in human brain
tissue and increase the probability of Alzheimer’s disease [22]. In grease lubricated
bearings, the oxidation of grease thickener and base oil is accelerated in the presence
of metal wear particles [23]. In some situations, the thickener structure can be
destroyed by particles, leading to failure of the lubricant and subsequently of the
bearing [24].
4
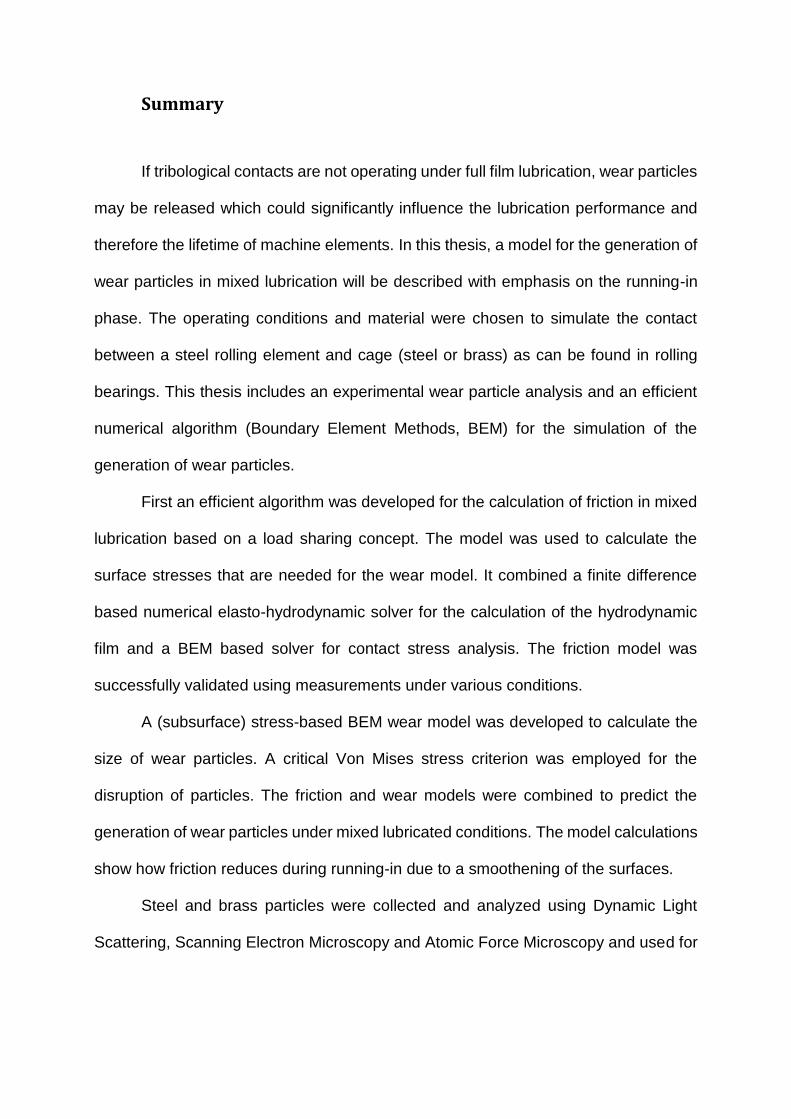
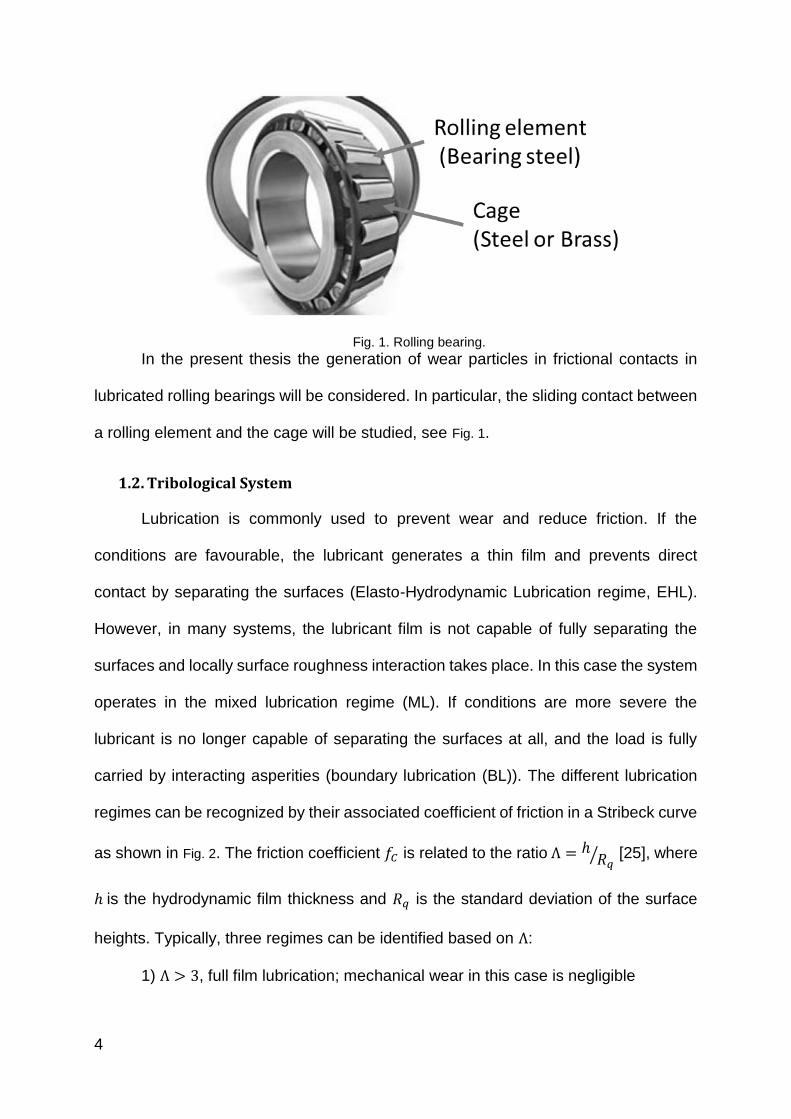
Fig. 1. Rolling bearing.
In the present thesis the generation of wear particles in frictional contacts in
lubricated rolling bearings will be considered. In particular, the sliding contact between
a rolling element and the cage will be studied, see Fig. 1.
1.2. Tribological System
Lubrication is commonly used to prevent wear and reduce friction. If the
conditions are favourable, the lubricant generates a thin film and prevents direct
contact by separating the surfaces (Elasto-Hydrodynamic Lubrication regime, EHL).
However, in many systems, the lubricant film is not capable of fully separating the
surfaces and locally surface roughness interaction takes place. In this case the system
operates in the mixed lubrication regime (ML). If conditions are more severe the
lubricant is no longer capable of separating the surfaces at all, and the load is fully
carried by interacting asperities (boundary lubrication (BL)). The different lubrication
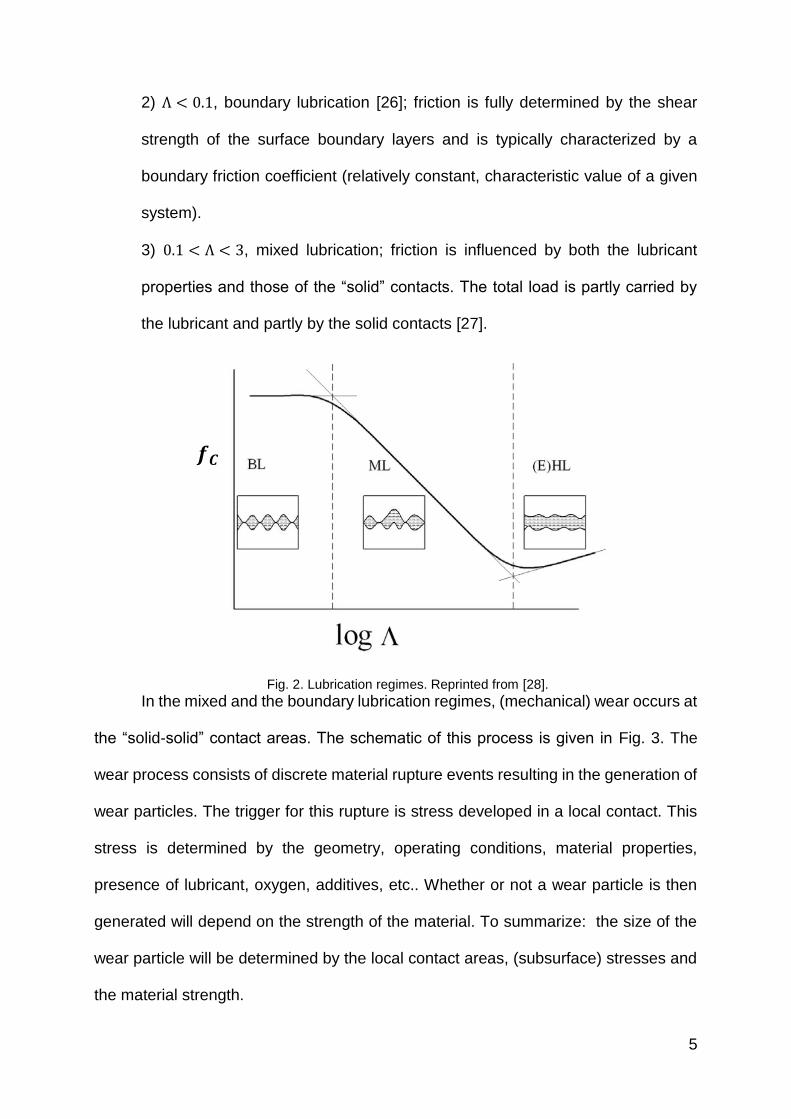
regimes can be recognized by their associated coefficient of friction in a Stribeck curve
as shown in Fig. 2. The friction coefficient 𝑓𝐶 is related to the ratio Λ = ℎ𝑅𝑞⁄ [25], where
ℎ is the hydrodynamic film thickness and 𝑅𝑞 is the standard deviation of the surface
heights. Typically, three regimes can be identified based on Λ:
1) Λ > 3, full film lubrication; mechanical wear in this case is negligible
5
2) Λ < 0.1, boundary lubrication [26]; friction is fully determined by the shear
strength of the surface boundary layers and is typically characterized by a
boundary friction coefficient (relatively constant, characteristic value of a given
system).
3) 0.1 < Λ < 3, mixed lubrication; friction is influenced by both the lubricant
properties and those of the “solid” contacts. The total load is partly carried by
the lubricant and partly by the solid contacts [27].
Fig. 2. Lubrication regimes. Reprinted from [28].
In the mixed and the boundary lubrication regimes, (mechanical) wear occurs at
the “solid-solid” contact areas. The schematic of this process is given in Fig. 3. The
wear process consists of discrete material rupture events resulting in the generation of
wear particles. The trigger for this rupture is stress developed in a local contact. This
stress is determined by the geometry, operating conditions, material properties,
presence of lubricant, oxygen, additives, etc.. Whether or not a wear particle is then
generated will depend on the strength of the material. To summarize: the size of the
wear particle will be determined by the local contact areas, (subsurface) stresses and
the material strength.
𝒇𝑪

6
Fig. 3. Schematic of the lubricated contact.
In systems lubricated by extreme pressure/anti-wear additive-rich lubricants,
there are at least two wear phases (provided that the conditions are mild enough not
to lead to catastrophic failure), namely, running-in and mild tribo-chemical wear. The
running-in stage is the initial phase, characterized by significant wear loss [29],
variation of the friction coefficient and surface roughness evolution [30]. At this stage,
the contacting substrate materials are worn due to local plastic deformation. Most of
the wear particles are generated at this stage. The mild tribo-chemical wear phase
follows running-in [31]. This regime is characterized by a very low wear volume. The
substrate material is not removed directly, but through the removal of reaction layers
containing lubricant compounds and substrate material [32-36]. The number of wear
particles generated at this stage is relatively low. Different models have to be used to
simulate wear in these regimes as discussed further.
In this thesis, the simulation of wear particles generation during the running-in
stage in mixed lubrication was performed in several steps. First, a friction model was
developed and validated using friction measurements for various lubricants and
conditions. This model was used to find the “solid-solid” contact areas in the mixed
lubricated regime arising under conditions similar to those in rolling element – cage

7
contacts. Next, the wear model was developed and applied for the simulation of
running-in wear in the boundary lubrication regime. The model was validated using
measurements of the size and shape of wear particles using roller-on-disk apparatus.
Subsequently, the friction and wear models were combined to predict the generation
of the wear particles size in mixed lubricated contacts during the running-in stage. The
model was also verified using the wear particles size measurement. Additionally, a mild
tribo-chemical wear model was developed and validated. These steps are described
in more detail in the text below.
2. Friction Model
In general there are two approaches for the calculation of friction in lubricated
contacts: “rough elasto-hydrodynamic lubrication (EHL) theory based methods [37,
38]” and “load sharing concept models [39, 40] ”. In the rough EHL approach (including
FEA) the governing lubricant flow and surface deformation equations are solved
numerically assuming rough surfaces. Despite the significant progress achieved in the
development of such models [3-6], certain problems still exist in the “thin film lubrication
regime”, such as convergence, accuracy, a unified film collapse parameter and mesh-
dependency [41]. The selection of the film collapse criteria in mixed lubrication models
has a significant effect on the calculated friction values. Most of these problems do not
apply to load sharing models, first introduced by Johnson [42]. They offer robustness
and a relatively simple methodology for the estimation of friction. In this approach, the
problem is split up into a separate smooth surface EHL and a dry rough contact
problem. The assumption of smooth surfaces in EHL makes the algorithm very robust
[43, 44]. The contact intensity is then given by the proportionality of the loads carried
by liquid and surface contacts [42]. The approach was introduced by Morales-Espejel

8
et al. [45] and later used by Bobach et al. [46]. It was shown to be robust and accurate
in calculation friction in mixed lubrication. In the current thesis the load sharing concept-
based model was further improved by introducing the concept of a non-uniform film.
The most widely used numerical solution techniques in EHL are the multigrid
method [47], full-system approach (Finite Element Method based) [48, 49] and the
differential deflection algorithm [50]. The latter two approaches solve the system of
equations in a coupled manner, which makes the solution procedure robust and
relatively fast to converge. Differential deflection technique computes elastic deflection
only on the contacting surface and hence requires significantly less degrees of freedom
than the full-system algorithm. Therefore, differential deflection approach was used in
the current work to calculate the EHL film thickness.
The algorithm adopted in the thesis is schematically represented in Fig. 4. It
consists of separate smooth EHL and rough surface contact solvers, which are linked
through the film thickness [27, 51] as will be further explained below.
Fig. 4. Load sharing Concept Diagram.
First, the numerical EHL solver is used to calculate the separation between the
bodies developed by the hydrodynamic action of the lubricant at a certain
hydrodynamic load 𝐹𝐻. In some areas, there is enough lubricant to provide sufficient
separation between the surfaces, in others there is not and surfaces come into contact,
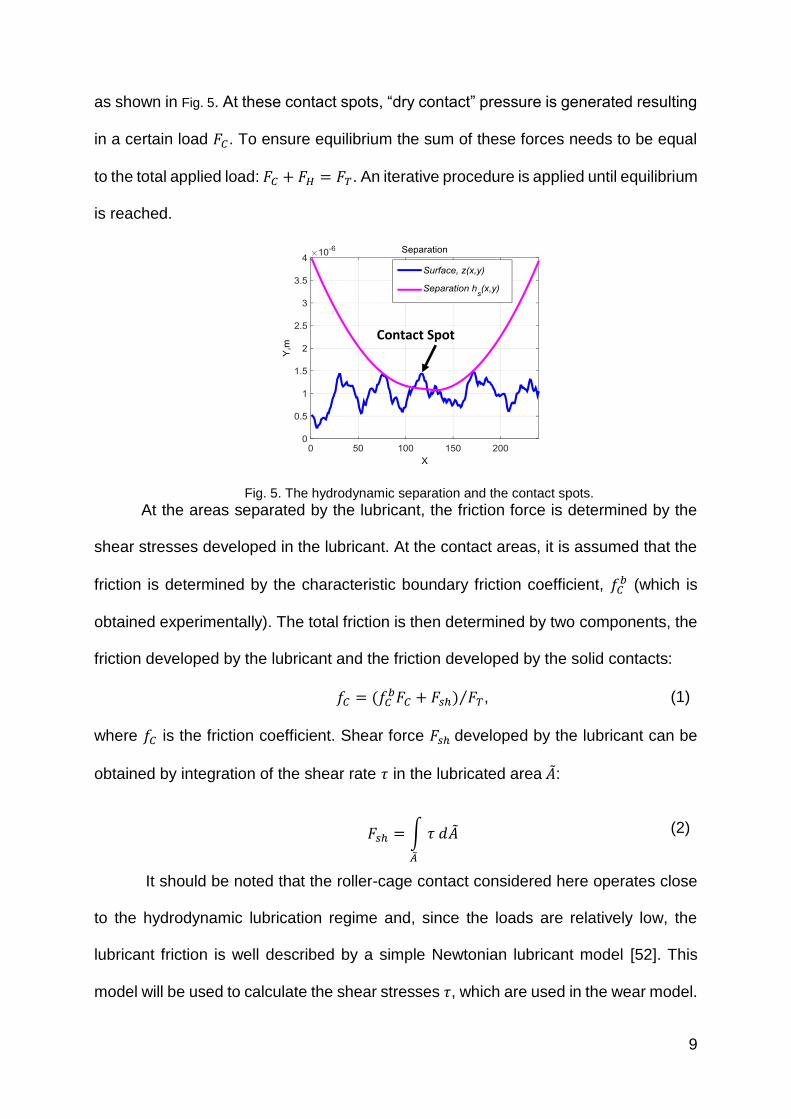
9
as shown in Fig. 5. At these contact spots, “dry contact” pressure is generated resulting
in a certain load 𝐹𝐶. To ensure equilibrium the sum of these forces needs to be equal
to the total applied load: 𝐹𝐶 + 𝐹𝐻 = 𝐹𝑇. An iterative procedure is applied until equilibrium
is reached.
Fig. 5. The hydrodynamic separation and the contact spots.
At the areas separated by the lubricant, the friction force is determined by the
shear stresses developed in the lubricant. At the contact areas, it is assumed that the
friction is determined by the characteristic boundary friction coefficient, 𝑓𝐶𝑏 (which is
obtained experimentally). The total friction is then determined by two components, the
friction developed by the lubricant and the friction developed by the solid contacts:
𝑓𝐶 = (𝑓𝐶𝑏𝐹𝐶 + 𝐹𝑠ℎ) 𝐹𝑇⁄ , (1)
where 𝑓𝐶 is the friction coefficient. Shear force 𝐹𝑠ℎ developed by the lubricant can be
obtained by integration of the shear rate 𝜏 in the lubricated area �̃�:
𝐹𝑠ℎ = ∫ 𝜏 𝑑�̃�
�̃�
(2)
It should be noted that the roller-cage contact considered here operates close
to the hydrodynamic lubrication regime and, since the loads are relatively low, the
lubricant friction is well described by a simple Newtonian lubricant model [52]. This
model will be used to calculate the shear stresses 𝜏, which are used in the wear model.
Contact Spot

10
The model was validated using friction coefficient measurements in mixed
lubrication, see Fig. 6. The agreement with the experimental data was found to be
reasonable. As an illustration, this figure also shows the results by assuming
independent deformation of asperities (see Paper A) which cause an overestimation
of the friction coefficient. The details of the developed friction model are discussed in
Paper A.
Fig. 6. Experimental validation of the developed friction model (Half-Space Based Model), reprinted from [53].
3. Analysis of Wear Particles
For the measurement of the size and shape of particles a number of techniques
can be employed [54]. This can for example be done using imaging techniques such
as electron microscopy (SEM, TEM) and atomic force (AFM) microscopy. These tools
are potentially capable of measuring shape, size and also texture of the particles.
However, only a limited number of particles can be analyzed using imaging methods
and a significant number of samples are required in order to gather statistically reliable
10-3
10-2
10-1
0
0.02
0.04
0.06
0.08
0.1
0.12
Velocity, m/s
Co
effic
ien
t o
f fr
ictio
n
Half-Space Based Model
Deterministic Asperity Based Model
Experiment with 90% confidence interval
11
information. This makes the imaging methods very labor intensive. In contrast, some
non-imaging techniques, such as dynamic light scattering (DLS) are fast and can
analyze a large number of particles simultaneously. However, information about
shape, concentration and texture is not available in this case. Therefore, the various
techniques need to be combined.
It is key in particle characterization methods to have a sufficiently large number
of particles collected after testing. The most common collection technique is
centrifugation followed by sonication. A complexity with centrifuging oil is that small
particles tend to form agglomerations, which can be interpreted as large single particles
[16, 55, 56]. Sonication is then used to break up these agglomerates [57, 58].
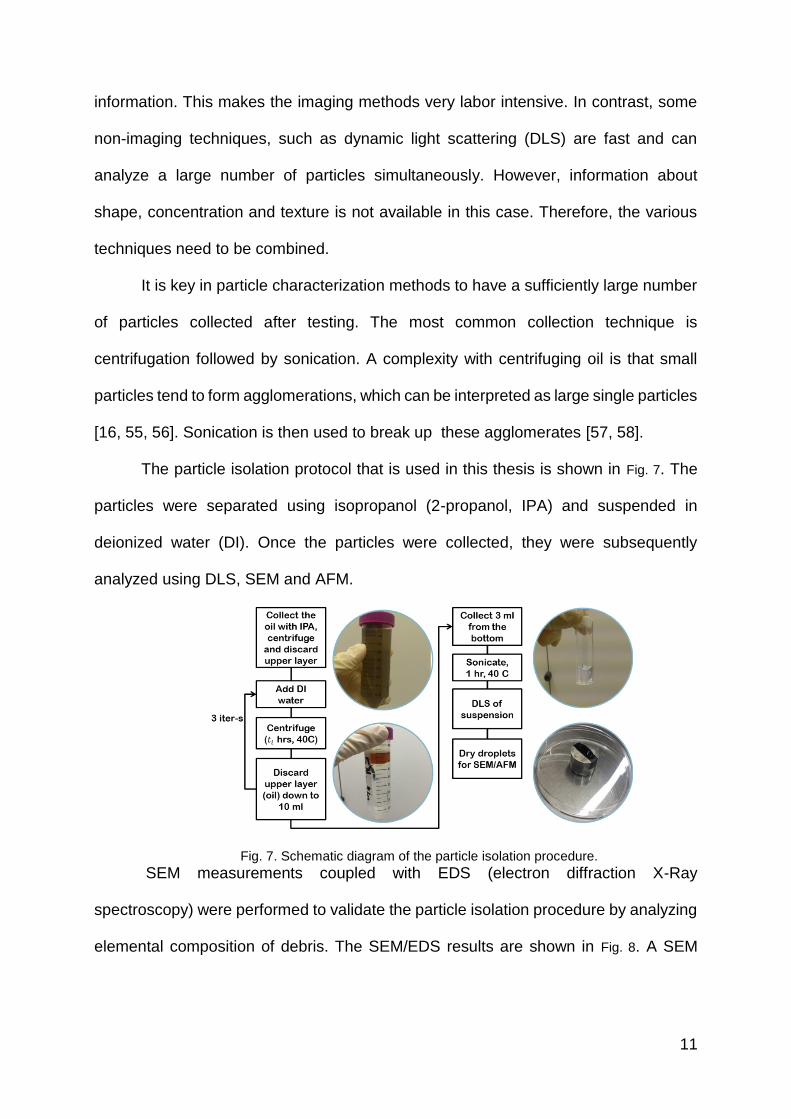
The particle isolation protocol that is used in this thesis is shown in Fig. 7. The
particles were separated using isopropanol (2-propanol, IPA) and suspended in
deionized water (DI). Once the particles were collected, they were subsequently
analyzed using DLS, SEM and AFM.
Fig. 7. Schematic diagram of the particle isolation procedure.
SEM measurements coupled with EDS (electron diffraction X-Ray
spectroscopy) were performed to validate the particle isolation procedure by analyzing
elemental composition of debris. The SEM/EDS results are shown in Fig. 8. A SEM
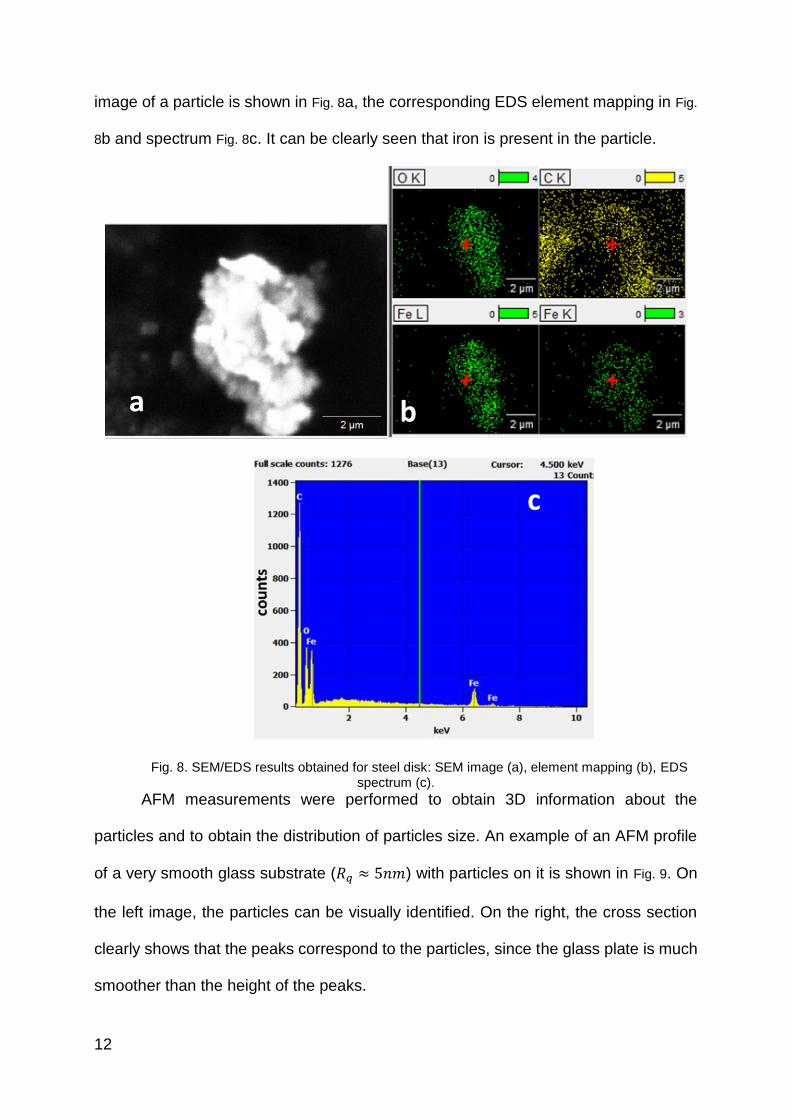
12
image of a particle is shown in Fig. 8a, the corresponding EDS element mapping in Fig.
8b and spectrum Fig. 8c. It can be clearly seen that iron is present in the particle.
Fig. 8. SEM/EDS results obtained for steel disk: SEM image (a), element mapping (b), EDS spectrum (c).
AFM measurements were performed to obtain 3D information about the
particles and to obtain the distribution of particles size. An example of an AFM profile
of a very smooth glass substrate (𝑅𝑞 ≈ 5𝑛𝑚) with particles on it is shown in Fig. 9. On
the left image, the particles can be visually identified. On the right, the cross section
clearly shows that the peaks correspond to the particles, since the glass plate is much
smoother than the height of the peaks.
a b
c

13
Fig. 9. AFM height profile of the plate with dried particles suspension.
A height threshold was introduced to ensure that the roughness of the substrate
and possible noise of the measurement are excluded from the analysis. An example
of the AFM height profile and identified particles using 50nm height threshold is shown
in Fig. 10.
Fig. 10. Identification of particles with a 50 nm height threshold.
The described procedures were applied to perform particles size measurements
for the validation of the wear model. The details of the methods can be found in the
appended Paper B.

14
4. Wear Modeling
The most widely used wear equation was developed by Holm and Archard in
1953 [59]. It only considers adhesive wear and assumes the sliding (spherical)
asperities to deform fully plastic. The wear volume formed during a sliding distance 𝑠
is then equal to 𝑉𝑇 = 𝑘 ∗ 𝐹𝑇/𝐻 ∗ 𝑠. The coefficient 𝑘 is known as the wear coefficient
and is frequently used to qualify materials for their wear resistance [1, 59]. In general,
this wear coefficient is estimated experimentally. Although Archard originally
developed this equation to model adhesive wear, it is now widely used for modeling
abrasive wear, fretting wear and other types of wear as well [60]. Meng and Ludema
[61] have identified 182 equations/models for different types of wear. Among them
were empirical relations, contact mechanics-based models and equations based on
material failure mechanisms. The latter were found to have become more popular
recently. Actually, in most wear models an ‘Archard’ approach is somehow used, for
example, by using Archard’s wear law locally [31, 62]. Alternatively, ‘particle-by-particle
removal models’ can be built. This approach is followed in the current thesis.
As was discussed in the introduction, two wear phases are distinguished,
namely, running-in and mild tribo-chemical wear. Separate models were used for these
phases. For the first phase a new wear particles generation model for running-in in
boundary lubrication was developed. For the prediction of wear particles in mixed
lubrication, this model was combined with the previously introduced mixed lubrication
model. Finally, for the prediction of wear after running-in, a tribo-chemical mild wear
model was developed and validated.

15
4.1. Running-in Wear Model
4.1.1. Particle-by-Particle Removal in Boundary Lubrication.
First, a model for calculating the wear particles size in boundary lubrication
during running-in will be described. In general, running-in wear models can be
classified into analytical [63-67], semi-analytical [53, 68-70] and numerical methods
[71-83]. Semi-Analytical models combine numerical methods with analytical solutions
to speed up the calculations to result in efficient, yet accurate solutions. BEM
(Boundary Element Method) are widely spread in this group. These models are
extensively used in simulations of the contact of rough surfaces [53, 68-70]. To apply
BEM it is assumed that the contacting bodies are semi-infinite. The assumption
reduces the complexity of the calculations using a well-developed theory of discrete
convolution and Fourier transformation [70, 84].
Particle-by-particle wear models require a criterion to find the areas in which
wear particles generation may occur. Various criteria can be found in the literature,
such as critical accumulated dissipated energy [65], critical accumulated plastic strain
[83], critical accumulated damage [85], critical Von Mises stress [86] and their variants
[66, 67, 87, 88].
Morales-Espejel et al. [89, 90] combined a cumulative damage model and a
local Archard wear equation to simulate the generation of micro-pits. They observed a
good agreement with the experimental data in the prediction of the size of micro-pits
[89] and the topography evolution [91]. In their approach the evolution of the surfaces
in time could be simulated. In the current thesis, the time dimension was not
considered, which made it possible to reduce the complexity of the problem. Nelias et
al. [92] proposed a wear model based on the accumulated plastic strain criterion to find
regions of potential wear. Here it should be noted that the simulation of wear particles

16
generation requires a dense mesh and the calculation time can be very high, especially
if subsurface plasticity is considered. The application of a stress based criterion is
computationally more efficient compared to a strain based approach and is therefore
preferred for practical reasons. Bosman and Schipper [86] used a Von Mises stress
based criterion (with the yield stress as a critical value) to simulate the wear particles
generation and to predict the severity of adhesive wear.
In this thesis the formation of a particle was determined using a Von Mises
stress based criterion as the onset of plasticity. More specifically, a particle is formed
if, in a certain volume of the body, the Von Mises stress exceeds the yield stress and
if this volume is exposed to the surface. This is schematically shown in Fig. 11.
Fig. 11. Representation of the particle removal process: removal of a volume takes place if the Von Mises stress exceeds the yield stress everywhere in this volume and if this volume is exposed to
the surface.
This model was validated using measurements of wear particles size for steel-
steel and steel-brass contacts operating in the boundary lubrication regime, see Fig. 12.
For the steel disks, the experiments showed slightly higher values of the particles’
radius and a small increase with increasing load, Fig. 12a. The model predicted smaller
particles and a somewhat higher increase with increasing load. As discussed in Paper
B, there is a bias of both AFM and DLS techniques towards larger particles and this
effect becomes more important as the particles get smaller. Therefore, the actual size
of particles at all loads (but especially at lower loads, e.g. 2.5N) may be smaller than
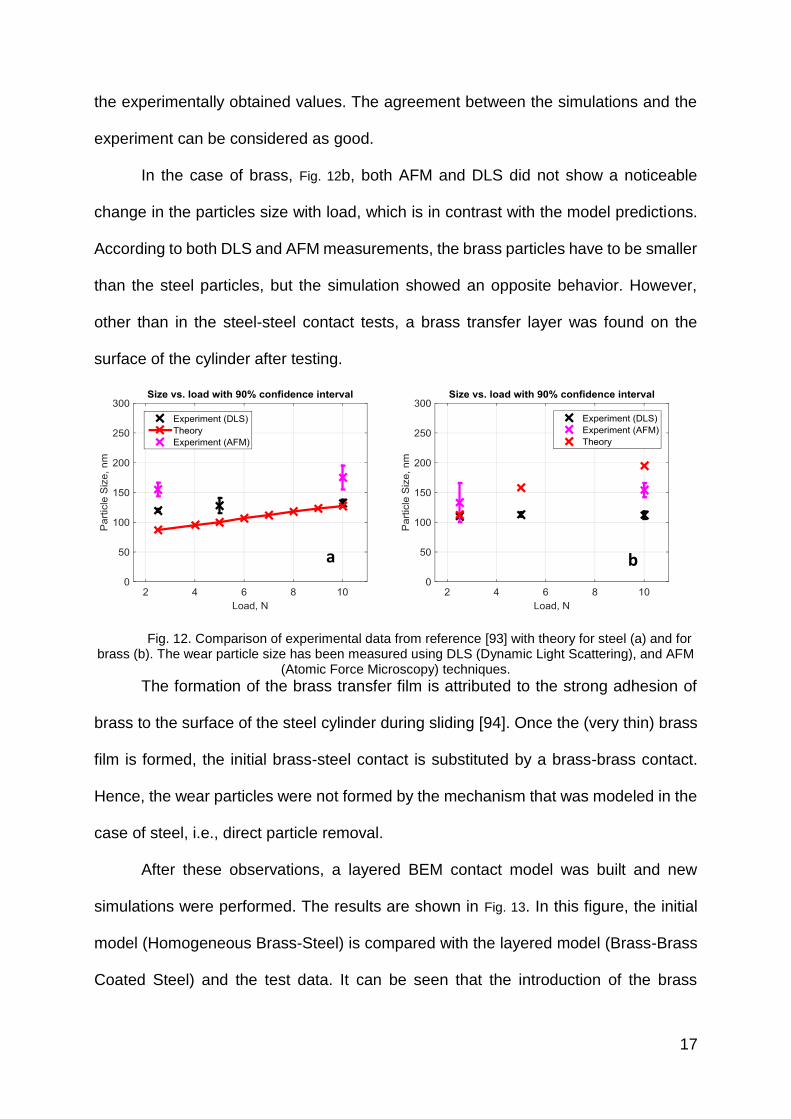
17
the experimentally obtained values. The agreement between the simulations and the
experiment can be considered as good.
In the case of brass, Fig. 12b, both AFM and DLS did not show a noticeable
change in the particles size with load, which is in contrast with the model predictions.
According to both DLS and AFM measurements, the brass particles have to be smaller
than the steel particles, but the simulation showed an opposite behavior. However,
other than in the steel-steel contact tests, a brass transfer layer was found on the
surface of the cylinder after testing.
Fig. 12. Comparison of experimental data from reference [93] with theory for steel (a) and for brass (b). The wear particle size has been measured using DLS (Dynamic Light Scattering), and AFM
(Atomic Force Microscopy) techniques.
The formation of the brass transfer film is attributed to the strong adhesion of
brass to the surface of the steel cylinder during sliding [94]. Once the (very thin) brass
film is formed, the initial brass-steel contact is substituted by a brass-brass contact.
Hence, the wear particles were not formed by the mechanism that was modeled in the
case of steel, i.e., direct particle removal.
After these observations, a layered BEM contact model was built and new
simulations were performed. The results are shown in Fig. 13. In this figure, the initial
model (Homogeneous Brass-Steel) is compared with the layered model (Brass-Brass
Coated Steel) and the test data. It can be seen that the introduction of the brass
a b
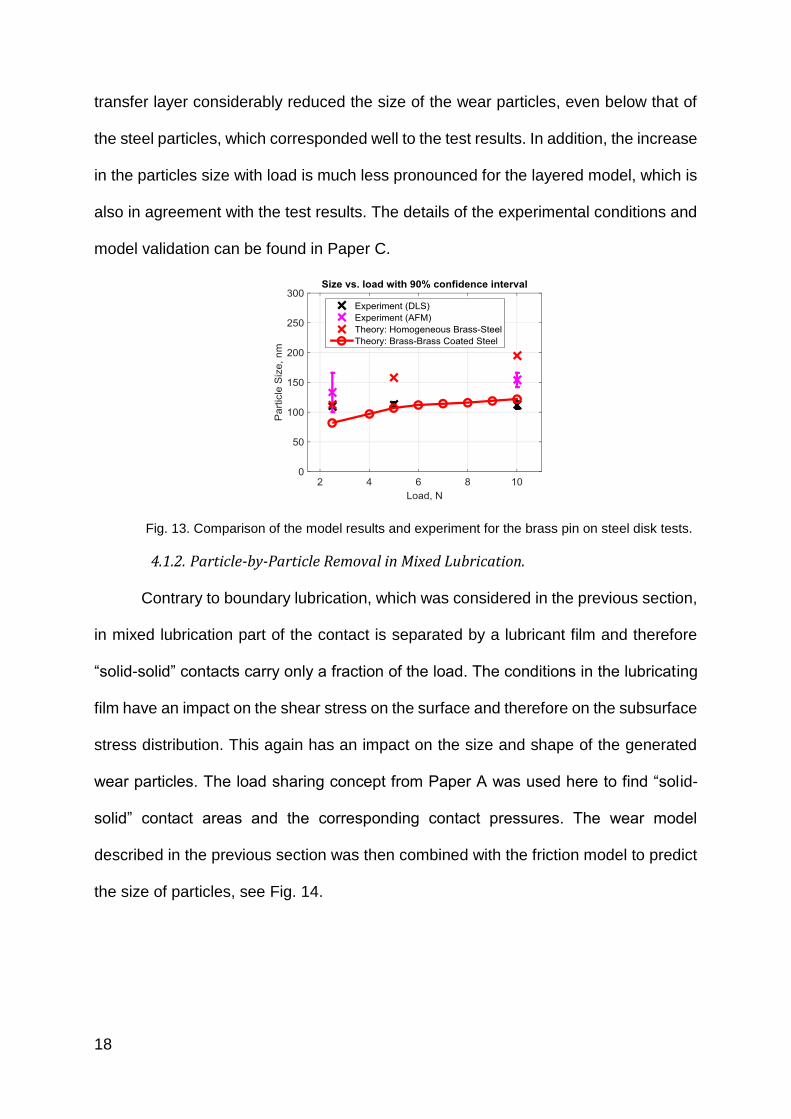
18
transfer layer considerably reduced the size of the wear particles, even below that of
the steel particles, which corresponded well to the test results. In addition, the increase
in the particles size with load is much less pronounced for the layered model, which is
also in agreement with the test results. The details of the experimental conditions and
model validation can be found in Paper C.
Fig. 13. Comparison of the model results and experiment for the brass pin on steel disk tests.
4.1.2. Particle-by-Particle Removal in Mixed Lubrication.
Contrary to boundary lubrication, which was considered in the previous section,
in mixed lubrication part of the contact is separated by a lubricant film and therefore
“solid-solid” contacts carry only a fraction of the load. The conditions in the lubricating
film have an impact on the shear stress on the surface and therefore on the subsurface
stress distribution. This again has an impact on the size and shape of the generated
wear particles. The load sharing concept from Paper A was used here to find “solid-
solid” contact areas and the corresponding contact pressures. The wear model
described in the previous section was then combined with the friction model to predict
the size of particles, see Fig. 14.

19
Fig. 14. Schematic coupling of friction and running-in wear models.
To validate the model, DLS measurements of the wear particles, collected after
a test at 0.01 m/s, were performed. The size of the wear particles calculated with the
model was 200 nm, whereas the DLS results gave 223±13 nm. The agreement
between model prediction and measurement can therefore be considered as good.
The generation of wear particles will change the surface roughness, which again
will change the friction coefficient. The calculated coefficient of friction is plotted as a
function of the number of iterations in Fig. 15b. Actually, the number of iterations can
also be regarded as time with an arbitrary unit. Therefore the results from Fig. 15b may
be compared to a measured coefficient of friction in time, shown in Fig. 15a. Initially, the
friction coefficient is high and drops due to generation of particles and corresponding
smoothening of the surfaces. The results cannot be directly compared. However, the
initial friction and the run-in (or steady state) friction coefficients from the calculations
and the measurements should be similar.

20
Fig. 15. Friction coefficient at 0.05 m/s sliding speed a) measured curve b) calculated curve.
Stribeck curves were built using these initial and run-in friction coefficients, see
Fig. 16. The prediction of the friction coefficient using the model is in a reasonable
agreement with the experimental data for both the initial and run-in friction coefficient.
The figure shows that the model run-in friction is underestimated in the range of 0.03
and 0.05 m/s. This is ascribed to roughening of the surface due to abrasive wear of
particles re-entering the contact, an effect that is not included in the model. The details
of the model validation can be found in Paper D.
Fig. 16. Initial and Run-In friction coefficient curves, experiment vs calculation.
a b

21
4.2. Mild Tribo-Chemical Wear Model
As was mentioned earlier, after running-in, i.e., after a relatively severe period
of wear, a mild tribo-chemical wear regime will be established (assuming that the
conditions are not harsh enough to get into a catastrophic wear mode). If anti-wear
additives are present in the lubricant, the substrate material will not be removed
directly, but wear will happen mainly through the removal of protective reaction layers
(tribo-films) containing various lubricant components and substrate material. Zinc
DialkylDithioPhosphate (ZDDP) is one of the most widely used anti-wear additives [95]
and is therefore considered here as a ‘model-additive’. A ZDDP tribo-film has a
heterogeneous structure and can be up to 200 nm thick (tribo-films self-limit their
growth at various levels, depending on the operating conditions) [96]. The tribo-film is
continuously worn and replenished and has a sacrificial function [97, 98].
Although it is widely accepted that the tribo-film is formed through a tribo-
chemical reaction within the contact, the pathway of the reaction is not known [33, 99].
According to Hard and Soft Acids and Bases theory (HSAB), ZDDP reacts with hard
abrasive iron oxide on the surface (and also with the wear particles) and forms softer,
less abrasive iron sulphides [100], thus preventing severe wear. Due to continuous
generation and subsequent digestion of the oxide wear particles, the tribo-film is
replenished [101]. The theory, however, cannot explain the generation of a tribo-film
on non-ferrous surfaces, such as DLC [102], silicon [33], other metals [99] and
ceramics [103]. Recently, Gosvami et al. [33] assumed that the tribo-film is a result of
chemical reactions taking place within the ZDDP itself under harsh contact conditions.
In their work, the study of the growth of the ZDDP tribo-film was performed using AFM.
They showed that the growth rate of the tribo-film can be described by the following
equation:

22
(𝜕ℎ
𝜕𝑡)𝑔 = 𝛤0̃𝑒
−∆𝑈𝑎𝑐𝑡−𝜏∙∆𝑉𝑎𝑐𝑡
𝑘𝐵𝑇 , (3)
where ∆𝑈𝑎𝑐𝑡 is the internal activation energy (in the absence of stress), ∆𝑉𝑎𝑐𝑡 is
the activation volume, 𝜏 is the shear stress, 𝛤0̃ is a pre-factor, 𝑘𝐵 and 𝑇 are Boltzmann’s
constant and absolute temperature. Zhang and Spikes [99] confirmed the stress-
activated Arrhenius behavior of ZDDP growth in macroscale experiments.
There are a number of wear models that include the presence of a tribo-film.
Brizmer et al. [104] introduced the influence of the additives on the micro-pitting
behavior by taking into account a modified boundary coefficient of friction and a wear
rate. Bosman and Schipper [97, 105] developed a mechano-chemical model to
calculate wear. It was assumed that the growth of the tribo-film is a diffusion process,
while the wear was calculated using the amount of plastic deformation of the tribo-film.
Andersson et al. [106] considered the influence of temperature and employed a
thermo-activated Arrhenius equation to model tribo-film growth, following So et al.
[107]. Ghanbarzadeh et al. [108] proposed a semi-deterministic model for tribo-film
growth, based on a modified Arrhenius equation, as proposed by Bulgarevich et al.
[109]. The influence of the stress was taken into account indirectly, through a pre-
factor.
Up until now, self-limitation – a characteristic feature of the tribo-film growth -
was implemented by the introduction of fitting parameters and a direct stress
dependence was mostly neglected. This limits the application of these models to the
specific experimental conditions for which these parameters were calibrated. In the
current work (see Paper E), it was shown that the stress-activated theory not only
allows to consider the stress influence on the growth rate, but also to predict the self-
limitation under various conditions.

23
The evolution of the tribo-film was calculated from the balance of growth and
wear. In the current work, a simple linear relation of tribo-film wear to its height ℎ was
used. The wear rate was calculated using the following equation:
(𝜕ℎ
𝜕𝑡)𝑤 = 𝛼ℎ, (4)
where 𝛼 is a fitting parameter and ℎ is the tribo-film thickness. According to this
relation, wear grows with the growth of the tribo-film. Fujita and Spikes [110, 111]
observed that a growth of the tribo-film also leads to an increase in the wear of this
film. This is ascribed to a difference in wear resistance between the fraction of the film
close to the surface (low wear resistance) and that of the bulk of the film (higher wear
resistance). Equation (4) shows the same behavior.
The change in the tribo-film thickness was calculated using the following
equation:
𝜕ℎ
𝜕𝑡= (
𝜕ℎ
𝜕𝑡)𝑔 − (
𝜕ℎ
𝜕𝑡)𝑤, (5)
A flow chart of the approach is shown in Fig. 17.
Fig. 17. Flow chart of the tribo-film growth calculation.

24
First, the model was applied to a contact for which experiments were available
that could be used for the validation of the model: the iron substrate – DLC AFM tip
contact, from Gosvami et al. [33], see Fig. 18. The initial phase of the tribo-film growth
is relatively slow, as discussed in detail in reference [33]. This period of growth is not
well understood and is also considered to be less relevant here. It is assumed that
there is an existing tribo-film layer at the start of the calculations. For comparison, the
simulation data was shifted in time to match the experiments in the fast growing region.
The agreement between model and experiment in this region is good.
Next the model was applied to the macroscale contact of rough steel surfaces,
for which experimental data was available from Ghanbarzadeh et al. [108], Fig. 19a.
The figure shows that a reasonable agreement at various temperatures can be
obtained with the use of the same set of parameters. It should be noted that including
the stress dependency in the Arrhenius growth equation was a prerequisite to get a
good fit of the three curves using the same constants. Fig. 19a shows a saturation of
the tribo-film thickness growth at higher temperatures, an effect that will not occur if
only Arrhenius behavior is assumed. The stress-activated equation with the described
mechanical model made it possible to also capture this effect.
Fig. 18. Simulation and experimental data (reconstructed from [33]) at 600nN load.

25
Fig. 19. a) Comparison of simulation and experimental data [108], b) Evolution of the wear rate with temperature.
The wear of the tribo-film as a function of time is shown in Fig. 19b. As expected,
the tribo-film wear rate is larger for thicker films. The wear of the tribo-film also leads
to wear of the substrate material (for most of materials), in this case iron. This is
ascribed to the diffusion of the iron atoms into the tribo-film [36], which are then
removed together with the film. The substrate material wear rate is related to the
concentration of the substrate material atoms in the tribo-film. The following relation
was used to calculate the concentration as a function of the tribo-film thickness:
𝐶(ℎ) = 𝑒−𝐶1ℎ, (6)
where 𝐶(ℎ) is the concentration of substrate material and 𝐶1 is an unknown
constant. If the concentration is known, the wear of the substrate material can be
calculated from the wear of the tribo-film. The unknown constant 𝐶1, needs to be
determined from wear depth measurements. The data for calibration was taken from
reference [108] and is given in Table 1. Reported data contained the wear depth
measurements after 45 and 120 minutes, at 60 and 100 °C. By taking the difference of
wear depths at 120 min and 45 min, the running-in period was excluded and the fitting
was performed, see Table 1. The running-in was excluded here, since only mild tribo-
chemical wear was considered. As can be seen, a remarkable agreement of the
simulation and experiment was achieved.
a b

26
Table 1. Wear depth data, 𝑪𝟏 = 𝟏. 𝟐𝟒 × 𝟏𝟎𝟕.
𝑇, °C ∆= ℎ𝑤𝑚120 𝑚𝑖𝑛
− ℎ𝑤𝑚45 𝑚𝑖𝑛
, , nm ∆= ℎ𝑤𝑚120 𝑚𝑖𝑛
− ℎ𝑤𝑚45 𝑚𝑖𝑛
, calculated, nm
60 85 86.3
100 45.4 45.8
The evolution of the substrate material wear is shown in Fig. 20a. Despite the
lowest tribo-film wear rate, the highest wear of the substrate material was found at 60
°C. This is ascribed to the high concentration of the substrate material in the tribo-film
at this temperature, see Fig. 20b. For the higher temperatures, the concentration drops
and the wear of substrate material decreases, despite higher wear rate of the tribo-
film. This behavior is consistent with the experimental observation. Further details of
the model development and validation can be found in Paper E.
Fig. 20 a) Calculated wear of a substrate material (wear depth), b) Calculated concentration of the substrate material in a tribo-film.
5. Conclusions and Recommendations
5.1. Conclusions
In this thesis a wear model to predict the generation of the wear particles in
boundary and mixed lubricated contacts during running-in was developed and
a b

27
validated using experimental data. An efficient and robust algorithm based on BEM
was employed.
First, a robust, fast and accurate friction model was developed and validated
using measurements of the friction coefficient under various operating conditions.
Further, the wear particles generation model based on Von Mises stress was validated
using particles size measurement in boundary lubrication. Finally, the models were
combined to predict the generation of particles in mixed lubricated contacts during
running-in. It was shown that the model is capable of predicting not only the size of the
formed wear fragments, but also the evolution of the friction coefficient while running-
in. As a last step, a mild tribo-chemical wear model was developed. The model is
based on the transition state theory and includes the stress-dependence of the tribo-
film growth. The model calculations showed a good agreement with the experimental
data under various conditions.
It can be concluded that the prediction of wear particles size during running-in
can be performed accurately based on the stress criterion and BEM algorithms. It was
found that the size of wear particles stabilizes after an initial period and that the size
depends on the applied load and the sliding speed in mixed lubrication. The generation
of the particles changed the surface roughness, which was reasonably well predicted
by the model. The model can be used to predict the size, shape and number of particles
generated in mixed lubrication in roller-cage contact in rolling bearings. This
information can be used to improve accuracy in the prediction of oil and grease
degradation due to wear particles.
The current trend in tribology shows that the classical principle of separation of
the surfaces using an EHL lubricant film to reduce friction further will be challenging.
Ultra-low friction reported so far was found with the use of “solid” tribo-films and it is
28
likely that more and more systems will be operating with the help of such films. Friction
and wear of these films, but also generation and durability, will be largely influenced
by the wear particles formed during the rubbing, and particularly by their size and
shape. The simulation models as discussed in the thesis can help to identify conditions
under which the particles can decrease damage of the protective tribo-films and/or take
part in their generation.
5.2. Recommendations
There are several points to be addressed in future research. One of the
important questions left open in the thesis is the impact of the generated particles on
the contact conditions and lubrication performance. It was assumed that the wear
particles leave the contact once generated. However, the particles may be trapped and
may be brought back and influence local stresses. In addition, the wear particles act
as catalysts for oxidation and therefore facilitate the chemical degradation of the
lubricant. Development of a model to take into account both mechanical and chemical
effects of the generated particles will increase the accuracy not only of wear prediction,
but also the surface roughness evolution and, as a consequence, the accuracy of
friction coefficient prediction in mixed lubrication. The long-term lifetime prediction of
the lubricated system therefore will be improved.
The mixed lubrication model employed in the thesis can be improved to extend
its application domain. It was assumed in the thesis that the roughness of the surfaces
does not disturb the lubricant EHL film thickness. In reality, for very thin films (high
loads), the film is disturbed locally by the surface asperities. In the thesis, the model
was developed for the cage-roller contacts where the loads are relatively low. For the
application at higher loads, the influence of the surface roughness on the EHL

29
thickness has to be considered. Additionally, at high loads an accurate (non-
Newtonian) rheological model of the lubricant has to be incorporated.
Additionally, it was assumed that the boundary friction coefficient is known and
constant. To increase the accuracy of particles size prediction, a boundary friction
coefficient model has to be developed. This will also increase the accuracy of mild
tribo-chemical wear model.
An empirical relation of the tribo-film hardness to height and temperature was
utilized in this thesis. It is recommended to develop a universal model to extend the
applicability and to increase the accuracy of the presented approach. The hardness
will have to be linked to the plastic penetration, temperature and diffusion of substrate
material (e.g. iron) into the tribo-film.
The mild tribo-chemical wear was validated for the ZDDP tribo-films. It is
recommended to extend the concept to other anti-wear additives as well.

30
Bibliography
[1] Bhushan B. Principles and Application of Tribology. New York: A Wiley-Interscience
Publication; 1999.
[2] Bhushan B. Modern Tribology Handbook. Columbus: CRC Press; 2001.
[3] Zmitrowicz A. Wear Debris: A Review of Properties and Constitutive Models. Journal of
Theoretical and Applied Mechanics. 2005;43:3-35.
[4] Soda N. Wear of Some F.C.C. Metals During Unlubricated Sliding. Part II: Effects of
Normal Load, Sliding Velocity and Atmospheric Pressure on Wear Fragments. Wear.
1975;35:331-43.
[5] Williams J, A. Wear and Wear Particles - Some Fundamentals. Tribology International.
2005;38:863-70.
[6] Roylance B, J., Williams, J.,A., Dwyer-Joyce, R. Wear Debris and Associated Phenomena
- Fundamental Research and Practice. Proceedings of the Institution of Mechanical Engineers,
Part J: Journal of Engineering Tribology. 2000;214:79-105.
[7] Reda A, A., Bowen, R. Characteristics of Particles Generated at the Interface Between
Sliding Steel Surfaces. 1975;34.
[8] Martin J, M., Mansot, J.,L., Berbezier, I. The Nature and Origin of Wear Particles from
Boundary Lubrication with a Zinc Dialkyl Dithiophosphate. 1984;93.
[9] Scherge M, Martin J, M., Pohlmann K. Characterization of Wear Debris of Systems
Operated Under Low Wear-Rate Conditions. Wear. 2006;260:458-61.
[10] Hiratsuka K, Muramoto, K. Role of Wear Particles in Severe-Mild Wear Transition. Wear.
2005;259:467-76.
[11] Hase A, Mishina, H. Wear Elements Generated in the Elementary Process of Wear.
Tribology International. 2008;42:1684-90.
[12] Wasche R, Hartelt M, Hodoroaba V-D. Analysis of Nanoscale Wear Particles from
Lubricated Steel-Steel Contacts. Tribology Letters. 2015;58.
[13] Rabinowicz E. The Formation of Spherical Wear Particles. 1977;42.
[14] Akchuin A, Xu, S.,Tangpong,A., Akhatov,I., Tian-Liu, Weston,W., Zhong,W.-H.
Nanoscale Characterization of Wear Particles Produced From CNF-Reinforced HDPE
Composites. Houston: In proceedings of IMECE Annual Meeting; 2012.
[15] Kato K. Micro-Mechanisms of Wear - Wear Modes. Wear. 1992;153:277-95.
[16] Mishina H. Surface Deformation and Formation of Original Element of Wear Particles in
Sliding Friction. Wear. 1998;215:10-7.
[17] MacQuarrie RA, Chen YF, Coles C, Anderson GI. Wear-Particle–Induced Osteoclast
Osteolysis: the Role of Particulates and Mechanical Strain. Journal of Biomedical Materials
Research Part B, Applied Biomaterials. 2004;69B:104-12.
[18] Green TR, Fisher J, Stone M, Wroblewski BM, Ingham E. Polyethylene Particles of a
“Critical Size” are Necessary for the Induction of Cytokines by Macrophages in Vitro.
Biomaterials. 1998;19:2297-302.
[19] Elfick APD, Green SM, Krickler S, Unsworth A. The Nature and Dissemination of
UHMWPE Wear Debris Retrieved from Periprosthetic Tissue of THR. Journal of Biomedical
Material and Research. 2003;65A:95-108.
[20] Olofsson U, Olander L, Jansson A. Towards a Model for the Number of Airborne Particles
Generated from a Sliding Contact. Wear. 2009;267:2252-6.
[21] Vindedahlm A, Strehlau JH, Arnold W, Pen RL. Organic Matter and Iron Oxide
Nanoparticles: Aggregation, Interactions, and Reactivity Environmental Science: Nano. 2016.
31
[22] Plascencia-Villa G, Ponce A, Collingwood JF, Arellano-Jiménez MJ, Zhu X, Rogers JT,
et al. High-resolution analytical imaging and electron holography of magnetite particles in
amyloid cores of Alzheimer’s disease. Scientific Reports. 2016;6:24873.
[23] Hurley S, Cann, P., M., Spikes, H.,A. Lubrication and Reflow Properties of Thermally
Aged Greases. Tribology Transactions. 2008;43:221-8.
[24] Jin X. The Effect of Contamination Particles on Lithium Grease Deterioration. Lubrication
Science. 1995;7.
[25] Tallian TE. The theory of partial elastohydrodynamic contacts. Wear. 1972;21:49-101.
[26] Spikes HA, Olver AV. Basics of Mixed Lubrication. Lubrication Science. 2003;16:3-28.
[27] Johnson KL, Greenwood JA, Poon SY. A Simple Theory of Asperity Contact in Elasto-
Hydrodynamic Lubrication. Wear. 1972;19:91-108.
[28] Bosman R. Mild Microscopic Wear Modeling in the Boundary Lubrication Regime [PhD
Thesis]. Enschede: University of Twente; 2011.
[29] Chou CC, Lin JF. Tribological Effects of Roughness and Running-In on Oil-Lubricated
Line Contacts. Proc IMechE PartJ: Journal of Engineering Tribology: Part J. 1997;211:209-22.
[30] Rowe GW, Kaliszer H, Trmal G, Cotter A. Running-in of Plain Bearings. Wear. 1975;34:1-
14.
[31] Bosman R, Schipper DJ. On the Transition from Mild to Severe Wear of Lubricated,
Concentrated Contacts: the IRG (OECD) Transition Diagram. Wear. 2010;269:581-9.
[32] Ghanbarzadeh A, Parsaeian P, Morina A, Wilson MCT, van Eijk MCP, Nedelcu I, et al. A
Semi-deterministic Wear Model Considering the Effect of Zinc Dialkyl Dithiophosphate
Tribofilm. Tribology Letters. 2015;61:12-27.
[33] Gosvami NN, Bares JA, Mangolini F, Konicek AR, Yablon DG, Carpick RW. Mechanisms
of antiwear tribofilm growth revealed in situ by single-asperity sliding contacts. Science.
2015;348:102-6.
[34] Minfraya C, Le Mognea T, Martina J-M, Onoderab T, Narab S, Takahashib S, et al.
Experimental and Molecular Dynamics Simulations of Tribochemical Reactions with ZDDP:
Zinc Phosphate–Iron Oxide Reaction. Tribology Transactions. 2008;51:18-27.
[35] Matta C, Joly-Pottuz L, De Barros Bouchet MI, Martin JM, Kano M, Zhang Q, et al.
Superlubricity and tribochemistry of polyhydric alcohols. Physical Review B. 2008;78.
[36] Pasaribu HR, Lugt PM. The Composition of Reaction Layers on Rolling Bearings
Lubricated with Gear Oils and Its Correlation with Rolling Bearing Performance. Tribology
Transactions. 2012;55:351-6.
[37] Evans HP. Modelling Mixed Lubrication and the Consequences of Surface Roughness in
Gear Applications. 13-th Nordic Symposium on Tribology (Nordtrib 2008)2008.
[38] Zhu D, Hu Y-Z. A computer program package for the prediction of EHL and mixed
lubrication characteristics, friction, subsurface stresses and flash temperatures based on
measured 3-D surface roughness. Tribology Transactions. 2008;44:383-90.
[39] Lugt PM, Morales-Espejel GE. A Review of Elasto-Hydrodynamic Lubrication Theory.
Tribology Transactions. 2011;54:470-96.
[40] Spikes HA. Mixed Lubrication - an Overview. Lubrication Science. 1997;9:221-53.
[41] Zhu D. On some aspects of numerical solutions of thin-film and mixed elastohydrodynamic
lubrication. Journal of Engineering Tribology. 2007;221:561-79.
[42] Johnson KL, Greenwood JA, Poon SY. A simple theory of asperity contact in
elastohydrodynamic lubrication. Wear. 1972;19:91-108.
[43] Dowson D, Higginson GR. New Roller-Bearing Lubrication Formula. Engineering
(London). 1961;192:158-9.
[44] Nijenbanning G, Venner CH, Moes H. Film thickness in elastohydrodynamically
lubricated elliptic contacts. Wear. 1994;176:217-29.

32
[45] Morales-Espejel GE, Wemekamp AW, Felix-Quinonez A. Micro-Geometry Effects on the
Sliding Friction Transition in Elastohydrodynamic Lubrication. Journal of Engineering
Tribology. 2010;224:621-37.
[46] Bobach L, Beilicke R, Bartel D, Deters L. Thermal Elastohydrodynamic Simulation of
Involute Spur Gears Incorporating Mixed Friction. Tribology International 2012;48:191-206.
[47] Venner CH, ten Napel WE. Multilevel solution of the elstohydrodynamically lubricated
circular contact problem. Part 2: smooth surface results. Wear. 1992;152:369-81.
[48] Habchi W. Reduced order finite element model for elastohydrodynamic lubrication:
Circular contacts. Tribology International. 2014;71:98-108.
[49] Habchi W. A Full-system Finite Element Approach to Elastohydrodynamic Lubrication
Problems: Application to Ultra-low-viscosity Fluids. PhD thesis.: INSA de Lyon; 2008.
[50] Hughes TG, Elcoate CD, Evans HP. Coupled Solution of the Elastohydrodynamic Line
Contact Problem Using a Differential Deflection Method. Proceedings of the Institution of
Mechanical Engineers, Part C. 1999;214:585-98.
[51] Faraon IC, Schipper DJ. Stribeck Curve for Starved Line Contacts. Journal of Tribology.
2007;129:181-7.
[52] Persson BNJ. Sliding Friction. Physical Principles and Applications: Springer Berlin
Heidelberg; 2000.
[53] Akchurin A, Bosman R, Lugt PM, van Drogen M. On a Model for the Prediction of the
Friction Coefficient in Mixed Lubrication Based on a Load-Sharing Concept. Tribology Letters.
2015;59:19-30.
[54] Weiner B. A Guide to Choosing a Particle Sizer.
[55] Skebo J, E., Grabinski A, M.,S., Schlager J, J., Hussain S, M. Assessment of Metal
Nanoparticle Agglomeration, Uptake, and Interaction Using High-Illuminating System.
International Journal of Toxicology. 2007;26:135 - 41.
[56] Zhou D, Bennett S, W., Keller A, A. Increased Mobility of Metal Oxide Nanoparticles Due
to Photo and Thermal Induced Disagglomeration. Public Library of Science one. 2012;7:1-8.
[57] Seipenbusch M, Toneva P, Peukert W, Weber A, P. Impact Fragmentation of Metal
Nanoparticle Agglomerates. Particle and Particle Systems Characterization. 2007;24:193-200.
[58] Kwak K, Kim C. Viscosity and Thermal Conductivity of Copper Oxide Nanofluid
Dispersed in Ethylene Glycol. Korea-Australia Rheology Journal. 2005;17:35-40.
[59] Ludema K. Friction, Wear, Lubrication: A Textbook in Tribology. Ann Arbor: CRC Press;
1996.
[60] Williams J, A. Wear Modelling: Analytical, Computational and Mapping: A Continuum
Mechanics Approach. Wear. 1999;225-229:1-17.
[61] Meng H, C., Ludema K.,C. Wear Models and Predictive Equations: Their Form and
Content. 1995;181-183.
[62] Jerbi H, Nelias D, Baietto M-C. Semi-Analytical Model for Coated Contacts. Fretting
Wear Simulation. Leeds-Lyon Symposium on Tribology. Lyon, France.2015.
[63] Argatov I, I. Asymptotic modeling of Reciprocating Sliding Wear with Application to
Local Interwire Contact. Wear. 2011;271:1147-55.
[64] Mishina H, Hase A. Wear equation for adhesive wear established through elementary
process of wear. Wear. 2013;308:186-92.
[65] De Moerlooze K, Al-Bender, F., Van Brussel, H. A Novel Energy-Based Generic Wear
Model at the Asperity Level. Wear. 2011;270:760-70.
[66] Huq M, Z., Celis, J.-P. Expressing Wear Rate in Sliding Contacts Based on Dissipated
Energy. Wear. 2002;252:375-83.
[67] Aghdam AB, Khonsari MM. On the correlation between wear and entropy in dry sliding
contact. Wear. 2011;270:781-90.

33
[68] Polonsky IA, Keer LM. A numerical method for solving rough contact problems based on
the multi-level multi-summation and conjugate gradient techniques. Wear. 1999;231:206-19.
[69] Tian X, Bhushan B. A numerical three-dimensional model for the contact of rough surfaces
by variational principle. Journal of Tribology. 1996;118:33-42.
[70] Liu S. Thermomechanical Contact Analysis of Rough Bodies. PhD thesis.: Northwestern
University; 2001.
[71] Molinari JF, Ortiz M, Radovitzky R, Repetto EA. Finite-Element Modeling of Dry Sliding
Wear in Metals. Engineering Computations. 2001;18:592-609.
[72] Podra P, Andersson S. Simulating Sliding Wear with Finite Element Method. Tribology
International. 1999;32:71-81.
[73] Hegadekatte V, Huber N, Kraft O. Modeling and Simulation of Wear in a Pin on Disc
Tribometer. Tribology Letters. 2006;24:51-60.
[74] Cruzado A, Urchegui MA, Gomez X. Finite Element Modeling of Fretting Wear Scars in
the Thin Steel Wires: Application in Crossed Cylinder Arrangements. Wear. 2014;318:98-105.
[75] Mattei L, Di Puccio F. Influence of the Wear Partition Factor on Wear Evolution Modeling
of Sliding Surfaces. International Journal of Mechanical Sciences. 2015;99:72-88.
[76] Holmberg K, Laukkanen A, Turunen E, Laitinen T. Wear Resistance Optimisation of
Composite Coatings by Computational Microstructure Modeling. Surface & Coatings
Technology. 2014;247:1-13.
[77] Holmberg K, Laukkanen A, Ghabchi A, Rombouts M, Turunen E, Waudby R, et al.
Computational Modelling Based Wear Resistance Analysis of Thick Composite Coatings.
Tribology International. 2014;72:13-30.
[78] Tavoosi H, Ziaei-Rad S, Karimzadeh F, Akbarzadeh S. Experimental and Finite Element
Simulation of Wear in Nanostructured NiAl Coating. Journal of Tribology. 2015;137.
[79] Luan BQ, Hyun S, Molinari JF, Bernstein N, Robbins MO. Multiscale Modeling of Two-
Dimensional Contacts. Physical Review E. 2006;74.
[80] Xiao SP, Belytchko T. A Bridging Domain Method for Coupling Continua with Molecular
Dynamics. Computer methods in applied mechanics and engineering. 2004;193:1645-69.
[81] Crill JW, Ji X, Irving DL, Brenner DW, Padgett CW. Atomic and Multi-Scale Modeling
of Non-Equilibrium Dynamics at Metal-Metal Contacts. Modeling and Simulation in Materials
Science and Engineering. 2010;18.
[82] Salib J, Kligerman, Y., Etsion, I. A Model for Potential Adhesive Wear Particle at Sliding
Inception of a Spherical Contact. Tribology Letters. 2008;30:225-3.
[83] Boher C, Barrau, O., Gras, R., Rezai-Aria, F. A Wear Model Based on Cumulative Cyclic
Plastic Straining. Wear. 2009;267:1087-94.
[84] Liu Q. Friction in mixed and elastohydrodynamic lubricated contacts including thermal
effects. PhD thesis.: University of Twente; 2002.
[85] Behesthi A, Khonsari, M.,M. An Engineering Approach for the Prediction of Wear in
Mixed Lubricated Contacts. 2013;308.
[86] Bosman R, Schipper D, J. Transition from Mild to Severe Wear Including Running in
Effects. Wear. 2011;270:472-8.
[87] Ajayi O, O., Lorenzo-Martin, C., Erck, R.,A., Fenske, G.,R. Analytical Predictive
Modeling of Scuffing Initiation in Metallic Materials in Sliding Contact. 2013;301.
[88] Jiang J, Stott, F.,H., Stack, M.,M. A Mathematical Model for Sliding Wear of Metals at
Elevated Temperatures. 1995;181-183.
[89] Morales-Espejel GE, Brizmer V. Micropitting Modelling in Rolling-Sliding Contacts:
Application to Rolling Bearings. Tribology Transactions. 2011;54:625-43.
[90] Brizmer V, Pasaribu HR, Morales-Espejel GE. Micropitting Performance of Oil Additives
in Lubricated Rolling Contacts. Tribology Transactions. 2013;56:739-48.
34
[91] Morales-Espejel GE, Brizmer V, Piras E. Roughness Evolution in Mixed Lubrication
Condition due to Mild Wear. Proc IMechE PartJ: Journal of Engineering Tribology.
2015;229:1330-46.
[92] Nelias D, Boucly V, Brunet M. Elastic-Plastic Contact Between Rough Surfaces: Proposal
for a Wear or Running-in Model. Journal of Tribology. 2006;128:236-44.
[93] Akchurin A, Bosman R, Lugt PM. Analysis of Wear Particles Formed in Boundary
Lubricated Sliding Contacts. Tribology Letters. 2016;63:1-14.
[94] Kerridge M, Lancaster JK. The Stages in a Process of Severe Metallic Wear. Proceedings
of the Royal Society of London. 1956:250-64.
[95] Spikes H. The History and Mechanisms of ZDDP. Tribology Letters. 2004;17:469-89.
[96] Topolovec-Miklozic K, Forbus TR, Spikes HA. Film thickness and roughness of ZDDP
antiwear films. Tribology Letters. 2007;26:161-71.
[97] Bosman R, Schipper D, J. Running-in of Systems Protected by Additive Rich Oils.
Tribology Letters. 2011;41:263-82.
[98] Lin YC, So H. Limitations on use of ZDDP as an antiwear additive in boundary lubrication.
Tribology International. 2004;37:25-33.
[99] Zhang J, Spikes H. On the Mechanism of ZDDP Antiwear Film Formation. Tribology
Letters. 2016;63:1-15.
[100] Martin JM. Antiwear mechanisms of zinc dithiophosphate: a chemical hardness approach.
Tribology Letters. 1999;6:1-8.
[101] Martin JM, Onodera T, Minfray C, Dassenoy F, Miyamoto A. The origin of anti-wear
chemistry of ZDDP. Faraday Discussions. 2012;156:311-23.
[102] Vengudusamy B, Green JH, Lamb GD, Spikes HA. Tribological properties of tribofilms
formed from ZDDP in DLC/DLC and DLC/steel contacts. Tribology International.
2011;44:165-74.
[103] Mingwu B, Xushou Z, Shangkui Q. Tribological properties of silicon nitride ceramics
coated with molybdenum films under boundary lubrication. Wear. 1993;169:181-7.
[104] Brizmer V, Pasaribu HR, Morales-Espejel GE. Micropitting Performance of Oil
Additives in Lubricated Rolling Contacts. Tribology Transactions. 2013;56:739-48.
[105] Bosman R, Hol J, Schipper D, J. Running in of Metallic Surfaces in the Boundary
Lubrication Regime. Wear. 2011;271:1134-46.
[106] Andersson J, Larsson R, Almqvist A, Grahn M, Minami I. Semi-deterministic chemo-
mechanical model of boundary lubrication. Faraday Discuss. 2012;156:343-60; discussion 413-
34.
[107] So H, Lin YC. The theory of antiwear for ZDDP at elevated temperature in boundary
lubrication condition. Wear. 1994;177:105-15.
[108] Ghanbarzadeh A, Parsaeian P, Morina A, Wilson MCT, van Eijk MCP, Nedelcu I, et al.
A Semi-deterministic Wear Model Considering the Effect of Zinc Dialkyl Dithiophosphate
Tribofilm. Tribology Letters. 2015;61:1-15.
[109] Bulgarevich SB, Boiko MV, Kolesnikov VI, Feizova VA. Thermodynamic and kinetic
analyses of probable chemical reactions in the tribocontact zone and the effect of heavy pressure
on evolution of adsorption processes. Journal of Friction and Wear. 2011;32:301-9.
[110] Fujita H, Spikes HA. Study of Zinc Dialkyldithiophosphate Antiwear Film Formation
and Removal Processes, Part II: Kinetic Model. Tribology Transactions. 2005;48:567-75.
[111] Fujita H, Glovnea RP, Spikes HA. Study of Zinc Dialkydithiophosphate Antiwear Film
Formation and Removal Processes, Part I: Experimental. Tribology Transactions. 2005;48:558-
66.

Part B


Paper A


On a Model for the Prediction of the Friction Coefficient in
Mixed Lubrication Based on a Load-Sharing Concept with Measured
Surface Roughness
Aydar Akchurin1,2, Rob Bosman2, Piet M. Lugt2,3, Mark van Drogen3
1Materials innovation institute (M2i)
P.O. Box 5008
2600 GA DELFT
The Netherlands
2Department of Engineering Technology,
Laboratory for Surface Technology and Tribology,
University of Twente,
P.O. Box 217
7500 AE Enschede
The Netherlands
3SKF Engineering & Research Centre
Kelvinbaan 16
3439MT Nieuwegein, The Netherlands

A-2
Nomenclature
𝑥, 𝑦, �̃� spatial coordinates, [𝑚]
𝑝(𝑥, 𝑦) dry contact pressure, [𝑃𝑎]
𝑢(𝑥, 𝑦) deflection due to pressure 𝑝(𝑥, 𝑦), [𝑚]
𝐸1, 𝐸2 Young’s modulus of the cylinder and the substrate,
[𝑃𝑎]
𝜈1, 𝜈2 Poisson’s ratio of the cylinder and the substrate, [−]
𝐸′
composite Young’s modulus, [𝑃𝑎]
2
𝐸′=1 − 𝜈1
2
𝐸1+1 − 𝜈2
2
𝐸2
𝑧(𝑥, 𝑦) measured surface roughness, [𝑚]
ℎ𝑠(𝑥, 𝑦) separation distance between the bodies, [𝑚]
𝐴𝑐,�̃�, 𝐴
dry, lubricated and nominal Hertzian contact areas
respectively, [𝑚2]
𝐹𝐶 load carried by surface contacts, [𝑁]
𝐾 influence matrix, [𝑚
𝑃𝑎]
𝑁 numerical grid size, [−]
ℎ(𝑥, 𝑦) hydrodynamic film thickness, [𝑚]
𝑃𝐻(𝑥, 𝑦) hydrodynamic pressure, [𝑃𝑎]
𝜇 kinematic viscosity of the lubricant, [𝑃𝑎 ∙ 𝑠]
𝑅 radius of the cylinder, [𝑚]
𝐹𝐻 load carried by the hydrodynamic film,[𝑁]
𝐹𝑇 total applied load, [𝑁]

A-3
𝑢ℎ(𝑥, 𝑦) elastic deflection due to hydrodynamic pressure
𝑃𝐻(𝑥, 𝑦),[𝑚]
𝑓𝐶 friction coefficient, [−]
𝑓𝐶𝑏 friction coefficient in boundary lubrication, [−]
𝜆 distance between the neighboring asperities, [𝑚]
𝐿 autocorellation length, [𝑚]
𝐵 width of the cylinder, [𝑚]
𝛼 pressure-viscosity coefficient, [1
𝐺𝑃𝑎]
𝑃𝑢 hardness of the substrate, [𝑃𝑎]
Abstract
A new model was developed for the simulation of the friction coefficient in
lubricated sliding line contacts. A half-space based contact algorithm was linked with
a numerical elasto-hydrodynamic lubrication solver using the load-sharing concept.
The model was compared with an existing asperity-based friction model for a set of
theoretical simulations. Depending on the load and surface roughness, the difference
in friction varied up to 32%. The numerical lubrication model makes it possible to also
calculate lightly loaded contacts and can easily be extended to solve transient
problems. Experimental validation was performed by measuring the friction coefficient
as a function of sliding velocity for the stationary case.
1. Introduction
Friction, lubrication and wear are highly related phenomena. The presence of
lubricating oil between contacting surfaces is often beneficial, as it reduces the shear

A-4
stresses and thereby friction and wear. By contrast, breakdown of the oil film, leads to
adverse effects. A film failure is associated with surface roughness. In the case of
insufficient lubrication two sliding bodies under normal load come in direct contact first
at the highest peaks (asperities), and the lubricant film breakdown is initiated at these
spots. Wear is initiated at these contact spots as well. In line with the efforts to reduce
energy consumption, significant efforts have been made in the development of friction
models. The literature reveals the existence of two general approaches for the
calculation of friction in lubricated contacts: rough elasto-hydrodynamic lubrication
(EHL) theory based methods and load sharing concept models [1,2]. In the rough EHL
approach the governing lubricant flow and surface deformation equations are solved
numerically assuming a rough surface in both the Reynolds equation as well as for the
solid deflection. Despite the significant progress achieved in the development of such
models [3-6], certain problems still exist in the “thin film lubrication regime”, such as
convergence, accuracy and mesh-dependence [7]. The selection of the film breakdown
criteria in mixed lubrication models, has a significant effect on the calculated friction
values. So far there is no consensus on this topic.
On the other hand, load sharing models, first introduced by Johnson [8], offer
advantages of robustness and a relatively simple methodology for the estimation of
friction. In this approach, separate smooth surface lubrication and dry rough contact
models are employed which simplifies the problem. Asperity contact conditions are
estimated using dry rough surface contact models, such as the Greenwood and
Williamson model [9]. The lubrication models apply the EHL theory under the
assumption of smooth surfaces [10,11] and consequently are more robust than the
rough EHL algorithms, as they are typically based on function fits. The contact and

A-5
lubrication models are linked through the proportionality of the loads carried by liquid
and surface contacts [8].
Since Johnson introduced the load sharing concept, a large number of
researchers employed this approach for the calculation of the friction coefficient in
lubricated contacts, see for example [12-14], and many attempts were undertaken to
reduce the assumptions, making the models more widely applicable. Most of the
researchers addressed the limitations of using the dry rough contact models.
Greenwood and Williamson [9] pioneered with the asperity based statistical approach
for predicting surface contact interaction. The surface was represented as a set of fully
elastic, independent, hemi-spherical asperities with equal radii of curvature with a
Gaussian distribution of heights. Zhao et al. [15] extended the theory to the case of
elastic/plastic and fully plastic deformation regimes. Arbitrary height distributions and
individual radii of curvature were introduced in deterministic models [16,17]. Mentioned
models can be categorized as uncoupled [18], since the real surface roughness is
replaced by a set of independent asperities of simplified geometry. An overview of
existing contact models can be found in reference [19].
Based on the uncoupled approach a number of reasearchers developed friction
and wear models. Gelinck et al. [20] extended Johnson’s model to calculate friction in
all lubrication regimes in line contacts. Akbarzadeh et al. [21] included a thermal
reduction of the film thickness and viscosity of the lubricant due to heat generated by
both the lubricant and asperities using the statistical approach. The statistical elasto-
plastic asperity contact model was utilized by Masjedi et al. [13] along with the
numerical solution of EHL equations for smooth surfaces to construct a curve-fit
formula of the traction coefficient. Recently, Chang et al. [22] introduced the influence

A-6
of boundary-film tribo-chemistry on the asperity level to account for variation of the
shear strength of boundary films.
On the other hand, also coupled models for the solution of dry rough contact
problems exist. These models take the measured surface topography as it is and do
not require any additional assumptions on the geometry of asperities or their height
distribution. Interactions due to deflections are taken into account automatically. In this
type of models, the half-space approximation theory is widely used [23]. The solution
in this case is obtained numerically [24]. Numerical methods for the solution of dry
rough contact problems based on half-space approach were developed by Polonsky
[25], Liu [26] and Tian [27].
So far, the load sharing lubricated friction methodology mostly relied on
uncoupled models due to their very limited computational effort. Some estimations
state that the assumption of independent asperities employed in such models does not
hold when the ratio of the central film thickness to the standard deviation of asperity
heights is less than 0.5 [2]. A model based on coupled contact approach was used by
Bobach et al. [28] to calculate friction in mixed lubrication. The half-space theory was
employed to pre-calculate the dry mean contact pressure as a function of deformed
gap height by assuming nominally flat surfaces in contact. And further, it was
incorporated into the load-sharing concept to find the fraction of the load carried by
solid contacts and lubricant. Multilevel multi-integration was used to facilitate the
calculations. A load sharing concept based approach which employs the half-space
theory was also implemented by Morales-Espejel et al. [29]. They used Hertz’ theory
[23] to calculate the average pressure and the mean film thickness was obtained from
‘central film thickness formula’, such as the Dowson and Higginson fit [10] be it with
the extension of an equivalent roughness using the perturbation method. However, this

A-7
makes the approach applicable only to highly, stationary, loaded cases. This method
was further developed in this paper so that it can also be applied for low loads and
transient problems.
The increase of computational power and the development of efficient numerical
methods made it possible not only to consider coupled contact models, using the half-
space theory, but also numerical smooth EHL theory, to tackle mentioned limitations.
Therefore, in the current paper the load sharing concept-based models are further
improved by taking a non-uniform film into account. The model combines the half-
space approximation based dry contact model with a numerical EHL model for smooth
surfaces in the scope of the load-sharing concept. It will be demonstrated that the
approach can be employed for the calculation of friction, real contact area and contact
pressures in lubricated line contacts. Several simulation tests will be performed and
the results will be compared with existing models and experimental data to validate the
developed model.
2. Problem formulation and solution methods
As mentioned above, in the load sharing method, separate dry contact and
lubrication models are needed. Therefore, these models are described individually
followed by a brief description of the algorithm for the friction calculation. Detailed
overviews on algorithms of the load sharing based models can be found elsewhere
[30,20,14]. In addition, an artificial rough surface generation technique is discussed in
this section.
2.1. Dry Rough Half-Space Based Contact Model
An alternative to the classical description of the surface by means of asperities
is the direct use of the (measured) height profile. The half-space approximation can be
used to calculate the surface deflection, described by [24]:

A-8
𝑢(𝑥, 𝑦) =2
𝜋𝐸′∬
𝑝(𝑥′,𝑦′)
√(𝑥′−𝑥)2+(𝑦′−𝑦)2𝑑𝑥′𝑑𝑦′, (1)
where 𝑢(𝑥, 𝑦) is the deflection, 𝐸′ is the composite elastic modulus and 𝑝(𝑥′, 𝑦′) is the
contact pressure.
If the pressure is known then the surface deflection can be found according to
equation (1). In the load-sharing concept, however, the situation is inverse: the
deflection is given and the pressure has to be found. For a given separating distance
ℎ𝑠 between the surfaces, the deflection is:
𝑢(𝑥, 𝑦) = 𝛿(𝑥, 𝑦), ∀ 𝑥, 𝑦 ∈ 𝐴𝑐 (2)
where 𝐴𝑐 is the contact area, 𝑧(𝑥, 𝑦) is the surface roughness profile, 𝛿(𝑥, 𝑦) =
𝑧(𝑥, 𝑦) − ℎ𝑠(𝑥, 𝑦). The contact area 𝐴𝑐 is actually not known a priori. The boundary
condition reads 𝑝(𝑥, 𝑦) ≥ 0 [27]. A schematic diagram of the contact is shown in Fig.
1.
Fig. 1. Schematic diagram of the surfaces in contact.
The corresponding system of equations to be solved then reads:
{
𝑢(𝑥, 𝑦) =
2
𝜋𝐸′∬
𝑝(𝑥′, 𝑦′)
√(𝑥′ − 𝑥)2 + (𝑦′ − 𝑦)2𝑑𝑥′𝑑𝑦′
𝑢(𝑥, 𝑦) = 𝑧(𝑥, 𝑦) − ℎ𝑠(𝑥, 𝑦), ∀ 𝑥, 𝑦 ∈ 𝐴𝑐𝑝(𝑥, 𝑦) > 0, ∀ 𝑥, 𝑦 ∈ 𝐴𝑐
𝑝(𝑥, 𝑦) ≤ 𝑃𝑢
(3)
where 𝑃𝑢 is the hardness of the material, beyond which the yielding is initiated. Once
the pressure 𝑝(𝑥, 𝑦) is known, the load carried by surface contacts 𝐹𝐶 can be obtained:

A-9
𝐹𝐶 =∬𝑝(𝑥, 𝑦) 𝑑𝑥𝑑𝑦 (4)
In the system (3), 𝑝(𝑥, 𝑦) and 𝐴𝑐 are unknowns, whereas ℎ𝑠(𝑥, 𝑦) is related with
the hydrodynamic film thickness, as shown in the next section. The pressure 𝑝(𝑥, 𝑦)
outside of the contact area is zero. The set of equations cannot be solved analytically
and numerical methods have to be used. It also should be noted, that the last equation
in the system (3) is used to model perfectly plastic behavior of the material [25]. In the
case of pure elastic simulations, this condition should be eliminated from the system
of the equations.
Computational time necessary for the solution of the system (3) is dominated by
the calculation of the integral equation (1). This is a convolution integral, and thus, the
computational burden can be decreased from 𝑂(𝑁2) to the 𝑂(𝑁𝑙𝑜𝑔𝑁) by discrete fast
Fourier transformation technique (DC-FFT) [26]. In this case, equation (1) is rewritten
in the following form:
𝑢(𝑥, 𝑦) = 𝐾 ⊗ 𝑝 (5)
where 𝐾 is the influence matrix, as described in Appendix A.
The foundation of the numerical solver of the system (3) is the method
developed by Polonsky and Keer [25] and is based on the conjugate gradient method
[31]. Their algorithm was developed to solve equation (1) for pressure with known
applied load. In the current approach, the applied load is unknown. However, there is
additional equation for the deflection in the contact area, which is given by the second
equation of the system (3). This equation links the dry rough contact solver with the
lubrication model through the separating distance ℎ𝑠(𝑥, 𝑦), which is related to the
hydrodynamic film. The separating distance must fulfill the condition that the total
lubricant volume between the smooth surfaces is equal to that between rough surfaces,

A-10
as it was defined by Johnson [32]. Therefore the method of Polonsky and Keer was
adapted to solve the considered. The details of the algorithm are given in Appendix B.
2.2. Numerical Lubrication Model
As mentioned in the introduction, existing numerical methods and increased
computational power make it possible to compute the smooth EHL solution in
acceptable time. Implementation of the smooth EHL model, rather than a film thickness
equation, can extend the applicability of the concept to both a wide range of loads and
to transient problems.
The classical system of smooth transient line contact EHL equations is given in
the following form:
{
𝜕
𝜕𝑥(ℎ3
12𝜇
𝜕𝑃𝐻𝜕𝑥
) − 𝑈𝜕ℎ
𝜕𝑥−𝜕ℎ
𝜕𝑡= 0
𝐹𝐻 = ∫𝑃𝐻(𝑥)𝑑𝑥
ℎ(𝑥) = ℎ0 +𝑥2
2𝑅−
4
𝜋𝐸′∫𝑃𝐻(𝑥
′)ln (𝑥 − 𝑥′) 𝑑𝑥′
(6)
where 𝜇 is the kinematic viscosity, 𝑅 is the radius of the cylinder, ℎ and 𝑃𝐻 are unknown
film thickness and pressure. 𝐹𝐻 is the load carried by the lubricant film and is
considered to be given. 𝑈 = (𝑈1 + 𝑈2)/2, where 𝑈1 and 𝑈2 are the velocities of the
moving surfaces. With boundary conditions, this system can be solved numerically to
obtain ℎ and 𝑃𝐻. Once this is solved, the bulk deflection of the surfaces due to
hydrodynamic pressure 𝑃𝐻 is also known and therefore can be taken into account in
the calculation of the separation by subtracting it from the initial surface profile
𝑧′(𝑥, 𝑦) = 𝑧(𝑥, 𝑦) − 𝑢ℎ(𝑥, 𝑦), where 𝑢ℎ(𝑥, 𝑦) is defined in the next paragraph.
In a smooth line contact the hydrodynamic film thickness ℎ(𝑥) does not vary in
𝑦 direction. However, this does not apply to the roughness 𝑧(𝑥, 𝑦). It is therefore
necessary to have the hydrodynamic solution defined in 𝑦 direction as well. This can
A-11
be accomplished by defining ℎ(𝑥, 𝑦) = ℎ(𝑥), ∀ 𝑦. The same is applied to the deflection
due to hydrodynamic pressure: 𝑢ℎ(𝑥, 𝑦) = 𝑢ℎ(𝑥), ∀𝑦 and 𝑢ℎ(𝑥) = −4
𝜋𝐸′∫𝑃𝐻(𝑥
′)ln (𝑥 −
𝑥′) 𝑑𝑥′.
The most widely used numerical solution techniques in EHL are the multigrid
method [33-35] and the differential deflection algorithm [36]. The latter approach solves
the system in a coupled manner, which makes it robust and fast to converge. This
method was used in the current work to calculate the EHL film thickness.
The hydrodynamic film thickness ℎ is used to calculate the separating distance
ℎ𝑠(𝑥, 𝑦):
ℎ𝑠(𝑥, 𝑦) = ℎ(𝑥, 𝑦) − 휀, ∀ 𝑥, 𝑦 ∈ 𝐴, (7)
where 휀 is a constant and 𝐴 is the total area. So, the separation ℎ𝑠(𝑥, 𝑦) has the same
form as the film thickness (Fig. 10), with the offset value 휀 which is found from:
∬ ℎ(𝑥, 𝑦)𝑑𝐴𝐴
= ∬ (ℎ𝑠(𝑥, 𝑦) − 𝑧(𝑥, 𝑦) + 𝑢(𝑥, 𝑦))𝑑�̃��̃�. (8)
where �̃� is the lubricated area. Equation (8) follows the definition of the separating
distance of Johnson [37], but it was modified here to take into account the non-uniform
hydrodynamic film and deflection of the surface due to contact and hydrodynamic
pressures. It should be mentioned, that the total displacement of the surfaces is a sum
of the deflection 𝑢(𝑥, 𝑦) due to contact pressure and the deflection 𝑢𝐻(𝑥, 𝑦) due to
hydrodynamic pressure. The left hand side of the equation represents the total volume
of the lubricant between smooth surfaces, which is equal to the volume occupied by
the pockets formed by the non-contacting part of the surfaces, represented by the right
hand side of this equation. It should be emphasized that the separation value ℎ𝑠(𝑥, 𝑦)
depends on the deflection 𝑢(𝑥, 𝑦). When the surface is loaded, the surface deflects
and the volume formed by non-contacting parts between surfaces changes. Therefore,
to preserve the lubricant volume according to equation (8), the separation values must
A-12
be changed. On the other hand, as it can be seen from the system (3), the deflection
𝑢(𝑥, 𝑦) depends on ℎ𝑠(𝑥, 𝑦). Therefore, an equilibrium between 𝑢(𝑥, 𝑦) and ℎ𝑠(𝑥, 𝑦)
must be established. This can be accomplished by the iteratively solving the system
(3) and equation (8), similarly to the algorithm of Morales-Espejel et al. [29]. However,
it was found to be time consuming and a different single-loop approach was developed,
which is described in Appendix B.
2.3. Calculation of the friction coefficient
For the calculation of the friction coefficient the load carried by the surface
contacts 𝐹𝐶 and the hydrodynamic film 𝐹𝐻 are calculated, with the boundary condition
that their sum should be equal to the applied load 𝐹𝑇 = 𝐹𝐶 + 𝐹𝐻. Description of the
iterative procedure for finding loads satisfying such a boundary condition can be found
in reference [14,38]. The friction coefficient 𝑓𝐶 can then be obtained from
𝑓𝐶 = (𝑓𝐶𝑏𝐹𝐶 + 𝐹𝑠ℎ) 𝐹𝑇⁄ , (9)
where the friction coefficient in boundary lubrication regime 𝑓𝐶𝑏 has to be obtained
experimentally and 𝐹𝑠ℎ is the lubricant shear force, which can be calculated as
𝐹𝑠ℎ = 𝐵∫ 𝜏𝑑𝑥
�̃�
(10)
where 𝜏 is the shear stress of the lubricant:
𝜏 = 𝜇𝜕𝑣
𝜕�̃� (11)
and 𝑣 = 𝑣(𝑥, �̃�) is the lubricant speed, given by [39]:
𝑣(𝑥, �̃�) =
1
2𝜇
𝜕𝑃𝐻𝜕𝑥
(�̃�2 − �̃�ℎ) + (1 −�̃�
ℎ)𝑈1 +
�̃�
ℎ𝑈2 (12)
The shear stress was calculated on the upper surface (�̃� = ℎ). For the
calculation of the pressure-viscosity dependency, the Roelands [39] equation was
used.

A-13
Fig. 2. Comparison of surfaces with different autocorrelation length. Left 𝑳 = 𝟑𝟒𝝁𝒎, right 𝑳 =𝟓𝟕𝝁𝒎
2.4. Generation of surface roughness
To illustrate the performance of the model, rough surfaces with different
properties were created digitally, using an approach based on Fourier analysis from
Hu [40]. The simulation allows variation of two major parameters, i.e. standard
deviation of the surface heights σ and the autocorrelation length L. Examples of
generated surfaces are shown in Fig. 2. It is clear that with the increase of the
autocorrelation length, the surface roughness becomes smoother in the sense that the
curvature of peaks increases and that transitions from one peak to another become
less abrupt. This parameter can therefore be used as a rough indicator for the
characteristic distance between asperities, as well as the sharpness of surface
features.
3. Results and Discussion
The model was employed for the calculation of friction coefficients in stationary
lubricated contacts. A set of simulations was performed to validate and explore the
behavior of the developed model.
3.1. Artificial surface simulation results
For the first simulation case surfaces consisting of uniformly distributed
spherical asperities of equal radius of curvature (30μm) and height (500 nm) were
X,m
Y,m
Generated Surface: L = 34m
0 1 2 3 4
x 10-4
0
1
2
3
4
x 10-4
0
0.5
1
1.5
2
x 10-6
X,m
Y,m
Generated Surface: L = 57m
0 1 2 3 4
x 10-4
0
1
2
3
4
x 10-4
0.5
1
1.5
2
x 10-6

A-14
used, see Fig. 3. Computational grid size contained 𝑁𝑥 ×𝑁𝑦 = 2000 × 2000 data points
with the horizontal spacing 𝑎𝑥 = 𝑎𝑦 = 115 nm. The distance λ between the asperities
was varied: 14 μm, 20 μm, 30 μm and 40 μm. The separating distance ℎ𝑠 was
considered to be constant throughout the contact, so the nominally flat surfaces in
contact were assumed. In the load-sharing concept the load carried by asperities is of
interest, as it determines the fraction of the dry and hydrodynamic friction in the total
friction coefficient. This was further explored. When the mentioned surface is loaded
against a flat and the half-space theory is applied, a boundary effect rises. As the
asperities interact, the inner asperities are influenced by pressures developed on the
surrounding asperities from all directions, however, boundary asperities are influenced
only from the inner parts of the surface. Hence, to study the interaction effect it is
necessary to exclude the mentioned effect by setting periodic boundary conditions.
The considered surface is shown in Fig. 3.
According to the left picture in Fig. 4, the distance between the asperities does
not influence the load carried by a single asperity in the deterministic model. This is as
expected since the asperities are assumed to deform independently according to
Hertz’ theory. However, this does not hold for the half-space model. The right picture
of Fig. 4 shows that for a fixed separation level, the load carried by the asperity
decreases with decreasing distance between the asperities. This is caused by the
increase of the interaction between the asperities, as the pressures developed at single
asperities deflect the whole surface. The increase of the distance between asperities,
moves the load curves obtained by the half-space model towards the deterministic
solution due to the decreasing asperity interaction.
Generally the friction in the fluid film is smaller than the friction in the contacting
fraction of the surface (where the load is carried by asperities). Following the load-

A-15
sharing concept, the friction will be smaller if the ratio of load carried by the fluid film
and load carried by the asperities increases.
This leads to the following conclusion: the friction values obtained using the half-
space approximation will in general be lower or equal to those calculated by the
deterministic asperity based approach.
Fig. 3. Uniform surface profile, λ = 20μm.
Fig. 4. Load as a function of the separation for two models varying the distance between the asperities.. Left – deterministic, right – half-space.
As a next step, more complex surfaces, generated digitally were analyzed. The
autocorrelation length 𝐿 was varied to explore the differences between deterministic
asperity based and half-space based models. In this set of simulations the film
-1 -0.8 -0.6 -0.4 -0.2 0
x 10-7
0
0.002
0.004
0.006
0.008
0.01
0.012
0.014
0.016
0.018
0.02
Separation, m
Lo
ad
Ca
rrie
d, N
Load vs Separation, Deterministic
14 m
20 m
30 m
40 m
-1 -0.8 -0.6 -0.4 -0.2 0
x 10-7
0
0.002
0.004
0.006
0.008
0.01
0.012
0.014
0.016
0.018
0.02
Separation, m
Ca
rrie
d L
oa
d, N
Load vs Separation, Half Space
Determiinistic
14 m
20 m
30 m
40 m

A-16
thickness (and consequently, separating distance) was considered constant in the
contact area in the new model as it is done in the deterministic approach. This makes
it possible to compare the two models. After all, in this case, observed differences
between calculated friction values will originate from the difference in the contact
models. Periodic boundary conditions were used in the simulations.
Example friction curves are shown in Fig. 5. There is a clear difference between
the frictional values calculated with both models. The maximum deviation is observed
at approximately 0.1 m/s. This can be explained by means of the load-sharing concept.
In the boundary lubrication regime, which corresponds to low velocities, the load
carried by the film is small. Since the coefficient of friction in boundary lubrication is
predefined, both models will give similar results. With the increase of the velocity, the
load carried by the film increases and the load carried by the asperities decreases.
Correspondingly, in the half-space approach, the asperities will carry less load while
the same separation is imposed compared to the deterministic model, and thus, the
lubricant has to carry a larger fraction of the total load. Therefore, the friction coefficient
is lower in the half-space approach. With a further increase of the sliding velocity, the
friction developed by the film starts to dominate the total friction coefficient, and the
influence of the direct contact between asperities diminishes. Hence, the difference
between deterministic and half-space approaches becomes smaller as both models
use the same EHL model. Finally, in the full film regime, there is no asperity contact,
and thus the friction coefficients will match.
In order to further explore the behavior of the half-space approach and quantify
its deviation from the deterministic model, the maximum relative difference was
introduced:
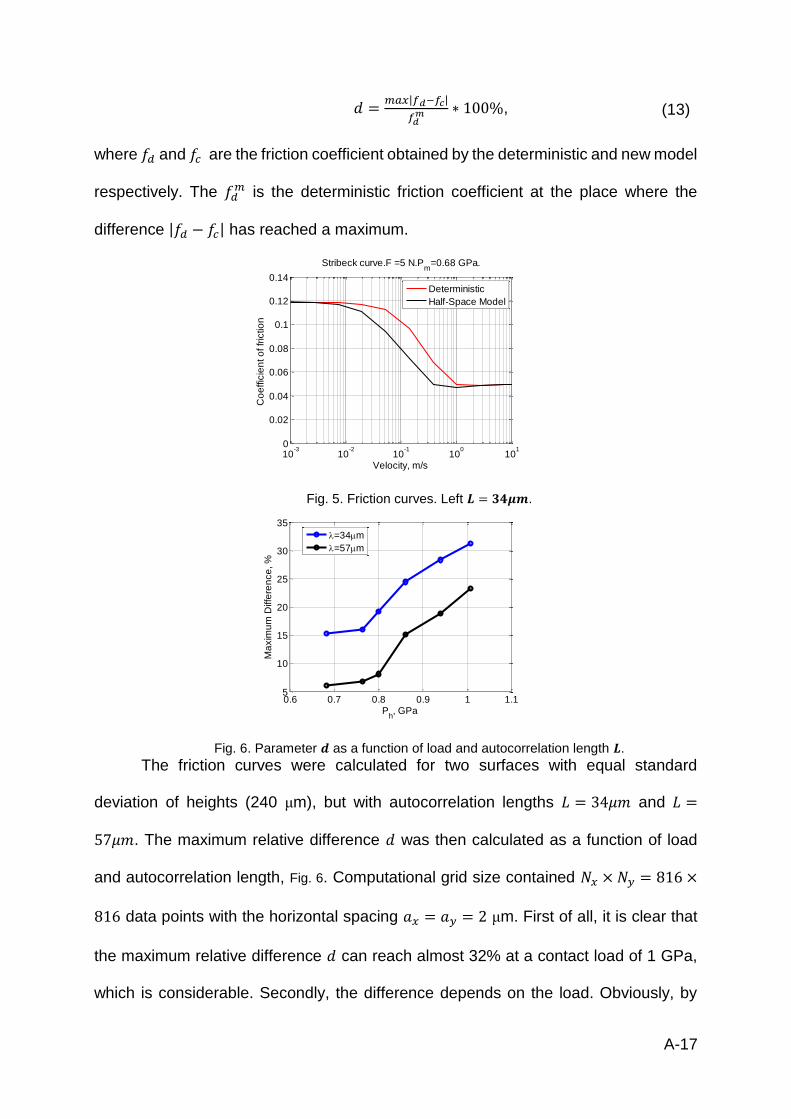
A-17
𝑑 =𝑚𝑎𝑥|𝑓𝑑−𝑓𝑐|
𝑓𝑑𝑚 ∗ 100%, (13)
where 𝑓𝑑 and 𝑓𝑐 are the friction coefficient obtained by the deterministic and new model
respectively. The 𝑓𝑑𝑚 is the deterministic friction coefficient at the place where the
difference |𝑓𝑑 − 𝑓𝑐| has reached a maximum.
Fig. 5. Friction curves. Left 𝑳 = 𝟑𝟒𝝁𝒎.
Fig. 6. Parameter 𝒅 as a function of load and autocorrelation length 𝑳.
The friction curves were calculated for two surfaces with equal standard
deviation of heights (240 μm), but with autocorrelation lengths 𝐿 = 34𝜇𝑚 and 𝐿 =
57𝜇𝑚. The maximum relative difference 𝑑 was then calculated as a function of load
and autocorrelation length, Fig. 6. Computational grid size contained 𝑁𝑥 × 𝑁𝑦 = 816 ×
816 data points with the horizontal spacing 𝑎𝑥 = 𝑎𝑦 = 2 μm. First of all, it is clear that
the maximum relative difference 𝑑 can reach almost 32% at a contact load of 1 GPa,
which is considerable. Secondly, the difference depends on the load. Obviously, by
10-3
10-2
10-1
100
101
0
0.02
0.04
0.06
0.08
0.1
0.12
0.14
Velocity, m/s
Co
effic
ien
t o
f fr
ictio
nStribeck curve.F =5 N.P
m=0.68 GPa.
Deterministic
Half-Space Model
0.6 0.7 0.8 0.9 1 1.15
10
15
20
25
30
35
Ph, GPa
Ma
xim
um
Diffe
ren
ce
, %
=34m
=57m
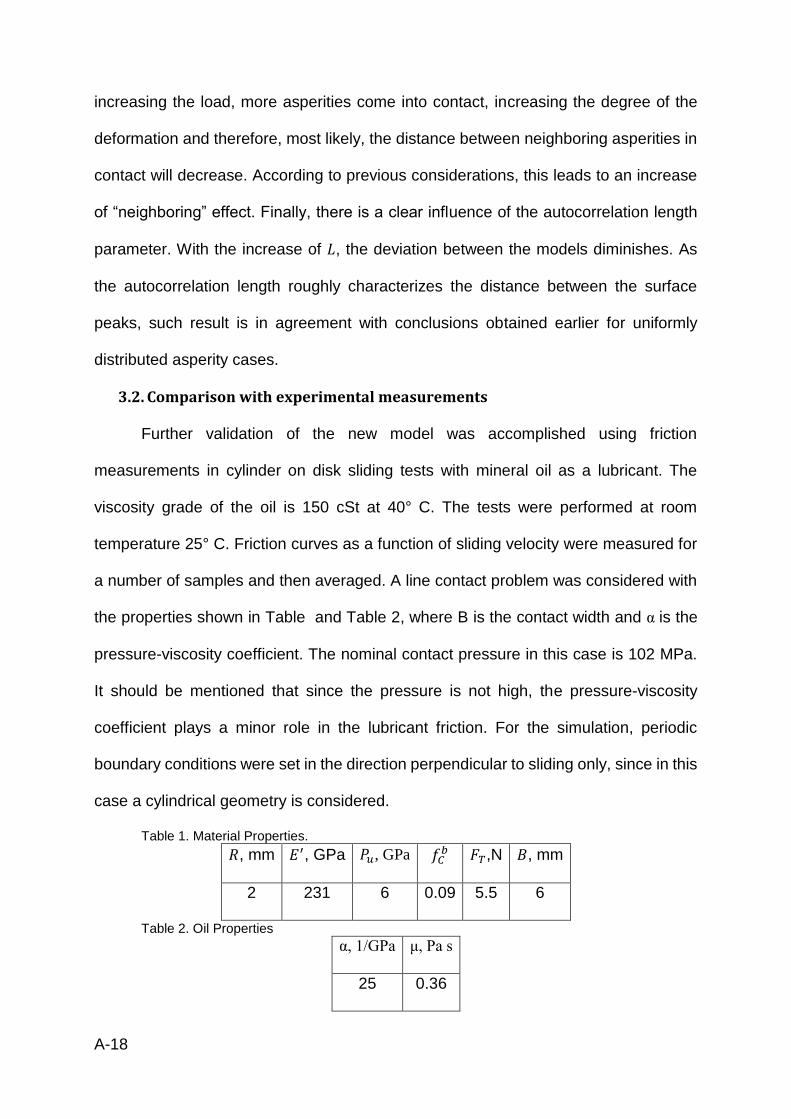
A-18
increasing the load, more asperities come into contact, increasing the degree of the
deformation and therefore, most likely, the distance between neighboring asperities in
contact will decrease. According to previous considerations, this leads to an increase
of “neighboring” effect. Finally, there is a clear influence of the autocorrelation length
parameter. With the increase of 𝐿, the deviation between the models diminishes. As
the autocorrelation length roughly characterizes the distance between the surface
peaks, such result is in agreement with conclusions obtained earlier for uniformly
distributed asperity cases.
3.2. Comparison with experimental measurements
Further validation of the new model was accomplished using friction
measurements in cylinder on disk sliding tests with mineral oil as a lubricant. The
viscosity grade of the oil is 150 cSt at 40° C. The tests were performed at room
temperature 25° C. Friction curves as a function of sliding velocity were measured for
a number of samples and then averaged. A line contact problem was considered with
the properties shown in Table and Table 2, where B is the contact width and α is the
pressure-viscosity coefficient. The nominal contact pressure in this case is 102 MPa.
It should be mentioned that since the pressure is not high, the pressure-viscosity
coefficient plays a minor role in the lubricant friction. For the simulation, periodic
boundary conditions were set in the direction perpendicular to sliding only, since in this
case a cylindrical geometry is considered.
Table 1. Material Properties.
𝑅, mm 𝐸′, GPa 𝑃𝑢, GPa 𝑓𝐶𝑏 𝐹𝑇,N 𝐵, mm
2 231 6 0.09 5.5 6
Table 2. Oil Properties
α, 1/GPa μ, Pa s
25 0.36

A-19
The surface roughness is shown in Fig. 7. As it can be seen, the surface is quite
smooth. Computational grid size of the contact model contained 𝑁𝑥 × 𝑁𝑦 = 200 × 200
data points with the horizontal spacing 𝑎𝑥 = 𝑎𝑦 = 0.45 μm. Computational grid size of
the hydrodynamic solver contained 𝑁ℎ = 2000 data points with 𝑎ℎ = 0.8𝜇𝑚. The
hydrodynamic grid was taken to be considerably larger than the dry contact area in
order to exclude possible starvation effects. It should be noted, that since the
hydrodynamic and contact models grids are different, the former is interpolated to the
contact grid.
Simulated friction curves along with experimental measurement data are shown
in Fig. 8. Three simulation curves are shown. The most deviating curve corresponds to
fully elastic deterministic asperity based contact model linked with numerical shear
stress calculation (thus, in full film regime, measurement and simulation match). The
closest to experimental data simulation curves were obtained using the discussed half-
space based models with fully elastic and elastic-fully plastic surface deformation
regimes.
Fig. 7. Surface roughness profile, m. Standard deviation σ = 100nm.
As it can be seen, the half-space based models are in a good agreement with
experimental data. Slight effect of plastic regime also can be noted. Assumption of the
fully elastic deformation leads to the same effect as the assumption of independent
X,m
Y,m
-4 -2 0 2 4
x 10-5
-4
-2
0
2
4
x 10-5
0
1
2
3
4
5
6
x 10-7

A-20
asperity deformation – it overestimates the loads carried by contact spots and as a
result overestimates the friction coefficient. Due to smooth surface and light load, the
effect of plastic deformation is limited.
From the width of the measurement 90% confidence interval, it can be noticed
that the variance of the experimental data is almost negligible in the full film regime,
i.e. the right side of the friction curve, and becomes larger towards the boundary
lubrication, i.e. the left side. This variation is caused by the difference in roughness
profiles of the samples. This difference does not play any role in the full film regime, as
the surfaces are completely separated by the lubricant film, but is influential in the
boundary lubrication.
Fig. 8. Comparison of the developed model with experimental data and elastic deterministic model.
The dry contact pressure profile developed in the boundary lubrication regime
is shown in Fig. 9. It can be noticed that the pressure profile reaches the hardness
values at some contact spots. At these areas, the surfaces deform in the fully-plastic
regime, which is modeled using a cut-off pressure in the CGM algorithm as is
discussed [25]. The total number of asperities in contact is low, since the applied load
is low.
10-3
10-2
10-1
0
0.02
0.04
0.06
0.08
0.1
0.12
Velocity, m/s
Coeff
icie
nt
of
fric
tion
Deterministic Fully Elastic
Half-Space Elastic-Fully Plastic
Half-Space Fully Elastic
Experiment with 90% confidence interval

A-21
Fig. 9. Pressure developed at asperity contacts, elastic-fully plastic case. Boundary lubrication regime, 𝑼 = 𝟏𝟎𝒆 − 𝟑 𝒎/𝒔, 𝑭𝑪 = 𝟓. 𝟐𝟕𝟓𝑵, 𝑭𝑯 = 𝟎. 𝟐𝟐𝟓𝑵.
Further, in Fig. 10 the cross-sections of the film thickness, separation and the
surface are shown in boundary lubrication and full film regimes, corresponding to the
speed 𝑈 = 0.001 𝑚/𝑠 and 𝑈 = 0.3 𝑚/𝑠 respectively. Clearly, in boundary lubrication,
the separation cannot prevent the surfaces from contacting, as shown in the Fig. 10a.
The contact spots generate high total friction coefficient, as shown in Fig. 8. On the
other hand, in the full film regime, Fig. 10b, there is enough lubricant film to completely
separate surfaces from contact. Under these conditions the friction is generated only
by the shear of the lubricant film and therefore is low compared to the boundary value,
see Fig. 8.
Fig. 10. Cross-section. Surface, separation and film thicknesses in boundary (a, 𝑼 = 𝟏𝟎𝒆 −𝟑 𝒎/𝒔, 𝑭𝑪 = 𝟓. 𝟐𝟕𝟓𝑵, 𝑭𝑯 = 𝟎. 𝟐𝟐𝟓𝑵) and in full film regimes (b, 𝑼 = 𝟎. 𝟑 𝒎/𝒔, 𝑭𝑪 = 𝟎 𝑵, 𝑭𝑯 = 𝟓. 𝟓𝑵).
X,m
Y,m
Pressure, Pa. Elastic-Fully Plastic.
-2 -1 0 1 2
x 10-5
-4
-2
0
2
4
x 10-5
0
1
2
3
4
5
6x 10
9
-4 -2 0 2 4
x 10-5
0
0.5
1
1.5
2x 10
-6
X,m
Heig
ht,
m
Separation
Surface, z(x,y)
Separation, hs(x,y)
Film Thickness, h(x,y)
-4 -2 0 2 4
x 10-5
0
0.5
1
1.5
2x 10
-6
X,m
Heig
ht,
m
Separation
Surface, z(x,y)
Separation, hs(x,y)
Film Thickness, h(x,y)
a b

A-22
4. Conclusion
A robust and fast numerical algorithm for the calculation of the friction coefficient
in lubricated line contact problems was developed based on a half-space
approximation approach and numerical smooth EHL theory using the load sharing
concept. This model does not require additional assumptions on the geometry of
asperities and takes into account their interaction during deformation. The use of a
numerical smooth EHL solver, rather than a film thickness formula, makes it possible
to solve lightly loaded and transient problems in the future.
The model was validated using an existing deterministic asperity based friction
model, artificial surface simulation tests and experimental measurements. The results
show that the independent asperity deformation assumption employed in many
existing friction models can cause a deviation in predicted friction up to 32%. This
deviation depends on the applied load and surface roughness characteristics. It leads
to an overestimation of the loads carried by the asperities, resulting in an
overestimation of the friction coefficient. Comparison of the simulation data with
experimental measurements showed a good agreement and illustrates the accuracy
of this friction model.
Acknowledgements
The authors would like to thank SKF Engineering & Research Centre,
Nieuwegein, The Netherlands and Bosch Transmission Technology BV, Tilburg, The
Netherlands for providing technical and financial support. We would like to thank Mr.
A.J.C de Vries, SKF Director Group Product Development for his permission to publish
this work. This research was carried out under project number M21.1.11450 in the
framework of the Research Program of the Materials innovation institute M2i.

A-23
Appendix A
After discretization of the governing equations on a numerical grid Ω, the
influence matrix 𝐾 is given by a following expression[23]:
𝜋𝐸′𝐾𝑖𝑗
= (𝑥𝑖 + 𝑎𝑥)𝑙𝑛
[ (𝑦𝑗 + 𝑎𝑦) + {(𝑦𝑗 + 𝑎𝑦)
2+ (𝑥𝑖 + 𝑎𝑥)
2}
12
(𝑦𝑗 − 𝑎𝑦) + {(𝑦𝑗 − 𝑎𝑦)2+ (𝑥𝑖 + 𝑎𝑥)2}
12]
+(𝑦𝑗 + 𝑎𝑦)𝑙𝑛
[ (𝑥𝑖 + 𝑎𝑥) + {(𝑦𝑗 + 𝑎𝑦)
2+ (𝑥𝑖 + 𝑎𝑥)
2}
12
(𝑥𝑖 − 𝑎𝑥) + {(𝑦𝑗 + 𝑎𝑦)2+ (𝑥𝑖 − 𝑎𝑥)2}
12]
+(𝑥𝑖 − 𝑎𝑥)𝑙𝑛
[ (𝑦𝑗 − 𝑎𝑦) + {(𝑦𝑗 − 𝑎𝑦)
2+ (𝑥𝑖 − 𝑎𝑥)
2}
12
(𝑦𝑗 + 𝑎𝑦) + {(𝑦𝑗 + 𝑎𝑦)2+ (𝑥𝑖 − 𝑎𝑥)2}
12]
+(𝑦𝑗 − 𝑎𝑦)𝑙𝑛
[ (𝑥𝑖 − 𝑎𝑥) + {(𝑦𝑗 − 𝑎𝑦)
2+ (𝑥𝑖 − 𝑎𝑥)
2}
12
(𝑥𝑖 + 𝑎𝑥) + {(𝑦𝑗 − 𝑎𝑦)2+ (𝑥𝑖 + 𝑎𝑥)2}
12]
where 𝑎𝑥 and 𝑎𝑦 are the half mesh size in direction 𝑋 and 𝑌 correspondingly, 𝑥𝑖, 𝑦𝑗 ∈
Ω.
Appendix B
The process starts with the initialization of the pressure 𝑝(𝑥, 𝑦), which can be
arbitrary or obtained from the previous iteration step. The area of contact 𝐴𝑐 is then
defined as the sum of those areas where 𝑝(𝑥, 𝑦) > 0. The hydrodynamic area is the
total area subtracted the contact area �̃� = 𝐴 ∩ �̅�𝑐. The corresponding deflection
𝑢(𝑥, 𝑦) is found according to equation (1) using the DC-FFT technique. The initial

A-24
separation value ℎ𝑠 is calculated through the equation (8). Auxiliary variables 𝐺𝑜𝑙𝑑 = 1
and 𝛿 = 0 are defined.
Iterations start and first the gap distribution is obtained:
𝑔𝑖𝑗 = −𝑢𝑖𝑗 + 𝑧𝑖𝑗 − ℎ𝑠 (14)
This gap is positive in areas of contact and negative in lubricated areas. Note
that here 𝑢𝑖𝑗 are positive. For the gap 𝑔𝑖𝑗, new variable 𝐺 is introduced:
𝐺 =∑𝑔𝑖𝑗2
𝐴𝑐
(15)
And a new conjugate direction is computed:
𝑡𝑖𝑗 = 𝑔𝑖𝑗 + 𝛿(𝐺 𝐺𝑜𝑙𝑑⁄ )𝑡𝑖𝑗, 𝑡𝑖𝑗 ∈ 𝐴𝑐
𝑡𝑖𝑗 = 0, 𝑡𝑖𝑗 ∉ 𝐴𝑐 (16)
Convolution of the influence matrix and 𝑡𝑖𝑗 is then obtained:
𝑟𝑖𝑗 = −𝐾⊗ 𝑡𝑖𝑗, 𝑡𝑖𝑗 ∈ 𝐴 (17)
Mean value of 𝑟𝑖𝑗 is then adjusted as
𝑟𝑖𝑗 = 𝑟𝑖𝑗 − �̅�, 𝑟𝑖𝑗 ∈ 𝐴, �̅� = 𝑁𝑐−1 ∑ 𝑟𝑘𝑙
𝑟𝑘𝑙∈𝐴𝑐
(18)
where 𝑁𝑐 is the number of points in the contact area 𝐴𝑐. The length of the step in the
direction 𝑡𝑖𝑗 is then:
𝜏 =∑𝑔𝑖𝑗𝑡𝑖𝑗∑𝑟𝑖𝑗𝑡𝑖𝑗
, 𝑔𝑖𝑗, 𝑟𝑖𝑗, 𝑡𝑖𝑗 ∈ 𝐴𝑐 (19)
The pressure is stored as 𝑝𝑖𝑗𝑜𝑙𝑑 = 𝑝𝑖𝑗 and the new pressure profile can be found
from:
𝑝𝑖𝑗 = 𝑝𝑖𝑗 − 𝜏𝑡𝑖𝑗 , 𝑝𝑖𝑗, 𝑡𝑖𝑗 ∈ 𝐴𝑐 (20)
The negative values of 𝑝𝑖𝑗 are set to zero. Further, it is necessary to include into
consideration the points, where pressure is zero, but surfaces overlap. The fact that

A-25
they overlap indicates, that they are in contact and thus, the pressure must be positive.
The surfaces are overlapping, if 𝑔𝑖𝑗 > 0. The following area is introduced
𝐴𝑜𝑙 = {𝐴: 𝑝𝑖𝑗 = 0, 𝑔𝑖𝑗 > 0} (21)
If 𝐴𝑜𝑙 = ∅, 𝛿 is set to unity, otherwise it is set to 0. In this area, the pressure is
then corrected according:
𝑝𝑖𝑗 = 𝑝𝑖𝑗 − 𝜏𝑔𝑖𝑗 , {𝑝𝑖𝑗, 𝑔𝑖𝑗 ∈ 𝐴𝑜𝑙}
(22)
The pressure obtained using this equation is always positive as 𝜏 is always
negative [25]. After that, the deflection and the new value for separation are calculated
according to the first of the equations (3) and equation (8) correspondingly. The
iterations continue until the difference in separation level between two successive
iterations is less than the desired value 휀0:
휀 =|ℎ𝑠 − ℎ𝑠
𝑜𝑙𝑑|
ℎ𝑠𝑜𝑙𝑑 ≤ 휀0 (23)
In rough surface contact problems, the plastic limit is usually set as an upper
boundary for the pressure, where the material starts yielding. In the described
algorithm, it is possible to impose this condition the same way as the condition on the
positivity of the contact pressure on each iteration, 𝑝𝑖𝑗 ≤ 𝑃𝑢, where 𝑃𝑢 is the plastic limit.

A-26
Bibliography
1. Lugt, P.M., Morales-Espejel, G.E.: A Review of Elasto-Hydrodynamic Lubrication Theory. Tribology Transactions 54, 470-496 (2011).
2. Spikes, H.A.: Mixed Lubrication - an Overview. Lubrication Science 9(3), 221-253 (1997). 3. Elcoate, C.D., Evans, H.P., Hughes, T.G.: On the Coupling of the Elastohydrodynamic Problem. Journal
of Mechanical Engineering Science 212, 307-318 (1998). 4. Evans, H.P.: Modelling Mixed Lubrication and the Consequences of Surface Roughness in Gear
Applications. Paper presented at the 13-th Nordic Symposium on Tribology (Nordtrib 2008), 2008
5. Evans, H.P., Snidle, R.W., Sharif, K.J.: Deterministic mixed lubrication modelling using roughness measurements in gear applications. Tribology International 42, 1406-1417 (2009).
6. Hu, Y.-Z., Zhu, D.: A full numerical solution to the mixed lubrication in point contacts. Journal of Tribology 122, 1-9 (2000).
7. Holmes, M.J.A., Evans, H.P., Snidle, R.W.: Discussion on Elastohydrodynamic Lubrication in Extended Parameter Ranges, Part II: Load Effect. Tribology Transactions 46, 282-288 (2003).
8. Johnson, K.L., Greenwood, J.A., Poon, S.Y.: A simple theory of asperity contact in elastohydrodynamic lubrication. Wear 19, 91-108 (1972).
9. Greenwood, J.A., Williamson, G.P.B.: Contact of Nominally Flat Surfaces. Proceedings of the Royal Society of London. Series A, Mathematical and Physical Sciences 295 (1966).
10. Dowson, D., Higginson, G.R.: New Roller-Bearing Lubrication Formula. Engineering (London) 192, 158-159 (1961).
11. Nijenbanning, G., Venner, C.H., Moes, H.: Film thickness in elastohydrodynamically lubricated elliptic contacts. Wear 176, 217-229 (1994).
12. Chang, L., Jeng, Y.-R.: A Mathematical Model for the Mixed Lubrication of Non-Conformable Contcats with Asperity Friction, Plastic Deformation, Flash Temperature, and Tribo-Chemistry. Journal of Tribology 136, 1-9 (2014).
13. Masjedi, M., Khonsari, M.M.: Theoretical and Experimental Investigation of Traction Coefficient in Line-Contact EHL of Rough Surfaces. Tribology international 70, 179-189 (2014).
14. Faraon, I.C., Schipper, D.J.: Stribeck Curve for Starved Line Contacts. Journal of Tribology 129, 181-187 (2007).
15. Zhao, Y., Maietta, D.M., Chang, L.: An asperity microcontact model incorporating the transition from elastic deformation to fully plastic flow. Journal of Tribology 122, 86-93 (2000).
16. Faraon, I.C.: Mixed lubricated line conacts. PhD thesis., University of Twente (2005) 17. Popovici, R.: Friction in wheel-rail contact. PhD thesis. In. University of Twente, (2010) 18. Adams, G.G., Nosovsky, M.N.: Contact Modeling - Forces. Tribology international 33, 431-442
(2000). 19. Bhushan, B.: Contact Mechanics of Rough Surfaces in Tribology: Multiple Asperity Contact.
Tribology Letters 4, 1-35 (1998). 20. Gelinck, E., Schipper, D.: Calculation of Sribeck curves for line contacts. Tribology International 33,
175-181 (2000). 21. Akbarzadeh, S., Khonsari, M.M.: Thermoelastohydrodynamic Analysis of Spur Gears with
Consideration of Surface Roughness. Tribology Letters 32, 129-141 (2008). 22. Chang, L., Jeng, Y.-R.: A Mathematical Model for the Mixed Lubrication of Non-Conformable
Contacts with Asperity Friction, Plastic Deformation, Flash Temperature, and Tribo-Chemistry. Journal of Tribology 136, 1-9 (2014).
23. Johnson, K.L.: Contact Mechanics. Cambridge University Press, Cambridge (1985) 24. Timoshenko, S.P., Goodier, J.N.: Theory of Elasticity, 3-rd ed. McGraw-Hill, New York (1970) 25. Polonsky, I.A., Keer, L.M.: A numerical method for solving rough contact problems based on the
multi-level multi-summation and conjugate gradient techniques. Wear 231, 206-219 (1999).

A-27
26. Liu, S.: Thermomechanical Contact Analysis of Rough Bodies. PhD thesis., Northwestern University (2001)
27. Tian, X., Bhushan, B.: A numerical three-dimensional model for the contact of rough surfaces by variational principle. Journal of Tribology 118, 33-42 (1996).
28. Bobach, L., Beilicke, R., Bartel, D., Deters, L.: Thermal Elastohydrodynamic Simulation of Involute Spur Gears Incorporating Mixed Friction. Tribology International 48, 191-206 (2012).
29. Morales-Espejel, G.E., Wemekamp, A.W., Felix-Quinonez, A.: Micro-Geometry Effects on the Sliding Friction Transition in Elastohydrodynamic Lubrication. Journal of Engineering Tribology 224('7), 621-637 (2010).
30. Popovici, R., Schipper, D.J.: Stribeck and Traction Curves for Elliptical Contacts: Isothermal Friction Model. International Journal of Sustainable Construction and Design 4(2) (2013).
31. Shewchuk, J.R.: An Introduction to the Conjugate Gradient Method Without the Agonizing Pain. http://www.cs.cmu.edu/~quake-papers/painless-conjugate-gradient.abstract (1994).
32. Johnson, K.L., Greenwood, J.A., Poon, S.Y.: A Simple Theory of Asperity Contact in Elasto-Hydrodynamic Lubrication. 19 (1972).
33. Venner, C.H., ten Napel, W.E.: Multilevel solution of the elstohydrodynamically lubricated circular contact problem. Part 2: smooth surface results. Wear 152, 369-381 (1992).
34. Zhu, D., Hu, Y.-Z.: A computer program package for the prediction of EHL and mixed lubrication characteristics, friction, subsurface stresses and flash temperatures based on measured 3-D surface roughness. Tribology Transactions 44, 383-390 (2008).
35. Zhu, D., Liu, Y., Wang, Q.: On the Numerical Accuracy of Rough Surface EHL Solution. Tribology Transactions 57, 570-580 (2014).
36. Hughes, T.G., Elcoate, C.D., Evans, H.P.: Coupled Solution of the Elastohydrodynamic Line Contact Problem Using a Differential Deflection Method. Journal of Mechanical Engineering Science 214, 585-598 (2000).
37. Johnson, K.L., Spence, D.I.: Determination of Gear Tooth Friction by Disc Machine. Tribology International 24(5), 269-275 (1991).
38. Liu, Q., Ten Napel, W., Tripp, J.H., Lugt, P.M., Meeuwenoord, R.: Friction in highly Loaded Mixed Lubricated Point Contacts. Tribology Transsactions 52(3), 360-369 (2009).
39. Szeri, A.Z.: Fluid Film Lubrication. Cambridge University Press, Cambridge (1998) 40. Hu, Y., Z., Tonder, K.: Simulation of 3-D Random Rough Surface by 2-D Digital Filter and Fourier
Analysis. International Journal of Machine Tools and Manufacture 32(1), 83-90 (1992).


Paper B

Analysis of Wear Particles Formed in Boundary Lubricated
Sliding Contacts.
Aydar Akchurin1,2, Rob Bosman2, Piet M. Lugt2,3, Mark van Drogen3
1Materials innovation institute (M2i)
P.O. Box 5008
2600 GA DELFT
The Netherlands
2Department of Engineering Technology,
Laboratory for Surface Technology and Tribology,
University of Twente,
P.O. Box 217
7500 AE Enschede
The Netherlands
3SKF Engineering & Research Centre
Kelvinbaan 16
3439MT Nieuwegein, The Netherlands

B-2
Abstract
The wear process in a sliding contact results in generation of wear debris, which
affects the system life. The impact depends on the wear particles properties, such as
size, shape and number. In this paper, the wear particles formed during a cylinder on
disk wear test were examined. PAO additive-free oil, steel-brass and steel-steel
contact pairs were employed. A particle isolation procedure was applied and SEM/EDS
analysis was used to validate it. DLS measurements indicated the wear particles radius
to be in the range from 110 to 175 nm for both materials under applied nominal
pressures from 87 to 175 MPa. A slight increase of particles size with load was
observed by AFM for both materials and confirmed by DLS for steel samples. AFM
measurements were used to determine thickness, length and width distributions of the
wear particles. The number of wear particles per sliding distance and per unit load was
estimated to be in the range from 1200 to 6000 𝑝𝑎𝑟𝑡𝑖𝑐𝑙𝑒𝑠
𝑚𝑚∙𝑁 for steel and approximately
12800 − 15200 𝑝𝑎𝑟𝑡𝑖𝑐𝑙𝑒𝑠
𝑚𝑚∙𝑁 for brass.

B-3
1. Introduction
The wear process results in generation of debris, or particles, of various size,
shape, color distributions and chemical composition [1-3]. The properties of the
particles may depend on normal load, sliding speed, environment and many other
parameters [4]. The types of wear particles include plate-shaped particles with aspect
ratios of 2-10 produced as a result of accumulated plastic deformation, ribbon-shaped
particles with aspect ratios higher than 10, produced by abrasion and even spherical
particles [1].
Wear particles produce mechanical damage, however, sometimes
accompanying effects become even more important. For example, in artificial joint
replacements, wear debris trigger the autoimmune reaction and lead to a failure of the
joint in a long term [5]. The severity of the reaction is known to be dependent on the
wear particles number, size, shape, surface area [6,7]. The influence of the wear
particles formed in dry sliding was shown to be significant on the transition from the
severe “running-in” mode to the mild wear regime [8,9]. In case of grease lubricated
bearings, the oxidation of the grease thickener and base oil is accelerated in the
presence of the wear debris as reported by Hurley et al. [10]. In some situations, the
thickener structure can be destroyed by the particles leading to the failure of lubrication
and of the bearing [11]. There is also an increasing concern regarding the
environmental effect of the metallic particles [12,13]. Additionally, it is believed that the
wear debris also reflects the wear mechanism [14-16] and therefore significant efforts
were devoted to wear particles analysis.
Kato et al. [17] found that, in the case of dry wear and with equipment that could
only measure particles larger than 200 nm, all of the considered cases showed the
maximum number of wear particles of this diameter. This fact indicates that most likely,

B-4
the actual size of the particles is even smaller. In a series of experimental
investigations, Mishina and Hase studied the formation of initial, or elementary wear
particle in situ using a frictional microscope [18] during the deformation in sliding
contacts and examined the surfaces after wear using an atomic force microscope
(AFM). Both lubricated and dry contacts were studied to investigate the mechanism of
wear particle formation [19,20]. The size distribution of the wear particles formed in dry
and lubricated sliding contacts of various metals with iron was also obtained [21]. The
size of the particles was found to be in the range of tens of nanometers. They
concluded that the particle size was determined by the material properties and not by
the load and lubrication conditions. However, the number of particles did strongly
depended on the load and lubrication conditions. Scherge et al. [22] analyzed wear
particles formed in lubricated conditions in chromium-plated steel and grey cast iron
pair. A fully formulated oil was used as a lubricant. Using transmission electron
microscope (TEM) and automated particle analyzing software, it was found that the
size of the particles was around 250 nm in lateral dimensions. The thickness was found
to be not more than 30 nm. Wasche et al. [23] also analyzed wear particles formed in
reciprocating lubricated steel-steel contact. As the lubricant, fully formulated and base
oil were used. The wear particles were analyzed using scanning electron microscope
(SEM). It was concluded, that the primary wear particles were of the size of around 5-
30 nm and most of the larger particles were agglomerates. It was suggested, that the
particles were milled down to the small sizes during the reciprocate motion. It was also
concluded, that although the chemical composition of the wear particles was different
(in fully formulated oil, the additives constituents were prevailing, whereas for the base
oil, iron was prevailing), their size was approximately the same. Olofsson et al.
[12,24,25] analyzed airborne wear particles, formed in unlubricated steel-steel sliding

B-5
contact at several normal loads. The mean particle size was found to be in the range
from 200 to 400nm, with mean values around 350 nm. The distributions, however, were
multi-modal and in most cases had 3 distinct peaks. An increase of the total number of
particles with load was also reported.
A number of techniques can be employed to analyze the wear particles [26],
which can be classified in imaging and non-imaging techniques. The imaging methods
include optical, electron (SEM, TEM) and AFM microscopy among others. These tools
are potentially capable of measuring shape, size and concentration (also texture) of
the particles. However, only a limited amount of particles can be analyzed using
imaging procedures and imaging of a significant number of sample spots is required in
order to gather statistically reliable information. This makes the imaging methods slow
but also subjective. In contrast, the non-imaging techniques, such as dynamic light
scattering (DLS) are fast and can analyze a large number of particles simultaneously.
The DLS method analyses the light scattered by particles undergoing a Brownian
motion in a suspension. Since the particles are in motion, the scattered light fluctuates
and for the larger particles, time scale of fluctuations is larger than for the smaller ones,
which makes it possible to calculate the diameters of the particles [27]. The information
about shape, concentration and texture is not available in this case. Therefore,
sometimes various techniques are combined.
Particles analysis techniques require sample preparation and the key issue of
most characterization methods is the collection of a sufficient number of particles
and/or separation of particles after testing. Common collection techniques include
centrifugation and sonication. Centrifugation is necessary to collect most of the
particles from the lubricant and possibly to eliminate unwanted contaminants. On the
other hand, several researchers showed that the small particles tend to make

B-6
agglomerations which can be misleadingly considered as large single particles
[28,29,18]. In order to break these agglomerates, sonication needs to be employed
[30,31].
In the current paper, wear particles formed in boundary lubricated steel on steel
and steel on brass sliding contacts were studied. The particles were collected after the
cylinder-on-disk test from the oil using an isolation protocol which includes
centrifugation and sonication. Polyalphaolefin oil (PAO) additive-free oil was used as
a lubricant to minimize chemical effects in the tribo-system. The test conditions were
varied to explore the dependence of the particles size on load and materials
combination. The particles were analyzed using DLS, SEM (coupled with electron
diffraction X-Ray spectroscopy, EDS) and AFM techniques. The results will be used
for validation of the wear particles size prediction model, which is developed in
accompanying paper.
2. Materials and method
2.1. Cylinder-on-disk wear tests
Sliding wear tests were conducted under boundary lubrication conditions with
PAO as a lubricant. The viscosity of the oil was 68 cSt at 40° C. In each test, 4ml of oil
was placed into the disk holder. AISI 52100 steel cylinders with surface roughness
(root mean square, 𝑅𝑞) of around 50 nm were worn in pair with bearing cage steel
material disks with a roughness of around 610 nm or with brass disks with
approximately 760 nm roughness. The oil, disks and cylinders were supplied by SKF
Research Centre, Nieuwegein, the Netherlands. The hardness of the steel disks was
110 ± 4 HV and that of brass was 112 ± 2 HV. Young’s modulus was 88 GPa for
brass and 210GPa for steel disks. The radius of the cylinder was 2mm and the width
was 6mm. The normal load was taken to be 2.5N, 5N or 10N under a constant

B-7
temperature of 80° C and sliding velocity of 0.01 m/s. Additionally, for the steel disks
the temperature was varied. Under 10N load, the temperatures used were: 50° C, 80°
C and 130°C. No noticeable variation of the wear particles size due to a temperature
change in this range was found, since the material properties of steel responsible for
wear do not change significantly. Material properties of brass also do not vary much in
the considered range of temperatures and the particles size dependence on
temperature was assumed to be negligible and not measured.
Wear tests were performed for 1740 rotations on 13mm wear track (4 hrs). The
lubricant with wear particles was collected after the test and stored for further analysis.
2.2. Surface roughness and wear volume measurement
Before the wear test, each disk was indented (7 indents) and the initial surface
roughness was measured. The indents were placed along the line perpendicular to the
wear track. After the wear test, the surface profiles of the worn disks were measured
and matched with initial profiles using the indents as markers. The wear volume was
then calculated using:
𝑉 = ∆ℎ ∙ 2𝜋𝑅 ∙ 𝑑, (1)
where 𝑉 is the wear volume, ∆ℎ is the difference between unworn and worn
height profiles, 𝑑 and 𝑅 are the width and radius of the wear track. Due to the way that
the materials of the contacting pair are chosen, e,g, soft vs hard, makes the wear to
be concentrated almost solely on the disk. The wear volume for the cylinder was 3
orders of magnitude less than the wear volume of the steel disk.
The measurement of roughness was performed using a Keyence VK9700 laser
scanning microscope (Keyence, Itasca, IL, USA). Indentations were performed using
a LECO microhardness tester LM100AT (LECO, St. Joseph, MI, USA).

B-8
2.3. Particle isolation procedure
In order to prepare wear particles samples for further analysis, the following
isolation procedure was applied. First, particles were collected with the oil after the
wear test. Isopropanol (2-propanol, IPA) was added to the oil holder which was
ultrasonically cleaned for 15 minutes at 40C. From the experiments it was found that
the cleaning helps to collect a sufficient number of particles in order to perform DLS
measurements. If ultrasonic cleaning was not used, sometimes the concentration of
particles was not sufficient. IPA was used as a cleaning agent. The mixture of IPA and
oil with particles was placed into 40 ml centrifuge tube and centrifuged for 15 hours.
The upper 30 ml were then discarded and the tube was filled with deionized water (DI)
and centrifuged again for 15 hours. During the centrifugation, high density wear
particles (mostly consisting of iron or brass,𝜌 ≈ 7900𝑘𝑔
𝑚3) sediment at the bottom of the
tube, whereas low density oil (𝜌 ≈ 800𝑘𝑔
𝑚3) forms an upper layer in the tube. By
discarding the upper layer, the oil can be eliminated. This procedure of adding DI water
and centrifuging is repeated 3 times to make sure that all the oil was eliminated.
Centrifugation time 𝑡𝑖 during each iteration was decreased, as discussed below. The
suspension of particles in DI water (3ml) is then collected for further analysis. The
diagram of the process is shown in Fig. 1.

B-9
Fig. 1. Schematic diagram of the particle isolation procedure.
For the centrifugation a Thermo Scientific SL 16R centrifuge (Thermo Fisher
Scientific, Waltham, MA, USA) was use at 10000 rpm and 40C, resulting in the Relative
Centrifugal Force 𝑅𝐶𝐹 =𝑟𝜔2
𝑔= 10947 in the particle isolation procedure.
The required centrifugation time 𝑡𝑖 at each iteration was estimated by assuming
that the particles are spherical and that there are only centrifugal, buoyancy and
viscous drag forces (Stokes drag) acting on the particles. A force balance leads to the
following expression for the time needed for a single particle to sediment at the bottom
of the tube [32]:
𝑡 =9
2
𝐿𝜇
𝑅𝐶𝐹∙𝑔(𝜌𝑝−𝜌𝑙)𝑅2, (2)
where 𝑔 is the gravitational acceleration, 𝜌𝑝, 𝜌𝑙 are the density of the particle
and liquid, 𝑅 is the radius of the particle, 𝜇 is the viscosity of the liquid and 𝐿 is the
particles traveling distance. In order to get a simple equation, it was assumed that the
interaction between the particles is negligible. It should be noticed, that the interaction
of particles may lead to agglomeration [33,34] and increased mass of the formed
agglomerate. This would lead to higher centrifugal force and decrease the centrifuging
time. Therefore, the discussed assumption results in upper bound for the centrifugation

B-10
time. It should also be noted, that the centrifugation time obtained by equation (2) was
used only as an indication and in the separation procedure even longer time was used,
as discussed below.
If it is assumed that the tube is fully filled by oil (𝜇 ≈ 55𝑐𝑃 ), then at least 12
hours are required for the spherical particles with radius larger than 25 nm to sediment
at the bottom of the tube according to (2). Since the calculated time is only an
approximation, the first centrifugation was done for 𝑡1 = 15 hours. After the first
centrifugation, most of the oil is eliminated and it can be assumed that the viscosity of
the left liquid is equal to the viscosity of DI water of 1 cP. In this case, for the same size
of particles to sediment, theoretically only 15 minutes are required. Therefore, after the
first iteration, consequent centrifugation times can be significantly decreased. The
centrifugation times were taken to be 𝑡2 = 4 and 𝑡3 = 2 hours.
2.4. DLS measurement
For the DLS measurements, a Zetasizer Nano ZS system (He-Ne laser of
633nm wavelength, Malvern, UK) with 1.5 ml of particle suspension was used.
Measurements were performed at 25 C. The result of the measurement is an
equivalent hydrodynamic diameter [35]. Equilibration of the sample before the
measurements was performed for 120 s. The diameter of the particles was measured
with refractive index of 2.87 and 0.58 for steel and brass, which corresponds to pure
iron and copper at 633nm wavelength [36]. Repeated DLS measurement on the same
sample at various times after particles isolation did not reveal significant variation of
the size, indicating stability of the suspension. It was also found, that the increase of
the sonication time after centrifugation did not affect the particles size measurement.
2.5. Preparation of samples for SEM/EDS and AFM measurements
After DLS analysis, samples were further analyzed using SEM/EDS and AFM.

B-11
SEM measurements coupled with EDS were performed to validate the particle
isolation procedure by analyzing elemental composition of debris. Suspensions of
particles were dried on a carbon tape for 1 day in a vacuum oven at 40C. Next, a JEOL
JSM-6400 Scanning Microscope (JEOL, Tokyo, Japan) coupled with EDS was
employed.
AFM measurements were performed to obtain 3D information about the
particles and to build the distribution of particles size. Samples were dried on a glass
plate for 1 day in a vacuum oven at 40C. A glass plate was used since the wear
particles can be visually identified on the glass plate using a microscope.
Measurements were performed using a FlexAFM microscope (Nanosurf AG, Liestal
Switzerland) in a dynamic mode. The scan window was taken to be 20 µm ×20 µm
with 1024×1024 measurement points. Silicon tips (ACLA) with the cantilever stiffness
of 42 N/m and tip radius less than 6 nm were used.
Fig. 2. AFM height profile and its cross-section for clean glass substrate (𝑹𝒒 ≈ 𝟓𝒏𝒎).
The AFM height profiles were analyzed in Matlab to identify wear particles. A
roughness profile of the clean glass substrate is shown in Fig. 2. The roughness of the
glass plate was found to be approximately 5 nm, which means that 99% of its surface
heights are within 30nm. Therefore, within the range of 30nm, it is not possible to
distinguish the particles from the substrate on AFM profile.

B-12
An example of an AFM profile of the substrate with particles on it is shown in
Fig. 3. On the left image, the particles can be visually identified. On the cross-section,
clearly, the peaks correspond to the particles, since the glass plate is much smoother.
Fig. 3. AFM height profile of the plate with dried particles suspension𝑹𝒒 ≈ 𝟓𝟎𝒏𝒎.
A height threshold was therefore introduced to ensure that the roughness of the
substrate and possible noise of the measurement is excluded in the analysis. An
example of the initial AFM height profile and identified particles using 50nm height
threshold is shown in Fig. 4. Based on this information, the distributions of width, length
and thickness of the particles were obtained. The width and length were defined as the
longest dimension of the square which encompasses the particle, being the width the
smallest dimension and the thickness was defined as the deepest point of a particle.
Fig. 4. Identification of particles with height threshold (50 nm threshold).

B-13
3. Results and Discussion
3.1. Friction and Wear Volume Measurement
During the wear tests, the coefficient of friction was recorded and wear volumes
were estimated using surface profile measurements as described above. It was found,
that the wear volume of the cylinder was three orders of magnitude less than the wear
of the steel disk at 10N load. In case of the brass disk, it was found that the brass
transfer film formed on the surface of the cylinder and no significant wear of the cylinder
was detected. Therefore, it was assumed, that most of the analyzed particles originated
from the disks.
Fig. 5. Coefficient of friction as a function of load for steel and brass disks.
The regime of lubrication was assessed using 𝜆 =ℎ𝑚𝑖𝑛
𝑅𝑞⁄ [37], where ℎ𝑚𝑖𝑛 is
the minimum film thickness obtained by Dowson-Higginson equation [38,39]. For the
case of steel-steel contact at 2.5N load 𝜆 = 0.051 and since 𝜆 < 0.1 the boundary
lubrication regime was encountered [40]. Under higher loads or with brass material, 𝜆
is even smaller, and therefore, all the considered tests operated in boundary lubrication
regime. It can be seen from Fig. 5 that the coefficient of friction does not change
significantly with load for both materials combinations. This suggests that the

B-14
dominating wear mechanism will also be the same for all measurements. The friction
with brass disk is approximately twice as high as with the steel disk.
There was no significant variation of the friction with temperature. This was to
be expected, since, in the considered range of temperatures, the mechanical
properties of the materials are not influenced significantly. A COF-temperature
dependence is also not expected from a possible formation of a tribo-layer. In these
tests no extreme pressure and anti-wear additives are used. However, even for
additive rich oils, in the range of temperatures considered, friction will not depend on
temperature [41]. In this range of temperatures, the oxide type remains the same [42].
Fig. 6. Wear volume variation with load.
Results of wear volume measurements are shown in Fig. 6. For both materials,
there is a linear relation of wear volume with load. The wear of the brass is higher,
since it has twice as high COF as the steel. The wear volume of brass as a function of
load increases stronger than that of steel disk.
Wear coefficients were obtained from the Archard’s wear equation in the
following form [43]:
𝑊 = 𝑘 ∗ 𝐹 ∗ 𝑠, (3)
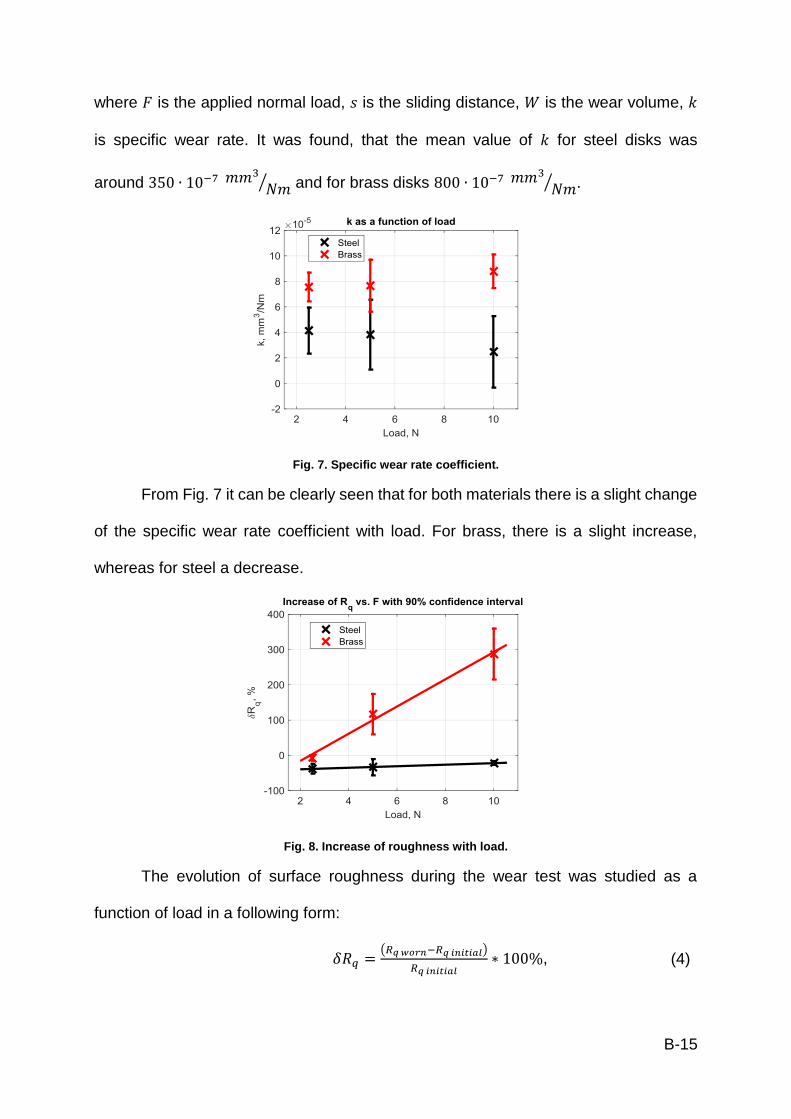
B-15
where 𝐹 is the applied normal load, 𝑠 is the sliding distance, 𝑊 is the wear volume, 𝑘
is specific wear rate. It was found, that the mean value of 𝑘 for steel disks was
around 350 ∙ 10−7 𝑚𝑚3
𝑁𝑚⁄ and for brass disks 800 ∙ 10−7 𝑚𝑚3
𝑁𝑚⁄ .
Fig. 7. Specific wear rate coefficient.
From Fig. 7 it can be clearly seen that for both materials there is a slight change
of the specific wear rate coefficient with load. For brass, there is a slight increase,
whereas for steel a decrease.
Fig. 8. Increase of roughness with load.
The evolution of surface roughness during the wear test was studied as a
function of load in a following form:
𝛿𝑅𝑞 =(𝑅𝑞 𝑤𝑜𝑟𝑛−𝑅𝑞 𝑖𝑛𝑖𝑡𝑖𝑎𝑙)
𝑅𝑞 𝑖𝑛𝑖𝑡𝑖𝑎𝑙∗ 100%, (4)

B-16
where 𝛿𝑅𝑞 is the increase of roughness in %, 𝑅𝑞 𝑖𝑛𝑖𝑡𝑖𝑎𝑙 and 𝑅𝑞 𝑤𝑜𝑟𝑛 are roughness
of initial and worn surfaces.
Variation of 𝛿𝑅𝑞 with load is given in Fig. 8. It can be seen that for 2.5N load,
the roughness after the test somewhat decreased for both materials. However, for the
loads of 5 and 10N, the “worn roughness” is significantly higher than the initial for brass.
In case of steel, the worn roughness is lower than the initial in all cases, so the surface
was smoothened during the wear test.
3.2. SEM/EDS measurements
The major goal of the particle isolation procedure is to collect wear particles from
the oil for further analysis. Firstly, it was confirmed by the presence of iron in the
collected particles, that they originate from the base material (in this case of the steel-
steel) sliding pair.
The SEM/EDS results are shown in Fig. 9. A SEM image of a particle is shown
in Fig. 9(a), and the corresponding EDS element mapping in Fig. 9(b). It can be clearly
seen that iron is present in the particle. There is also C (carbon) present, which
originates from the carbon tape used for preparation of the sample. The presence of
oxygen shows that the particle is oxidized. The measurement of elemental composition
was performed for several particles and iron was found in all of them and therefore, it
can be concluded that the wear particles can be collected using the developed isolation
procedure.

B-17
Fig. 9. SEM/EDS results obtained for steel disk: SEM image (a), element mapping (b), EDS spectrum (c).
3.3. DLS measurements of the particles
Significant effort in this study was devoted to the DLS analysis of the size of the
wear particles. First, a measurement (including the particle isolation procedure) was
done with fresh oil which confirmed that no particles were observed. Coupled with the
SEM/EDS measurements, it proves that the isolation procedure does not introduce
artifacts in the measurement.
Fig. 10 shows the relation between the characteristic particles radius (the radius
obtained from DLS) on load. This figure shows that there is a trend in the particles
radius with load in the case of steel. The difference of the mean radius at 10N and at
2.5N is approximately 7%. This does not apply to the case of the brass disks.
Apparently the size does not depend on the load here. The particles have smaller
radius roughly by 20-40nm than formed in a steel-steel pair.
a b
c

B-18
Fig. 10. Radius of a wear particle as a function of load.
Fig. 11 shows, the characteristic radius as a function of temperature for the case
of steel disks. Rubbing at different temperatures gives wear particles with the similar
radii.
Fig. 11. Radius of a wear particle as a function of temperature, steel disk.
By dividing the total wear volume by a volume of a characteristic wear particle,
the total number of particles can be found. The results are shown in Fig. 12a.

B-19
Fig. 12. 𝑵𝒑 (a) and 𝒌𝑵 (b) as a function of load.
Dividing Archard’s equation (3) by a volume of a characteristic particle, results
in the following relation:
𝑁𝑝 = 𝑘𝑁 ∗ 𝐹 ∗ 𝑠, (7)
where 𝑁𝑝 is the number of particles and 𝑘𝑁 = 𝑘/𝑊𝑝 is the specific wear particle
coefficient with 𝑊𝑝 being the volume of characteristic particle.
The calculated values of 𝑘𝑁 as a function of load are shown in Fig. 12b. It should
be noted, that 𝑘𝑁 does not depend on load significantly for brass. This makes it
convenient to estimate the total number of particles without knowing the mean size of
a particle in similar conditions.
3.4. AFM measurements of steel wear particles
After the DLS measurements, several samples from the tests with steel disks
under 2.5 and 10 N load were analyzed using AFM to obtain 3D information regarding
particle size. Overall, 2500 particles were analyzed with nearly 500 particles for the
samples at 10N and 2000 particles for the samples at 2.5N. Based on these
measurements the distributions of length, width and thickness were built.
In order to compare the results of AFM measurements with those obtained by
DLS, equivalent radii of the particles were calculated. These are based on the radius
of a spherical particle with the same volume given by:
a b

B-20
𝑅𝑖 = (𝑉𝑖
𝜋
3
4)1/3
, (5)
where 𝑅𝑖 is the equivalent radius of the particle, and 𝑉𝑖 is its volume obtained
from AFM analysis. The probability distributions of the equivalent radius of particles
obtained under 10N load are given in Fig. 13.
Fig. 13. Number and volume weighted equivalent radius probability distributions. Steel disk, 10N, 467 particles total.
The number weighted mean value of the equivalent radius was found to be
around 175 nm, whereas the volume weighted mean value was found to be 358 nm. It
means that most of the volume is composed by a small amount of relatively large
particles, whereas the number of smaller particles is dominant. DLS results for the
same sample showed an equivalent radius of approximately 265 nm. The tendency of
the DLS approach towards higher values of particle’s size compared to AFM was
already reported in the literature [44]. The equivalent hydrodynamic diameter may be
biased towards higher radius particles, since it is proportional to the scattered intensity
and for small particles it is proportional to the 6-th power of the radius [44,35]. It can
be noticed that the distribution of the particles size is not Gaussian. However, the
distribution is mono-modal. This indicates that there are only limited wear particles
originating from the cylinder, otherwise it could be expected to get at least two peaks
in the distribution, corresponding to the disk and to the cylinder.
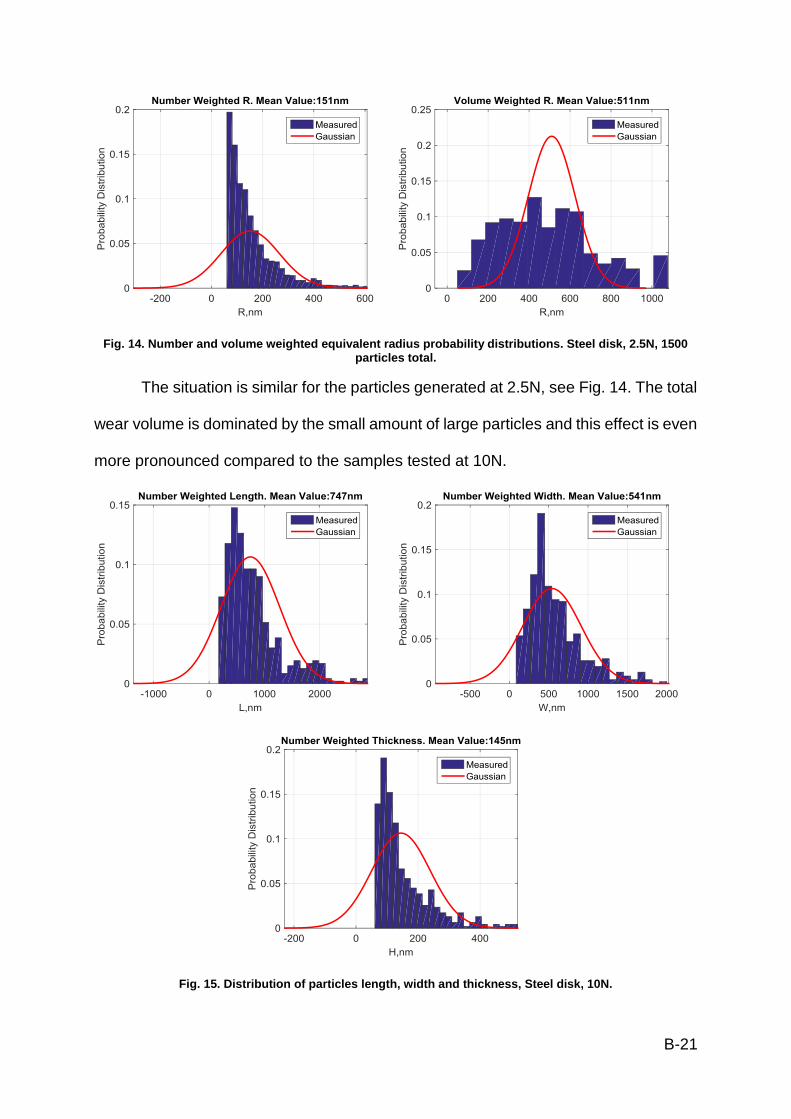
B-21
Fig. 14. Number and volume weighted equivalent radius probability distributions. Steel disk, 2.5N, 1500 particles total.
The situation is similar for the particles generated at 2.5N, see Fig. 14. The total
wear volume is dominated by the small amount of large particles and this effect is even
more pronounced compared to the samples tested at 10N.
Fig. 15. Distribution of particles length, width and thickness, Steel disk, 10N.
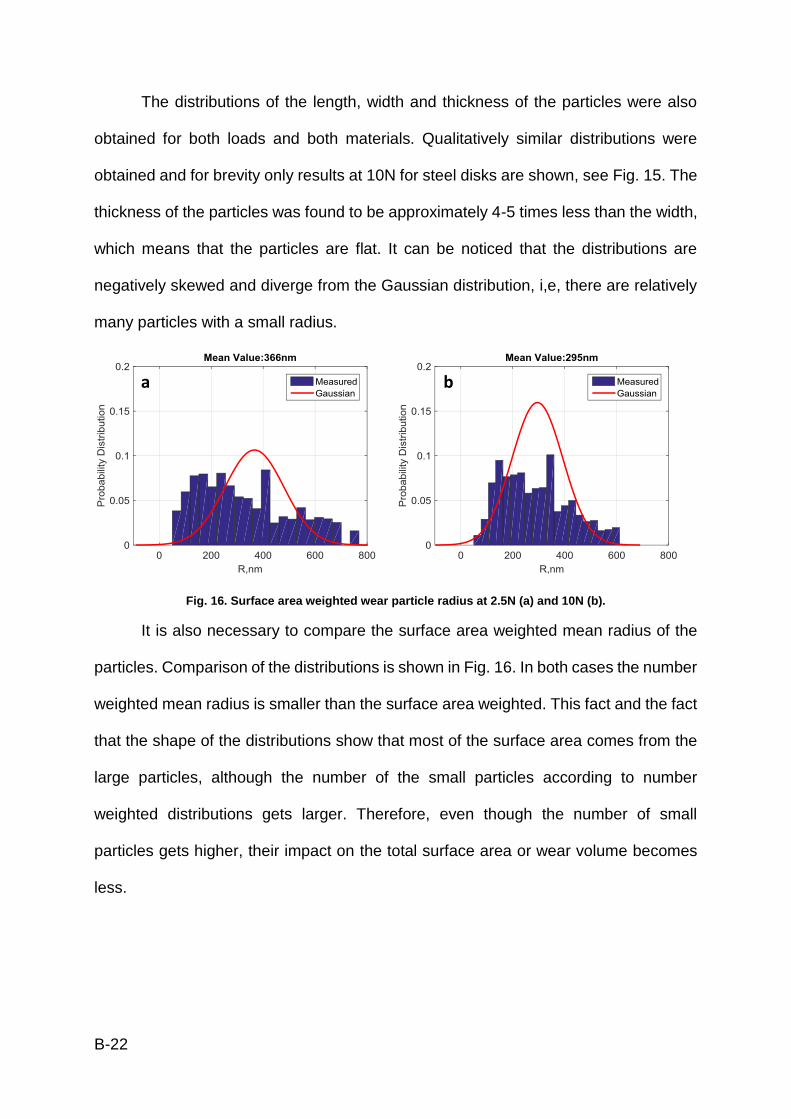
B-22
The distributions of the length, width and thickness of the particles were also
obtained for both loads and both materials. Qualitatively similar distributions were
obtained and for brevity only results at 10N for steel disks are shown, see Fig. 15. The
thickness of the particles was found to be approximately 4-5 times less than the width,
which means that the particles are flat. It can be noticed that the distributions are
negatively skewed and diverge from the Gaussian distribution, i,e, there are relatively
many particles with a small radius.
Fig. 16. Surface area weighted wear particle radius at 2.5N (a) and 10N (b).
It is also necessary to compare the surface area weighted mean radius of the
particles. Comparison of the distributions is shown in Fig. 16. In both cases the number
weighted mean radius is smaller than the surface area weighted. This fact and the fact
that the shape of the distributions show that most of the surface area comes from the
large particles, although the number of the small particles according to number
weighted distributions gets larger. Therefore, even though the number of small
particles gets higher, their impact on the total surface area or wear volume becomes
less.
a b

B-23
Fig. 17. Comparison of DLS and AFM results for steel (a) and for brass (b).
Finally, comparison of the DLS and AFM data is shown in Fig. 17. A slight trend
of the increase of the particles size with load can be found from both DLS and AFM
results for steel disk. In case of brass disks, DLS results do not show such trend and
the obtained radius stays approximately constant with load. The AFM results show
smaller particles sizes due to bias of DLS towards larger particles. At the same time,
AFM also has a bias, although it is apparently less expressed. Due to the height
threshold, a number of small particles are not considered, next to the fact that in AFM
only the upper contour is obtained and thus volume of undercuts is added to the wear
particles. Since the number of these particles is relatively large, a large number of
particles is not considered, which leads to the bias of AFM results towards larger sizes.
This bias is more pronounced for low loads, when the size of the particles are close to
the height threshold.
3.5. Discussion
The main challenge of the wear particles analysis lies in the preparation of the
samples and related artificial filtering. There is a possibility of the wear particles to
aggregate into larger clusters and sometimes these clusters may not be broken by the
sonication [29]. Therefore, the obtained results can be considered as the upper bound
estimation for the wear particles size. The particle isolation procedure also introduces
a b

B-24
a filtering of particles smaller than approximately 25nm radius due to the limited
centrifugation time. It should also be noted that hypothetically, there is no minimum
wear particles size (the theoretical smallest possible wear particle is an ion).
On the other hand, there is no need in putting efforts to capture smaller particles
during the centrifugation, since both DLS and AFM techniques introduce coarser
filtering. In case of DLS, the particles with the radius smaller than 100 nm will have
significantly less weight in the determination of the mean value of the wear particle.
This results in relatively large mean particle radius observed by DLS. In case of AFM,
the filtering is introduced explicitly through the height profile threshold. This threshold
is necessary to distinguish the particle from the background roughness and possible
noise. In this work, the threshold was taken to be 50 nm. Due to filtering, it is also clear
that the obtained values of the wear particles size are larger than the actual sizes in
case of both DLS and AFM analysis.
On the other hand, the contribution of the smallest particles to the overall wear
volume or surface area of worn particles sometimes can be limited. It can be argued
that in the presence of large particles which make most of the wear volume, the
mechanical damage from wear particles can be ascribed to these large particles. They
are capable of making relatively large dents, scratches and other mechanical damage,
as in case of large abrasive particles [45]. Smaller particles, within the range of the
surface roughness, are going to create relatively minor damage [46,47], since they
may carry less load. The fact that the number of small particles is high but their
contribution to the total wear volume is low is found by the comparison of the number
and volume weighted distributions obtained using AFM, see Fig. 13 and Fig. 14.
Moreover, with the decrease of the overall mean particles size, this effect becomes
even more pronounced. Wear particles also play significant role in chemical processes,

B-25
such as chemical deterioration of the grease in bearings [11]. The degree of catalytic
effect of wear particles on chemical reactions is mostly determined by the total surface
area of the particles rather than by their volume [48]. From the AFM results regarding
the surface area weighted particle size it can be concluded that the contribution of the
small particles to the total surface area of the worn particles decreases rapidly with a
decrease of the particles size, see Fig. 16. In addition, it must be noted that relatively
large particles will always be generated in the system in the running-in stage of the
wear process [8].
Based on the results of AFM measurements, a slight dependence of the
particles size on load can be observed for both materials. This behavior is confirmed
by DLS for steel samples. It should be noted, that with the decrease of the applied
load, the size of the particles become smaller and the effect of the filtering (both by
AFM and DLS) becomes more pronounced. Therefore, the actual dependence of the
size on load may be more noticeable, especially at lower loads. Based on DLS results
for brass disks, it is not possible to draw a conclusion on the relation between load and
size. This may be due to resolution of the DLS and only slight changes of the particles
size.
AFM measurements also revealed the shape of particles is characterized by a
high aspect ratio (around 4-5) meaning that the particles are flat, as it is frequently
reported in the literature [49,1]. The formation of flat particles suggests that severe
plastic deformation takes place on the surface and subsurface in the presence of a
tangential load. The wear particle may form in such regions [50,51].
Specific wear rates obtained in these measurements indicate a running-in stage
of the sliding friction [52]. It is suggested, that most of the wear volume is generated
during this initial stage [53,22] and therefore it can be concluded that most of the

B-26
particles are also formed during the running-in stage. In the present work, the values
of 𝑘𝑁 ≈ 1200 − 6000 𝑝𝑎𝑟𝑡𝑖𝑐𝑙𝑒𝑠
𝑚𝑚∙𝑁 for steel and 𝑘𝑁 ≈ 12800 − 15200
𝑝𝑎𝑟𝑡𝑖𝑐𝑙𝑒𝑠
𝑚𝑚∙𝑁 for brass were
obtained. These values then can be considered as characteristic to the running-in
stage of the discussed system. It should be noted, that calculation of the number of
particles based on DLS is approximate and underestimates the real number of particles
due to bias towards large particles.
4. Conclusions
The method for collecting and analyzing wear particles from lubricated wear
experiments was developed, validated and discussed. The procedure can be applied
for preparation of samples for DLS, SEM/EDS and AFM measurements.
Based on DLS measurements it was shown that the radius of particles is in the
range of 110-175 nm for both materials. A slight dependence particles size on load
was obtained both by AFM for both materials and by DLS for steel samples. AFM
measurements showed mono-modal non-Gaussian size distribution of flat particles
with aspect ratio in the order of 4-5. The number of particles formed per sliding distance
and unit of load were estimated to be in the range from 1200 to 6000 𝑝𝑎𝑟𝑡𝑖𝑐𝑙𝑒𝑠
𝑚𝑚∙𝑁 for steel
and approximately 12800 − 15200 𝑝𝑎𝑟𝑡𝑖𝑐𝑙𝑒𝑠
𝑚𝑚∙𝑁 for brass In case of steel-steel pair, wear
debris were mostly composed of iron.
Obtained data can be used for validation of the theoretical wear particles
formation models.
Acknowledgements
The authors would like to thank SKF Engineering & Research Centre,
Nieuwegein, The Netherlands and Bosch Transmission Technology BV, Tilburg, The
Netherlands for providing technical and financial support. We would like to thank Mr.
A.J.C de Vries, SKF Director Group Product Development for his permission to publish

B-27
this work. This research was carried out under project number M21.1.11450 in the
framework of the Research Program of the Materials innovation institute M2i.

B-28
Bibliography
1. Bhushan, B.: Principles and Applicaion of Tribology. A Wiley-Interscience Publication, New York (1999)
2. Bhushan, B.: Modern Tribology Handbook. CRC Press, Columbus (2001) 3. Zmitrowicz, A.: Wear Debris: A Review of Properties and Constitutive Models. Journal of Theoretical
and Applied Mechanics 43(1), 3-35 (2005). 4. Soda, N.: Wear of Some F.C.C. Metals During Unlubricated Sliding. Part II: Effects of Normal Load,
Sliding Velocity and Atmospheric Pressure on Wear Fragments. Wear 35(2), 331-343 (1975). 5. MacQuarrie, R.A., Chen, Y.F., Coles, C., Anderson, G.I.: Wear-Particle–Induced Osteoclast Osteolysis:
the Role of Particulates and Mechanical Strain. Journal of Biomedical Materials Research. Part B, Applied Biomaterials 69B, 104-112 (2004).
6. Green, T.R., Fisher, J., Stone, M., Wroblewski, B.M., Ingham, E.: Polyethylene Particles of a “Critical Size” are Necessary for the Induction of Cytokines by Macrophages in Vitro. Biomaterials 19, 2297-2302 (1998).
7. Elfick, A.P.D., Green, S.M., Krickler, S., Unsworth, A.: The Nature and Dissemination of UHMWPE Wear Debris Retrieved from Periprosthetic Tissue of THR. Journal of Biomedical Material and Research 65A, 95-108 (2003).
8. Hiratsuka, K., Muramoto, K.: Role of Wear Particles in Severe-Mild Wear Transition. Wear 259, 467-476 (2005).
9. Kato, H., Komai, K.: Tribofilm Formation and Mild Wear by Tribo-Sintering of Nanometer-Sized Oxide Paricles on Rubbing Steel Surfaces. Wear 262(1-2), 36-41 (2006).
10. Hurley, S., Cann, P., M., Spikes, H.,A.: Lubrication and Reflow Properties of Thermally Aged Greases. Tribology Transactions 43(2), 221-228 (2008).
11. Jin, X.: The Effect of Contamination Particles on Lithium Grease Deterioration. Lubrication Science 7(3) (1995).
12. Olofsson, U., Olander, L., Jansson, A.: Towards a Model for the Number of Airborne Particles Generated from a Sliding Contact. Wear 267, 2252-2256 (2009).
13. Vindedahlm, A., Strehlau, J.H., Arnold, W., Pen, R.L.: Organic Matter and Iron Oxide Nanoparticles: Aggregation, Interactions, and Reactivity Environmental Science: Nano(6) (2016).
14. Williams, J., A.: Wear and Wear Particles - Some Fudamentals. Tribology International 38(10), 863-870 (2005).
15. Roylance, B., J., Williams, J.,A., Dwyer-Joyce, R.: Wear Debris and Associated Phenomena - Fundamental Research and Practice. Proceedings of the Institution of Mechanical Engineers, Part J: Journal of Engineering Tribology 214(1), 79-105 (2000).
16. Kato, K.: Classification of Wear Mechanisms/Models. Journal of Engineering Tribology, 349-355 (2002).
17. Kato, K.: Micro-Mechanisms of Wear - Wear Modes. Wear 153(1), 277-295 (1992). 18. Mishina, H.: Surface Deformation and Formation of Original Element of Wear Particles in Sliding
Friction. Wear 215(1-2), 10-17 (1998). 19. Mishina, H., Iwase, H., Hase, A.: Generation of wear elements and origin of tribomagnetization
phenomenon. Wear 269(5-6), 491-497 (2010). doi:10.1016/j.wear.2010.05.004 20. Mishina, H., Hase, A.: Wear equation for adhesive wear established through elementary process of
wear. Wear 308(1-2), 186-192 (2013). doi:10.1016/j.wear.2013.06.016 21. Hase, A., Mishina, H.: Wear Elements Generated in the Elementary Process of Wear. Tribology
International 42(11-12), 1684-1690 (2008). 22. Scherge, M., Martin, J., M., Pohlmann, K.: Characterization of Wear Debris of Systems Operated
Under Low Wear-Rate Conditions. Wear 260, 458-461 (2006). 23. Wasche, R., Hartelt, M., Hodoroaba, V.-D.: Analysis of Nanoscale Wear Particles from Lubricated
Steel-Steel Contacts. Tribology Letters 58 (2015). 24. Olofsson, U., Olander, L.: On the Identification of Wear Modes and Transitions Using Airborne Wear
Particles. Tribology International 59, 104-113 (2013).

B-29
25. Abbasi, S., Wahlstrom, J., Olander, L., Larsson, C., Olofsson, U., Sellgren, U.: A Study of Airborne Wear Particles Generated from Organic Railway Brake Pads and Brake discs. Wear 273, 93-99 (2011).
26. Weiner, B.: A Guide to Choosing a Particle Sizer. http://www.brookhaveninstruments.com/pdf/theory/AGuidetoChoosingaParticle.pdf.
27. Pecora, R.: Dynamic Light Scattering: Application of Photon Correlation Spectroscopy. Plenum Press, New York (1985)
28. Skebo, J., E., Grabinski, A., M.,S., Schlager, J., J., Hussain, S., M.: Assessment of Metal Nanoparticle Agglomeration, Uptake, and Interaction Using High-Illuminating System. International Journal of Toxicology 26, 135 - 141 (2007).
29. Zhou, D., Bennett, S., W., Keller, A., A.: Increased Mobility of Metal Oxide Nanoparticles Due to Photo and Thermal Induced Disagglomeration. Public Library of Science one 7(5), 1-8 (2012).
30. Seipenbusch, M., Toneva, P., Peukert, W., Weber, A., P.: Impact Fragmentation of Metal Nanoparticle Agglomerates. Particle and Particle Systems Characterization 24, 193-200 (2007).
31. Kwak, K., Kim, C.: Viscosity and Thermal Conductivity of Copper Oxide Nanofluid Dispersed in Ethylene Glycol. Korea-Australia Rheology Journal 17(2), 35-40 (2005).
32. Volkl, A.: Ultracentrifugation In: Encyclopedia of Life Sciences (ELS). In. John Wiley & Sons, Ltd, Chichester (2010)
33. Rosická, D., Šembera, J.: Assessment of Influence of Magnetic Forces on Aggregation of Zero-valent Iron Nanoparticles. Nanoscale Research Letters 6 (2011).
34. Chekli, L., Phuntsho, S., Roy, M., Lombi, E., Donner, E., Shon, H.K.: Assessing the aggregation behaviour of iron oxide nanoparticles under relevant environmental conditions using a multi-method approach. Water Research 47, 4585-4599 (2013).
35. Merkus, H., G.: Particle Size Measurements. Fundamentals, Practice, Quality. Springer, (2009) 36. Ordal, M., A., Bell, R., J., Alexander, R., W., Long, L., L., Querry, M., R.: Optical properties of fourteen
metals in the infrared and far infrared: Al, Co, Cu, Au, Fe, Pb, Mo, Ni, Pd, Pt, Ag, Ti, V, and W. Applied Optics 24(24), 4493-4499 (1985).
37. Tallian, T.E.: The theory of partial elastohydrodynamic contacts. Wear 21, 49-101 (1972). 38. Dowson, D., Higginson, G.R.: New Roller-Bearing Lubrication Formula. Engineering (London) 192,
158-159 (1961). 39. Hooke, C.: A review of the paper 'A numerical solution to the elastohydrodynamic problem' by D.
Dowson and G.R. Higginson. Journal of Engineering Tribology 223, 49-53 (2009). 40. Spikes, H.A., Olver, A.V.: Basics of Mixed Lubrication. Lubrication Science 16, 3-28 (2003). 41. Rounds, G.: Some Environmental Factors Affecting Surface Coating Formation with Lubricating Oil
Additives. ASLE Transactions 9, 88-106 (1966). 42. Quinn, T., F.,J.: Review of oxidational wear Part II: Recent developments and future trends in
oxidational wear research. Tribology International 16(6), 305-315 (1983). 43. Ludema, K.: Friction, Wear, Lubrication: A Textbook in Tribology. CRC Press, Ann Arbor (1996) 44. Maccuspie, R., I., Rogers, K., Patra, M., Suo, Z., Allen, A., J., Martin, M., N.: Challenges for Physical
Characterization of Silver Nanoparticles Under Pristine and Environmentally Relevant Conditions. Journal of Environmental Monitoring 13(5), 1212-1226 (2011).
45. Adamiak, E.b.M.: Abrasion Resistance of Materials. InTech, Chapters published (2012) 46. Padgurskas, J., Rukuiza, R., Prosyc, I., Kreivaitis, R.: Tribological properties of lubricant additives of
Fe, Cu and Co nanoparticles. Tribology International 60, 224–232 (2013). 47. Chinas-Castillo, F., Spikes, H.A.: Mechanism of Action of Colloidal Solid Dispersions. Journal of
Tribology 125, 525-557 (2003). 48. Walker, D.: Chemical Reactions. Evans Brothers, London (2007) 49. Suh, N., P.: The Delamination Theory of Wear. Wear 25, 111-124 (1973). 50. Bosman, R., Schipper, D., J.: Transition from Mild to Severe Wear Including Running in Effects. Wear
270(7-8), 472-478 (2011). 51. Jahanmir, S.: The Relationship of Tangential Stress to Wear Particle Formation Mechanisms. Wear
103, 233-252 (1985).

B-30
52. Begelinger, A., de Gee, A., W.,J.: Boundary Lubrication of Sliding Concentrated Steel Contacts. Wear 22, 337-357 (1972).
53. Bosman, R., Hol, J., Schipper, D., J.: Running in of Metallic Surfaces in the Boundary Lubrication Regime. Wear 271(7-8), 1134-1146 (2011).

Paper C


Stress Criterion Based Model for the Prediction of the Size of Wear
Particles in Boundary Lubricated Contacts
Aydar Akchurin1,2, Rob Bosman2, Piet M. Lugt2,3
1Materials innovation institute (M2i)
P.O. Box 5008
2600 GA DELFT
The Netherlands
2Department of Engineering Technology,
Laboratory for Surface Technology and Tribology,
University of Twente,
P.O. Box 217
7500 AE Enschede
The Netherlands
3SKF Engineering & Research Centre
Kelvinbaan 16
3439 MT Nieuwegein, The Netherlands

C-2
Nomenclature
𝑥, 𝑦, �̃� spatial coordinates, [𝑚]
𝑝(𝑥, 𝑦), 𝑠(𝑥, 𝑦) Normal and tangential surface stresses, [𝑃𝑎]
𝑢(𝑥, 𝑦) deflection due to pressure 𝑝(𝑥, 𝑦), [𝑚]
𝐸, 𝐸1, 𝐸2 Young’s modulus of the materials in contact, [𝑃𝑎]
𝜈, 𝜈1, 𝜈2 Poisson’s ratio of the cylinder and the substrate, [−]
𝐸′
composite Young’s modulus, [𝑃𝑎]
2
𝐸′=1 − 𝜈1
2
𝐸1+1 − 𝜈2
2
𝐸2
𝑧(𝑥, 𝑦) measured surface roughness, [𝑚]
ℎ𝑠(𝑥, 𝑦) separation distance between the bodies, [𝑚]
𝐹𝐶 load carried by surface contacts, [𝑁]
𝐴𝑐 Direct contact area, [𝑚2]
𝑁𝑥, 𝑁𝑦, 𝑁𝑧 number of grid points in spatial directions [−]
𝑅 radius of the cylinder, [𝑚]
𝑓𝐶𝑏 friction coefficient in boundary lubrication, [−]
𝐵 width of the cylinder, [𝑚]
𝐻 hardness, [𝑃𝑎]
𝜎𝑦 yield stresses, [𝑃𝑎]
𝜎𝑖𝑗 subsurface stresses, [𝑃𝑎]
𝑅𝑞 surface roughness (standard deviation of surface
heights), [𝑚]

C-3
Abstract
In this paper the formulation and validation of a model for the prediction of the
wear particles size in boundary lubrication is described. An efficient numerical model
based on a well-established BEM formulation combined with a mechanical wear
criterion was applied. The behavior of the model and particularly the influence of the
initial surface roughness and load was explored. The model was validated using
measurements of the wear particles formed in steel-steel and steel-brass contacts. In
the case of steel-steel contact, a reasonable quantitative agreement was observed. In
the case of steel-brass contact, formation of the brass transfer layer dominates the
particles generation process. To include this effect, a layered material model was
introduced.
1. Introduction
Failure of equipment due to wear has led to considerable effort in
understanding wear and in the development of predictive models for wear. For example
Meng and Ludema [1] have identified 182 equations for different types of wear. Among
them were empirical relations, contact mechanics-based approaches, and equations
based on material failure mechanisms.
One of the most famous and frequently used wear equation was developed by
Holm and Archard in 1953 [2]. The model considers adhesive wear and assumes the
sliding spherical asperities to deform fully plastic. The wear volume formed in a sliding
distance 𝑠 under the applied normal load 𝐹 equals to 𝑉𝑇 = 𝑘 ∗ 𝐹/𝐻 ∗ 𝑠. The coefficient
𝑘 is known as a wear coefficient and is frequently used to compare the degree of the
wear resistance of systems [3,4]. It can be regarded as the probability that a wear
particle will be formed during contact. In general this wear coefficient is estimated

C-4
experimentally. Although Archard originally developed this equation to model adhesive
wear, it is now widely used for modelling abrasive, fretting and other types of wear [5]
as well.
In general, wear models can be empirical or based on physical phenomena
occurring in the system. Empirical models typically fit the experimental data with
algebraic equations of arbitrary form. Although they require less investment in the
model development, a good predictive capability can be achieved only with a great
number of experimental data. Physical based models use the physical properties of
the system and physical phenomena to predict wear. By doing so, it is possible to
significantly reduce the experimental data needed for the model development. These
models can be classified in analytical, semi-analytical and numerical methods. Most of
them are used to predict the wear volume and resulting life-time, rather than focusing
on the size of the resulting wear particles. On the other hand, the particles size is more
relevant in some applications. For example, oxidation of grease thickener and base oil
is accelerated by metal particles [6,7], the severity of this phenomenon depends on the
total surface area of the particles and therefore on their size, shape and number.
Another example is that an autoimmune reaction of the body is highly dependent on
the size of formed wear fragments in artificial joint replacements [8,9]. Also the
environmental impact of small particles is of increasing concern [10].
Analytical wear models often link global parameters, such as load, speed,
temperature with the wear volume or the wear track depth [11-15]. Although they are
applicable only in specific cases, these models are very useful for understanding the
relationship between governing parameters such as hardness, load or sliding speed.
Among the numerical models, a large group is represented by Finite Element
Analysis (FEM) [16,17]. The application of these models is restricted to the analysis of

C-5
simplified problems, such as smooth surfaces, single asperities etc., due to the
associated computational costs. The numerical models frequently incorporate
Archard’s law or its modifications using local contact stress distributions obtained by
FEM [18-25]. A number of researchers also considered multi-scale FEM-MD
(molecular dynamic approach) coupling in order to perform nanometer scale wear
simulations [26-28].
Semi-Analytical models combine numerical methods with analytical solutions to
speed up the calculations. This approach is also applicable to the calculation of the
subsurface stresses [29-31] and temperatures in the contact [32]. Boundary Element
Methods (BEM) are widely spread in this group. These models are extensively used in
simulations of the contact of rough surfaces [33-35,29] and rely on the assumption that
the contacting bodies are semi-infinite.
Application of BEM to model wear may be performed in the same way as is
done in FEM, for example, by using Archard’s wear law locally [36,37]. Alternatively, a
particle-by-particle removal model can be built. This type of wear model requires the
formulation of a material rupture criterion, which is used to indicate the regions of the
wear volume generation. A number of criteria can be found in the literature, including
critical accumulated dissipated energy [13], critical accumulated plastic strain [17],
critical accumulated damage [38], critical von Mises stress [39] and their variants
[14,15,40,41].
Critical damage based models are typically used to simulate fatigue type of
wear, in which the failure criterion is based on a critical number of cycles and stress
intensity. A combination of a local Archard wear equation and cumulative damage
model (Palmgren-Miner) was used by Morales-Espejel et al. [42,43] to simulate mild
wear and to predict the generation of micro-pits. The model showed a good qualitative

C-6
agreement with the experimental data in the prediction of the size of the pits [42], as
well as in the topography evolution [44]. At the same time, this approach requires the
assessment of the fatigue limits at various loads and it introduces additional
parameters that need to be determined. In practice these values are rather hard to
determine using representative conditions. This approach is definitely required to
simulate the evolution of the surfaces in time. However, in this paper, this time scale is
not addressed since the objective here is to predict the particle generation until a
steady state situation has occurred. The objective is not to predict when the particles
are generated.
In the current paper the focus is rather on the running-in process of sliding
contacts. The time scale of the problem is not relevant. The wear process is considered
not to be time but only strain/stress driven [39]. Oila [45] studied the mechanisms of
the material degradation due to wear in high carbon steels and concluded that the wear
particle formation is associated with the so called plastically deformed regions beneath
the surface. Based on this work, Nelias [46] proposed a running-in wear model, using
the accumulated plastic strain criterion to distinguish these regions. Bosman et al. [39]
employed the Von Mises yield criterion to identify the plastically deformed regions and
simulated the wear particles generation. In addition, they combined a thermal and wear
model [39,47,48]. They successfully applied the combined model to predict the
transition from mild to severe wear, as well as the level of severe wear and running-in.
It should be noted, that the application of the stress based criterion is computationally
more efficient than the plastic-strain based criterion. A dense mesh is required which
results in much longer calculation times for the plastic strains.
In the present paper, the attention will be given to steel-steel and steel-brass
materials, frequently encountered in rolling element – cage contacts in bearings. A

C-7
simplified version of the model developed by Bosman et al. [39] will be used here. An
engineering semi-analytical model (BEM) for the simulation of wear particle formation
in boundary lubrication will be formulated based on a critical Von Mises stress and
validated using experimental measurements of the wear particles’ size. The model can
be combined with the Archard’s wear law to estimate the number of generated
particles, as discussed in the current paper.
2. Materials and method
2.1. Experimental Procedures
Experimental data on the wear particles size formed in boundary lubrication
sliding contacts of steel-steel and steel-brass were taken from an accompanying
publication by the authors [49].
In the current paper, several additional sliding tests of steel cylinder-brass disk
contacts were performed to study the formation of a brass transfer layer and obtain its
thickness (it was not measured in the reference [49]). The tests were performed at the
same conditions as in the reference [49] and are described below. Experiments were
conducted under boundary lubrication conditions with a polyalphaolefin oil (PAO) as a
lubricant. The viscosity of the oil was 68 cSt at 40°C. AISI 52100 steel cylinders with
surface roughness (root mean square, 𝑅𝑞) of around 50 nm were worn against brass
disks with approximately 760 nm roughness. The cylinder was stationary, while the
disk was rotating. The radius of the wear track was 17mm. The radius of the cylinder
was 2mm and the width was 6mm. The normal load was taken to be 2.5N, 5N or 10N
(corresponding to 88, 130 and 175 MPa) under a constant temperature of 80° C and a
sliding velocity of 0.01 m/s.
To obtain the thickness of the transfer layer formed during the steel-brass wear
tests, indentation marks were placed across the contact line of a cylinder before the

C-8
test. Subsequently, the roughness profile, including the dents, was measured. After
the wear test, the profile measurement was performed again and the initial and worn
profiles were matched using the indent marks. After the test, an increase of the initial
height profile of the cylinder was observed due to presence of the transfer layer. The
thickness of the transfer layer was obtained by measuring the difference in the height
between the worn and initial profiles.
The roughness measurement was performed using a Keyence VK9700 laser
scanning microscope. Indentations and hardness measurements were performed
using a LECO micro-hardness tester LM100AT.
2.2. Simulation Parameters
During the simulations, a cylinder-on-disk configuration was used,
corresponding to the experimental conditions [49], as discussed in the previous
section.
The material properties used in the simulations are given in Table . The wear of
the cylinder was neglected since it is significantly harder than the counter surface and
the measured wear volume was 3 orders of magnitude smaller than that of the steel
disk. The yield stress was calculated from the hardness using the rule of thumb 𝐻 =
2.8𝜎𝑦 [46].
The measured surface data was used in the simulations (see Fig. 1) unless
explicitly mentioned. The friction coefficient (0.16 for steel-steel and 0.3 for steel-brass
contacts) used in the current study was taken from [49], and was considered constant
throughout the simulation.
2.3. Contact Model
In the present model the contacting bodies were assumed to be semi-infinite
solids and both surfaces were assumed to be rough. In tribological systems running in

C-9
boundary lubrication, the elastic properties near the surface may be significantly
different from the bulk due to presence of chemically/physically absorbed layers.
However, as it was shown in [48], the thickness of the altered layers is relatively small
and the presence of the layer can be neglected in the subsurface stress state
calculation. Therefore, in this work a homogeneous material model was assumed,
unless explicitly mentioned.
Table 1. Properties of the materials.
Property Cylinder Disk, steel Disk, brass
𝐸, GPa 210 210 88
𝜈 0.3 0.3 0.3
𝐻, GPa 6 1.8 2.64
𝜎𝑦, GPa - 0.64 0.94
𝑅, mm 2
𝑅𝑞, nm 50 610 760
Skewness -0.27 -0.84 -1
Kurtosis 8.6 4.46 4.94
Slope 0.22 0.28 0.15
To calculate the stresses on and beneath the surface, the half-space
approximation was used. In this case, the contact pressure can be found by solving
the following system of equations:
{
𝑢(𝑥, 𝑦) = 𝑧(𝑥, 𝑦) − ℎ𝑠(𝑥, 𝑦), ∀ 𝑥, 𝑦 ∈ 𝐴𝑐
𝑝(𝑥, 𝑦) > 0, ∀ 𝑥, 𝑦 ∈ 𝐴𝑐𝑝(𝑥, 𝑦) ≤ 𝐻
𝐹𝐶 = ∬𝑝(𝑥, 𝑦) 𝑑𝑥𝑑𝑦
, (1)

C-10
where the deflection 𝑢(𝑥, 𝑦) can be calculated using the half-space
approximation [50]. The solution method for these types of problems was developed
by Polonsky and Keer [34] based on a single loop “Conjugate Gradient Method.” To
reduce the computational burden only a fraction of the cylinder geometry in the
direction perpendicular to sliding (𝑦 direction) was considered. Periodic boundary
conditions were applied in this direction to mimic the full cylinder geometry.
Fig. 1. Measured roughness profiles of the (a) cylinder, (b) steel and (c) brass disks.
Additionally, the computational time can be further decreased by implementing
the discrete fast Fourier transformation technique (DC-FFT) [29], since the deflection
𝑢(𝑥, 𝑦) is a discrete convolution:
𝑢(𝑥, 𝑦) = (𝐾 + 𝑆)⊗ 𝑝, (2)
a b
c

C-11
where 𝐾 and 𝑆 are the influence matrices for normal and tangential stresses
(tangential stess is 𝑓𝐶𝑏 ∙ 𝑝). Equation (2) can be used for the calculation of the
displacements in homogeneous [48], but also layered systems. For a layered body,
expressions for 𝐾 + 𝑆 are given in the frequency domain [51,52].
The subsurface stress can be calculated using the following relation:
𝜎𝑖𝑗(𝑥, 𝑦, 𝑧) = ∬𝑝(𝜉, 𝜂)𝐹𝑁𝑖𝑗(𝑥 − 𝜉, 𝑦 − 𝜂, 𝑧)𝑑𝜉𝑑𝜂 + 𝑠(𝜉, 𝜂)𝐹𝑆𝑖𝑗(𝑥 − 𝜉, 𝑦 −
𝜂, 𝑧)𝑑𝜉𝑑𝜂,
(3)
where 𝐹𝑁𝑖𝑗 and 𝐹𝑆𝑖𝑗 are the influence functions corresponding to the normal and
tangential directions. Indices (𝑖, 𝑗) ∈ {𝑥, 𝑦, 𝑧} are used to show the stress components.
These integrals are also convolutions and can be calculated using the DC-FFT based
approach:
𝜎𝑖𝑗(𝑥, 𝑦, 𝑧) = 𝐹𝑁⊗𝑝 + 𝐹𝑆⊗𝑝. (4)
Details can be found in the references [30,53]. In case of layered surfaces, these
functions are given in the frequency domain [51].
2.4. Wear Particle Formation Criterion and Wear Model
Once the subsurface stresses are obtained, the equivalent von Misses stresses
can be calculated. The formation of a particle is then determined by the critical von
Mises stress. More specifically, a particle will be formed, if in a certain volume of the
body, the von Mises stress exceeds a critical value and if this volume is exposed to the
surface. This is schematically shown in Fig. 2. The transition from elastic to elastic-
plastic behavior is characterized by the yield stress [53,46], which was therefore taken
as a critical value, following Bosman et al. [39].

C-12
Fig. 2. Representation of the particle removal.
The flow chart of the wear model is shown in Fig. 3. After the initialization, the
contact pressure and subsurface stresses are calculated. At this step, the grid
resolution in vertical direction is refined 10 times by interpolation of the calculated von
Mises stress to a refined grid using a polynomial function, for details see [47,54].This
keeps the computational time low while increasing the accuracy of the wear criterion
application. Next, the particle formation criterion is applied. If this criterion is met, a
particle is assumed to leave the contact. Subsequently, the surface profile is updated.
The wear cycles continue until the equilibrium of the wear particle size has been
reached.
Fig. 3. Schematic diagram of the wear model

C-13
2.5. Surface roughness simulation
The influence of the initial surface roughness on the wear particle’s size was
explored on artificially generated surfaces with different values for 𝑅𝑞, following the
approach from Hu [55].
For each surface type three surfaces were generated: 𝑅𝑞 = 500, 𝑅𝑞 =
1000 𝑎𝑛𝑑 𝑅𝑞 = 1500 𝑛𝑚 for the softer surface and 𝑅𝑞 = 50, 𝑅𝑞 = 500 𝑎𝑛𝑑 𝑅𝑞 =
1500 𝑛𝑚 for the harder surface.
3. Results and Discussion
A set of simulations was performed to explore the numerical behavior and
accuracy of the numerical scheme. To validate the model, the simulation results will
be compared to the experimental data obtained in reference [49]. This includes
Dynamic Light Scattering (DLS) and Atomic Force Microscope (AFM) measurement
results. Equivalent radii of the particles were calculated to accommodate a direct
comparison between the two methods (DLS determines only equivalent radii). This
was calculated using:
𝑅𝑖 = (𝑉𝑖
𝜋
3
4)1/3
, (5)
where 𝑅𝑖 is the equivalent radius of the particle, and 𝑉𝑖 is its volume obtained
from the simulation.
The simulations were done using homogenous material properties unless
explicitly mentioned. The computational area was a square with a size of 4 times the
Hertz contact radius.
3.1. Numerical Convergence
In this section, the convergence of the wear algorithm with respect to the
particle’s size is evaluated. Simplified simulations were performed by assuming that
the steel disk is worn against a rigid flat surface using a normal load of 10N.

C-14
The computational grid size was gradually refined in lateral direction from 𝑁𝑥 ×
𝑁𝑦 × 𝑁𝑧 = 80 × 80 × 64 data points (horizontal spacing 𝑑𝑥 = 𝑑𝑦 = 305 𝑛𝑚, 𝑑𝑧 =
95 𝑛𝑚) to 𝑁𝑥 × 𝑁𝑦 ×𝑁𝑧 = 320 × 320 × 64 , (𝑑𝑥 = 𝑑𝑦 = 76 𝑛𝑚, 𝑑𝑧 = 95 𝑛𝑚). Variation
of the average wear particle size is given in Fig. 4, a (normalized to the value at the
lowest grid). It can be seen that with the increase of the mesh density, the mean wear
particle’s size decreases and converges to a certain value. It does not change
significantly with a further increase of the grid points.
Fig. 4. Convergence of the wear particles size with the mesh size in lateral (a) and vertical (b) directions.
In addition, the influence of the number of grid points in vertical direction on the
results was studied. The number was gradually increased from 𝑁𝑧 = 8 (𝑑𝑧 = 1500 𝑛𝑚)
to 𝑁𝑧 = 64 (𝑑𝑧 = 95 𝑛𝑚). The results are presented in Fig. 4, b. As it was earlier
mentioned, during the wear simulation, an interpolation is used in the z direction. Due
to the interpolation, the influence of the initial depth resolution is decreased and the
size of the particle does not depend on it, as shown in Fig. 4. More details in the
description of the numerical algorithm can be found in reference [54].
3.2. General Simulation Results
In this section, some typical simulation results are shown for a steel-steel
contact, at a load of 10N and a grid of 𝑁𝑥 ×𝑁𝑦 × 𝑁𝑧 = 240 × 240 × 64 points with 𝑑𝑥 =
𝑑𝑦 = 102 𝑛𝑚 and 𝑑𝑧 = 95 𝑛𝑚.
100 150 200 250 3000
0.2
0.4
0.6
0.8
1
Nx,N
y
Ra
diu
s, n
orm
aliz
ed
Normalized particle radius vs mesh size
a b

C-15
Fig. 5a, shows the variation of the wear particles size during the wear cycles. At
the early stage of the wear process, large particles are formed followed by a decrease
and stabilization of the particles size with further iterations. This behavior may be
expected and can be explained by the evolution of the surfaces. Due to wear, the initial
surfaces adapt and the stresses decrease, leading to a decrease of the number and
size of the generated particles. This behavior, however, is not general and will depend
on the initial surface roughness and the hardness of the material. If the initial surface
is smooth, but the hardness of the material is low, the surface may become rougher
due to large wear particles, leading to an increase of stress and further increase of the
particles size until the equilibrium is reached.
The wear volume per iteration follows the same trend. In the beginning the wear
volume per iteration step is high. It results in a large wear volume in the first 50 cycles.
Later, the wear volume per iteration stabilizes and the accumulation of the wear volume
becomes slower.
Fig. 5. Wear particles radius (a) and wear volume per iteration (b).
As can be seen in Fig. 6a, the average contact pressure decreases only slightly
during the wear process. This is due to a relatively low hardness of the disk. It restricts
the local contacts from carrying high pressures and most of the contact is in the full
plastic regime. The evolution of the surface roughness is shown in Fig. 6b. In this
50 100 150 200100
200
300
400
500
600
700
Iteration
Ra
diu
s, n
m
50 100 150 2000
10
20
30
40
50
60
Iteration
We
ar
Vo
lum
e,
m3
Wear Volume per Iteration
a b

C-16
particular case, the initially rough surface gets smoothened, as frequently reported,
see for example [56,44].
Fig. 6. Average contact pressure and surface roughness evolution.
Based on the simulations of these cases it can be concluded that some of the
major characteristics of the wear process were captured. The running-in process is
represented by the evolution of the surface profiles, wear volume, wear particles size
and average contact pressure. In the following sections, the influence of the surface
roughness and experimental validation of the model will be addressed.
3.3. Wear particles size
In this section, the results of the particles size simulation will be compared with
the experimental data from the reference [49], which is shown in Fig. 7. For the steel
disks, the experiments show slightly higher values of the particles radius and a small
increase with increasing load. The model predicts smaller particles and a somewhat
higher increase. As discussed in the reference [49], there is a bias of both AFM and
DLS towards larger particles and this effect becomes more important as the particles
get smaller. The actual size of particles at all loads (and especially at lower loads, e.g.
2.5N), may be smaller than the experimentally obtained values. Therefore, the
agreement between the simulations and the experiment can be considered as
reasonable.
50 100 150 2000
0.5
1
1.5
Iteration
Ave
rag
e P
ressu
re, G
Pa
Average Contact Pressure
Average Contact Pressure
Hardness
50 100 150 2000
100
200
300
400
500
600
700
Iteration
Rq, n
m
Evolution of Surface Roughness

C-17
In case of brass, both AFM and DLS do not show noticeable change of the
particles size with load, in contrast with the model predictions. According to both DLS
and AFM measurement, the brass particles have to be smaller than the steel particles,
but the simulation shows an opposite behavior. In addition, the brass transfer layer was
found on the surface of a cylinder after testing. It was therefore concluded, that a
different primary wear mechanism was encountered in the steel-brass contact, which
will be discussed later.
Fig. 7. Comparison of experimental data from reference [49] with theory for steel (a) and for brass(b). The wear particle size has been measured using DLS (Dynamic Light Scattering), and AFM (Atomic Force
Microscopy) techniques. Equivalent radius is compared.
Since the shape of the particles also plays an important role, comparison of the
theoretical length, width and thickness with the AFM data from [49] was performed.
The results for the steel-steel pair is shown in Table and the steel-brass pair in Table 3.
For steel-steel, the theoretical values are smaller, except for the thickness. It can also
be noticed, that the predicted variation with load of all three parameters is more
pronounced than observed experimentally. This discrepancy increases with a
decrease of the load, which may be linked to the limitations of the experimental data,
as was discussed earlier [49].
a b

C-18
Table 1. Specification of the particle’s sizes, steel-steel contact.
Property AFM, [49] Theory Load, N
Length, nm 747 442 10
Width, nm 541 245 10
Thickness, nm 145 197 10
Length, nm 600 267 2.5
Width, nm 476 161 2.5
Thickness, nm 129 151 2.5
3.4. Influence of surface roughness on wear particles size
The influence of the initial surface roughness on the resultant wear particles size
was explored using generated surfaces and the result is shown in Fig. 8. It can be
clearly seen that the variation of the surface roughness of the softer material does not
influence the wear particles size, whereas the change of the topography of the harder
surface produces a clear effect. This behavior was also observed experimentally [57].
Fig. 8. Influence of the initial roughness of the softer (a) and harder (b) materials on the resultant particle size.
3.5. Brass transfer film and wear of the layered surface
In the case of steel-brass material combination, the presence of a brass transfer
film was observed under an optical microscope, see Fig. 9. This layer was found to
affect the size of the particles and resulted in a much larger deviation of the predicted
400 600 800 1000 1200 1400 16000
50
100
150
200
250
300
Rq, nm
Ra
diu
s, n
m
Wear particle radius vs Rq
200 400 600 800 1000 1200 1400 1600340
360
380
400
420
440
460
480
Rq, nm
Ra
diu
s, n
m
Wear particle radius vs Rq
a b
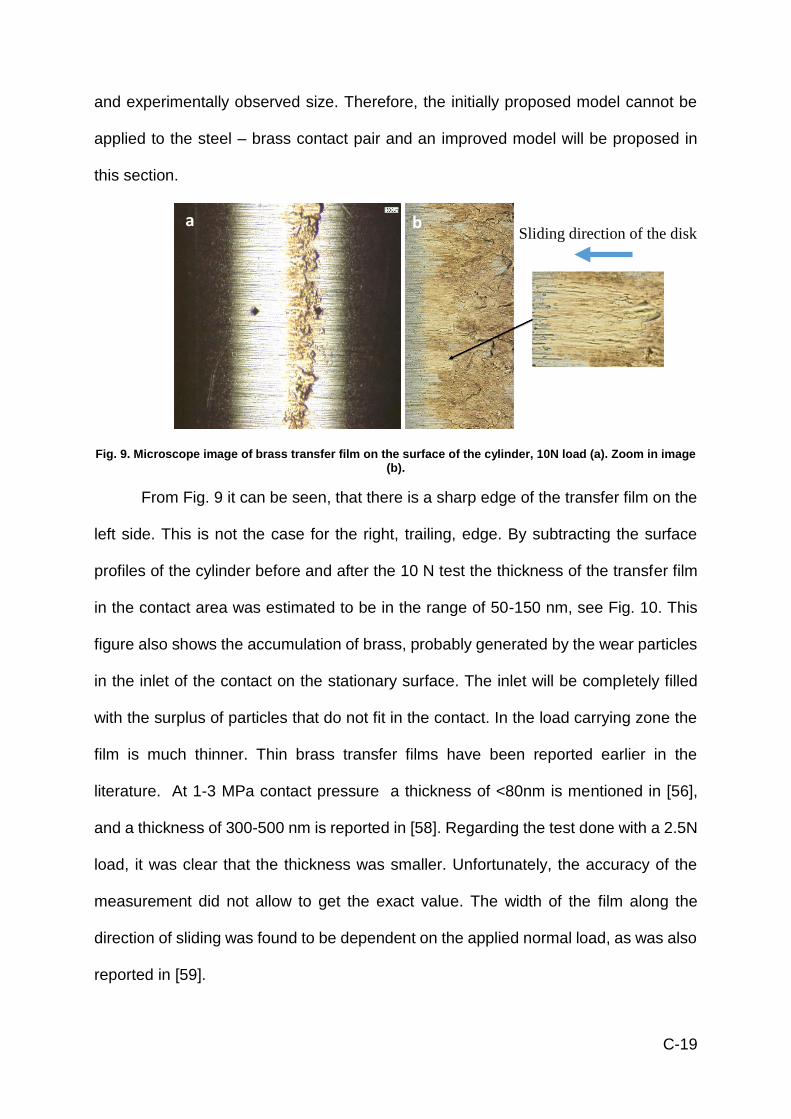
C-19
and experimentally observed size. Therefore, the initially proposed model cannot be
applied to the steel – brass contact pair and an improved model will be proposed in
this section.
Fig. 9. Microscope image of brass transfer film on the surface of the cylinder, 10N load (a). Zoom in image (b).
From Fig. 9 it can be seen, that there is a sharp edge of the transfer film on the
left side. This is not the case for the right, trailing, edge. By subtracting the surface
profiles of the cylinder before and after the 10 N test the thickness of the transfer film
in the contact area was estimated to be in the range of 50-150 nm, see Fig. 10. This
figure also shows the accumulation of brass, probably generated by the wear particles
in the inlet of the contact on the stationary surface. The inlet will be completely filled
with the surplus of particles that do not fit in the contact. In the load carrying zone the
film is much thinner. Thin brass transfer films have been reported earlier in the
literature. At 1-3 MPa contact pressure a thickness of <80nm is mentioned in [56],
and a thickness of 300-500 nm is reported in [58]. Regarding the test done with a 2.5N
load, it was clear that the thickness was smaller. Unfortunately, the accuracy of the
measurement did not allow to get the exact value. The width of the film along the
direction of sliding was found to be dependent on the applied normal load, as was also
reported in [59].
b a Sliding direction of the disk

C-20
Fig. 10. Comparison of initial and after test cylinder surface profiles. The difference (pink color) indicates transferred or accumulated brass. The blue line represents the line perpendicular to the normal loading
direction.
The hardness of the brass film on the cylinder surface after the test was found
to be close to the value of the hardness of the brass disk surface before the wear test
(see Table 2), as also reported in literature [60].
Table 2. Hardness of the brass. Transfer film hardness measured after 10N load test.
Hardness of the surface, GPa 2.64
Hardness of the transfer film, GPa 2.96
The formation of the brass transfer film is attributed to the strong adhesion of
brass to the surface of the steel cylinder during sliding [59]. Hence, the wear particles
are not formed by the mechanism that was modelled in the case of the steel-steel pair,
i.e., direct particle removal. Once the (very thin) film is formed, the initial brass-steel
contact is substituted by a brass-brass contact. A simulation with the present model
showed that the predicted size of particles would be in the range of 500-600 nm (at a
load of 10N), which is significantly larger than the experimental observation. However,
the initial steel-brass contact is very quickly transformed into a brass against a transfer
layer coated steel contact. This model was then employed in the simulation of the
brass-against steel situation. The following assumptions were introduced:

C-21
1) The particles detached from the brass disk only form a transfer film and do
not create loose wear particles.
2) Loose wear particles are only formed from the transferred layer with a given
(uniform) thickness and based on the critical Von Mises stress criterion.
3) There is no return of the brass wear particles.
A schematic representation of the contact is shown in Fig. 11. In the load
carrying area the thickness of the layer was found to be in the range from 50 to 150
nm. The thickness of the layer was therefore taken to be equal to 100 nm.
The results are shown in Fig. 12. In this figure, the initial model (Homogeneous
Brass-Steel) is compared with the layered model (Brass-Brass Coated Steel) and
experimental data. It can be seen, that the introduction of the brass transfer layer
considerably reduces the size of the wear particles below that of the steel particles
corresponding to the experimental observations. In addition, the increase of the
particles size with load is less pronounced for the layered model, in agreement with
the experimental evidence.
Fig. 11. Schematic of the contact with brass transfer film.

C-22
Fig. 12. Comparison of the model results and experiment for brass.
Comparison of the predicted length, width and thickness of wear particles
formed in steel-brass contact with the AFM data from the reference [49] is shown in
Table 3. The predicted values are always smaller, including the thickness. The variation
of the thickness with load is limited in both simulation and experiment, which indicates
that the thickness of particles is largely influenced by the thickness of the transfer layer
(50-150nm). As for the case with steel disk, the decrease of the size is less pronounced
in the experimental data.
Table 3. Specification of the particle’s sizes, steel-brass contact.
Property AFM, [49] Theory Load, N
Length, nm 751 635 10
Width, nm 521 262 10
Thickness, nm 126 95 10
Length, nm 543 300 2.5
Width, nm 397 195 2.5
Thickness, nm 115 89 2.5

C-23
3.6. Discussion
The degradation of surfaces during the wear process is complex. It involves the
influence of contact pressure, microstructural changes, material transformation,
chemical reactions and material properties variation [45,61].
The model described in this paper is a relatively simple method to predict the
wear particles size distribution. If the removed volume is known, the size may also be
used to calculate the number of wear particles resulting from the wear process.
Unfortunately, the considered approach does not allow for the calculation of wear
volume directly, due to the assumption of the immediate wear particle detachment if
the critical stress is exceeded. In reality, the wear is a gradual, fatigue governed
process and sometimes, even if the mentioned criterion is met, the particle will not
detach, or if detached, stick to the surface again, and self-heal the surfaces. This leads
to a several orders of magnitude overestimation of the wear volume. Therefore, to
model the wear volume, at least an Archard’s type of approach will be necessary to
introduce the probability of wear particle detachment.
As it was shown in the case of a steel-steel contact, reasonable agreement is
found between wear particles size prediction and measurements. In the steel-brass
contacts, the dominant particle formation mechanism is different. The brass from the
disk is first transferred onto the counter body, forming a new sliding pair with different
properties and the loose wear particles are detached mainly from the transfer layer.
Therefore, the particles formation is driven by the growth and rupture of this layer [62].
A better agreement with the experiment was found by considering the layered structure
of the contacting bodies.

C-24
Employment of the BEM methods makes it possible to run a considerable
number of iterations and to address the dynamics of the wear process, by including
the running in and steady state regimes.
4. Conclusions
A simple wear algorithm based on subsurface stress calculation was introduced
and validated using experimental data on the wear particles size. The particle
generation criterion was based on a critical stress and geometrical boundary
conditions. It was shown that the model works well for steel-steel contacts. In case of
steel-brass contact, a transfer film was observed and it was concluded that the main
wear particle formation mechanism is linked to the rupture of this layer. The model was
therefore extended by including the influence of the transfer layer after which a better
agreement was observed.
It was found, that the resultant wear particles size is independent of the softer
surface profile. In contrast, an increase in roughness of the harder material resulted in
an increase of the wear particles detached from the softer material.
Overall, the performance of the model can be considered as satisfactory to
predict the formation of wear particles both by direct removal as well as through
formation and rupture of a transfer layer.
Acknowledgements
The authors would like to thank SKF Engineering & Research Centre,
Nieuwegein, The Netherlands for providing technical and financial support. This
research was carried out under project number M21.1.11450 in the framework of the
Research Program of the Materials innovation institute M2i.

C-25
Bibliography
1. Meng, H., C., Ludema K.,C.: Wear Models and Predictive Equations: Their Form and Content. 181-183 (1995).
2. Archard, J.F.: Contact and Rubbing of Flat Surfaces. Journal of Applied Physics 24(8), 981-988 (1953). doi:doi:http://dx.doi.org/10.1063/1.1721448
3. Ludema, K.: Friction, Wear, Lubrication: A Textbook in Tribology. CRC Press, Ann Arbor (1996) 4. Bhushan, B.: Principles and Applicaion of Tribology. A Wiley-Interscience Publication, New York
(1999) 5. Williams, J., A.: Wear Modelling: Analytical, Computational and Mapping: A Continuum Mechanics
Approach. Wear 225-229, 1-17 (1999). 6. Hurley, S., Cann, P., M., Spikes, H.,A.: Lubrication and Reflow Properties of Thermally Aged Greases.
Tribology Transactions 43(2), 221-228 (2008). 7. Jin, X.: The Effect of Contamination Particles on Lithium Grease Deterioration. Lubrication Science
7(3) (1995). 8. MacQuarrie, R.A., Chen, Y.F., Coles, C., Anderson, G.I.: Wear-Particle–Induced Osteoclast Osteolysis:
the Role of Particulates and Mechanical Strain. Journal of Biomedical Materials Research. Part B, Applied Biomaterials 69B, 104-112 (2004).
9. Green, T.R., Fisher, J., Stone, M., Wroblewski, B.M., Ingham, E.: Polyethylene Particles of a “Critical Size” are Necessary for the Induction of Cytokines by Macrophages in Vitro. Biomaterials 19, 2297-2302 (1998).
10. Olofsson, U., Olander, L., Jansson, A.: Towards a Model for the Number of Airborne Particles Generated from a Sliding Contact. Wear 267, 2252-2256 (2009).
11. Argatov, I., I.: Asymptotic modeling of Reciprocating Sliding Wear with Application to Local Interwire Contact. Wear 271(7-8), 1147-1155 (2011).
12. Mishina, H., Hase, A.: Wear equation for adhesive wear established through elementary process of wear. Wear 308(1-2), 186-192 (2013). doi:10.1016/j.wear.2013.06.016
13. De Moerlooze, K., Al-Bender, F., Van Brussel, H.: A Novel Energy-Based Generic Wear Model at the Asperity Level. Wear 270(11-12), 760-770 (2011).
14. Huq, M., Z., Celis, J.-P.: Expressing Wear Rate in Sliding Contacts Based on Dissipated Energy. Wear 252(5-6), 375-383 (2002).
15. Aghdam, A.B., Khonsari, M.M.: On the correlation between wear and entropy in dry sliding contact. Wear 270(11-12), 781-790 (2011). doi:DOI 10.1016/j.wear.2011.01.034
16. Salib, J., Kligerman, Y., Etsion, I.: A Model for Potential Adhesive Wear Particle at Sliding Inception of a Spherical Contact. Tribology Letters 30(3), 225-223 (2008).
17. Boher, C., Barrau, O., Gras, R., Rezai-Aria, F.: A Wear Model Based on Cumulative Cyclic Plastic Straining. Wear 267(5-8), 1087-1094 (2009).
18. Molinari, J.F., Ortiz, M., Radovitzky, R., Repetto, E.A.: Finite-Element Modeling of Dry Sliding Wear in Metals. Engineering Computations 18(3/4), 592-609 (2001).
19. Podra, P., Andersson, S.: Simulating Sliding Wear with Finite Element Method. Tribology International 32(2), 71-81 (1999).
20. Hegadekatte, V., Huber, N., Kraft, O.: Modeling and Simulation of Wear in a Pin on Disc Tribometer. Tribology Letters 24(1), 51-60 (2006).
21. Cruzado, A., Urchegui, M.A., Gomez, X.: Finite Element Modeling of Fretting Wear Scars in the Thin Steel Wires: Application in Crossed Cylinder Arrangements. Wear 318, 98-105 (2014).
22. Mattei, L., Di Puccio, F.: Influence of the Wear Particion Factor on Wear Evolution Modeling of Sliding Surfaces. International Journal of Mechanical Sciences 99, 72-88 (2015).
23. Holmberg, K., Laukkanen, A., Turunen, E., Laitinen, T.: Wear Resistance Optimisation of Composite Coatings by Computational Microstructure Modeling. Surface & Coatings Technology 247, 1-13 (2014).
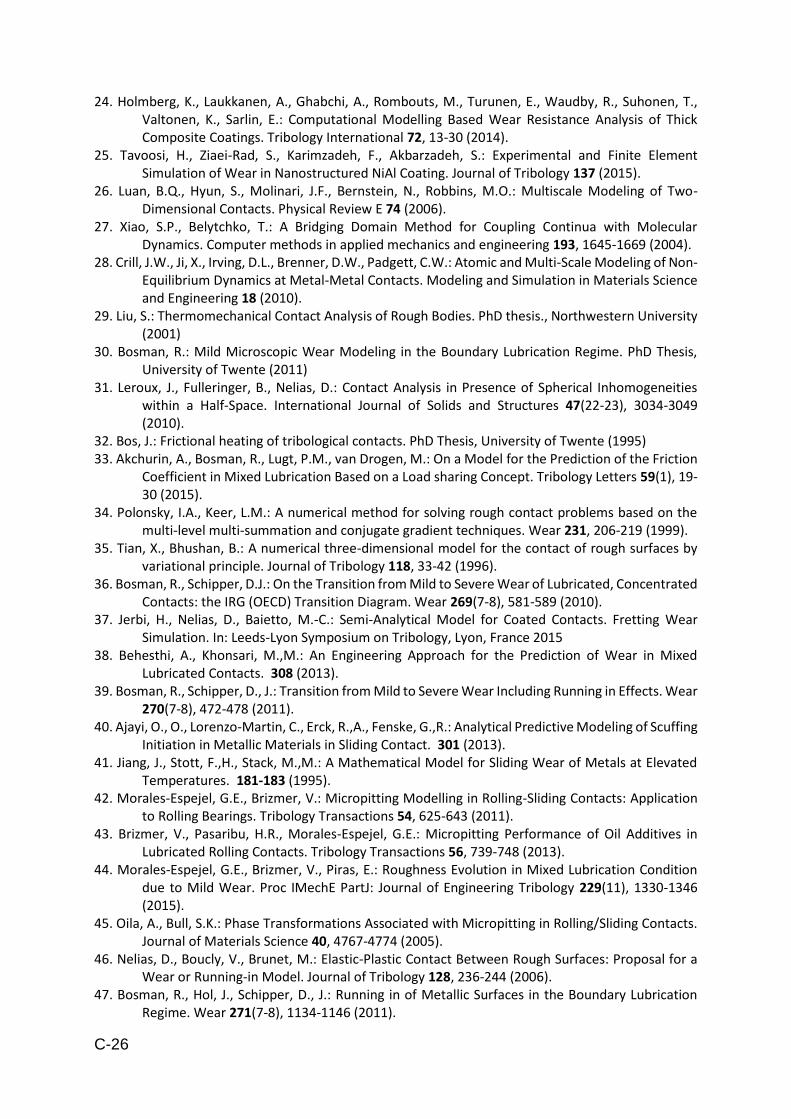
C-26
24. Holmberg, K., Laukkanen, A., Ghabchi, A., Rombouts, M., Turunen, E., Waudby, R., Suhonen, T., Valtonen, K., Sarlin, E.: Computational Modelling Based Wear Resistance Analysis of Thick Composite Coatings. Tribology International 72, 13-30 (2014).
25. Tavoosi, H., Ziaei-Rad, S., Karimzadeh, F., Akbarzadeh, S.: Experimental and Finite Element Simulation of Wear in Nanostructured NiAl Coating. Journal of Tribology 137 (2015).
26. Luan, B.Q., Hyun, S., Molinari, J.F., Bernstein, N., Robbins, M.O.: Multiscale Modeling of Two-Dimensional Contacts. Physical Review E 74 (2006).
27. Xiao, S.P., Belytchko, T.: A Bridging Domain Method for Coupling Continua with Molecular Dynamics. Computer methods in applied mechanics and engineering 193, 1645-1669 (2004).
28. Crill, J.W., Ji, X., Irving, D.L., Brenner, D.W., Padgett, C.W.: Atomic and Multi-Scale Modeling of Non-Equilibrium Dynamics at Metal-Metal Contacts. Modeling and Simulation in Materials Science and Engineering 18 (2010).
29. Liu, S.: Thermomechanical Contact Analysis of Rough Bodies. PhD thesis., Northwestern University (2001)
30. Bosman, R.: Mild Microscopic Wear Modeling in the Boundary Lubrication Regime. PhD Thesis, University of Twente (2011)
31. Leroux, J., Fulleringer, B., Nelias, D.: Contact Analysis in Presence of Spherical Inhomogeneities within a Half-Space. International Journal of Solids and Structures 47(22-23), 3034-3049 (2010).
32. Bos, J.: Frictional heating of tribological contacts. PhD Thesis, University of Twente (1995) 33. Akchurin, A., Bosman, R., Lugt, P.M., van Drogen, M.: On a Model for the Prediction of the Friction
Coefficient in Mixed Lubrication Based on a Load sharing Concept. Tribology Letters 59(1), 19-30 (2015).
34. Polonsky, I.A., Keer, L.M.: A numerical method for solving rough contact problems based on the multi-level multi-summation and conjugate gradient techniques. Wear 231, 206-219 (1999).
35. Tian, X., Bhushan, B.: A numerical three-dimensional model for the contact of rough surfaces by variational principle. Journal of Tribology 118, 33-42 (1996).
36. Bosman, R., Schipper, D.J.: On the Transition from Mild to Severe Wear of Lubricated, Concentrated Contacts: the IRG (OECD) Transition Diagram. Wear 269(7-8), 581-589 (2010).
37. Jerbi, H., Nelias, D., Baietto, M.-C.: Semi-Analytical Model for Coated Contacts. Fretting Wear Simulation. In: Leeds-Lyon Symposium on Tribology, Lyon, France 2015
38. Behesthi, A., Khonsari, M.,M.: An Engineering Approach for the Prediction of Wear in Mixed Lubricated Contacts. 308 (2013).
39. Bosman, R., Schipper, D., J.: Transition from Mild to Severe Wear Including Running in Effects. Wear 270(7-8), 472-478 (2011).
40. Ajayi, O., O., Lorenzo-Martin, C., Erck, R.,A., Fenske, G.,R.: Analytical Predictive Modeling of Scuffing Initiation in Metallic Materials in Sliding Contact. 301 (2013).
41. Jiang, J., Stott, F.,H., Stack, M.,M.: A Mathematical Model for Sliding Wear of Metals at Elevated Temperatures. 181-183 (1995).
42. Morales-Espejel, G.E., Brizmer, V.: Micropitting Modelling in Rolling-Sliding Contacts: Application to Rolling Bearings. Tribology Transactions 54, 625-643 (2011).
43. Brizmer, V., Pasaribu, H.R., Morales-Espejel, G.E.: Micropitting Performance of Oil Additives in Lubricated Rolling Contacts. Tribology Transactions 56, 739-748 (2013).
44. Morales-Espejel, G.E., Brizmer, V., Piras, E.: Roughness Evolution in Mixed Lubrication Condition due to Mild Wear. Proc IMechE PartJ: Journal of Engineering Tribology 229(11), 1330-1346 (2015).
45. Oila, A., Bull, S.K.: Phase Transformations Associated with Micropitting in Rolling/Sliding Contacts. Journal of Materials Science 40, 4767-4774 (2005).
46. Nelias, D., Boucly, V., Brunet, M.: Elastic-Plastic Contact Between Rough Surfaces: Proposal for a Wear or Running-in Model. Journal of Tribology 128, 236-244 (2006).
47. Bosman, R., Hol, J., Schipper, D., J.: Running in of Metallic Surfaces in the Boundary Lubrication Regime. Wear 271(7-8), 1134-1146 (2011).

C-27
48. Bosman, R., Schipper, D., J.: Running-in of Systems Protected by Additive Rich Oils. Tribology Letters 41, 263-282 (2011).
49. Akchurin, A., Bosman, R., Lugt, P.M.: Analysis of Wear Particles Formed in Boundary Lubricated Sliding Contacts. Tribology Letters 63(2), 1-14 (2016).
50. Timoshenko, S.P., Goodier, J.N.: Theory of Elasticity, 3-rd ed. McGraw-Hill, New York (1970) 51. Wang, Z.-J., Wang, W.-Z., Wang, H., Zhu, D., Hu, Y.-Z.: Partial Slip Contact Analysis on Three-
Dimensional Elastic Layered Half Space. Journal of Tribology 132(2), 1-12 (2012). 52. Liu, S., Wang, Q.: Studying Contact Stress Fields Caused by Surface Tractions with a Discrete
Convolution and Fast Fourier Transform Algorithm. Journal of Tribology 124(1), 36-45 (2002). 53. Jacq, C., Nelias, D., Lormand, G., Girodin, D.: Development of a three-dimensional semi-analytical
elastic-plastic contact code. Journal of Tribology 124, 653-667 (2002). 54. Boucly, V.: Contact and its Application to Asperity Collision, Wear and Running-in of Surfaces. INSA
Lyon (2008) 55. Hu, Y., Z., Tonder, K.: Simulation of 3-D Random Rough Surface by 2-D Digital Filter and Fourier
Analysis. International Journal of Machine Tools and Manufacture 32(1), 83-90 (1992). 56. Feser, T., Stoyanov, P., Mohr, F., Dienwiebel, M.: The Running-in Mechanisms of Binary Brass
Studied by In-situ Topography Measurements. Wear 303, 465-472 (2013). 57. Rowe, G.W., Kaliszer, H., Trmal, G., Cotter, A.: Running-in of Plain Bearings. Wear 34(1), 1-14 (1975). 58. Myshkin, N.K.: Friction Transfer Film Formation in Boundary Lubrication. Wear 245, 116-124 (2000). 59. Kerridge, M., Lancaster, J.K.: The Stages in a Process of Severe Metallic Wear. Proceedings of the
Royal Society of London, 250-264 (1956). 60. Amirat, M., Zaidi, H., Djamai, A., Necib, D., Eyidi, D.: Influence of the Gas Environment on the
Transferred Film of the Brass (Cu64Zn36)/steel AISI 1045 Couple. Wear 267, 433-440 (2009). 61. Schofer, J., Rehbein, P., Stolz, U., Lohe, D., Zum Gahr, K.-H.: Formation of Tribochemical Films and
White Layers on Self-Mated Bearing Steel Surfaces in Boundary Lubricated Sliding Contact. Wear 248, 7-15 (2001).
62. Nosovsky, M.: Entropy in Tribology: in the Search for Applications. Entropy 12, 1345-1390 (2010).

C-28

Paper D


Generation of Wear Particles and Running-In in Mixed
Lubricated Sliding Contacts
Aydar Akchurin1,2, Rob Bosman2, Piet M. Lugt2,3
1Materials innovation institute (M2i)
P.O. Box 5008
2600 GA DELFT
The Netherlands
2Department of Engineering Technology,
Laboratory for Surface Technology and Tribology,
University of Twente,
P.O. Box 217
7500 AE Enschede
The Netherlands
3SKF Engineering & Research Centre
Kelvinbaan 16
3439 MT Nieuwegein, The Netherlands

D-2
Nomenclature
𝑓𝐶𝑏 friction coefficient in boundary lubrication, [−]
𝑅 radius of the cylinder, [𝑚]
𝐹𝑇 total applied load, [𝑁]
𝐹𝐶 load carried by surface contacts, [𝑁]
𝐹𝐻 load carried by the hydrodynamic film,[𝑁]
𝐹𝑠ℎ lubricant shear force, [𝑁]
𝜇 kinematic viscosity of the lubricant, [𝑃𝑎 ∙ 𝑠]
𝛼 pressure-viscosity coefficient, [1
𝐺𝑃𝑎]
ℎ(𝑥, 𝑦) hydrodynamic film thickness, [𝑚]
ℎ0 hydrodynamic approach, [𝑚]
𝑃𝐻(𝑥, 𝑦) hydrodynamic pressure, [𝑃𝑎]
𝑝(𝑥, 𝑦) contact pressure, [𝑃𝑎]
𝑢(𝑥, 𝑦) deflection due to pressure 𝑝(𝑥, 𝑦), [𝑚]
𝐻 hardness of the substrate, [𝑃𝑎]
𝜎𝑦 yield stress, [𝑃𝑎]
𝐸1, 𝐸2 Young’s modulus of the cylinder and the substrate,
[𝑃𝑎]
𝜈1, 𝜈2 Poisson’s ratio of the cylinder and the substrate, [−]
𝐸′
composite Young’s modulus, [𝑃𝑎]
2
𝐸′=1 − 𝜈1
2
𝐸1+1 − 𝜈2
2
𝐸2
𝑧(𝑥, 𝑦) measured surface roughness, [𝑚]
ℎ𝑠(𝑥, 𝑦) separation distance between the bodies, [𝑚]

D-3
𝐴𝑐 Direct contact area, [𝑚2]
𝐾, 𝑆
influence matrices for the surface deflection due to
normal and tangential surface stresses, [𝑚
𝑃𝑎]
𝜎𝑖𝑗 subsurface stress, [𝑃𝑎]
𝐹𝑁𝑖𝑗,𝐹𝑆𝑖𝑗 influence matrices for subsurface stress calculation
due to normal and tangential surface stresses, [−]
Abstract
A new model was developed for the simulation of wear particles formation in
mixed lubricated sliding contacts. The contact simulations are based on a previously
developed half-space algorithm coupled with a numerical elasto-hydrodynamic
lubrication solver utilizing the load sharing concept. A particle removal criterion based
on a critical Von Mises stress and a geometrical boundary condition was successfully
implemented. The resulting model allows for the determination of the shape and size
of the particles generated under different conditions. The model was applied to the
simulation of running-in and validated using experimental measurements of the initial
and run-in friction coefficient in a mixed lubricated sliding line contact. A good
agreement with the experiment was observed. Additionally, dynamic light scattering
(DLS) measurements of the wear particles size were performed and compared to the
simulation data.
1. Introduction
The wear process in tribological contacts results in the generation of particles
of various size and shape. Besides the mechanical damage, the particles may
influence the performance of the tribological system in other ways. In grease lubricated
systems particles can have an impact on the grease life since thickener and base oil

D-4
oxidation is accelerated by metal wear particles [1,2]. An autoimmune reaction was
found to be dependent on the size and number of formed wear UHMWPE fragments
in artificial joint replacements [3,4]. Additionally, environmental effects may also be
important [5].
Since the wear process involves various complex phenomena, development of
a generic wear model is problematic. Meng and Ludema [6] identified 182 equations
for different types of wear developed over the years. Among them were empirical
relations, contact mechanics-based approaches, and equations based on material
failure mechanisms.
The latter models are based on the contact stresses and strains and are typically
either fully numerical or semi-analytical. Fully numerical models are commonly based
on the Finite Element Method (FEM) [7,8] and are applied to simplified cases due to
the high computational costs. Semi-analytical codes (based on boundary element
method, BEM), on the other hand, assume the surfaces to be semi-infinite solids [9,10].
The higher accuracy compared to the analytical models (applicable only in specific
cases) and the significantly lower computational costs compared to FEM, made this
approach widely used for contact, friction and wear simulations, see for example [11-
13]. Here, one of the major drawbacks is the assumption of homogeneous elastic
material behavior in a least discrete layers [14,15].
To calculate the local wear volume, BEM may be combined with a local variant
of Archard’s wear law [16,17]. However, to model wear particles generation rather than
wear volume, it is necessary to define a material rupture criterion. A number of material
rupture criteria can be found in the literature, including the critical accumulated
dissipated energy [18], critical accumulated plastic strain [19], critical accumulated
damage [20], critical Von Mises stress [21] and their variations [22-25].

D-5
A number of models were developed to simulate wear particles generation in
dry or boundary lubricated contacts. Nelias et al. [26] proposed a wear model based
on the accumulated plastic strain criterion to find regions of potential wear. Here it
should be noted that the simulation of wear particle generation requires a dense mesh
and the calculation time can be very high, especially since subsurface plasticity is
considered. The application of a stress based criterion is computationally more efficient
compared to strain based approach and is therefore preferred for practical
applications. In the stress based approach, the particle is formed, if the critical stress
is exceeded and yield stress is frequently used as the critical value. Bosman and
Schipper [21] used a Von Mises stress based criterion (with a yield stress as a critical
value) to simulate the wear particles generation and to predict the severity of adhesive
wear. Recently, Aghababaei et al. [27] used Molecular Dynamic (MD) simulations to
discriminate two wear particle generation regimes: by fracture or atom-by-atom. They
found that the yield stress can be used in a simple material rupture criterion to fit the
MD simulations. An excellent agreement of the model results with the Atomic Force
Microscopy (AFM) experiments was reported. Akchurin et al. [28] applied a Von Mises
stress based criterion to calculate the wear particles size and shape for boundary
lubricated contacts and a good agreement with the experimental data obtained using
DLS and AFM was observed.
In mixed lubricated conditions a fraction of the load is carried by the lubricant.
The lubrication conditions therefore have an impact on the shear stress on the surface
and hence on the subsurface stress distribution. This has an impact on the size and
shape of the generated wear particles. There are two general approaches for the
calculation of the load distribution in mixed lubricated contacts: rough elasto-
hydrodynamic lubrication (EHL) theory based methods and load sharing concept

D-6
models [29,30]. In the first group, the governing lubricant flow and surface deformation
equations are solved numerically using a discretized rough surface in both the
Reynolds and the solid deflection equations [31,32]. Although more accurate, these
models encounter certain problems in the “thin film lubrication regime”, such as
convergence, accuracy and mesh-dependence [33,34]. Also the exact value of the
minimum film thickness at which the film collapses is still a point of discussion [35].
Next to this, an accurate estimation of wear particles requires dense meshes and the
computation effort of full numerical solutions may therefore become very high. On the
other hand, load sharing models, first introduced by Johnson [36], offer advantages of
robustness and a relatively simple methodology, without the need to determine an
(arbitrary) chosen film collapse parameter. In these models the problem is split up into
two separate problems: a smooth surface hydrodynamic lubrication problem and a dry
rough contact problem, for details see [37,38]. The load sharing concept was used by
Bartel et al. [39] along with an energy threshold based wear model to predict the
volumetric wear loss in mixed lubrication. Prediction of the friction coefficient in mixed
lubrication based on a load sharing approach was reported in [40].
Morales-Espejel et al. [41,42] combined a cumulative damage model and a local
Archard wear equation to simulate mild wear. They found a good qualitative agreement
with the experimental data in the prediction of the size of micro-pits [41] and the
topography evolution [43]. This approach is required for the simulation of the evolution
of surfaces as a function of time. However, in the current paper, the objective is to
predict the particle size formed during running-in and to estimate the ultimate surface
roughness (process roughness) after running-in. The running-in time is therefore not
predicted, which simplifies the approach.

D-7
The major goal of the current work is to predict the size of the wear particles
generated in mixed lubricated contacts during running-in and to obtain the stable
running conditions, e.g. disregarding the timescale of the damage accumulation
process. The main interest is on metal-steel materials and running conditions
encountered in rolling element – cage contacts in bearings. An engineering algorithm
based on Von Mises stress was used to model the wear particles generation, as
presented in [28]. There are two conditions to be met for a wear particle to form in a
certain volume: firstly, Von Mises stress should exceed the yield stress and secondly
the volume should reach up to the free surface, see Fig. 1. This wear model was
coupled with a load sharing based friction model developed by the authors earlier [40].
Validation of the proposed model was done using experimental measurement of the
initial and run-in friction coefficients and the particle size measurement.
Fig. 1. Wear particle removal (reprinted from [28]).
2. Problem Formulation and Solution Methods
2.1. Friction Model in Mixed Lubrication
In mixed lubricated conditions, a part of the load is carried by the solid contact
(contacting asperities) and a part is carried by a lubricant film. To predict the formation
of a wear particle, it is necessary to obtain the stress state in the loaded body. In the
current work, this was accomplished using the load sharing concept firstly introduced

D-8
by Johnson [36] and the current algorithm is based on the same physical
approximation. The half-space approximation based dry contact model and a
numerical elasto-hydrodynamic (EHL) model for smooth surfaces were implemented,
which were shown to significantly improve the accuracy of the original approach used
by Johnson [40]. This model has been extensively described in [45]. However, to make
this paper easier to read, the major steps are repeated below.
The lubrication model consists of the classical system of smooth transient line
contact EHL equations:
{
𝜕
𝜕𝑥(ℎ3
12𝜇
𝜕𝑃𝐻
𝜕𝑥) − 𝑈
𝜕ℎ
𝜕𝑥−𝜕ℎ
𝜕𝑡= 0
𝐹𝐻 = ∫𝑃𝐻(𝑥)𝑑𝑥
ℎ(𝑥) = ℎ0 +𝑥2
2𝑅−
4
𝜋𝐸′∫𝑃𝐻(𝑥
′)ln (𝑥 − 𝑥′) 𝑑𝑥′
, (1)
where 𝑈 = (𝑈1 + 𝑈2)/2, 𝑈1 and 𝑈2 are the velocities of the moving surfaces.
This system is solved numerically to obtain film thickness ℎ, hydrodynamic pressure
𝑃𝐻 and hydrodynamic load 𝐹𝐻.
From the calculated film thickness ℎ, the separating distance ℎ𝑠 between the
two rough surfaces can be calculated. The separating distance determines the contact
force 𝐹𝐶 according to the following system of equations:
{
𝑢(𝑥, 𝑦) = 𝑧(𝑥, 𝑦) − ℎ𝑠(𝑥, 𝑦), ∀ 𝑥, 𝑦 ∈ 𝐴𝑐
𝑝(𝑥, 𝑦) > 0, ∀ 𝑥, 𝑦 ∈ 𝐴𝑐𝑝(𝑥, 𝑦) ≤ 𝐻
𝐹𝐶 = ∬𝑝(𝑥, 𝑦) 𝑑𝑥𝑑𝑦
, (2)
where the deflection 𝑢(𝑥, 𝑦) is related to the pressure according to half-space
approximation [9]:
𝑢(𝑥, 𝑦) = (𝐾 + 𝑓𝐶𝑏 ∙ 𝑆) ⊗ 𝑝, (3)

D-9
where the tangential stress is 𝑓𝐶𝑏 ∙ 𝑝. The corresponding influence functions can be
found in reference [12]. The systems (1) (EHL) and (3) (dry) are solved iteratively, until
the load balance condition is met:
𝐹𝑇 = 𝐹𝐶 + 𝐹𝐻. (4)
The friction coefficient is then calculated according to [40]:
𝑓𝐶 = (𝑓𝐶𝑏𝐹𝐶 + 𝐹𝑠ℎ) 𝐹𝑇⁄ , (5)
where 𝑓𝐶𝑏 has to be obtained experimentally and 𝐹𝑠ℎ is obtained by integrating
hydrodynamic shear stress.
2.2. Wear Model
Once the contact pressure is known, the subsurface stresses can be calculated
using the half-space approximation.
The stress field is calculated according to [44]:
𝜎𝑖𝑗(𝑥, 𝑦, 𝑧) = (𝐹𝑁𝑖𝑗 + 𝐹𝑆𝑖𝑗) ⊗ 𝑝, (6)
A Von Mises stress based wear particle formation criterion was used, following
Bosman et al. [21] and validated for boundary lubricated conditions in reference [28].
2.3. Combined Model
The wear and friction models were combined as shown in Fig. 2. First, the parts
of the total load carried by the solid contacts and by the lubricant film were calculated
using the load sharing concept (also the friction coefficient was calculated here).
Further, based on the load carried by the asperities and calculated contact pressure,
the Von Mises stress was obtained and the wear particle formation criterion was
checked. Finally, the surfaces were updated to account for wear. This process
continued until the surface roughness reached the steady state.
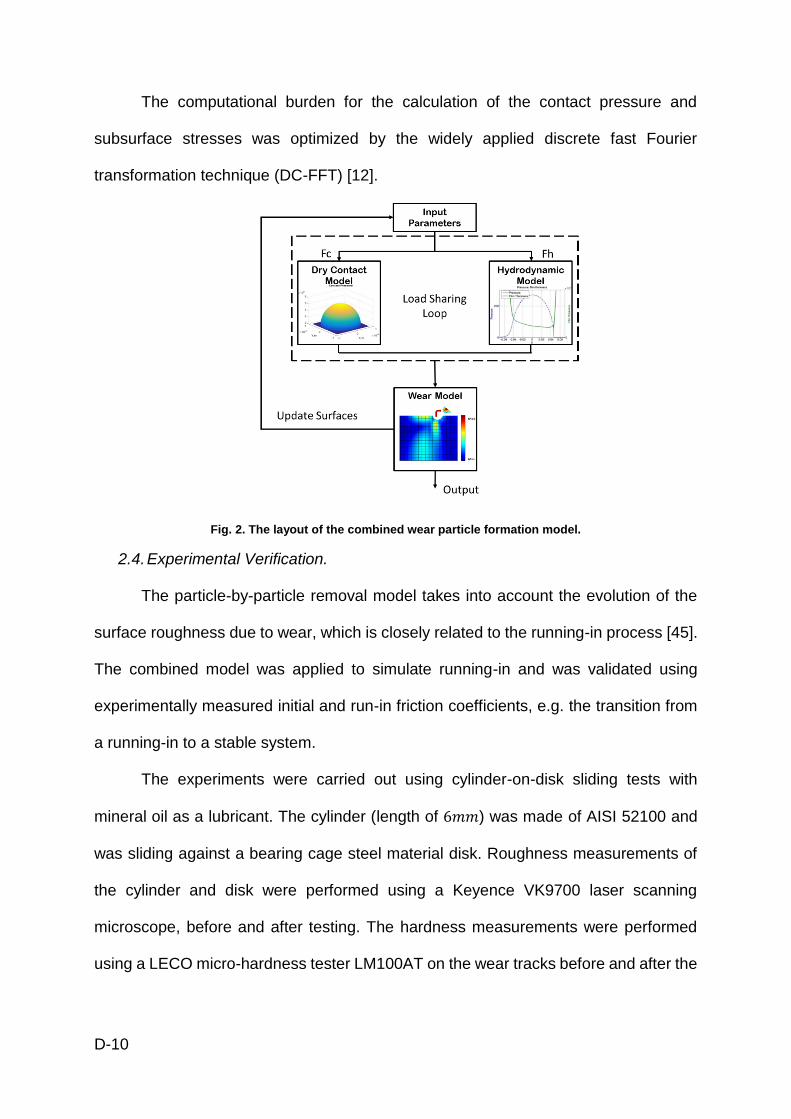
D-10
The computational burden for the calculation of the contact pressure and
subsurface stresses was optimized by the widely applied discrete fast Fourier
transformation technique (DC-FFT) [12].
Fig. 2. The layout of the combined wear particle formation model.
2.4. Experimental Verification.
The particle-by-particle removal model takes into account the evolution of the
surface roughness due to wear, which is closely related to the running-in process [45].
The combined model was applied to simulate running-in and was validated using
experimentally measured initial and run-in friction coefficients, e.g. the transition from
a running-in to a stable system.
The experiments were carried out using cylinder-on-disk sliding tests with
mineral oil as a lubricant. The cylinder (length of 6𝑚𝑚) was made of AISI 52100 and
was sliding against a bearing cage steel material disk. Roughness measurements of
the cylinder and disk were performed using a Keyence VK9700 laser scanning
microscope, before and after testing. The hardness measurements were performed
using a LECO micro-hardness tester LM100AT on the wear tracks before and after the

D-11
test. It was found that the hardness did not change noticeably after the wear test. The
material properties are given in Table 1.
Table 1. Properties of the materials.
Property Cylinder Disk, steel
𝐸, GPa 210 210
𝜈 0.3 0.3
𝐻, GPa 6 1.08
𝜎𝑦, GPa 2.14 0.39
𝑅, mm 2
𝑅𝑞, nm 55 120
A mineral oil (Shell Vitrea) was used, see Table 2. The tests were performed at
room temperature 25° C. The coefficient of friction was measured at various sliding
velocities at a fixed normal load of 5.5N (nominal contact pressure 102 MPa), resulting
in a representative Stribeck curve. To obtain this curve the friction was measured 3
times and then averaged at each sliding speed. The friction coefficient was measured
for 4 hours and in all cases it stabilized by the end of the test. For the comparison with
the theoretical model, two levels of friction were used: initial and stabilized (after run-
in).
Table 2. Oil Properties.
α, 1/GPa dynamic viscosity (at 25° C), Pa s
25 0.36
The size of the wear particles was analyzed using DLS technique as part of the
validation of the presented model. After a test at 0.01 m/s sliding velocity, the wear
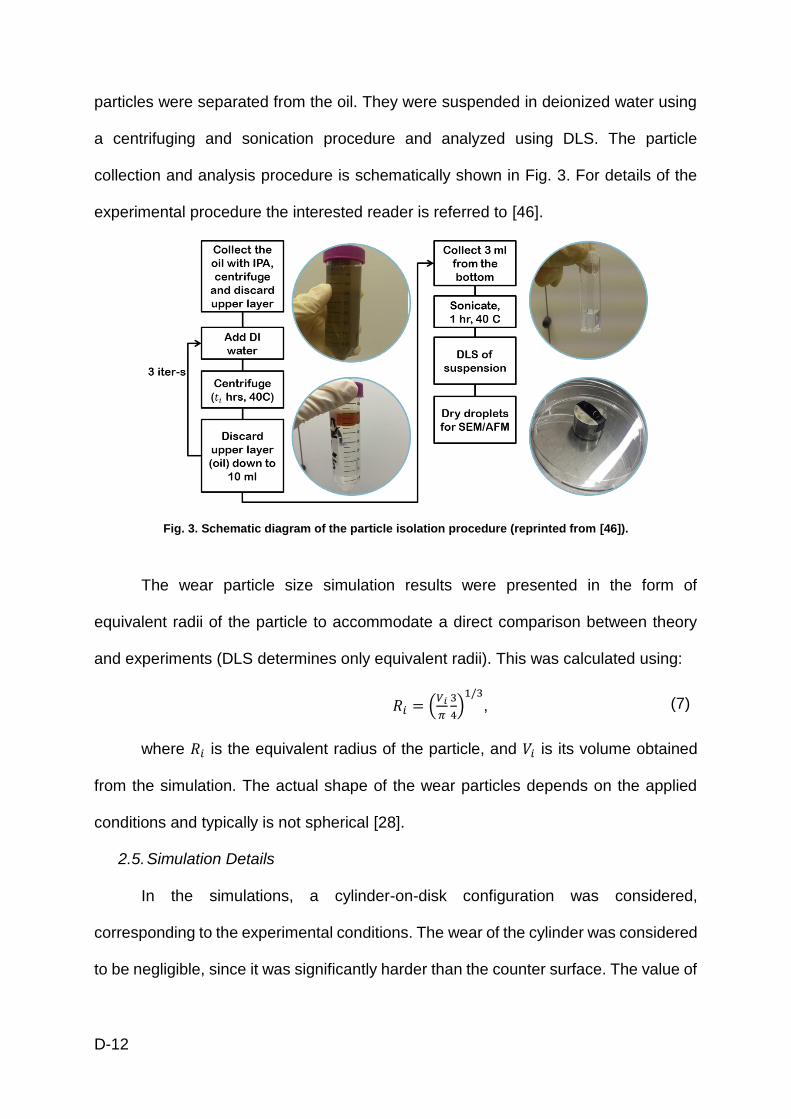
D-12
particles were separated from the oil. They were suspended in deionized water using
a centrifuging and sonication procedure and analyzed using DLS. The particle
collection and analysis procedure is schematically shown in Fig. 3. For details of the
experimental procedure the interested reader is referred to [46].
Fig. 3. Schematic diagram of the particle isolation procedure (reprinted from [46]).
The wear particle size simulation results were presented in the form of
equivalent radii of the particle to accommodate a direct comparison between theory
and experiments (DLS determines only equivalent radii). This was calculated using:
𝑅𝑖 = (𝑉𝑖
𝜋
3
4)1/3
, (7)
where 𝑅𝑖 is the equivalent radius of the particle, and 𝑉𝑖 is its volume obtained
from the simulation. The actual shape of the wear particles depends on the applied
conditions and typically is not spherical [28].
2.5. Simulation Details
In the simulations, a cylinder-on-disk configuration was considered,
corresponding to the experimental conditions. The wear of the cylinder was considered
to be negligible, since it was significantly harder than the counter surface. The value of
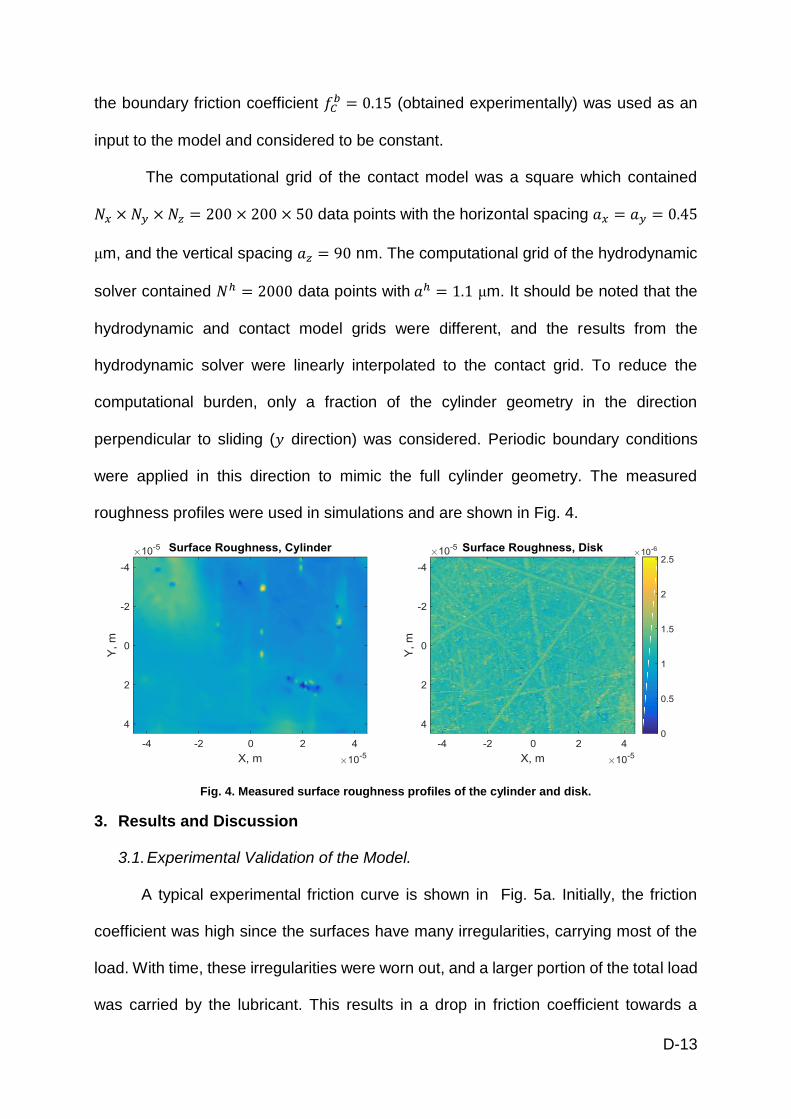
D-13
the boundary friction coefficient 𝑓𝐶𝑏 = 0.15 (obtained experimentally) was used as an
input to the model and considered to be constant.
The computational grid of the contact model was a square which contained
𝑁𝑥 × 𝑁𝑦 ×𝑁𝑧 = 200 × 200 × 50 data points with the horizontal spacing 𝑎𝑥 = 𝑎𝑦 = 0.45
μm, and the vertical spacing 𝑎𝑧 = 90 nm. The computational grid of the hydrodynamic
solver contained 𝑁ℎ = 2000 data points with 𝑎ℎ = 1.1 μm. It should be noted that the
hydrodynamic and contact model grids were different, and the results from the
hydrodynamic solver were linearly interpolated to the contact grid. To reduce the
computational burden, only a fraction of the cylinder geometry in the direction
perpendicular to sliding (𝑦 direction) was considered. Periodic boundary conditions
were applied in this direction to mimic the full cylinder geometry. The measured
roughness profiles were used in simulations and are shown in Fig. 4.
Fig. 4. Measured surface roughness profiles of the cylinder and disk.
3. Results and Discussion
3.1. Experimental Validation of the Model.
A typical experimental friction curve is shown in Fig. 5a. Initially, the friction
coefficient was high since the surfaces have many irregularities, carrying most of the
load. With time, these irregularities were worn out, and a larger portion of the total load
was carried by the lubricant. This results in a drop in friction coefficient towards a

D-14
steady-state value. The curves were used to find the initial friction by taking the
average of the first 1% of the data points and the run-in friction coefficient by taking the
average of the last 5% of the data points.
Fig. 5. Friction coefficient at 0.05 m/s sliding speed a) measured curve b) calculated curve.
A typical friction curve obtained using the model is shown in Fig. 5b. Here the
wear simulations were performed for 200 iterations at each sliding speed, which was
found to be enough to get a stable friction coefficient. The iterations on the x-axis do
not refer to time and these curves were therefore only used to determine the initial
friction (the first calculated friction value) and the run-in friction coefficient (by taking
the average of the 10 last data points). The Stribeck curves were subsequently built
using the initial and run-in friction coefficients for both the experimental and theoretical
data, see Fig. 6. Note that all three lubrication regimes are present in the curves:
boundary (BL), mixed (ML) and full film lubrication (EHL). Prediction of the initial friction
coefficient by the model is in a reasonable agreement with the experimental data for
both the initial and run-in friction coefficient. It can be noticed that for the sliding speeds
of 0.03 and 0.05 m/s, the model underestimates the friction. This is ascribed to the
roughening of the surface due to abrasive wear of particles re-entering the contact, an
effect that is not included in the model.
a b
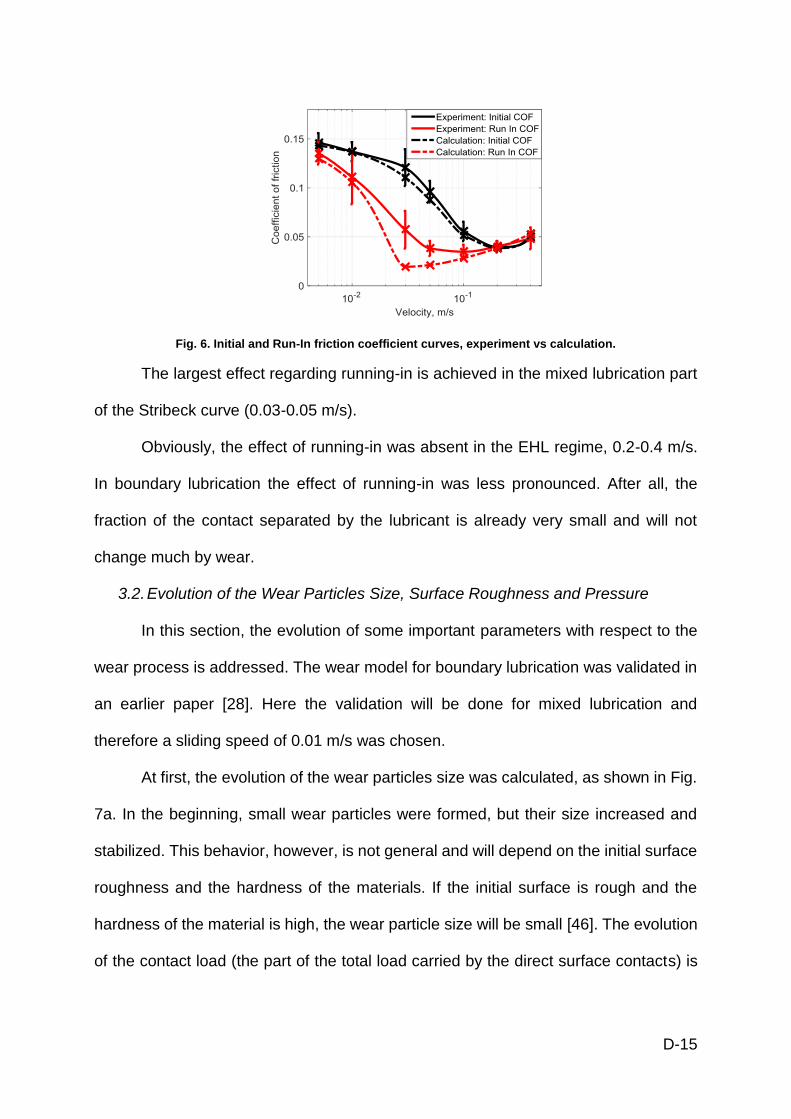
D-15
Fig. 6. Initial and Run-In friction coefficient curves, experiment vs calculation.
The largest effect regarding running-in is achieved in the mixed lubrication part
of the Stribeck curve (0.03-0.05 m/s).
Obviously, the effect of running-in was absent in the EHL regime, 0.2-0.4 m/s.
In boundary lubrication the effect of running-in was less pronounced. After all, the
fraction of the contact separated by the lubricant is already very small and will not
change much by wear.
3.2. Evolution of the Wear Particles Size, Surface Roughness and Pressure
In this section, the evolution of some important parameters with respect to the
wear process is addressed. The wear model for boundary lubrication was validated in
an earlier paper [28]. Here the validation will be done for mixed lubrication and
therefore a sliding speed of 0.01 m/s was chosen.
At first, the evolution of the wear particles size was calculated, as shown in Fig.
7a. In the beginning, small wear particles were formed, but their size increased and
stabilized. This behavior, however, is not general and will depend on the initial surface
roughness and the hardness of the materials. If the initial surface is rough and the
hardness of the material is high, the wear particle size will be small [46]. The evolution
of the contact load (the part of the total load carried by the direct surface contacts) is
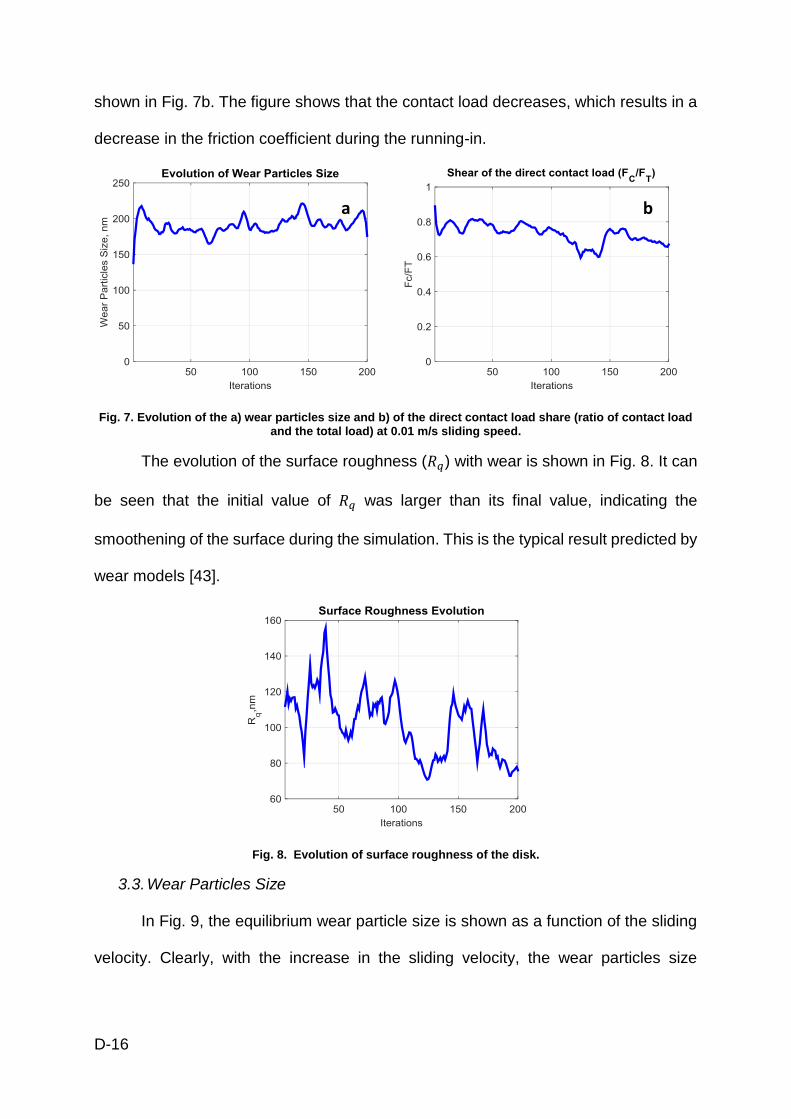
D-16
shown in Fig. 7b. The figure shows that the contact load decreases, which results in a
decrease in the friction coefficient during the running-in.
Fig. 7. Evolution of the a) wear particles size and b) of the direct contact load share (ratio of contact load and the total load) at 0.01 m/s sliding speed.
The evolution of the surface roughness (𝑅𝑞) with wear is shown in Fig. 8. It can
be seen that the initial value of 𝑅𝑞 was larger than its final value, indicating the
smoothening of the surface during the simulation. This is the typical result predicted by
wear models [43].
Fig. 8. Evolution of surface roughness of the disk.
3.3. Wear Particles Size
In Fig. 9, the equilibrium wear particle size is shown as a function of the sliding
velocity. Clearly, with the increase in the sliding velocity, the wear particles size
a b

D-17
decreased and at speeds larger than 0.03 m/s, after running-in, full film lubrication was
obtained resulting in no wear particles.
Fig. 9. Equilibrium wear particles size as a function of sliding speed.
To validate the presented model, DLS measurements of the wear particles
collected after test at 0.01m/s were performed. The size of the wear particles according
to the model is 200 nm, whereas the DLS results gave 223±13 nm. The agreement is
considered to be good.
3.4. Influence of Hardness on the Running-In Behavior
To investigate the influence of the hardness on the severity of running-in the
hardness of the disk and load were varied. The sliding speed was fixed at 0.01 m/s
and the hardness of the disk varied from 700 MPa to 5 GPa. The result is shown in
Fig. 10.
Fig. 10. Theoretical run-in friction coefficient as a function of hardness at 0.01 m/s sliding speed.

D-18
It can be seen that there was a clear minimum in the run-in friction coefficient.
This result can be explained by the following consideration. If the hardness and
therefore the yield stress is high enough, the contact is an elastic state. Hence, there
is no running-in taking place and the friction stays high. On the other hand, if the
hardness is very low, very large wear particles form and create deep pits on the
surface. These pits, in turn, retain large volumes of the lubricant and bring the surfaces
closer to each other and more irregularities come into direct contact. This results in an
increase in the friction coefficient. Therefore, there exists an optimum value of
hardness (and wear particle size), which gives the running-in effect an optimum
depending on the surface hardness of the softer body (run-in friction coefficient
minimized). The effect is similar to the effect of surface texturing: there exists an
optimum depth of the texture feature to provide the maximum film thickness in the
contact [47]. If the size of the texture is larger or lower than the optimum, the film
thickness is decreased. The optimum value’s range will depend on the applied
conditions and the surface roughness of the harder body, but not the initial roughness
of the softer body. Minor influence of the initial roughness of the softer body on the
running-in is also documented in the literature [48]. As discussed in the reference [28],
the initial roughness of the softer body does not change the size of wear particles in
stationary running-in conditions and, according to the theory presented here, cannot
affect the run in friction coefficient. It should also be noted that the effect of directionality
of the surface roughness is not taken into account in the presented hydrodynamic
model. This can be partly improved by incorporation of flow factors into the lubrication
model [49,50].

D-19
4. Conclusion
The generation of the wear particles was efficiently modeled using a half-space
approximation approach. The load sharing concept was employed to identify the
fraction of the total load carried by the lubricant film and that of the solid contacts. This
was then used to calculate the shear stresses (friction), which, in combination with the
normal stresses, give the total stress field. A wear particle is then generated if the Von
Mises stress exceeds the yield stress and if the volume reaches up to the free surface.
The model was validated using experimental measurements of friction and its
evolution with the running-in process. A reasonable agreement was observed, proving
the possibility to simulate the running-in due to the surface roughness wear using the
presented wear model. Since the surface roughness evolution is correlated to the wear
particles size, the agreement in the predicted evolution of friction due to roughness,
may indirectly indicate the validity of the particles size estimation. In addition, DLS
measurement of wear particles size was performed and compared to the simulations
and previously reported results and a reasonable agreement was observed.
For the particular combination of materials and lubricant considered in this
paper, the surface roughness evolution was the main component of the running-in
process. Simulations showed the existence of an optimum hardness range, which
ensures the minimum friction coefficient after the running-in.
Acknowledgements
This research was carried out under project number M21.1.11450 in the
framework of the Research Program of the Materials innovation institute M2i. The
authors would like to thank SKF Engineering & Research Centre, Nieuwegein and
Bosch Transmission Technology BV, Tilburg, the Netherlands for providing technical
and financial support.

D-20
Bibliography
1. Hurley, S., Cann, P., M., Spikes, H.,A.: Lubrication and Reflow Properties of Thermally Aged Greases. Tribology Transactions 43(2), 221-228 (2008).
2. Jin, X.: The Effect of Contamination Particles on Lithium Grease Deterioration. Lubrication Science 7(3) (1995).
3. MacQuarrie, R.A., Chen, Y.F., Coles, C., Anderson, G.I.: Wear-Particle–Induced Osteoclast Osteolysis: the Role of Particulates and Mechanical Strain. Journal of Biomedical Materials Research. Part B, Applied Biomaterials 69B, 104-112 (2004).
4. Green, T.R., Fisher, J., Stone, M., Wroblewski, B.M., Ingham, E.: Polyethylene Particles of a “Critical Size” are Necessary for the Induction of Cytokines by Macrophages in Vitro. Biomaterials 19, 2297-2302 (1998).
5. Olofsson, U., Olander, L., Jansson, A.: Towards a Model for the Number of Airborne Particles Generated from a Sliding Contact. Wear 267, 2252-2256 (2009).
6. Meng, H., C., Ludema K.,C.: Wear Models and Predictive Equations: Their Form and Content. 181-183 (1995).
7. Holmberg, K., Laukkanen, A., Ghabchi, A., Rombouts, M., Turunen, E., Waudby, R., Suhonen, T., Valtonen, K., Sarlin, E.: Computational Modelling Based Wear Resistance Analysis of Thick Composite Coatings. Tribology International 72, 13-30 (2014).
8. Molinari, J.F., Ortiz, M., Radovitzky, R., Repetto, E.A.: Finite-Element Modeling of Dry Sliding Wear in Metals. Engineering Computations 18(3/4), 592-609 (2001).
9. Timoshenko, S.P., Goodier, J.N.: Theory of Elasticity, 3-rd ed. McGraw-Hill, New York (1970) 10. Tian, X., Bhushan, B.: A numerical three-dimensional model for the contact of rough surfaces by
variational principle. Journal of Tribology 118, 33-42 (1996). 11. Bosman, R., de Rooij, M.B.: Transient Thermal Effects and Heat Partition in Sliding Contacts. Journal
of Tribology 132 (2010). 12. Liu, S.: Thermomechanical Contact Analysis of Rough Bodies. PhD thesis., Northwestern University
(2001) 13. Polonsky, I.A., Keer, L.M.: A numerical method for solving rough contact problems based on the
multi-level multi-summation and conjugate gradient techniques. Wear 231, 206-219 (1999). 14. O’Sullivan, T.C., King, R.B.: Sliding Contact Stress Field Due to a Spherical Indenter on a Layered
Elastic Half-Space. Journal of Tribology 110(2), 235-240 (1988). doi:10.1115/1.3261591 15. Liu, S., Wang, Q.: Studying Contact Stress Fields Caused by Surface Tractions with a Discrete
Convolution anf Fast Fourier Transform Algorithm. Journal of Tribology 124(1), 36-45 (2002). 16. Bosman, R., Schipper, D.J.: On the Transition from Mild to Severe Wear of Lubricated, Concentrated
Contacts: the IRG (OECD) Transition Diagram. Wear 269(7-8), 581-589 (2010). 17. Jerbi, H., Nelias, D., Baietto, M.-C.: Semi-Analytical Model for Coated Contacts. Fretting Wear
Simulation. In: Leeds-Lyon Symposium on Tribology, Lyon, France 2015 18. De Moerlooze, K., Al-Bender, F., Van Brussel, H.: A Novel Energy-Based Generic Wear Model at the
Asperity Level. Wear 270(11-12), 760-770 (2011). 19. Boher, C., Barrau, O., Gras, R., Rezai-Aria, F.: A Wear Model Based on Cumulative Cyclic Plastic
Straining. Wear 267(5-8), 1087-1094 (2009). 20. Behesthi, A., Khonsari, M.,M.: An Engineering Approach for the Prediction of Wear in Mixed
Lubricated Contacts. 308 (2013). 21. Bosman, R., Schipper, D., J.: Transition from Mild to Severe Wear Including Running in Effects. Wear
270(7-8), 472-478 (2011). 22. Huq, M., Z., Celis, J.-P.: Expressing Wear Rate in Sliding Contacts Based on Dissipated Energy. Wear
252(5-6), 375-383 (2002). 23. Aghdam, A.B., Khonsari, M.M.: On the correlation between wear and entropy in dry sliding contact.
Wear 270(11-12), 781-790 (2011). doi:DOI 10.1016/j.wear.2011.01.034 24. Ajayi, O., O., Lorenzo-Martin, C., Erck, R.,A., Fenske, G.,R.: Analytical Predictive Modeling of Scuffing
Initiation in Metallic Materials in Sliding Contact. 301 (2013).
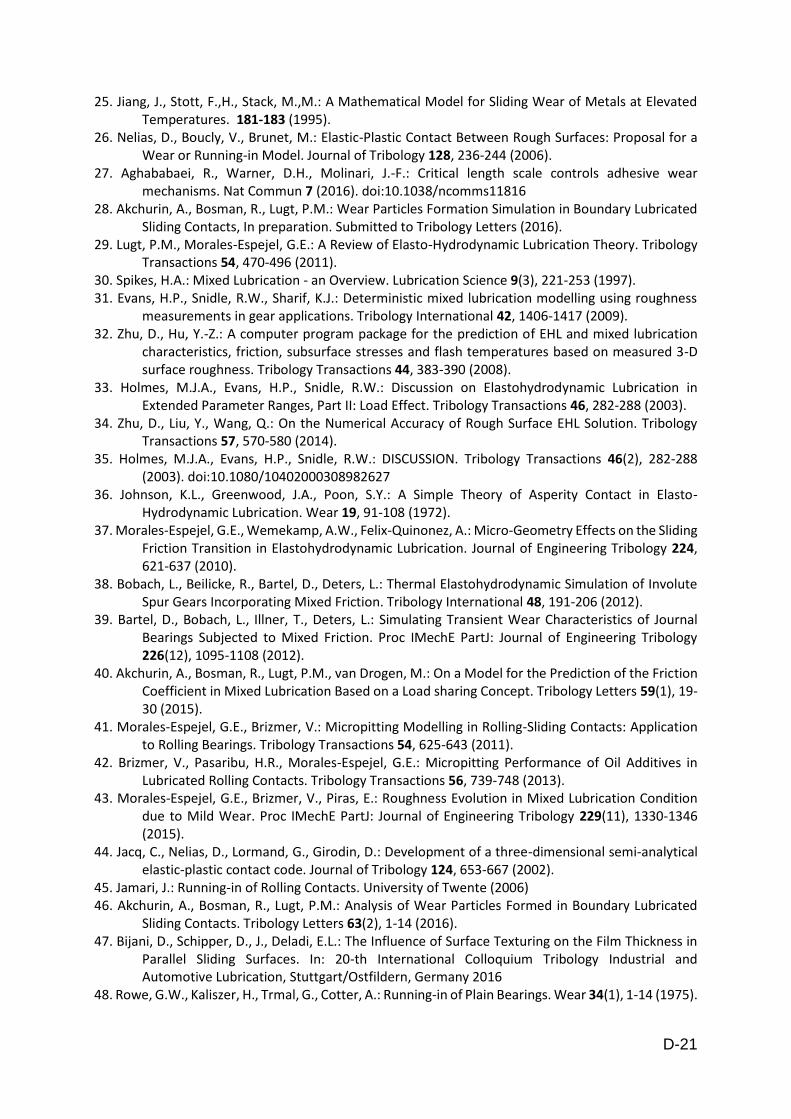
D-21
25. Jiang, J., Stott, F.,H., Stack, M.,M.: A Mathematical Model for Sliding Wear of Metals at Elevated Temperatures. 181-183 (1995).
26. Nelias, D., Boucly, V., Brunet, M.: Elastic-Plastic Contact Between Rough Surfaces: Proposal for a Wear or Running-in Model. Journal of Tribology 128, 236-244 (2006).
27. Aghababaei, R., Warner, D.H., Molinari, J.-F.: Critical length scale controls adhesive wear mechanisms. Nat Commun 7 (2016). doi:10.1038/ncomms11816
28. Akchurin, A., Bosman, R., Lugt, P.M.: Wear Particles Formation Simulation in Boundary Lubricated Sliding Contacts, In preparation. Submitted to Tribology Letters (2016).
29. Lugt, P.M., Morales-Espejel, G.E.: A Review of Elasto-Hydrodynamic Lubrication Theory. Tribology Transactions 54, 470-496 (2011).
30. Spikes, H.A.: Mixed Lubrication - an Overview. Lubrication Science 9(3), 221-253 (1997). 31. Evans, H.P., Snidle, R.W., Sharif, K.J.: Deterministic mixed lubrication modelling using roughness
measurements in gear applications. Tribology International 42, 1406-1417 (2009). 32. Zhu, D., Hu, Y.-Z.: A computer program package for the prediction of EHL and mixed lubrication
characteristics, friction, subsurface stresses and flash temperatures based on measured 3-D surface roughness. Tribology Transactions 44, 383-390 (2008).
33. Holmes, M.J.A., Evans, H.P., Snidle, R.W.: Discussion on Elastohydrodynamic Lubrication in Extended Parameter Ranges, Part II: Load Effect. Tribology Transactions 46, 282-288 (2003).
34. Zhu, D., Liu, Y., Wang, Q.: On the Numerical Accuracy of Rough Surface EHL Solution. Tribology Transactions 57, 570-580 (2014).
35. Holmes, M.J.A., Evans, H.P., Snidle, R.W.: DISCUSSION. Tribology Transactions 46(2), 282-288 (2003). doi:10.1080/10402000308982627
36. Johnson, K.L., Greenwood, J.A., Poon, S.Y.: A Simple Theory of Asperity Contact in Elasto-Hydrodynamic Lubrication. Wear 19, 91-108 (1972).
37. Morales-Espejel, G.E., Wemekamp, A.W., Felix-Quinonez, A.: Micro-Geometry Effects on the Sliding Friction Transition in Elastohydrodynamic Lubrication. Journal of Engineering Tribology 224, 621-637 (2010).
38. Bobach, L., Beilicke, R., Bartel, D., Deters, L.: Thermal Elastohydrodynamic Simulation of Involute Spur Gears Incorporating Mixed Friction. Tribology International 48, 191-206 (2012).
39. Bartel, D., Bobach, L., Illner, T., Deters, L.: Simulating Transient Wear Characteristics of Journal Bearings Subjected to Mixed Friction. Proc IMechE PartJ: Journal of Engineering Tribology 226(12), 1095-1108 (2012).
40. Akchurin, A., Bosman, R., Lugt, P.M., van Drogen, M.: On a Model for the Prediction of the Friction Coefficient in Mixed Lubrication Based on a Load sharing Concept. Tribology Letters 59(1), 19-30 (2015).
41. Morales-Espejel, G.E., Brizmer, V.: Micropitting Modelling in Rolling-Sliding Contacts: Application to Rolling Bearings. Tribology Transactions 54, 625-643 (2011).
42. Brizmer, V., Pasaribu, H.R., Morales-Espejel, G.E.: Micropitting Performance of Oil Additives in Lubricated Rolling Contacts. Tribology Transactions 56, 739-748 (2013).
43. Morales-Espejel, G.E., Brizmer, V., Piras, E.: Roughness Evolution in Mixed Lubrication Condition due to Mild Wear. Proc IMechE PartJ: Journal of Engineering Tribology 229(11), 1330-1346 (2015).
44. Jacq, C., Nelias, D., Lormand, G., Girodin, D.: Development of a three-dimensional semi-analytical elastic-plastic contact code. Journal of Tribology 124, 653-667 (2002).
45. Jamari, J.: Running-in of Rolling Contacts. University of Twente (2006) 46. Akchurin, A., Bosman, R., Lugt, P.M.: Analysis of Wear Particles Formed in Boundary Lubricated
Sliding Contacts. Tribology Letters 63(2), 1-14 (2016). 47. Bijani, D., Schipper, D., J., Deladi, E.L.: The Influence of Surface Texturing on the Film Thickness in
Parallel Sliding Surfaces. In: 20-th International Colloquium Tribology Industrial and Automotive Lubrication, Stuttgart/Ostfildern, Germany 2016
48. Rowe, G.W., Kaliszer, H., Trmal, G., Cotter, A.: Running-in of Plain Bearings. Wear 34(1), 1-14 (1975).
D-22
49. Patir, N., Cheng, H.S.: An Average Flow Model for Determining Effects of Three-Dimensional Roughness on Partial Hydrodynamic Lubrication. Journal of Lubrication Technology 100(1), 12-17 (1978). doi:10.1115/1.3453103
50. Sahlin, F., Almqvist, A., Larsson, R., Glavatskih, S.: Rough surface flow factors in full film lubrication based on a homogenization technique. Tribology International 40(7), 1025-1034 (2007). doi:http://dx.doi.org/10.1016/j.triboint.2006.09.007

Paper E


A Deterministic Stress-Activated Model for Tribo-Film Growth
and Wear Simulation
Aydar Akchurin1,2, Rob Bosman2, Piet M. Lugt2,3
1Materials innovation institute (M2i)
P.O. Box 5008
2600 GA DELFT
The Netherlands
2Department of Engineering Technology,
Laboratory for Surface Technology and Tribology,
University of Twente,
P.O. Box 217
7500 AE Enschede
The Netherlands
3SKF Engineering & Research Centre
Kelvinbaan 16
3439MT Nieuwegein, The Netherlands

E-2
Abstract
A new model was developed for the simulation of growth and wear of tribo-
chemical films by combining a Boundary Element Method (BEM) based contact model
and a stress-activated Arrhenius tribo-film growth equation. Using this methodology, it
is possible to predict the evolution and steady state thickness of the tribo-film (self-
limitation) at various operating conditions. The model was validated using two cases
for which experimental data was available in the literature. The first case is a single
microscopic contact consisting of a DLC coated AFM tip and an iron coated substrate.
The second case is a macro-scale contact between a bearing steel ball and disk.
Subsequently, mild wear (wear after running-in) was modeled by assuming diffusion of
the substrate atoms into the tribo-film.
Introduction
In tribological systems operating in the boundary or mixed lubrication regime,
protection of the surfaces from severe wear is frequently obtained by so called anti-
wear (AW) additives added to the base lubricant. Zinc dialkyldithiophosphate
(ZDDP) is one of the most widely used additives [1].
So far, it is well known that the antiwear mechanism of ZDDP is related to the
formation of a protective layer – generally called `tribo-film’. It is formed through the
chemical decomposition of ZDDP, it has a heterogeneous structure and it is up to
200nm thick [2]. The ZDDP tribo-film is typically observed at the surfaces of steels, but
was also found on the surfaces of other materials, such as aluminum-silicon alloys [3],
DLC [4], silicon [5], tungsten carbide [6] and ceramics [7]. The structure of the films
formed on various materials was reported to be similar [5,6,8]. In the case of steels, it
mainly consists of oxygen, phosphate, sulfide, zinc and iron, with an increase of the
concentration of iron closer to the bulk material [1,9]. The top surface may be covered

E-3
by an iron free zinc polyphosphate glass, which has a highly amorphous structure,
while the bulk is composed of pyro- or orthophosphate glasses [10].
There is consensus on the fact that the tribo-film is continuously worn and
replenished and has a sacrificial function [11,12]. The exact mechanism of its growth
and anti-wear action, are however still under debate [10]. According to the Hard and
Soft Acids and Bases theory (HSAB), hard abrasive iron oxide wear particles react with
phosphate glasses to form softer less abrasive iron sulphides [13], thus preventing
severe wear. Due to continuous generation and subsequent digestion of the oxide
particles (or surface oxide layers), the tribo-film is replenished [14]. The theory,
however, may not explain the generation of a tribo-film on non-ferrous surfaces, such
as DLC [4], silicon [5], other metals [6] and ceramics [7], although it was recently
hypothesized that HSAB may be applied in non-ferrous cases as well [15]. Based on
molecular dynamic simulations, Mosey et al. [16] concluded that a tribo-film is formed
due to pressure induced cross-linking of ZDDP molecules at pressures higher than
7GPa. However, such high pressures are higher than the yield stress of most materials
used in common engineering applications, so this is not realistic. It was also observed,
that tribo-films can grow at high temperatures (>150C) without any contact, suggesting
that the chemical reactions also take place due to thermal activation. However, in the
case of rubbing, the growth rate is much higher [17].
Initially, the tribo-film growth was described using an Arrhenius equation
[18,17]. However, Bulgarevich et al. [19], showed that this leads to very low (unrealistic)
activation energies. In a different paper, Bulgarevich et al. [20] introduced a stress
dependence to the Arrhenius equation by means of a multiplication factor [20]. Very
recently, Gosvami et al. [5] employed an Arrhenius equation where the activation
energy was made stress dependent. The equation was found to fit the growth of the
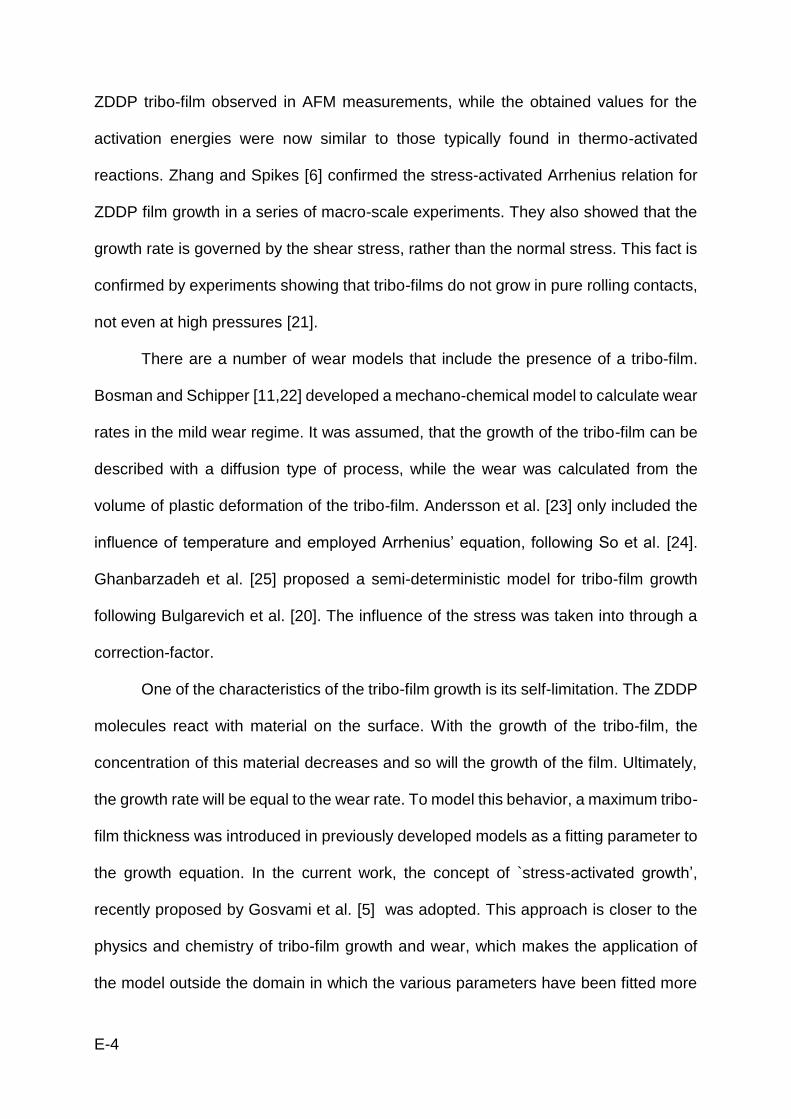
E-4
ZDDP tribo-film observed in AFM measurements, while the obtained values for the
activation energies were now similar to those typically found in thermo-activated
reactions. Zhang and Spikes [6] confirmed the stress-activated Arrhenius relation for
ZDDP film growth in a series of macro-scale experiments. They also showed that the
growth rate is governed by the shear stress, rather than the normal stress. This fact is
confirmed by experiments showing that tribo-films do not grow in pure rolling contacts,
not even at high pressures [21].
There are a number of wear models that include the presence of a tribo-film.
Bosman and Schipper [11,22] developed a mechano-chemical model to calculate wear
rates in the mild wear regime. It was assumed, that the growth of the tribo-film can be
described with a diffusion type of process, while the wear was calculated from the
volume of plastic deformation of the tribo-film. Andersson et al. [23] only included the
influence of temperature and employed Arrhenius’ equation, following So et al. [24].
Ghanbarzadeh et al. [25] proposed a semi-deterministic model for tribo-film growth
following Bulgarevich et al. [20]. The influence of the stress was taken into through a
correction-factor.
One of the characteristics of the tribo-film growth is its self-limitation. The ZDDP
molecules react with material on the surface. With the growth of the tribo-film, the
concentration of this material decreases and so will the growth of the film. Ultimately,
the growth rate will be equal to the wear rate. To model this behavior, a maximum tribo-
film thickness was introduced in previously developed models as a fitting parameter to
the growth equation. In the current work, the concept of `stress-activated growth’,
recently proposed by Gosvami et al. [5] was adopted. This approach is closer to the
physics and chemistry of tribo-film growth and wear, which makes the application of
the model outside the domain in which the various parameters have been fitted more

E-5
reliable. They assumed that the self-limitation is a result of the evolution of the
mechanical properties. When sliding starts, there is no tribo-film and the contact
pressure (and therefore tangential stress) at the asperity level is determined by the
hardness and Young’s modulus of the bulk material of the bodies in contact. Since
typically the substrates are harder and less compliant than the tribo-film, relatively high
pressures are generated. According to the stress-activated growth concept, high
contact pressure decreases the effective activation energy of the reaction and results
in a high reaction rate, i.e., a high tribo-film growth rate. With further development of
the film, the lower tribo-film hardness and/or Young’s modulus start to become relevant
and gradually reduce the contact pressure until the growth rate is balanced by the wear
rate. By using this concept it is possible to build a model to predict the growth of the
tribo-film up to its steady-state value.
In the current paper, a mechano-chemical model was developed to simulate the
tribo-film growth and concurrent wear in the presence of a ZDDP additive. The growth
rate of the tribo-film was calculated using a stress-activated Arrhenius equation. A
layered elastic-fully-plastic model was used to include the influence of the tribo-film on
the contact stress and its growth rate. The model was developed based on
experimental data available in the literature, i.e., measurements of tribo-film growth
under an AFM tip and in a macro-scale contact.
1. Numerical Model and Tribo-Film Growth
1.1. Layered Elastic Fully-Plastic Contact Models
In the current work, a layered elastic-fully plastic contact model was used for the
simulation of the tribo-film growth. The contact pressures can be obtained by solving
the following system of equations [26]:

E-6
{
𝑢(𝑥, 𝑦) = 𝑧(𝑥, 𝑦) − ℎ𝑠(𝑥, 𝑦), ∀ 𝑥, 𝑦 ∈ 𝐴𝑐
𝑝(𝑥, 𝑦) > 0, ∀ 𝑥, 𝑦 ∈ 𝐴𝑐𝑝(𝑥, 𝑦) ≤ 𝐻
𝐹𝐶 = ∬𝑝(𝑥, 𝑦) 𝑑𝑥𝑑𝑦
, (1)
where the deflection 𝑢(𝑥, 𝑦) can be calculated using the half-space
approximation [27]. The model was implemented using the discrete fast Fourier
transformation technique (DC-FFT) [28], since the deflection 𝑢(𝑥, 𝑦) is a discrete
convolution:
𝑢(𝑥, 𝑦) = (𝐾 + 𝑆)⊗ 𝑝, (2)
where 𝐾 and 𝑆 are the influence matrices for normal and tangential stresses
(tangential stess is 𝑓𝐶𝑏 ∙ 𝑝). For a layered body, expressions for 𝐾 + 𝑆 are given in the
frequency domain [29,30]. The model assumes elastic-fully plastic behavior, i.e., a cut-
off pressure is applied in the numerical solver.
1.2. Tribo-Film Growth and Its Mechanical Model
Following Gosvami et al. [5] and Zhang and Spikes [6], a stress-activated
Arrhenius model was employed to calculate the growth of the tribo-film. The growth
rate of the tribo-film is given by the following equation:
(𝜕ℎ
𝜕𝑡)𝑔 = 𝛤0̃𝑒
−∆𝑈𝑎𝑐𝑡−𝜏∙∆𝑉𝑎𝑐𝑡
𝑘𝐵𝑇 , (3)
where ∆𝑈𝑎𝑐𝑡 is the internal activation energy (in the absence of stress), ∆𝑉𝑎𝑐𝑡 is
the activation volume, 𝛤0̃ is a pre-factor, 𝑘𝐵 and 𝑇 are the Boltzmann’s constant and
absolute temperature. The value of 𝛤0̃ = 10−2𝑚
𝑠 was taken from [5], while ∆𝑉𝑎𝑐𝑡 and
∆𝑈𝑎𝑐𝑡 were used to fit experimental data. The shear stress was obtained from 𝜏 = 𝜇𝑝,
where 𝜇 is the friction coefficient and 𝑝 is the contact pressure. The friction coefficient
of ZDDP films varies only slightly within a range of 60-100 °C [31] and a constant value
of 𝜇 = 0.1 was used in all simulations.

E-7
According to equation (3) and assuming a constant coefficient of friction, the
growth rate depends on pressure. The contact pressure is determined by Young’s
modulus and by the hardness of the tribo-film and substrate. It is reported [32] that,
due to the underlying substrate, the hardness of the tribo-film varies with the height of
the tribo-film and plastic penetration depth. Unfortunately, it was not possible to
calculate the plastic penetration depth using the available simulation tools. It was
therefore chosen to use the empirical variation of the hardness with the tribo-film height
from [32]:
Fig. 1. Hardness evolution with thickness.
It should be noted, that Young’s modulus was found to be largely independent
of the temperature [32,33] i.e., within 25-200 °C (at 220°C the ZDDP tribo-film will start
to degrade [34]), while the hardness does depend on temperature [32]. Bosman and
Schipper [35] proposed a compensation factor for the hardness as a function of
temperature. The hardness at a given temperature can then be obtained by using the
initial hardness given in Fig. 1 multiplied by a compensation factor from Fig. 2.

E-8
Fig. 2. Compensation factor [35].
The temperature increase was calculated using the approach of Bosman and
De Rooij [36] and it was found to be less than 1°C for both micro- and macro-scale
simulations. This is consistent with the findings of Fujita and Spikes [17]. Temperature
variations due to frictional heating were therefore neglected in the current simulations.
1.3. Tribo-Film Wear Model
One of the most widely used wear equations is the linear Archard wear equation
[37]. This relation does not take into account the presence of a tribo-film. This may be
the reason for it to fail to fit experimental data in some cases [38-40]. In the current
work, a simple linear relation of tribo-film wear to its height ℎ was used. The wear rate
was calculated using the following equation:
(𝜕ℎ
𝜕𝑡)𝑤 = 𝛼ℎ , (4)
where 𝛼 is a fitting parameter and ℎ is the tribo-film thickness. According to this
relation, wear rate increases with the growth of the tribo-film. This is consistent with
experimental observation of Fujita and Spikes [41]. This is ascribed to a difference in
wear resistance between the fraction of the film close to the surface (low wear
resistance) compared and that of the bulk of the film (higher wear resistance). Equation
(4) shows the same behaviour.

E-9
1.4. Evolution of the Tribo-Film and the Flow Chart of the Model
The evolution of the tribo-film was calculated from the balance of growth and
wear. The change of the tribo-film thickness was calculated by the following equation:
𝜕ℎ
𝜕𝑡= (
𝜕ℎ
𝜕𝑡)𝑔 − (
𝜕ℎ
𝜕𝑡)𝑤, (5)
The flow chart of the simulation algorithm is shown in Fig. 3. Input are the
mechanical properties, temperature, macro-scale geometry and roughness. Initially,
the tribo-film does not exist (ℎ = 0). After the calculation of contact pressures and shear
stresses, the local growth of the tribo-film and subsequent wear are obtained from to
equations (3) and (4) respectively. The tribo-film thickness is then updated and the
average tribo-film thickness is calculated. The average thickness is then used as a
thickness of the (uniform) layer in the model. The hardness is recalculated based on
the updated tribo-film thickness and the algorithm continues.
Fig. 3. Flow chart of the tribo-film growth calculation.

E-10
2. Results and Discussion
2.1. Micro-scale Contact
The model was tested using the measurements of the tribo-film growth under
an AFM tip from Gosvami et al. [5]. The contact consists of a DLC coated (15 nm thick)
Silicon AFM tip with a radius of 53 nm and an iron coated (10 nm thick) Silicon
substrate. First the tribo-film growth at 600nN was calculated.
By performing an elastic simulation with a layered model, it was found that the
coatings are thick enough to neglect the influence of the underlying silicon. Therefore,
only the iron film – DLC AFM tip contact was taken into account.
The Young modulus and hardness of the tribo-film were reported to increase
with the indentation depth in the range of 15-130GPa and 2-4GPa respectively [32]. A
semi-analytical contact model developed by Bosman and Schipper [22] indicated that
the indentation depth would be less than 0.5 nm. Therefore, the lowest values of the
Young modulus and hardness were used in the simulations. It was assumed, that the
tribo-film grows only on the substrate (iron coated), as schematically shown in Fig. 4.
Fig. 4. Schematic diagram of the contact model.
Since the plastic penetration depth was found to be less than 0.5 nm (taking the
lowest hardness of 2GPa), the hardness of the substrate will not affect the contact
pressure and the maximum contact pressure will be determined by the hardness of the
tribo-film only. In this case, the hardness of the tribo-film was assumed to be constant.
However, this does not apply to the Young modulus of the substrate which does
influence the contact pressure, even with thick films. The simulation of the tribo-film

E-11
growth was therefore performed using the layered elastic-fully plastic contact model
with a constant hardness of 2 GPa, see Fig. 4.
Initially, wear of the tribo-film was not taken into account and the growth was
compared to the data published in reference [5]. This was done to test the hypothesis
in [5] that the self-limiting behavior is based on the stress relaxation by the tribo-film,
see Fig. 5a. It should be mentioned, that the initial phase of the tribo-film growth is
relatively slow, as discussed in detail in reference [5]. This phase of growth is not well
understood but can also be regarded as not relevant for engineering problems. In
practice it can be assumed that a tribo-film already exists after running-in, i.e. when
mild wear starts. The simulation data could therefore be shifted in time to correspond
to the onset of the fast growth phase. As can be seen in Fig. 5a, the calculations
correspond well with the experimental results, except for the last part of the curve
where a significant deviation occurs. The mean contact pressure evolution is shown in
Fig. 5b. Initially a high contact pressure is developed due to the high elastic modulus
of the iron substrate. With a rapid growth of the tribo-film with relatively low Young’s
modulus and hardness, the pressure drops. However, the level of this contact pressure
remains sufficiently high for steady growth of the tribo-film. It can thus be stated that
the stress relaxation is not sufficient to limit the growth and wear should be included.

E-12
Fig. 5. Contact between AFM tip and steel substrate. a) Simulation and experimental data (data reconstructed from [5]) ) at 600nN load of the tribofilm growth neglecting tribo-film wear b) corresponding
mean pressure as a function of the tribo-film thickness.
This was done in the second calculation, shown in Fig.6a, where the growth
measurement data was used to find the values of ∆𝑈𝑎𝑐𝑡 and ∆𝑉𝑎𝑐𝑡. The rapid growth
and the steady state tribo-film thickness can be well predicted by the model. However,
an important feature, i.e., an overshoot of the tribo-film thickness in the experimental
data, cannot be reproduced. This overshoot is frequently observed in macro-scale
contacts as well [1,2,21]. The fact that it occurs on both micro- and macro-scale makes
is an intriguing feature of the tribo-film growth, which needs to be studied further.
Fig. 6. Same case as from Fig. 4. The simulations now include both tribo-film growth and wear using a)
equation (4) b) using a time lag, equation (6) with 𝒕𝒍𝒂𝒈 = 𝟕.
The exact reason of the overshoot is not clear. Fujita and Spikes [41] reported
an experimental investigation of this phenomenon. They first let the tribo-film grow until
a b
a b

E-13
it stabilized after an overshoot. At this point they added fresh ZDDP. They repeated
this experiment several times and every time after the addition of fresh ZDDP, they
observed an overshoot of the tribo-film thickness. Interestingly, after each overshoot,
the tribo-film stabilized towards the same value. From this, it can be concluded, that
the overshoot is related to certain processes within fresh ZDDP during rubbing. In order
to include this behaviour into the model, a delay between growth and removal was
introduced in the wear equation:
(𝜕ℎ
𝜕𝑡)𝑤 = 𝛼ℎ(𝑡 − 𝑡𝑙𝑎𝑔), (6)
This delay time 𝑡𝑙𝑎𝑔 can then be considered as a characteristic time for
stabilization of the growth rate. The results obtained by using equation (6) are shown
in Fig. 6b. It can be seen, that almost the full curve, with the exception of the initial
nucleation phase, can be described by the model. The parameters that were used in
the simulations are given in Table 2. It should also be noticed, that since the overshoot
is not always observed and it does not influence the steady-state thickness of the tribo-
film, equation (4) can be used to calculate wear of the tribo-film.
Next, the load was decreased to 340 nN. Fig. 7b shows the result of the
simulation using exactly the same input parameters as for the higher load case (see
Table 2). The figure also shows the experimental results. The experiment stopped before
the point of self-limitation was reached. However, it can be seen that the linear growth
of the tribo-film thickness is again well predicted. The simulation was also performed
with 𝑡𝑙𝑎𝑔 = 0 to confirm that the time lag is also needed here. The results are shown in
Fig. 7a. Unfortunately, there was no more data available to further test the performance
of the model.

E-14
Fig. 7. Contact between AFM tip and steel substrate Simulation and experimental data (reconstructed
approximately from [5]) at 340nN load using a) equation (4) b) equation (6) with 𝒕𝒍𝒂𝒈 = 𝟑𝟎𝟎𝟎 𝒄𝒚𝒄𝒍𝒆𝒔.
2.2. Macro-scale Contact with Roughness
The model was further applied to a macro-scale contact consisting of two rough
steel surfaces. The physical properties of the steel, radius of curvature of the contact
and roughness are listed in Table . The applied load was 60N, entrainment speed was
0.1 m/s and the slide-to-roll ratio was 5%. The growth of the tribo-film was recorded at
60, 80 and 100 °C. The variation of the effective Young modulus due to the presence
of the tribo-film was found to have a negligible effect on the growth rate. On the other
hand, the influence of the hardness was found to be very high.
Table 1. Properties of the macro-scale contact.
Property Cylinder Disk, steel
𝐸, GPa 210 210
𝜈 0.3 0.3
𝐻, GPa 6 6
𝑅, mm 19.05
𝑅𝑞, nm 20 130
a b

E-15
The data from Ghanbarzadeh et al. [25] was used to fit the model
parameters∆𝑈𝑎𝑐𝑡, ∆𝑉𝑎𝑐𝑡, and 𝛼. Equation (4) was used for wear simulation. The
simulation and test data are shown in Fig. 8a. A reasonable agreement at various
temperatures can be obtained It should be noted, that including the stress dependency
in the Arrhenius growth equation was a prerequisite to get a good fit of the three curves
using the same constants. Fig. 8a shows a saturation of the tribo-film thickness growth
at higher temperatures, an effect that will not occur if only Arrhenius behaviour is
assumed. The stress-activated equation with the described mechanical model made it
possible to also capture this effect.
Fig. 8. a) Comparison of simulation and experimental data [25], b) Evolution of the wear rate with temperature.
The set of optimum parameters for the macroscopic steel-steel contact is given
in Table 2. The values of ∆𝑈𝑎𝑐𝑡 and ∆𝑉𝑎𝑐𝑡 are close to the ones reported by Gosvami et
al. [5], see Table 2. This suggests that the proposed model is effective for a wide range
of contact conditions, emphasising the validity of the model.
a b
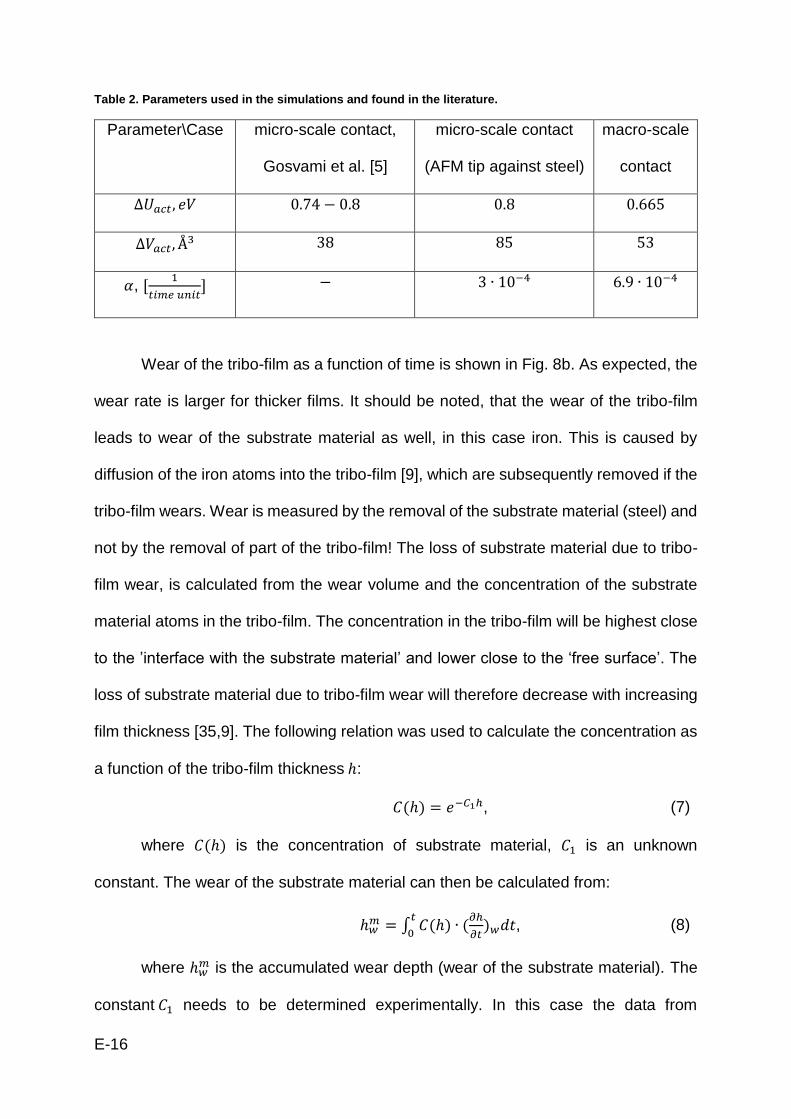
E-16
Table 2. Parameters used in the simulations and found in the literature.
Parameter\Case micro-scale contact,
Gosvami et al. [5]
micro-scale contact
(AFM tip against steel)
macro-scale
contact
∆𝑈𝑎𝑐𝑡, 𝑒𝑉 0.74 − 0.8 0.8 0.665
∆𝑉𝑎𝑐𝑡, Å3 38 85 53
𝛼, [1
𝑡𝑖𝑚𝑒 𝑢𝑛𝑖𝑡] − 3 ∙ 10−4 6.9 ∙ 10−4
Wear of the tribo-film as a function of time is shown in Fig. 8b. As expected, the
wear rate is larger for thicker films. It should be noted, that the wear of the tribo-film
leads to wear of the substrate material as well, in this case iron. This is caused by
diffusion of the iron atoms into the tribo-film [9], which are subsequently removed if the
tribo-film wears. Wear is measured by the removal of the substrate material (steel) and
not by the removal of part of the tribo-film! The loss of substrate material due to tribo-
film wear, is calculated from the wear volume and the concentration of the substrate
material atoms in the tribo-film. The concentration in the tribo-film will be highest close
to the ’interface with the substrate material’ and lower close to the ‘free surface’. The
loss of substrate material due to tribo-film wear will therefore decrease with increasing
film thickness [35,9]. The following relation was used to calculate the concentration as
a function of the tribo-film thickness ℎ:
𝐶(ℎ) = 𝑒−𝐶1ℎ, (7)
where 𝐶(ℎ) is the concentration of substrate material, 𝐶1 is an unknown
constant. The wear of the substrate material can then be calculated from:
ℎ𝑤𝑚 = ∫ 𝐶(ℎ) ∙ (
𝜕ℎ
𝜕𝑡)𝑤𝑑𝑡
𝑡
0, (8)
where ℎ𝑤𝑚 is the accumulated wear depth (wear of the substrate material). The
constant 𝐶1 needs to be determined experimentally. In this case the data from

E-17
Ghanbarzadeh et al. [25] was used. They measured the wear depth after 45 and 120
minutes, at 60 and 100 °C. By taking the difference in wear depth between 120 min
and 45 min, the running-in period was excluded, see Table 1. Running-in was excluded
here, since only mild tribo-chemical wear data was needed. As it can be seen in Table
3, a remarkable agreement of the simulation and experiment was achieved.
Table 3. Wear depth data as, 𝑪𝟏 = 𝟏.𝟐𝟒 × 𝟏𝟎𝟕 derived from the measurements of Ghanbarzadeh et al.[25]
and model calculations.
𝑇,
°C
∆= ℎ𝑤𝑚120 𝑚𝑖𝑛
− ℎ𝑤𝑚45 𝑚𝑖𝑛
,measured ,
nm
∆= ℎ𝑤𝑚120 𝑚𝑖𝑛
− ℎ𝑤𝑚45 𝑚𝑖𝑛
, calculated,
nm
60 85 86.3
100 45.4 45.8
The evolution of the substrate material wear is shown in Fig. 9a. Fig. 8 showed
that the film thickness increases with increasing temperature. Hence, the substrate
material concentration will be decreasing with increasing temperature, see Fig.9b. The
substrate material loss (wear) will therefore also decrease with increasing temperature.
The highest wear of the substrate material is therefore found at 60 °C.
Fig. 9 a) Wear of a substrate material (wear depth), b) Concentration of the substrate material in a tribo-film.
a b

E-18
Conclusion
A new mechano-chemical model was developed for the calculation of the tribo-
film evolution. It was shown that the use of a stress-activated Arrhenius model makes
it possible to calculate the tribo-film development up to its steady-state value. In
addition, a mild tribo-chemical wear model was introduced based on the growth and
wear of tribo-films. The models were validated using data from the literature. The
results support the theory of stress and temperature driven growth and self-limitation
of tribo-films.
Inputs for the model are, in addition to the traditional mechanical properties of
the substrate materials, the constants in the stress-activated Arrhenius equations and
the constants 𝛼 and 𝐶1 in the wear equations. These constants depend on the type of
additive, base oil and concentration of ZDDP molecules [42,21]. It is important to notice
that these constants may be independent of load or temperature. This implies that the
number of experiments that are required to calibrate the model are relatively small,
which makes it relatively easy to apply the model to engineering problems. The test
data that could be found for the validation of the model was limited. It is recommended
to further perform tribo-film thickness evolution measurements at various stresses and
temperatures at macro-scale to advance the model.
Acknowledgements
The authors would like to thank SKF Engineering & Research Centre,
Nieuwegein, the Netherlands for providing technical and financial support. This
research was carried out under project number M21.1.11450 in the framework of the
Research Program of the Materials innovation institute M2i.

E-19
Bibliography
1. Spikes, H.: The History and Mechanisms of ZDDP. Tribology Letters 17(3), 469-489 (2004). doi:10.1023/B:TRIL.0000044495.26882.b5
2. Topolovec-Miklozic, K., Forbus, T.R., Spikes, H.A.: Film thickness and roughness of ZDDP antiwear films. Tribology Letters 26(2), 161-171 (2007). doi:10.1007/s11249-006-9189-2
3. Nicholls, M.A., Norton, P.R., Bancroft, G.M., Kasrai, M., Stasio, G.D., Wiese, L.M.: Spatially resolved nanoscale chemical and mechanical characterization of ZDDP antiwear films on aluminum–silicon alloys under cylinder/bore wear conditions. Tribology Letters 18(3), 261-278 (2005). doi:10.1007/s11249-004-2752-9
4. Vengudusamy, B., Green, J.H., Lamb, G.D., Spikes, H.A.: Tribological properties of tribofilms formed from ZDDP in DLC/DLC and DLC/steel contacts. Tribology International 44(2), 165-174 (2011). doi:10.1016/j.triboint.2010.10.023
5. Gosvami, N.N., Bares, J.A., Mangolini, F., Konicek, A.R., Yablon, D.G., Carpick, R.W.: Mechanisms of antiwear tribofilm growth revealed in situ by single-asperity sliding contacts. Science 348(6230), 102-106 (2015).
6. Zhang, J., Spikes, H.: On the Mechanism of ZDDP Antiwear Film Formation. Tribology Letters 63(2), 1-15 (2016). doi:10.1007/s11249-016-0706-7
7. Mingwu, B., Xushou, Z., Shangkui, Q.: Tribological properties of silicon nitride ceramics coated with molybdenum films under boundary lubrication. Wear 169(2), 181-187 (1993). doi:http://dx.doi.org/10.1016/0043-1648(93)90296-X
8. Vengudusamy, B., Green, J.H., Lamb, G.D., Spikes, H.A.: Durability of ZDDP Tribofilms Formed in DLC/DLC Contacts. Tribology Letters 51(3), 469-478 (2013). doi:10.1007/s11249-013-0185-z
9. Pasaribu, H.R., Lugt, P.M.: The Composition of Reaction Layers on Rolling Bearings Lubricated with Gear Oils and Its Correlation with Rolling Bearing Performance. Tribology Transactions 55(3), 351-356 (2012). doi:10.1080/10402004.2011.629403
10. Minfray, C., Le Mogne, T., Martin, J.-M., Onodera, T., Nara, S., Takahashi, S., Tsuboi, H., Koyama, M., Endou, A., Takaba, H., Kubo, M., Del Carpio, C.A., Miyamoto, A.: Experimental and Molecular Dynamics Simulations of Tribochemical Reactions with ZDDP: Zinc Phosphate–Iron Oxide Reaction. Tribology Transactions 51(5), 589-601 (2008). doi:10.1080/10402000802011737
11. Bosman, R., Schipper, D., J.: Running-in of Systems Protected by Additive Rich Oils. Tribology Letters 41, 263-282 (2011).
12. Lin, Y.C., So, H.: Limitations on use of ZDDP as an antiwear additive in boundary lubrication. Tribology International 37(1), 25-33 (2004). doi:http://dx.doi.org/10.1016/S0301-679X(03)00111-7
13. Martin, J.M.: Antiwear mechanisms of zinc dithiophosphate: a chemical hardness approach. Tribology Letters 6(1), 1-8 (1999). doi:10.1023/a:1019191019134
14. Martin, J.M., Onodera, T., Minfray, C., Dassenoy, F., Miyamoto, A.: The origin of anti-wear chemistry of ZDDP. Faraday Discussions 156(0), 311-323 (2012). doi:10.1039/C2FD00126H
15. Qu, J., Meyer Iii, H.M., Cai, Z.-B., Ma, C., Luo, H.: Characterization of ZDDP and ionic liquid tribofilms on non-metallic coatings providing insights of tribofilm formation mechanisms. Wear 332–333, 1273-1285 (2015). doi:http://dx.doi.org/10.1016/j.wear.2015.01.076
16. Mosey, N.J., Müser, M.H., Woo, T.K.: Molecular Mechanisms for the Functionality of Lubricant Additives. Science 307(5715), 1612-1615 (2005). doi:10.1126/science.1107895
17. Fujita, H., Spikes, H.A.: The formation of zinc dithiophosphate antiwear films. Proceedings of the Institution of Mechanical Engineers, Part J: Journal of Engineering Tribology 218(4), 265-278 (2004). doi:10.1243/1350650041762677
18. Hänggi, P., Talkner, P., Borkovec, M.: Reaction-rate theory: fifty years after Kramers. Reviews of Modern Physics 62(2), 251-341 (1990).

E-20
19. Bulgarevich, S.B., Boiko, M.V., Kolesnikov, V.I., Korets, K.E.: Population of transition states of triboactivated chemical processes. Journal of Friction and Wear 31(4), 288-293 (2010). doi:10.3103/s1068366610040070
20. Bulgarevich, S.B., Boiko, M.V., Kolesnikov, V.I., Feizova, V.A.: Thermodynamic and kinetic analyses of probable chemical reactions in the tribocontact zone and the effect of heavy pressure on evolution of adsorption processes. Journal of Friction and Wear 32(4), 301-309 (2011). doi:10.3103/s1068366611040027
21. Naveira-Suarez, A., Tomala, A., Grahn, M., Zaccheddu, M., Pasaribu, R., Larsson, R.: The influence of base oil polarity and slide–roll ratio on additive-derived reaction layer formation. Proceedings of the Institution of Mechanical Engineers, Part J: Journal of Engineering Tribology 225(7), 565-576 (2011). doi:10.1177/1350650111405115
22. Bosman, R., Hol, J., Schipper, D., J.: Running in of Metallic Surfaces in the Boundary Lubrication Regime. Wear 271(7-8), 1134-1146 (2011).
23. Andersson, J., Larsson, R., Almqvist, A., Grahn, M., Minami, I.: Semi-deterministic chemo-mechanical model of boundary lubrication. Faraday Discuss 156, 343-360; discussion 413-334 (2012).
24. So, H., Lin, Y.C.: The theory of antiwear for ZDDP at elevated temperature in boundary lubrication condition. Wear 177(2), 105-115 (1994). doi:http://dx.doi.org/10.1016/0043-1648(94)90236-4
25. Ghanbarzadeh, A., Parsaeian, P., Morina, A., Wilson, M.C.T., van Eijk, M.C.P., Nedelcu, I., Dowson, D., Neville, A.: A Semi-deterministic Wear Model Considering the Effect of Zinc Dialkyl Dithiophosphate Tribofilm. Tribology Letters 61(1), 1-15 (2015). doi:10.1007/s11249-015-0629-8
26. Akchurin, A., Bosman, R., Lugt, P.M., van Drogen, M.: On a Model for the Prediction of the Friction Coefficient in Mixed Lubrication Based on a Load-Sharing Concept. Tribology Letters 59(1), 19-30 (2015).
27. Timoshenko, S.P., Goodier, J.N.: Theory of Elasticity, 3-rd ed. McGraw-Hill, New York (1970) 28. Liu, S.: Thermomechanical Contact Analysis of Rough Bodies. PhD thesis., Northwestern University
(2001) 29. Wang, Z.-J., Wang, W.-Z., Wang, H., Zhu, D., Hu, Y.-Z.: Partial Slip Contact Analysis on Three-
Dimensional Elastic Layered Half Space. Journal of Tribology 132(2), 1-12 (2012). 30. Liu, S., Wang, Q.: Studying Contact Stress Fields Caused by Surface Tractions with a Discrete
Convolution anf Fast Fourier Transform Algorithm. Journal of Tribology 124(1), 36-45 (2002). 31. Roshan, R., Priest, M., Neville, A., Morina, A., Xia, X., Warrens, C.P., Payne, M.J.: Friction Modelling
in Boundary Lubrication Considering the Effect of MoDTC and ZDDP in Engine Oils. Tribology Online 6(7), 301-310 (2011). doi:10.2474/trol.6.301
32. Demmou, K., Bec, S., Loubet, J.L., Martin, J.M.: Temperature Effects on Mechanical Properties of Zinc Dithiophosphate Tribofilms. Tribology International 39, 1558-1563 (2006).
33. Pereira, G., Munoz-Paniagua, D., Lachenwitzer, A., Kasrai, M., Norton, P.R., Capehart, T.W., Perry, T.A., Cheng, Y.-T.: A variable temperature mechanical analysis of ZDDP-derived antiwear films formed on 52100 steel. Wear 262(3–4), 461-470 (2007). doi:http://dx.doi.org/10.1016/j.wear.2006.06.016
34. Tse, J.S., Song, Y., Liu, Z.: Effects of Temperature and Pressure on ZDDP. Tribology Letters 28(1), 45-49 (2007). doi:10.1007/s11249-007-9246-5
35. Bosman, R., Schipper, D.J.: Mild Wear Prediction of Boundary-Lubricated Contacts. Tribology Letters 42(2), 169-178 (2011). doi:10.1007/s11249-011-9760-3
36. Bosman, R., de Rooij, M.B.: Transient Thermal Effects and Heat Partition in Sliding Contacts. Journal of Tribology 132 (2010).
37. Archard, J.F.: Contact and Rubbing of Flat Surfaces. Journal of Applied Physics 24(8), 981-988 (1953). doi:doi:http://dx.doi.org/10.1063/1.1721448
38. Gotsmann, B., Lantz, M.A.: Atomistic Wear in a Single Asperity Sliding Contact. Physical Review Letters 101(12), 125501 (2008).

E-21
39. Bhaskaran, H., Gotsmann, B., Sebastian, A., Drechsler, U., Lantz, M.A., Despont, M., Jaroenapibal, P., Carpick, R.W., Chen, Y., Sridharan, K.: Ultralow nanoscale wear through atom-by-atom attrition in silicon-containing diamond-like carbon. Nat Nano 5(3), 181-185 (2010). doi:http://www.nature.com/nnano/journal/v5/n3/suppinfo/nnano.2010.3_S1.html
40. Schirmeisen, A.: Wear: One atom after the other. Nat Nano 8(2), 81-82 (2013). 41. Fujita, H., Spikes, H.A.: Study of Zinc Dialkyldithiophosphate Antiwear Film Formation and Removal
Processes, Part II: Kinetic Model. Tribology Transactions 48(4), 567-575 (2005). doi:10.1080/05698190500385187
42. Fujita, H., Glovnea, R.P., Spikes, H.A.: Study of Zinc Dialkydithiophosphate Antiwear Film Formation and Removal Processes, Part I: Experimental. Tribology Transactions 48(4), 558-566 (2005). doi:10.1080/05698190500385211


List of Journal Publications
A. Akchurin, R. Bosman, Deterministic Stress-Activated Model for Tribo-
Film Growth and Wear Simulation, Submitted to Tribology Letters, 2016.
A. Akchurin, R. Bosman, P.M. Lugt, Generation of Wear Particles and
Running-In in Mixed Lubricated Sliding Contacts, Tribology International,
2016.
A. Akchurin, R. Bosman, P.M. Lugt, A Stress-Criterion-Based Model for
the Prediction of the Size of Wear Particles in Boundary Lubricated
Contacts, Tribology Letters, 64, 2016.
Akchurin, R. Bosman, P.M. Lugt, M. van Drogen, Analysis of Wear
Particles Formed in Boundary Lubricated Sliding Contacts, Tribology
Letters, 63, 2016.
Akchurin, R. Bosman, P.M. Lugt, M. van Drogen, On a Model for the
Prediction of the Friction Coefficient in Mixed Lubrication Based on a
Load-Sharing Concept with Measured Surface Roughness, Tribology
Letters, 59, 2015.
Conference Proceedings
Modeling of the Wear Particles Formation in Mixed Lubricated Sliding
Line Contacts, A. Akchurin, R. Bosman, P.M. Lugt, in the Proceedings of
2016 STLE Annual Meeting & Exhibition, Las Vegas, 2016.
The origin of wear particles during sliding friction, R. Bosman, A.
Akchurin, in the Proceedings of the 30-th meeting of IRG-WOEM, Lisbon,
2015.
On a New Model for the Prediction of the Friction Coefficient in Mixed
Lubrication Based on a Load-Sharing, A. Akchurin, R. Bosman, P.M.
Lugt, M. van Drogen, in the Proceedings of STLE Frontiers, 2014,
Chicago, IL, USA.

INVITATION
You are invited to attend the public defence of my doctoral thesis entitled:
GENERATION OF WEAR PARTICLES IN LUBRICATED CONTACTS DURING
RUNNING-IN
On Friday, 20th January
2017at 14:45
in the Prof. dr. G. Berkhoff-room ot the Waaier
building, University of Twente
Aydar [email protected]
AY
DA
R A
KC
HU
RIN
GE
NE
RA
TIO
N O
F WE
AR
PAR
TIC
LES IN
LUB
RIC
AT
ED
CO
NT
AC
TS D
UR
ING
RU
NN
ING
-IN
GENERATION OF WEAR PARTICLES IN LUBRICATED CONTACTS DURING
RUNNING-IN
AYDAR AKCHURIN