Embed Size (px)
Citation preview
Journal of Economic Perspectives- Volume 8, Number 1- Winter 1994-Pages 73-94
Generational Accounting: A Meaningful Way to Evaluate Fiscal Policy
Alan J. Auerbach, Jagadeesh Gokhale, and Laurence J. Kotlikoff
H t ow large should the federal budget deficit be? Any economist or policy-maker seeking to answer this question is immediately con- fronted with a range of questions about how to measure the deficit.
Should the deficit be measured including or excluding Social Security's cash- flow surpluses? Should it include all or part of the recent savings and loan bailout? Should it be adjusted for growth, inflation, and the state of the economy? Should the deficit be measured net of government investment? Should the deficit include changes in the unfunded liabilities of Medicare, Social Security, and the civil service and the military retirement systems? The answers one gives to these and the plethora of similar questions make all the difference in the world to the measured size of the deficit.
For want of agreement on the "correct" way to measure the deficit, the Congressional Budget Office now routinely offers the public a menu of deficits from which to choose. Take fiscal year 1992. For that year, the CBO reported that the "official" deficit, as measured for Congressional budget purposes, was $290 billion (CBO, 1993, Table 2-1). But it also reported that the "on-budget" deficit, which excludes the large surplus of the social security system and the small deficit of the postal service, was $340 billion. The CBO also offered a "standardized employment" deficit, which was only $201 billion, as well as a $292 billion deficit that excluded the net payments received to help finance Operation Desert Storm as well as those made to bolster the nation's deposit
* Alan J. Auerbach is Professor of Economics and Law, University of Pennsylvania, Philadelphia, Pennsylvania, and Research Associate, National Bureau of Economic Research, Cambridge, Massachusetts. Jagadeesh Gokhale is Economist, Federal Reserve Bank of Cleveland, Cleveland, Ohio. Laurence J. Kotlikoff is Professor of Economics, Boston University, Boston, Massachusetts, and Research Associate, National Bureau of Economic Research, Cambridge, Massachusetts.
74 Journal of Economic Perspectives
insurance system. These alternative deficit measures differ not only in their magnitudes (the difference between the largest and smallest equals 2.3 percent of GDP), but also in their time-trends. For example, the difference between the standardized employment deficit and the official deficit is projected to narrow considerably by fiscal year 1998, while the difference between the official and on-budget deficits is projected to grow considerably, as the annual surpluses of the social security system rise.
Which deficit is the right one, and to which deficit trend should we pay attention? No consensus exists among economists, and for good reason. Eco- nomic theory suggests that the deficit is not a well-defined economic concept, but rather an arbitrary number whose value depends on how the government chooses to label its receipts and payments (Kotlikoff, 1986, 1992, 1993; Auerbach and Kotlikoff, 1987).
To understand the arbitrary nature of any particular deficit measure, consider how the U.S. government might characterize $1.00 that it "borrows" from a citizen this year, through the sale of a one-year Treasury bill, and the $1.03 of "principal plus interest" that it gives the citizen next year, through the payment of principal plus interest on the T-bill. One way to relabel these transactions is to say that the government is "taxing" the citizen $1.00 this year and making a "transfer payment" of $1.03 to the citizen next year. Another way is for the government to say that it is, this year, "borrowing" $5.00 from the citizen as well as "transferring" $4.00 to the citizen and that next year it is "repaying principal plus interest" of $5.15 to the citizen as well as levying a "tax" on the citizen of $4.12.
There are countless ways of labeling the government's extraction of $1.00 from this citizen this year and its giving the citizen $1.03 next year. The reported deficit can be wildly different, although the citizen is in exactly the same economic position. This ambiguity applies to every dollar the government takes in, whether labeled "taxes" or "borrowing," and every dollar the govern- ment distributes, whether described as "transfer payments" or "repayment of principal plus interest."' In short, it is impossible to measure the debt and the change in the debt-the deficit-in a way which carries a useful underlying economic meaning.
Even were there agreement about which deficit measure were "correct," such a measure would still be of limited use in understanding fiscal policy for two reasons. First, fiscal policy is dynamic and cannot be described by a short-term measure that entirely ignores the likely course of future policy. Second, a single deficit measure cannot identify the intergenerational distribu- tion of the burden of government finance at any given time. Without dealing with these issues it is impossible to evaluate the impact of fiscal policy on the aggregate economy or identify how the burden of fiscal policy is distributed
IThis statement may be true even in the context of liquidity constraints once one takes into account the endogenous determination of the liquidity constraints. Hayashi (1987) and Kotlikoff (1993) discuss this point.
AlanJ. Auerbach, Jagadeesh Gokhale and LaurenceJ. Kotlikoff 75
across individuals-supposedly the major questions the deficit is supposed to help us address.
To make an assessment of generational fiscal burdens that is independent of the words the government uses to label its receipts and payments, we have developed "generational accounting" (Auerbach, Gokhale, and Kotlikoff, 1991). Generational accounts indicate, in present value, what the typical member of each generation can expect to pay, now and in the future, in net taxes (taxes paid net of transfer payments received). Generational accounting indicates not only what existing generations will pay, but also what future generations must pay, given current policy and the government's intertemporal budget con- straint. This constraint requires that those government bills not paid by current generations must ultimately be paid by future generations.
This paper first describes the method of generational accounting, and provides some limited analysis of its sensitivity to economic assumptions. It offers some representative applications of this new tool to proposed Social Security and budget policies. Finally, it addresses criticisms of generational accounting, particularly those leveled by Robert Haveman in his companion piece in this issue.
Understanding Generational Accounts
The government's intertemporal budget constraint at each date requires that the subsequent net tax payments of current and future generations be sufficient, in present value, to cover the present value of future government consumption, as well as pay off the government's initial net indebtedness (net of initial government assets). Failure to satisfy this constraint means that the government will default on its liabilities, in essence satisfying the constraint through a tax on its creditors. A common, but incorrect, interpretation of this constraint is that it implies that the national debt will be paid off. In fact, the only requirement is that the debt be serviced through payments by existing and future generations. The way in which generational accounts-the present value of the remaining lifetime net tax payments of current generations as well as the entire lifetime net tax payments of future generations-enter into the govern- ment's intertemporal budget constraint can be expressed by a simple equation.2
present value of present value of present value government remaining net tax + net tax payments = of all future - net payments of offuture government wealth existing generations generations consumption
2For those more comfortable seeing such relationships expressed in algebraic form:
D oo oo
E Nt,t-s+ E Nt,t+ = E Gs(1 + r)t -sWtg s=O s=I s=t
76 Journal of Economic Perspectives
This equation indicates the zero sum nature of fiscal policy, when it is properly viewed from an intergenerational perspective. Holding the present value of government consumption fixed, a reduction in the present value of net taxes extracted from current generations (a decline in the first term in the equation) necessitates an increase in the present value of net tax payments of future generations. The equation also demonstrates that we cannot determine the fiscal burden being imposed on future generations without knowing the future path of government purchases and the generational accounts of those currently alive, which depend on the net taxes to be paid by these generations. Hence, it is impossible to assess the stance of generational policy without making assump- tions about the paths of these future variables.
A set of generational accounts is simply a set of values, one for each existing and future generation, with the property that their combined present value adds up to the present value of government consumption less initial govern- ment wealth.3 The same principles can be extended to distinguish male and female cohorts within each generation, which we have done in our work to date, and to distinguish among other demographic characteristics as well as lifetime income levels. Don Fullerton and Diane Lim Rogers (1993) have recently made some progress toward such intragenerational accounting.
Since generational accounts reflect only net taxes paid to the government (taxes less transfers received), they do not impute to particular generations the value of the government purchases of goods and services made to provide them with education, highways, national defense, and other services.4 Therefore, they do not show the full net benefit or burden that any generation receives from government policy as a whole, although they can show a generation's net
The term Nt k stands for the account of the generation born in year k. The index s in the first summation runs from age 0 to age D, the maximum length of life. Hence, the first element of this summation is Nt t, which is the present value of net payments of the generation born in year t; the last term is Nt,t-D, the present value of remaining net payments of the oldest generation alive in year t, namely those born in year t - D. The second summation starts with the term NA1t + 1the present value in year t of the payments of the generation born in year t + 1. The values of government consumption in year s, given by Gs, are discounted by the pre-tax real interest rate, r. The remaining term on the right-hand side, WJ9, denotes the government's net wealth in year t. 3A set of generational accounts is simply a set of values Nt k' defined by:
k+D
Nt, k = E Tskks,k(l + r)ts s = max(t, k)
In this expression, T, k stands for the projected average net tax payment to the government made in year s by a member of the generation born in year k. The term P5 k stands for the number of surviving members of the cohort in year s who were born in year k. For generations who are born prior to year t, the summation begins in year t. For generations who are born in year k, where k > t, the summation begins in year k. Regardless of the generation's year of birth, the discounting is always back to year t. 4Imputations appear feasible for certain types of government purchases, such as for primary school education, and they could be included in future improvements of generational accounts.
Generational Accounting 77
benefit or burden from a particular policy change that affects only taxes and transfers.
Note that any reduction in a generation's "account" expands its remaining lifetime budget constraint, thereby permitting it to engage in more consump- tion.5 This, then, is the channel by which redistributing across generations can lower national saving. Policies that lower the accounts of current generations (necessitating increases in the accounts of future current generations) will stimulate current consumption.6 Armed with cohort-specific propensities to consume, one can estimate how changes in fiscal policy will alter each genera- tion's and, thus, aggregate consumption by multiplying the generation's propensity to consume by the change in its generational account, as shown in Auerbach, Gokhale, and Kotlikoff (1992b).
Constructing Generational Accounts
The methodology and data sources used in calculating generational ac- counts are discussed in detail in Auerbach et al. (1991) and OMB (1993). We summarize that discussion here.
The basic approach to calculating generational accounts proceeds as fol- lows. Based on projections of current tax and transfer plans, we calculate generational accounts for the current generation, the first term in the left-hand side of the equation in the text. This requires projections of the population by age and sex, and projections of average taxes and transfers for each generation in each year in which at least some member of the generation will be alive. For population, we use the Social Security Trustees' 1992 intermediate (alternative II) projections of population by age and sex through 2066 and extend these projections beyond 2066 using the fertility, mortality, and immigration proba- bilities projected to prevail in 2066.
5The lifetime budget constraint of each generation specifies that the present value of its consump- tion must equal its current net wealth, plus the present value of its human wealth, plus the present value of its net private intergenerational transfers, less the present value of its net payments to the government, its generational account (its N1 k). For the generation born in year k the year I remaining lifetime budget constraint is given by:
k+D k+D
E [Cs,k + Is,k]Ps,k(I + r) = Wt,k + E E.,kP, k(I + r) - Nt, k s=t s=t
In this equation, the terms C, k, IS k, and Es k stand, respectively, for the average values in year s of consumption, private net intergenerational transfers, and labor earnings of the generation born in rear k. The term Wt k stands for the year t net wealth of the generation born in year k. This assumes that current generations do not offset such government intergenerational redistribu-
tion through changes in private intergenerational transfers. As Altonji, Hayashi, and Kotlikoff (1992) show, there is no evidence in U.S. data to support the intergenerational altruism needed for such a result.
78 Journal of Economic Perspectives
Our projections of average future taxes and transfers by age and sex are based on current and projected values of National Income and Product Ac- counts (NIPA) totals of all federal, state, and local taxes and transfers. These projections incorporate the Social Security Trustee's long-term forecasts of social security total contributions and benefit payments, the Health Care Fi- nancing Administration's long-term forecasts of spending on Medicare and Medicaid, and OMB's long-term forecasts of federal taxes and transfer pay- ments other than those of Social Security, Medicare, and Medicaid. Beyond the period in which these government long-term forecasts are available, we assume that particular tax and transfer aggregates grow to keep pace with demograph- ics and productivity growth. The current and projected future NIPA tax and transfer totals are distributed to generations, as defined by age and sex, based on corresponding distributions in cross-section survey data. These surveys include the Survey of Income and Program Participation, the Survey of Con- sumer Expenditures, and the Current Population Survey.
The second task is to calculate the present value of future government consumption. Federal purchases of goods and services through 2004 are taken from OMB's 1992 Mid-Session Review extended beyond 1997 and updated for the actual fiscal year 1992 results. State and local purchases through 2004 are kept at the same ratio to GDP as in 1991. Federal, state, and local purchases after 2004 were divided between those made on behalf of specific age groups, the young, middle-aged, and elderly (such as educational expenditures), and those that are more nearly pure public goods (such as defense and public safety). Purchases per person in each of the three age groups, and purchases of public goods per capita, increase at the assumed rate of productivity growth.7
For making present value calculations in each of these cases, we need to decide on an appropriate discount rate. Future government receipts and expenditures are risky, which suggest that they be discounted by a rate higher than the real rate of interest on government securities. On the other hand, government receipts and expenditures appear to be less volatile than the real return on capital, which suggests that they be discounted by a lower rate than that. The baseline calculations assume a 6 percent real discount rate, which is roughly halfway between the real historical returns on government bonds and private sector capital.
For the second term on the right-hand side, we need an estimate of the initial stock of government net wealth. Our measure of government wealth
7To date we have not attempted to measure the value of existing government capital, such as highways, nor have we added the imputed rent on this measure of government consumption spending. However, the omission of such adjustments has little impact on our assessment of the imbalance in the net taxation of current and future generations. If we value the capital at the present value of its imputed rent, these two adjustments to the right-hand side of the equation in the text would cancel. For example, our exclusion of Yellowstone National Park from initial government assets is offset by our exclusion of the park's implicit rent from future government purchases.

Alan J. Auerbach, Jagadeesh Gokhale and Laurence J. Kotlikoff 79
should, in principle, equal all government assets less liabilities. In practice, we include only government net financial wealth.8 Our estimate of government net debt (the negative of government net wealth) for 1992 is formed by adding together annual National Income Account deficits (federal, state, and local) from 1900 through 1991.
With the present value of net taxes of current generations, the present value of government spending, and an estimate of government wealth in place, we can then calculate the total collective net tax payment required of future generations, expressed as a present value. Given this total, we determine the average lifetime net tax payment of each member of each future generation under the assumption that the average lifetime net tax payment of successive generations rises at the economy's rate of productivity growth.9
Perhaps the easiest way to evaluate the burden faced by the typical future generation is to compare it to the lifetime net tax payments of current newborns. The generational accounts of both newborns and future generations take into account net tax payments over these generations' entire lifetimes; the only difference is the growth adjustment just mentioned. Of course, one could make many alternate assumptions about the tax payments of future genera- tions. But while considering alternatives is a useful purpose of generational accounting, it makes sense to begin by calculating the intergenerational imbal- ance of present fiscal policy.
Baseline Generational Accounts
Tables 1 and 2 present generational accounts as of 1991 (reprinted from OMB, 1993, Tables F-I and F-2) for every fifth generation of males and females alive in that year. The calculations assume a real discount rate of 6 percent and a real productivity growth rate of .75 percent per year, and that no policy changes will affect the fiscal burdens of generations currently alive.
The first column of each table, labelled "net payment," is the difference between the present value of taxes that a member of each generation will pay, on average, over his or her remaining life and the present value of the transfers he or she will receive. The second column shows the average present values of the different federal, state and local taxes; this includes labor income taxes, capital income taxes, payroll taxes, and excise taxes. The final column gives the values of the corresponding transfers, which includes Social Security, disability, health, and welfare transfers. As an example, take the case of 30-year-old males. On average, the 1991 cohort of 30-year-old males will pay $205,500 to the government over the course of their remaining lives. This figure reflects the difference between the $258,500 present value of payments to the government
8As just mentioned in the previous footnote, this omission is not as serious as it may at first appear. 9In our calculations, "generation" refers to sex-specific birth cohorts.
80 Journal of Economic Perspectives
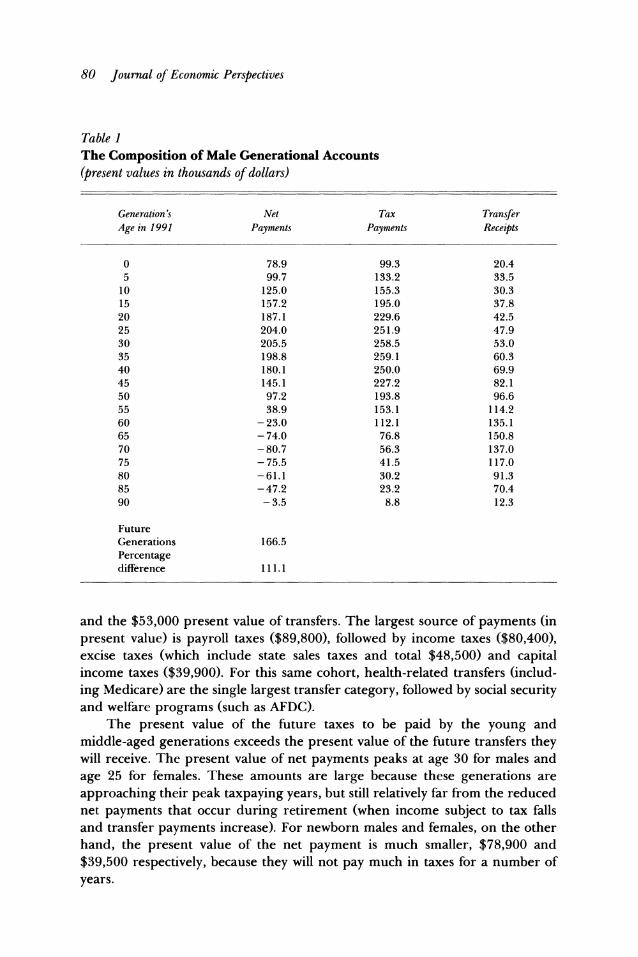
Table I The Composition of Male Generational Accounts (present values in thousands of dollars)
Generation's Net Tax Transfer Age in 1991 Payments Payments Receipts
0 78.9 99.3 20.4 5 99.7 133.2 33.5
10 125.0 155.3 30.3 15 157.2 195.0 37.8 20 187.1 229.6 42.5 25 204.0 251.9 47.9 30 205.5 258.5 53.0 35 198.8 259.1 60.3 40 180.1 250.0 69.9 45 145.1 227.2 82.1 50 97.2 193.8 96.6 55 38.9 153.1 114.2 60 -23.0 112.1 135.1 65 - 74.0 76.8 150.8 70 - 80.7 56.3 137.0 75 - 75.5 41.5 117.0 80 -61.1 30.2 91.3 85 -47.2 23.2 70.4 90 - 3.5 8.8 12.3
Future Generations 166.5 Percentage difference 111.1
and the $53,000 present value of transfers. The largest source of payments (in present value) is payroll taxes ($89,800), followed by income taxes ($80,400), excise taxes (which include state sales taxes and total $48,500) and capital income taxes ($39,900). For this same cohort, health-related transfers (includ- ing Medicare) are the single largest transfer category, followed by social security and welfare programs (such as AFDC).
The present value of the future taxes to be paid by the young and middle-aged generations exceeds the present value of the future transfers they will receive. The present value of net payments peaks at age 30 for males and age 25 for females. These amounts are large because these generations are approaching their peak taxpaying years, but still relatively far from the reduced net payments that occur during retirement (when income subject to tax falls and transfer payments increase). For newborn males and females, on the other hand, the present value of the net payment is much smaller, $78,900 and $39,500 respectively, because they will not pay much in taxes for a number of years.
Generational Accounting 81
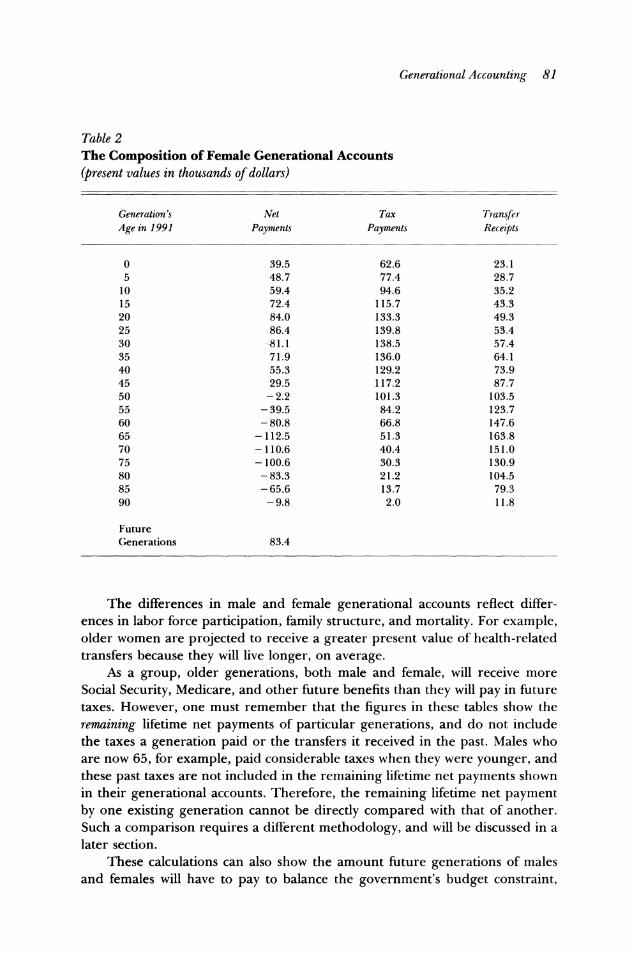
Table 2 The Composition of Female Generational Accounts (present values in thousands of dollars)
Generation's Net Tax Transfer Age in 1991 Payments Payments Receipts
0 39.5 62.6 23.1 5 48.7 77.4 28.7
10 59.4 94.6 35.2 15 72.4 115.7 43.3 20 84.0 133.3 49.3 25 86.4 139.8 53.4 30 -81.1 138.5 57.4 35 71.9 136.0 64.1 40 55.3 129.2 73.9 45 29.5 117.2 87.7 50 - 2.2 101.3 103.5 55 - 39.5 84.2 123.7 60 - 80.8 66.8 147.6 65 - 112.5 51.3 163.8 70 - 110.6 40.4 151.0 75 - 100.6 30.3 130.9 80 -83.3 21.2 104.5 85 -65.6 13.7 79.3 90 - 9.8 2.0 11.8
Future Generations 83.4
The differences in male and female generational accounts reflect differ- ences in labor force participation, family structure, and mortality. For example, older women are projected to receive a greater present value of health-related transfers because they will live longer, on average.
As a group, older generations, both male and female, will receive more Social Security, Medicare, and other future benefits than they will pay in future taxes. However, one must remember that the figures in these tables show the remaining lifetime net payments of particular generations, and do not include the taxes a generation paid or the transfers it received in the past. Males who are now 65, for example, paid considerable taxes when they were younger, and these past taxes are not included in the remaining lifetime net payments shown in their generational accounts. Therefore, the remaining lifetime net payment by one existing generation cannot be directly compared with that of another. Such a comparison requires a different methodology, and will be discussed in a later section.
These calculations can also show the amount future generations of males and females will have to pay to balance the government's budget constraint,
82 Journal of Economic Perspectives
assuming that subsequent generations pay this same amount except for an adjustment for growth. These amounts come out to $166,500 for men and $83,400 for women, which represents an increase of 111.1 percent over the burden faced by current newborns, who have been assumed to face current tax and transfer rules. This imbalance is striking in its magnitude. Of course, making more optimistic assumptions about discount rates and productivity can reduce the size of this gap. But even assuming a discount rate of just 3 percent and a productivity growth rate of 1.25 percent, future generations will still have to pay 65 percent more than current newborns (OMB, 1993, Table F-3). Thus, the evidence for significant generational imbalance in U.S. fiscal policy is quite robust.
Applications of Generational Accounting
The superiority of generational accounting over deficit accounting is im- mediately clear when one compares the effects of particular policies on deficits and generational accounts. Policies that change the pattern of generational burdens need not affect the deficit, while other policies may change the deficit without affecting the pattern of generational burdens. Our purpose here is to show the advantages of generational accounting in examining fiscal and inter- generational consequences of alternate policies; to use generational accounting as a reminder of the necessity of specifying the future consequences of current policy changes; and to see how generational accounting can be used to design policies that can achieve an equitable intergenerational distribution of the burden of paying for the government's bills.
Three Hypothetical Policies To begin, consider three hypothetical policies which shift the fiscal burden,
at least to some extent, to young and future generations. The first policy is a five-year, 20 percent reduction in the average federal income tax rate, with the tax rate increased above its initial value after five years to maintain a constant debt-to-GNP ratio. The second policy is an immediate and permanent 20 percent increase in Social Security benefits, financed on a pay-as-you-go basis by increases in payroll taxes. The third policy involves an equal revenue switch in tax structure-a permanent 30 percent cut in payroll taxes financed by increased sales taxes.
Notice that only the first policy of cutting taxes now and raising them in the future affects the budget deficit. The other two policies are "revenue- neutral" in the standard budgetary sense. Thus, if an analyst is using the budget deficit as the measure of intergenerational tax burdens and fiscal policy, the first policy would be seen as a stimulus and something that imposes additional burdens on future generations, while the second and third policies would appear to have no impact at all.
AlanJ. Auerbach, Jagadeesh Gokhale and LaurenceJ. Kotlikoff 83
A generational accounting approach offers a much more informative analy- sis. Given the assumptions used earlier, the temporary 20 percent income tax cut benefits all generations over age 25 while burdening those younger. The greatest benefit accrues to those currently about age 55, while the greatest burden lands on those currently age 15-20. Although the second policy of a pay-as-you-go increase in Social Security benefits has no effect on the deficit, as typically measured, it has more pronounced generational implications: old men and old and middle-aged women gain substantially from this policy; young and future generations, especially men, lose. The third policy of switching from payroll to sales and excise taxes also leaves the deficit unchanged over time, but results in young and middle-aged men gaining at the expense of older male and all female generations. This pattern of redistribution arises because the ratio of male to female payroll tax payments is much higher than their ratio of indirect tax payments. Hence, compared to females, payroll tax reduction benefits males, especially younger ones, relatively more than increases in sales and excise taxes hurts them.
Without a correct assessment of such generational effects, it is also impossi- ble to evaluate the macroeconomic effects of these policies. Consider again the 20 percent increase in Social Security benefits that leaves the deficit unchanged because payroll taxes are increased simultaneously. Given evidence that the marginal propensity to consume out of remaining lifetime resources rises with age (Auerbach et al., 1992a), this policy will raise the consumption of the elderly by a larger amount than it reduces the consumption of the young and middle-aged.'0 However, if the deficit is used as a measure of economic stimulus, the analyst would mistakenly conclude that this policy has no impact on aggregate consumption demand.
Along with failing as a guide to changes in consumption, the deficit also fails to help us understand how fiscal policies affect national saving, and through this channel, changes in capital-labor ratios and factor prices (wages and real interest rates). As discussed in Auerbach and Kotlikoff (1987), under- standing changes in factor prices is important for assessing fully the intergener- ational incidence of fiscal policy. Hence, knowing how generational accounts change in response to policy is essential to understanding not only the direct generational welfare effects of government policy, but also the indirect effects associated with factor price changes.
The Moynihan Proposal One lesson of generational accounting is that any short-term policy changes
also require a long-term policy adjustment. Take, for example, Senator Daniel
10Note that by the zero-sum nature of intergenerational redistribution, the increase in resources to the current elderly exceeds the reduction in resources to the current young and middle-aged with the difference equal to the reduction in resources of future generations. Hence, even if the elderly had the same (rather than a larger) propensity to consume as the young and middle-aged, there would be an increase in aggregate consumption.
84 Journal of Economic Perspectives
Patrick Moynihan's recent proposal to cut payroll taxes in the short term by 30 percent, and thus to avoid building up a surplus in the Social Security trust fund." Generational accounting emphasizes that any such proposal for tax cuts must ultimately be paid for, and it forces the analyst to state how the govern- ment's intertemporal budget constraint would be satisfied.
Consider three ways of paying for Moynihan's proposal. The first alterna- tive is that specified in the Senator's proposal, namely raising payroll taxes after 2020 to levels above those that would otherwise have prevailed. The second is cutting Social Security benefits after 2020. The third is making up the shortfall in payroll tax revenue by immediately raising income tax rates. A generational accounting analysis shows that cutting Social Security taxes until the year 2020 and increasing them thereafter benefits all except the very young and future generations of both sexes. Cutting benefits, rather than increasing taxes, after 2020 produces the same pattern of gains and losses. However, in this second approach, the gains of middle-aged generations are not as large as under the first policy: these generations pay no payroll taxes when old under the first policy and, hence, escape the future hikes in payroll tax rates under that policy. However, they do suffer reduced benefits under the second policy. Under the second policy, because the gains of working generations are not as large as under the first policy, the losses of future generations are also lower. The third option-a switch from payroll to income taxation-produces large losses for older generations while providing moderate gains for young and future gener- ations. Unlike payroll taxation, income taxation contains an element of capital income taxation which falls relatively more heavily on older generations-the major asset-owners in the economy.
Generational Accounting as a Guide to Generational Equity Generational equity is an ethical concern, and our choice of any particular
norm for purposes of illustration is not meant to impose this norm as our preferred ethical judgment. Rather, we simply choose a norm we think is of general interest: namely, that generations born in the future should not pay a higher share of their lifetime incomes to the government than today's new- borns. In the U.S. context, satisfying this norm-equalizing the lifetime net tax rate of today's and tomorrow's children-requires the elimination of the current fiscal policy's 11 1 percent imbalance in growth-adjusted generational accounts.
There are many possible ways of making this adjustment, of course. One method would be to raise, immediately and permanently, all taxes at all levels of government by 11.7 percent. The second way is to reduce, immediately and permanently, all transfer payments made by all levels of government by 24.9 percent. Both policies would lead to an equalization, on a growth-adjusted
IIStatement of Senator Daniel Patrick Moynihan on the Social Security Tax Cut Act of 1991, released January 14, 1991.
Generational Accounting 85
basis, of the generational accounts of current newborns and future generations. But the two policies are significantly different in other respects.
Increasing all taxes by 11.7 percent will impose especially heavy sacrifices on young and working-aged generations. In contrast, a policy of reducing all transfer payments by 24.9 percent will place heavy burdens on older genera- tions. In fact, older females suffer relatively more from reductions in transfer payments because of their relatively lower mortality and because they earn Social Security and health benefits based on their spouses' greater earnings in the past. In either approach, however, current adult generations would have to make a considerable sacrifice to keep their children and/or future generations from bearing much higher burdens than they themselves must bear. According to our preliminary calculations, such sacrifices are about three times as large as those called for by President Clinton's first budget, enacted in August 1993-and Clinton's budget passed by only a single vote in both the House and the Senate. The political prospects for far greater sacrifices do not appear great.
Retrospective Calculations: Lifetime Tax Rates
The analysis so far has considered only the present value of future taxes and transfers. This sort of prospective analysis can compare a generation's account before and after a policy change, and it can compare the lifetime fiscal burdens of the newly born and future generations, because their entire lifetimes are in the future. However, it cannot directly compare the genera- tional accounts of one existing generation with that of another-say the generation born in 1940 with the generation born in 1960-because prospec- tive analysis does not take into account the taxes and transfer payments all living generations have paid and received in the past.
Making comparisons of the lifetime net tax treatment of existing genera- tions requires retrospective calculations that combine past taxes and transfers with the remaining generational accounts for these generations. Tables 3 (aggregate) and 4 (for males and females separately) show the results of such "lifetime" generational accounts for different generations born since 1900, expressed in terms of lifetime net tax rates, defied as the generation's account at birth divided by the present value, also evaluated at birth, of its lifetime labor income. 12As described in OMB (1993), the lifetime net tax rates in the table are calculated using historical data on estimates of actual taxes paid and transfers received by age and sex in the years 1900 through 1992, along with the projections for 1993 and subsequent years of taxes paid and transfers received
12Since lifetime taxes, transfers, and income have trended upward and have fluctuated to some extent, it is more appropriate to compare the relative fiscal burden on different generations in terms of lifetime net tax rates rather than in terms of absolute amounts.
86 Journal of Economic Perspectives
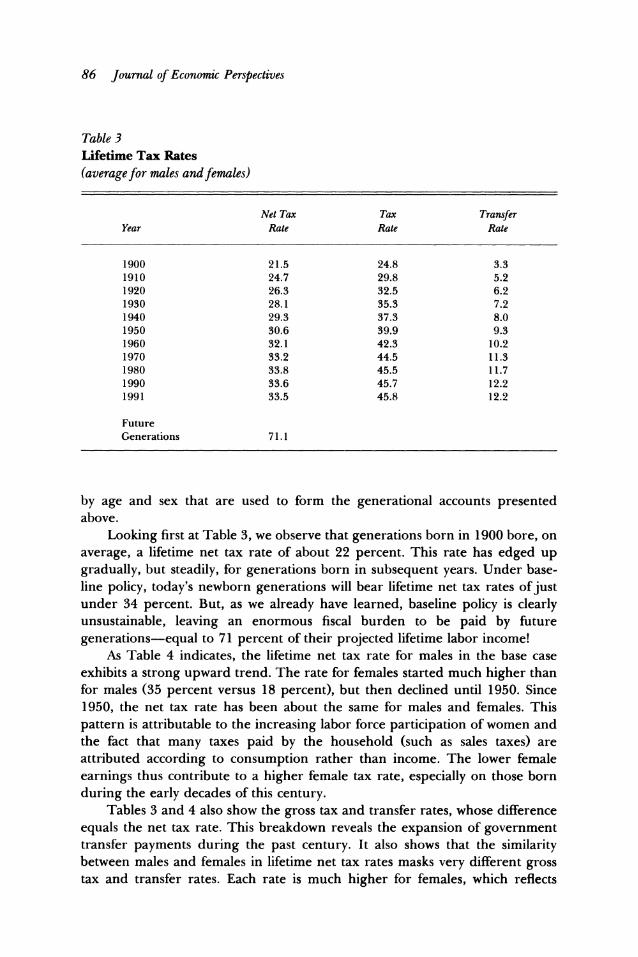
Table 3 Lifetime Tax Rates (average for males and females)
Net Tax Tax Transfer Year Rate Rate Rate
1900 21.5 24.8 3.3 1910 24.7 29.8 5.2 1920 26.3 32.5 6.2 1930 28.1 35.3 7.2 1940 29.3 37.3 8.0 1950 30.6 39.9 9.3 1960 32.1 42.3 10.2 1970 33.2 44.5 11.3 1980 33.8 45.5 11.7 1990 33.6 45.7 12.2 1991 33.5 45.8 12.2
Future Generations 71.1
by age and sex that are used to form the generational accounts presented above.
Looking first at Table 3, we observe that generations born in 1900 bore, on average, a lifetime net tax rate of about 22 percent. This rate has edged up gradually, but steadily, for generations born in subsequent years. Under base- line policy, today's newborn generations will bear lifetime net tax rates of just under 34 percent. But, as we already have learned, baseline policy is clearly unsustainable, leaving an enormous fiscal burden to be paid by future generations-equal to 71 percent of their projected lifetime labor income!
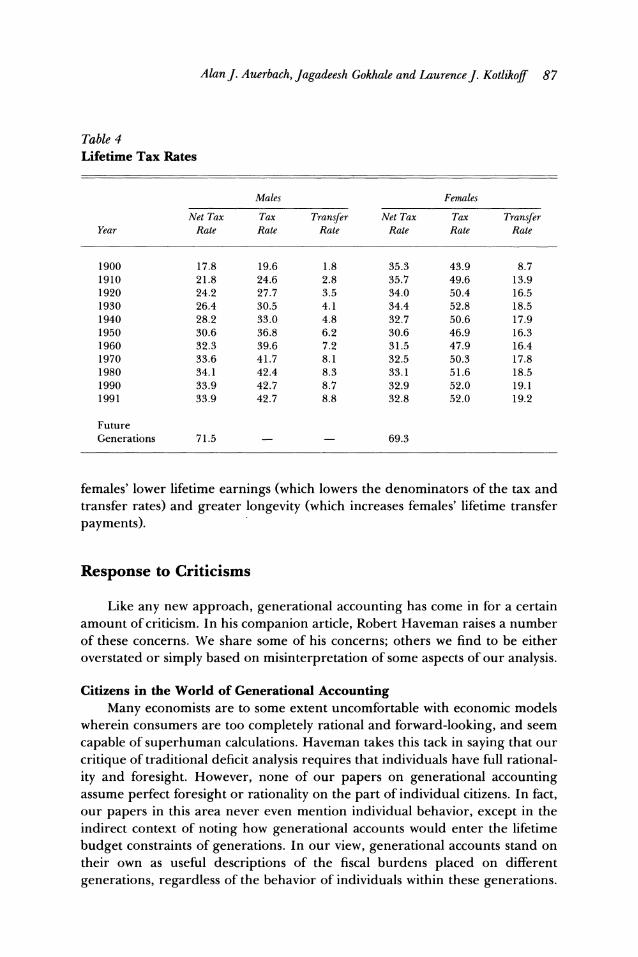
As Table 4 indicates, the lifetime net tax rate for males in the base case exhibits a strong upward trend. The rate for females started much higher than for males (35 percent versus 18 percent), but then declined until 1950. Since 1950, the net tax rate has been about the same for males and females. This pattern is attributable to the increasing labor force participation of women and the fact that many taxes paid by the household (such as sales taxes) are attributed according to consumption rather than income. The lower female earnings thus contribute to a higher female tax rate, especially on those born during the early decades of this century.
Tables 3 and 4 also show the gross tax and transfer rates, whose difference equals the net tax rate. This breakdown reveals the expansion of government transfer payments during the past century. It also shows that the similarity between males and females in lifetime net tax rates masks very different gross tax and transfer rates. Each rate is much higher for females, which reflects
AlanJ. Auerbach, Jagadeesh Gokhale and LaurenceJ. Kotlikoff 87
Table 4 Lifetime Tax Rates
Males Females
Net Tax Tax Transfer Net Tax Tax Transfer Year Rate Rate Rate Rate Rate Rate
1900 17.8 19.6 1.8 35.3 43.9 8.7 1910 21.8 24.6 2.8 35.7 49.6 13.9 1920 24.2 27.7 3.5 34.0 50.4 16.5 1930 26.4 30.5 4.1 34.4 52.8 18.5 1940 28.2 33.0 4.8 32.7 50.6 17.9 1950 30.6 36.8 6.2 30.6 46.9 16.3 1960 32.3 39.6 7.2 31.5 47.9 16.4 1970 33.6 41.7 8.1 32.5 50.3 17.8 1980 34.1 42.4 8.3 33.1 51.6 18.5 1990 33.9 42.7 8.7 32.9 52.0 19.1 1991 33.9 42.7 8.8 32.8 52.0 19.2
Future Generations 71.5 69.3
females' lower lifetime earnings (which lowers the denominators of the tax and transfer rates) and greater longevity (which increases females' lifetime transfer payments).
Response to Criticisms
Like any new approach, generational accounting has come in for a certain amount of criticism. In his companion article, Robert Haveman raises a number of these concerns. We share some of his concerns; others we find to be either overstated or simply based on misinterpretation of some aspects of our analysis.
Citizens in the World of Generational Accounting Many economists are to some extent uncomfortable with economic models
wherein consumers are too completely rational and forward-looking, and seem capable of superhuman calculations. Haveman takes this tack in saying that our critique of traditional deficit analysis requires that individuals have full rational- ity and foresight. However, none of our papers on generational accounting assume perfect foresight or rationality on the part of individual citizens. In fact, our papers in this area never even mention individual behavior, except in the indirect context of noting how generational accounts would enter the lifetime budget constraints of generations. In our view, generational accounts stand on their own as useful descriptions of the fiscal burdens placed on different generations, regardless of the behavior of individuals within these generations.
88 Journal of Economic Perspectives
Allocating the Generation-Specific Benefits of Government Purchases Some readers may be concerned that by calculating net taxes, we may seem
to be implying that the remainder of government spending has no particular value. However, in not attempting to impute to generations the value of government purchases, we have not meant to suggest that this value is zero. Indeed, in some of our work we have allocated government spending on education by age and sex (Auerbach et al., 1993). But, apart from education, there is no clear method for allocating the benefits of government purchases, such as defense expenditures, across generations. In helping to clarify which generations will pay for government purchases, we hope also to stimulate more careful consideration of who the beneficiaries of these purchases are. In addition, many uses of generational accounting do not present any issue of how to allocate the benefits of government purchases among generations. For example, many of the issues discussed earlier in this paper involve changes in which generations will pay for government purchases, rather than changes in either the present value of these purchases or their composition.
Incorporating Future Changes in the Economy and Economic Policy Tomorrow will certainly be different from today, and generational ac-
counts should take some of those differences into account. However, Haveman expresses concern that citizens in generational accounting models ignore the future performance of the economy, as well as expected changes in fiscal policy. In fact, generational accounting does neither. As mentioned, it incorporates the short-term as well as long-term forecasts of OMB, Social Security, and Medicare and Medicaid. These forecasts take into account the short-run and likely long-run performance of the economy, as well as the likely course of fiscal policy given existing legislation. For example, OMB's short-term forecast of income tax receipts takes into account the economy's current position in the business cycle; Social Security's forecast takes into account the scheduled rise after the turn of the century in the social security retirement age; and the Health Care Finance Administration's long-term forecast of government health care spending takes into account the likely growth in this spending due to the projected growth in the utilization and price of health care services. In evaluat- ing existing policy in terms of generational accounts, we certainly are not asserting that this course of policy is immutable. To the contrary, in asking what would happen if policy were not to change, we are illustrating the inevitability of such policy changes, and offering an analytical framework within which the fiscal policy implications and intergenerational impacts of any changes can be examined.
Macroeconomic Feedback Effects The analysis presented here does not incorporate general equilibrium
feedback effects, a fact that Haveman points out in his criticism. In the basic framework, changes in taxes affect after-tax income, but not the amount of
Generational Accounting 89
working and saving and investment that occurs. In future versions of genera- tional accounting we hope to incorporate these effects. But as we've argued in other articles, factor price feedback effects occur very gradually, so their impact on the discounted values comprising the generational accounts are likely to be small (Auerbach and Kotlikoff, 1987). Moreover, the inclusion of factor price effects is likely to reinforce the conclusions about the generational impact of policy changes. For example, policies that decrease the generational accounts of current generations and increase those of future generations will stimulate more current consumption and, thereby, reduce the saving available to finance investment. This, in turn, will lower real wage growth and raise real interest rates, which, on balance, will harm future generations. Finally, we must note that this critique also applies to the traditional deficit accounting methods, in which the types of behavioral corrections we have just outlined would not be possible.
The Choice of Discount Rate Clearly, some discount rate is needed to carry out generational accounting,
but there is room for argument about the most appropriate rate. If the flows of government payments, receipts and expenditures were certain and riskless, it would clearly be appropriate to use the government's borrowing rate, essen- tially a risk-free rate, in our calculations. However, these flows are somewhat uncertain, a fact which taxpayers must take into account. Because government receipts and expenditures appear to be risky, but less volatile than the real return on capital, we choose for our base case a 6 percent discount rate, which lies roughly half-way between the real historical returns on government bonds and private sector capital (OMB, 1993). Haveman criticizes this use of a uniform discount rate for expenditures, transfers and taxes. Since the same discount rate is correct only if the flows have the same risk characteristics, we readily admit that our use of a single discount rate is an oversimplification, and that the methodology can be improved here.'3 Indeed, we made exactly this point in our original presentation of generational accounts (Auerbach, Gokhale, and Kotlikoff, 1991, p. 75).
The Treatment of Capital Income Taxes As mentioned, for most taxes we make the standard incidence assumptions
used in static studies (for example, Pechman, 1985). Taxes on capital income require special treatment, because some taxes on capital may be capitalized into the values of existing assets. If, for example, new assets received more favorable tax treatment than existing ones, it is natural to expect that existing assets
'3At a more specific level, though, we find Haveman's argument to be invalid. He suggests that risk aversion implies that if government receipts are discounted at a rate above the risk-free rate, then government transfers and expenditures should be discounted at a rate below the risk-free rate. This is not correct in general, and holds only if transfers and expenditures are generally higher in "bad" states of nature when resources are highly valued.
90 Journal of Economic Perspectives
would sell at a discount. Thus, it would be inappropriate to assign the entire burden of future taxes on these existing assets to taxpayers who happen to own these assets in the future. Robert Haveman describes this procedure as "con- troversial" and suggests tests of the sensitivity of our conclusions with respect to this assumption. While our original paper on the subject presents such tests (Auerbach, Gokhale, and Kotlikoff, 1991, Tables lb, 2b), we take issue with the description of this procedure as controversial. It is nothing more than a generalization of the assumption that a tax on land rent is born by the owner of the land at the time the tax is imposed.'4
Bequests and Offsetting Private Intergenerational Transfers Government intergenerational redistribution may either substitute for, or
be offset by, private intergenerational transfers. While we believe that there is very strong and mounting evidence against the kind of intergenerational altruism needed for such a result (for example, Altonji, Hayashi, and Kotlikoff, 1992; Abel and Kotlikoff, forthcoming 1994), generational accounting is worth doing regardless of the degree of such altruism. If there is, as we strongly suspect, very little response of private transfers to changes in generational accounts, the generational accounts tell us the net redistribution across genera- tions. Even if private intergenerational transfers fully offset government trans- fers, the generational accounts tell us the degree to which the government redistribution across cohorts must be offset by private transfers. Furthermore, if we want to understand the degree to which the private sector nullifies govern- ment intergenerational redistribution we need first to measure it, which is precisely what generational accounting tries to do.'5
Generational Accounting vs. the Budget Deficit The case for generational accounting, as for any statistic, does not depend
in the end on whether it is perfect, but rather on whether it improves upon the alternative. Haveman offers several arguments in defense of the conventional budget deficit. First, if individuals are liquidity constrained or distortionary taxes are used to finance government expenditures, Haveman suggests that the budget deficit becomes a more theoretically appropriate measure of fiscal policy. As Kotlikoff (1993) shows, this is not the case. Kotlikoff points out that the government's labeling of its receipts and payments, and thus its definition of the deficit, is no less arbitrary in settings that include distortionary taxation,
14It certainly does not assume a shift to cash-flow capital income taxation, although it is capable of analyzing such a shift. '5Such analysis could well find that, rather than offsetting government intergenerational redistribu- tion, the private sector reinforces this redistribution. As Cox and Rank (1992) point out, if intergenerational transfers arise, not because of altruism, but through a process in which parents bargain with their children over particular services, government redistribution say, to parents from children, may strengthen the bargaining position of parents, permitting them to extract even more resources from their children.
AlanJ. Auerbach, Jagadeesh Gokhale and LaurenceJ. Kotlikoff 91
liquidity constraints, and, for that matter, uncertainty, including uncertainty about government policy.'6
There seems to be a general misconception (see, for example, Bohn, 1991; Buiter, 1993) that generational accounting requires that taxes and transfers be nondistortionary. Perhaps the easiest way to demonstrate the irrelevance of this point is through a comparison of wage and consumption taxation, illustrated in Auerbach and Kotlikoff (1987). Under a system of proportional taxation, a consumption tax is equivalent to a tax on labor income plus initial assets. Neither of these tax systems is nondistortionary-they induce the same distor- tion of the choice between labor and leisure. Yet the timing of tax collections from each household, while equal in present value, have quite different time patterns, with consumption taxes occurring much later in life. Hence, a distor- tionary consumption tax will appear to generate more of a current deficit than the equivalent distortionary tax on labor income plus initial assets.
Haveman next argues that generational accounting would be as subject to manipulation for political purposes as is the deficit. This is not, of course, a reason to prefer deficit accounting to generational accounting. But, in any case, we disagree that the potential for manipulation of generational accounts is as great as it is in the case of the budget deficit. Generational accounting, because it has a conceptual basis, has some natural defenses against the myriad "smoke and mirrors games" that have become such a routine part of U.S. federal fiscal affairs. In contrast, the deficit has no conceptual basis, and is thus open to manipulation of what is to be included and excluded.
Alas, even generational accounting is not impervious to misuse. Ideally, it would be done by an independent set of experts and, as a result, be relatively insulated from political manipulation. A good example here is the Social Security Trustees' annual long-term projections of Social Security's finances. This Trustees' Report, which is compiled by Social Security's actuaries, has been quite free of political manipulation.
Third, certain measures of the deficit perform reasonably well in explain- ing macroeconomic variables in certain time-series empirical analyses, at least according to Haveman. In our view, the empirical literature relating "the" deficit to macroeconomic variables simply reinforces the view that the deficit is whatever any particular economist chooses it to be. While a series of studies by Evans (for example, 1985, 1986, 1987a, 1987b) finds no evidence that deficit measures help explain either consumption, interest rates, exchange rates, or current accounts, Haveman counters with other studies that, after making
161n his discussion of liquidity constraints, Kotlikoff relies on Hayashi's (1987) demonstration that liquidity constraints are not necessarily immutable, but will adjust to changes in the timing of the government's net taxation. While there are some specifications of liquidity constraints in which Hayashi's argument does not go through, the relevance of these special cases is not clear. What is clear, however, is that the importance of liquidity constraints is overstated; the vast majority of Americans as well as citizens of other developed countries are not liquidity constrained. See, for example, Zeldes (1989).
92 Journal of Economic Perspectives
further "corrections" to the measured deficit, do produce the empirical rela- tionship between interest rates and deficits that he expects. Our only question is, given that an arbitrary number of such corrections can be made, when does the researcher know when to stop?
Fourth, Haveman says that changes in the deficit tell us about the relative fiscal burdens being imposed on existing versus future generations. As we have just shown in the comparison of consumption and labor income taxation, the deficit can change with no change in the intergenerational distribution of net tax burdens. In addition, as Kotlikoff (1992) shows, most postwar U.S. inter- generational redistribution has involved policies that have not increased the measured deficit.
Haveman also defends the deficit because the numbers are "accurate," because they inform us about the annual flows of spending and taxes, because they provide a basis for fiscal discipline, because they tell us whether net debt is growing, and because they can somehow be improved through accrual account- ing and the like. By contrast (and apparently ignoring the enormous changes in projected budget deficits that have occurred over the same time period), he draws attention to the fact that our estimates of generational accounts and the size of the intergenerational fiscal imbalance have changed over time.17
We find most of this argument to be close to a tautology, saying essentially that the deficit measures the deficit accurately and that the deficit is measured to be the change in the debt. No one knows what the "accurate and consistent" deficit numbers are supposed to be measuring, nor which government receipts to label as taxes and which government payments to label as spending, nor how to correct the deficit for all its shortcomings.'8 If this is indeed the best that can be said for conventional fiscal analysis, than surely it is time for a fresh approach.
Conclusion
Generational accounting represents a new and comprehensive method of long-term fiscal planning. Unlike the budget deficit, generational accounting is not an arbitrary accounting construct. Rather it is a prescription, based on economic theory, for how to assess the generational burden and macroeco- nomic effects of fiscal policy. While improvements in the methodology remain to be made, generational accounting is now routinely being used by the U.S. government. It is also being used or developed by the governments of several other countries, including Japan, Italy and Norway.
'7Indeed, most of the variation to which he objects results from his comparison of a particular calculation in Kotlikoff (1992) that is based on different assumptions than those used on OMB (1993). 18We are reminded of the familiar story of the two men lost in a balloon who, seeing an economist on the ground, ask where they are. Quite accurately, the economist replies, "In a balloon."
Generational Accounting 93
Generational accounting describes not only the burdens that fiscal policy places on different generations, but also the changes in policy needed to alter the distribution of such burdens. In the case of U.S. fiscal policy, achieving the goal of stabilizing lifetime tax rates of future generations of Americans will require a much more significant sacrifice by current generations than politi- cians seem to realize. As long as our politicians rely on deficit accounting, they are likely not to recognize the extremely serious consequences of their delay in addressing the current generational imbalance in U.S. fiscal policy.
* This paper draws from our other work, including Auerbach, Gokhale and Kotlikoff (1991, 1992a, 1992b), Auerbach et al. (1993), Kotlikoff (1992), and from Office of Management and Budget (1993). We thank Robert Kilpatrick, Bruce Baker, Barry Anderson, and other economists at OMB for their collaboration. We are very grateful to Mr. Lawrence Benenson for funding research on generational accounting. Auerbach also acknowledges the support of the National Science Foundation (grant #SES9022707), and the Edward Netter Research Fund.

94 Journal of Economic Perspectives
References
Abel, Andrew and Laurence J. Kotlikoff, "Intergenerational Altruism and the Effec- tiveness of Fiscal Policy: New Tests Based on Cohort Data." In Tachibanaki, T., ed., Savings and Bequests, forthcoming 1994.
Altonji, Joseph, Fumio Hayashi, and Lau- rence J. Kotlikoff, "Is the Extended Family Altruistically Linked? Direct Tests Using Mi- croData," American Economic Review, Decem- ber 1992, 82:5, 1177-98.
Auerbach, Alan J., and Laurence J. Kot- likoff, Dynamic Fiscal Policy. Cambridge: Cam- bridge University Press, 1987.
Auerbach, Alan J., Jagadeesh Gokhale, and Laurence J. Kotlikoff, "Generational Ac- counts: A Meaningful Alternative to Deficit Accounting." In Bradford, D., ed., Tax Policy and the Economy, vol. 5. Cambridge: MIT Press, 1991, 55-110.
Auerbach, Alan J., Jagadeesh Gokhale, and Laurence J. Kotlikoff, "Generational Account- ing: A New Approach to Understanding the Effects of Fiscal Policy on Saving," Scandina- vian Journal of Economics, June 1992a, 94:2, 303- 18.
Auerbach, Alan J., Jagadeesh Gokhale, and Laurence J. Kotlikoff, "Social Security and Medicaid Policy from the Perspective of Gen- erational Accounting." In Poterba, J., ed. Tax Policy and the Economy vol. 6. Cambridge: MIT Press, June 1992b, 129-45.
Auerbach, Alan J., Jagadeesh Gokhale, and Laurence J. Kotlikoff, and Erling Steigum, Jr., "Generational Accounting in Norway: Is Norway Overconsuming Its Petroleum Wealth," mimeo, Boston University, 1993.
Bohn, Henning, "Budget Deficits and Gov- ernment Accounting," Rodney L. White Cen- ter Research Paper No. 28-91, Wharton School, 1991.
Buiter, Willem, "Public Debt in the USA: How Much, How Bad and Who Pays?" NBER Working Paper No. 4362, Cambridge, May 1993.
Congressional Budget Office, The Economic and Budget Outlook: Fiscal Years 1994-1998, January 1993.
Cox, Donald, and Mark Rank, "Inter-Vivos Transfers and Intergenerational Exchange," mimeo, Boston College, 1992.
Evans, Paul, "Do Large Deficits Produce High Interest Rates?" American Economic Re- view, March 1985, 75:1, 68-87.
Evans, Paul, "Is the Dollar High Because of Large Budget Deficits?" Journal of Monetary Economics, November 1986, 18:3, 227-49.
Evans, Paul, "Interest Rates and Expected Future Budget Deficits in the United States," Journal of Political Economy, February 1987a, 95:1, 34-58.
Evans, Paul, "Do Budget Deficits Raise Nominal Interest Rates? Evidence From Six Countries," Journal of Monetary Economics, September 1987b, 20:2, 551-66.
Fullerton, Don, and Diane Lim Rogers, Who Bears the Lifetime Tax Burden? Washington, D.C.: Brookings Institution, 1993.
Hayashi, Fumio, "Tests for Liquidity Con- straints: A Critical Survey and Some New Ob- servations." In Bewley, Truman F., ed., Ad- vances in Econometrics, Fifth World Congress, vol. 2. Cambridge, UK: Cambridge University Press, 1987.
Kotlikoff, Laurence J., "Deficit Delusion," The Public Interest, Summer 1986, no. 84, 53-65.
Kotlikoff, Laurence J., Generational Account- ing-Knowing Who Pays, and When, for What we Spend. New York: Free Press, 1992.
Kotlikoff, Laurence J., "From Deficit Delu- sion to the Fiscal Balance Rule-Looking for a Sensible Way to Measure Fiscal Policy," Jour- nal of Economics, Supplement 7, 1993, 17-41.
Office of Management and Budget, Budget Baselines, Historical Data, and Alternatives for the Future, January 1993, Appendix, ch. F.
Pechman, Joseph A., Who Paid the Taxes, 1960-85? Washington, D.C.: Brookings Insti- tution, 1985.
Zeldes, Stephen P., "Consumption and Li- quidity Constraints: An Empirical Investiga- tion," Journal of Political Economy, April 1989, 97:2, 305-46.