Embed Size (px)
Citation preview
fraserinstitute.org FRASER RESEARCH BULLETIN 1
F R A S E R RESEARCHBULLETIN
�� Manitoba had the highest percentage of tax filers that donated to charity among the provinces (24.6%) during the 2015 tax year while New Brunswick and Quebec had the lowest (19.3%). Manitoba also donated the highest percentage of its aggregate income to charity among the prov inces (0.83%) while Quebec donated the lowest (0.26%).
�� The general trend in recent years is that a declining percentage of Canadian tax filers are donating to charity and they are donating less as a percentage of income.
�� Nationwide, a lower percentage of tax filers donated to charity in Canada (20.9%) than in the United States (24.5%). Similarly, Canadians (at 0.56%) gave a lower percentage of their aggregate income to charity than did Americans (at 1.43%).
�� The percentage of tax filers donating to charity varies significantly among US states and Canadian provinces and territories. On this indicator, Manitoba is the only Canadian jurisdiction that ranks among the top 20 (ranked 19th out of 64).
�� The percentage of aggregate income donated was generally less in the Canadian provinces and territories than in the US states. There were only three US states (Alaska, Maine, and West Virginia) where the percentage of aggregate income donated was less than the percentage donated in Manitoba (0.83%), Canada’s highest ranked province.
�� US jurisdictions top the overall Generosity Index rankings. Utah places first (scoring 8.7 out of 10.0), followed by Maryland (7.7) and District of Columbia (7.1). Manitoba is the highest-scoring Canadian province (3.8) but ranks only 37th overall out of 64 North American jurisdictions.
Summary
FROM THE CENTRE FOR FISCAL POLICY December 2017
0.77
0.560.50
0.55
0.60
0.65
0.70
0.75
0.80
2005 2010 2015
Percentage of household income donated to Canadian charities
CANADIAN CHARITABLE DONATIONS
by Charles Lammam, Sazid Hasan, and Hugh MacIntyre
Generosity in Canada and the United States:
The 2017 Generosity Index
Generosity in Canada and the United States: The 2017 Generosity Index
fraserinstitute.org FRASER RESEARCH BULLETIN 2
IntroductionInterest in the charitable sector heightens each year as the holiday season approaches. This sector is actively engaged in providing social services such as counselling, crisis prevention, basic necessities, and education to help vul-nerable people in need. Charities depend on the generosity of thousands of ordinary citi-zens who give privately from their own funds to enhance the quality of life in their communities and beyond.
The Fraser Institute’s annual Generosity Index measures this private monetary generosity using readily available data on the extent and depth of charitable donations, as recorded on personal income tax returns in Canada and the United States.1 As it has done in previous years, the 2017 index reveals a substantial generosity gap between the two countries.
1 While earlier editions of the Generosity Index incorporated donations of time as well as money (Francis, 1998; Clemens and Samida, 1999), the Can-ada Revenue Agency (CRA) no longer collects data on volunteer time donated to charity. For survey data on rates of volunteerism in Canada, see Statis-tics Canada, 2015. While directly comparable data are not readily available for the United States, the Bureau of Labor Statistics has published survey data on volunteerism in the United States (United States, Bureau of Labor Statistics, 2016). In addi-tion, it should be noted that in Canada it is possible to carry charitable contributions forward for up to five years after the year they were originally made. Thus, donations reported for the 2015 tax year could include donations that were made in any of the five previous years. In the United States, however, chari-table contributions must be made before the end of the tax year to be deductible (United States Internal Revenue Service, 2017b).
The Generosity IndexThe Generosity Index measures private mon-etary generosity using two key indicators. The percentage of tax filers donating to charity indi cates the extent of generosity, while the per centage of aggregate personal income donated to charity indicates the depth of charitable giving.2 Though not used to calculate the Generosity Index scores, the average dollar value of chari table donations given in a year provides additional information on the level of private generosity in each juris diction.3
The jurisdictions included in the index are Canada’s 10 provinces and 3 territories, the 50 US states, and the District of Columbia. The data used are from the 2015 tax year—the most recent year for which comparable data are available for both Canada and the United States. The data collected for the Generosity Index show stark differences in charitable giv-ing among the Canadian provinces and territo
2 Aggregate income is the sum of the total income earned by every individual in each jurisdiction con-sidered for the index. Currently, more than 80,000 charities are registered with the CRA. This figure and the data used for the Generosity Index only include organizations formally registered with the CRA or those classified as 501(c)(3) organizations with the US Internal Revenue Service (IRS) that are able to issue tax receipts and accept grants and donations from philanthropic foundations (Canada Revenue Agency, 2017b). Canada’s non-profit sec-tor also includes several thousand organizations that are exempt from paying income tax, but may not issue tax-deductible receipts to donors. The US non-profit sector also includes 501(c)(4) social and welfare organizations that are not eligible for tax-receiptable contributions.
3 The average dollar value of donations is excluded from the Generosity Index because it is a poor esti-mate of individual generosity as it favours relatively wealthy jurisdictions over relatively poor ones.
Generosity in Canada and the United States: The 2017 Generosity Index
fraserinstitute.org FRASER RESEARCH BULLETIN 3
ries, as well as between Canada and the United States.
Charitable giving in Canada
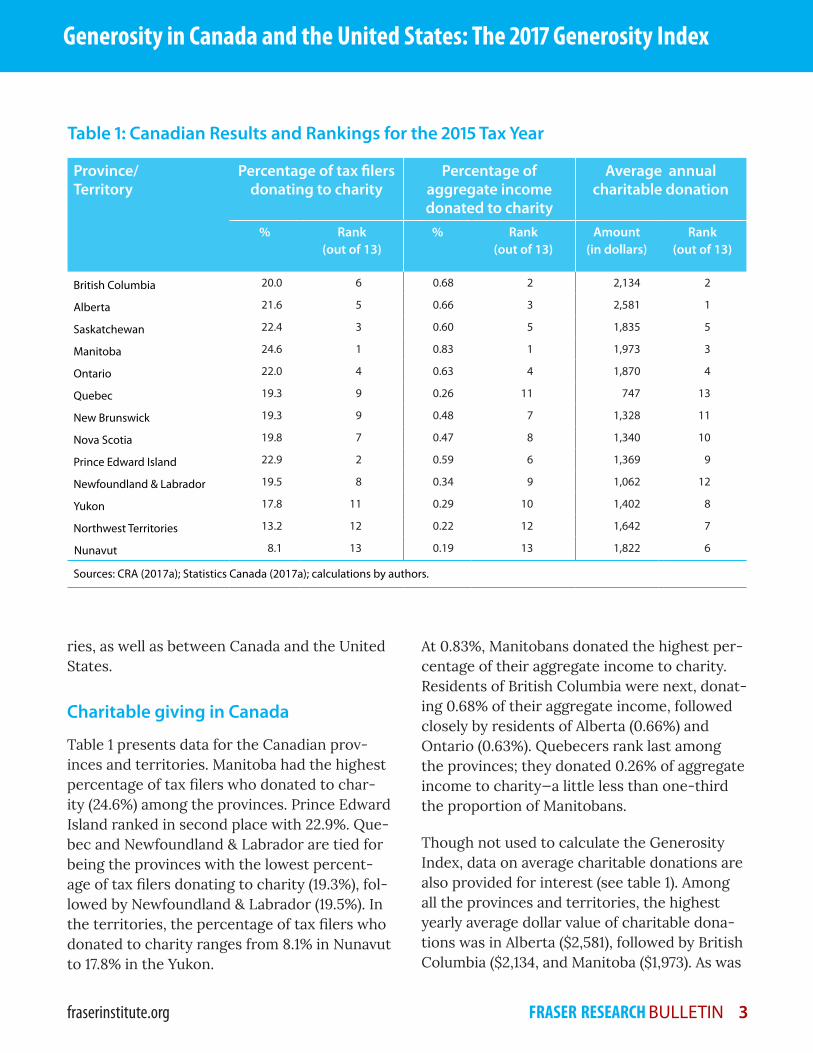
Table 1 presents data for the Canadian provinces and territories. Manitoba had the highest percentage of tax filers who donated to char-ity (24.6%) among the provinces. Prince Edward Island ranked in second place with 22.9%. Quebec and Newfoundland & Labrador are tied for being the provinces with the lowest percentage of tax filers donating to charity (19.3%), followed by Newfoundland & Labrador (19.5%). In the territories, the percentage of tax filers who donated to charity ranges from 8.1% in Nunavut to 17.8% in the Yukon.
At 0.83%, Manitobans donated the highest percentage of their aggregate income to char ity. Residents of British Columbia were next, donat-ing 0.68% of their aggregate income, followed closely by residents of Alberta (0.66%) and Ontario (0.63%). Quebecers rank last among the provinces; they donated 0.26% of aggregate income to charity—a little less than one-third the proportion of Manitobans.
Though not used to calculate the Generosity Index, data on average charitable donations are also provided for interest (see table 1). Among all the provinces and territories, the highest yearly average dollar value of charitable donations was in Alberta ($2,581), followed by British Columbia ($2,134, and Manitoba ($1,973). As was
Table 1: Canadian Results and Rankings for the 2015 Tax Year
Province/ Territory
Percentage of tax filers donating to charity
Percentage of aggregate income donated to charity
Average annual charitable donation
% Rank (out of 13)
% Rank (out of 13)
Amount (in dollars)
Rank (out of 13)
British Columbia 20.0 6 0.68 2 2,134 2
Alberta 21.6 5 0.66 3 2,581 1
Saskatchewan 22.4 3 0.60 5 1,835 5
Manitoba 24.6 1 0.83 1 1,973 3
Ontario 22.0 4 0.63 4 1,870 4
Quebec 19.3 9 0.26 11 747 13
New Brunswick 19.3 9 0.48 7 1,328 11
Nova Scotia 19.8 7 0.47 8 1,340 10
Prince Edward Island 22.9 2 0.59 6 1,369 9
Newfoundland & Labrador 19.5 8 0.34 9 1,062 12
Yukon 17.8 11 0.29 10 1,402 8
Northwest Territories 13.2 12 0.22 12 1,642 7
Nunavut 8.1 13 0.19 13 1,822 6
Sources: CRA (2017a); Statistics Canada (2017a); calculations by authors.
Generosity in Canada and the United States: The 2017 Generosity Index
fraserinstitute.org FRASER RESEARCH BULLETIN 4
the case last year, Quebec ranked last among the provinces and territories with an average yearly value of charitable donations of $747—less than half the national average of $1,699.
Canadian giving trends from 2004 to 2015
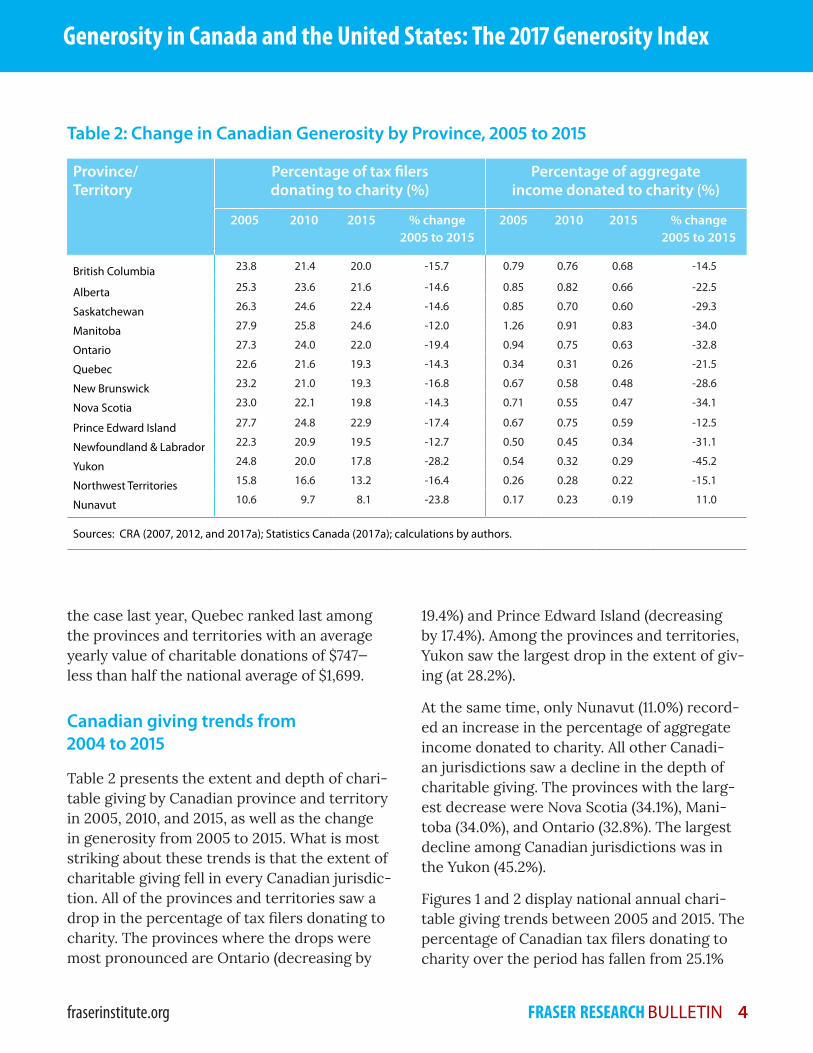
Table 2 presents the extent and depth of charitable giving by Canadian province and ter ritory in 2005, 2010, and 2015, as well as the change in generosity from 2005 to 2015. What is most striking about these trends is that the extent of charitable giving fell in every Canadian jurisdiction. All of the provinces and territories saw a drop in the percentage of tax filers donating to charity. The provinces where the drops were most pronounced are Ontario (decreasing by
19.4%) and Prince Edward Island (decreasing by 17.4%). Among the provinces and territories, Yukon saw the largest drop in the extent of giving (at 28.2%).
At the same time, only Nunavut (11.0%) recorded an increase in the percentage of aggregate income donated to charity. All other Canadi-an jurisdictions saw a decline in the depth of charitable giving. The provinces with the largest decrease were Nova Scotia (34.1%), Manitoba (34.0%), and Ontario (32.8%). The largest decline among Canadian jurisdictions was in the Yukon (45.2%).
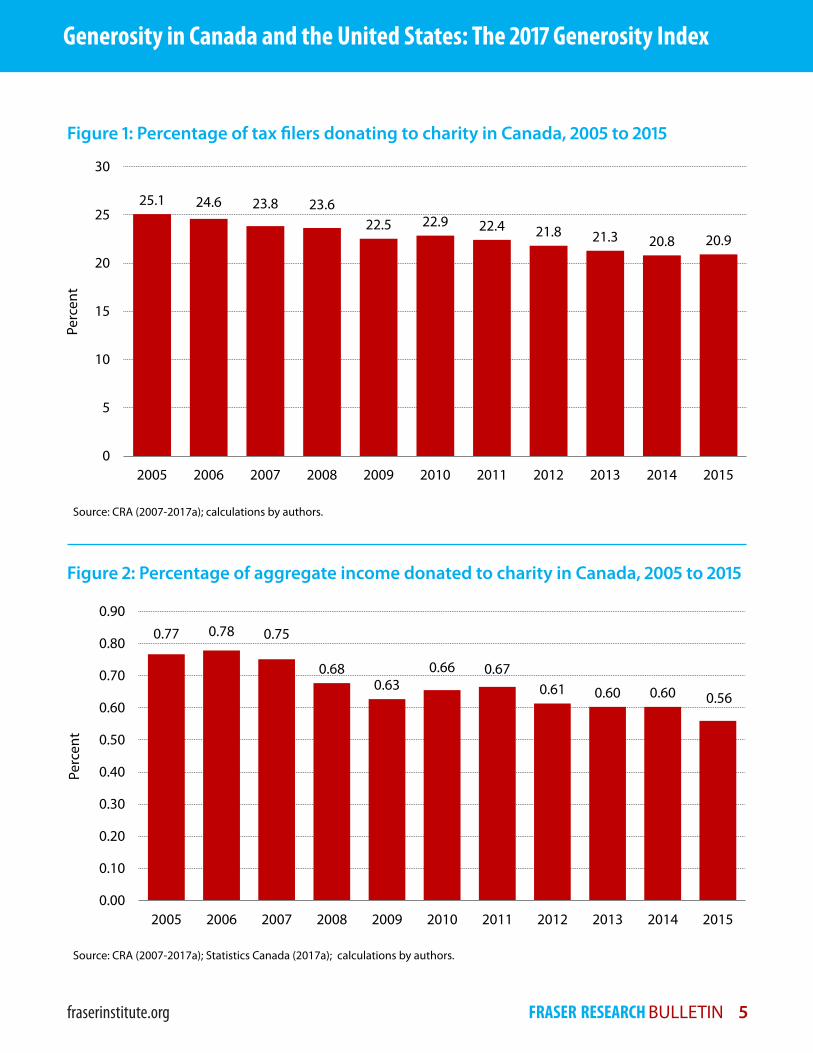
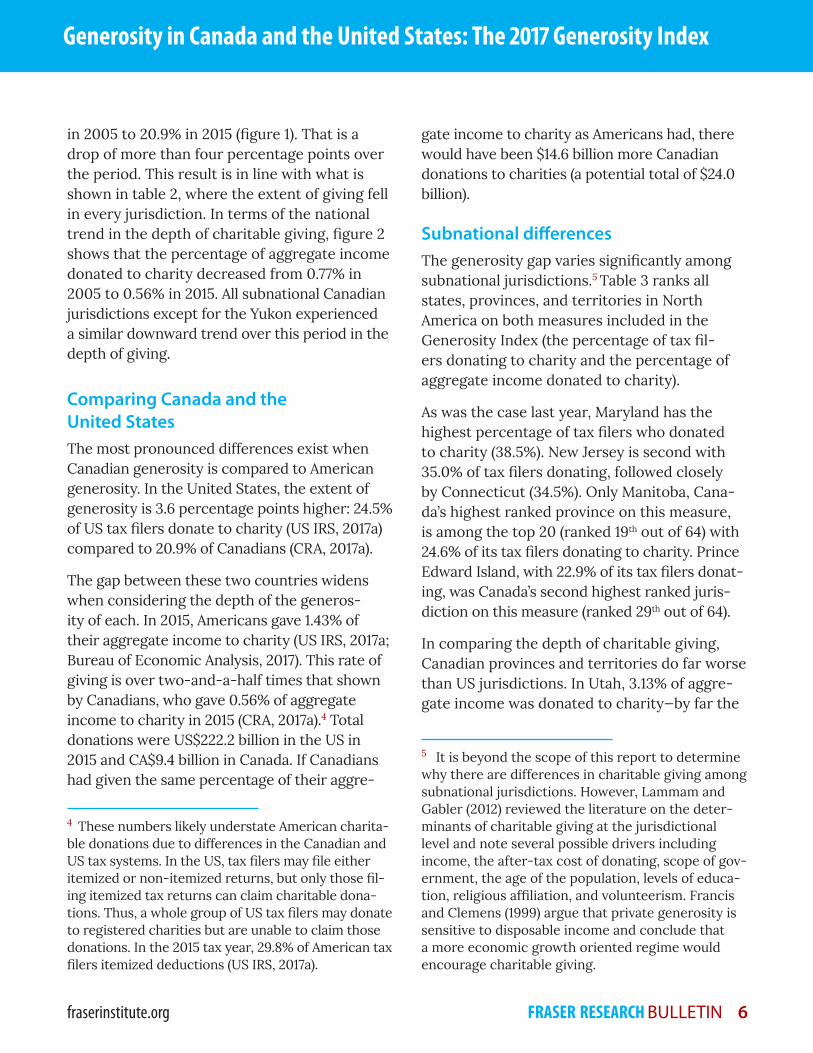
Figures 1 and 2 display national annual chari-table giving trends between 2005 and 2015. The percentage of Canadian tax filers donating to charity over the period has fallen from 25.1%
Table 2: Change in Canadian Generosity by Province, 2005 to 2015
Province/ Territory
Percentage of tax filers donating to charity (%)
Percentage of aggregate income donated to charity (%)
2005 2010 2015 % change 2005 to 2015
2005 2010 2015 % change 2005 to 2015
British Columbia 23.8 21.4 20.0 -15.7 0.79 0.76 0.68 -14.5
Alberta 25.3 23.6 21.6 -14.6 0.85 0.82 0.66 -22.5
Saskatchewan 26.3 24.6 22.4 -14.6 0.85 0.70 0.60 -29.3
Manitoba 27.9 25.8 24.6 -12.0 1.26 0.91 0.83 -34.0
Ontario 27.3 24.0 22.0 -19.4 0.94 0.75 0.63 -32.8
Quebec 22.6 21.6 19.3 -14.3 0.34 0.31 0.26 -21.5
New Brunswick 23.2 21.0 19.3 -16.8 0.67 0.58 0.48 -28.6
Nova Scotia 23.0 22.1 19.8 -14.3 0.71 0.55 0.47 -34.1
Prince Edward Island 27.7 24.8 22.9 -17.4 0.67 0.75 0.59 -12.5
Newfoundland & Labrador 22.3 20.9 19.5 -12.7 0.50 0.45 0.34 -31.1
Yukon 24.8 20.0 17.8 -28.2 0.54 0.32 0.29 -45.2
Northwest Territories 15.8 16.6 13.2 -16.4 0.26 0.28 0.22 -15.1
Nunavut 10.6 9.7 8.1 -23.8 0.17 0.23 0.19 11.0
Sources: CRA (2007, 2012, and 2017a); Statistics Canada (2017a); calculations by authors.
Generosity in Canada and the United States: The 2017 Generosity Index
fraserinstitute.org FRASER RESEARCH BULLETIN 5
Figure 2: Percentage of aggregate income donated to charity in Canada, 2005 to 2015
Figure 1: Percentage of tax filers donating to charity in Canada, 2005 to 2015
Source: CRA (2007-2017a); calculations by authors.
Source: CRA (2007-2017a); Statistics Canada (2017a); calculations by authors.
25.1 24.6 23.8 23.622.5 22.9 22.4 21.8 21.3 20.8 20.9
0
5
10
15
20
25
30
2005 2006 2007 2008 2009 2010 2011 2012 2013 2014 2015
Perc
ent
0.77 0.78 0.75
0.680.63
0.66 0.670.61 0.60 0.60 0.56
0.00
0.10
0.20
0.30
0.40
0.50
0.60
0.70
0.80
0.90
2005 2006 2007 2008 2009 2010 2011 2012 2013 2014 2015
Perc
ent
Generosity in Canada and the United States: The 2017 Generosity Index
fraserinstitute.org FRASER RESEARCH BULLETIN 6
in 2005 to 20.9% in 2015 (figure 1). That is a drop of more than four percentage points over the period. This result is in line with what is shown in table 2, where the extent of giving fell in every jurisdiction. In terms of the national trend in the depth of charitable giving, figure 2 shows that the percentage of aggregate income donated to charity decreased from 0.77% in 2005 to 0.56% in 2015. All subnational Canadian jurisdictions except for the Yukon experienced a similar downward trend over this period in the depth of giving.
Comparing Canada and the United States The most pronounced differences exist when Canadian generosity is compared to Ameri can generosity. In the United States, the extent of generosity is 3.6 percentage points higher: 24.5% of US tax filers donate to charity (US IRS, 2017a) compared to 20.9% of Canadians (CRA, 2017a).
The gap between these two countries widens when considering the depth of the generosity of each. In 2015, Americans gave 1.43% of their aggregate income to charity (US IRS, 2017a; Bureau of Economic Analysis, 2017). This rate of giving is over two-and-a-half times that shown by Canadians, who gave 0.56% of aggregate income to charity in 2015 (CRA, 2017a).4 Total donations were US$222.2 billion in the US in 2015 and CA$9.4 billion in Canada. If Canadians had given the same percentage of their aggre-
4 These numbers likely understate American charita-ble donations due to differences in the Canadian and US tax systems. In the US, tax filers may file either itemized or non-itemized returns, but only those fil-ing itemized tax returns can claim charitable dona-tions. Thus, a whole group of US tax filers may donate to registered charities but are unable to claim those donations. In the 2015 tax year, 29.8% of American tax filers itemized deductions (US IRS, 2017a).
gate income to charity as Americans had, there would have been $14.6 billion more Canadian donations to charities (a potential total of $24.0 billion).
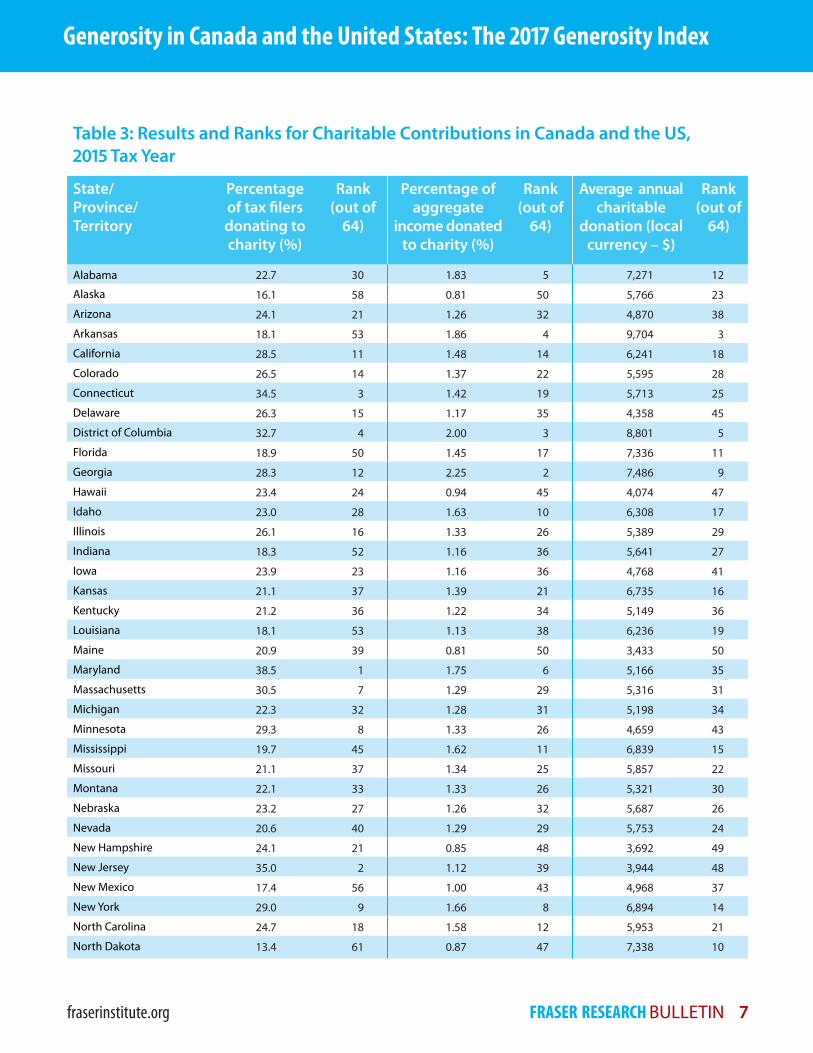
Subnational differences The generosity gap varies significantly among subnational jurisdictions.5 Table 3 ranks all states, provinces, and territories in North America on both measures included in the Generosity Index (the percentage of tax fil-ers donating to charity and the percentage of aggregate income donated to charity).
As was the case last year, Maryland has the highest percentage of tax filers who donated to charity (38.5%). New Jersey is second with 35.0% of tax filers donating, followed closely by Connecticut (34.5%). Only Manitoba, Cana-da’s highest ranked province on this measure, is among the top 20 (ranked 19th out of 64) with 24.6% of its tax filers donating to charity. Prince Edward Island, with 22.9% of its tax filers donat-ing, was Canada’s second highest ranked juris-diction on this measure (ranked 29th out of 64).
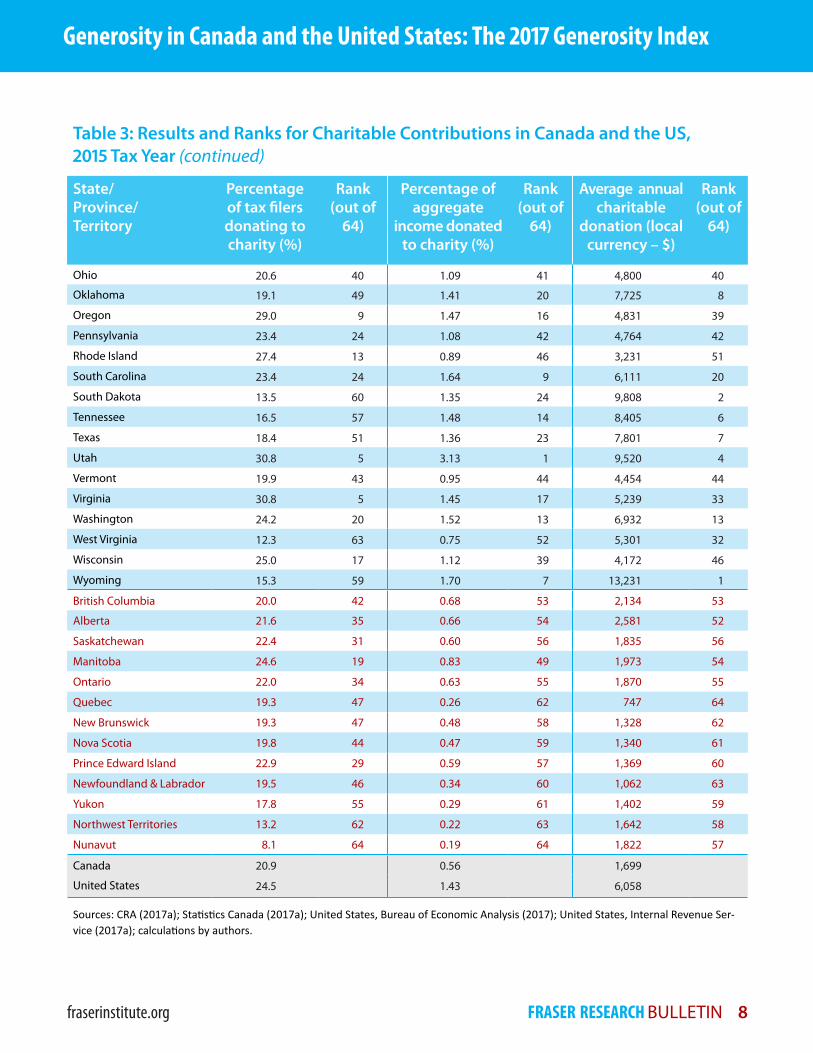
In comparing the depth of charitable giving, Canadian provinces and territories do far worse than US jurisdictions. In Utah, 3.13% of aggre-gate income was donated to charity—by far the
5 It is beyond the scope of this report to determine why there are differences in charitable giving among subnational jurisdictions. However, Lammam and Gabler (2012) reviewed the literature on the deter-minants of charitable giving at the jurisdictional level and note several possible drivers including income, the after-tax cost of donating, scope of gov-ernment, the age of the population, levels of educa-tion, religious affiliation, and volunteerism. Francis and Clemens (1999) argue that private generosity is sensitive to disposable income and conclude that a more economic growth oriented regime would encourage charitable giving.
Generosity in Canada and the United States: The 2017 Generosity Index
fraserinstitute.org FRASER RESEARCH BULLETIN 7
Table 3: Results and Ranks for Charitable Contributions in Canada and the US, 2015 Tax Year
State/ Province/ Territory
Percentage of tax filers donating to charity (%)
Rank (out of
64)
Percentage of aggregate
income donated to charity (%)
Rank (out of
64)
Average annual charitable
donation (local currency – $)
Rank (out of
64)
Alabama 22.7 30 1.83 5 7,271 12
Alaska 16.1 58 0.81 50 5,766 23
Arizona 24.1 21 1.26 32 4,870 38
Arkansas 18.1 53 1.86 4 9,704 3
California 28.5 11 1.48 14 6,241 18
Colorado 26.5 14 1.37 22 5,595 28
Connecticut 34.5 3 1.42 19 5,713 25
Delaware 26.3 15 1.17 35 4,358 45
District of Columbia 32.7 4 2.00 3 8,801 5
Florida 18.9 50 1.45 17 7,336 11
Georgia 28.3 12 2.25 2 7,486 9
Hawaii 23.4 24 0.94 45 4,074 47
Idaho 23.0 28 1.63 10 6,308 17
Illinois 26.1 16 1.33 26 5,389 29
Indiana 18.3 52 1.16 36 5,641 27
Iowa 23.9 23 1.16 36 4,768 41
Kansas 21.1 37 1.39 21 6,735 16
Kentucky 21.2 36 1.22 34 5,149 36
Louisiana 18.1 53 1.13 38 6,236 19
Maine 20.9 39 0.81 50 3,433 50
Maryland 38.5 1 1.75 6 5,166 35
Massachusetts 30.5 7 1.29 29 5,316 31
Michigan 22.3 32 1.28 31 5,198 34
Minnesota 29.3 8 1.33 26 4,659 43
Mississippi 19.7 45 1.62 11 6,839 15
Missouri 21.1 37 1.34 25 5,857 22
Montana 22.1 33 1.33 26 5,321 30
Nebraska 23.2 27 1.26 32 5,687 26
Nevada 20.6 40 1.29 29 5,753 24
New Hampshire 24.1 21 0.85 48 3,692 49
New Jersey 35.0 2 1.12 39 3,944 48
New Mexico 17.4 56 1.00 43 4,968 37
New York 29.0 9 1.66 8 6,894 14
North Carolina 24.7 18 1.58 12 5,953 21
North Dakota 13.4 61 0.87 47 7,338 10
Generosity in Canada and the United States: The 2017 Generosity Index
fraserinstitute.org FRASER RESEARCH BULLETIN 8
Table 3: Results and Ranks for Charitable Contributions in Canada and the US, 2015 Tax Year (continued)
State/ Province/ Territory
Percentage of tax filers donating to charity (%)
Rank (out of
64)
Percentage of aggregate
income donated to charity (%)
Rank (out of
64)
Average annual charitable
donation (local currency – $)
Rank (out of
64)
Ohio 20.6 40 1.09 41 4,800 40
Oklahoma 19.1 49 1.41 20 7,725 8
Oregon 29.0 9 1.47 16 4,831 39
Pennsylvania 23.4 24 1.08 42 4,764 42
Rhode Island 27.4 13 0.89 46 3,231 51
South Carolina 23.4 24 1.64 9 6,111 20
South Dakota 13.5 60 1.35 24 9,808 2
Tennessee 16.5 57 1.48 14 8,405 6
Texas 18.4 51 1.36 23 7,801 7
Utah 30.8 5 3.13 1 9,520 4
Vermont 19.9 43 0.95 44 4,454 44
Virginia 30.8 5 1.45 17 5,239 33
Washington 24.2 20 1.52 13 6,932 13
West Virginia 12.3 63 0.75 52 5,301 32
Wisconsin 25.0 17 1.12 39 4,172 46
Wyoming 15.3 59 1.70 7 13,231 1
British Columbia 20.0 42 0.68 53 2,134 53
Alberta 21.6 35 0.66 54 2,581 52
Saskatchewan 22.4 31 0.60 56 1,835 56
Manitoba 24.6 19 0.83 49 1,973 54
Ontario 22.0 34 0.63 55 1,870 55
Quebec 19.3 47 0.26 62 747 64
New Brunswick 19.3 47 0.48 58 1,328 62
Nova Scotia 19.8 44 0.47 59 1,340 61
Prince Edward Island 22.9 29 0.59 57 1,369 60
Newfoundland & Labrador 19.5 46 0.34 60 1,062 63
Yukon 17.8 55 0.29 61 1,402 59
Northwest Territories 13.2 62 0.22 63 1,642 58
Nunavut 8.1 64 0.19 64 1,822 57
Canada 20.9 0.56 1,699
United States 24.5 1.43 6,058
Sources: CRA (2017a); Statistics Canada (2017a); United States, Bureau of Economic Analysis (2017); United States, Internal Revenue Ser-vice (2017a); calculations by authors.
Generosity in Canada and the United States: The 2017 Generosity Index
fraserinstitute.org FRASER RESEARCH BULLETIN 9
highest percentage among US states and Canadian provinces. Georgia is second on this measure with 2.25% of aggregate income donated to charity. By contrast, the percentage of aggregate income donated to charity in Manitoba, Canada’s highest ranked province on this measure, was just 0.83%—roughly a quarter of the amount donated in Utah. Alaska, Maine, and West Virginia were the only US states where the percentage of aggregate income donated was less than the percentage of aggregate income donated in Manitoba.
The Generosity Index recognizes the magnitude
of charitable donations eligible for income tax deduction.
Though not included in the calculations of the Generosity Index, Canada makes its poorest showing in the average value of charitable donations in local currency. The average US donation was US$6,058 per year (US IRS, 2017a)—more than three-and-a-half times the average Canadian donation of CA$1,699 a year (CRA, 2017a). Wyoming, the top-ranked jurisdiction on this measure, recorded an average annual charitable donation of US$13,231—more than five times the average annual donation of CA$2,581 in Alberta, Canada’s top-performing province on this measure. Even in Rhode Island, the lowest-ranked US state, the average donation (US$3,231) is $650 more than the average donation in Alberta. The disparity is more pronounced when currency differences are accounted for in the 2015 tax year.6
6 In 2015, US$1.00 was worth an average CA$1.279 at the spot rate (Statistics Canada, 2017b).
The 2017 Generosity Index
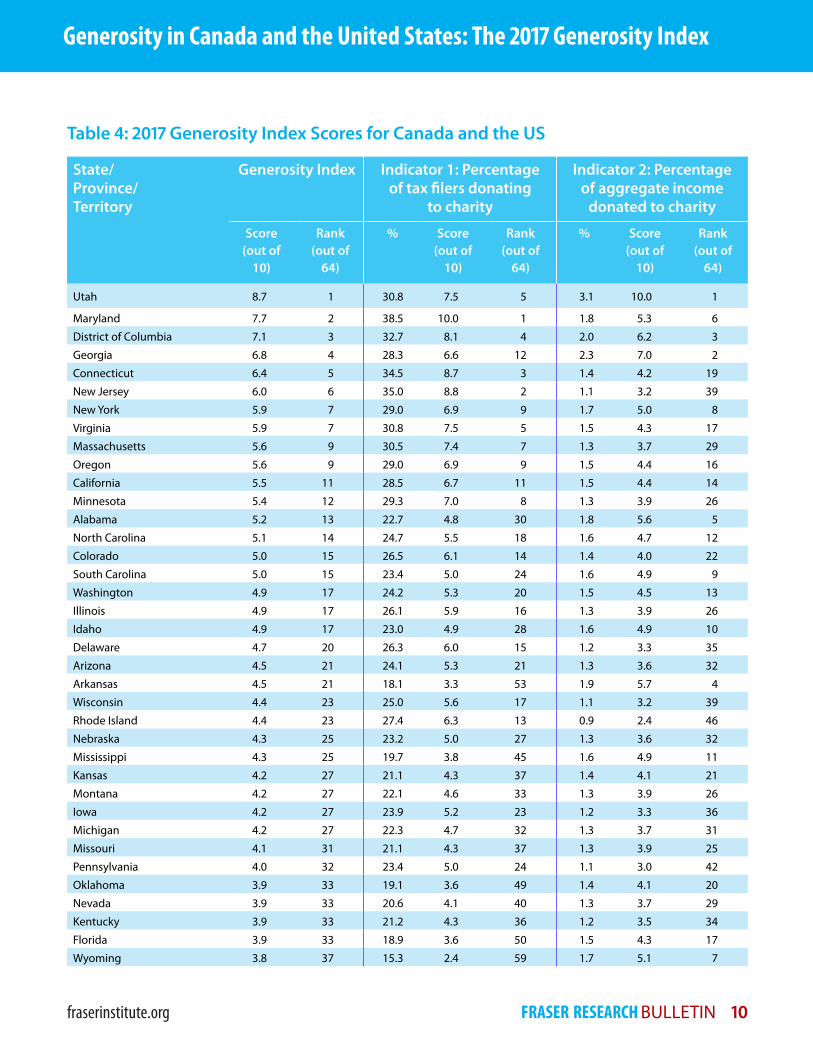
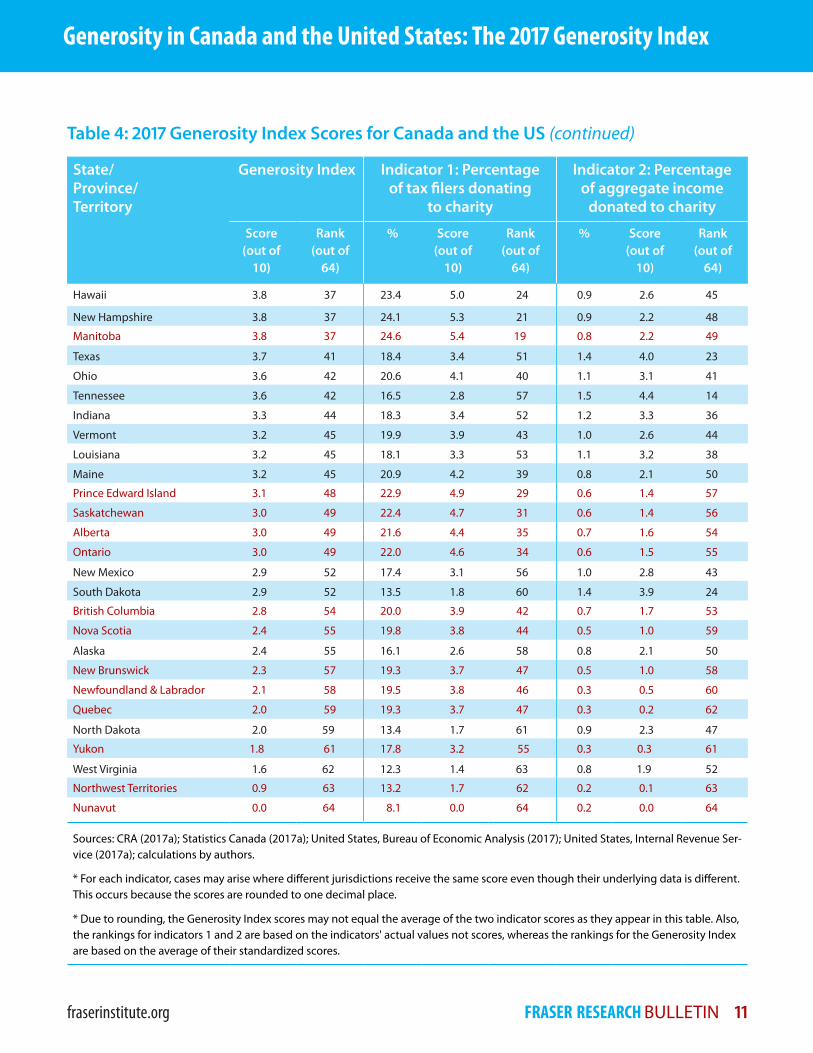
Table 4 displays the overall results of the 2017 Generosity Index for the 64 jurisdictions. Over-all scores (out of 10) and ranks (out of 64) are presented for each indicator (the extent and depth of charitable giving).
As in previous years, the top-ranked jurisdiction is Utah, with an overall index score of 8.7 out of 10.0. Maryland ranks second with an overall score of 7.7, and the District of Colum-bia is third with an overall score of 7.1. Canada’s highest ranked province, Manitoba, is 37th over-all, scoring 3.8 on the 2017 Generosity Index. Quebec ranks last among Canadian provinc-es, placing 59th overall with a score of 2.0. The Northwest Territories and Nunavut are at the bottom of the list, with scores of 0.9 and 0.0 out of 10.0, respectively.
Conclusion
The Generosity Index uses readily available data to measure private monetary generos-ity in Canada and the United States. By mea-suring both the percentage of tax filers who donate to charity and the percentage of aggre-gate income donated to charity in each juris-diction, the Generosity Index recognizes the magnitude of charitable donations eligible for income tax deduction. The results indicate that, in recent years, a smaller proportion of Cana-dians are generally giving to charity and the amount given makes up an increasingly smaller proportion of aggregate income. Most notably, however, the index shows that private mone-tary generosity in Canada is considerably lower than in the United States. This generosity gap undoubtedly limits the ability of Canadian char-ities to improve the quality of life in their com-munities and beyond.
Generosity in Canada and the United States: The 2017 Generosity Index
fraserinstitute.org FRASER RESEARCH BULLETIN 10
Table 4: 2017 Generosity Index Scores for Canada and the US
State/ Province/ Territory
Generosity Index Indicator 1: Percentage of tax filers donating
to charity
Indicator 2: Percentage of aggregate income
donated to charity
Score (out of
10)
Rank (out of
64)
% Score (out of
10)
Rank (out of
64)
% Score (out of
10)
Rank (out of
64)
Utah 8.7 1 30.8 7.5 5 3.1 10.0 1
Maryland 7.7 2 38.5 10.0 1 1.8 5.3 6
District of Columbia 7.1 3 32.7 8.1 4 2.0 6.2 3
Georgia 6.8 4 28.3 6.6 12 2.3 7.0 2
Connecticut 6.4 5 34.5 8.7 3 1.4 4.2 19
New Jersey 6.0 6 35.0 8.8 2 1.1 3.2 39
New York 5.9 7 29.0 6.9 9 1.7 5.0 8
Virginia 5.9 7 30.8 7.5 5 1.5 4.3 17
Massachusetts 5.6 9 30.5 7.4 7 1.3 3.7 29
Oregon 5.6 9 29.0 6.9 9 1.5 4.4 16
California 5.5 11 28.5 6.7 11 1.5 4.4 14
Minnesota 5.4 12 29.3 7.0 8 1.3 3.9 26
Alabama 5.2 13 22.7 4.8 30 1.8 5.6 5
North Carolina 5.1 14 24.7 5.5 18 1.6 4.7 12
Colorado 5.0 15 26.5 6.1 14 1.4 4.0 22
South Carolina 5.0 15 23.4 5.0 24 1.6 4.9 9
Washington 4.9 17 24.2 5.3 20 1.5 4.5 13
Illinois 4.9 17 26.1 5.9 16 1.3 3.9 26
Idaho 4.9 17 23.0 4.9 28 1.6 4.9 10
Delaware 4.7 20 26.3 6.0 15 1.2 3.3 35
Arizona 4.5 21 24.1 5.3 21 1.3 3.6 32
Arkansas 4.5 21 18.1 3.3 53 1.9 5.7 4
Wisconsin 4.4 23 25.0 5.6 17 1.1 3.2 39
Rhode Island 4.4 23 27.4 6.3 13 0.9 2.4 46
Nebraska 4.3 25 23.2 5.0 27 1.3 3.6 32
Mississippi 4.3 25 19.7 3.8 45 1.6 4.9 11
Kansas 4.2 27 21.1 4.3 37 1.4 4.1 21
Montana 4.2 27 22.1 4.6 33 1.3 3.9 26
Iowa 4.2 27 23.9 5.2 23 1.2 3.3 36
Michigan 4.2 27 22.3 4.7 32 1.3 3.7 31
Missouri 4.1 31 21.1 4.3 37 1.3 3.9 25
Pennsylvania 4.0 32 23.4 5.0 24 1.1 3.0 42
Oklahoma 3.9 33 19.1 3.6 49 1.4 4.1 20
Nevada 3.9 33 20.6 4.1 40 1.3 3.7 29
Kentucky 3.9 33 21.2 4.3 36 1.2 3.5 34
Florida 3.9 33 18.9 3.6 50 1.5 4.3 17
Wyoming 3.8 37 15.3 2.4 59 1.7 5.1 7
Generosity in Canada and the United States: The 2017 Generosity Index
fraserinstitute.org FRASER RESEARCH BULLETIN 11
Table 4: 2017 Generosity Index Scores for Canada and the US (continued)
State/ Province/ Territory
Generosity Index Indicator 1: Percentage of tax filers donating
to charity
Indicator 2: Percentage of aggregate income
donated to charity
Score (out of
10)
Rank (out of
64)
% Score (out of
10)
Rank (out of
64)
% Score (out of
10)
Rank (out of
64)
Hawaii 3.8 37 23.4 5.0 24 0.9 2.6 45
New Hampshire 3.8 37 24.1 5.3 21 0.9 2.2 48
Manitoba 3.8 37 24.6 5.4 19 0.8 2.2 49
Texas 3.7 41 18.4 3.4 51 1.4 4.0 23
Ohio 3.6 42 20.6 4.1 40 1.1 3.1 41
Tennessee 3.6 42 16.5 2.8 57 1.5 4.4 14
Indiana 3.3 44 18.3 3.4 52 1.2 3.3 36
Vermont 3.2 45 19.9 3.9 43 1.0 2.6 44
Louisiana 3.2 45 18.1 3.3 53 1.1 3.2 38
Maine 3.2 45 20.9 4.2 39 0.8 2.1 50
Prince Edward Island 3.1 48 22.9 4.9 29 0.6 1.4 57
Saskatchewan 3.0 49 22.4 4.7 31 0.6 1.4 56
Alberta 3.0 49 21.6 4.4 35 0.7 1.6 54
Ontario 3.0 49 22.0 4.6 34 0.6 1.5 55
New Mexico 2.9 52 17.4 3.1 56 1.0 2.8 43
South Dakota 2.9 52 13.5 1.8 60 1.4 3.9 24
British Columbia 2.8 54 20.0 3.9 42 0.7 1.7 53
Nova Scotia 2.4 55 19.8 3.8 44 0.5 1.0 59
Alaska 2.4 55 16.1 2.6 58 0.8 2.1 50
New Brunswick 2.3 57 19.3 3.7 47 0.5 1.0 58
Newfoundland & Labrador 2.1 58 19.5 3.8 46 0.3 0.5 60
Quebec 2.0 59 19.3 3.7 47 0.3 0.2 62
North Dakota 2.0 59 13.4 1.7 61 0.9 2.3 47
Yukon 1.8 61 17.8 3.2 55 0.3 0.3 61
West Virginia 1.6 62 12.3 1.4 63 0.8 1.9 52
Northwest Territories 0.9 63 13.2 1.7 62 0.2 0.1 63
Nunavut 0.0 64 8.1 0.0 64 0.2 0.0 64
Sources: CRA (2017a); Statistics Canada (2017a); United States, Bureau of Economic Analysis (2017); United States, Internal Revenue Ser-vice (2017a); calculations by authors.
* For each indicator, cases may arise where different jurisdictions receive the same score even though their underlying data is different. This occurs because the scores are rounded to one decimal place.
* Due to rounding, the Generosity Index scores may not equal the average of the two indicator scores as they appear in this table. Also, the rankings for indicators 1 and 2 are based on the indicators' actual values not scores, whereas the rankings for the Generosity Index are based on the average of their standardized scores.
Generosity in Canada and the United States: The 2017 Generosity Index
fraserinstitute.org FRASER RESEARCH BULLETIN 12
References
Canada Revenue Agency [CRA] (2007). Final Statistics—Sample Data 2007 Edition (2005 tax year). Web Tables. Government of Canada, Canada Revenue Agency. <http://www.cra-arc.gc.ca/gncy/stts/gb05/pst/fnl/menu-eng.html>, as of September 28, 2017.
Canada Revenue Agency [CRA] (2008). Final Statistics—Sample Data 2008 Edition (2006 tax year). Web Tables. Government of Canada, Canada Revenue Agency. <http://www.cra-arc.gc.ca/gncy/stts/gb06/pst/fnl/menu-eng.html>, as of September 28, 2017.
Canada Revenue Agency [CRA] (2009). Final Statistics—Sample Data 2009 Edition (2007 tax year). Web Tables. Government of Canada, Canada Revenue Agency. <http://www.cra-arc.gc.ca/gncy/stts/gb07/pst/fnl/menu-eng.html>, as of September 28, 2017.
Canada Revenue Agency [CRA] (2010). Final Statistics—Sample Data 2010 Edition (2008 tax year). Web Tables. Government of Canada, Canada Revenue Agency. <http://www.cra-arc. gc.ca/gncy/stts/gb08/pst/fnl/menu-eng. html>, as of September 28, 2017.
Canada Revenue Agency [CRA] (2011). Final Statistics—2011 Edition (2009 tax year). Web Tables. Government of Canada, Canada Revenue Agency. <http://www.cra-arc.gc.ca/gncy/ stts/gb09/pst/fnl/menu-eng.html>, as of September 28, 2017.
Canada Revenue Agency [CRA] (2012). Final Sta tistics—2012 Edition (2010 tax year). Web Ta bles. Government of Canada, Canada Revenue Agency. <https://www.canada.ca/en/revenue-agency/programs/about-canada-revenue-agency-cra/income-statistics-gst-hst-statistics/t1-final-statistics-2012-edition-2010-tax-year.html>, as of September 28, 2017.
Canada Revenue Agency [CRA] (2013). Final Statistics—2013 Edition (2011 tax year). Web Tables. Government of Canada, Canada Revenue Agency. <https://www.canada.ca/en/revenue-agency/programs/about-canada-revenue-agency-cra/income-statistics-gst-hst-statistics/t1-final-statistics-2013-edition-2011-tax-year.html>, as of September 28, 2017.
Canada Revenue Agency [CRA] (2014). Final Sta tistics—2014 Edition (2012 year). Web tables. Government of Canada, Canada Revenue Agency. <https://www.canada.ca/en/revenue-agency/programs/about-canada-revenue-agency-cra/income-statistics-gst-hst-statistics/t1-final-statistics-2014-edition-2012-tax-year.html>, as of September 28, 2017.
Canada Revenue Agency [CRA] (2015). Final Statistics—2015 Edition (2013 year). Gov ernment of Canada, Canada Revenue Agency. <https://www.canada.ca/en/revenue-agency/programs/about-canada-revenue-agency-cra/income-statistics-gst-hst-statistics/t1-final-statistics-2015-edition-2013-tax-year.html>, as of September 28, 2017.
Canada Revenue Agency [CRA] (2016). Final Statistics—2016 Edition (2014 year). Gov ernment of Canada, Canada Revenue Agency. <https://www.canada.ca/en/revenue-agency/programs/about-canada-revenue-agency-cra/income-statistics-gst-hst-statistics/final-statistics-2016-edition-2014-tax-year.html>, as of September 28, 2017.
Canada Revenue Agency [CRA] (2017a). Preliminary Statistics—2017 edition (2015 year). Government of Canada, Canada Revenue Agency. <https://www.canada.ca/en/revenue-agency/programs/about-canada-revenue-agency-cra/income-statistics-gst-hst-statistics/t1-preliminary-statistics-2017-edition-2015-tax-year.html>, as of September 28, 2017.
Canada Revenue Agency [CRA] (2017b). Charities Program Update – 2015. Government of
Generosity in Canada and the United States: The 2017 Generosity Index
fraserinstitute.org FRASER RESEARCH BULLETIN 13
Canada, Canada Revenue Agency. <https://www.canada.ca/en/revenue-agency/services/charities-giving/charities/about-charities-directorate/charities-program-update-2015.html>, as of September 29, 2017.
Clemens, Jason, and Dexter Samida (1999). The 1999 Private Charitable Generosity Index. Public Policy Sources No. 34. Fraser Insti tute. <https://www.fraserinstitute.org/sites/default/files/GenerosityIndex1999.pdf>, as of November 20, 2017.
Francis, Johanna (1998). Ranking Private Gener-osity. Fraser Forum (November): 18-20, 32.
Francis, Johanna, and Jason Clemens (1999). Charitable Donations and Tax Incentives. Fraser Forum (June).
Lammam, Charles, and Nachum Gabler (2012). Determinants of Charitable Giving: a Review of the Literature. Fraser Forum (March/April): 12–15. <https://www.fraserinstitute.org/sites/default/files/fraserforum-march-april-2012-rev.pdf>, as of November 20, 2017.
Statistics Canada (2015). CANSIM Table 1190009: Volunteer Rate and Distribution of Vol unteer Hours, by Age Group, Canada, Prov inces. Statistics Canada. <http://www5.statcan.gc.ca/cansim/a26?lang=eng&id=1190009>, as of November 20, 2017.
Statistics Canada (2017a). CANSIM Table 3840042: Selected Indicators – Households. Statistics Canada. <http://www5.statcan.gc.ca/cansim/a26?lang=eng&id=3840042>, as of Novem ber 20, 2017.
Statistics Canada (2017b). CANSIM Table 1760064: Foreign Exchange Rates in Canadian Dollars, Bank of Canada, Archived. Statistics Canada. <http://www5.statcan.gc.ca/cansim/a26?id=1760064>, as of November 20, 2017.
United States, Bureau of Economic Analysis [BEA] (2017). Regional Data. SA5N Personal income by major source and earnings by NAICS indus try 1/. Generated web table. Government of the United States. <https://www.bea.gov/iTable/iTable.cfm?reqid=70&step=30&isuri=1&7022=2&7023=0&7033=-1&7024=sic&7025=0&7026=04000&7027=-1&7001=42&7028=-1&7031=0&7040=-1&7083=levels&7029=2&7090=70#reqid=70&step=30&isuri=1&7022=2&7023=0&7033=-1&7024=sic&7025=0&7026=04000&7027=-1&7001=42&7028=-1&7031=0&7040=-1&7083=levels&7029=2&7090=70>, as of November 20, 2017.
United States, Bureau of Labor Statistics [BEA] (2016). Volunteering in the United States. Bureau of Labor Statis tics. <http://www.bls.gov/news.release/volun.toc.htm>, as of November 20, 2017.
United States, Internal Revenue Service [IRS] (2017a). SOI Tax Stats – Historic Table 2. Historical Table 2: State Data Tax Year 2015. Government of the United States. <https://www.irs.gov/statistics/soi-tax-stats-historic-table-2>, as of September 29, 2017.
United States, Internal Revenue Service [IRS] (2017b). Charitable Contribution Deductions. Government of the Unit ed States. <https://www.irs.gov/charities-non-profits/charitable-organizations/charitable-contribution-deductions>, as of September 29, 2017.
Generosity in Canada and the United States: The 2017 Generosity Index
fraserinstitute.org FRASER RESEARCH BULLETIN 14
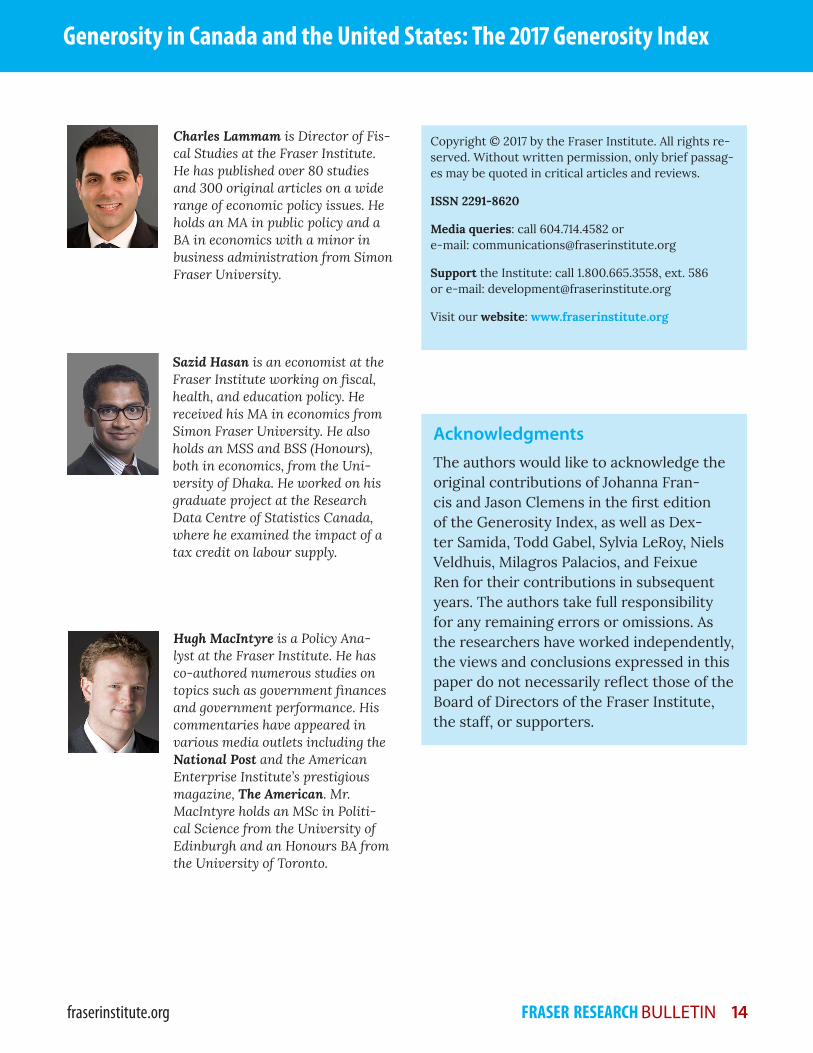
Hugh MacIntyre is a Policy Analyst at the Fraser Institute. He has coauthored numerous studies on topics such as government finances and government performance. His commentaries have appeared in various media outlets including the National Post and the American Enterprise Institute’s prestigious magazine, The American. Mr. MacIntyre holds an MSc in Political Science from the University of Edinburgh and an Honours BA from the University of Toronto.
Copyright © 2017 by the Fraser Institute. All rights reserved. Without written permission, only brief passages may be quoted in critical articles and reviews.
ISSN 2291-8620
Media queries: call 604.714.4582 or e-mail: [email protected]
Support the Institute: call 1.800.665.3558, ext. 586 or e-mail: [email protected]
Visit our website: www.fraserinstitute.org
Charles Lammam is Director of Fiscal Studies at the Fraser Institute. He has published over 80 studies and 300 original articles on a wide range of economic policy issues. He holds an MA in public policy and a BA in economics with a minor in business administration from Simon Fraser University.
Sazid Hasan is an economist at the Fraser Institute working on fiscal, health, and education policy. He received his MA in economics from Simon Fraser University. He also holds an MSS and BSS (Honours), both in economics, from the University of Dhaka. He worked on his graduate project at the Research Data Centre of Statistics Canada, where he examined the impact of a tax credit on labour supply.
AcknowledgmentsThe authors would like to acknowledge the original con tributions of Johanna Francis and Jason Clemens in the first edition of the Generosity Index, as well as Dexter Samida, Todd Gabel, Sylvia LeRoy, Niels Veldhuis, Milagros Palacios, and Feixue Ren for their contributions in subsequent years. The authors take full responsibility for any remain ing errors or omissions. As the researchers have worked independently, the views and conclusions expressed in this paper do not necessarily reflect those of the Board of Directors of the Fraser Institute, the staff, or supporters.