Embed Size (px)
Citation preview
0.00
50.00
100.00
150.00
200.00
250.00
300.00
9520
5B
9522
9A
9529
1A
9521
2A
9520
9B
9521
5B
9524
2B
9527
5A
9524
1A
9524
8B
9522
7A
9527
4A
9522
6A
9524
4A
9530
5B
9529
5B
9527
1A
9523
4B
9523
9A
9523
9B
9521
1A
9526
1A
9529
2A
9526
8B
9528
0B
9528
1A
9528
6A
9521
7B
9528
4B
9526
1B
mon
eyA
9530
0B
9522
8A
9520
6B
9521
4A
9526
2B
9529
7B
9523
0A
9523
0B
9529
9A
t50
(hr)
0%
20%
40%
60%
80%
100%
9526
9A
9530
7A
9525
6B
9524
3A
9525
5B
9521
7A
9523
3A
9523
8B
9521
4B
9528
8B
9523
9A
9521
8A
9523
8A
9525
0A
9521
0B
9524
5B
mon
eyB
9528
7A
9527
5B
9526
8B
9528
3B
9527
4A
9524
4B
9521
1A
9527
9B
9530
5A
9526
6B
9522
5B
9528
3A
9530
2B
9524
6A
9525
3A
9522
2A
9525
4A
9522
0A
9525
1A
9527
6B
9530
6A
9521
5A
9526
3B
Ger
min
atio
n %
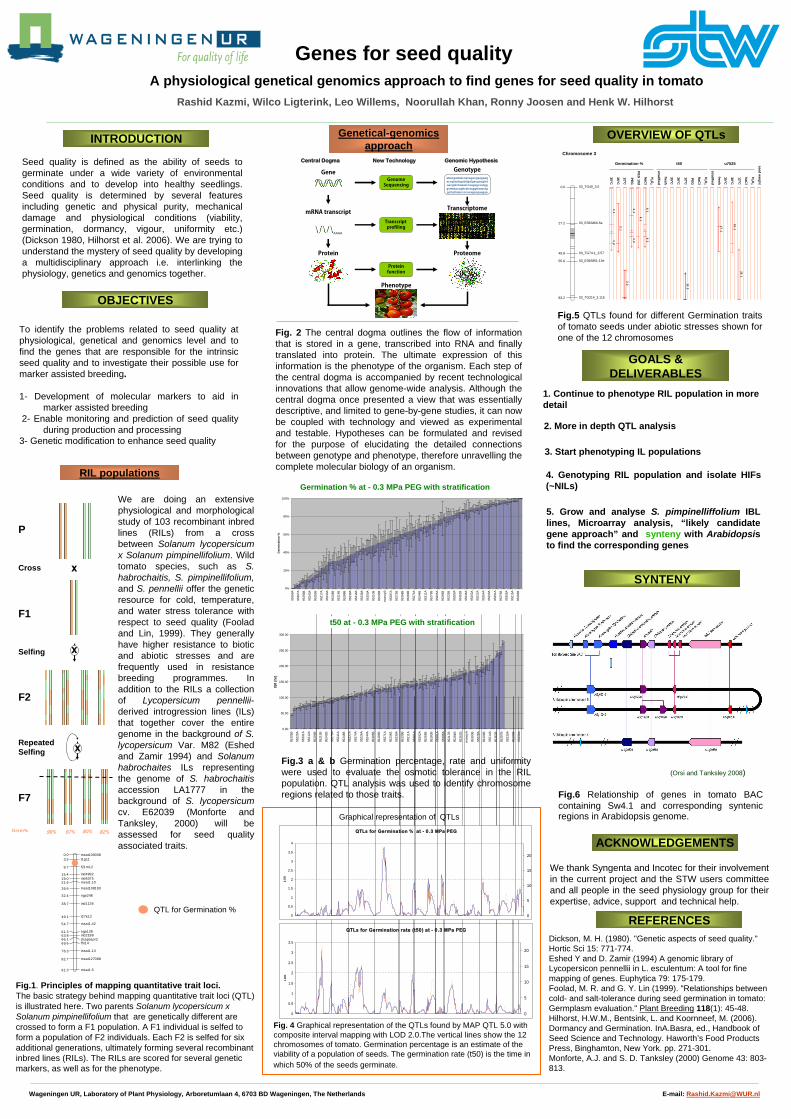
Genes for seed qualityA physiological genetical genomics approach to find genes for seed quality in tomato
Rashid Kazmi, Wilco Ligterink, Leo Willems, Noorullah Khan, Ronny Joosen and Henk W. Hilhorst
INTRODUCTION
Seed quality is defined as the ability of seeds to germinate under a wide variety of environmental conditions and to develop into healthy seedlings. Seed quality is determined by several features including genetic and physical purity, mechanical damage and physiological conditions (viability, germination, dormancy, vigour, uniformity etc.) (Dickson 1980, Hilhorst et al. 2006). We are trying to understand the mystery of seed quality by developing a multidisciplinary approach i.e. interlinking the physiology, genetics and genomics together.
To identify the problems related to seed quality at physiological, genetical and genomics level and to find the genes that are responsible for the intrinsic seed quality and to investigate their possible use for marker assisted breeding.
1- Development of molecular markers to aid in marker assisted breeding
2- Enable monitoring and prediction of seed quality during production and processing
3- Genetic modification to enhance seed quality
Genetical-genomics approach
We thank Syngenta and Incotec for their involvement in the current project and the STW users committee and all people in the seed physiology group for their expertise, advice, support and technical help.
Dickson, M. H. (1980). "Genetic aspects of seed quality." Hortic Sci 15: 771-774.Eshed Y and D. Zamir (1994) A genomic library of Lycopersicon pennellii in L. esculentum: A tool for fine mapping of genes. Euphytica 79: 175-179.Foolad, M. R. and G. Y. Lin (1999). "Relationships between cold- and salt-tolerance during seed germination in tomato: Germplasm evaluation." Plant Breeding 118(1): 45-48.Hilhorst, H.W.M., Bentsink, L. and Koornneef, M. (2006). Dormancy and Germination. InA.Basra, ed., Handbook of Seed Science and Technology. Haworth’s Food Products Press, Binghamton, New York. pp. 271-301.Monforte, A.J. and S. D. Tanksley (2000) Genome 43: 803-813.
OVERVIEW OF QTLs
GOALS & DELIVERABLES
ACKNOWLEDGEMENTS
REFERENCES
Fig. 2 The central dogma outlines the flow of information that is stored in a gene, transcribed into RNA and finally translated into protein. The ultimate expression of this information is the phenotype of the organism. Each step of the central dogma is accompanied by recent technological innovations that allow genome-wide analysis. Although the central dogma once presented a view that was essentially descriptive, and limited to gene-by-gene studies, it can now be coupled with technology and viewed as experimental and testable. Hypotheses can be formulated and revised for the purpose of elucidating the detailed connections between genotype and phenotype, therefore unravelling the complete molecular biology of an organism.
1. Continue to phenotype RIL population in more detail
2. More in depth QTL analysis
5. Grow and analyse S. pimpinelliffolium IBL lines, Microarray analysis, “likely candidate gene approach” and synteny with Arabidopsis to find the corresponding genes
Fig.1. Principles of mapping quantitative trait loci.The basic strategy behind mapping quantitative trait loci (QTL) is illustrated here. Two parents Solanum lycopersicum x Solanum pimpinellifolium that are genetically different are crossed to form a F1 population. A F1 individual is selfed to form a population of F2 individuals. Each F2 is selfed for six additional generations, ultimately forming several recombinant inbred lines (RILs). The RILs are scored for several genetic markers, as well as for the phenotype.
We are doing an extensive physiological and morphological study of 103 recombinant inbred lines (RILs) from a cross between Solanum lycopersicum x Solanum pimpinellifolium. Wild tomato species, such as S. habrochaitis, S. pimpinellifolium,and S. pennellii offer the genetic resource for cold, temperature, and water stress tolerance with respect to seed quality (Foolad and Lin, 1999). They generally have higher resistance to biotic and abiotic stresses and are frequently used in resistance breeding programmes. In addition to the RILs a collection of Lycopersicum pennellii-derived introgression lines (ILs) that together cover the entire genome in the background of S. lycopersicum Var. M82 (Eshed and Zamir 1994) and Solanum habrochaites ILs representing the genome of S. habrochaitisaccession LA1777 in the background of S. lycopersicum cv. E62039 (Monforte and Tanksley, 2000) will be assessed for seed quality associated traits.
OBJECTIVES
RIL populations
3. Start phenotyping IL populations
4. Genotyping RIL population and isolate HIFs (~NILs)
SYNTENY
(Orsi and Tanksley 2008))
Fig.5 QTLs found for different Germination traits of tomato seeds under abiotic stresses shown for one of the 12 chromosomes
Fig.3 a & b Germination percentage, rate and uniformity were used to evaluate the osmotic tolerance in the RIL population. QTL analysis was used to identify chromosome regions related to those traits.
Graphical representation of QTLs
Fig.6 Relationship of genes in tomato BAC containing Sw4.1 and corresponding syntenic regions in Arabidopsis genome.
Selfing
Repeated Selfing
F2
F1
Cross
x
x
P
Germ% 98% 97% 80% 82%
QTL for Germination %
Fig. 4 Graphical representation of the QTLs found by MAP QTL 5.0 with composite interval mapping with LOD 2.0.The vertical lines show the 12 chromosomes of tomato. Germination percentage is an estimate of the viability of a population of seeds. The germination rate (t50) is the time in which 50% of the seeds germinate.
Wageningen UR, Laboratory of Plant Physiology, Arboretumlaan 4, 6703 BD Wageningen, The Netherlands E-mail: [email protected]
QTLs for Germination rate (t50) at - 0.3 MPa PEG
0
0.5
1
1.5
2
2.5
3
3.5
LOD
0
5
10
15
20
QTLs for Germination % at - 0.3 MPa PEG
0
0.5
1
1.5
2
2.5
3
3.5
4
LOD
0
5
10
15
20
Germination % at - 0.3 MPa PEG with stratification
t50 at - 0.3 MPa PEG with stratification
Gene
mRNA transcript
Genotype
Transcriptome
Protein
Phenotype
Proteome
Transcript profiling
GenomeSequencing
Proteinfunction
attacgatataccacagacgaagaagaccgtaatcgaattgatgacgacgtataacgtactataatccaagagccatgggcttaaaccgttcatctaggttaaactggcttattataccccacagacgaagaa
AAAA
Central Dogma New Technology Genomic Hypothesis
35°C
PEG
NaC
l
H2 O
2
36°C
12°C
PEG 10d
35°C
PEG
NaC
l
H2 O
2
36°C
fresh
stratified
12°C
35°C
stratified
NaC
l
H2 O
2
36°C
fresh
seed weight
Germination % u7525t5012°C
03_TG40_3.00.0
03_E35/M60-5e27.2
03_TG74-1_3.5749.8
03_E36/M51-13e55.6
03_TG214_3.11583.2
1_11_2
2_1
4_14_2
5_1
6_16_2
12_2
17_1
19_1
20_1
Chromosome 3
3_2
msat1000080.0t1g113.5
f21m129.7
ind499215.4ind637519.0msat1.1021.6msat10819326.6
nga24832.4
ind113638.7
t27k1249.1
msat1.4254.7
nga12861.3ind218863.8dcapsapr266.1f5i1469.6
msat1.1376.3
msat12708882.7
msat1.591.3
x
F7