Embed Size (px)
Citation preview
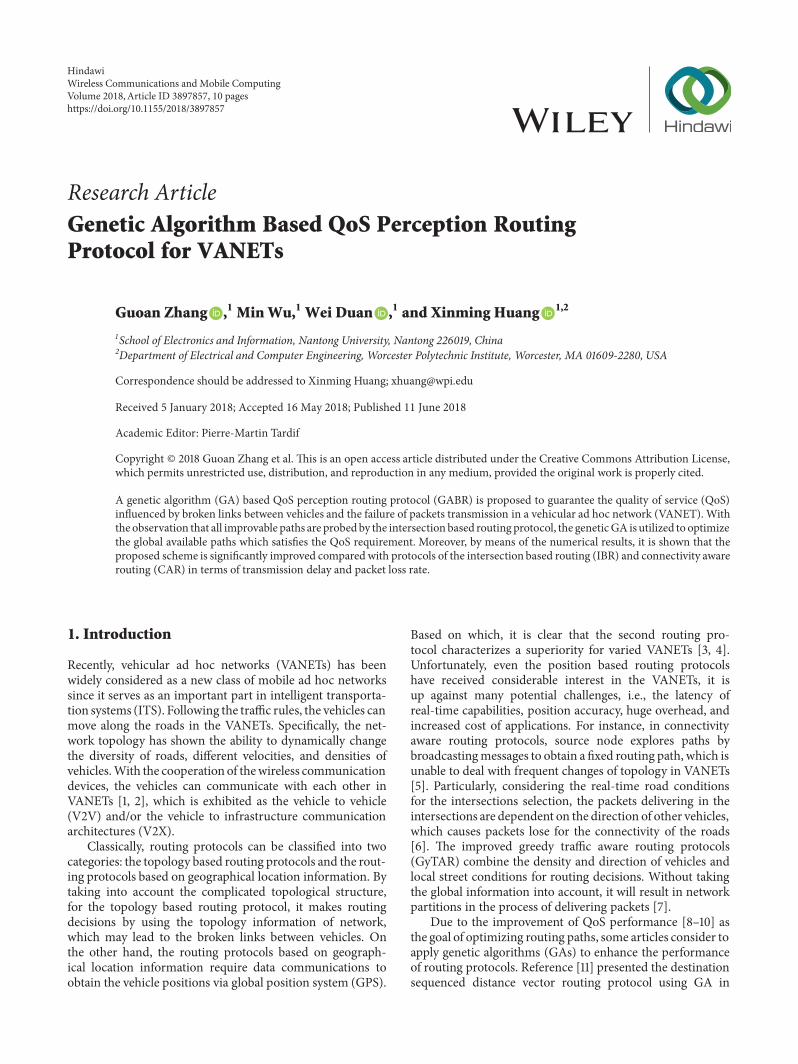
Research ArticleGenetic Algorithm Based QoS Perception RoutingProtocol for VANETs
Guoan Zhang 1 Min Wu1 Wei Duan 1 and Xinming Huang 12
1School of Electronics and Information Nantong University Nantong 226019 China2Department of Electrical and Computer Engineering Worcester Polytechnic Institute Worcester MA 01609-2280 USA
Correspondence should be addressed to Xinming Huang xhuangwpiedu
Received 5 January 2018 Accepted 16 May 2018 Published 11 June 2018
Academic Editor Pierre-Martin Tardif
Copyright copy 2018 Guoan Zhang et al This is an open access article distributed under the Creative Commons Attribution Licensewhich permits unrestricted use distribution and reproduction in any medium provided the original work is properly cited
A genetic algorithm (GA) based QoS perception routing protocol (GABR) is proposed to guarantee the quality of service (QoS)influenced by broken links between vehicles and the failure of packets transmission in a vehicular ad hoc network (VANET) Withthe observation that all improvable paths are probedby the intersection based routing protocol the geneticGA is utilized to optimizethe global available paths which satisfies the QoS requirement Moreover by means of the numerical results it is shown that theproposed scheme is significantly improved compared with protocols of the intersection based routing (IBR) and connectivity awarerouting (CAR) in terms of transmission delay and packet loss rate
1 Introduction
Recently vehicular ad hoc networks (VANETs) has beenwidely considered as a new class of mobile ad hoc networkssince it serves as an important part in intelligent transporta-tion systems (ITS) Following the traffic rules the vehicles canmove along the roads in the VANETs Specifically the net-work topology has shown the ability to dynamically changethe diversity of roads different velocities and densities ofvehiclesWith the cooperation of thewireless communicationdevices the vehicles can communicate with each other inVANETs [1 2] which is exhibited as the vehicle to vehicle(V2V) andor the vehicle to infrastructure communicationarchitectures (V2X)
Classically routing protocols can be classified into twocategories the topology based routing protocols and the rout-ing protocols based on geographical location information Bytaking into account the complicated topological structurefor the topology based routing protocol it makes routingdecisions by using the topology information of networkwhich may lead to the broken links between vehicles Onthe other hand the routing protocols based on geograph-ical location information require data communications toobtain the vehicle positions via global position system (GPS)
Based on which it is clear that the second routing pro-tocol characterizes a superiority for varied VANETs [3 4]Unfortunately even the position based routing protocolshave received considerable interest in the VANETs it isup against many potential challenges ie the latency ofreal-time capabilities position accuracy huge overhead andincreased cost of applications For instance in connectivityaware routing protocols source node explores paths bybroadcastingmessages to obtain a fixed routing path which isunable to deal with frequent changes of topology in VANETs[5] Particularly considering the real-time road conditionsfor the intersections selection the packets delivering in theintersections are dependent on the direction of other vehicleswhich causes packets lose for the connectivity of the roads[6] The improved greedy traffic aware routing protocols(GyTAR) combine the density and direction of vehicles andlocal street conditions for routing decisions Without takingthe global information into account it will result in networkpartitions in the process of delivering packets [7]
Due to the improvement of QoS performance [8ndash10] asthe goal of optimizing routing paths some articles consider toapply genetic algorithms (GAs) to enhance the performanceof routing protocols Reference [11] presented the destinationsequenced distance vector routing protocol using GA in
HindawiWireless Communications and Mobile ComputingVolume 2018 Article ID 3897857 10 pageshttpsdoiorg10115520183897857
2 Wireless Communications and Mobile Computing
VANET which is a kind of the topology based routing proto-col and uses a fitness function to evaluate the solution thensimulation result analysis showed the QoS of DSDVwith GAis better than the simple DSDV scheme The authors in [12]considered the ad hoc on-demand distance vector routingprotocol through genetic algorithm which aims to find theoptimal path from the source to destination and increase thethroughput of AODV where the simulation results illustratedthat the proposed algorithm significantly improves the QoScompared to the simple one with satisfactory efficiency
In this paper to further enhance the QoS performanceof location based routing protocols in urban environmentfor VANETs an efficient GA is applied to optimize therouting path between source and destination nodes Theconnectivity model and the delay model are also analyzedto estimate the average delay where the road segment isdivided into several blocks Moreover the IBR protocol isalso employed to explore possible paths between sources anddestinations Based on that the proposed genetic algorithmoptimizes routing paths which subjects to the fitness functionswitched by the objective function with parallelism wherean initial population composed of multiple solutions isconsidered It is worth noting that the genetic operations ieselection crossover and mutation are disposed with certainprobabilities that reinforce the flexibility of the searchingprocess [13 14] With this observation for our proposedGA the obtained results undergo genetic operations whichsupport the following search From the numerical results it isshown that compared with the IBR and CAR protocols theproposed GABR protocol scheme outperforms significantlyin terms of packets transmission delay and packet loss rate
The rest of this paper is organized as follows Section 2describes the GABR algorithm In Section 3 it shows inves-tigation for GABR Analysis of the QoS model for theproposed scheme is presented in Section 4 Section 5 showsthe excellent performance of our proposed scheme comparedwith the existing works Section 6 concludes this paper
2 GABR Algorithm
21 QoS Model One example of urban street is shown inFigure 1 in which four intersections (1198681 sim 1198684) are consideredDue to the forward delay and connectivity between multiplelinks on the two-way lane the road segment model isdesignedTherefore for each road segment traffic conditionsare randomly distributed In the proposed system the follow-ing assumptions are considered
(i) On a straight road segment the lanes between twointersections (119868119894 119868119895) are located along opposite direc-tions referred as the east and west bound with length119871
(ii) Thedirection ofmoving vehicles is eastbound and thecommunication range is set as 119877
(iii) The vehicles in the two-lane road segment scenariosfollow the Poisson distribution [15]
(iv) The vehicle densities for the east and west bound laneare set to be 1205821 and 1205822 while the average vehiclevelocities for two lanes are V1 and V2 respectively
4
1
2
3
Source vehicleDestination vehicleNormal vehicles I1 ~ I4 Intersections
Figure 1 Sample of urban street
In this paper QoS model is split into two parts theconnectivity model and delay model Particularly the roadsegment is also divided into several rectangular blocks withthe length and width of each block as 119886119877 where 119886 = 07 andtwo-lane road width is used to accurately analyze the QoS [1]
211 Connectivity Probability Model In order to study theexact connectivity model for a two-lane road as shown inFigure 2 the distance119883 between two consecutive vehicles onthe eastbound lane is compared with 119877 By this way the linkbetween two consecutive vehicles is connected and packetsare delivered directly with the condition 119883 le 119877 otherwisethe packets are out of scope which can not be forwardeddirectly Owing to the cooperation of the auxiliary vehiclein the westbound block the broken link is possible to berepaired regarding 119883
Without loss of generality further assume that 119870 is arandom variable denoting the number of vehicles in eachblock which follows the Poisson distribution with ProbabilityMass Function (PMF) as
119875 (119870 = 119896) = (119886119877120582)119896 119890minus119886119877120582119896 (1)
where 120582 denotes the vehicle density on a road segment laneSince the distance between any two consecutive vehiclesobeys the exponential distribution [16] the correspondingprobability of a broken link between two vehicles on theeastbound lane can be expressed as
119875119887 = 119875 (119883 gt 119877) = 119890minus1205821119877 (2)
with 1205821 as the vehicle density on eastbound lane
212 TransmissionDelayModel Following traffic rules in theurban environment vehicles move into clusters where the
Wireless Communications and Mobile Computing 3
Packet delivering direction Westbound
Eastbound
i j
Ve
VW VW+1
xgtR Ve+1
Figure 2 Distribution of road vehicles
Connected situation 1 Connectedsituation 2
Broken link
x gt R
Packet delivering direction Westbound
Eastbound
ji
Vk+1Vk
Figure 3 Road segment with partly connected
Packet delivering direction Westbound
Eastbound
i j
Figure 4 Road segment with absolutely connected
link between two consecutive vehicles is connected in eachcluster On account of the cluster size there are two kindsituations of vehicles moving
(i) Road segment with partly connected (PC) as shownin Figure 3 packets can be forwarded to the furthestvehicles within communication range as next-hopnode by utilizing greedy algorithm on the connectedroad segment On the contrary packets on the brokensegment can use carry-forward mechanism
(ii) Road segment with absolutely connected (AC) asshown in Figure 4 packets can be delivered by hop tohopwith greedy algorithmbetween two intersections
3 Details of the GABR Protocol
31 Genetic Algorithm It is well known that GA is a ran-dom search method based on the evolution rule of biology(survival of the fittest) which was first proposed by JHolland in 1975 to optimize the complete NP problems[17] The genetic algorithm imitates the process of naturalselection (NS) in which NS means a central concept ofevolution some organisms have traits that will make itmore likely that the organism survives long enough toreproduce It is likely that these traits will be passed onto the next generation which is also named survival ofthe fittest For a simple description genetic algorithm canbe seen as a simulation in which a population of abstractrepresentations (called chromosomes or the phenotype ofthe genome after their biological counterparts) of candidate
solutions (called individuals creatures or phenotypes) toan optimization problem Since that genetic algorithms arerandomized search and optimization techniques guided bythe principles of evolution andnatural genetics having a largeamount of implicit parallelism Therefore genetic algorithmsare part of the broader class of evolutionary algorithms thatcan be applied to the optimization of complex algorithmsthe training of text classification systems and the evolutionof intelligent artificial agents in stochastic environmentsWith these observations genetic algorithms perform searchin complex large and multimodal landscapes and providenear-optimal solutions for objective or fitness function of anoptimization problem
Figure 5 depicts the basic module process of GA [18]which is illustrated in detail as follows
(i) The first step to develop a GA for an optimizationproblem is to represent it Therefore the solution is inthe form of a string of bits which consists of the samenumber of element
(ii) An initial population is normally generated randomlywhich should be spread over enough of the searchspace to represent as wide a variety of solutions aspossible
(iii) The selection allows strings to be copied for possibleinclusion in the next generation where the standardfor the selection is that of the fitness of all individuals
(iv) The crossover is applied to two chromosomes andcreates two new chromosomes by selecting a randomposition
4 Wireless Communications and Mobile Computing
Start
Code
Initializepopulation
Selection
Crossover
Mutation
Newpopulation
End
Figure 5 Basic module process of GA
(v) Selection and crossover alone can generate a stagger-ing amount of differing strings
(vi) The stopping criterion can be set by the number ofevolution cycles the amount of variation of individ-uals between different generations or a predefinedvalue of fitness
32 Routing Exploration In this paper the proposed protocolis based on IBR with GA and vehicles are equipped withGPS and navigation system Adopting traffic information topredict the vehicle moving direction GABR protocol selectsthe next-hop intersection dynamically Meanwhile vehiclesutilize carry-forward strategy to deliver packets on theroad segment The proposed routing exploration integrateslocating destinations with finding connected paths betweensource and destination It means that to gather the availableinformation along the routes the source vehicle broadcaststhe request packets to the destination After receiving therequest packets accordingly the destination confirms thebest routing path which will be replied to the source
33 Genetic Operations In this subsection the main flowchart of our proposed routing algorithm with GA is intro-duced as shown in Figure 6 To begin with all improvablepaths are probed by IBR Subsequently genetic algorithmis utilized in the global optimization of available paths toacquire the path with optimal QoS All available paths areoptimized by GA repeatedly with five steps to find optimalQoS path which are shown as follows
(a) Code a given route between the source and destina-tion nodes is equal to an individual ie the serial numbersequence of intersections of the route is a chromosomewhichcan be encoded directlyTherefore this coding scheme avoidsthe route circulation due to that the variation length of the
Start
Utilize based on intersectionsrouting protocol to explore
all available routes
Code directlyInitialize iterations t=1
Initial population P(t)
Calculate fitness value ofeach individual
Total iterationsgentlt=gen
N
Y
According to fitness values operateselection with optimized strategical
selection and roulette wheel selection
Apply crossover operationon selected paths
Apply mutation operationon the population
Get the new population P(t+1)t=t+1
Obtain the optimal path
End
Figure 6 Flow chart of GABR protocol
chromosome and the total numbers are less than the amountof intersections
(b) Initialize the population according to the route selec-tion strategy based on IBR 119866 paths are explored as an initialpopulation and with the corresponding size
(c) Selection the pros and cons of individuals depend onthe fitness value in GA where the fitness value representsthe QoS performance With the increasing fitness the QoSperformance should be also correspondingly improved Anindividual has more fitness value which means that the
Wireless Communications and Mobile Computing 5
1 2 3 4 8 7 11 15 16
1 2 6 7 8 12 16
1 2 6 7 8 12 16
1 2 3 4 8 7 11 15 16
Crossing site
Parent path P1
Parent path P2
Child P1rsquo
Child P2rsquo
Crossover
Figure 7 Example of crossover
1
1
1
2
2
2
3 4
6
6
8
7
7
7
11
11
15
15
16
16
16
12Parentpath P
Subpath r1
Subpath r2
New path Prsquo
Mutation node i
Neighbor node j
Figure 8 Example of mutation
individual is excellent and the corresponding path is optimalTherefore the fitness function can be expressed as follows
119878 = 120572119875119899 + 120573119863119899119905ℎ (3)
where 119875119899 and 119863119899119905ℎ denote the connectivity probability andaverage delay of 119899-th individual and 120572 and 120573 are weightparameters with 120572 120573 isin [0 1] respectively
In this step we propose to combine the optimal strategicalselection and roulette wheel selection to rank all paths Beforeeach pair of chromosome crossing the optimal individualreplaces the worst one and becomes an offspring individualaccording to the fitness valueThen the rest of the populationuses the roulette wheel method where the individual withhigher fitness value is selected by greater probability
(d) Crossover crossover operator is used to exchange thesubpath of two individuals As shown in Figure 7 1198751 and1198752 paths are selected as parents These alternative crossingpositions should be randomly selected as the crossing siteswhich are both in parents Remarkably two new offspring11987510158401 and 11987510158402 take shapes after exchanging all nodes and thecrossing site
(e) Mutation mutation operator is applied to the ran-domly select the solution 119875 from the population whichis with small random changes in the solution We further
consider that the node 119899119894 selected randomly from 119875 formutation is called mutation node The operation details inFigure 8 can be summarized as follows
Step 1 Select a node 119899119895 from the neighbors of mutation node119899119894Step 2 Generate two random paths (1199031 1199032) from the sourcenode to node 119899119895 and from node 119899119895 to destination noderespectively
Step 3 If there is a duplication nodes in 1199031 1199032 discard thepath and do not performmutation on it otherwise these tworoutes are connected with each other to form a new mutatedchromosome 1198751015840Step 4 Repeat the process of the selection crossover andmutation until reaching the maximum number of iterationsor the route paths are optimized
4 Analysis of QoS Model
In this section in order to characterize the superiority ofour proposed scheme we analyze the performance of theproposed scenario in terms of the connectivity probabilityand the transmission delay
6 Wireless Communications and Mobile Computing
41 Analysis of Connectivity Probability As shown inFigure 2 two consecutive vehicles 119881119890 and 119881119890+1 on theeastbound lane are disconnected due to the distance119909 gt 119877 Using the vehicles on the opposite lane the brokenlink between 119881119890 and 119881119890+1 can be repaired by the vehicles(119881119908 119881119908+1) Clearly the corresponding probability for abroken link between 119881119890 and 119881119890+1 can be expressed as
Ξ119895 = 1 if 119909119894 le 119877(1 minus 119875 (119870 = 0))lfloor119909119894119886119877rfloor if 119909119894 gt 119877 (4)
where 119875(119870 = 0) = 119890minus119886119877120582 with 120582 = 1205822 denotes the vehicledensity on the westbound lane Denote that119872 is the numberof broken links on the eastbound lane and the road segment119868119894119895 is connected if broken links are completely fixable For119898 = 1 2 119873minus1 the conditional connectivity probability119875119888|119872(119872 = 119898) can be written as
119875119888|119872 (119872 = 119898) = 119898prod119894=1
119875119891 (119894) = (1 minus 119890minus1198861198771205822)Σ119898119894=1lfloor119909119894119886119877rfloor
= (1 minus 119890minus1198861198771205822)119871119886119877minus(119873minus1minus119898)1198861198771205821 (5)
where119873 stands for the number of vehicles on the eastboundlane
When 119872 = 119898 broken links exist among 119873 minus 1 links onthe lane the Probability Mass Function 119875119872 (119872 = 119898) followsthe binomial distribution which is given as
119875119872 (119872 = 119898) = (119873 minus 1119898 )119875119898119887 (1 minus 119901119887)119873minus1minus119898 (6)
From (6) it is easy to see that for the case of at least onebroken link existing on the eastbound lane (119898 ge 1) theconnectivity probability of the road segment can be expressedas
1198751198881 =119873minus1sum119898=1
119875119888|119872 (119872 = 119898)119875119872 (119872 = 119898) (7)
On the other hand when there is no broken link on theeastbound lane ie all cells are occupied by at least onevehicle the connectivity probability of the road segment isgiven as
1198751198882 (119894 119895) = (1 minus 1198901198861198771205821)lfloor119871119886119877rfloor (8)
Based on the above analysis the total connectivity probabilityof a road segment between the intersection 119894 and the intersec-tion 119895 can be finally represented as
1198751198881 (119894 119895) = 1198751198881 + 1198751198882 (9)
42 Analysis of Transmission Delay In this section thetransmission delay of PC and ACwill be analyzed which havebeen mentioned in Section 2
421 Road Segment with Partly Connected (PC) FromFigure 3 the road segment transmission delay 119863119899119901 is givenas
119863119899119901 = 119871119864 (V) (10)
where 119871 and 119864(V) denote the road segment length and theaverage data packets transmission speed on the road segmentrespectively
With the assistance of vehicles on the westbound lanethere are alternating periods of disconnection and connec-tivity on the eastbound lane In the disconnection phasedata packets are carried by a forwarding vehicle with vehiclespeed V1 until next neighboring vehicle to be connected Inthe connection phase data packets are propagated at wirelesstransmission speed V1ℎ119900119901 which can be represented as
V1ℎ119900119901 = 119886119877119905119901 (11)
where 119905119901 is the one-hop transmission delay [19]Referring to the alternating renewal process theorem as
shown in [20] the long-run probability of data transmissiontime spent in disconnected phase is given as
119875119889119901 = 119879119889119901119879119889119901 + 119879119888119901 = 11 + 119889119888119901V1119889119889119901V1ℎ119900119901 (12)
where 119879119889119901 119879119888119901 and 119889119889119901 119889119888119901 respectively indicate the datapackets travelling time and the distances in the disconnectedand connected phases For the connected phase the proba-bility is deduced as
119875119888119901 = 119879119888119901119879119889119901 + 119879119888119901 = 11 + 119889119889119901V1ℎ119900119901119889119888119901V1 (13)
Comprehensivizing (11) (12) and (13) we have
119864 (V) = V1119875119889119901 + V1ℎ119900119901119875119888119901 = (119889119889119901 + 119889119888119901) V1V1ℎ119900119901119889119889119901V1ℎ119900119901 + 119889119888119901V1 (14)
Further substituting (14) back into (13) the road segmenttransmission delay can be obtained as
119863119899119901 = 119871119889119889119901119886119877 + 119889119888119901V1119905119901(119889119889119901 + 119889119888119901V1119886119877) (15)
(a) Disconnected PhaseAs shown in Figure 3 the forwardingvehicle 119881119896 and the next consecutive vehicle 119881119896+1 on theeastbound lane are disconnected due to the distance 119909 gt 119877With this observation the data packets are carried by vehicle119881119896 until the connectivity between119881119896 and the neighbor vehicleis set up
The corresponding distance on the westbound lanebetween 119881119896 and 119881119896+1 is connected ie lfloor119909119886119877rfloor consecutiveblocks are occupied by at least one vehicle Therefore thenumber of blocks traversed by 119881119896 is given as
119864 (119899) = ( 1 minus 119901119909119886119877119886(1 minus 119901119886) 119901119909119886119877119886 minus 119909119886119877) V1V1 + V2
(16)
Wireless Communications and Mobile Computing 7
where 119901119886 = 1minus 119890minus1198861198771205822 denotes the probability that each blockhas at least one vehicle on the westbound lane
The link between119881119896 and119881119896+1 is broken if at least one blockon the westbound lane is vacant along the gap 119909 for 119909 gt 119877The disconnection probability between 119881119896 and 119881119896+1 is givenas follows
119875 (119862 | 119883 = 119909) == 0 if 119909 le 1198771 minus 119901lfloor119909119886119877rfloor119886 if 119909 gt 119877 (17)
Noting that the probability density function (PDF) of thevehicles on the eastbound lane 119891119883(119909) = 1205821119890minus1205821119909 thedisconnection probability can be expressed as
119875 (119862) = intinfin0
119875 (119862 | 119883 = 119909)119891119883 (119909) 119889119909 (18)
Based on which the average distance of data transmission indisconnected phase is given as
119889119889119901 = intinfin0
119886119877119864 (119899) 119891119883 (119909) 119875 (119862 | 119883 = 119909)119875 (119862) (19)
Substituting (16)ndash(18) back into (19) the final expression of119889119889119901 can be obtained
(b) Connected Phase In the connected phase vehicles areconnected with each other and data packets are transmittedat the speed V1ℎ119900119901 The transmission distance is divided intotwo parts
In the first part as shown in Figure 3 consecutive east-bound vehicles are connected if the distance between them isno more than 119877 andor even if the distance is greater than119877 each westbound block within the distance is occupied byat least one vehicle In this case the expected transmissiondistance between two consecutive vehicles on the eastboundlane is obtained as
119889119889119901 = intinfin0
119886119877119864 (119899) 119891119883 (119909) 119875 (119862 | 119883 = 119909)119875 (119862) (20)
If 119910 which is a slack value consecutive links on the eastboundlane are connected the transmission distance covered is 119910 sdotE(119883 | 119862) Therefore the average transmission distance isshown as follows
1198891198891199011 = infinsum119910=1
119910E (119883 | 119862) 119875 (119862)119910 (1 minus 119875 (119862))
= E (119883 | 119862) 119875 (119862)1 minus 119875 (119862) = E (119883 | 119862) 1 minus 119875 (119862)119875 (119862)
(21)
In the second equality if the gap in the disconnected phase isrepaired by the vehicles on the westbound lane successfullythe distance is also traversed by data packets with the speedV1ℎ119900119901 As shown in Figure 3 with the movement of vehiclesthe vacant blocks between 119881119870 and 119881119870+1 will be occupied bythe vehicles in connected situation 2 and data packets can
220 240 260 280 300 320 340 360 380 400200Communication range R(m)
0
5
10
15
20
25
30
35
Aver
age d
elay
of r
oad
segm
ents(
s)
=001vehiclesm=002vehiclesm
=003vehiclesm=004vehiclesm
Figure 9 Average delay of road segments for different communica-tion ranges 119877
then be forwarded hop by hop when going through theseblocksMeanwhile the average distance between119881119870 and119881119870+1is deduced as
1198891198881199011 = E (119883 | 119862) = intinfin0
119909119891119883 (119909) 119875 (119862 | 119883 = 119909)119875 (119862) (22)
Particularly in terms of the above investigation the averagedistance of data transmission in partly connected phase isobtained as
119889119888119901 = 1198891198881199011 + 1198891198881199012 (23)
Substituting (21) and (22) back into (24) 119889119888119901 can be deducedand the road segment delay can be finally obtained from (15)(19) and (24)
422 Road Segment with Absolutely Connected (AC) Asshown in Figure 4 all links are connected and data packetsare delivered by hop and hop greedy algorithm so thetransmission delay between adjacent intersections 119894 and 119895 isgiven as
119863119899119888 = 119867119899119888119905119901 (24)
where 119867119899119888 = lceil119871119886119877rceil and 119905119901 present the number of hopsin the road segment and the transmission delay of onehop respectively According to above analysis the averagetransmission delay between two adjacent intersections 119894 and119895 is deduced as follows
119863 (119894 119895) = 119863119899119901 (1 minus 119875119888 (119894 119895)) + 119863119899119888119875119888 (119894 119895) (25)
where 119875119888(119894 119895) means the connectivity probability of the roadsegment
Figures 9ndash11 show the impact of communication rangethe number of vehicles and vehicles speed on the average
8 Wireless Communications and Mobile Computing
0
10
20
30
40
50
60
70
Aver
age d
elay
of r
oad
segm
ents(
s)
22 24 26 28 30 32 34 36 38 4020Number vehicles vehicles
L=1000 mL=1500 m
L=2000 mL=2500 m
Figure 10 Average delay of road segments for different numbers ofvehicles
0
5
10
15
20
25
30
35
40
45
50
Aver
age d
elay
of r
oad
segm
ents(
s)
10 15 20 25 30 355Vehicle speed V(ms)
=001vehiclesm=0015vehiclesm
=002vehiclesm=0025vehiclesm
Figure 11 Average delay of road segments for different vehiclespeeds
transmission delay on the road segment respectively Asshown in Figure 9 the average delay is given as a functionof communication range and the vehicle density in a two-lane scenario In this scenario the vehicle speed V1 = 10msand V2 = 25ms the road segment length 119871 = 2000mand vehicle density 1205821 = 1205822 = 120582 respectively With vehicledensity 1205821 = 001 002 003 004 vehiclesm we candeduce these rules as follows (1) increased communicationrange has low average delay with the constant vehicle density(2) high vehicle density has low average delay with thefixed communication range In Figure 10 the average delayis shown as a function of the number of vehicles and length
Table 1 Settings of simulation parameters
Parameters ValueRoad segment length 2000mRoad width 6mCommunication range 200mVehicle velocity 10ndash25msIterations 100Crossover operator 04ndash099Mutation operator 00001ndash01m
10
20
30
40
50
60
70
80
90
100
Pack
et d
elay
(s)
240 260 280 300220 320 340 360 380 400200Communication range R(m)
IBRGABRCAR
Figure 12 Packet delay
of road segment In this scenario communication range 119877 =200m vehicle speed V1 = 10ms V2 = 25ms respectivelyand road segment length 119871 = 1000 1500 2000 2500mThese curves show that longer road segment length gets highaverage delay in the terms of the fixed number of vehiclesand that more vehicles have lower average delay with thesame road segment length As shown in Figure 11 the averagedelay is given as a function of vehicle speed and vehicledensity In this scenario road segment length 119871 = 2000mcommunication range 119877 = 200m and vehicle density 1205821 =1205822 = 120582 = 001 002 003 and 004 vehiclesm respectivelyFrom the figure we observe that the fast vehicles have loweraverage delay with the same vehicle density and that morevehicles get low average delay in two-lane road segment withthe same vehicle speed In addition it also shows the variationtrend between the average delay and different variables
5 Simulation Results
In this section we examine the performance of our proposedGABR protocol with IBR and CAR [5] where the simulationscenario is urban road and simulation parameters are givenin Table 1
Figure 12 depicts the average transmission delay as afunction of communication range The figure shows that
Wireless Communications and Mobile Computing 9
IBRGABRCAR
550 600 650 700 750 800 850 900 950 1000500Number vehicles vehicles
082
084
086
088
09
092
094
096
098
1
Pack
et d
eliv
ery
ratio
Figure 13 Packet delivery ratio
GABR provides the lowest transmission delay compared withIBR and CAR In the case of CAR which cannot adopt rapidtopology changes it results in slow packets transmissionIBR is based on intersection routing protocol but cannotconsider vehicles density which results in high transmissiondelay The proposed routing protocol divides the road intoseveral blocks and analyzes average delay by considering theconnectivity and it can utilize GA to find the optimal routepaths
Figure 13 shows that the packets delivery ratio as afunction of number of vehicles on the road segment Itis found that more vehicles can significantly reduce theloss of packets It is clear that the GABR provides betterperformance of delivering packets when compared with theother two protocols Specifically GABR obtains real-timetraffic information divides roads into several blocks andanalyzes road connectivity to select next-hop intersectiondynamically Moreover the proposed scheme uses GA tooptimize routes for successful delivery of packets In thecase of IBR packets may be lost because of ignoring roadconnectivity It is pointed out that CAR is based on sourcenode routing protocol but cannot deal with protean topologychanges which results frequent loss of packets
6 Conclusions
In this paper a genetic algorithm based QoS perceptionrouting protocol namely GABR is proposed for VANETswhere each improvable path is probed by IBR protocol androad segments are divided into several blocks In our pro-posed scheme vehicles between two adjacent intersectionsutilized greedy carry-forward algorithm to deliver packets Inaddition genetic algorithm is employed to find the path withoptimal QoS in the global available paths The simulationresults validated that GABR protocol is superior to the IBRand CAR protocols in terms of packets transmission delayand the packet loss rate However it is worth noting that
our proposed scheme is complex to program in GA and thespeed of searching is slower In our future work we will focuson combining genetic algorithm with other heuristic bionicalgorithms to speed up the optimization
Data Availability
The simulation code and data used to support the findings ofthis study are available from the corresponding author uponrequest
Conflicts of Interest
The authors declare that there are no conflicts of interestregarding the publication of this paper
Acknowledgments
This work is supported by National Natural Science Founda-tion of China under Grants 61401241 61371113 and 61571246and also supported by the US National Science Foundationunder Grants 1401121 and 1414250
References
[1] G Li L Boukhatem and SMartin ldquoAn intersection-basedQoSrouting in vehicular ad hoc networksrdquo Mobile Networks andApplications vol 20 no 2 pp 268ndash284 2015
[2] S Tsiachris G Koltsidas and F-N Pavlidou ldquoJunction-basedgeographic routing algorithm for vehicular ad hoc networksrdquoWireless Personal Communications vol 71 no 2 pp 955ndash9732013
[3] M Al-Rabayah and R Malaney ldquoA new scalable hybrid routingprotocol for VANETsrdquo IEEE Transactions on Vehicular Technol-ogy vol 61 no 6 pp 2625ndash2635 2012
[4] K Rajesh R Karthick and G S Raj ldquoA new scalable reac-tive location based ad hoc routing protocol for VANETsrdquo inProceedings of the 5th International Conference on InformationCommunication amp Embedded Systems pp 1ndash5 Chennai India2014
[5] NAlsharif andX S Shen ldquoICARII intersection-basedconnec-tivity aware routing in vehicular networksrdquo in Proceedings of the1st IEEE International Conference on Communications (ICC rsquo14)pp 2731ndash2735 New South Wales Australia June 2014
[6] L-D Chou J-Y Yang Y-C Hsieh D-C Chang and C-F Tung ldquoIntersection-based routing protocol for VANETsrdquoWireless Personal Communications vol 60 no 1 pp 105ndash1242011
[7] M Jerbi S-M Senouci T Rasheed and Y Ghamri-DoudaneldquoTowards efficient geographic routing in urban vehicular net-worksrdquo IEEE Transactions on Vehicular Technology vol 58 no9 pp 5048ndash5059 2009
[8] M Xu F Ji M Wen and W Duan ldquoNovel Receiver Designfor the Cooperative Relaying System with Non-OrthogonalMultiple Accessrdquo IEEE Communications Letters vol 20 no 8pp 1679ndash1682 2016
[9] M Wen E Basar Q Li B Zheng and M Zhang ldquoMultiple-Mode Orthogonal FrequencyDivisionMultiplexing with IndexModulationrdquo IEEE Transactions on Communications vol 65no 9 pp 3892ndash3906 2017
10 Wireless Communications and Mobile Computing
[10] J Li M Wen X Jiang and W Duan ldquoSpace-Time Multiple-Mode Orthogonal FrequencyDivisionMultiplexing with IndexModulationrdquo IEEE Access vol 5 pp 23212ndash23222 2017
[11] S Girijalakshmi K Sivakumar and C Chandrasekar ldquoDSDVaddendum through genetic algorithm in VANETrdquo in Proceed-ings of the in Proceedings on National Conference on Innovationin Computing and Communication Technology pp 19ndash23 Ger-many 2016
[12] S Kaur and A Virk ldquoAODV extension using genetic algorithmin VANETrdquo International Journal of Science and Research vol 4no 7 pp 2420ndash2422 2015
[13] M Yazdani and F Jolai ldquoLion optimization algorithm (LOA) anature-inspired metaheuristic algorithmrdquo Journal of Computa-tional Design amp Engineering vol 4 no 1 pp 24ndash36 2015
[14] B M Baker and M A Ayechew ldquoA genetic algorithm for thevehicle routing problemrdquo Computers amp Operations Researchvol 30 no 5 pp 787ndash800 2003
[15] A Paschalis P Molnar S Fatichi and P Burlando ldquoOntemporal stochastic modeling of precipitation nesting modelsacross scalesrdquoAdvances inWater Resources vol 63 pp 152ndash1662014
[16] A Papoulis and S Pillai Probability Random Variables andStochastic Processes McGraw-Hill New York NY USA 4thedition 2002
[17] V SiwachY Singh andDBarak ldquoAn approach to optimizeQoSrouting protocol using genetic algorithm in MANETrdquo Interna-tional Journal of Computer Science amp Management Studies vol12 no 3 pp 149ndash153 2012
[18] O Yeniay ldquoAn Overview of Genetic Algorithmsrdquo AnadoluUniversity Journal of Science and Technology vol 2 no 1 pp37ndash49 2001
[19] A Dittrich B Lichtblau R Rezende andMMalek ldquoModelingresponsiveness of decentralized service discovery in wirelessmesh networksrdquo inMeasurement Modelling and Evaluation ofComputing Systems and Dependability and Fault Tolerance vol8376 of Lecture Notes in Computer Science pp 88ndash102 SpringerInternational Publishing Cham Switzerland 2014
[20] A L Marzo and J C Salazar Index-introduction to probabilitymodels Infection amp Immunity Press 11th edition 2007
International Journal of
AerospaceEngineeringHindawiwwwhindawicom Volume 2018
RoboticsJournal of
Hindawiwwwhindawicom Volume 2018
Hindawiwwwhindawicom Volume 2018
Active and Passive Electronic Components
VLSI Design
Hindawiwwwhindawicom Volume 2018
Hindawiwwwhindawicom Volume 2018
Shock and Vibration
Hindawiwwwhindawicom Volume 2018
Civil EngineeringAdvances in
Acoustics and VibrationAdvances in
Hindawiwwwhindawicom Volume 2018
Hindawiwwwhindawicom Volume 2018
Electrical and Computer Engineering
Journal of
Advances inOptoElectronics
Hindawiwwwhindawicom
Volume 2018
Hindawi Publishing Corporation httpwwwhindawicom Volume 2013Hindawiwwwhindawicom
The Scientific World Journal
Volume 2018
Control Scienceand Engineering
Journal of
Hindawiwwwhindawicom Volume 2018
Hindawiwwwhindawicom
Journal ofEngineeringVolume 2018
SensorsJournal of
Hindawiwwwhindawicom Volume 2018
International Journal of
RotatingMachinery
Hindawiwwwhindawicom Volume 2018
Modelling ampSimulationin EngineeringHindawiwwwhindawicom Volume 2018
Hindawiwwwhindawicom Volume 2018
Chemical EngineeringInternational Journal of Antennas and
Propagation
International Journal of
Hindawiwwwhindawicom Volume 2018
Hindawiwwwhindawicom Volume 2018
Navigation and Observation
International Journal of
Hindawi
wwwhindawicom Volume 2018
Advances in
Multimedia
Submit your manuscripts atwwwhindawicom
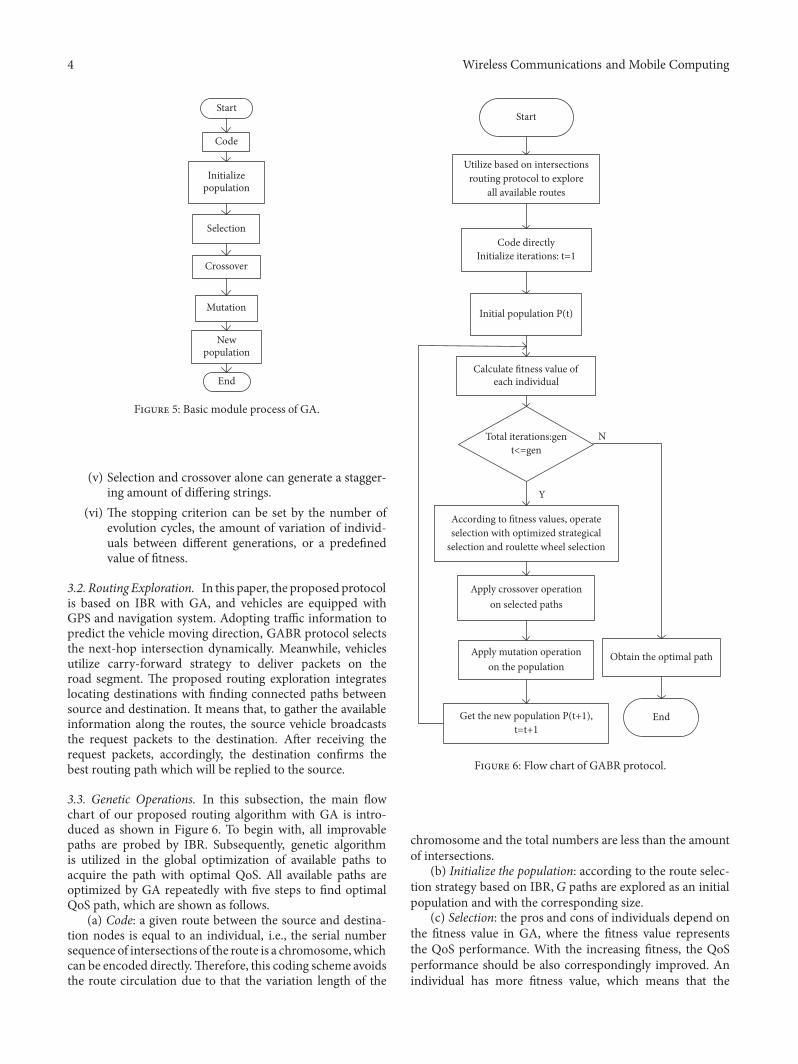
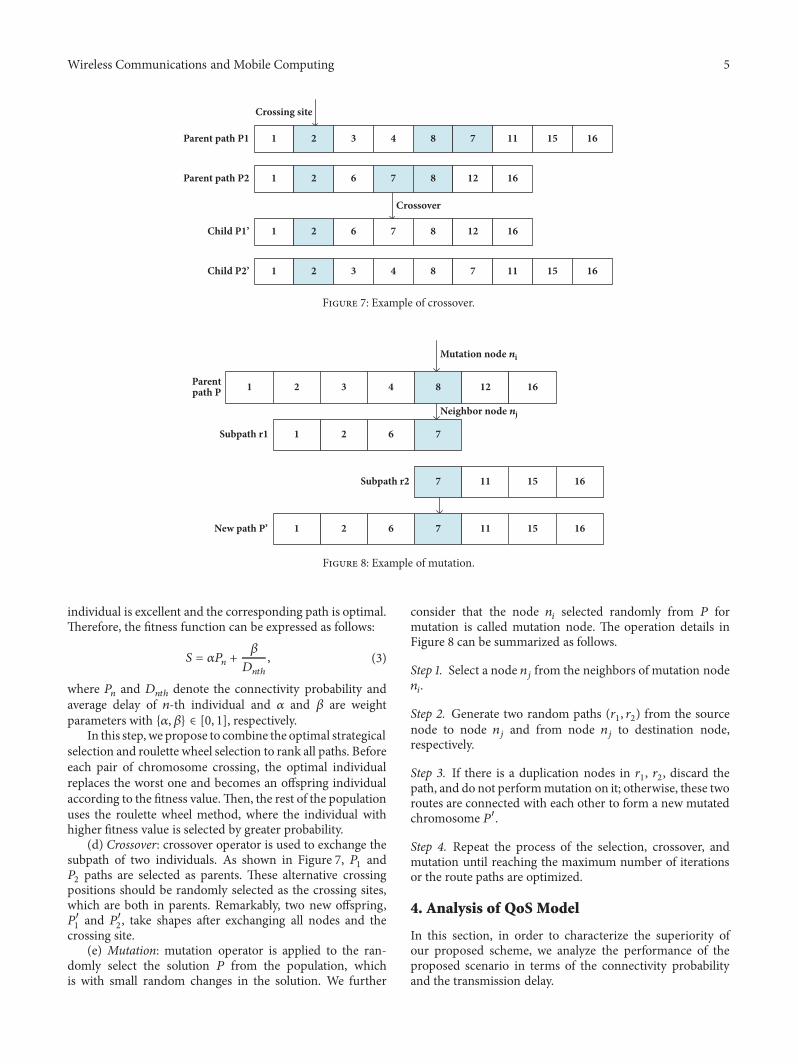
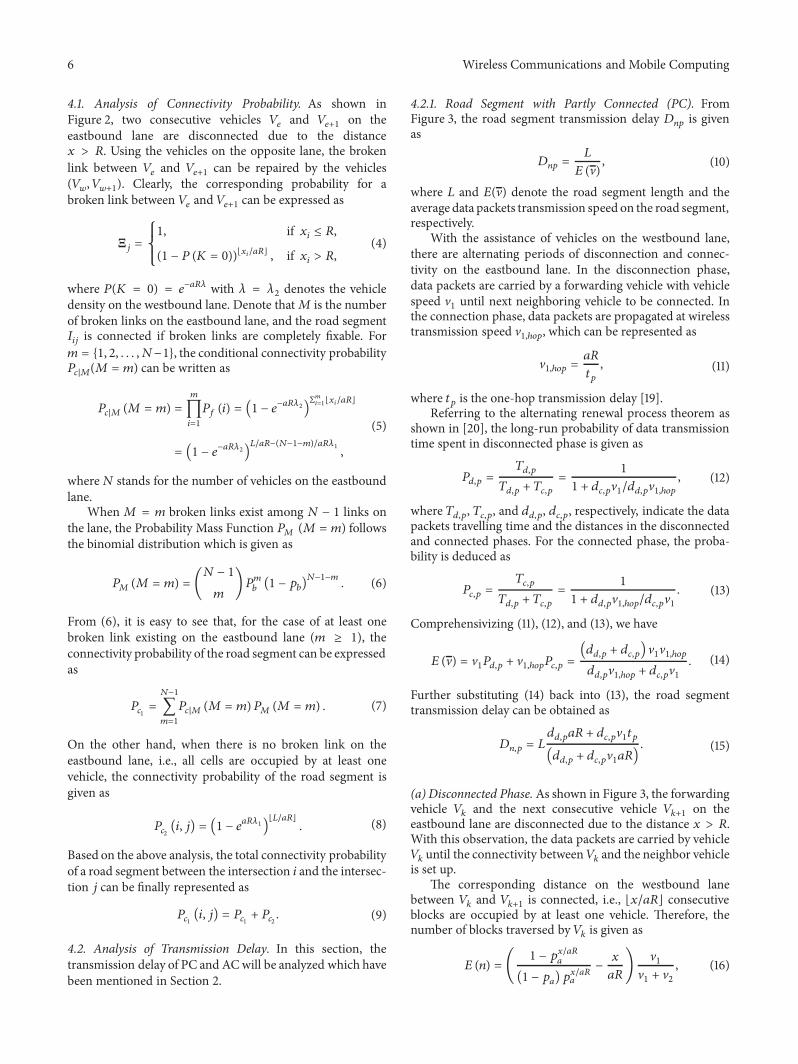
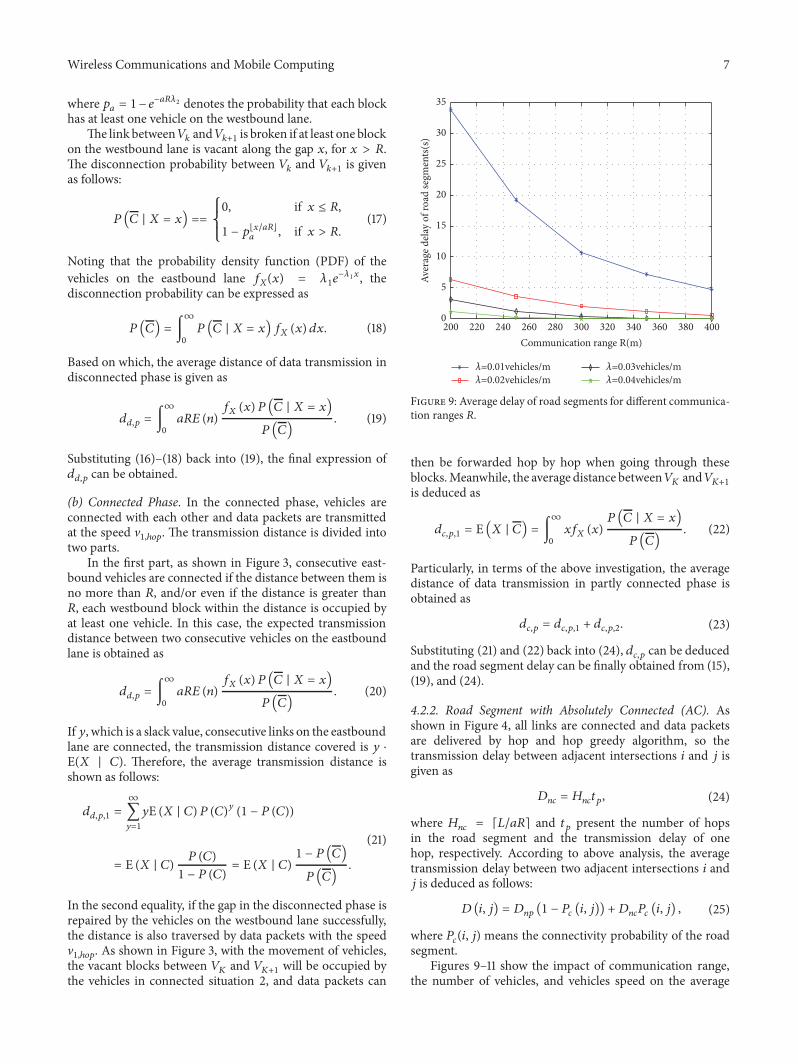
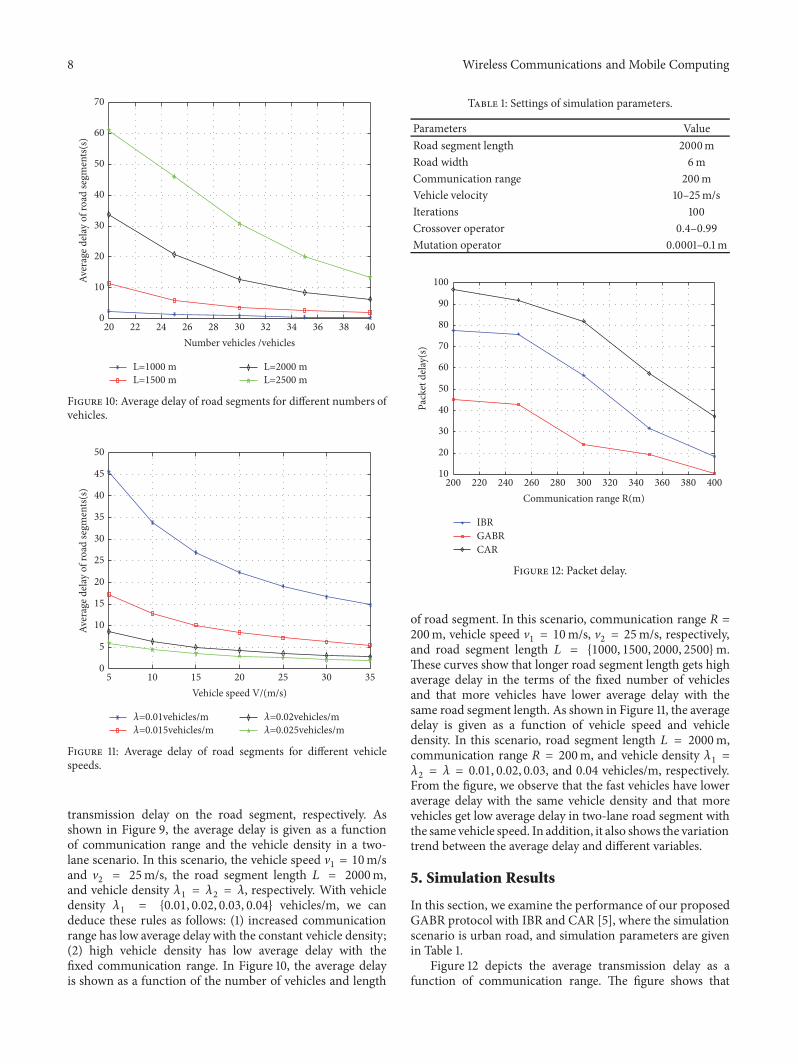

International Journal of
AerospaceEngineeringHindawiwwwhindawicom Volume 2018
RoboticsJournal of
Hindawiwwwhindawicom Volume 2018
Hindawiwwwhindawicom Volume 2018
Active and Passive Electronic Components
VLSI Design
Hindawiwwwhindawicom Volume 2018
Hindawiwwwhindawicom Volume 2018
Shock and Vibration
Hindawiwwwhindawicom Volume 2018
Civil EngineeringAdvances in
Acoustics and VibrationAdvances in
Hindawiwwwhindawicom Volume 2018
Hindawiwwwhindawicom Volume 2018
Electrical and Computer Engineering
Journal of
Advances inOptoElectronics
Hindawiwwwhindawicom
Volume 2018
Hindawi Publishing Corporation httpwwwhindawicom Volume 2013Hindawiwwwhindawicom
The Scientific World Journal
Volume 2018
Control Scienceand Engineering
Journal of
Hindawiwwwhindawicom Volume 2018
Hindawiwwwhindawicom
Journal ofEngineeringVolume 2018
SensorsJournal of
Hindawiwwwhindawicom Volume 2018
International Journal of
RotatingMachinery
Hindawiwwwhindawicom Volume 2018
Modelling ampSimulationin EngineeringHindawiwwwhindawicom Volume 2018
Hindawiwwwhindawicom Volume 2018
Chemical EngineeringInternational Journal of Antennas and
Propagation
International Journal of
Hindawiwwwhindawicom Volume 2018
Hindawiwwwhindawicom Volume 2018
Navigation and Observation
International Journal of
Hindawi
wwwhindawicom Volume 2018
Advances in
Multimedia
Submit your manuscripts atwwwhindawicom


![ChipNet: Real-Time LiDAR Processing for Drivable Region ...users.wpi.edu/~xhuang/pubs/2018_lyu_tcas1.pdf · Convolutional Network (FCN) [25], various network struc-tures have been](https://img.pdfslide.net/doc/110x75/5ed58ebce4e9005a3e7b0b58/chipnet-real-time-lidar-processing-for-drivable-region-userswpieduxhuangpubs2018lyutcas1pdf.jpg)