Embed Size (px)
Citation preview
Comprehensive Summaries of Uppsala Dissertationsfrom the Faculty of Medicine 1378
Genetic Analysis of QuantitativeTraits Using Domestic AnimalsA Candidate Gene and Genome Scanning Approach
BY
HEE-BOK PARK
ACTA UNIVERSITATIS UPSALIENSISUPPSALA 2004
51 p
PRKAG3 MC4R

To my parents
and
my dearest wife, Sojeong Ka
List of appended papers
This thesis is based on the following publications and manuscripts, which will be referred to in the text by their Roman numerals:
I. H.B. Park, S. Marklund, J.T. Jeon, J.R. Mickelson, S.J. Val-berg, K. Sandberg, L. Andersson. 2004. Molecular characteri-zation and mutational screening of PRKAG3 gene in the horse. Cytogenetic and Genome Research 102: 211-216.
II. H.B. Park, Ö. Carlborg, S. Marklund, L. Andersson. 2002. Melanocortin-4 receptor (MC4R) genotypes have no major ef-fect on fatness in a Large White Wild Boar intercross. Ani-mal Genetics 33. 155-157.
III. L. Jacobsson, H.B. Park. P.Wahlberg, S.W. Jiang, P.B. Siegel, L. Andersson, 2004. Assignment of 14 microsatellite markers to the chicken linkage map. Poultry Science (ac-cepted).
IV. L. Jacobsson, H.B. Park. P. Wahlberg, R. Fredriksson, M. Pérez-Encisco, P.B. Siegel, L. Andersson. Many QTLs, each with a small effect, explain a huge difference in growth rate between two selection lines in chicken (submitted).
V. H.B. Park, L. Jacobsson, P. Wahlberg, P.B. Siegel, L. Andersson. QTL analysis of body composition and metabolic traits in an intercross between lines of chickens divergently selected for growth (manuscript).
Reprints were made with the permission of the publishers.
Contents
Introduction.....................................................................................................71. Historical background ............................................................................7
1.1 Mendelian and classical quantitative genetics .................................71.1.1 Mendelian genetics ..................................................................71.1.2 Classical quantitative genetics: Could Mendelian genetics account for inheritance of quantitative characters?...........................7
1.2 Neoclassical quantitative genetics and molecular genetics .............81.2.1 Neoclassical quantitative genetics............................................81.2.2 Molecular genetics ...................................................................9
2. Strategies for molecular genetic analysis of quantitative traits ............102.1 Candidate genes .............................................................................112.2 Genome scanning...........................................................................122.3 Combined approach of candidate genes and genome scanning.....14
3. Linkage analysis: a powerful method for genetic analysis of quantitative traits ......................................................................................15
3.1 Two point linkage analysis ............................................................153.2 Multipoint linkage analysis............................................................183.3 Genetic mapping of trait loci .........................................................193.4 Linkage analysis of quantitative traits ...........................................21
4. Benefits from using domestic animals in the genetic studies of quantitative traits ......................................................................................23
4.1 Phenotypic and genotypic diversity...............................................234.2 Long history of analysis of quantitative traits ...............................244.3 Domestic animal genomic resources .............................................24
Objectives of the thesis .................................................................................261. Candidate gene analysis ......................................................................262. Genome scanning ................................................................................26
Results and Discussion .................................................................................271. Candidate gene analysis .......................................................................27
1.1 Molecular characterization and mutational screening of the PRKAG3 gene in the horse (Paper I) ..................................................271.2 Melanocortin-4 receptor (MC4R) genotypes have no major effect on fatness in a Wild Boar Large White intercross (Paper II) ............29
2. Genome scanning .................................................................................312.1 Multipoint linkage analysis to construct a chicken linkage map (Paper III) ...................................................................................332.2 Genome scanning of QTLs affecting the direct response to selection for growth in chickens (Paper IV).......................................342.3 Genome scanning of QTLs affecting correlated response to selection for growth in chickens (Paper IV and V) ...........................36
Conclusions...................................................................................................39
Future prospects ............................................................................................40
Acknowledgments.........................................................................................42
References.....................................................................................................44
7
Introduction
1. Historical background
1.1 Mendelian and classical quantitative genetics 1.1.1 Mendelian genetics Gregor Mendel (1822-1884), the first geneticist, proposed his principles ad-dressing the question of “what is inherited and how?” based on his experi-mental results using garden pea (Mendel, 1865). Mendel performed a series of elegant experiments and concentrated on the numerical relationship ap-pearing in the offspring of hybrids. He observed the transmission of each qualitative character (e.g. green versus yellow seeds, red versus white flow-ers, etc.) from parents to progeny, and mathematical analyses of his garden pea crosses enabled him to recognize the particulate nature of the hereditary factors, now called genes. Mendel also postulated that the factors undergo segregation during the formation of germ cells (i.e. the law of segregation) and pairs of differentiating traits are inherited independently of other pairs of traits (i.e. the law of independent assortment). However, it took almost 40 years for the biologists to appreciate the importance of Mendel’s findings. In the following years, there were new scientific discoveries that could support Mendel’s principle. For example, the chromosome theory of inheritance was proposed based on the cytological observations that transmission patterns of chromosomes are closely associated with Mendelian inheritance (Sutton, 1903). Thomas H. Morgan (1866-1945) provided the empirical evidences of this theory using fruit flies. He demonstrated that genes located close to-gether on the same chromosome co-segregated in his experimental crosses (i.e. linkage), and could be mapped into linear linkage groups which corre-sponded to chromosomes (Morgan, 1934). Thanks to Morgan’s contribution, the failure of independent assortment in Mendelian inheritance can be ex-plained by linkage. In 1908, the equation describing the expected genotype distribution in a random mating population at equilibrium was derived by Hardy and Weinberg (Crow, 1999).
1.1.2 Classical quantitative genetics: Could Mendelian genetics account for inheritance of quantitative characters?In 1859, Charles Darwin (1809-1882) published “The Origin of the Species”
8
where he proposed his theory of evolution by means of natural selection. Inhis book, Darwin argued that species were not unchangeable, but were forced to adapt to given environments, and that the individuals with optimal fitness had a better chance of survival and reproduction. He postulated that the evolution of new species is due to the gradual accumulation of useful small variation in traits. Thus, quantitative variation is of crucial importance in Darwinian evolution. A group of scientist, called biometricians, led by Karl Pearson (1857-1936) supported the Darwinian view of step-wise accu-mulation of continuous variation in the evolutionary process driven by natu-ral selection. They exclusively focused on collection of quantitative data showing continuous variation and developed statistical methods such as re-gression and correlation for quantitative comparison of the traits between relatives. Although Mendel’s findings were re-discovered by three plant breeders, Karl Correns, Erich Tschermak, and Hugo de Vries in 1900, bio-metricians disregarded Mendelian heredity and regarded it as a few special cases in natural populations because they thought that the evolutionary proc-ess including inheritance of quantitative traits could only be interpreted in terms of statistics. However, Mendelian geneticists in the early 20th century such as William Bateson (1861-1926) had different views on the evolution-ary process. In contrast to biometricians, they just concentrated their inter-ests on qualitative traits exhibiting discontinuous characters and did not study quantitative traits such as height or weight since they dismissed such continuous characters as random fluctuations which can not be explained by biometric methods. As for the Mendelian geneticists, the role of natural se-lection in evolution was limited to maintaining the variation within species, and they subscribed to the discrete nature of evolution by mutation as the major force for the creation of new species (Provine, 1971; Table 1).
This conflict between Darwinian biometricians and Mendelian geneticists was reconciled by Ronald A. Fisher (1890-1962). In an article published in 1918, Fisher proposed his theory demonstrating that Mendelian inheritance could be interpreted as the correlations between relatives studied by the bio-metricians. In this masterpiece which became one of the most important cor-nerstones of classical quantitative genetics, he regarded phenotypic value of an individual as the sum of aggregate genotypic value derived from an infi-nitely large number of segregating loci, each with a very small effect on the continuous variation of the phenotype (i.e. infinitesimal loci model) in com-bination with environment value.
1.2 Neoclassical quantitative genetics and molecular genetics 1.2.1 Neoclassical quantitative genetics Although the classical quantitative genetic theory is supported by several types of evidence, such as many successes in genetic improvement in farm
9
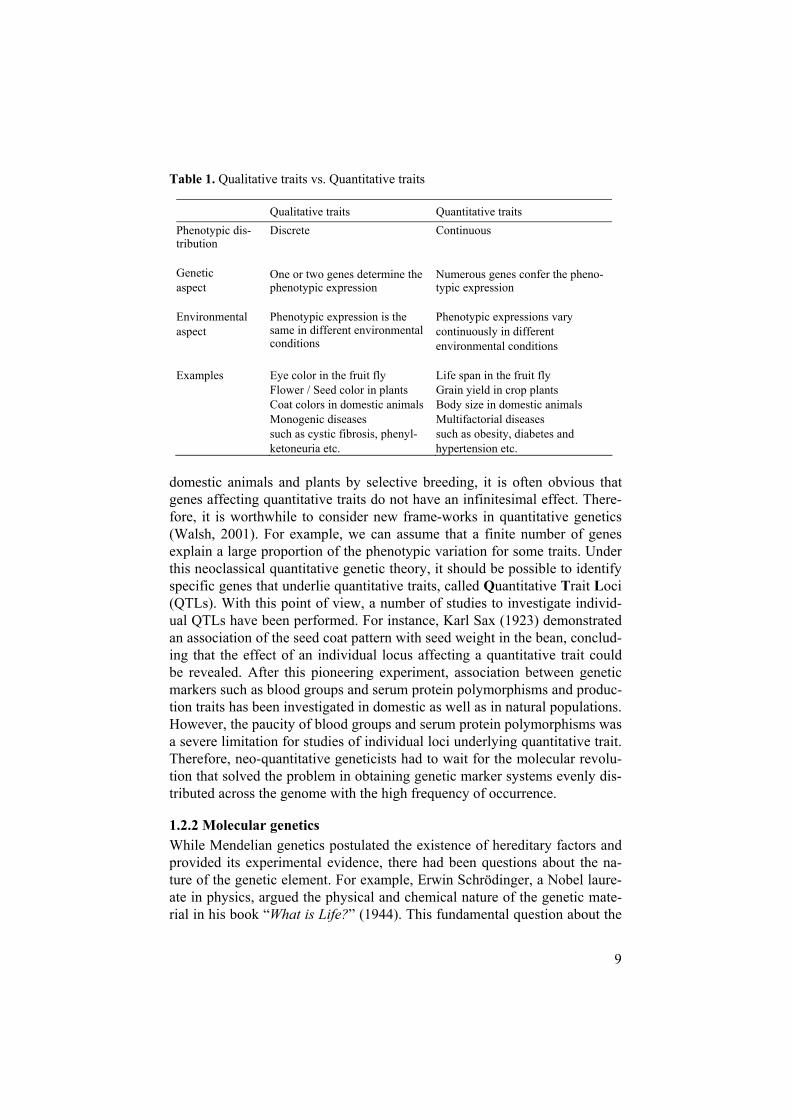
Table 1. Qualitative traits vs. Quantitative traits
Qualitative traits Quantitative traits Phenotypic dis-tribution
Discrete Continuous
Geneticaspect
One or two genes determine the phenotypic expression
Numerous genes confer the pheno-typic expression
Environmentalaspect
Phenotypic expression is the same in different environmental conditions
Phenotypic expressions vary continuously in different environmental conditions
Examples Eye color in the fruit fly Life span in the fruit fly Flower / Seed color in plants Grain yield in crop plants Coat colors in domestic animals Body size in domestic animals Monogenic diseases Multifactorial diseases such as cystic fibrosis, phenyl- such as obesity, diabetes and ketoneuria etc. hypertension etc.
domestic animals and plants by selective breeding, it is often obvious that genes affecting quantitative traits do not have an infinitesimal effect. There-fore, it is worthwhile to consider new frame-works in quantitative genetics (Walsh, 2001). For example, we can assume that a finite number of genes explain a large proportion of the phenotypic variation for some traits. Under this neoclassical quantitative genetic theory, it should be possible to identify specific genes that underlie quantitative traits, called Quantitative Trait Loci(QTLs). With this point of view, a number of studies to investigate individ-ual QTLs have been performed. For instance, Karl Sax (1923) demonstrated an association of the seed coat pattern with seed weight in the bean, conclud-ing that the effect of an individual locus affecting a quantitative trait could be revealed. After this pioneering experiment, association between genetic markers such as blood groups and serum protein polymorphisms and produc-tion traits has been investigated in domestic as well as in natural populations. However, the paucity of blood groups and serum protein polymorphisms was a severe limitation for studies of individual loci underlying quantitative trait. Therefore, neo-quantitative geneticists had to wait for the molecular revolu-tion that solved the problem in obtaining genetic marker systems evenly dis-tributed across the genome with the high frequency of occurrence.
1.2.2 Molecular genetics While Mendelian genetics postulated the existence of hereditary factors and provided its experimental evidence, there had been questions about the na-ture of the genetic element. For example, Erwin Schrödinger, a Nobel laure-ate in physics, argued the physical and chemical nature of the genetic mate-rial in his book “What is Life?” (1944). This fundamental question about the
10
molecular basis of genetic materials attracted many chemists and physicists. They eventually introduced their theoretical and experimental experiences like the x-ray crystallography, into the field of molecular genetics, and they reported a series of experimental results supporting the fact that Deoxyribose Nucleic Acid (DNA) is the hereditary material (Avery et al., 1944; Hershey and Chase, 1952). In 1953, Watson and Crick came up with a critical turning point in unveiling the nature of the gene based on those progresses in the field of molecular genetics. They proposed the double helical structure of DNA and postulated its importance for genetic information transfer in living organisms. Taken together, all of these contributed significantly to the de-velopment of experimental methods used to solve problems concerning the paucity of informative genetic markers. In the 1970’s, discoveries of restric-tion endonuclease (Smith and Wilcox, 1970) and ligase (Jackson et al., 1972) became the starting point of the recombinant DNA research using plasmids and bacteria (Cohen et al., 1973). Detection of specific sequences among DNA fragments separated by gel electrophoresis became also avail-able (Southern, 1975). Furthermore, techniques to reveal the accurate nu-cleotide sequence of DNA were devised (Sanger et al., 1977; Maxam and Gilbert, 1977). In the following decades, innovative technologies such as Po-lymerase Chain Reaction (PCR) for in vitro amplification of a specific DNA fragment (Mullis et al., 1986) together with automated DNA sequencing methods (Smith et al., 1986) provided the technical background for sequenc-ing the entire human genome and the project eventually achieved its goal (Lander et al., 2001;Venter et al., 2001).
All these tremendous breakthroughs in molecular genetics rendered it pos-sible to lift the hurdle in the development of the genetic markers, which are highly informative and evenly distributed throughout the genome. This new marker system based on DNA sequence variation allowed geneticists to build genetic maps of the genome to locate trait loci of unknown function based only on their hereditary patterns (Figure 1; Botstein et al., 1980).
2. Strategies for molecular genetic analysis of quantitative traits
Thanks to the progress in both molecular genetic approaches and statistical methods, it has been possible to perform genetic analysis of an organism to correlate DNA polymorphisms with the phenotypic variations to map and identify QTLs. Genetic analysis of QTLs can be conducted by using a candi-date gene approach and by genome scanning based on linkage analysis using DNA markers.
11
2.1 Candidate genes Candidate genes are previously identified genes with a known biochemical function involved in a physiological pathway that can influence the trait of interest. If a gene in another species exhibits high degree of sequence ho-mology and determines a strikingly similar phenotype, this gene can also be a candidate gene. Polymorphic variants of candidate genes can be detected by direct sequencing of the coding sequence and the flanking regions. Poly-morphic DNA markers adjacent to the candidate locus can also be used as another type of polymorphic variants. Then, statistical analysis, such as analysis of variance or regression methods, is carried out to evaluate the ef-fects of the candidate gene on the variability of a quantitative trait using a population that is phenotyped for the trait under consideration and genotyped at the candidate locus.
If the phenotypic distribution of traits between genotype classes are sig-nificantly different, the candidate gene can be assumed either to have a direct effect on the trait or to be associated (via Linkage Disequilibrium, LD) with another locus that has a functional effect (Blangero et al., 1992).
In a population, LD between loci may be generated by mutation, selec-tion, random genetic drift, or migrations and population stratification be-tween genetically differentiated populations. In farm animal populations, the effect of random drift is more significant due to the limited number of breed-ing animals. The presence of LD increases the probability of finding a true association between genetic markers and a QTL but also increases the risk of false positive association in candidate gene studies (Andersson, 2001).
It is possible to assess the direct effects of candidate genes on quantitative traits. So, one can detect loci with small effects as well as major loci that cause the trait variation depending on the experimental design (Andersson 2001). Moreover, it can be applied to an existing population without a spe-cial experimental mating scheme (Cheverud and Routman, 1993).
A number of candidate gene studies have been carried out to identify QTLs in various populations. For example, there are reports concerning the significant association of alleles at candidate loci underlying the develop-ment of bristle with bristle number traits in the fruit fly (Mackay and Lang-ley, 1990; Lai et al, 1994). Genes coding for growth hormon and insulin- like growth factor-1 have been investigated as candidate genes for growth traits in pigs (Casas-Carrillo et al., 1997).
However, the candidate gene approach has also some disadvantages. Firstly, only a limited region of the genome is assessed even though many unidentified loci may also affect the trait of interest. Thus, it is not possible to identify new QTLs using this approach (Cheverud and Routman, 1993). Secondly, the candidate gene approach might be unsuccessful simply due to the gaps in our knowledge about gene function. Most of the functional in-formation that can be used for selecting candidate genes is derived from
12
model organisms such as transgenic mice. Therefore, it could be irrelevant to investigate the expression of the phenotype in natural population using this information (Vadasz, 2000). Thirdly, we should be very cautious to interpret the positive result of a candidate gene approach because a false positive re-sult can be produced because of LD to linked causative genes. Spurious re-sults can also occur because the significance thresholds are improperly ad-justed when testing multiple candidate genes (Campbell and Rudan, 2002).
2.2 Genome scanning In the genome scanning approach, multiple genetic markers are employed to screen the whole genome of an organism to identify chromosomal regions affecting quantitative traits. In contrast to the candidate gene approach, there are no specific loci chosen by a priori knowledge based on functional rele-vance to the trait of interest. But instead, marker loci employed for screening the entire genome are expected to be linked to QTL resulting in a correlation between quantitative trait values and marker genotypes. Then it is rational to examine which genetic markers co-segregate with QTLs and to estimate the effects of each located QTL on the phenotypic variation. Therefore, scanning the genome using genetic markers provides the potential of identifying new and/or previously unexpected genes influencing the trait of interest (Cheverud and Routman, 1993; Bovenhuis et al., 1997). Systematic genome scanning to identify chromosomal regions influencing quantitative traits has only become possible with the development of markers based on DNA se-quence variation, which can be applied to construct saturated genetic maps.
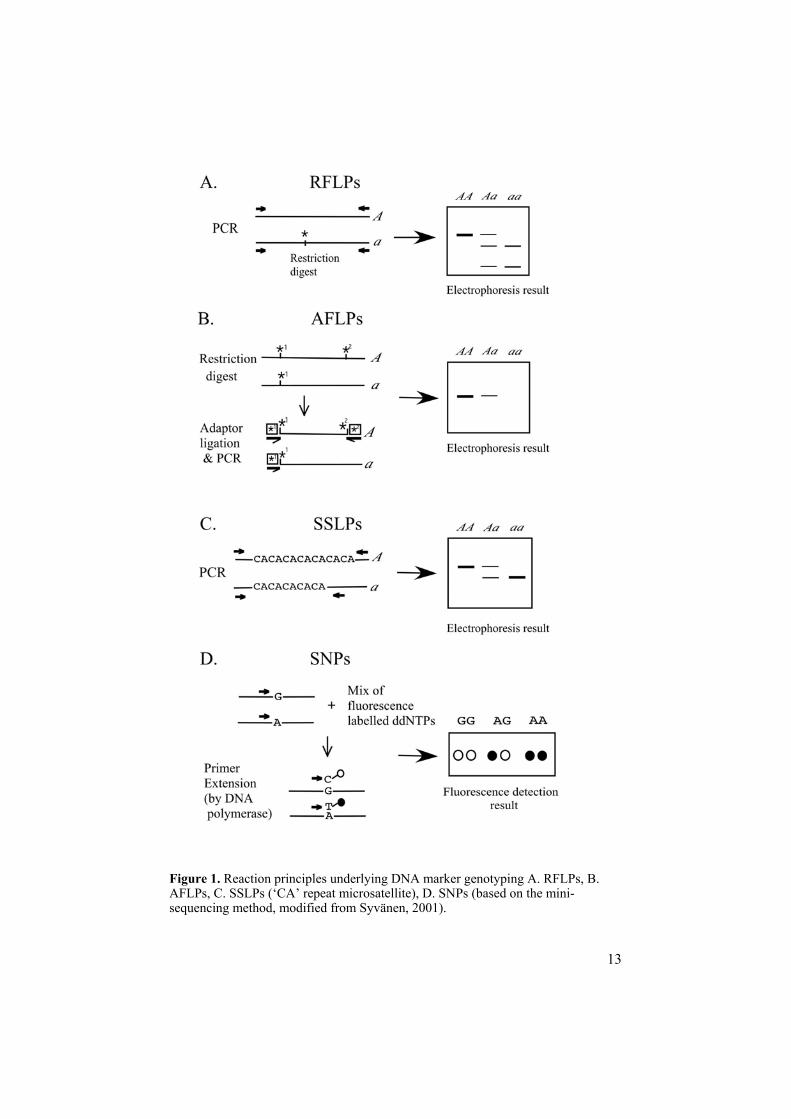
Along with recent revolutionary advances in molecular genetics, several types of markers based on DNA sequence polymorphism have been devel-oped. For instance, Restriction Fragment Length Polymorphisms (RFLPs, Botstein et al., 1980), Simple Sequence Length Polymorphisms (SSLPs, Jef-freys et al., 1985; Weber and May, 1989), Amplified Fragment Length Polymorphisms (AFLPs, Vos et al., 1995), and Single Nucleotide Polymor-phisms (SNPs, Landegren et al., 1988). If we categorize these DNA markers with respect to the mode of inheritance, RFLP, SSLP, and SNP markers are usually co-dominant markers, whereas AFLP is often categorized as a domi-nant marker (Figure 1). It is important to select the markers having sufficient information to maximize the probability to detect the co-segregation between markers and QTLs. The informativeness of a marker is commonly evaluated for its Polymorphism Information Content (PIC) representing the probability for a marker to be informative in a family segregation analysis (Botstein et al., 1980). Markers with a PIC above 0.7 are generally considered as highly informative genetic markers (Hearne et al., 1992).
The access to large number of DNA markers has made it possible to de-velop comprehensive genetic maps encompassing all regions of genome in various organisms (Donis-Keller et al., 1987; Marklund et al., 1996; Groen-
13
Figure 1. Reaction principles underlying DNA marker genotyping A. RFLPs, B. AFLPs, C. SSLPs (‘CA’ repeat microsatellite), D. SNPs (based on the mini-sequencing method, modified from Syvänen, 2001).
14
en et al., 1998). Microsatellites or SSLPs have been the most widely used DNA markers to conduct a genome scanning. They are highly informative, highly abundant, and approximately randomly distributed across the whole genome. Moreover, it is easy to genotype using automated methods based on PCR (Dodgson et al., 1997). As the genomes of several organisms have been
sequenced, SNPs are now becoming the standard molecular marker for a wide range of biological studies including genome scanning. SNPs are the most frequent type of DNA variation. They occur once per 1000-2000 base-pairs in the human genome and approximately 3 million SNPs are already recorded in the human SNP database (e.g. dbSNP§). In general, SNPs are mutationally stable, and mostly bi-allelic making them easy to score (Brookes, 1999). This simple bi-allelic nature of SNPs has facilitated the de-velopment of efficient and accurate high throughput genotyping methods. To analyze the genetic variation at the single nucleotide level, there has been a large number of technologies developed based on a small number of reaction principles such as hybridization with allele specific oligonucleotides, primer extension catalysed by DNA polymerase, recognition of mismatched base pairs by DNA ligase (Syvänen, 2001).
2.3 Combined approach of candidate genes and genome scanningBoth candidate gene analysis and genome scanning have their strengths and limitations in the analysis of QTLs that make them complementary rather than mutually exclusive. So, it should be worthwhile to consider a combined approach that can have the advantage of two methods, as well as avoid their disadvantages.An example of the combination of the two approaches is the positional can-didate gene approach. The first step is to define the chromosomal region us-ing genome scanning, and then try to identify candidate genes responsible for the trait of interest within this region. By using this approach, we can in-vestigate candidate genes with additional information based on map position. The use of comparative mapping, which compares the location of ortholo-gous genes across species, makes it possible to reveal the candidate genes (Womack and Kata, 1995). In this approach, the maps of farm animal spe-cies are supposed to be aligned with the maps of for instance, human and mouse. Thus, the comparative mapping data allow the transfer of informa-tion from ‘gene-rich’ species to ‘gene-poor’ species (O’Brien et al., 1999). Bioinformatics can be used for comparative analysis of genomic sequence and Expressed Sequence Tags (ESTs) to elucidate the information underly-ing orthologous genomic regions between species. This makes it possible to evaluate potential candidate genes worthwhile to investigate further (Penna-
§ The URL of the dbSNP: http://www.ncbi.nih.gov/SNP/
15
-cchio et al., 2001; Band et al., 2000; Amarger et al., 2002; Grisart et al., 2002). Candidate genes located in the QTL region can also be evaluated us-ing their RNA expression pattern because the causative gene might have an expression pattern consistent with the physiology of the trait. The use of mi-croarrays, which is composed of either cDNA fragments or oligonucleotides representing thousands of genes, may reveal the causative gene showing dif-ferential expression between the parental strains (Geschwind, 2000). Genes exhibiting significant evidences for differences at both DNA and RNA levels in relation to the trait of interest should be regarded as positional candidate genes (Aitman et al., 1999; Wayne and McIntyre, 2002).
3. Linkage analysis: a powerful method for genetic analysis of quantitative traits
This section briefly introduces the background about “how is it possible to map loci responsible for the trait of interest via linkage analysis”. Further re-views on the topic are given by Ott (1986, 1999), Broman (1997), Sham (1998), Lynch and Walsh (1998), Zeng (2000), and Terwilliger (1998, 2001).
Meiotic recombination (or crossing-over) can occur more or less ran-domly along homologous pairs of chromosomes at the 1st stage of meiosis. During gametogenesis, the chance of recombination between loci on the same chromosome is lower the more closely located they are.
If family data are available from successive generations, twopoint linkage analysis can allow us to estimate the recombination fraction between loci. Multipoint linkage analysis allows us to order loci and construct a genetic map. Furthermore, if we have a good knowledge regarding the mode of in-heritance for the phenotype from pedigree segregation analysis, we may es-timate the strength of linkage between genetic markers and genes responsi-ble for the traits including Mendelian monogenic traits as well as complex traits displaying quantitative variation.
3.1 Two point linkage analysisLet us consider two loci and at least one parent is doubly heterozygous for both loci. The gametes inherited from the doubly heterozygous parent are deduced from the genotypes of its progeny and statistical analysis such as chi-square test or likelihood analysis is performed to test whether the alleles at the two loci segregate independently or co-segregate which is an excep-tional case to Mendel’s principle of independent assortment. In some situa-tions when the linkage phase is known, it is possible to directly observe whether a recombination occurred or not between two loci in a given meio-
16
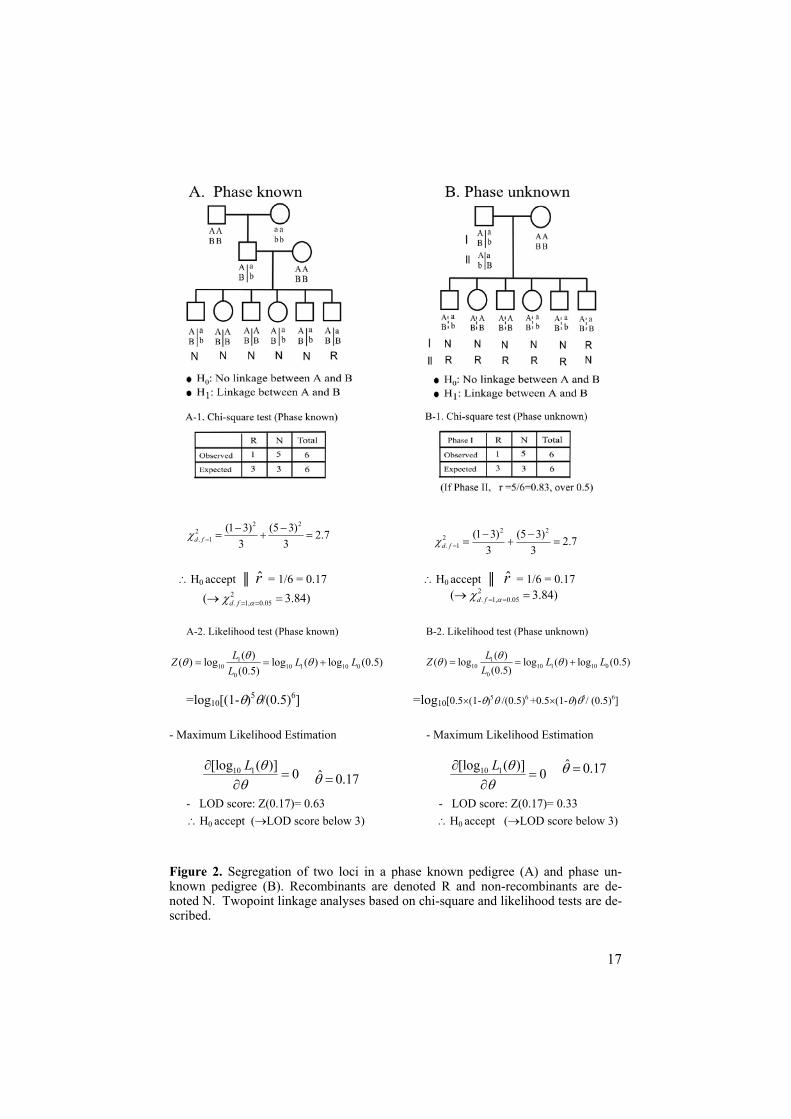
sis, thereby allowing us to directly count recombinants and non-recombinants between two loci in a given meiosis. When we say the phase is known, it means that we can tell which alleles were transmitted from each grandparent (Terwilliger, 1998). Let us consider the pedigree in Figure 2A; in that pedigree, it is obvious that allele a at the first locus and allele b at the second locus in the father were inherited together from the grandmother. If the two loci are on the same chromosome, all A B and a b haplotypes in off-spring are non-recombinants, while the A b and a B gametes are recombi-nants. In this example, there are 5 non-recombinants and 1 recombinant, so a chi-square analysis can be performed to test whether the two loci are trans-mitted together in the pedigree (Figure 2A-1). From the observed number of recombinants, we can also calculate the recombination fraction between the two loci (in this case, r̂ = 0.17). There are also some cases with uncertainty in the parental phase. In this phase-unknown case, all possible phases should be accounted for in the linkage analysis. For instance, if the grand-parental genotypes are unknown, we can not directly decide the linkage phase of the two loci in the father (Figure 2B). In this situation, there are two possible phases for the father; either he could have phase A B/a b or he could have phase A b/a B. Then, there are either 1 recombinant and 5 non-recombinants or 1 non-recombinant and 5 recombinants. If we focus on the recombination fractions from each case, r̂ = 0.17 for the first case whereas, r̂ = 0.83 is the second. Since the true recombination fraction should not exceeded 0.5, the A B/a b linkage phase is the most likely one in this case, although the numbers of progeny are too small to draw a firm conclusion. Linkage analysis can be carried out alternatively using likelihood methods. Linkage analysis based on the likelihood method, like the previous method based on chi-square test, involves the estimation of the recombination fraction, and testing whether an observed estimate is significantly smaller than 50%. The binomial distribu-tion is relevant in this situation. The number of independent recombinants (R) in a fixed number of meiosis (N), is a binomially distributed variable which is dependent on the recombination fraction ( ). Given a value of the recombination fraction, we can construct the likelihood function, L( ), of the observed distribution of recombinants and non-recombinants like the follow-ing,
In general, L( ) changes with the value of . That value of in the range between 0 and 0.5 at which L( ) is at maximum is defined as the Maximum Likelihood (ML) estimate, ˆ , of the recombination fraction. Returning to the issue of testing whether an observed estimate is significantly smaller than
( ) (1 )R N RNL
R
17
H0 accept r̂ = 1/6 = 0.17 H0 accept r̂ = 1/6 = 0.17
A-2. Likelihood test (Phase known) B-2. Likelihood test (Phase unknown)
=log10[(1- )5 /(0.5)6] =log10[0.5 (1- )5 /(0.5)6 +0.5 (1- ) 5/ (0.5)6]
- Maximum Likelihood Estimation - Maximum Likelihood Estimation
- LOD score: Z(0.17)= 0.63 - LOD score: Z(0.17)= 0.33 H0 accept ( LOD score below 3) H0 accept ( LOD score below 3)
Figure 2. Segregation of two loci in a phase known pedigree (A) and phase un-known pedigree (B). Recombinants are denoted R and non-recombinants are de-noted N. Twopoint linkage analyses based on chi-square and likelihood tests are de-scribed.
2. 1, 0.05( 3.84)d f
110 10 1 10 0
0
( )( ) log log ( ) log (0.5)(0.5)
LZ L LL
ˆ 0.17
2. 1, 0.05( 3.84)d f
110 10 1 10 0
0
( )( ) log log ( ) log (0.5)(0.5)
LZ L LL
ˆ 0.1710 1[log ( )] 0L 10 1[log ( )] 0L
2 22. 1
(1 3) (5 3) 2.73 3d f
2 22. 1
(1 3) (5 3) 2.73 3d f
18
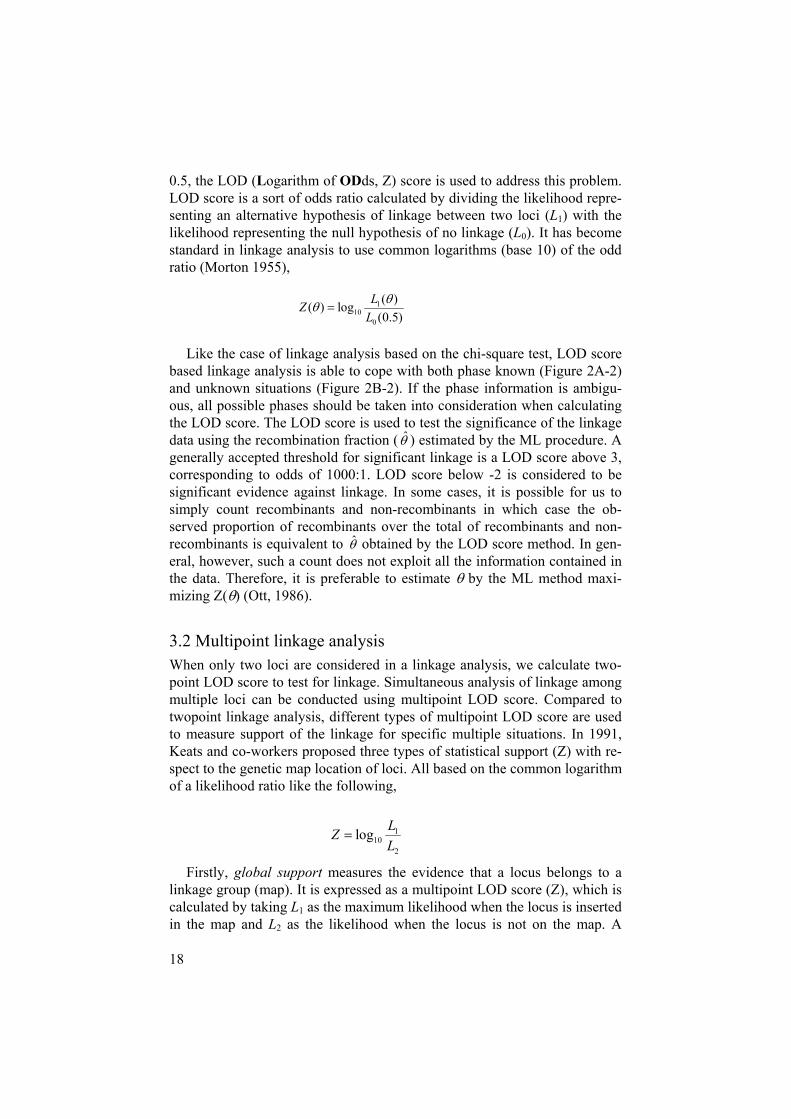
0.5, the LOD (Logarithm of ODds, Z) score is used to address this problem. LOD score is a sort of odds ratio calculated by dividing the likelihood repre-senting an alternative hypothesis of linkage between two loci (L1) with the likelihood representing the null hypothesis of no linkage (L0). It has become standard in linkage analysis to use common logarithms (base 10) of the odd ratio (Morton 1955),
Like the case of linkage analysis based on the chi-square test, LOD score based linkage analysis is able to cope with both phase known (Figure 2A-2) and unknown situations (Figure 2B-2). If the phase information is ambigu-ous, all possible phases should be taken into consideration when calculating the LOD score. The LOD score is used to test the significance of the linkage data using the recombination fraction ( ˆ ) estimated by the ML procedure. A generally accepted threshold for significant linkage is a LOD score above 3, corresponding to odds of 1000:1. LOD score below -2 is considered to be significant evidence against linkage. In some cases, it is possible for us to simply count recombinants and non-recombinants in which case the ob-served proportion of recombinants over the total of recombinants and non-recombinants is equivalent to ˆ obtained by the LOD score method. In gen-eral, however, such a count does not exploit all the information contained in the data. Therefore, it is preferable to estimate by the ML method maxi-mizing Z( ) (Ott, 1986).
3.2 Multipoint linkage analysis When only two loci are considered in a linkage analysis, we calculate two-point LOD score to test for linkage. Simultaneous analysis of linkage among multiple loci can be conducted using multipoint LOD score. Compared to twopoint linkage analysis, different types of multipoint LOD score are used to measure support of the linkage for specific multiple situations. In 1991, Keats and co-workers proposed three types of statistical support (Z) with re-spect to the genetic map location of loci. All based on the common logarithm of a likelihood ratio like the following,
Firstly, global support measures the evidence that a locus belongs to a linkage group (map). It is expressed as a multipoint LOD score (Z), which is calculated by taking L1 as the maximum likelihood when the locus is inserted in the map and L2 as the likelihood when the locus is not on the map. A
110
0
( )( ) log(0.5)
LZL
110
2
log LZL
19
claim for this linkage requires global support of at least 3. Interval support indicates the evidence that a locus is located in a particular interval of the map, where L1 is the maximum likelihood with the locus being in that inter-val and L2 is the likelihood obtained by placing the locus in any other inter-val. If the level of interval support is at least 3, the locus should be regarded as a ‘framework locus’. To express support for a given order, L1 is taken as the maximum likelihood of the best supported order and L2 is the likelihood for the order under consideration. It is recommended that the support should be at least 3 for the ‘framework map (a map composed fully of framework loci)’ versus the map with next best order.
Genetic distances between loci on maps are measured in Morgan (M), the expected number of crossing-over events. A recombination fraction of 0.01 corresponds to a genetic distance of 1 centiMorgan (cM). However, there is no linear relationship between genetic distance and recombination fraction when they are located far apart on a linkage group. Therefore, a map func-tion is used to provide a transformation from recombination rate to the map distance when building a genetic map. Several map functions have been de-veloped to cope with this situation (Sham, 1998). For example, Haldane’s map function is appropriate if we assume that crossing-over events occur without any influences from other cross-over taking place nearby (Haldane, 1919). However, we can also assume the situation that crossing-over events occur non-randomly due to interference derived from another cross-over at a close location. Kosambi map function takes into account the interference (Kosambi, 1944). Both these map functions use cM as the unit of genetic distance transformed from recombination fraction.
3.3 Genetic mapping of trait loci When linkage analysis is carried out to map a gene responsible for a trait of interest, the situation is more complex than that described in the previous sections. For the genetic mapping of trait loci, we need to consider the rela-tionship between genotypes at marker loci and genotypes at trait loci in first hand, and then there is a second relationship of major importance namely the relationship between genotypes at trait loci and observed phenotypes. In this situation, there are two observable variables, the measured phenotypes and the marker genotypes determined by molecular methods and one unobserv-able variable, the genotypes at trait loci. Thus, it is necessary for us to spec-ify the relationship between the two observable variables and the unobserv-able variable to map trait loci. The relationship between marker genotypes and the trait locus genotypes arise due to linkage and one can calculate the conditional probability that the trait locus genotype (Gph) given the observed marker genotype (GM), that is P(Gph|GM). To solve the second relationship between trait-causing genotypes and phenotypes, we need to introduce an additional concept called penetrance. The definition of penetrance is the
20
conditional probability that an individual with a given genotype (Gph) ex-presses the phenotype(Ph) (i.e. P(Ph|Gph); Ott, 1999). Since this penetrance is unknown in most cases, additional analysis (e.g. segregation analysis) is supposed to be done using pedigree data to investigate the penetrance. For example, if the pedigree data is consistent with an autosomal recessive dis-order with diseased allele D and normal allele d, then four conditional prob-abilities of disease given the four possible ordered genotypes, DD, Dd, dD, dd can be calculated. Since the disease is recessive, the penetrance in this case take the all-or-none values, that is (1,0,0,0) for each genotype. Once the two relationships (i.e. P(Gph|GM), P(Ph|Gph)) are specified, the likelihood function for linkage analysis for mapping trait locus can be constructed as follows,
L P(Ph, GM) = P(Ph|GPh)P(GPh|GM)P(GM)
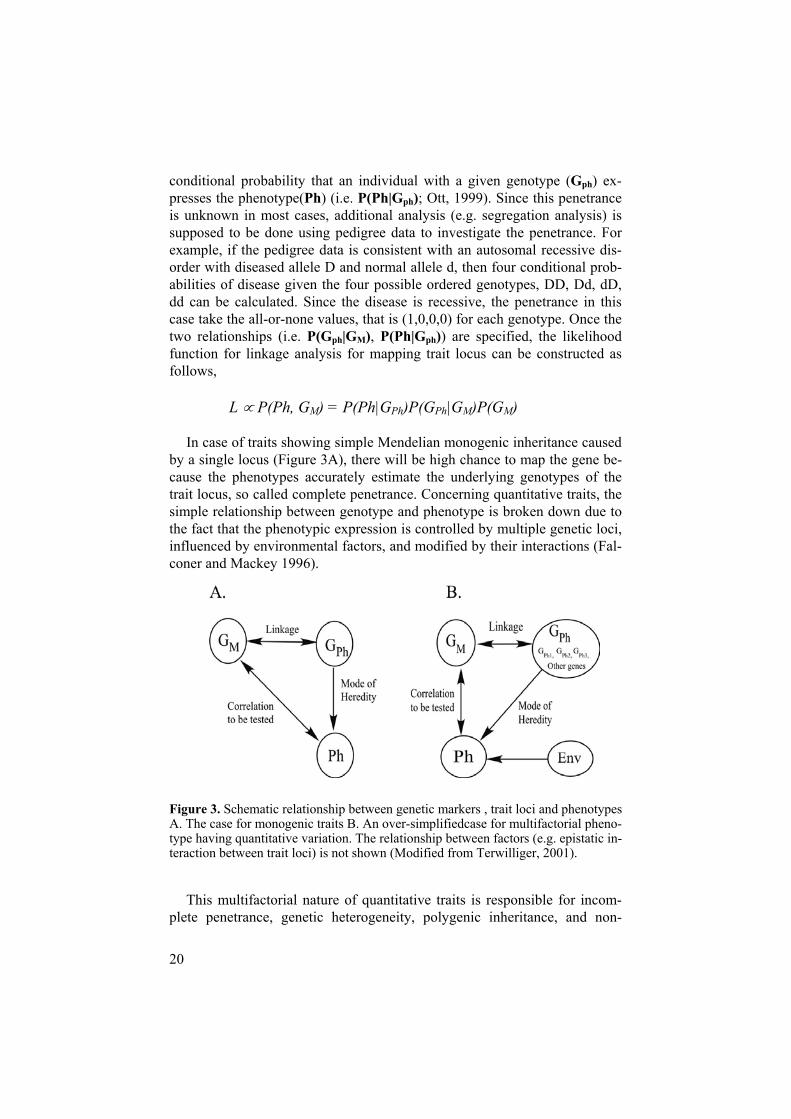
In case of traits showing simple Mendelian monogenic inheritance caused by a single locus (Figure 3A), there will be high chance to map the gene be-cause the phenotypes accurately estimate the underlying genotypes of the trait locus, so called complete penetrance. Concerning quantitative traits, the simple relationship between genotype and phenotype is broken down due to the fact that the phenotypic expression is controlled by multiple genetic loci, influenced by environmental factors, and modified by their interactions (Fal-coner and Mackey 1996).
Figure 3. Schematic relationship between genetic markers , trait loci and phenotypes A. The case for monogenic traits B. An over-simplifiedcase for multifactorial pheno-type having quantitative variation. The relationship between factors (e.g. epistatic in-teraction between trait loci) is not shown (Modified from Terwilliger, 2001).
This multifactorial nature of quantitative traits is responsible for incom-plete penetrance, genetic heterogeneity, polygenic inheritance, and non-
21
genetic phenocopy, which makes mapping quantitative trait loci an extreme challenge in modern genetics (Lander and Schork, 1994). Let us consider the complex relationships around a quantitative phenotype. Figure 3B is an over-simplified model to consider this situation. Genetic heterogeneity from mul-tiple genetic loci (e.g.GPh1, GPh2, GPh3, etc.) and environmental factors (Env) can affect power and the accuracy of quantitative trait linkage analysis. Dif-ferently from the penetrance for all-or-none phenotypes showing Mendelian inheritance, the penetrance function for the quantitative traits can be ob-tained by assuming the residuals in a least-squares model to be normally dis-tributed (Lander and Botstein, 1989; Sillanpää and Corander, 2002). In this framework, it is possible to accommodate polygenic characters with addi-tive, dominance inheritance. Furthermore, this quantitative genetic pene-trance function is fully capable of handling more complex situation such as epistasis, non-Mendelian inheritance, and even genotype by environment in-teraction (Lynch and Walsh, 1998). To model multiple genetic loci and envi-ronmental factors in a linkage analysis one could compute the likelihood as follows,
Once the likelihood function is constructed, we can conduct the quantita-tive trait linkage analysis to correlate GM with Ph in order to map GPh, (i.e. QTLs).
3.4. Linkage analysis of quantitative traits The first step in a genome scanning to map QTLs is the establishment of a resource pedigree. For the detection of QTLs, one of the most powerful de-sign is a F2 intercross between two inbred lines showing different quantita-tive phenotypes. When we use inbred lines, we can easily assume that differ-ent QTL and marker alleles are completely fixed in the two parental popula-tions. However, inbred lines are seldom available for farm animals. So, F2 intercrosses between divergent livestock breeds have been used in QTL analysis since it can often be reasonable to assume that QTLs are fixed for alternative alleles in two parental breeds that have been long selected for dif-ferent purposes (Haley and Andersson, 1997). Experimental designs for de-tecting QTLs in existing outbred populations have also been suggested. For example, the granddaughter design based on half-sib families was developed to map QTLs in cattle using field data (Weller et al., 1990). When the collection of genotypic and phenotypic data is completed, statis-tical analysis can be performed to identify the positions of QTLs that under-lie phenotypic differences between two breeds and estimate their effects. A
( , , ) ( | , ) ( | ) ( ) ( )Ph
M ph Ph M MG
L P Ph G Env P Ph G Env P G G P G P Env
22
number of statistical methods have been reported for QTL analysis using a genome scanning approach (Lynch and Walsh, 1998). Haley and co-workers (1994) developed a method for least squares interval mapping using multiple markers in crosses between divergent outbred populations. Least squares method generates results very similar to those obtain from ML methods but has the advantage of demanding considerably less computation (Haley and Knott, 1992). Marker genotypes are used to estimate probabilities of the breed-origin of each gamete at each position through the genome. These conditional probabilities of QTL genotypes given the genotypes of all mark-ers in the linkage group are calculated to estimate coefficients of additive and dominance components for a putative QTL at each position under the assumption that the QTL was fixed for alternative alleles in each parental breed. Then, regression of phenotypic values on these coefficients is per-formed to calculate F-ratios testing the existence of a QTL at a given posi-tion in the genome. The F-ratios are plotted against map position along the entire genome. The most likely location of QTL in a linkage group corre-sponds to the position with the highest F-ratio. The additive and dominance regression indicator variables for the most significant QTLs detected in the initial scan can be added in genome scans for the composite interval map-ping of QTLs. Inclusion of the previously detected QTLs to the regression model is supposed to decrease the residual error variance and thereby in-creasing the statistical power to detect QTLs with smaller genetic effects (Jansen, 1993; Zeng, 1993).
The large number of tests needed to complete a genome scan causes a risk for false positive detection of QTL (i.e. type I error). Thus, the test statistic used in a genome-wide QTL analysis (e.g. F-ratio, LOD score) should be compared to appropriate threshold values to verify the statistical significance of a QTL. To address the multiple testing issue, Lander and Kruglyak (1995) proposed thresholds for the genome-wide significance for specific situations in QTL analysis. For instance, the threshold for a significant LOD score should be 4.3 for QTL mapping in F2 intercross with 2 degrees of freedom for additive and dominant effects. This is equivalent to point-wise (nominal) p-value 5.2 10-5, which corresponds to a genome-wide false positive rate of 5%. This stringent threshold for genome-wide QTL analysis is derived based on their analytical equations assuming that a “dense” map is employed in the genome-wide QTL analysis. They also presented analytical formula for a genome scan with intermediate map density (Kruglyak and Lander, 1995). An alternative way to set up an appropriate significance level is to estimate empirical significance thresholds by randomization test. Because this proce-dure is empirical, based on observed genotype and phenotype data, it can be applied a wide range of population designs (Churchill and Doerge, 1994; Doerge and Churchill, 1996).
A number of QTLs in farm animals have been revealed using this ap-proach (Andersson et al., 1994; Paterson, 1998). While genome scanning us-
23
ing genetic markers is successful to map QTLs, large numbers of progeny are required to achieve sufficient statistical power to detect typical QTLs (Soller et al., 1976). This means that it is necessary to determine tens of thousands of genotypes with a dense array of genetic markers in a genome-wide scan analysis. Moreover, genome scanning can only resolve the loca-tion of QTL to a 10-30 cM genomic region, which is too large to investigate individual genes relevant to the trait of interest. So, it is necessary to prepare additional resource populations such as advanced intercross lines to provide more precise QTL map locations (Darvasi, 1998).
4. Benefits from using domestic animals in the genetic studies of quantitative traits
4.1 Phenotypic and genotypic diversity A definition of domestic animals is those whose breeding is or can be con-trolled by humans. In the category of domestic animals, we exclude most animals in zoos and many laboratory animals such as various kinds of ro-dents and primates used for experimental researches because they have not truly been brought ‘into the house’ (Cole and Ronning, 1974). By means of selective breeding, several of the major farm animals (pig, sheep, goat and cattle) were domesticated from their wild ancestors 9,000-11,000 years ago, whereas the domestication of the chicken and the horse occurred about 4,500-6,000 years ago (Reed, 1984).
Most domestic animals show a much broader genetic diversity than hu-mans, who seem to have expanded massively from a small and isolated population present approximately 100,000 years ago (Harpending et al., 1998). For examples, molecular phylogenetic studies have shown that both the European and Asian subspecies of the wild boar have contributed to European and Asian breeds of the domestic pig (Giuffra et al., 2000) and the evidence that the domestication of horses occurred in multiple regions around the world was presented based on DNA sequence data derived from both modern and ancient horses (Vilá et al., 2001). Moreover, phenotypic se-lection has resulted in various breeds of domestic animals that are adapted to different environmental conditions and various breeding goals. For instance, approximately 400 horse breeds are distinguished nowadays (Scherf, 1995). In fact, this remarkable phenotypic diversity that is observed within and be-tween breeds in domestic animal species made significant contribution toDarwin’s formalization of his theory on the evolution of species by means of natural selection (Darwin, 1859). A large amount of data concerning pheno-typic changes in farm animals that were subjected to artificial selection pro-vided an excellent model system of his theory.
24
This richness in both phenotypic and genotypic diversity as a result of the adaptation to different environments and human demands make domestic animals unique and important systems for genetic analysis of quantitative traits (Andersson, 2001).
4.2 Long history of analysis of quantitative traits In fact, farmers and breeders have experienced the evolutionary and heredi-tary processes during their selective breeding programs. For instance, Robert Bakewell (1725-1795) developed his careful selection procedure and sys-tems of mating to achieve the genetic improvement for efficient production of highly valued characteristics in farm animals. His efforts led to the devel-opment of new farm animal breeds that could provide high quality products such as the Leicester breed of sheep (Wood and Orel, 2001). In the early 20th
century, the reconciliation of the conflict between Mendelian genetics and biometrics largely done by the work of Fisher (1918), Wright (1921) and Haldane (1932) formulated the basis of the classical quantitative genetic the-ory. Since then, animal breeders have been effective expositors of the theo-ries of quantitative genetics to develop and apply methodologies to improve the efficiency of breeding program. Mixed-model based approaches have been developed to predict breeding values and estimate precise genetic pa-rameters from a large amount of unbalanced data containing phenotypic re-cords together with detailed information about husbandry conditions and pedigree relationship (Henderson, 1984; Lee, 2000). These phenotypes have been systematically recorded from extensive and complex pedigrees as part of ongoing animal breeding programs. With the aid of the sophisticated bio-metrical and computing methods, animal breeding has been tremendously ef-fective in improving the genetic potential for efficiency of livestock produc-tion. As an example, a strain of meat chicken in year 2001 is approximately four times heavier than a strain used 40 years ago (Havenstein et al., 2003). Thus, the long tradition of the “phenome project” (i.e. systematic collection and established analysis of quantitative phenotypic information from extant pedigrees) is one of the most important advantages of using domestic ani-mals in the genetic analysis of quantitative traits (Georges and Andersson, 2004).
4.3 Domestic animal genomic resources Through international efforts, all the basic genomic resources for the domes-tic animal species are now in place. Low-resolution linkage maps comprising hundreds of microsatellite markers, physical maps based on Radiation Hy-brid (RH) panels, large-insert libraries, as well as preliminary transcript maps using ESTs have been developed for all the main farm animals. How-ever, despite these tremendous achievements together with the features dis-
25
cussed in the previous sections, identification of trait loci in farm animals has been hampered by relatively less powerful genome resources compared with human and mouse. Therefore, it is important to generate high quality draft genome sequences for several domestic animals to lift the hurdle that are limiting the positional cloning of a gene causing quantitative variations in farm animals. Efforts are now ongoing so that the high quality draft se-quence of the major farm animals are expected to become available in the near future (Andersson and Georges, 2004).
From this point of view, chicken is of considerable interest because it is the first domestic animal species with a high quality draft genome sequence (i.e. http://genome.ucsc.edu/; http://www.ensembl.org). Positional cloning of QTLs in chicken will also be greatly facilitated by the access to a SNP map comprising approximately 2.8 million loci (International Chicken Polymor-phism Map Consortium, submitted).
26
Objectives of the thesis
The main objective of the thesis was to study the molecular genetic basis un-derlying quantitative traits in domestic animals using candidate gene and ge-nome scanning methodologies.
The work was split into two sub-themes related to the candidate gene and genome scanning approach.
1. Candidate gene analysis To investigate association between genetic polymorphisms of the gene encoding the muscle-specific 3 isoform of AMP-activated protein kinase (PRKAG3) and a muscle disorder, physical perform-ance and muscle development in the horse
To investigate a possible association between a missense mutation in the MC4R gene and fatness using a Large White Wild boar inter-cross
2. Genome scanning To construct a linkage map of the chicken genome for QTL analysis
To perform a genome scan for mapping QTLs affecting the direct response (i.e. growth) to selection for growth in chicken
To conduct genome scans for mapping QTLs underlying correlated responses (i.e. anorexia, body composition, metabolic traits and im-mune response) to selection for growth in chicken
27
Results and Discussion
1. Candidate gene analysis
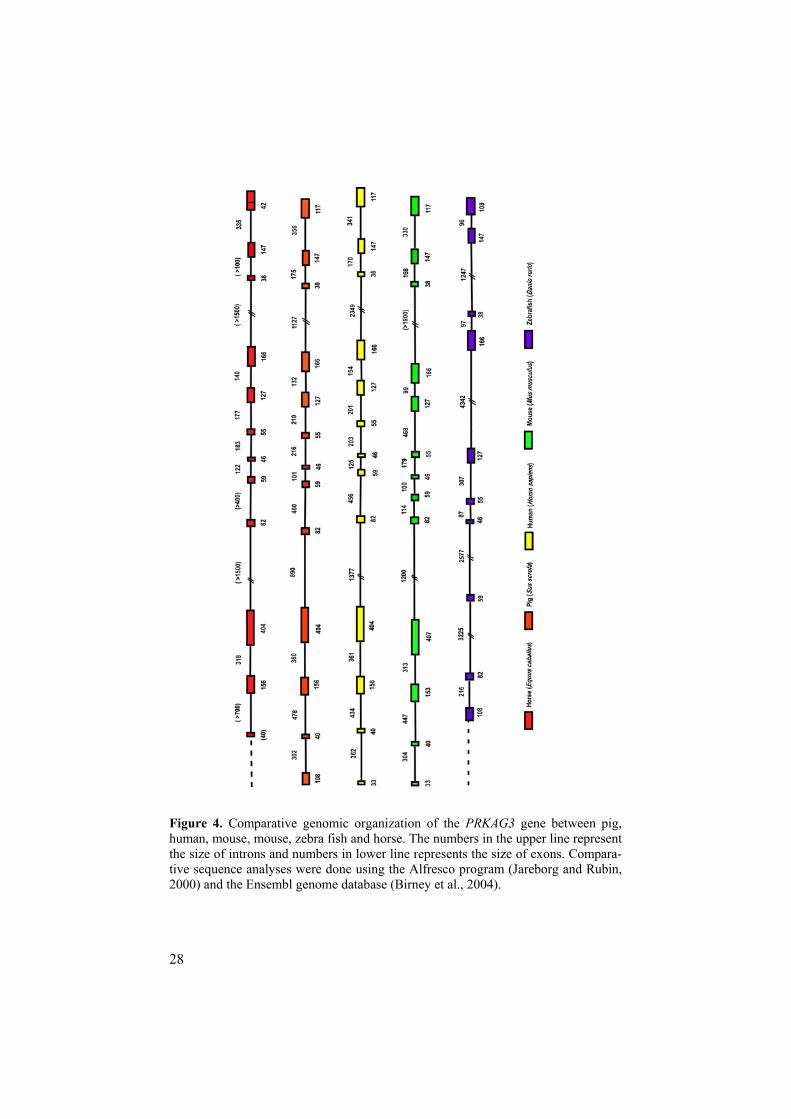
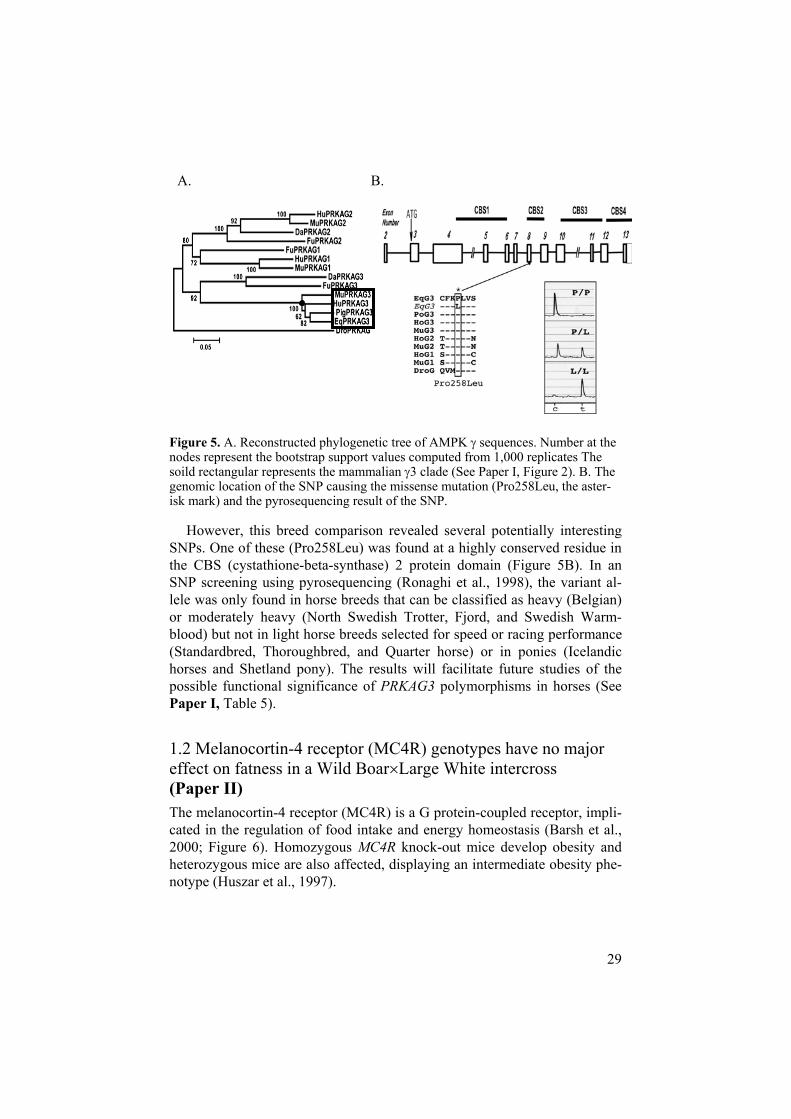
1.1 Molecular characterization and mutational screening of the PRKAG3 gene in the horse (Paper I)The PRKAG3 gene encodes the muscle-specific isoform of the regulatory 3subunit of AMP-activated protein kinase (AMPK), a metabolic stress-sensing protein kinase playing a major role in the regulation of energy ho-meostasis within the eukaryotic cell. A missense mutation (Arg200Gln) in PRKAG3 causes the dominant RN phenotype characterized by excess glyco-gen content in pig skeletal muscle (Milan et al., 2000). To test for a possible association of genetic polymorphisms in the PRKAG3 gene with muscle dis-order, performance traits and muscle development in the horse, a major cod-ing part of the equine PRKAG3 sequence was cloned using cross-species RT-PCR and inter-exon PCR. Bioinformatic analyses were performed to characterize the cloned equine PRKAG3 gene. Comparative sequence analy-sis of horse, pig, mouse, human, fugu, and zebrafish established the exon/intron organization of horse PRKAG3. A multiple alignment including the equine PRKAG3 sequence and AMPK sequences from other species was used to reconstruct a phylogenetic tree to study the orthology among different AMPK isoforms present in vertebrates. The overall genomic or-ganization was remarkably conserved across mammalian and fish species (Figure 4). We concluded that the horse PRKAG3 orthologue has been iden-tified in this study because the cloned sequence clearly fell into the mammal-ian AMPK 3 clade (Figure 5A). Furthermore, the results clearly demon-strated that the three different isoforms (i.e. 1, 2, and 3) were established already in bony fishes (Figure 5A).
Seven SNPs, five causing amino acid substitutions, were revealed in a screening across horse breeds with widely different phenotypes regarding muscle development and physical performance traits. The screening of a ma-jor part of the PRKAG3 coding sequence in a small case/control material of horses affected with polysaccharide storage myopathy did not reveal any mutation that was exclusively associated with this muscle storage disease (See Paper I, Tables 3 and 4).
28
Figure 4. Comparative genomic organization of the PRKAG3 gene between pig, human, mouse, mouse, zebra fish and horse. The numbers in the upper line represent the size of introns and numbers in lower line represents the size of exons. Compara-tive sequence analyses were done using the Alfresco program (Jareborg and Rubin, 2000) and the Ensembl genome database (Birney et al., 2004).
29
A. B.
Figure 5. A. Reconstructed phylogenetic tree of AMPK sequences. Number at the nodes represent the bootstrap support values computed from 1,000 replicates The soild rectangular represents the mammalian 3 clade (See Paper I, Figure 2). B. The genomic location of the SNP causing the missense mutation (Pro258Leu, the aster-isk mark) and the pyrosequencing result of the SNP.
However, this breed comparison revealed several potentially interesting SNPs. One of these (Pro258Leu) was found at a highly conserved residue in the CBS (cystathione-beta-synthase) 2 protein domain (Figure 5B). In an SNP screening using pyrosequencing (Ronaghi et al., 1998), the variant al-lele was only found in horse breeds that can be classified as heavy (Belgian) or moderately heavy (North Swedish Trotter, Fjord, and Swedish Warm-blood) but not in light horse breeds selected for speed or racing performance (Standardbred, Thoroughbred, and Quarter horse) or in ponies (Icelandic horses and Shetland pony). The results will facilitate future studies of the possible functional significance of PRKAG3 polymorphisms in horses (See Paper I, Table 5).
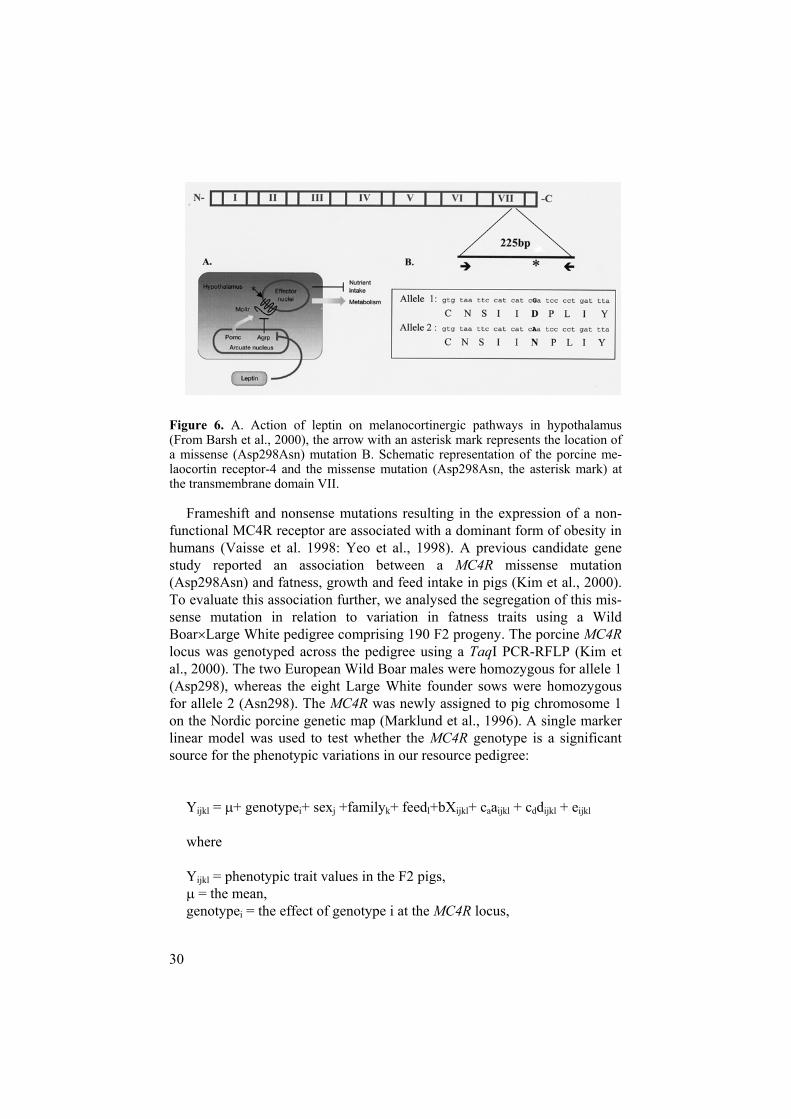
1.2 Melanocortin-4 receptor (MC4R) genotypes have no major effect on fatness in a Wild Boar Large White intercross(Paper II) The melanocortin-4 receptor (MC4R) is a G protein-coupled receptor, impli-cated in the regulation of food intake and energy homeostasis (Barsh et al., 2000; Figure 6). Homozygous MC4R knock-out mice develop obesity and heterozygous mice are also affected, displaying an intermediate obesity phe-notype (Huszar et al., 1997).
30
Figure 6. A. Action of leptin on melanocortinergic pathways in hypothalamus (From Barsh et al., 2000), the arrow with an asterisk mark represents the location of a missense (Asp298Asn) mutation B. Schematic representation of the porcine me-laocortin receptor-4 and the missense mutation (Asp298Asn, the asterisk mark) at the transmembrane domain VII.
Frameshift and nonsense mutations resulting in the expression of a non-functional MC4R receptor are associated with a dominant form of obesity in humans (Vaisse et al. 1998: Yeo et al., 1998). A previous candidate gene study reported an association between a MC4R missense mutation (Asp298Asn) and fatness, growth and feed intake in pigs (Kim et al., 2000). To evaluate this association further, we analysed the segregation of this mis-sense mutation in relation to variation in fatness traits using a Wild Boar Large White pedigree comprising 190 F2 progeny. The porcine MC4Rlocus was genotyped across the pedigree using a TaqI PCR-RFLP (Kim et al., 2000). The two European Wild Boar males were homozygous for allele 1 (Asp298), whereas the eight Large White founder sows were homozygous for allele 2 (Asn298). The MC4R was newly assigned to pig chromosome 1 on the Nordic porcine genetic map (Marklund et al., 1996). A single marker linear model was used to test whether the MC4R genotype is a significant source for the phenotypic variations in our resource pedigree:
Yijkl = + genotypei+ sexj +familyk+ feedl+bXijkl+ caaijkl + cddijkl + eijkl
where
Yijkl = phenotypic trait values in the F2 pigs, = the mean,
genotypei = the effect of genotype i at the MC4R locus,
31
sexj = the effect of sex j, familyk = the effect of family k, feedl = the effect of feed treatment within batch l, b = regression coefficient of weight at slaughtereijkl = random residual.
Furthermore, two regression coefficients for the additive (caaijkl) and dominance (cddijkl) components for individualijkl at the pig chromosome 4 QTL with a major effect on fatness (Andersson et al., 1994) were included as covariates to decrease the residual error variance and thereby increasing the statistical power in this study.
ANalysis Of VAriance (ANOVA) was carried out using the GLM proce-dure of SAS (version 6.12, 1997). Interval mapping as described by Haley et al. (1994) was also applied. Single marker analysis revealed no significant effects of MC4R on the total phenotypic variance of average back-fat thick-ness (p-value=0.42) or abdominal fat content (p-value=0.11). Moreover, the test statistic obtained using interval mapping did not reach the 5% chromo-some-wise significance threshold at the MC4R locus (See Paper II, Figure 1). Thus, the statistical assessments did not reveal any indication of a major effect of the missense mutation on fatness related traits in the Wild Boar Large White intercross. The discrepancy between the two studies may be caused by the following reasons. Firstly, the previously reported associa-tion may be caused by LD with an other major gene rather than the missense mutation itself at the MC4R locus. Secondly, the effect of the Asp298Asn mutation may be too small to be detected given the statistical power in our experiment. Thirdly, a QTL analysis tests for a chromosome substitution ef-fect and two QTLs in the repulsive phase may cancel out each other (Zeng, 1993). Furthermore, the segregation at multiple QTLs, some with major ef-fects, gives a high phenotypic residual variance that reduces the power of de-tecting QTLs with minor effects. We tried to address this problem by the in-clusion of the additive and dominant components of QTL on pig chromo-some 4 with major effect on fatness as covariates in this analysis.
2. Genome scanning
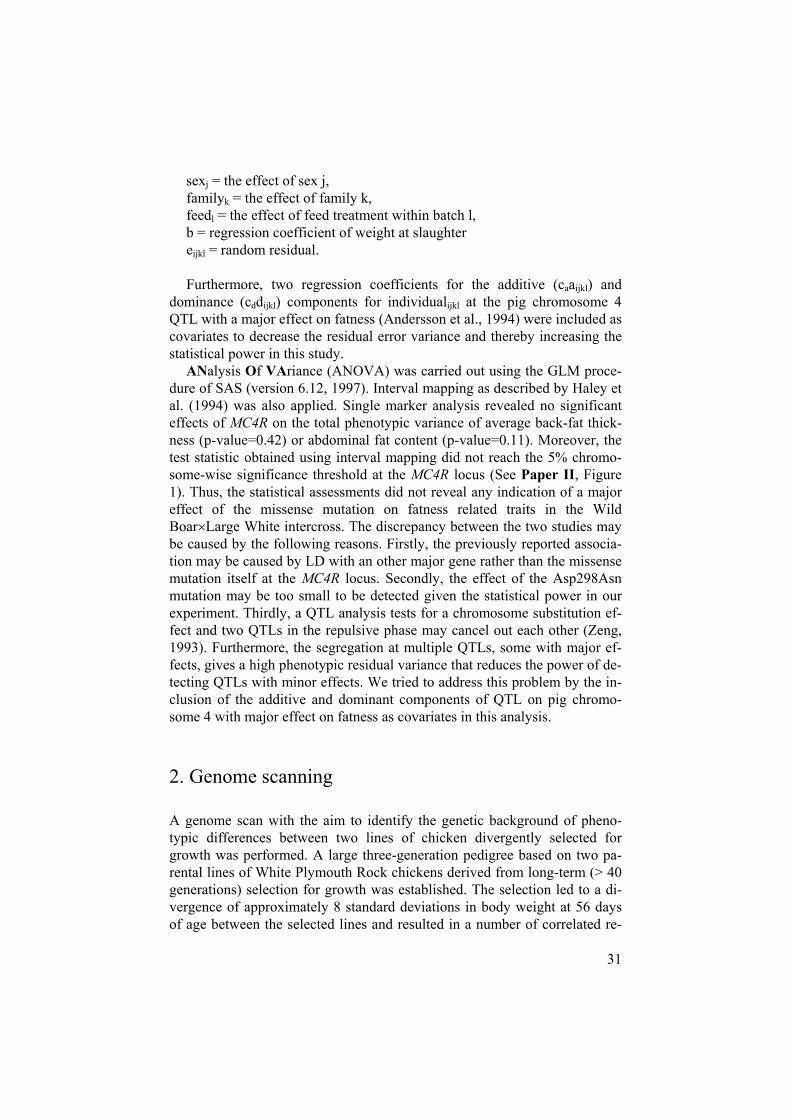
A genome scan with the aim to identify the genetic background of pheno-typic differences between two lines of chicken divergently selected for growth was performed. A large three-generation pedigree based on two pa-rental lines of White Plymouth Rock chickens derived from long-term (> 40 generations) selection for growth was established. The selection led to a di-vergence of approximately 8 standard deviations in body weight at 56 days of age between the selected lines and resulted in a number of correlated re-
32
sponses of traits related to appetite, body composition, metabolic regulation and immune response (Dunnington and Siegel, 1996).
Figure 7. Response to 37 generations of divergent selection for 56-day body weight and the parental lines of White Plymouth Rock chicken (male) at 56 days of age.
A F2 population was generated by reciprocal crossing. Phenotypic meas-urements related to growth, body composition, metabolic regulation and immune response were recorded for more than 800 F2 chickens (see Table 1 in Paper IV and Table 1 in Paper V). Genome scanning using a genetic linkage map comprising 145 microsatellite markers was performed to map QTLs affecting the direct response (i.e. growth) and correlated responses (i.e. anorexia, body composition, metabolic regulation, and immune re-sponse) to the selection for growth in this intercross.
33
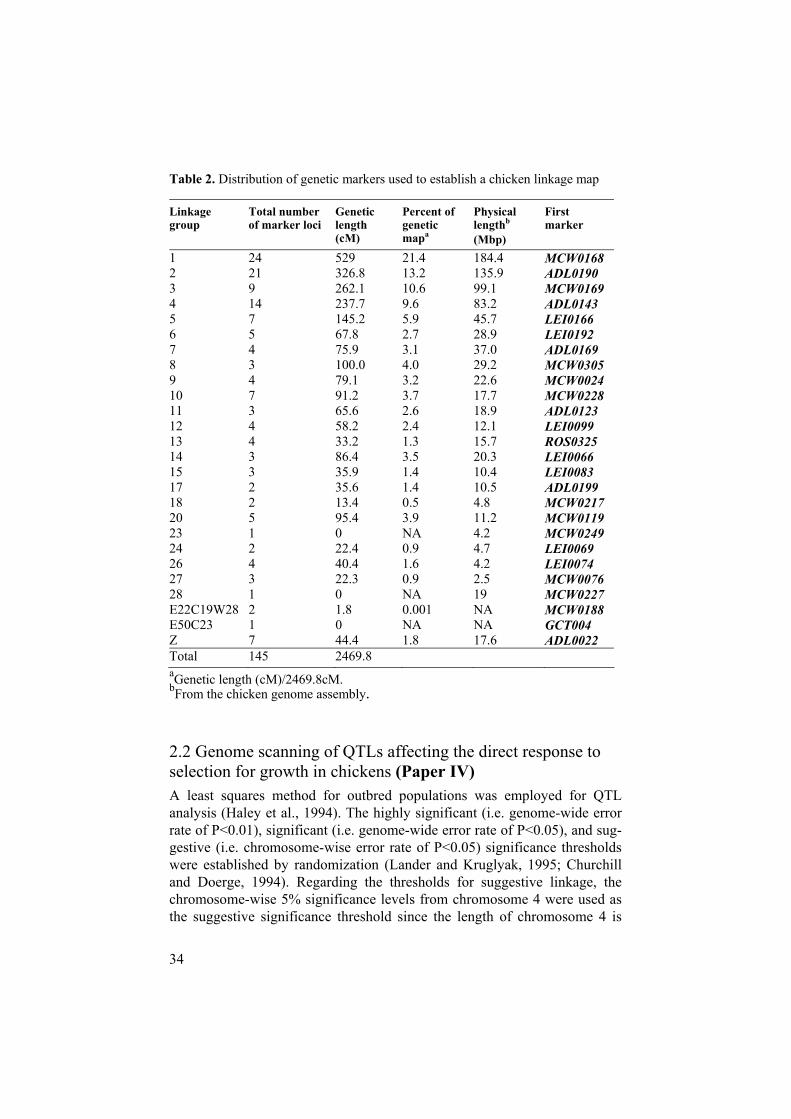
2.1 Multipoint linkage analysis to construct a chicken linkage map (Paper III) The establishment of comprehensive linkage maps provides a fundamental resource for mapping genes underlying monogenic and quantitative traits. Moreover, it provides important anchor points when constructing physical maps such as fingerprinted contigs. In an attempt to construct a linkage map, the genotyping of highly informative DNA markers was carried out. We per-formed genotyping of these DNA polymorphisms in the large three-generation pedigree generated by reciprocally intercrossing two chicken lines. Multipoint linkage analysis using the CRIMAP program (Green et al., 1990) established a 2426.6 cM genetic map comprising 25 linkage groups. The map contains 148 genetic markers including 145 microsatellite markers and 3 SNPs. Average information content was 0.55 on the individual marker basis, which is slightly higher than the level (i.e. 0.5) being considered as in-formative (Knott et al., 1998) and the average spacing between markers was about 17 cM (Table 2).
This analysis enabled us to assign chromosome locations for 14 previ-ously unmapped markers (see in Table 1 in Paper III). Among the 14 mark-ers, ADL0132 was previously mapped to chromosome 9. However, the cur-rent data provided clear statistical evidence that the marker is located on chromosome 4 ( =0.02, two-point LOD score= 152.0 to MCW0091). With this exception, our multi-point linkage result was in excellent agreement with the chicken consensus map. A comparison with the chicken genome as-sembly (http://genome.ucsc.edu, February, 2004) suggested a few minor er-rors in the assembly. A PCR-RFLP test was conducted to localize the melanocortin receptor 3 (MC3R) gene in the linkage map and the pyrose-quencing technique was employed to genotype SNPs in the bone morpho-genic protein 7 (BMP7) and hematopoetic cell kinase (HCK) genes on link-age group E32. Close linkage of MC3R to BMP7 ( =0.06, two-point LOD score= 23.5) and HCK ( =0.15, two-point LOD score= 10.5) was observed.
We also found that MC3R showed significant linkage to the distal end of linkage group E47W24 ( =0.4, two-point LOD score= 5.3 to ADL0125).
This result demonstrated that the two linkage groups E32 and E47W24 are located on the same chromosome and the release of the chicken genome assembly showed that the mentioned loci above (i.e. HCK, BMP7, MC3R and ADL0125) mapped to chromosome 20. A comparison between the link-age data in the current study and the physical location of markers as revealed in the chicken genome sequence assembly (February 2004) also showed a significant three-fold higher recombination rate on micro-chromosomes compared to macro-chromosomes (Figure 1 in Paper III).
34
Table 2. Distribution of genetic markers used to establish a chicken linkage map
Linkagegroup
Total number of marker loci
Genetic length(cM)
Percent of geneticmapa
Physical lengthb
(Mbp)
Firstmarker
1 24 529 21.4 184.4 MCW0168 2 21 326.8 13.2 135.9 ADL0190 3 9 262.1 10.6 99.1 MCW0169 4 14 237.7 9.6 83.2 ADL0143 5 7 145.2 5.9 45.7 LEI0166 6 5 67.8 2.7 28.9 LEI0192 7 4 75.9 3.1 37.0 ADL0169 8 3 100.0 4.0 29.2 MCW0305 9 4 79.1 3.2 22.6 MCW0024 10 7 91.2 3.7 17.7 MCW0228 11 3 65.6 2.6 18.9 ADL0123 12 4 58.2 2.4 12.1 LEI0099 13 4 33.2 1.3 15.7 ROS0325 14 3 86.4 3.5 20.3 LEI0066 15 3 35.9 1.4 10.4 LEI0083 17 2 35.6 1.4 10.5 ADL0199 18 2 13.4 0.5 4.8 MCW0217 20 5 95.4 3.9 11.2 MCW0119 23 1 0 NA 4.2 MCW0249 24 2 22.4 0.9 4.7 LEI0069 26 4 40.4 1.6 4.2 LEI0074 27 3 22.3 0.9 2.5 MCW0076 28 1 0 NA 19 MCW0227 E22C19W28 2 1.8 0.001 NA MCW0188 E50C23 1 0 NA NA GCT004 Z 7 44.4 1.8 17.6 ADL0022 Total 145 2469.8 aGenetic length (cM)/2469.8cM.bFrom the chicken genome assembly.
2.2 Genome scanning of QTLs affecting the direct response to selection for growth in chickens (Paper IV) A least squares method for outbred populations was employed for QTL analysis (Haley et al., 1994). The highly significant (i.e. genome-wide error rate of P<0.01), significant (i.e. genome-wide error rate of P<0.05), and sug-gestive (i.e. chromosome-wise error rate of P<0.05) significance thresholds were established by randomization (Lander and Kruglyak, 1995; Churchill and Doerge, 1994). Regarding the thresholds for suggestive linkage, the chromosome-wise 5% significance levels from chromosome 4 were used as the suggestive significance threshold since the length of chromosome 4 is
35
approximately 5% of the total chicken map length (i.e. about 4000 cM). Given this suggestive threshold, we expected to observe one type I error on average per genome scan.
The QTL mapping revealed 13 loci affecting direct response to selection for growth. Five of them (i.e. Growth1, Growth6, Growth7, Growth9 and Growth12) were significant at the 5% genome wide level. All the identified QTLs showed a co-dominant mode of inheritance, with the exception of Growth11 and 13 showing negative over-dominance implying a reduced growth in the heterozygotes. The allele from the high growth line in all addi-tive cases was associated with higher growth. However, each locus ex-plained only a small portion of the phenotypic variance (1.3 to 3.1%). A multiple regression analysis was performed to estimate their individual effect as well as the joint effect of identified QTLs on 56 day body weight that have been used as the single criterion of the artificial selection experiment. The results indicated that these 11 loci with additive effects explained ~50% of the phenotypic difference between the parental lines and ~13% of the re-sidual variance in the F2 generation (Table 3 in Paper IV). This is in clear contrast to our recent study where we report that the two-fold difference in adult body size between the red jungle fowl and White Leghorn domestic chickens is explained by a small number of QTLs with large effects (Kerje et al., 2003). The current design of reciprocal intercross allowed us to test for the presence of a major QTL for growth on the Z-chromosome because fe-male progeny inherit their Z-chromosome from their father, whereas male progeny inherit one Z from each parent (Hastings and Veerkamp, 1993). A simple one-way ANOVA using F1 reciprocal progeny (i.e. HL, LH) was performed to test the hypothesis about a Z-linked QTL for growth. However, the ANOVA result did not support the existence of sex-linked QTL. The re-sult also supported a large maternal effect on growth, which was consistent with data previously reported by Liu and co-workers in 1993. We could not detect any significant linkage to growth in the QTL analysis of the Z- chro-mosome using the Qxpak program based on the dosage compensation model (Pérez-Enciso and Misztal, 2004), which is a validation of the previous result solely based on phenotypic information from the reciprocal pedigree. How-ever, we can not exclude the possibility of two or multiple sex linked QTLs in the repulsion phase, thereby canceling out each other’s effect.
There is some overlap between QTLs found in this study and previous studies. The location of some major QTLs, Growth 1, Growth9 and Growth 13, overlaps with QTLs for growth in an intercross between layer and broiler line-cross (Sewalem et al., 2002). The chromosomal regions harboring QTLs for growth on GGA1, GGA4 and GGA7 were approximately the same re-gion as QTLs were located in our previous QTL study using a red jungle fowl White Leghorn intercross (Kerje et al., 2003). In addition, a significant effect of a marker located on chromosome 28 in the vicinity of Growth 13 in our study on 56 day body weight was detected in Fayoumi chickens (Deeb
36
and Lamont, 2003). However, these data should be interpreted with caution due to the low resolution in this initial QTL mapping experiments.
There are a few obvious candidate genes such as IGF binding protein 1 and 3 genes (IGFBP 1&3) mapping to the Growth 2 region on chromosome 2. IGF binding protein 2 and 5 genes (IGFBP2&5) are localized in the vicin-ity of Growth 9 on chromosome 7. In addition, the melanocortin-3 receptor (MC3R) maps to the same region as Growth 12.
2.3 Genome scanning of QTLs affecting correlated response to selection for growth in chickens (Paper IV and V) A correlated response denotes the associated change of an unselected trait when artificial selection is conducted for a particular characteristic due to the genetic relationship (e.g. linkage or pleiotropy) among traits (Siegel, 1962). Selection for high and low 56-day body weight resulted in correlated re-sponses in appetite, body composition, metabolic traits, and immune re-sponses in White Plymouth Rock chicken lines (Dunnington and Siegel, 1985; Dunnington and Siegel, 1996). We found that a number of the traits showed significant correlations in a segregating F2 pedigree based on the lines of chickens having been used for the selection experiment. Correlations between 56-day body weight and body composition traits were moderate to high and positive (r = 0.39~0.84) in the F2 population. There was a weak positive correlation between abdominal fat weight and triglyceride (r=0.2) as well as cholesterol (r = 0.1) content in plasma. We found also some weak negative correlations (r = -0.18~-0.1) among metabolic traits However, some traits did not show significant correlation. For instance, no significant corre-lation between glucagons and triglycerides level was found. We also found strong correlations (r= 0.6~0.9) between 70-day body weight (the weight at slaughter) and body composition traits. This parameter was therefore in-cluded as a covariate in the QTL analysis of body composition traits to con-sider the variation in 70-day body weight among the F2 animals (Table 2 in Paper V).
To investigate possible substitution effects (i.e. HLLH-LHHL) of recipro-cal cross on the phenotypic traits for each sex separately, a dummy variable which is assigned a value of 1 for HLLH reciprocal and 2 for the other was employed in a regression analysis. Highly significant substitution effects of reciprocal cross were revealed in both sexes for hatch weight and for several metabolic traits such as glucose, cholesterol, insulin and IGF-I. The HLLH reciprocal (i.e. the one where the maternal grand-dam is derived from the HW line) was associated with higher hatch weight and plasma glucose con-centration compared with the LHHL reciprocal. The reciprocal effect ex-plained 15-30% of the phenotypic variance for body weight at hatch and for some metabolic traits such as glucose and insulin. Given the current F2 re-
37
ciprocal design, the cause of effect may be interpreted as either maternal in-fluence or the effect of mitochondria-linked QTL. Our forthcoming ad-vanced intercross line at the 7th generation will allow us to discern these two possible causes of the observed reciprocal effects on phenotypes since any association between maternal and mitochondrial effects should be reshuffled.
The genome scan identified QTLs affecting correlated responses to the se-lection for growth. Five of them were significant at the 5% genome wide level. The strongest evidence for a QTL affecting shank weight was found to markers on chromosome 1 with a F-value of 30 (equivalent to nominal p-value= 4.1 10-13). Additional significant linkage was detected on chromo-some 27. Breast muscle was also significantly linked to markers on chromo-somes 1 and 3. In addition, significant linkage between markers on chromo-some 27 and plasma glucose concentration was revealed.
Most of the convincing QTLs responsible for body composition and metabolic traits were co-localized with loci that have been mapped for growth on chromosomes 1, 3, and 7 (Figure 2 in Paper V). This may be an indication of either the same QTL influencing more than one trait (i.e. a pleiotropic QTL) or tightly linked multiple QTLs within the intervals sepa-rately affecting each trait. In the region of chromosome 3 between marker brackets MCW0022 and ADL0127, the test statistic curves suggested that correlated responses in the region were attributable to multiple loosely linked loci having effects on different traits. Fine scale map resolution how-ever is necessary to interpret whether the correlated responses are due to pleiotropy or linkage (Nuzhdin et al., 1999).
Compared to QTLs for the direct response to selection explaining only 1.3-3.1% of the residual phenotypic variance for growth or body, most of the significant QTL tests for body composition gave estimates of the explained residual variance higher than this and three were above 9%, whereas most of the suggestive QTLs for metabolic traits explained small portions (1.5-2.4%) of the residual phenotypic variance. The identified QTLs for correlated re-sponses did not show any consistency in mode of inheritance and in the di-rection (i.e. sign) of the effects. For instance, QTLs on chromosome 1 and 3 for shank weight had positive co-dominant effects, while QTL on chromo-some 4 for breast muscle showed negative over-dominance effects. In addi-tion to the three regions underlying correlations among traits, a number of QTL for body composition and metabolic traits were also identified that did not coincide with the growth QTLs. No QTL at all was detected for anorexia and antibody response to sheep red blood cells despite large phenotypic dif-ferences between the founder lines.
The QTL affecting abdominal fat weight on chromosome 7 in our study were approximately the same region as QTLs for the same trait previously reported from a QTL analysis using lines of chicken selected for egg produc-tion (Ikeobi et al., 2002).
38
There were some obvious positional candidate genes. The QTL regions on chromosome 3 and 7 harbor the genes for the insulin-like growth factor 2 receptor (IGF2R) and IGF-binding proteins 2 and 5 (IGFBP2, IGFBP5), re-spectively.The QTL for breast muscle weight maps to a region on chromo-some 4 containing the gene for peroxisome proliferative activated receptor, gamma, coactivator 1 alpha (PGC-1) affecting energy metabolism as well as muscle physiology (Knutti and Kralli, 2001; Zhu et al., 2004; Lin et al., 2002). Finally, the gene encoding neuropeptide Y (NPY) maps in the vicin-ity of the QTL on chromosome 2 influencing serum insulin level.
39
Conclusions
Molecular and bioinformatic characterization of the equine PRKAG3 re-vealed a SNP (Pro258Leu) at a highly conserved residue in CBS2 protein domain. Screening of the SNP using 106 horses indicated a possible asso-ciation between genetic polymorphisms in the PRKAG3 gene with muscle development. However, no detectable association between genetic poly-morphisms in the PRKAG3 gene and a muscle carbohydrate storage dis-order and physical performance was found in our study. Linkage analysis between a genetic variation (Asp298Asn) at the porcine MC4R locus and fatness-related traits using a Wild Boar Large White in-tercross did not provide result to support a previously reported association of the MC4R polymorphism with fatness in pigs. Further evaluations are required to confirm the genetic and functional significance of the SNP. A genetic linkage map covering 2469.8 cM of the chicken genome was constructed using a large intercross between two lines of chickens diver-gently selected for growth. A genome scan revealed 13 QTLs affecting the direct response to selec-tion for growth in chicken. The QTL allele from the high growth line was in all cases associated with higher growth but each locus explained only a small portion of the phenotypic variance (1.3 to 3.3%). Our observation of many QTLs each with small and largely additive effects approaches the classical infinitesimal theory for quantitative traits. The result is a good example where a huge phenotypic difference between individuals occurs in the apparent absence of any locus with large effects on the phenotype. A genome scan for body composition and metabolic traits revealed QTLs affecting the correlated responses to selection for growth in chicken. Some of these QTLs affecting body composition and metabolic traits were co-localized with loci that have been mapped for growth on chromo-somes 1, 3, and 7. Despite large phenotypic differences between the foun-der lines, no QTL at all was detected for anorexia and immune response in this study. Highly significant differences between reciprocal crosses were observed for weight at hatch and plasma concentrations of glucose, insulin, cholesterol and IGF-I. The result is most likely caused by mater-nal effects and/or genetic differences in mitochondrial DNA.
40
Future prospects
An important aim of genetic analysis is to correlate phenotype with genotype to understand genetic basis for phenotypic variation. The application of link-age analysis using DNA markers for positional cloning have shown its po-tential to unravel genes causing Mendelian phenotypes. Combination of linkage analysis with quantitative genetics is an important step to expand our knowledge of molecular basis of phenotypic variation from Mendelian quali-tative traits to quantitative traits because quantitative genetics is capable of handling polygenic inheritance, non-additive genetic effects, non-Mendelian inheritance and other genetic complexities. Moreover, newly developed technologies can be incorporated into the current machinery of quantitative genetics (Lynch and Walsh, 1998). For example, linkage analysis of quanti-tative traits have revealed non-Mendelian QTL (Jeon et al., 1999, Nezer et al., 1999) and epistatic interaction between QTL (Carlborg et al., 2003). Methods for QTL mapping based on variance component analysis have been developed to cope with extended pedigrees in humans (Blangero, 2004). Ex-pression profiles become interesting phenotypes in QTL analysis to decipher the complex network of expression pattern (Jansen and Nap, 2004).
Once we have an idea about a certain chromosomal map location (i.e. QTL) affecting the quantitative characters, the next step will be the im-provement of map resolution sufficiently for the positional cloning of QTL. The increase of marker density, and the specification of penetrance to infer QTL genotype from phenotypes are the two major hurdles to be overcome for the positional cloning of QTL. The availability of SNPs map together with the high-throughput genotypig technologies will contribute to resolve the marker density problem (Pastinen et al., 2000; Hardenbol et al., 2003). The development of experimental designs to breed recombinants de novo us-ing inbred strains and the joint use of both linkage and association informa-tion in outbred population will help us to specify the relationship between QTL genotype and phenotype to achieve high resolution mapping of QTL (Darvasi, 1998; Lake et al., 2000; Göring and Terwilliger, 2000; Nezer et al., 2003). With the aid of current genome projects for various organisms, com-parative genomic sequence analysis of various species will also play major role to characterize positional candidate regions (Birney et al., 2004; Boffelli et al., 2004). Developments of new approaches to cope with the sequence variation in segmental duplications, which is widespread in vertebrate ge-
41
nomes will add more knowledge about relationship between genotype and phenotype (Pielberg et al., 2003; Fredman et al., 2004).
Despite of all these tremendous efforts, attempts to identify the genes re-sponsible for quantitative variation still remains as the great challenge in modern genetics. As a result, only a small number of genes underlying QTL has been identified (Flint and Mott, 2001; Glazier et al., 2002). For example, if genes are tightly linked, it is extremely difficult to pinpoint causative gene responsible for the trait of interest (Steinmetz et al., 2002). To overcome this situation in higher vertebrates, we expect progresses in chromosomal engi-neering technology (Yu and Bradley, 2001) together with embryo cloning technology (Kuroiwa et al., 2004). As we showed in the QTL analysis using an intercross between the lines of chicken divergently selected for growth, statistical power also is an important issue for positional cloning of QTL. With this aspect, QTL experiments with F2 intercross comprising, for in-stance, 10,000 progeny and maintaining similar population size in successive generation for fine mapping of QTL will be an interesting approach to achieve the sufficient statistical power to understand genetic architecture of quantitative traits. However, to set up the appropriate scale of animal hus-bandry facility and the availability of data analysis based on high perform-ance computing will be the critical issues to make such an extraordinary scale of experiment possible.
Once we succeed in the positional cloning of a gene affecting quantitative traits after getting through all the obstacles above, we can have chance to address the question about an extended molecular basis (e.g. RNA and pro-tein level) underlying complex phenotypic variation (Van Laere et al., 2003). On the other hand, the identification of a gene influencing quantitative traits allows us to test various hypotheses concerning evolutionary process such as adaptation and speciation (Orr, 2001; Barton and Keightley, 2002). In addi-tion to these pure scientific issues, the positional cloning of QTL will play an important role in developing new drugs and in improving efficiency of breeding programs (Roses, 2003; Dekkers and Hospital, 2002).
42
Acknowledgments
The studies presented in this thesis were mainly performed at the Depart-ment of Animal Breeding and Genetics, Swedish University of Agricultural Sciences but later completed at the Department of Medical Biochemistry and Microbiology, Uppsala University. The financial supports from Arexis AB, the Swedish Research Council for Environment, Agricultural Sciences, and Spatial Planning, Swedish University of Agricultural Sciences, Uppsala Uni-versity, and the Wallenberg Research Foundation, Consortium North are gratefully acknowledged.
I should like to express my sincere gratitude to:
Leif Andersson, my main supervisor, for his keen and thought-provoking comments on my work, for patience and encouragement, and for all empha-ses on the importance of having my own critical views on data. I have also enjoyed the valuable discussions with my co-supervisors, Stefan Marklund, Robert Fredricksson, and Lena Andersson-Eklund who keep me to explore different problems.
Paul B. Siegel for all the inspiring discussions.
All the members of chicken genomics group: Lina Jacobsson, Susanne Ke-jre, Per Wahlberg, Ulika Gunnarsson, and Carolyn Fitzsimmons.
All other current members of husdjursgenetik at BMC: Anne-Sophie Van Laere, Gerli Pielberg, Frida Berg, Ellen Markljung, Nicolette Hillbertz, Carl-Gustaf Thulin, Meying Fang, Ana Fernandez, Emmanuelle Bourneuf, Gabri-ella Lindegren, Maria Moller, Ulla Gustafson, Gudrun Wieslander, Erik Bongcam-Rudloff and Göran Andersson.
All the former members of husdjursgenetik at BMC: Martin Braunschweig, Örjan Carlborg, Siw Johansson, Anna Törnsten, Valérie Amarger, Elisabetta Giuffra, Anna-Karin Fridolfsson, Siwen Jiang, Göran Hjälm, and Benjamin Van Laere.
Jin-Tae Jeon for introducing me to this exciting opportunity and his kind support during my first period in Uppsala.
43
Hossein Jorjani and Miguel Pérez-Enciso for theoretical and practical guid-ance about quantitative genetics.
People at the Blood group laboratory for nice supports.
People at the IMBIM (Department of Medical Biochemistry and Microbiol-ogy) for the warm welcome and the help to finalize this thesis.
All the Korean friends in Uppsala and Stockholm for being nice and their kindness.
All the professors and doctors at the Department of Animal Science, Korea University for their encouragement and advice concerning my academic life.
Lastly, but not least, I would like to thank my family:
I am deeply grateful to my lovely two sisters and my parents for their end-less love. I also wish to thank my parents-in-law for their unending moral support on my study. Finally, I should like to express the deepest gratitude to my dearest wife, Sojeong Ka. This thesis could hardly have been done with-out her beautiful smile, despite her demanding work both at home and at the Department of Neuroscience, Uppsala University.
Hee-Bok Park, Uppsala
September 2004
44
References
Aitman T.J., Glazier A.M., Wallace C.A., Cooper L.D., Norsworthy P.J., Wahid F.N., Al-Majali K.M., Trembling P.M., Mann C.J., Shoulders C.C., Graf D., St Lezin E., Kurtz T.W., Kren V., Pravenec M., Ibrahimi A., Abumrad N.A., Stan-ton L.W. and Scott J. 1999. Identification of Cd36 (Fat) as an insulin-resistance gene causing defective fatty acid and glucose metabolism in hyper-tensive rats. Nat. Genet. 21: 76-83.
Amarger V., Nguyen M., Van Laere A.S., Braunschweig M., Nezer C., Georges M., Andersson L. 2002. Comparative sequence analysis of the INS-IGF2-H19 gene cluster in pigs. Mamm. Genome 13: 388-398.
Andersson L. 2001.Genetic dissection of phenotypic diversity in farm animals. Nat. Rev. Genet. 2: 130-138.
Andersson L., Georges M. 2004. Domestic-animal genomics: deciphering the genet-ics of complex traits. Nat. Rev. Genet. 5: 202-212.
Andersson L., Haley C.S., Ellegren H., Knott S.A., Johansson M., Andersson K., Andersson-Eklund L., Edfors-Lilja I., Fredholm M., Hansson I., Hakansson J. and Lundstrom K. 1994. Genetic mapping of quantitative trait loci for growth and fatness in pigs. Science 263: 1771-1774.
Avery O.T., MacLeod C.M. and McCarty M. 1944. Studies on the chemical nature of the substance inducing transformation of pneumococcal types. Induction of transformation by a deoxyribonucleic acid fraction isolated from Pneumococ-cus TypeIII. J. Exp. Med. 79: 137-158.
Band M.R., Larson J.H., Rebeiz M., Green C.A., Heyen D.W., Donovan J., Windish R., Steining C., Mahyuddin P., Womack J.E., Lewin H.A. 2000. An ordered comparative map of the cattle and human genomes. Genome Res. 10: 1359-1368.
Barsh G.S., Farooqi I.S., O'Rahilly S. 2000. Genetics of body-weight regulation. Na-ture 404: 644-651.
Barton N.H., Keightley P.D. 2002. Understanding quantitative genetic variation. Nat. Rev. Genet. 3: 11-21.
Birney E., et al. 2004. An overview of Ensembl. Genome Res. 14: 925-928. Blangero J. 2004. Localization and identification of human quantitative trait loci:
king harvest has surely come. Curr. Opin. Genet. Dev. 14: 233-240. Blangero J., Williams-Blangero S., Hixson J.E. 1992. Assessing the effects of can-
didate genes on quantitative traits in primate populations. Am. J. Primat., 27: 119-132.
Boffelli D., Nobrega M.A., Rubin E.M. 2004. Comparative genomics at the verte-brate extremes. Nat. Rev. Genet. 5: 456-465.
Botstein D., White R.L., Skolnick M. Davis R.W.1980. Construction of a genetic linkage map in man using restriction fragment length polymorphisms. Am. J. Hum. Genet.32: 314-331.
45
Bovenhuis H., Van Arendonk J.A.M., Davis G., Elsen J.M., Haley C.S., Hill W.G., Baret P.V., Hetzel D.J.S., Nicholas F.W. 1997. Detection and mapping of quan-titative trait loci in farm animals. Livest. Prod. Sci., 52: 135-144.
Broman K. 1997. Identifying quantitative trait loci in experimental cross. Ph.D. the-sis, Department of Statistics, University of California, Berkeley.
Brookes A.J. 1999. The essence of SNPs. Gene 234: 177-186. Campbell H., Rudan I. 2002. Interpretation of genetic association studies in complex
disease. Pharmacogenomics J. 2: 349-360. Carlborg, Ö., Kerje S., Schutz K., Jacobsson L., Jensen P., Andersson L. 2003. A
global search reveals epistatic interaction between QTL for early growth in the chicken. Genome Res.13: 413-421.
Casas-Carrillo E., Prill-Adams A., Price S.G., Clutter A.C. and Kirkpatrick B.W. 1997. Relationship of growth hormone and insulin-like growth factor-1 geno-types with growth and carcass traits in swine. Anim. Genet. 28: 88-93.
Cheverud J.M., Routman E. 1993. Quantitative trait loci: individual gene effects on quantitative characters. J. Evol. Biol. 6: 463-480.
Churchill G.A., Doerge R.W. 1994. Empirical threshold values for quantitative trait mapping. Genetics 138: 963-971.
Cohen S.N., Chang A.C., Boyer H.W., Helling R.B. 1973. Construction of biologi-cally functional bacterial plasmids in vitro. Proc. Natl. Acad. Sci. USA. 70: 3240-3244.
Cole H.H. and Ronning M. 1974. Animal Agriculture: The Biology of Domestic Animals and Their Use by Man. W.H. Freeman Co., San Francisco.
Crow J.F. 1999. Hardy, Weinberg and Language Impediments. Genetics 152: 821-825.
Darvasi A. 1998. Experimental strategies for the genetic dissection of complex traits in animal models. Nat. Genet. 18: 19-24.
Darwin C. 1859. The Origin of Species by Means of Natural Selection, John Murray, London
Deeb, N. and Lamont, S.J. 2003. Use of a novel outbred by inbred F1 cross to detect genetic markers for growth. Anim. Genet. 34: 205-212.
Dekkers J.C., Hospital F. 2002. The use of molecular genetics in the improvement of agricultural populations. Nat. Rev. Genet. 3: 22-32.
Dodgson J.B., Cheng H.H., Okimoto R. 1997. DNA marker technology: a revolution in animal genetics. Poult. Sci., 76:1108-1114.
Donis-Keller H., Green P., Helms C., Cartinhour S., Weiffenbach B., Stephens K., Keith T.P., Bowden D.W., Smith D.R., Lander E.S., et al. 1987. A genetic link-age map of the human genome. Cell 51:319-337.
Doerge R.W., Churchill G.A. 1996. Permutation tests for multiple loci affecting a quantitative character. Genetics 142:285-294.
Dunnington, E.A., Siegel, P.B. 1985. Long-term selection for 8-week body weight in chickens-direct and correlated responses. Theor. Appl. Genet. 71: 305-313.
Dunnington, E.A., Siegel, P.B. 1996. Long-term divergent selection for eight-week body weight in White Plymouth Rock chickens. Poult. Sci. 75: 1168-1179.
Falconer, D. S., Mackay, T.F.C. 1996. Introduction to Quantitative Genetics, Addi-son Wesley Longman, Harlow.
Fisher R.A. 1918. The correlation between Relatives on the Supposition of Mende-lian Inheritance. R. Soc. Trans. (Edinburgh) 52: 399-433.
Flint J., Mott R. 2001. Finding the molecular basis of quantitative traits: successes and pitfalls. Nat.Rev. Genet. 2: 437-445.
46
Fredman D., White S.J., Potter S., Eichler E.E., Den Dunnen J.T., Brookes A.J. 2004. Complex SNP-related sequence variation in segmental genome duplica-tions. Nat. Genet. 36: 861-866.
Geschwind D.H. 2000. Mice, microarrays, and the genetic diversity of the brain. Proc. Natl. Acad. Sci. USA 97: 10676-10678.
Giuffra E., Kijas J.M., Amarger V., Carlborg Ö., Jeon J.T., Andersson L. 2000. The origin of the domestic pig: independent domestication and subsequent intro-gression. Genetics 154: 1785-1791.
Glazier A. M., Nadeau J. H., Aitman T.J. 2002. Finding genes that underlie complex traits. Science 298: 2345-2349.
Green P., Falls K., Crook S. 1990. Document for CRI-MAP, version 2.4. Washing-ton University School of Medicine, St. Louis, MO.
Grisart B., Coppieters W., Farnir F., Karim L., Ford C., Berzi P., Cambisano N., Mni M., Reid S., Simon P., Spelman R., Georges M., Snell R. 2002. Positional Candidate Cloning of a QTL in Dairy Cattle: Identification of a Missense Mu-tation in the Bovine DGAT1 Gene with Major Effect on Milk Yield and Com-position. Genome Res. 12: 222-231.
Groenen M.A., Crooijmans R.P., Veenendaal A., Cheng H.H., Siwek M. and van der Poel J.J. 1998. A comprehensive microsatellite linkage map of the chicken ge-nome. Genomics 49: 265-274.
Georges M., Andersson L. 2003. Positional identification of structural and regula-tory quantitative trait nucleotides in domestic animal species. Cold Spring Harb. Symp. Quant. Biol. 68: 179-187.
Göring H.H., Terwilliger J.D. 2000. Linkage analysis in the presence of errors IV: joint pseudomarker analysis of linkage and/or linkage disequilibrium on a mix-ture of pedigrees and singletons when the mode of inheritance cannot be accu-rately specified. Am. J. Hum. Genet. 66: 1310-1327.
Haldane J.B.S. 1919. The combination of linkage values and the calculation of dis-tances between loci of linked factors. J. Genet. 8: 299-309.
Haldane J.B.S. 1932. The Causes of Evolution. Longmans, Green. London. Haley C.S., Andersson L. 1997. Linkage mapping of quantitative trait loci in plants
and animals. In: Dear P.H. (Ed.). Genome Mapping-A Practical Approach. Ox-ford University Press. Oxford: 49-71.
Haley C.S., Knott S.A. 1992. A simple regression method for mapping quantitative trait loci in line crosses using flanking markers. Heredity 69: 315-324.
Haley C.S., Knott S.A., Elsen J.M. 1994. Mapping quantitative trait loci in crosses between outbred lines using least squares. Genetics 36: 1195-1207.
Hardenbol P., Baner J., Jain M., Nilsson M., Namsaraev E.A., Karlin-Neumann G.A., Fakhrai-Rad H., Ronaghi M., Willis T.D., Landegren U., Davis R.W. 2003. Multiplexed genotyping with sequence-tagged molecular inversion probes. Nat. Biotechnol. 21: 673-678.
Harpending H.C., Batzer M.A., Gurven M., Jorde L.B., Rogers A.R., Sherry S.T. 1998. Genetic traces of ancient demography. Proc. Natl. Acad. Sci. USA. 95: 1961-1967.
Hastings I.M., Veerkamp R.F. 1993. The genetic basis of response in mouse lines divergently selected for body weight or fat content. I. The relative contribu-tions of autosomal and sex-linked genes. Genet Res. 62: 169-175.
Havenstein G.B., Ferket P.R., Qureshi M.A. 2003. Growth, livability, and feed con-version of 1957 versus 2001 broilers when fed representative 1957 and 2001 broiler diets. Poult. Sci. 82: 1500-1508.
Hearne C.M., Ghosh S., Todd J.A. 1992. Microsatellites for linkage analysis of ge-netic traits. Trends Genet. 8:288-294.
47
Henderson C.R. 1984. Applications of Linear Models in Animal Breeding. Univer-sity of Guelph.
Hershey A.D., Chase M. 1952. Independent functions of viral protein and nucleic acid in growth of bacteriophage. J. Gen. Physiol. 36: 39-56.
Huszar D., Lynch C.A., Fairchild-Huntress V., Dunmore J.H., Fang Q., Berkemeier L.R., Gu W., Kesterson R.A., Boston B.A., Cone R.D., Smith F.J., Campfield L.A., Burn P., Lee F. 1997. Targeted disruption of the melanocortin-4 recep-tor results in obesity in mice. Cell 88:131-141.
Jackson D.A., Symons R.H., Berg P. 1972. Biochemical method for inserting new genetic information into DNA of Simian Virus 40: circular SV40 DNA mole-cules containing lambda phage genes and the galactose operon of Escherichia coli. Proc. Natl. Acad. Sci. USA. 69:2904-2909
International Chicken Polymorphism Map Consortium. 2004. A polymorphism map for chicken with 2.8 million SNPs. submitted
Jansen R.C. 1993. Interval mapping of multiple quantitative trait loci. Genetics 135: 205-211.
Jansen R.C., Nap J.P. 2004. Regulating gene expression: surprises still in store. Trends Genet. 20: 223-225.
Jareborg N., Durbin R. 2000. Alfresco-a workbench for comparative genomic se-quence analysis. Genome Res. 10: 1148-1157.
Jeffreys A.J., Wilson V., Thein S.L. 1985. Hypervariable minisatellite' regions in human DNA. Nature 314: 67-73.
Jeon J.T., Carlborg Ö., Tornsten A., Giuffra E., Amarger V., Chardon P., Anders-son-Eklund L., Andersson K., Hansson I., Lundstrom K., Andersson L. 1999. A paternally expressed QTL affecting skeletal and cardiac muscle mass in pigs maps to the IGF2 locus. Nat. Genet. 21: 157-158.
Keats B.J., Sherman S.L., Morton N.E., Robson E.B., Buetow K.H., Cartwright P.E., Chakravarti A., Francke U., Green P.P., Ott J. 1991. Guidelines for hu-man linkage maps: an international system for human linkage maps (ISLM, 1990). Genomics 9: 557-560.
Kerje S., Carlborg Ö., Jacobsson L., Schutz K., Hartmann C., Jensen P., Andersson L. 2003. The twofold difference in adult size between the red junglefowl and White Leghorn chickens is largely explained by a limited number of QTLs. Anim. Genet. 34: 264-274.
Kim K.S., Larsen N., Short T., Plastow G., Rothschild M.F. 2000. A missense vari-ant of the porcine melanocortin-4 receptor (MC4R) gene is associated with fat-ness, growth, and feed intake traits. Mamm. Genome. 11: 131-135.
Knott S.A., Marklund L., Haley C.S., Andersson K., Davies W., Ellegren H., Fred-holm M., Hansson I., Hoyheim B., Lundstrom K., Moller M., Andersson L. 1998. Multiple marker mapping of quantitative trait loci in a cross between out-bred wild boar and large white pigs. Genetics 149: 1069-1080.
Knutti D., Kralli A. 2001. PGC-1, a versatile coactivator. Trends Endocrinol. Me-tab. 12: 360-365.
Kosambi D.D. 1944. The estimation of map distances from recombination values. Ann. Eugen. 12: 172-175.
Kruglyak L., Lander E.S. 1995. High-resolution genetic mapping of complex traits. Am. J. Hum. Genet. 56: 1212-1223.
Kuroiwa Y., Kasinathan P., Matsushita H., Sathiyaselan J., Sullivan E.J., Kakitani M., Tomizuka K., Ishida I., Robl J.M. 2004. Sequential targeting of the genes encoding immunoglobulin-mu and prion protein in cattle. Nat. Genet. 36: 775-780.
48
Lai C., Lyman R.F., Long A.D., Langley C.H., Mackay T.F. 1994. Naturally occur-ring variation in bristle number and DNA polymorphisms at the scabrous lo-cus of Drosophila melanogaster. Science 266: 1697-1702.
Lake S.L., Blacker D, Laird N.M. 2000. Family-based tests of association in the presence of linkage. Am. J. Hum. Genet. 67: 1515-1525.
Landegren U., Kaiser R., Sanders J., Hood L. 1988. A ligase-mediated gene detec-tion technique. Science 241: 1077-1080.
Lander E.S., Botstein D. 1989. Mapping Mendelian factors underlying quantitative traits using RFLP linkage maps. Genetics 121: 185-199.
Lander E.S, Schork N.J. 1994. Genetic dissection of complex traits. Science. 265: 2037-2048.
Lander E., Kruglyak L. 1995. Genetic dissection of complex traits: guidelines for in-terpreting and reporting linkage results. Nat. Genet. 11:241-247.
Lander E.S. et al. 2001. Initial sequencing and analysis of the human genome. Na-ture 409: 860-921.
Lee C. 2000. Methods and Techniques for Variance Component Estimation in Ani-mal Breeding. Asian-Aus. J. Anim. Sci. 13: 413-422.
Lin J., Wu H., Tarr P.T., Zhang C.Y., Wu Z., Boss O., Michael L.F., Puigserver P., Isotani E., Olson E.N., Lowell B.B., Bassel-Duby R., Spiegelman B.M. 2002. Transcriptional co-activator PGC-1 alpha drives the formation of slow-twitch muscle fibres. Nature 418: 797-801.
Liu G., Dunnington, E.A., Siegel, P.B. 1993. Maternal effects and heterosis for growth in reciprocal cross populations of chickens. J. Anim. Breed. Genet. 110: 423-428.
Lynch, M., Walsh, B. 1998. Genetics and Analysis of Quantitative Traits. Sinauer Associates, Inc., Sunderland, MA.
Mackay T.F., Langley C.H. 1990. Molecular and phenotypic variation in the achaete-scute region of Drosophila melanogaster. Nature 348:64-66.
Marklund L., Moller M., Hoyheim B., Davies W., Fredholm M., Juneja R.K., Mari-ani P., Coppieters W., Ellegren H., Andersson L. 1996. A comprehen-sive link-age map of the pig based on a wild pigxLarge White intercross. Anim. Genet. 27: 255-269.
Maxam A.M., Gilbert W. 1977. A new method for sequencing DNA. Proc. Natl. Acad. Sci. USA. 74: 560-564.
Mendel G. 1865. Experiments in Plant Hybridization (In English version). In: Bate-son W. 1909. Mendel’s Principle of Heredity. Cambridge University Press. London: 335-369.
Milan D., Jeon J.T., Looft C., Amarger V., Robic A., Thelander M., Rogel-Gaillard C., Paul S., Iannuccelli N., Rask L., Ronne H., Lundstrom K., Reinsch N., Gel-lin J., Kalm E., Roy P.L., Chardon P., Andersson L. 2000. A mutation in PRKAG3 associated with excess glycogen content in pig skeletal muscle. Sci-ence 288: 1248-1251.
Morgan T.H. 1934. The relation of genetics to physiology and medicine. In Nobel lectures, Physiology or Medicine 1922-1941. Elservier, Amsterdam: 313-328.
Morton N.E. 1955. Sequential tests for the detection of linkage. Am. J. Hum. Genet. 73: 277-318.
Mullis K., Faloona F., Scharf S., Saiki R., Horn G., Erlich H. 1986. Specific enzy-matic amplification of DNA in vitro: the polymerase chain reaction. Cold Spring Harb. Symp. Quant. Biol. 51: 263-273.
Nezer C., Collette C., Moreau L., Brouwers B., Kim J.J., Giuffra E., Buys N., Andersson L., Georges M. 2003. Haplotype sharing refines the location of an
49
imprinted quantitative trait locus with major effect on muscle mass to a 250-kb chromosome segment containing the porcine IGF2 gene. Genetics 165: 277-285.
Nezer C., Moreau L., Brouwers B., Coppieters W., Detilleux J., Hanset R., Karim L., Kvasz A., Leroy P., Georges M. 1999. An imprinted QTL with major ef-fect on muscle mass and fat deposition maps to the IGF2 locus in pigs. Nat. Genet. 21: 155-156.
Nuzhdin S.V., Dilda C.L., Mackay T.F. 1999. The genetic architecture of selection response: Inferences from fine-scale mapping of bristle number quantitative trait loci in Drosophila melanogaster. Genetics 153: 1317-1331.
O'Brien S.J., Menotti-Raymond M., Murphy W.J., Nash W.G., Wienberg J., Stanyon R.,Copeland N.G., Jenkins N.A., Womack J.E., Marshall Graves J.A. 1999. The promise of comparative genomics in mammals. Science 286: 458-462, 479-481.
Orr H.A. 2001. The genetics of species differences. Trends Ecol. Evol. 16: 343-350. Ott J. 1986. A short guide to linkage analysis. In: Davies K.E. (Ed.) Human Genetic
Diseases, IRL press, Oxford: 19-32. Ott J. 1999. Analysis of Human Genetic Linkage (3rd ed.). Johns Hopkins Univer-
sity Press. Baltimore. Pastinen T., Raitio M., Lindroos K., Tainola P., Peltonen L., Syvänen A.C. 2000. A
system for specific, high-throughput genotyping by allele-specific primer ex-tension on microarrays. Genome Res. 10: 1031-1042.
Paterson A.H. 1998. Molecular Dissection of Complex Traits. New York. CRC press.
Pennacchio L.A., Olivier M., Hubacek J.A., Cohen J.C., Cox D.R., Fruchart J.C., Krauss R.M. and Rubin E.M. 2001. An apolipoprotein influencing triglyc-erides in humans and mice revealed by comparative sequencing. Science 294:169-173.
Pérez-Enciso M., Misztal I. 2004. Qxpak: a versatile mixed model application for genetical genomics and QTL analyses. Bioinformatics, in press.
Pielberg, G., Day, A.E., Plastow. G.S., Andersson, L. 2003. A sensitive method for detecting variation in copy numbers of duplicated genes. Genome Res. 13: 2171-2177.
Provine W.B. 1971. The Origins of Theoretical Population Genetics. University of Chicago Press, Chicago.
Reed C.A. 1984. The beginnings of animal domestication. In: Mason I.L.(Ed.). Evolution of domesticated animals. Longman Group Ltd. New York: 1-6.
Roses A.D. 2003. The genome ear begins. Nat. Genet. 33: 217. Ronaghi M., Uhlen M., Nyren P. 1998. A sequencing method based on real-time py-
rophosphate. Science 281: 363-365. Sanger F., Nicklen S., Coulson A.R. 1977. DNA sequencing with chain-terminating
inhibitors. Proc. Natl. Acad. Sci. USA. 74: 5463-5467. SAS. 1997. SAS/STAT User’s Guid. Version 6.12. SAS Institute, Cary, NC. Sax K. 1923. The association of size differences with seed-coat pattern and pigmen-
tation in Phaseolus vulgaris. Genetics, 8:552-560. Scherf B. 1995. World Watch List for Domestic Animal Diversity. (2nd ed.) The
Food and Agriculture Organization (FAO), Rome. Schrödinger E. 1944. What is Life?, Cambridge University Press, Cambridge. Sewalem A., Morrice D.M., Law A., Windsor D., Haley C.S., Ikeobi C.O., Burt
D.W., Hocking, P.M. 2002. Mapping of quantitative trait loci for body weight at three, six, and nine weeks of age in a broiler layer cross. Poult. Sci. 81: 1775-1781.
Sham P. 1998. Statistics in Human Genetics. Arnold. London. Siegel P.B. 1962. A double selection experiment for body weight and breast angle at
8 weeks of age in chickens. Genetics 47: 1313-1319.
50
Sillanpää M.J., Corander J. 2002. Model choice in gene mapping: what and why. Trends Genet. 18:301-307.
Smith H.O., Wilcox K.W. 1970. A restriction enzyme from Hemophilus influenzae. I. Purification and general properties. J. Mol. Biol. 51:379-391.
Smith L.M., Sanders J.Z., Kaiser R.J., Hughes P., Dodd C., Connell C.R., Heiner C., Kent S.B., Hood L.E. 1986. Fluorescence detection in automated DNA se-quence analysis. Nature 321: 674-679.
Soller M., Brody T. 1976.On the power of Experimental designs for the detection of linkage between marker loci and quantitative trait loci in cross between in-bred Lines. Theor. Appl. Genet. 47: 35-39.
Southern E.M. 1975. Detection of specific sequences among DNA fragments sepa-rated by gel. electrophoresis. J. Mol. Biol. 98: 503-517.
Steinmetz L.M., Sinha H., Richards D.R., Spiegelman J.I., Oefner P.J., McCusker J.H., Davis R.W. 2002. Dissecting the architecture of a quantitative trait lo-cus in yeast. Nature 416: 326-330.
Sutton W.S. 1903. The chromosome in heredity. Biol. Bull 4: 231-251. Syvänen A.C. 2001. Accessing genetic variation: genotyping single nucleotide
polymorphisms. Nat. Rev. Genet. 2: 930-942. Terwilliger J.D. 1998. Linkage analysis, Model-Based. In: Armitage P., Colton T.
(Eds.) Encyclopaedia of Bio-statistics. John Wiley & Sons, Chichester: 2279-2291.
Terwilliger J.D. 2001. On the resolution and feasibility of genome scanning ap-proaches. Adv. Genet. 42: 351-391.
Vadasz C. 2000. Analysis of Complex traits: mutagenesis versus QTLs. Nat. Genet. 26: 395.
Vaisse C., Clement K., Guy-Grand B., Froguel P. 1998. A frameshift mutation in human MC4R is associated with a dominant form of obesity. Nat. Genet. 20:113-114.
Van Laere A.S., Nguyen M., Braunschweig M., Nezer C., Collette C., Moreau L., Archibald A.L., Haley C.S., Buys N., Tally M., Andersson G., Georges M., Andersson L. 2003. A regulatory mutation in IGF2 causes a major QTL ef-fect on muscle growth in the pig. Nature 425: 832-836.
Venter J.C. et al. 2001. The sequence of the human genome. Science 291: 1304-1351.
Vilá C., Leonard J.A., Gotherstrom A., Marklund S., Sandberg K., Liden K., Wayne R.K., Ellegren H. 2001. Widespread origins of domestic horse lineages. Sci-ence 291: 474-477.
Vos P., Hogers R., Bleeker M., Reijans M., van de Lee T., Hornes M., Frijters A., Pot J., Peleman J., Kuiper M., et al. 1995. AFLP: a new technique for DNA fin-gerprinting. Nucleic. Acids. Res. 23: 4407-4414.
Walsh B. 2001. Quantitative Genetics in the Age of Genomics. Theor. Popul. Biol. 59: 175-184.
Watson J.D., Crick F.H.C. 1953. A structure of deoxyribose nucleic acid. Nature 171: 737-738.
Wayne M.L., McIntyre L.M. 2002. Combining mapping and arraying: An approach to candidate gene identification. Proc. Natl. Acad. Sci. USA 99: 14903-14906.
Weber J.L., May P.E. 1989. Abundant class of human DNA polymorphisms which can be typed using the polymerase chain reaction. Am. J. Hum. Genet. 44: 388-396.
Weller J.I., Kashi Y., Soller M.1990. Power of daughter and granddaughter designs for determining linkage between marker loci and quantitative trait loci in dairy cattle. J. Dairy. Sci. 73: 2525-2537.
51
Womack J.E. and Kata S.R. 1995. Bovine genome mapping: evolutionary inference and the power of comparative genomics. Curr. Opin. Genet. Dev. 5: 725-733.
Wood R.J.,Orel V. 2001. Genetic prehistory in sheep breeding: a prelude to Mendel. Oxford University Press. Oxford.
Wright S. 1921. Systems of mating. Genetics 6: 111-178. Yeo G.S., Farooqi I.S., Aminian S., Halsall D.J., Stanhope R.G., O'Rahilly S. 1998.
A frameshift mutation in MC4R associated with dominantly inherited human obesity. Nat Genet. 20: 111-112.
Yu Y., Bradley A. 2001. Engineering chromosomal rearrangements in mice. Nat. Rev. Genet. 2: 780-790.
Zeng Z.B. 1993. Theoretical basis for separation of multiple linked gene effects in mapping quantitative trait loci. Proc. Natl. Acad. Sci. USA. 90: 10972-10976.
Zeng Z.B. 2000. Unpublished notes on statistical methods for mapping quantitative trait loci. Department of Statistics, North Carolina State University, Raleigh, NC.
Zhu M., de Cabo R., Lane M.A., Ingram D.K. 2004. Caloric restriction modulates early events in insulin signaling in liver and skeletal muscle of rat. Ann. N. Y. Acad. Sci. 1019: 448-452.
Acta Universitatis UpsaliensisComprehensive Summaries of Uppsala Dissertations
from the Faculty of MedicineEditor: The Dean of the Faculty of Medicine
Distribution:Uppsala University Library
Box 510, SE-751 20 Uppsala, Swedenwww.uu.se, [email protected]
ISSN 0282-7476ISBN 91-554-6056-9
A doctoral dissertation from the Faculty of Medicine, Uppsala University,is usually a summary of a number of papers. A few copies of the completedissertation are kept at major Swedish research libraries, while the sum-mary alone is distributed internationally through the series Comprehen-sive Summaries of Uppsala Dissertations from the Faculty of Medicine.(Prior to October, 1985, the series was published under the title “Abstracts ofUppsala Dissertations from the Faculty of Medicine”.)
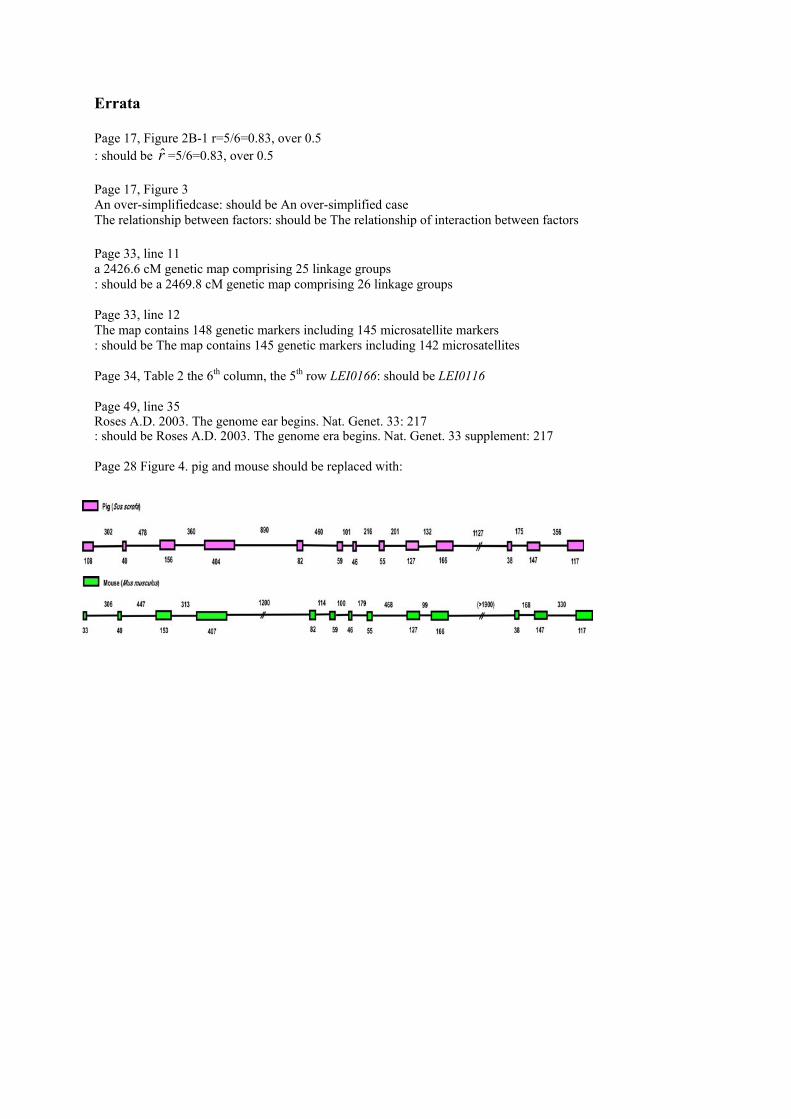
Errata Page 17, Figure 2B-1 r=5/6=0.83, over 0.5 : should be r̂ =5/6=0.83, over 0.5 Page 17, Figure 3 An over-simplifiedcase: should be An over-simplified case The relationship between factors: should be The relationship of interaction between factors Page 33, line 11 a 2426.6 cM genetic map comprising 25 linkage groups : should be a 2469.8 cM genetic map comprising 26 linkage groups Page 33, line 12 The map contains 148 genetic markers including 145 microsatellite markers : should be The map contains 145 genetic markers including 142 microsatellites Page 34, Table 2 the 6th column, the 5th row LEI0166: should be LEI0116 Page 49, line 35 Roses A.D. 2003. The genome ear begins. Nat. Genet. 33: 217 : should be Roses A.D. 2003. The genome era begins. Nat. Genet. 33 supplement: 217 Page 28 Figure 4. pig and mouse should be replaced with: