Embed Size (px)
Citation preview

Intro GxEcon Empirics Structural
Genetic and Economic Interaction in theFormation of Health: The Case of Obesity
Pietro Biroli
University of Zurich
IGSS, October 23, 2015
Pietro Biroli1

Intro GxEcon Empirics Structural Research question
Genes, Biology, and Choices
What:How genetic differences influence health investments and life-cycleevolution of health
via changes in production functionvia changes in preferences
How:Integrate genes into a standard economic model of health
Genes = measures of heterogeneity in parameters
Why:Inequality at birth and impact over the lifeDifferential response to prices, taxes, policies
Pietro Biroli2

Intro GxEcon Empirics Structural
Simple Model
maxE,F
U (B,F , `, c; g)
s.tΩ = `+ E (1)Y = pF F + c (2)B = I(F , E; g) + (1− δ)B′ + ε (3)
Utility from BMI B, consumption c, food consumption F , and leisure `Income Y is devoted to buying food F and non-food consumption ctime Ω devoted to exercise E vs leisure `
Genotype g influences:
Cost of investment [disutility: U(.;g)]Productivity of investment [I(.; g)]
Pietro Biroli3

Intro GxEcon Empirics Structural
The Model: Genetic-Economic Interaction(a) Shift the production function
(b) Change the utility cost of investment
Investment 1: Calories
Bo
dy
Mas
s In
dex
BMI
BMI Isoquant T-Allele
(a) Productivity Effect
Pietro Biroli4

Intro GxEcon Empirics Structural
The Model: Genetic-Economic Interaction(a) Shift the production function
(b) Change the utility cost of investment
Investment 1: Calories
BMI
BMI Isoquant T-Allele
BMI Isoquant A-Risky
(a) Productivity Effect
Bo
dy
Mas
s In
dex
Pietro Biroli5

Intro GxEcon Empirics Structural
The Model: Genetic-Economic Interaction(a) Shift the production function(b) Change the utility cost of investment
Investment 1: Calories
BMI
BMI Isoquant T-Allele
BMI Isoquant A-Risky
(a) Productivity Effect Calories
Sed
enta
ry M
inu
tes
BMI
Indifference Set T-Allele
BMI Isoquant T-Allele
(b) Cost Effect
Bo
dy
Mas
s In
dex
Pietro Biroli6

Intro GxEcon Empirics Structural
The Model: Genetic-Economic Interaction(a) Shift the production function(b) Change the utility cost of investment
Investment 1: Calories
BMI
BMI Isoquant T-Allele
BMI Isoquant A-Risky
(a) Productivity Effect Calories
Sed
enta
ry M
inu
tes
BMI
Indifference Set T-Allele
Indifference Set A-Risky
BMI Isoquant T-Allele
BMI Isoquant A-Risky
(b) Cost Effect
Bo
dy
Mas
s In
dex
Pietro Biroli7

Intro GxEcon Empirics Structural
The gene variant rs9939609Gene: FTO intron, long-range connection with IRX [Smemo et al., 2014]Risky A-allele connected to obesity by GWAS
How?: Regulates appetiteAppetite-stimulant hormone (ghrelin)Neural responsiveness to food imagesExpressed in the hunger-related sites of the brain
⇒ could increase the utility cost of dieting[Karra et al., 2013, Speakman et al., 2008, Fawcett and Barroso, 2010,Wardle et al., 2008, Cecil et al., 2008, Olszewski et al., 2009, Fredriksson et al., 2008,Timpson et al., 2008, Smemo et al., 2014] pics
More exercise associated with lower genetic differences in BMIWeight-loss in dieting programs associated with FTO
⇒ could change the productivity of investments[Andreasen et al., 2008, Franks et al., 2008, Kilpelainen et al., 2011,Huang et al., 2014, Zhang et al., 2012]Pietro Biroli
8

Intro GxEcon Empirics Structural ALSPAC Data Results
ALSPAC Data
Avon Longitudinal Study of Parents and Children (ALSPAC)Cohort of children born in 1991-1992 near Bristol (UK)Data from clinic visitsEnrolled ≈ 14,000 pregnant mothers, ≈ 8,000 children with geneticdata
Obesity: Body Mass Index (BMI), ages 1 to 18Investments: ages 11 and 13
- Child Physical Activity: uni-axial accelerometerMTI Actigraph; see [Mattocks et al., 2008]
- Child Diet: 3-day dietary diaryNutrients with reporting adjustment, see [Noel et al., 2010]
- Genetic data collected at age 7
Pietro Biroli9

Intro GxEcon Empirics Structural ALSPAC Data Results
The Children of the 90s
Pietro Biroli10
Intro GxEcon Empirics Structural ALSPAC Data Results
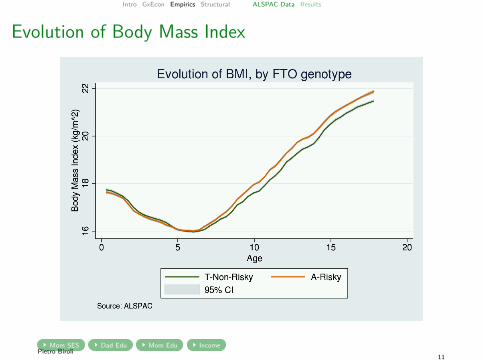
Evolution of Body Mass Index
Mom SES Dad Edu Mom Edu IncomePietro Biroli
11

Intro GxEcon Empirics Structural ALSPAC Data Results
Evolution of Body Mass Index
Mom SES Dad Edu Mom Edu IncomePietro Biroli
12

Intro GxEcon Empirics Structural ALSPAC Data Results
Evolution of Body Mass Index
Mom SES Dad Edu Mom Edu IncomePietro Biroli
13

Intro GxEcon Empirics Structural ALSPAC Data Results
Gene×Calories Interaction
Figure: Nonparametric local-mean smoothing using Epanechnikov kernel and Silverman’s Rule-of-Thumb bandwidth. Combininginformation from successive clinical visits, age 11 and 13; excluding outliers in the top and bottom 5% of the distributions of BMI andlog(energy intake).
Male FemalePietro Biroli14

Intro GxEcon Empirics Structural ALSPAC Data Results
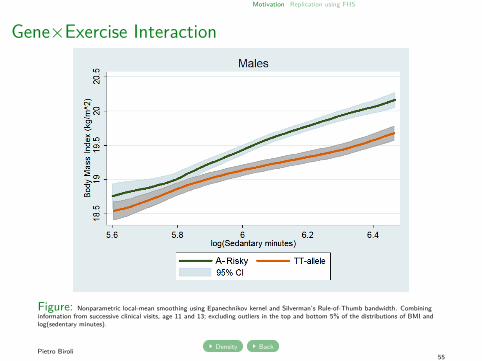
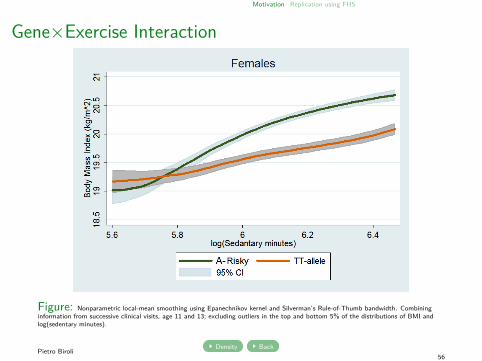
Gene×Exercise Interaction
Figure: Nonparametric local-mean smoothing using Epanechnikov kernel and Silverman’s Rule-of-Thumb bandwidth. Combininginformation from successive clinical visits, age 11 and 13; excluding outliers in the top and bottom 5% of the distributions of BMI andlog(sedentary minutes).
Male FemalePietro Biroli15

Intro GxEcon Empirics Structural ALSPAC Data Results
Genetic Productivity Effect
Log-linearize a Cobb Douglas production function for obesity
log(Bi,t) =µ+ µg g + αe log(Ei,t) + αf log(Fi,t)++ αg×e log(Ei,t) · g + αg×f log(Fi,t) · g++ δlog(Bi,t−1)+ γb log(Bmom
i ) + h(Xi,t) + κt + εi,t
Level effect: µg = ∂f∂g
Productivity effect: αGxK = ∂f∂investment
∣∣∣g=A− ∂f
investment
∣∣∣g=T
Xi covariates: mom and dad education and SES; mother age at pregnancy;parity; birth weight; age of child at clinic date; dummy for single mother; timedummy; seasonal dummies; month effects; low kilo-calories reporting; laterespondent;
Pietro Biroli16

Intro GxEcon Empirics Structural ALSPAC Data Results
Reduced FormTable: Gene and Investment Interaction - FTO
log(Body Mass Indext )(1) (2) (3) (4) (5)
Risky FTO Gene βg 0.019 0.006 0.010 0.010 0.010[0.005]*** [0.002]*** [0.002]*** [0.003]*** [0.003]***
log(Food Intake) αf 0.067 0.059 0.069[0.009]*** [0.010]*** [0.009]***
G X Food Intake αg×f 0.025 0.027 0.026[0.011]** [0.011]** [0.011]**
log(Sedentary min.) αe 0.027 0.028 0.024[0.009]*** [0.011]*** [0.009]***
G X Sedentary min. αg×e 0.011 0.010 0.012[0.011] [0.011] [0.011]
log(BMI)t−1 (1− δ) 0.969 0.939 0.947 0.967[0.007]*** [0.008]*** [0.013]*** [0.008]***
log(BMI)mom γb 0.090 0.090 0.097[0.007]*** [0.007]*** [0.012]***
Covariates X X XMom Gene XR2 0.32% 78% 78% 78% 78%Observations 7052 7052 7052 7052 7052n 3526 3526 3526 3526 3526
Dependent variable: log BMI (kg/m2); Risky FTO gene g = 1 if rs9939609 gene variant contains one or more A-Alleles; g = 0otherwise; Covariates: gender; parity; age of child at clinic date; mom and dad education and SES; mother age at pregnancy; dummy forsingle mother; reliable dietary report; time dummy; seasonal dummies; late respondent; birth weight. * significant at 10%; ** significantat 5%; *** significant at 1%. Standard error clustered at the individual level in brackets.
Sizable effect: ≈ 1/4 kgPietro Biroli17

Intro GxEcon Empirics Structural ALSPAC Data Results
Utility CostSecond genetic effect: change in the demand for investmentsA-Allele
Higher food intakeNo differences in activity
Table: Utility Cost Effect
Calories Sedentary ActivityMale Female Male Female(1) (2) (3) (4)
Risky FTO 0.020 0.018 0.006 0.005Gene [0.009]** [0.008]** [0.007] [0.006]
Covariates X X X XObservations 3,347 3,711 3,347 3,711
Dependent variables: log of daily kilocalories intake (columns (1) and (2)), and log of daily sedentary minutes (columns (3) and (4)).Covariates: log(BMI)t−1 ; log mom BMI during pregnancy; parity; age of child at clinic date; mom and dad education and SES; motherage at pregnancy; dummy for single mother; reliable dietary report; time dummy; month dummies; late respondent; birth weight. *significant at 10%; ** significant at 5%; *** significant at 1%. Standard error clustered at the individual level in brackets.
Sizable effect: ≈ 1.5 kg/yearPietro Biroli
18

Intro GxEcon Empirics Structural ALSPAC Data Results
Robustness
Check the robustness of the results:→ Polygenic Score→ Dropping underweight children (≈ 4%) Gender+NoUnder
→ Different measures of fat-mass Fat Mass
→ Different measures of investments Food
→ Different quantiles Quantiles
→ Different dataset: FHS FHS
Pietro Biroli19

Intro GxEcon Empirics Structural ALSPAC Data Results
Polygenic Approach
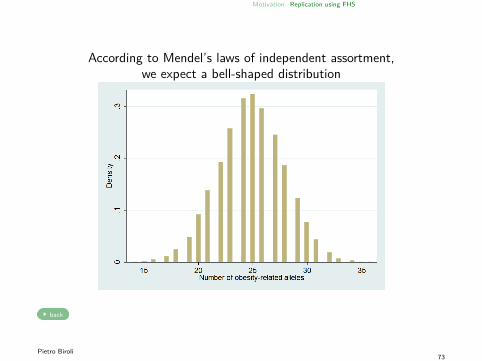
Construct a PGS by adding up the number of obesity-related allelesof 24 different genes, following [Belsky et al., 2013] MC4R TMEM18 FTO
TFAP2B BCDIN3D ETV5 BDNF GNPDA2 PPARG THADA IGF2BP2 TCF7L2 NPC1 MTCH2 PCSK1 KCTD15 SH2B1 NRXN3
HHEX LYPLAL1 GCK NEGR1 PTER GCKR dist
UnweightedSplit the sample into higher and lower than median PGS
Pietro Biroli20

Intro GxEcon Empirics Structural ALSPAC Data Results
Polygenic Approach
Table: Gene and Investment Interaction - Genetic Score(1) (2) (3) (4)
Risky Genetic βg 0.034 0.009 0.012 0.012Score [0.005]*** [0.002]*** [0.002]*** [0.002]***log(Energy Intake) αf 0.065 0.066
[0.008]*** [0.008]***G X Energy Intake αg×f 0.025 0.026
[0.011]** [0.011]**log(Sedentary min.) αe 0.019 0.014
[0.008]** [0.008]*G X Sedentary min. αg×e 0.000 -0.003
[0.011] [0.011]log(BMI)t−1 (1− δ) 0.967 0.938 0.965
[0.007]*** [0.008]*** [0.008]***log(BMI)mom γb 0.089 0.090
[0.007]*** [0.007]***Covariates X XR2 1.05% 78% 78% 78%Observations 7052 7052 7052 7052
* significant at 10%; ** significant at 5%; *** significant at 1%. Standard error clustered at the individual level in brackets. Dependentvariable: log BMI (kg/m2); Risky genetic score g = 1 if genetic score > 25; g = 0 otherwise; Covariates: gender; parity; age of child atclinic date; mom and dad education and SES; mother age at pregnancy; dummy for single mother; reliable dietary report; time dummy;seasonal dummies; late respondent; birth weight.
Pietro Biroli21

Intro GxEcon Empirics Structural ALSPAC Data Results
Utility Cost Effect
Effect of the genetic score on the investments:Varies by genderDifferences also in activity levels
Table: Genetic Effect on Investments - Genetic ScoreCaloric Consumption Sedentary MinutesMale Female Male Female(1) (2) (3) (4)
Risky Genetic 0.011 0.014 0.001 0.022Score [0.009] [0.008]* [0.007] [0.006]***
Covariates X X X XObservations 3,347 3,371 3,347 3,371
* significant at 10%; ** significant at 5%; *** significant at 1%. Standard error clustered at the individual level in brackets. Dependentvariables: logarithm of daily kilocalories intake (columns (1) and (2)), and logarithm of daily sedentary minutes (columns (3) and (4)).Covariates: log(sedentary min.) in columns (1) and (2), and log(kilocalories) in columns (3) and (4); log(BMI)t−1; log mom BMI duringpregnancy; parity; age of child at clinic date; mom and dad education and SES; mother age at pregnancy; dummy for single mother;reliable dietary report; time dummy; month dummies; late respondent; birth weight.
→ Must understand better the biological function of the various genes
Pietro Biroli22

Intro GxEcon Empirics Structural The Model Simulations
Life-cycle Model
Vt (Bt ,Yt , εt ; g) = maxEt ,Ft
u (Bt ,Ft , `t , ct ; g) + βEVt+1(Bt+1,Yt+1, εt+1; g)
s.tΩ = `t + Et (4)
Yt = pFt Ft + ct (5)Bt+1 = I(Ft , Et ; g) + (1− δt )Bt + εt (6)
Take into account expected future value of current choices βEVt+1
Genotype g influences:
Cost of investment [disutility: U(.;g)]Productivity of investment [I(.; g)]
Pietro Biroli23

Intro GxEcon Empirics Structural The Model Simulations
CalibrationUse parameters estimated in reduced form to calibrate:
16.0
16.5
17.0
17.5
18.0
18.5
19.0
19.5
20.0
1 2 3 4 5 6 7 8 9 10 11 12 13 14 15 16 17 18 19 20 21 22 23 24 25 26 27
B
M
I
Age
Body Mass Index
A-Risky T-Allele
Pietro Biroli24

Intro GxEcon Empirics Structural The Model Simulations
Policy A: Food TaxHigher food prices
16.0
16.5
17.0
17.5
18.0
18.5
19.0
19.5
20.0
1 2 3 4 5 6 7 8 9 10 11 12 13 14 15 16 17 18 19 20 21 22 23 24 25 26
B
M
I
Age
Body Mass Index50% Tax on Calories
A-Risky T-Allele
Pietro Biroli25

Motivation Replication using FHS
Thank You
Pietro Biroli26

Motivation Replication using FHS
Policy B: School EatingReduce caloric consumption by 25% in the first 10 years of life
16.0
16.5
17.0
17.5
18.0
18.5
19.0
19.5
20.0
1 2 3 4 5 6 7 8 9 10 11 12 13 14 15 16 17 18 19 20 21 22 23 24 25 26
B
M
I
Age
Body-Mass-IndexHealthy Eating in School
A-Risky T-Allele
Pietro Biroli27

Motivation Replication using FHS
Appendix
Pietro Biroli28

Motivation Replication using FHS
Body-Mass-Index and obesity: major health problem
Cost ConsequencesHealth: (US) $14.3 billion for children, $147 billion for adults, 400k deaths;Economic: lower skills acquisition, wages, labor force, and productivity.→ see [Cawley, 2010, Kline and Tobias, 2008, Ng et al., 2014]
Pietro Biroli29

Motivation Replication using FHS
Summary StatisticsTable: Summary Statistics, Age 11 and 13 by genotype and father SES
Genotype Father SES TotalT-Allele A-Risky High Low
Body Mass Index 19.10 19.47 19.17 19.39 19.33(11.24) (11.07) (10.09) (11.68) (11.17)
[0.07]*** [0.05]*** [0.06]** [0.06]**Overweight (%) 22.17 28.48 23.39 27.47 26.19
(17.26) (20.37) (17.92) (19.93) (19.33)[0.82]*** [0.67]*** [0.75]*** [0.82]***
Kilocalories/day 1.89 1.92 1.91 1.90 1.91(0.21) (0.19) (0.19) (0.20) (0.20)
[0.01]** [0.01]** [0.01] [0.01]Sedentary Hours/day 7.51 7.55 7.67 7.43 7.54
(1.54) (1.59) (1.46) (1.65) (1.58)[0.02] [0.02] [0.02]** [0.02]**
n obs. 2562 4490 3722 3330 7052
Mean of Body Mass Index (BMI kg/m2), percentage overweight (BMI greater than 85% pct),sedentary hours, and Kilocalories (x1000), by FTO variant and father SES. Sample variance inparenthesis; mean standard-error in brackets.49% of the sample is male. 63% of the sample carries one or two A-Alleles in the rs9939609 SNPof the FTO gene (15% are heterozygous AA, Minor Allele Frequency of 0.39 representative of UKpopulation). High SES: manager or professional (47%); low: worker (skilled or unskilled), based onOPCS occupation codes.
By Age Investments Anthropometrics GenderPietro Biroli
30

Motivation Replication using FHS
Identification and limitations
Identification:Mendelian Randomization: Mendel’s first law of segregationGenotype random conditional on parental gDad genotype unobserved → bound using [Altonji et al., 2008]
Limitations:Measurement error and misreporting → attenuationPotential endogeneity of investments
Pietro Biroli31

Motivation Replication using FHS
Parametrization of the Model
Utility
u (B,F , `, c; g) = ζB log B + ζF (g) log F + ζ` log `+ ζc log c
Production function
log Bt+1 = log φ(g)+a(g) log Ft+b(g) logEt + (1− δ1 − t/T δ2) log Bt+εt
10 Parameters(ζB , ζF (g), ζ`, ζc , φ(g), a(g), b(g), δ1, δ2, σ2
ε
)4 vary by genotype
back
Pietro Biroli32

Motivation Replication using FHS
Calibrated ParametersParameters taken from the literature:
β = 0.97 (As in Hubbard, Skinner, and Zeldes (1995); and Engen, Gale, andUccello (1999))ζc = 0.36 (As in Scholz and Seshadri (2013))
Calibrated:ζB = 0.4ζ` = 0.4ζF (0) = 0.1ζF (1) = 0.2a(0) = 0.06a(1) = 0.09b(0) = 0.3b(1) = 0.3φ(0) = 1.0φ(1) = 1.1δ1 = 0.02δ2 = 0.04
backPietro Biroli33

Motivation Replication using FHS
Alternative Parametrization of the Model
Utility
u (B,F , `; g) =
λ[F η(g)`1−η(g)]ρ + (1− λ)Bρ
1−σρ
1− σ + αct
11 Parameters: λ, η(g), ρ, σ, α, φ(g), a(g), b(g), δ1, δ2, σ2ε
4 vary by genotypeback
Pietro Biroli34

Motivation Replication using FHS
Moments to Match
Match the following moments from the ALSPAC data:Ft , Et at ages 11 and 13Average, median, and BMI cutoff at different agesCov (Bt ,Ft−1)Cov (Bt , Et−1)Cov (Bt ,Bt−1)Cov (Ft , Et)
back
Pietro Biroli35

Motivation Replication using FHS
Brain Imaging, Appetite, and FTO
Figure: Brain regions where the TT and AA genotypes exhibited different BOLD responses in fMRI when viewing food/non-foodimages while fasting (A-F); or comparing interaction between fed/fasting and high-incentive/low-incentive-value food (D-F)
BackPietro Biroli
36

Motivation Replication using FHS
Brain Imaging, Appetite, and FTO
Figure: Brain regions where the circulating acyl-ghrelin differentially affected brain fMRI responses in TT and AA genotypes
BackPietro Biroli
37

Motivation Replication using FHS
Endogeneity of Inputs
So far, assumed Ie , Id ⊥⊥ εH
Now, consider system of equations:Bt = f (Id , Ie ,Bt−1,X ; g) + εH
Id = Id (Ie ,Bt−1,X ,Z ; g) + εd
Ie = Ie (Id ,Bt−1,X ,Z ; g) + εe
Exclusion restriction: Z ⊥⊥ εkLagged investments Ik,t−1Income Y , family composition, distance to schoolMother and Father behaviors
back
Pietro Biroli38
Motivation Replication using FHS
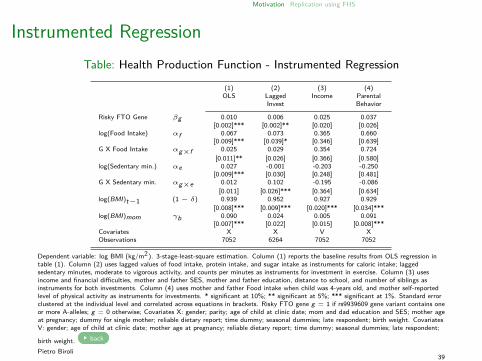
Instrumented RegressionTable: Health Production Function - Instrumented Regression
(1) (2) (3) (4)OLS Lagged Income Parental
Invest Behavior
Risky FTO Gene βg 0.010 0.006 0.025 0.037[0.002]*** [0.002]** [0.020] [0.026]
log(Food Intake) αf 0.067 0.073 0.365 0.660[0.009]*** [0.039]* [0.346] [0.639]
G X Food Intake αg×f 0.025 0.029 0.354 0.724[0.011]** [0.026] [0.366] [0.580]
log(Sedentary min.) αe 0.027 -0.001 -0.203 -0.250[0.009]*** [0.030] [0.248] [0.481]
G X Sedentary min. αg×e 0.012 0.102 -0.195 -0.086[0.011] [0.026]*** [0.364] [0.634]
log(BMI)t−1 (1 − δ) 0.939 0.952 0.927 0.929[0.008]*** [0.009]*** [0.020]*** [0.034]***
log(BMI)mom γb 0.090 0.024 0.005 0.091[0.007]*** [0.022] [0.015] [0.008]***
Covariates X X V XObservations 7052 6264 7052 7052
Dependent variable: log BMI (kg/m2). 3-stage-least-square estimation. Column (1) reports the baseline results from OLS regression intable (1). Column (2) uses lagged values of food intake, protein intake, and sugar intake as instruments for caloric intake; laggedsedentary minutes, moderate to vigorous activity, and counts per minutes as instruments for investment in exercise. Column (3) usesincome and financial difficulties, mother and father SES, mother and father education, distance to school, and number of siblings asinstruments for both investments. Column (4) uses mother and father Food intake when child was 4-years old, and mother self-reportedlevel of physical activity as instruments for investments. * significant at 10%; ** significant at 5%; *** significant at 1%. Standard errorclustered at the individual level and correlated across equations in brackets. Risky FTO gene g = 1 if rs9939609 gene variant contains oneor more A-alleles; g = 0 otherwise; Covariates X: gender; parity; age of child at clinic date; mom and dad education and SES; mother ageat pregnancy; dummy for single mother; reliable dietary report; time dummy; seasonal dummies; late respondent; birth weight. CovariatesV: gender; age of child at clinic date; mother age at pregnancy; reliable dietary report; time dummy; seasonal dummies; late respondent;
birth weight. back
Pietro Biroli39

Motivation Replication using FHS
Utility Cost EffectTable: Investment Equation - Food Intake
(2) (3) (4)Risky FTO 0.017 Risky FTO 0.109 Risky FTO 0.112Gene [0.006]*** Gene [0.077] Gene [0.076]log(Sed -0.222 log(Sed -19.590 log(Sed -19.459Min) [0.052]*** Min) [0.128]*** Min) [0.184]***
Lagged 0.198 Income 0.009 Mom Food Int. 0.063Food Int. [0.021]*** [0.073] (age 4) [0.143]Lagged 0.074 Mom SES -0.012 Dad Food Int. 0.018Protein Int. [0.014]*** [0.045] (age 4) [0.183]Lagged 0.042 Dad SES -0.106 Mom Physical -0.227Sugar Int. [0.009]*** [0.036]*** Activity [0.099]**
Mom Edu 0.259[0.041]***
Dad Edu 0.071[0.036]**
Distance 0.176[0.041]***
Num Sibling -0.153[0.048]***
Covariates X V XObservations 6264 7052 7052Instrument: Lag Investment Income and distance to school Parental Behavior
Dependent variable: log(Food Intake). 3-stage-least-square estimation. Column (2) uses lagged values of food intake, protein intake, andsugar intake as instruments for caloric intake; lagged sedentary minutes, moderate to vigorous activity, and counts per minutes asinstruments for investment in exercise. Column (3) uses income and financial difficulties, mother and father SES, mother and fathereducation, distance to school, and number of siblings as instruments for both investments. Column (4) uses mother and father Foodintake when child was 4-years old, and mother self-reported level of physical activity as instruments for investments. * significant at 10%;** significant at 5%; *** significant at 1%. Standard error clustered at the individual level and correlated across equations in brackets.Risky FTO gene g = 1 if rs9939609 gene variant contains one or more A-alleles; g = 0 otherwise; Covariates X: gender; parity; age ofchild at clinic date; log mom BMI during pregnancy; mom and dad education and SES; mother age at pregnancy; dummy for singlemother; reliable dietary report; time dummy; seasonal dummies; late respondent; birth weight. Covariates V: gender; age of child at clinic
date; mother age at pregnancy; reliable dietary report; time dummy; seasonal dummies; late respondent; birth weight. backPietro Biroli40

Motivation Replication using FHS
Utility Cost Effect - 2Table: Investment Equation - Sedentary Minutes
(2) (3) (4)Risky FTO 0.008 Risky FTO 0.006 Risky FTO 0.006Gene [0.004]* Gene [0.004] Gene [0.004]log(Food -0.187 log(Food -0.051 log(Food -0.051Intake) [0.010]*** Intake) [0.000]*** Intake) [0.000]***
Lagged 0.191 Income 0.000 Mom Food Int. 0.003Sedentary Min [0.020]*** [0.004] (age 4) [0.007]Lagged 0.021 Mom SES -0.001 Dad Food Int. 0.001Vig. Activity [0.006]*** [0.002] (age 4) [0.009]Lagged -0.140 Dad SES -0.005 Mom Physical -0.012Counts per min [0.019]*** [0.002]*** Activity [0.005]**
Mom Edu 0.013[0.002]***
Dad Edu 0.004[0.002]**
Distance 0.009[0.002]***
Num Sibling -0.008[0.002]***
Covariates X V XObservations 6264 7052 7052
Instrument: Lag Investment Income and distance to school Parental Behavior
Dependent variable: log(Sedentary min.). 3-stage-least-square estimation. Column (2) uses lagged values of food intake, protein intake,and sugar intake as instruments for caloric intake; lagged sedentary minutes, moderate to vigorous activity, and counts per minutes asinstruments for investment in exercise. Column (3) uses income and financial difficulties, mother and father SES, mother and fathereducation, distance to school, and number of siblings as instruments for both investments. Column (4) uses mother and father Foodintake when child was 4-years old, and mother self-reported level of physical activity as instruments for investments. * significant at 10%;** significant at 5%; *** significant at 1%. Standard error clustered at the individual level and correlated across equations in brackets.Risky FTO gene g = 1 if rs9939609 gene variant contains one or more A-alleles; g = 0 otherwise; Covariates X: gender; parity; age ofchild at clinic date; log mom BMI during pregnancy; mom and dad education and SES; mother age at pregnancy; dummy for singlemother; reliable dietary report; time dummy; seasonal dummies; late respondent; birth weight. Covariates V: gender; age of child at clinic
date; mother age at pregnancy; reliable dietary report; time dummy; seasonal dummies; late respondent; birth weight. backPietro Biroli41

Motivation Replication using FHS
Summary Statistics, Investments
Table: Summary Statistics, Food Intake and Exercise
FTO genotypeT-Allele A-Risky Total
Kilocalories 1.89** 1.92** 1.91(x1000) [0.01] [0.01] [0.01]Fat Intake 75.82** 77.10** 76.64(grams/day) [0.45] [0.33] [0.27]Dietary Cholesterol Intake 188.66** 193.39** 191.67(grams/day) [1.88] [1.44] [1.15]Carbohydrate Intake 252.83* 255.58* 254.58(grams/day) [1.30] [0.94] [0.76]Total Sugar Intake 114.74 115.87 115.46(grams/day) [0.91] [0.64] [0.53]
Physical Activity 7.51 7.55 7.54(Sedentary Hours) [0.02] [0.02] [0.01]Physical Activity 23.92 23.68 23.77(Moderate To Vigorous) [0.32] [0.25] [0.20]Physical Activity 581.96 576.78 578.66(counts per minute) [3.73] [2.84] [2.26]Very Active 3.69 3.71 3.7(self-report) [0.02] [0.01] [0.01]
Average measures of investment in diet, and investment in exercise. Pooled across gender and ages, separated by FTO-genotype.Standard errors of means in brackets. Mean difference * significant at 10%; ** significant at 5%; *** significant at 1%. 3-day dietaryrecords coded using the Diet In Data Out software. Actigraph data: counts per min., min. of sedentary activity, and moderate to vigorous
activity. Self-reported activity ranged from 1 (never) to 5 (daily). Back
Pietro Biroli42
Motivation Replication using FHS
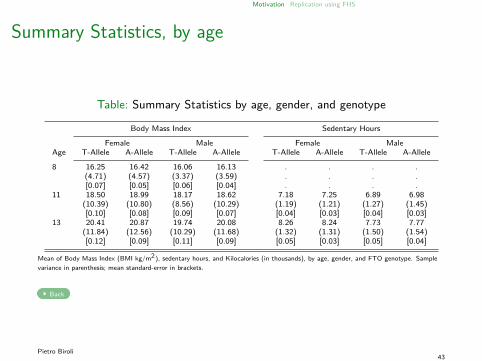
Summary Statistics, by age
Table: Summary Statistics by age, gender, and genotype
Body Mass Index Sedentary Hours
Female Male Female MaleAge T-Allele A-Allele T-Allele A-Allele T-Allele A-Allele T-Allele A-Allele
8 16.25 16.42 16.06 16.13 . . . .(4.71) (4.57) (3.37) (3.59) . . . .[0.07] [0.05] [0.06] [0.04] . . . .
11 18.50 18.99 18.17 18.62 7.18 7.25 6.89 6.98(10.39) (10.80) (8.56) (10.29) (1.19) (1.21) (1.27) (1.45)[0.10] [0.08] [0.09] [0.07] [0.04] [0.03] [0.04] [0.03]
13 20.41 20.87 19.74 20.08 8.26 8.24 7.73 7.77(11.84) (12.56) (10.29) (11.68) (1.32) (1.31) (1.50) (1.54)[0.12] [0.09] [0.11] [0.09] [0.05] [0.03] [0.05] [0.04]
Mean of Body Mass Index (BMI kg/m2), sedentary hours, and Kilocalories (in thousands), by age, gender, and FTO genotype. Samplevariance in parenthesis; mean standard-error in brackets.
Back
Pietro Biroli43

Motivation Replication using FHS
Summary Statistics, by age
Table: Summary Statistics by age, gender, and genotype
Kilocalories Whole SampleFemale Male
Age T-Allele A-Allele T-Allele A-Allele BMI Sed Kcal8 1.64 1.64 1.75 1.79 16.23 . 1.71
(0.08) (0.08) (0.09) (0.11) (4.08) . (0.10)[0.01] [0.01] [0.01] [0.01] [0.03] . [0.00]
11 1.75 1.78 1.92 1.97 18.64 7.10 1.86(0.13) (0.12) (0.15) (0.16) (10.23) (1.31) (0.15)[0.01] [0.01] [0.01] [0.01] [0.04] [0.02] [0.01]
13 1.77 1.76 2.12 2.15 20.34 8.02 1.95(0.21) (0.18) (0.30) (0.27) (11.92) (1.47) (0.27)[0.02] [0.01] [0.02] [0.01] [0.05] [0.02] [0.01]
Mean of Body Mass Index (BMI kg/m2), sedentary hours, and Kilocalories (in thousands), by age, gender, and FTO genotype. SampleVariance in parenthesis; mean standard-error in brackets.
Back
Pietro Biroli44

Motivation Replication using FHS
Summary Statistics, by gender
Table: Summary Statistics, by gender
Female Male TotalT-Allele A-Risky T-Allele A-Risky
Body Mass Index 19.34 19.77 18.83 19.14 19.33(11.80) (11.73) (10.49) (10.16) (11.17)
[0.09]*** [0.07]*** [0.09]*** [0.07]***Kilocalories/day 1.77 1.79 2.02 2.06 1.91
(0.16) (0.14) (0.23) (0.21) (0.20)[0.01] [0.01] [0.01]*** [0.01]***
Sedentary Hours/day 7.70 7.72 7.29 7.36 7.54(1.51) (1.52) (1.50) (1.62) (1.58)[0.03] [0.03] [0.04] [0.03]
Mean of Body Mass Index (BMI kg/m2), sedentary hours, and Kilocalories (x1000), by gender andFTO variant. Sample variance in parenthesis; mean standard-error in brackets.49% of the sample is male. 63% of the sample carries one or two A-Alleles in the rs9939609 SNPof the FTO gene (15% are heterozygous AA, Minor Allele Frequency of 0.39, representative of UKpopulation)
Back
Pietro Biroli45
Motivation Replication using FHS
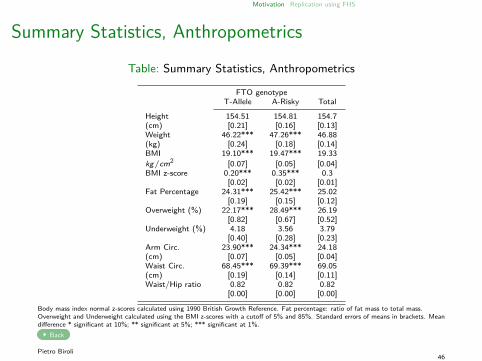
Summary Statistics, Anthropometrics
Table: Summary Statistics, Anthropometrics
FTO genotypeT-Allele A-Risky Total
Height 154.51 154.81 154.7(cm) [0.21] [0.16] [0.13]Weight 46.22*** 47.26*** 46.88(kg) [0.24] [0.18] [0.14]BMI 19.10*** 19.47*** 19.33kg/cm2 [0.07] [0.05] [0.04]BMI z-score 0.20*** 0.35*** 0.3
[0.02] [0.02] [0.01]Fat Percentage 24.31*** 25.42*** 25.02
[0.19] [0.15] [0.12]Overweight (%) 22.17*** 28.49*** 26.19
[0.82] [0.67] [0.52]Underweight (%) 4.18 3.56 3.79
[0.40] [0.28] [0.23]Arm Circ. 23.90*** 24.34*** 24.18(cm) [0.07] [0.05] [0.04]Waist Circ. 68.45*** 69.39*** 69.05(cm) [0.19] [0.14] [0.11]Waist/Hip ratio 0.82 0.82 0.82
[0.00] [0.00] [0.00]
Body mass index normal z-scores calculated using 1990 British Growth Reference. Fat percentage: ratio of fat mass to total mass.Overweight and Underweight calculated using the BMI z-scores with a cutoff of 5% and 85%. Standard errors of means in brackets. Meandifference * significant at 10%; ** significant at 5%; *** significant at 1%.
Back
Pietro Biroli46

Motivation Replication using FHS
Evolution of Body Mass Index
Back DensityPietro Biroli47

Motivation Replication using FHS
Evolution of Body Mass Index
BackPietro Biroli
48

Motivation Replication using FHS
Evolution of Body Mass Index
BackPietro Biroli
49

Motivation Replication using FHS
Evolution of Body Mass Index
BackPietro Biroli
50

Motivation Replication using FHS
Evolution of Body Mass Index
BackPietro Biroli
51

Motivation Replication using FHS
Summary Statistics, Environment and CovariatesTable: Family Characteristics, by Child FTO genotype
FTO genotypeT-Allele A-Risky Total
Mother Edu 3.36 3.33 3.34[0.03] [0.02] [0.02]
Father Edu 3.32 3.34 3.33[0.04] [0.03] [0.02]
Mother SES 2.75 2.78 2.77[0.02] [0.02] [0.02]
Father SES 2.88 2.84 2.86[0.03] [0.02] [0.02]
Mother BMI 22.74** 23.00** 22.90[0.10] [0.08] [0.06]
Mother age 29.33 29.35 29.34at birth [0.12] [0.09] [0.07]Teen mother (%) 1.51 2.10 1.88
[0.33] [0.29] [0.22]Single Mother (%) 15.85 15.28 15.49
[0.98] [0.73] [0.58]Parity 0.69 0.73 0.72
[0.02] [0.02] [0.01]Birth Weight (kg) 3.42 3.43 3.42
[0.01] [0.01] [0.01]
Average value of the covariates for the sample used in the main analysis. Pooled across genders and separated by FTO-genotype.Standard errors of means in brackets. Mean difference * significant at 10%; ** significant at 5%; *** significant at 1%.Education ranges from lowest (1 = CSE or less) to highest (5 = degree). Socio-Economic-Status ranges from from highest (1 =professional) to lowest (6 = unskilled). Teen mother is a dummy for mothers who were pregnant before age 19. Single mother is a dummyfor a household without a male figure.Pietro Biroli
52

Motivation Replication using FHS
Gene×Calories Interaction
Figure: Nonparametric local-mean smoothing using Epanechnikov kernel and Silverman’s Rule-of-Thumb bandwidth. Combininginformation from successive clinical visits, age 11 and 13; excluding outliers in the top and bottom 5% of the distributions of BMI and
log(energy intake). Density Back
Pietro Biroli53

Motivation Replication using FHS
Gene×Calories Interaction
Figure: Nonparametric local-mean smoothing using Epanechnikov kernel and Silverman’s Rule-of-Thumb bandwidth. Combininginformation from successive clinical visits, age 11 and 13; excluding outliers in the top and bottom 5% of the distributions of BMI and
log(energy intake). Density Back
Pietro Biroli54
Motivation Replication using FHS
Gene×Exercise Interaction
Figure: Nonparametric local-mean smoothing using Epanechnikov kernel and Silverman’s Rule-of-Thumb bandwidth. Combininginformation from successive clinical visits, age 11 and 13; excluding outliers in the top and bottom 5% of the distributions of BMI andlog(sedentary minutes).
Density BackPietro Biroli
55
Motivation Replication using FHS
Gene×Exercise Interaction
Figure: Nonparametric local-mean smoothing using Epanechnikov kernel and Silverman’s Rule-of-Thumb bandwidth. Combininginformation from successive clinical visits, age 11 and 13; excluding outliers in the top and bottom 5% of the distributions of BMI andlog(sedentary minutes).
Density BackPietro Biroli
56

Motivation Replication using FHS
Distribution of BMI, Females
Back
Pietro Biroli57

Motivation Replication using FHS
Distribution of BMI, Males
Back
Pietro Biroli58

Motivation Replication using FHS
Distribution of Caloric Intake, Females
Back
Pietro Biroli59
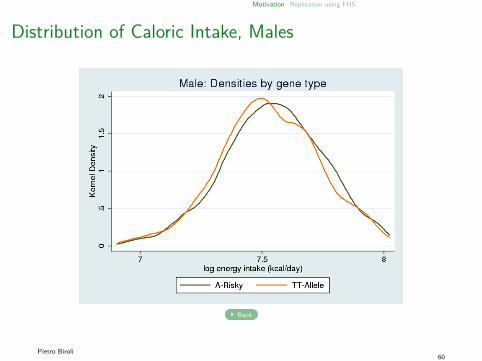
Motivation Replication using FHS
Distribution of Caloric Intake, Males
Back
Pietro Biroli60

Motivation Replication using FHS
Distribution of Exercise, Females
Back
Pietro Biroli61
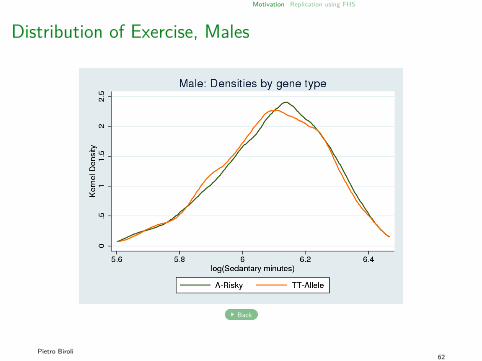
Motivation Replication using FHS
Distribution of Exercise, Males
Back
Pietro Biroli62

Motivation Replication using FHS
Heterogeneity by groupTable: By Gender and Without Underweight
(1) (2) (3) (4)No
Baseline Males Females UnderweightRisky FTO Gene βg 0.010 0.006 0.010 0.011
[0.002]*** [0.004] [0.003]*** [0.003]***log(Food Int.) αf 0.067 0.067 0.082 0.069
[0.009]*** [0.013]*** [0.014]*** [0.009]***G X Food Int. αg×f 0.025 0.004 0.044 0.030
[0.011]** [0.016] [0.018]** [0.011]***log(Sedentary m.) αe 0.027 0.042 0.007 0.028
[0.009]*** [0.013]*** [0.013] [0.009]***G X Sedentary m. αg×e 0.012 0.026 -0.007 0.009
[0.011] [0.016]* [0.016] [0.011]Bt−1 (1− δ) 0.939 0.947 0.928 0.911
[0.008]*** [0.012]*** [0.011]*** [0.008]***Controls X X X XR2 78% 79% 79% 77%Observations 7,052 3,346 3,706 6,785
Column (1) reports the baseline estimates (same as table 1). Column (2) and (3) run the model separately for males and females. Column(4) runs the model dropping the children who are below the 5th percentile of the z-BMI standard distribution for the UK (they represent4% of the sample).* significant at 10%; ** significant at 5%; *** significant at 1%. Standard errors in brackets. Risky FTO gene g = 1 if rs9939609 genevariant contains one or more A-Alleles; g = 0 otherwise. Covariates: gender; parity; age of child at clinic date; log mom BMI duringpregnancy; mom and dad education and SES; mother age at pregnancy; dummy for single mother; reliable dietary report; time dummy;seasonal dummies; late respondent; birth weight.
BackPietro Biroli63

Motivation Replication using FHS
Measurement of AdiposityTable: Different Measures of Adiposity
(1) (2) (3) (4) (5)Prob BMI and
Overweight Height Weight zBMI Fat %Risky FTO Gene βg 0.228 0.010 0.012 0.081 -0.011
[0.065]*** [0.002]*** [0.003]*** [0.019]*** [0.019]log(Food Int.) αf 0.500 0.060 0.072 0.490 0.036
[0.224]** [0.009]*** [0.011]*** [0.070]*** [0.078]G X Food Int. αg×f 0.091 0.025 0.030 0.199 0.029
[0.274] [0.011]** [0.013]** [0.083]** [0.093]log(Sedentary m.) αe 0.554 0.026 0.031 0.189 0.141
[0.218]** [0.009]*** [0.011]*** [0.067]*** [0.068]**G X Sedentary m. αg×e 0.082 0.012 0.009 0.076 0.021
[0.252] [0.011] [0.013] [0.080] [0.081]Bt−1 (1− δ) 2.101 0.934 0.761 0.869 0.306
[0.052]*** [0.008]*** [0.008]*** [0.008]*** [0.022]***log(Height) 0.106 0.92
[0.021]*** [0.031]***Controls X X X X XR2 78% 88% 77% 55%Observations 7,052 7,050 7,048 7,052 5,305
Column (1) runs a probit model on the probability of being obese. Column (2) uses Bt =log(weight) as dependent variable, controlling forlog(height). Column (3) uses z-BMI as dependent variable. Column (4) uses the estimated percentage of body fat as dependent variable.* significant at 10%; ** significant at 5%; *** significant at 1%. Standard errors in brackets. Risky FTO gene g = 1 if rs9939609 genevariant contains one or more A-Alleles; g = 0 otherwise. Covariates: gender; parity; age of child at clinic date; log mom BMI duringpregnancy; mom and dad education and SES; mother age at pregnancy; dummy for single mother; reliable dietary report; time dummy;seasonal dummies; late respondent; birth weight.
BackPietro Biroli
64

Motivation Replication using FHS
Measurement of Food Intake
Table: Different Measures of Food Intake - FTO gene
(1) (2) (3) (4) (5) (6) (7) (8) (9)Dietary Non Factor
Calories Proteins Fat Carbs Cholesterol Sugar Starch Starch Score
Risky FTO Gene βg 0.010 0.010 0.009 0.008 0.008 0.007 0.008 0.008 0.009[0.002]*** [0.002]*** [0.002]*** [0.002]*** [0.002]*** [0.002]*** [0.002]*** [0.002]*** [0.002]***
log(Food) αf 0.067 0.046 0.037 0.047 0.010 0.011 0.046 0.022 0.016[0.009]*** [0.007]*** [0.007]*** [0.008]*** [0.004]*** [0.005]** [0.007]*** [0.005]*** [0.002]***
G X Food αg×f 0.025 0.027 0.015 0.013 0.009 0.002 0.011 0.014 0.006[0.011]** [0.009]*** [0.008]* [0.010] [0.005]* [0.006] [0.009] [0.007]** [0.003]**
log(Sedentary min.) αe 0.027 0.025 0.027 0.026 0.024 0.024 0.027 0.025 0.028[0.009]*** [0.009]*** [0.009]*** [0.009]*** [0.009]** [0.009]** [0.009]*** [0.009]*** [0.009]***
G X Sedentary min. αg×e 0.012 0.010 0.013 0.011 0.010 0.010 0.011 0.010 0.013[0.011] [0.011] [0.011] [0.011] [0.011] [0.011] [0.011] [0.011] [0.011]
log(BMI)t−1 (1 − δ) 0.939 0.939 0.944 0.942 0.945 0.946 0.943 0.947 0.937[0.008]*** [0.008]*** [0.008]*** [0.008]*** [0.008]*** [0.008]*** [0.008]*** [0.008]*** [0.008]***
Covariates X X X X X X X X XR2 78% 78% 78% 78% 78% 78% 78% 78% 78%Observations 7052 7052 7052 7052 7051 7052 7052 7052 7051
Column (1) reports the baseline estimates (same as table 1). The different measures of dietary intake used are: Food intake(kilocalories/day - column 1); protein intake (grams/day - column 2); fat intake (grams/day - column 3); carbohydrate intake (grams/day- column 4); dietary cholesterol intake (mg/day - column 5); total sugar intake (grams/day - column 6); starch intake (grams/day -column 7); non-starch polysaccharide (fibre) intake (grams/day - column 8); factor score of all the dietary measures (column 9);* significant at 10%; ** significant at 5%; *** significant at 1%. Standard error clustered at the individual level in brackets. Dependentvariable: log BMI (kg/m2); Covariates: gender; parity; age of child at clinic date; log mom BMI during pregnancy; mom and dadeducation and SES; mother age at pregnancy; dummy for single mother; reliable dietary report; time dummy; seasonal dummies; laterespondent; birth weight.
BackPietro Biroli
65

Motivation Replication using FHS
Measurement of ExerciseTable: Different Measures of Physical Activity - FTO gene
(1) (2) (3) (4)Sedentary Counts
min MVPA per min Factor ScoreRisky FTO Gene βg 0.010 0.009 0.009 0.009
[0.002]*** [0.002]*** [0.003]*** [0.002]***log(Food Intake) αf 0.067 0.068 0.069 0.069
[0.009]*** [0.009]*** [0.009]*** [0.009]***G X Food Intake αg×f 0.025 0.021 0.024 0.023
[0.011]** [0.011]* [0.011]** [0.011]**log(Exercise) αe 0.027 -0.011 -0.028 -0.008
[0.009]*** [0.002]*** [0.005]*** [0.002]***G X Exercise αg×e 0.012 -0.001 -0.009 -0.002
[0.011] [0.002] [0.006] [0.002]log(BMI)t−1 (1− δ) 0.939 0.934 0.936 0.936
[0.008]*** [0.008]*** [0.008]*** [0.008]***Covariates X X X XR2 78% 79% 79% 79%Observations 7052 7043 7052 7043
Column (1) reports the baseline estimates (same as table 1). The different measures of exercise used are: sedentary minutes (column 1);moderate to vigorous physical activity (MVPA - column 2); counts per minute (column 3) factor score of all the exercise measures(column 4);* significant at 10%; ** significant at 5%; *** significant at 1%. Standard error clustered at the individual level in brackets. Dependentvariable: log BMI (kg/m2); Covariates: gender; parity; age of child at clinic date; log mom BMI during pregnancy; mom and dadeducation and SES; mother age at pregnancy; dummy for single mother; reliable dietary report; time dummy; seasonal dummies; laterespondent; birth weight.
BackPietro Biroli66

Motivation Replication using FHS
Quantile Regression
BackPietro Biroli
67

Motivation Replication using FHS
Quantile Regression
BackPietro Biroli
68

Motivation Replication using FHS
Replication of the Results
Framingham Heart Study (FHS), Offspring Cohort
Information on 5,124 individuals, children of the original cohortpopulation (1948)Born over a 60-year period (1905-1965)8 clinical exams from 1971 to 2008Genetic info: 1987-1991, 98% consent4 waves with BMI, caloric intake, and physical activity
Back
Pietro Biroli69

Motivation Replication using FHS
FHS: Log-Linear Regression
Table: FHS: Gene and Investment Interaction - FTOlog(Body Mass Indext )
(1) (2) (3) (4)born after 1940 born after 1940
Risky FTO variant βg 0.024*** 0.043*** 0.002 0.005**[0.007] [0.010] [0.001] [0.002]
log(Energy Intake) αf 0.013*** 0.022***[0.004] [0.005]
G X Energy Intake αg×f 0.010** 0.016**[0.005] [0.006]
log(Physical Activity) αe -0.005** -0.009***[0.002] [0.003]
G X Physical Activity αg×e 0.003 0.001[0.003] [0.004]
log(BMI)t−1 (1− δ) 0.937*** 0.927***[0.006] [0.009]
Covariates x xR2 0.4% 1.2% 85.3% 84.7%Observations 8258 4918 8258 4642n 2753 1639 2753 1547
Dependent variable: log BMI (kg/m2); Risky FTO gene g = 1 if rs9939609 gene variant contains one or more A-Alleles; g = 0otherwise; Covariates: gender; 3-degree polynomial in age; dummies education and income; dummies for marital status; reliable dietaryreport; time dummies; birth cohort dummies; 20 first principal components of genome. * significant at 10%; ** significant at 5%; ***significant at 1%. Standard error clustered at the individual level in brackets.
BackPietro Biroli
70

Motivation Replication using FHS
Birth Year Effects
Back
Pietro Biroli71

Motivation Replication using FHS
Prices, Income, Food Availability
BackPietro Biroli
72
Motivation Replication using FHS
According to Mendel’s laws of independent assortment,we expect a bell-shaped distribution
back
Pietro Biroli73

Motivation Replication using FHS
References I
Altonji, J. G., Elder, T. E., and Taber, C. R. (2008).Using Selection on Observed Variables to Assess Bias from Unobservables when Evaluating Swan-Ganz Catheterization.American Economic Review: Papers & Proceedings, 98(2):345–350.
Andreasen, C. H., Stender-petersen, K. L., Mogensen, M. S., Torekov, S. S., Wegner, L., Andersen, G., Nielsen, A. L.,Albrechtsen, A., Borch-johnsen, K., Rasmussen, S. S., Clausen, J. O., Sandbæk, A., Lauritzen, T., Hansen, L., Jorgensen, T.,Pedersen, O., and Hansen, T. (2008).Low Physical Activity Accentuates the Effect of the FTO rs9939609 Polymorphism on Body Fat Accumulation.Diabetes, 57(January):95–101.
Belsky, D. W., Moffitt, T. E., Sugden, K., Williams, B. S., Houts, R., McCarthy, J., and Caspi, A. (2013).Development and evaluation of a genetic risk score for obesity.Biodemography and social biology, 59(1):85–100.
Cawley, J. (2010).The economics of childhood obesity.Health affairs, 29(3):364–71.
Cecil, J. E., Tavendale, R., Watt, P., Hetherington, M. M., and Palmer, C. N. A. (2008).An obesity-associated FTO gene variant and increased energy intake in children.The New England Journal of Medicine, 359:2558–2566.
Fawcett, K. A. and Barroso, I. (2010).The genetics of obesity: FTO leads the way.Trends in genetics, 26(6):266–74.
Franks, P. W., Jablonski, K. a., Delahanty, L. M., McAteer, J. B., Kahn, S. E., Knowler, W. C., and Florez, J. C. (2008).Assessing gene-treatment interactions at the FTO and INSIG2 loci on obesity-related traits in the Diabetes Prevention Program.Diabetologia, 51(12):2214–23.
Pietro Biroli74

Motivation Replication using FHS
References IIFredriksson, R., Hagglund, M., Olszewski, P. K., Stephansson, O., Jacobsson, J. A., Olszewska, A. M., Levine, A. S., Lindblom,J., and Schioth, H. B. (2008).The obesity gene, FTO, is of ancient origin, up-regulated during food deprivation and expressed in neurons of feeding-relatednuclei of the brain.Endocrinology, 149(5):2062–71.
Huang, T., Qi, Q., Li, Y., Hu, F. B., Bray, G. A., Sacks, F. M., Williamson, D. A., and Qi, L. (2014).FTO genotype, dietary protein, and change in appetite: the Preventing Overweight Using Novel Dietary Strategies trial.The American journal of clinical nutrition, 99(5):1126–30.
Karra, E., O’Daly, O. G., Choudhury, A. I., Yousseif, A., Millership, S., Neary, M. T., Scott, W. R., Chandarana, K., Manning, S.,Hess, M. E., Iwakura, H., Akamizu, T., Millet, Q., Gelegen, C., Drew, M. E., Rahman, S., Emmanuel, J. J., Williams, S. C. R.,Ruther, U. U., Bruning, J. C., Withers, D. J., Zelaya, F. O., and Batterham, R. L. (2013).A link between FTO, ghrelin, and impaired brain food-cue responsivity.The Journal of clinical investigation, 123(8):3539–51.
Kilpelainen, T. O., Qi, L., Brage, S., Sharp, S. J., Sonestedt, E., Demerath, E. W., Ahmad, T., Mora, S., Kaakinen, M.,Sandholt, C. H., Holzapfel, C., Autenrieth, C. S., Hypponen, E., Cauchi, S., He, M., Kutalik, Z., Kumari, M., Stancakova, A.,Meidtner, K., Balkau, B., Tan, J. T., Mangino, M., Timpson, N. J., Song, Y., Zillikens, M. C., Jablonski, K. A., Garcia, M. E.,Johansson, S., Bragg-Gresham, J. L., Wu, Y., van Vliet-Ostaptchouk, J. V., Onland-Moret, N. C., Zimmermann, E., Rivera,N. V., Tanaka, T., Stringham, H. M., Silbernagel, G., Kanoni, S., Feitosa, M. F., Snitker, S., Ruiz, J. R., Metter, J., Larrad, M.T. M., Atalay, M., Hakanen, M., Amin, N., Cavalcanti-Proenca, C., Grøntved, A., Hallmans, G., Jansson, J.-O., Kuusisto, J.,Kahonen, M., Lutsey, P. L., Nolan, J. J., Palla, L., Pedersen, O., Perusse, L., Renstrom, F., Scott, R. A., Shungin, D., Sovio, U.,Tammelin, T. H., Ronnemaa, T., Lakka, T. A., Uusitupa, M., Rios, M. S., Ferrucci, L., Bouchard, C., Meirhaeghe, A., Fu, M.,Walker, M., Borecki, I. B., Dedoussis, G. V., Fritsche, A., Ohlsson, C., Boehnke, M., Bandinelli, S., van Duijn, C. M., Ebrahim,S., Lawlor, D. A., Gudnason, V., Harris, T. B., Sørensen, T. I. A., Mohlke, K. L., Hofman, A., Uitterlinden, A. G., Tuomilehto, J.,Lehtimaki, T., Raitakari, O. T., Isomaa, B., Njølstad, P. R., Florez, J. C., Liu, S., Ness, A., Spector, T. D., Tai, E. S., Froguel, P.,Boeing, H., Laakso, M., Marmot, M., Bergmann, S., Power, C., Khaw, K.-T., Chasman, D., Ridker, P., Hansen, T., Monda,K. L., Illig, T., Jarvelin, M.-R., Wareham, N. J., Hu, F. B., Groop, L. C., Orho-Melander, M., Ekelund, U., Franks, P. W., andLoos, R. J. F. (2011).Physical activity attenuates the influence of FTO variants on obesity risk: a meta-analysis of 218,166 adults and 19,268 children.PLoS medicine, 8(11):e1001116.
Pietro Biroli75

Motivation Replication using FHS
References IIIKline, B. and Tobias, J. L. (2008).The wages of BMI: Bayesian analysis of a skewed treatment-response model with nonparametric endogeneity.Journal of Applied Econometrics, 23(6):767–793.
Mattocks, C., Ness, A. R., Leary, S. D., Tilling, K., Blair, S. N., Shield, J., Deere, K., Saunders, J., Kirkby, J., Davey Smith, G.,Wells, J. C., Wareham, N. J., Reilly, J. J., and Riddoch, C. J. (2008).Use of accelerometers in a large field-based study of children: protocols, design issues, and effects on precision.Journal of physical activity & health, 5 Suppl 1:S98–111.
Ng, M., Fleming, T., Robinson, M., Thomson, B., Graetz, N., Margono, C., Mullany, E. C., Biryukov, S., Abbafati, C., Abera,S. F., Abraham, J. P., Abu-Rmeileh, N. M. E., Achoki, T., AlBuhairan, F. S., Alemu, Z. A., Alfonso, R., Ali, M. K., Ali, R.,Guzman, N. A., Ammar, W., Anwari, P., Banerjee, A., Barquera, S., Basu, S., Bennett, D. A., Bhutta, Z., Blore, J., Cabral, N.,Nonato, I. C., Chang, J.-C., Chowdhury, R., Courville, K. J., Criqui, M. H., Cundiff, D. K., Dabhadkar, K. C., Dandona, L., Davis,A., Dayama, A., Dharmaratne, S. D., Ding, E. L., Durrani, A. M., Esteghamati, A., Farzadfar, F., Fay, D. F. J., Feigin, V. L.,Flaxman, A., Forouzanfar, M. H., Goto, A., Green, M. A., Gupta, R., Hafezi-Nejad, N., Hankey, G. J., Harewood, H. C.,Havmoeller, R., Hay, S., Hernandez, L., Husseini, A., Idrisov, B. T., Ikeda, N., Islami, F., Jahangir, E., Jassal, S. K., Jee, S. H.,Jeffreys, M., Jonas, J. B., Kabagambe, E. K., Khalifa, S. E. A. H., Kengne, A. P., Khader, Y. S., Khang, Y.-H., Kim, D.,Kimokoti, R. W., Kinge, J. M., Kokubo, Y., Kosen, S., Kwan, G., Lai, T., Leinsalu, M., Li, Y., Liang, X., Liu, S., Logroscino, G.,Lotufo, P. A., Lu, Y., Ma, J., Mainoo, N. K., Mensah, G. A., Merriman, T. R., Mokdad, A. H., Moschandreas, J., Naghavi, M.,Naheed, A., Nand, D., Narayan, K. M. V., Nelson, E. L., Neuhouser, M. L., Nisar, M. I., Ohkubo, T., Oti, S. O., Pedroza, A.,Prabhakaran, D., Roy, N., Sampson, U., Seo, H., Sepanlou, S. G., Shibuya, K., Shiri, R., Shiue, I., Singh, G. M., Singh, J. A.,Skirbekk, V., Stapelberg, N. J. C., Sturua, L., Sykes, B. L., Tobias, M., Tran, B. X., Trasande, L., Toyoshima, H., van de Vijver,S., Vasankari, T. J., Veerman, J. L., Velasquez-Melendez, G., Vlassov, V. V., Vollset, S. E., Vos, T., Wang, C., Wang, S. X.,Weiderpass, E., Werdecker, A., Wright, J. L., Yang, Y. C., Yatsuya, H., Yoon, J., Yoon, S.-J., Zhao, Y., Zhou, M., Zhu, S.,Lopez, A. D., Murray, C. J. L., and Gakidou, E. (2014).Global, regional, and national prevalence of overweight and obesity in children and adults during 1980-2013: a systematic analysisfor the Global Burden of Disease Study 2013.Lancet, 384(9945):766–781.
Noel, S. E., Mattocks, C., Emmett, P., Riddoch, C. J., Ness, A. R., and Newby, P. K. (2010).Use of accelerometer data in prediction equations for capturing implausible dietary intakes in adolescents.American Journal of Clinical Nutrition, 92(6):1436–1445.
Pietro Biroli76

Motivation Replication using FHS
References IV
Olszewski, P. K., Fredriksson, R., Olszewska, A. M., Stephansson, O., Alsio, J., Radomska, K. J., Levine, A. S., and Schioth,H. B. (2009).Hypothalamic FTO is associated with the regulation of energy intake not feeding reward.BMC neuroscience, 10:129.
Smemo, S., Tena, J. J., Kim, K.-H., Gamazon, E. R., Sakabe, N. J., Gomez-Marın, C., Aneas, I., Credidio, F. L., Sobreira, D. R.,Wasserman, N. F., Lee, J. H., Puviindran, V., Tam, D., Shen, M., Son, J. E., Vakili, N. A., Sung, H.-K., Naranjo, S., Acemel,R. D., Manzanares, M., Nagy, A., Cox, N. J., Hui, C.-C., Gomez-Skarmeta, J. L., and Nobrega, M. A. (2014).Obesity-associated variants within FTO form long-range functional connections with IRX3.Nature.
Speakman, J. R., Rance, K. A., and Johnstone, A. M. (2008).Polymorphisms of the FTO gene are associated with variation in energy intake, but not energy expenditure.Obesity, 16(8):1961–5.
Timpson, N. J., Emmett, P. M., Frayling, T. M., Rogers, I. S., Hattersley, A. T., McCarthy, M. I., and Davey Smith, G. (2008).The fat mass- and obesity-associated locus and dietary intake in children.The American Journal of Clinical Nutrition, 88(4):971–8.
Wardle, J., Carnell, S., Haworth, C. M. A., Farooqi, I. S., O’Rahilly, S., and Plomin, R. (2008).Obesity associated genetic variation in FTO is associated with diminished satiety.The Journal of clinical endocrinology and metabolism, 93(9):3640–3.
Zhang, X., Qi, Q., Zhang, C., Smith, S. R., Hu, F. B., Sacks, F. M., Bray, G. A., and Qi, L. (2012).FTO genotype and 2-year change in body composition and fat distribution in response to weight-loss diets: the POUNDS LOSTTrial.Diabetes, 61(11):3005–11.
Pietro Biroli77

Motivation Replication using FHS
Decomposition of the Genetic Effect
Decompose the overall effect in difference in parameters anddifference in inputs (Oaxaca 1973):BMIg = W gαg
⇒ BMIA − BMIT︸ ︷︷ ︸∆ BMI
= W T (αA − αT )︸ ︷︷ ︸∆ parameters
+ (W A −W T )αA︸ ︷︷ ︸∆ inputs
Difference in Parameters: 35.4% [26%,39%] → productivityDifference in Inputs: 64.6% [47%,72%] → preferneces
Pietro Biroli78


![Genetic Variation Suggests Interaction between Cold ... · Genetic Variation Suggests Interaction between Cold Acclimation and Metabolic Regulation of Leaf Senescence1[W][OA] Ce´line](https://img.pdfslide.net/doc/110x75/5af4516b7f8b9a5b1e8c57a8/genetic-variation-suggests-interaction-between-cold-variation-suggests-interaction.jpg)