Embed Size (px)
Citation preview
Pacific Science, vol. 68, no. 2 October 24, 2013 (Early view)
Genetic diversity and population structure of
pronghorn spiny lobster Panulirus penicillatus in the Pacific region
By Muhamad Fadry Abdullah*, Seinen Chow, Mitsuo Sakai,
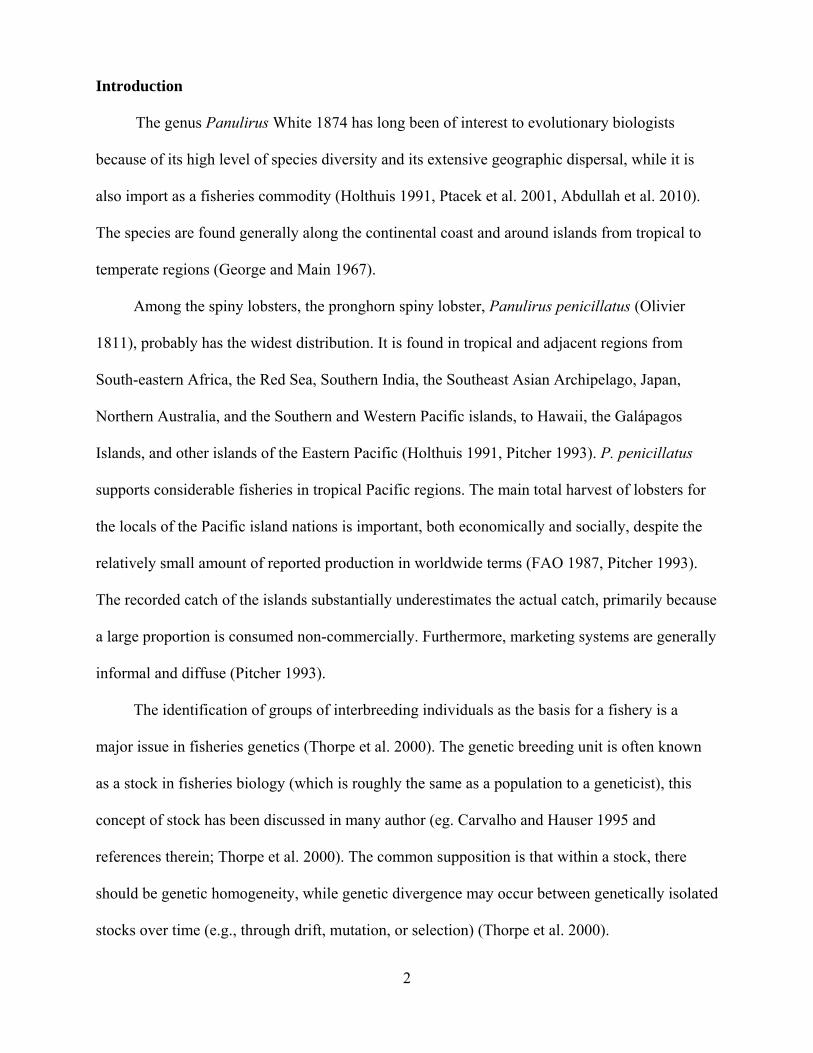
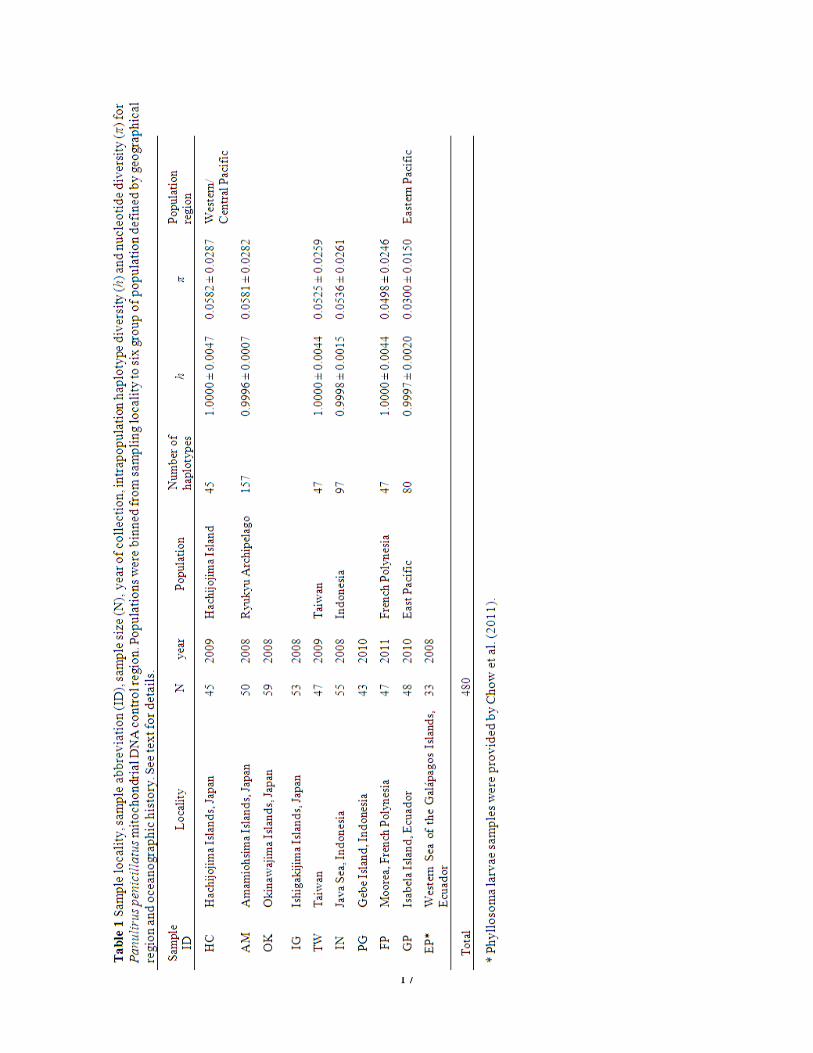
Jin-Hua Cheng and Hideyuki Imai Abstract Adult specimens of Panulirus penicillatus were collected from localities distributed in Japan: Hachijojima Island, Ryukyu Archipelago (Amamioshima, Okinawajima, Ishigakijima); Taiwan: Taitung; Indonesia: Java Sea and Gebe Island; French Polynesia: Moorea Island; and Ecuador: Isabela Island. Phyllosoma larvae specimens were collected from the Western Sea of the Galápagos Islands. In total, 569-570 nucleotide sequences were analyzed from the mtDNA control region. Almost all individuals had a unique haplotype. Intrapopulation haplotype (h) and nucleotide (π) diversities were high for each locality, ranging from h = 0.9996–1.0000 and π = 0.0255–0.0448. A mismatch distribution of pairwise differences between haplotypes indicated that P. penicillatus does not fit the sudden population expansion model. Analysis of molecular variance (AMOVA) shows a clear genetic difference between two regions (Western/Central Pacific and Eastern Pacific). High gene flow was found within localities in Western/Central Pacific region, probably resulting from an extended planktonic larval stage and prevailing ocean currents. The present study detected genetic structure between Eastern Pacific populations and Western Pacific populations, indicating that despite the nearly 1-year larval period for this species, larvae generally do not pass over the East Pacific Barrier. *Corresponding Author E-mail: [email protected]
2
Introduction
The genus Panulirus White 1874 has long been of interest to evolutionary biologists
because of its high level of species diversity and its extensive geographic dispersal, while it is
also import as a fisheries commodity (Holthuis 1991, Ptacek et al. 2001, Abdullah et al. 2010).
The species are found generally along the continental coast and around islands from tropical to
temperate regions (George and Main 1967).
Among the spiny lobsters, the pronghorn spiny lobster, Panulirus penicillatus (Olivier
1811), probably has the widest distribution. It is found in tropical and adjacent regions from
South-eastern Africa, the Red Sea, Southern India, the Southeast Asian Archipelago, Japan,
Northern Australia, and the Southern and Western Pacific islands, to Hawaii, the Galápagos
Islands, and other islands of the Eastern Pacific (Holthuis 1991, Pitcher 1993). P. penicillatus
supports considerable fisheries in tropical Pacific regions. The main total harvest of lobsters for
the locals of the Pacific island nations is important, both economically and socially, despite the
relatively small amount of reported production in worldwide terms (FAO 1987, Pitcher 1993).
The recorded catch of the islands substantially underestimates the actual catch, primarily because
a large proportion is consumed non-commercially. Furthermore, marketing systems are generally
informal and diffuse (Pitcher 1993).
The identification of groups of interbreeding individuals as the basis for a fishery is a
major issue in fisheries genetics (Thorpe et al. 2000). The genetic breeding unit is often known
as a stock in fisheries biology (which is roughly the same as a population to a geneticist), this
concept of stock has been discussed in many author (eg. Carvalho and Hauser 1995 and
references therein; Thorpe et al. 2000). The common supposition is that within a stock, there
should be genetic homogeneity, while genetic divergence may occur between genetically isolated
stocks over time (e.g., through drift, mutation, or selection) (Thorpe et al. 2000).
3
The assumptions that P. penicillatus phyllosoma larvae distribute widely and that
unexploited stocks offer a protected supply for breeding stock recruitment should be evaluated
before fisheries around most of the Pacific nations become fully developed. These apparently
reasonable assumptions underlie existing knowledge about the robustness of the actual Pacific
P. penicillatus stocks. The degree of certainty in these assumptions may differ across the region
(Prescott 1988, Pitcher 1993) owing to the distance from and wide variety of adjacent reefs, and
the intensity of fishing in an area.
The early life history of spiny lobsters consists of a drifting larval period adapted for a
relatively long-term stay in the open ocean, extending from several months to more than a year,
with many possibilities for dispersal through ocean currents (Booth and Phillips 1994, Tolley et
al. 2005). Much of the recent literature has focused on the role of the pelagic larval duration in
determining realized dispersal distances and has resulted in mixed conclusions (Shanks et al.
2003, Bowen et al. 2006, Shanks 2009, Weersing and Toonen 2009, Riginos et al. 2011, Treml et
al. 2012). For example, pelagic larval duration has been shown to be a strong predictor of
dispersal distances (Shanks et al. 2003), but Weersing and Toonen (2009) suggested that general
acceptance of pelagic larval duration as a reliable predictor of population connectivity across
broad taxonomic lines is clearly unfounded. Indeed, pelagic larval duration was significantly
correlated with dispersal distance, but there were many exceptions, larval behavior can play a
crucial role in determining dispersal distance (Shank 2009), type of eggs and life-history
parameters are also significant predictors of connectivity in fishes (Bradbury et al.2008, Riginos
et al. 2011). Oceanographic currents are likely to create barriers and impact routes and directions
of larval dispersal (Baums et al. 2006, Treml et al. 2008, Riginos et al 2011).
The duration of the planktonic larval phase (phyllosoma) of P. penicillatus has been
reported previously, based on field and laboratory studies. Using field-caught plankton samples,
4
Johnson (1968) estimated the duration of the phyllosoma stage in natural condition to be >7–8
months. Minagawa (1990) cultured phyllosoma of P. penicillatus under laboratory conditions
and described the phases from hatching up to the mid-stages (reared for 160 days). The complete
larval development of P. penicillatus in culture was subsequently documented by Matsuda et al.
(2006), who reported a duration of 8.3–9.4 months for phyllosome larvae in culture.
Several molecular techniques, including allozymes, restriction fragment length
polymorphism (RFLP), mitochondrial DNA sequencing, and microsatellites, have been used in
studying genetic variability in marine organisms at the population level (Shaklee and Bentzen
1998, Diniz et al. 2005). Mitochondrial DNA sequencing, particularly of the most rapidly
evolving and highly variable control region, has been a useful tool for population genetic studies
of many terrestrial and aquatic organisms (Avise 1994). The control region, which includes the
D-loop in vertebrates and is known as the AT-rich region in invertebrates, does not encode a
functional protein and is therefore under fewer functional and structural constraints, resulting in a
high average substitution rate (Saccone et al. 1987, Diniz et al. 2005). As it is generally the
fastest evolving region in the mitochondrial DNA of vertebrates and invertebrates, the control
region is more sensitive than protein loci as a marker of phylogeographic structuring for many
organisms (Avise 2000, Diniz et al. 2005).
Identification of phyllosoma of P. penicillatus from the Western Pacific has been reported
previously (Chow et al. 2006a, b). Further sequence analysis of cytochrome oxidase I and 16S
rDNA from a Pacific population of P. penicillatus indicated two distinct sub-populations
between the Eastern and Western/Central Pacific; however, population analyses within the
Western/Central Pacific and within the Eastern Pacific were not possible because of the low
variability in the markers and the small number of samples (Chow et al. 2011).
5
In this study, we analysed the highly polymorphic marker, mitochondrial DNA (mtDNA)
control region of P. penicillatus to determine whether genetic structure could be detected in
Pacific Ocean populations. Information regarding the contemporary population genetic structure
combined with information on the life history of the species and the oceanographic history of the
Pacific Ocean were used to infer larval distribution patterns and recent evolutionary history.
Given the economic importance of P. penicillatus, this genetic information may be valuable for
long-term fisheries management decisions.
Materials and Methods
Lobster Samples
Adults of Panulirus penicillatus were collected from nine localities (Table 1) throughout
the Western/Central Pacific and Eastern Pacific Ocean (Fig. 1). Lobsters were purchased from
local commercial fishers and fully complied with local fisheries management and marine
protected area controls. Tissues samples from walking legs (pereiopods) or abdomen were
dissected on site, immediately fixed in 70-99% ethanol, and transferred to the laboratory.
Phyllosoma larvae samples of P. penicillatus from the Western Sea of the Galápagos Islands of
the East Pacific Ocean were provided by Chow et al. (2011).
DNA Analysis
About 50 mg of finely minced tissue sample was added to a 1.5 mL plastic test tube
containing 0.5 mL TNES-8 M urea buffer (Asahida et al. 1996). After adding 10 μL
proteinase K, it was incubated at 38ºC for 3 hours and then genomic DNA was extracted using
phenol-chloroform procedure and precipitated with absolute ethanol according method described
in Imai et al. (2004). The mtDNA control region was amplified using the polymerase chain
reaction (PCR). Primers were designed manually specifically for Panulirus penicillatus
6
(alignment of primer sequences against the Japanese spiny lobster Panulirus japonicus, DDBJ
accession number: AB071201). Several amplification attempts using the Panulirus12s primer
(5′-TATAGCAAGAATCAAACTATAG), in the 12S ribosomal RNA gene, and the Panulirus-
tRNA primer (5′-CATAGACGGGGTATGAGCCCGT), in the tRNAmet gene, were
unsuccessful. Thus, a new reverse primer, Penicillatus-R
(5′-CATAGG(T/C)GTG(T/C)GAGGGAACAAAGTC), was based on the conservative
nucleotide sequence of P. penicillatus obtained with primers Panulirus12s and Panulirus-tRNA.
Primers Panulirus12s and Penicillatus-R were used for sequencing. PCR amplifications were
performed in 50 μL reaction mixtures containing 1 μL template DNA, 12.5 pmol of each primer,
5 μL 10X Ex Taq reaction buffer, 5 μL dNTP mixture, and 2.5 unit Ex Taq Polymerase (Takara
Bio Ltd); the final volume of the reaction mixture was adjusted to 50 μL with sterile water.
Reactions were performed in a thermal cycler (Perkin Elmer GeneAmp PCR System 9700) under
conditions of an initial denaturation step at 94°C for 2 min, followed by 30 cycles of 30 s at
95°C, 30 s at 50°C, and 1 min at 72°C, with a final 7-min extension at 72°C. PCR products were
purified using a PCR Product Pre-sequencing kit (Exosap; USB Co.). The cleaned products were
sequenced on an ABI 3730xl Genetic Analyzer (Applied Biosystems) using a Big Dye
Terminator Cycle Sequencing kit (ver. 3.1; Applied Biosystems).
Genetic Data and Analyses
The nucleotide sequence data reported in this paper appear in the DDBJ/EMBL/GenBank
nucleotide sequence databases with the accession numbers AB689204–AB689672. Sequence
data were aligned using ClustalX (Thompson et al. 1997) with default alignment parameters and
were checked manually for misalignments. The nucleotide compositions and numbers of variable
sites were assessed with MEGA5 (Tamura et al. 2011). Haplotype and nucleotide diversity for
each location were estimated using Arlequin (ver. 3.5) software (Excoffier et al. 2005). We ran
7
preliminary analysis on each data set using analysis of molecular variance (AMOVA) in
Arlequin (ver. 3.5) to measure standard diversity indices and pairwise FST (using haplotype
frequency only) and ΦST (using genetic distance). ΦST was estimated using a Tamura-Nei (1993)
distance method with a gamma correction (α = 0.27) as determined by best nucleotide
substitution models in MEGA5 (Tamura et al. 2011). The statistical significance of FST and ΦST
value was tested by 1000 permutation. In addition, several groupings were tested with SAMOVA
(ver. 1.0) (Dupanloup et al. 2002), an annealing procedure to define clusters of adjacent
populations that maximize the proportion of genetic variance due to differences between groups
(FCT), considering the geography of a region and oceanographic patterns. Due to ΦST being
relatively unaffected by high allelic diversity, unlike FST (Bird et al. 2011), we only report ΦST
values. A neighbour-joining tree (Saitou and Nei 1987) based on ΦST values was constructed
using Neighbor in Phylip (ver. 3.68) (Felsenstein 2004). The median-joining network (Bandelt et
al. 1999) for the haplotypes was estimated using Network (ver 4.611) (http://www.fluxus-
engineering.com).
Mismatch distribution differences were estimated to review historical demography. The
shape of the mismatch distribution is relevant because it may be used to deduce whether a
population is undergoing sudden population expansion or is in equilibrium (Rogers and
Harpending 1992). Generally, chaotic and multimodal distributions suggest a population of
constant size, whereas unimodal distributions reflect a population that has experienced a sudden
demographic expansion. Parameters of the model of sudden expansion (τ, θ0, θ1) and mismatch
distribution differences were estimated using Arlequin (ver. 3.5). Goodness-of-fit test was
computed using Arlequin (ver. 3.5), calculated based on the sum of squared deviations (SSD)
between observed and expected distribution under the sudden expansion, with the P-value
representing the probability of obtaining a simulated SSD equal to or larger than the observed

8
one (Schneider and Excoffier 1999). Tajima’s test of neutrality (Tajima 1989) was estimated
using Arlequin (ver. 3.5), Tajima’s D test are commonly used to test neutrality; however, they
can also be used to examine population growth because population expansion may result in
rejection of the null hypothesis of neutrality (significant negative D-value).
9
Results
Genetic diversity
In total, sequence data of 569 bp (Western/Central Pacific region samples) and 570 bp
(Eastern Pacific region samples) were obtained from 480 specimens of P. penicillatus. Of the
571 aligned base pairs, 326 variable sites (excluding indels) were found: 246 were parsimony
informative and 81 were singletons. In total, 469 haplotypes were identified, and nearly all
sequenced individuals had a unique haplotype (Table 1).
The nucleotide sequences of the haplotypes were deposited in the DNA Data Bank of Japan
(DDBJ) under accession numbers AB689204–AB689672.
The average nucleotide composition of the control region was 38.1% adenine, 31.6%
thymine, 19.3% cytosine, and 11% guanine, consistent with previous reports of an AT-rich
control region of the mitochondrial genome in many invertebrates, including crustaceans
(McMillen-Jackson and Bert 2004, Diniz et. al. 2005). Haplotype diversity (h) within the
geographical populations was high, ranging from 0.9996 in the Ryukyu Archipelago to 1.0000 in
Hachijojima Island, Taiwan, and French Polynesia. Nucleotide diversity (π) was generally high,
ranging from 0.0300 in the East Pacific to 0.0582 in Hachijojima Island (Table 1). Four of the
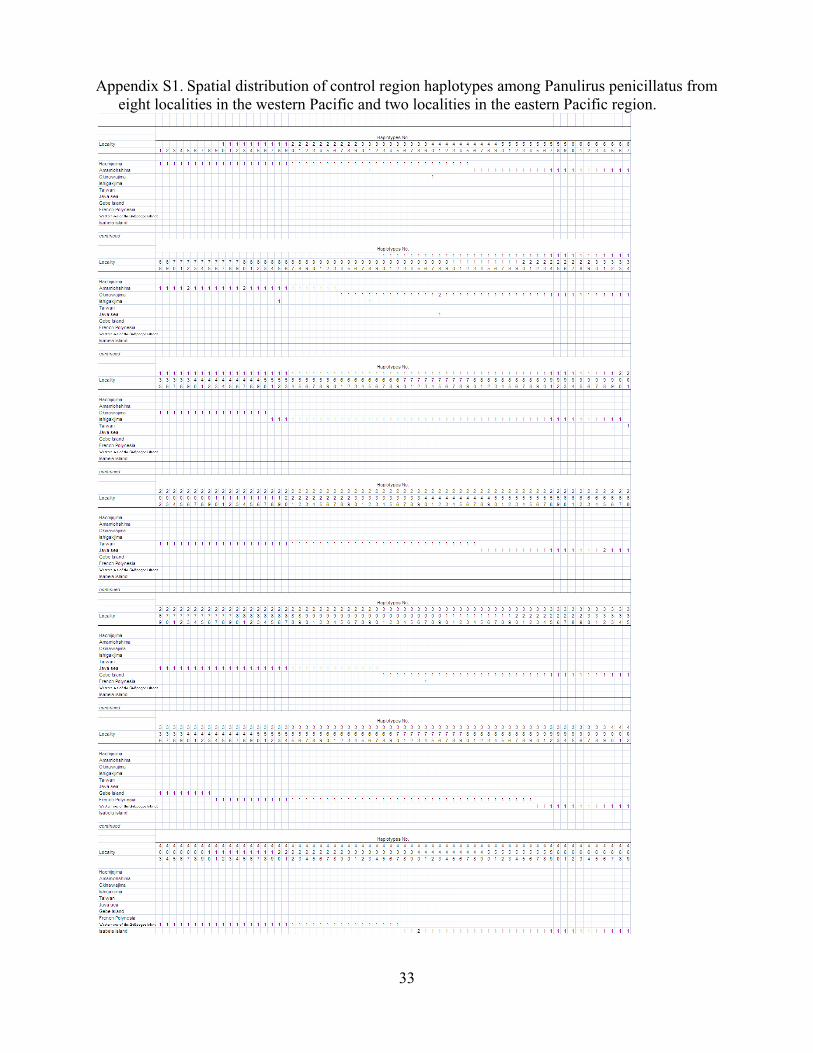
shared haplotypes were represented at two geographical sites, while the other two were shared
only between individuals restricted to the same geographical site (Supplementary Appendix S1,
available online).
Structure of the pronghorn spiny lobster population Individuals were binned into six groups of populations defined by geographical region and
oceanographic history (i.e., exposure to currents): Hachijojima Island (n = 45); Amamiohshima,
Okinawajima, and Ishigakijima Island in the Ryukyu archipelago (162); Taiwan (47); Java Sea
and Gebe Island in Indonesia (97); French Polynesia (47); and Isabela Island and phyllosome
larvae from the Western Sea of the Galápagos Islands in the East Pacific (81). Additionally,
10
SAMOVA maximized at two groups, with the Isabela Island and phyllosome larvae from the
Western Sea of the Galápagos Islands in the East Pacific grouped separately from the rest of the
sampling sites, (FCT = 0.76, P < 0.05). An AMOVA based on conventional F-statistics
(haplotype frequency only) failed to detect any population structure, while an AMOVA using the
Tamura-Nei (1993) distance performed on the mtDNA sequence data set revealed a structure in
population. There was no significant population distinction within samples from Western/Central
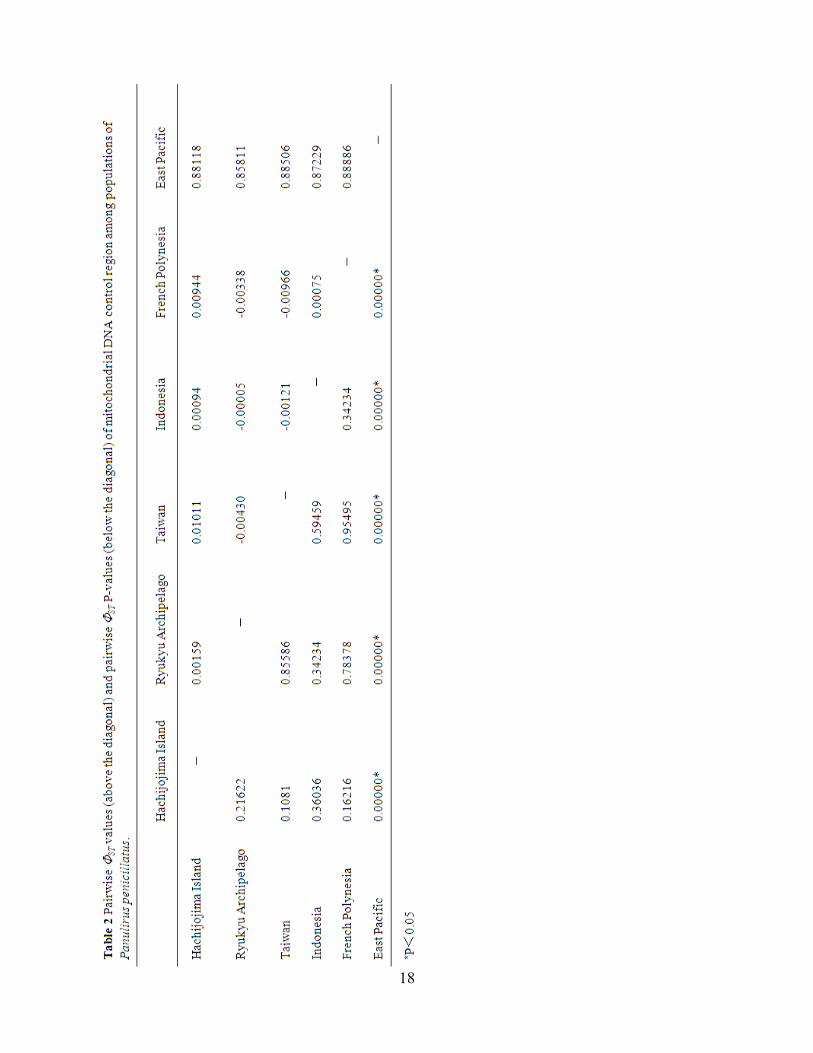
Pacific populations by AMOVA. The Pairwise ΦST among populations were high between
Eastern Pacific and Western/Central Pacific population (0.858–0.889) (Table 2). Congruent with
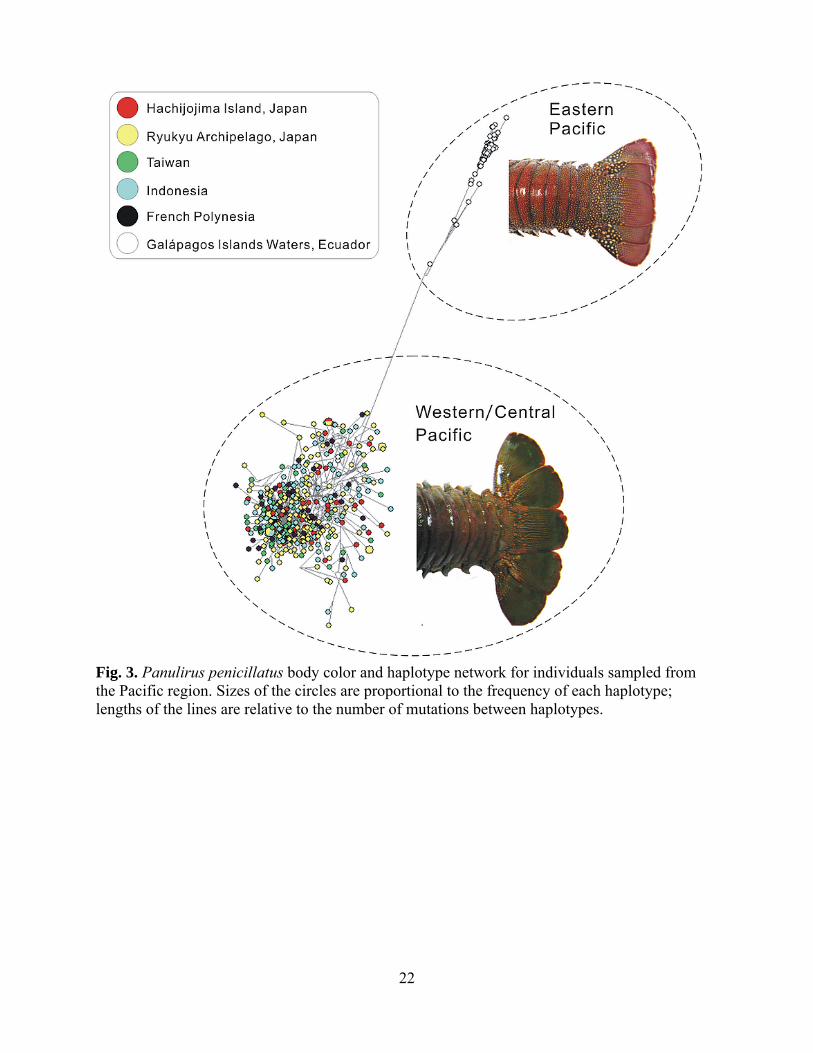
the pattern observed in the network haplotypes (Fig.3), we found strong regional structuring
between Eastern and Western/Central Pacific populations of P.penicillatus, which explained
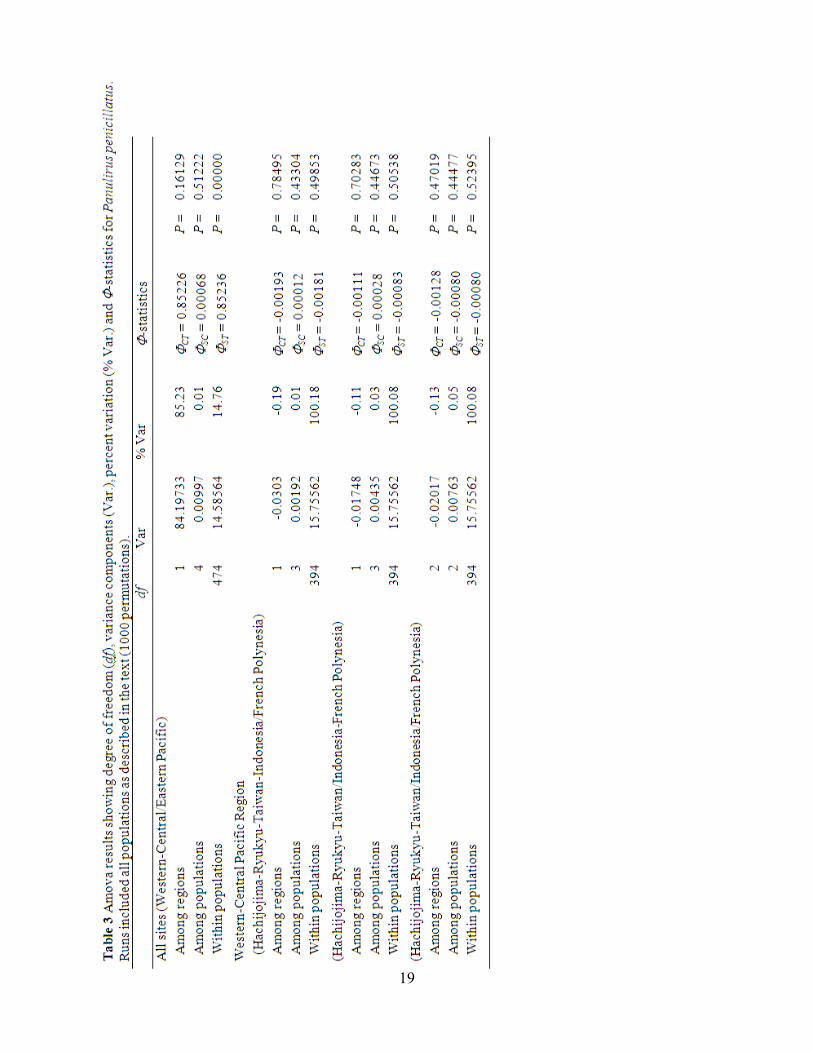
most genetic variations (85%) between the regions. To analyze the sub-structure in the
Western/Central Pacific area we attempted three types of regional grouping: (1) Hachijojima-
Ryukyu-Taiwan-Indonesia and French Polynesia, (2) Hachijojima-Ryukyu-Taiwan and
Indonesia-French Polynesia, and (3) Hachijojima-Ryukyu-Taiwan, Indonesia, and French
Polynesia. Regarding these groupings, genetic variation and ΦST among population was small
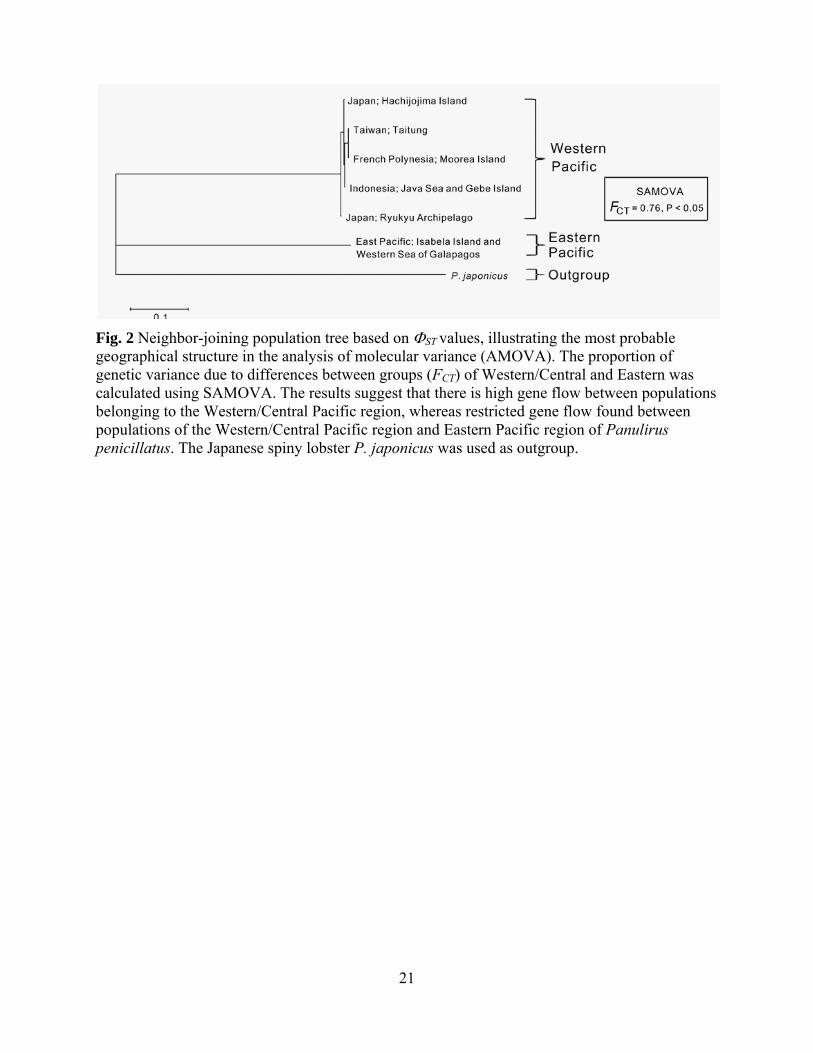
(%var -0.19 to -0.11) and did not significantly differ from 0 (Table 3). A neighbour-joining tree
based on ΦST values showed a prominent genetic break between Western/Central Pacific and
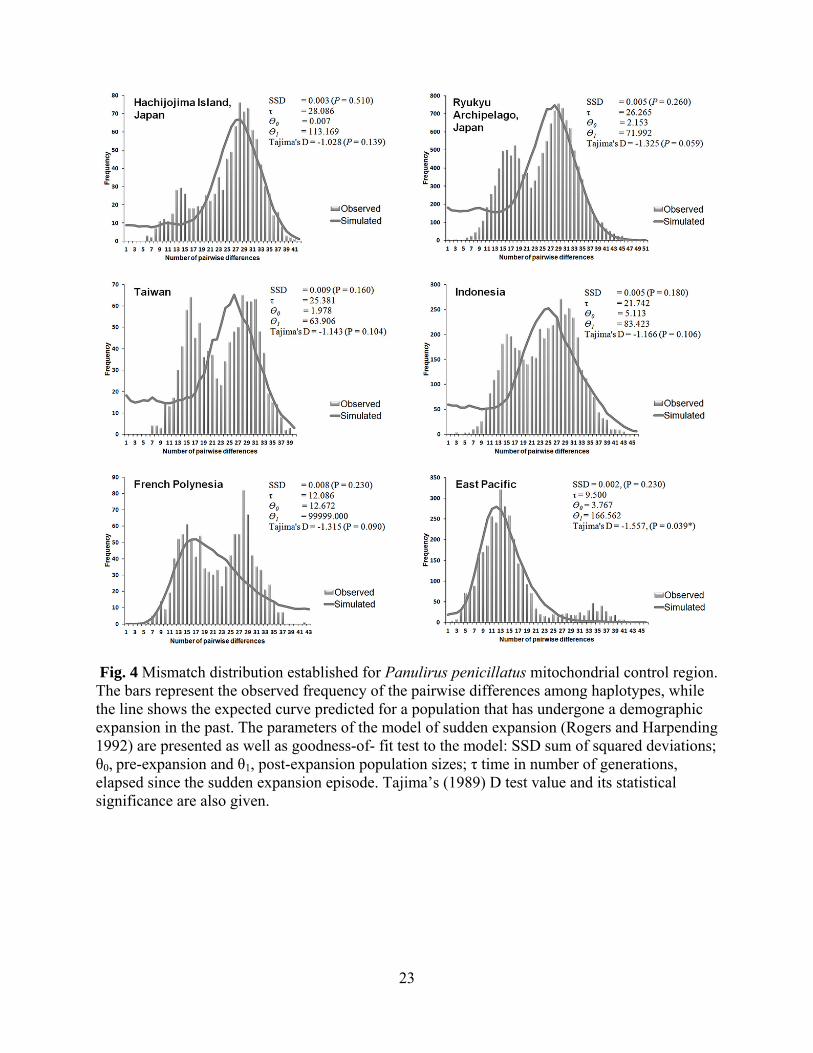
Eastern Pacific populations (Fig.2). Based on the goodness-of-fit test, P. penicillatus could be
fitted to an expansion model (all the population has P > 0.05) (Fig.4). However, this method is
quite conservative, rarely rejecting the expansion model (Schneider and Excoffier 1999). Indeed,
visual inspection of the mismatch distributions suggested a multimodal profile, as is typical of
demographically stable populations (Rogers and Harpending 1992). The mismatch distribution
for the entire sample deviated significantly from the expected distribution under a sudden
expansion model. This outcome is supported by a lack of significance with Tajima’s D test,
11
except for Eastern Pacific samples, where Tajima’s test showed significant negative values (D
=-1.557, P = 0.039). Appropriate dating of population expansions was not possible because
mutation rates for the mtDNA control region in this species have not been estimated.
Considering this, the mutation rate was calculated according to Babbucci et al. (2010), ranging
between 8.1-13.4% per MYR were applied to the model T = τ/2u (Rogers and Harpending 1992),
where T = time since expansion, 2u = μ x number bases sequenced x generation time (3 yr
generation). A rough estimation suggested that population expansions occurred in the late
Pleistocene: 52,000 to 200,000 years ago for Western/Central Pacific P. penicillatus, and 41,000
to 68,000 years ago for the Eastern Pacific
Discussion
Mitochondrial DNA (mtDNA) has been widely used for studies of genetic differentiation
in the spiny lobster genus Panulirus. Genetic differences were not detected between samples of
P. japonicus along the Japanese coast, supporting the hypothesis that benthic individuals of P.
japonicus are sustained from a common pool of long-period phyllosoma larvae through long-
distance larval transport within the Kuroshio Subgyre (Inoue et al. 2007). High genetic
variability of the blue spiny lobster, P. inflatus, along the Pacific coast of Mexico has been
observed. Furthermore, it has been suggested that the lack of variation in genetic structure is
related to oceanographic flows in the area, coupled with a long larval period (García-Rodríguez
and Perez-Enriquez 2008). A high level of divergence was also observed between Brazilian and
Western Atlantic populations of P. argus, and this genetic distinction may have arisen due to the
pattern of the South Equatorial current in the area (Sarver et al. 1998, Diniz et al. 2005).
Water movement patterns have also been suggested to influence the genetic population
structures of other crustaceans. In the red rock lobster, Jasus edwardsii, which occurs in
Southern Australia and New Zealand, mtDNA assessment failed to detect genetic subdivisions of
12
populations spanning 4500 km of its range (Ovenden et al. 1992). The currents leaving Southern
Australia and flowing past New Zealand may transport larvae masses. However, in the green
rock lobster, Sagmariasus verreauxi (J. verreauxi; secondary synonym), genetic distinctions
were detected between Australian and New Zealand populations, using mtDNA (Brasher et al.
1992, Chan 2010). Previous study of P. penicillatus using analysis of COI and 16s rDNA found
two distinct subpopulations between Eastern and Western/Central pacific (Chow et al. 2011).
However, population analyses within the Western/Central Pacific and within the Eastern Pacific
were not possible due to low variability of markers and small number of samples.
In the present study, the mtDNA control region exhibited high genetic variability(h =
0.9996 to 1.0000 and π = 0.0300 to 0.0581), which are relatively high values compared with the
control region diversities of other Panulirus sp. [P. inflatus: h = 0.957 to 1.0000 and π = 0.019 to
0.028 (García-Rodríguez and Perez-Enriquez 2008); P. argus: h = 0.667 to 1.0000 and π = 0.003
to 0.066 (Diniz et al. 2005)]. The control region is a non-coding region that includes signals
necessary for replication of a molecule and is the most rapidly evolving region of mtDNA
(Heyer et al. 2001). The high genetic variability the control region in P. penicillatus may be
maintained by its large population size. In fact, because nearly all individuals represented a
unique haplotype, an investigation based on sequencing the control region would require a very
large sample size to detect common haplotypes and associate them with particular geographic
areas (García-Rodríguez and Perez-Enriquez 2008). The evolutionary pattern of interhaplotypic
divergence will almost always produce a biogeographic signature, and an analysis that
recognizes genetic distance among alleles will provide additional resolution, especially for
hypervariable markers (Bird et al. 2011).
Significant genetic divergence was found between Eastern and Western/Central Pacific
populations based on polymorphic markers (the control region). Our statistical assignment of
13
genetic heterogeneity among populations found genetic isolation only between P. penicillatus
from the Eastern Pacific and Western/Central Pacific, with no genetic structuring observed
within each region (Table 3). For P. penicillatus differentiation of the Eastern Pacific and
Western/Central Pacific with respect to mtDNA traits may be due to contemporary isolation/gene
flow or prior isolation with recent gene flow, although the overall level of genetic exchange must
be below that required to homogenize the populations.
No population structure was found within the population of P. penicillatus inhabiting the
Western Pacific to the Central Pacific: Hachijojima Island, Ryukyu Archipelago, Taiwan,
Indonesia, and French Polynesia. Genetic similarities were also shown in this region for other
marine organisms such as coral, fish, and starfish (Acanthaster planci) (Rodriguez-Lanetty and
Hoegh-Guldberg 2002, Mukai et al. 2009, Yasuda et al. 2009). Furthermore, another Panulirus
species, P. japonicus, was found to be sustained from a common pool of long-period phyllosoma
larvae through long-distance larval transport within the Kuroshio Subgyre (Inoue et al. 2007).
For P. penicillatus, long larval life (nearly 1 year) of the phyllosoma (Johnson 1968, Booth and
Phillips 1994, Matsuda 2006) coupled with the significant impact of oceanic current systems or
gyres (e.g., the Kuroshio and Equatorial currents) may explain the observed patterns. The
Kuroshio current, a strong western boundary current, flows northeastward and is suspected to
transport larvae along Northwestern Pacific. Furthermore, transportation of larvae between the
Western-Central Pacific more likely occurred indirectly via stepping stones by the Equatorial
Currents, and small amount of larval dispersal over years might result in genetic homogeneity.
Unfortunately, population analysis within Eastern Pacific could not be done due to having only
two locations in this study.
Predicting connectivity of marine populations is extremely difficult due to the unknown
and variable biology of larvae, the complex physical environment, and the inherent difficulties in
14
considering the range in spatial and temporal scales covered by larval dispersal (Werner et al.
2007, Botsford et al. 2009, Treml 2012). Currently, biophysical modeling approaches have been
used to understand the spatial patterns in connectivity by integrating seascape data with a
species’ life-history characteristics (Treml et al. 2008, White et al. 2010, Kool et al. 2011).
Biophysical studies demonstrate how complex oceanographic information can be used to provide
insight into the evolution of genetic structure in marine environments. (Kool et al. 2011).
The pronghorn spiny lobster, P. penicillatus, has been reported to be commercially
abundant in the Eastern Pacific, particularly the Galápagos Islands (Holthuis and Loesch 1967,
George and Main 1967). P. penicillatus represents more than 75% of the annual spiny lobster
catch in the Galápagos Islands which in recent years has shown indications of decline in
abundance (Hearn and Murillo 2008). The phyllosoma larvae of P. penicillatus have been found
throughout the tropical Eastern Pacific some 3,500–4,000 km west of the nearest likely source
(the Galápagos Islands); this suggests the apparent crossing of the East Pacific Barrier, a vast
stretch of open ocean that divides the majority of Pacific islands from those to the east and
corresponds to a major break in faunal composition (Ekman 1953, Johnson 1974, Pitcher 1993).
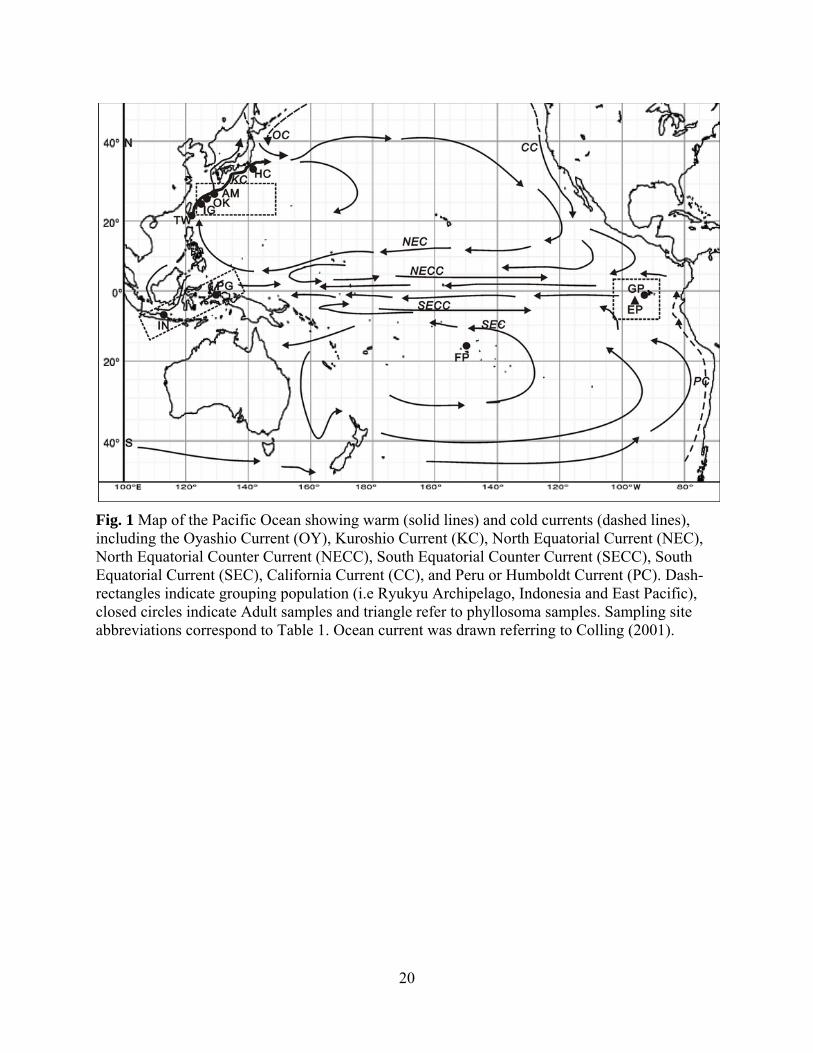
Johnson (1974) also indicated that the counter currents within the Equatorial Current System
(Fig. 1) could provide possible routes for the return of Eastern Pacific species that have either
fortuitously or instinctively shifted into counter currents, possibly through habits of diurnal
migrations, and that have not drifted westward to a point of no return, determined by
requirements inherent in their life cycle. The present study detected genetic structure between
Eastern Pacific population and Western/Central Pacific populations, indicating that despite the
nearly 1-year larval period for this species (e.g., Booth and Phillips 1994, George 2005), could
the larvae generally not pass over the East Pacific Barrier, or they could regularly cross this
barrier but fail to survive in appreciable number in other region due to some selective advantage
15
of local recruits and habitat preferences. The absence of intermediate ‘steppingstones’— areas of
available adult habitat that provide generational layovers between the end of one dispersal event
and the beginning of another population can represent a significant barrier to dispersal and gene
flow (Crandall et al. 2012). More importantly, the lack of shared mtDNA haplotypes and large
ΦST values suggest that there has been prolonged historical isolation between the
Western/Central Pacific and Eastern Pacific populations.
Further analysis on recruitment of P. penicillatus phyllosoma larvae may be necessary
since genetic distinction in Eastern Pacific populations may indicate the potential self-
recruitment of phyllosoma larvae in this region. Although phyllosoma larvae are weak
swimmers, they have the ability to maintain their vertical position in the water column (Johnson
1974). Larval dispersal for spiny lobsters has been previously modelled. Griffin et al. (2001)
discovered that P. cygnus was a self-recruiting species, restricted to Western Australia. A more
recent simulation study of P. argus found the average dispersal of P. argus in the Caribbean Sea
to be possibly only 200-400 km, suggesting that larval behaviour such as vertical migration,
together with a retentive oceanographic environment, may increase the potential for self-
recruitment (Butler 2011).
Adult P. penicillatus show variations in body colour, including yellow-green, brown-green,
blue-black, and dark reddish-brown (Holthuis 1991, George 2006). The dark reddish-brown form
is regionally limited to the Eastern Pacific, within the Galápagos, Clipperton, Socorro, and
Revillagigedo Islands, where it is known as the ‘red lobster’ (Holthuis and Loesch 1967,
Holthuis 1991, George 2006). It is probably restricted to the Eastern Pacific owing to equatorial
currents. Consistent with previous findings, we identified morphological variability in the body
colour of P. penicillatus species: Eastern Pacific populations had a reddish body and
Western/Central Pacific populations had a greenish body (Fig. 3). George (2006) proposed that

16
the genetic distinctions for subpopulations of P. penicillatus from the Eastern Pacific, referred as
P. penicillatus red, could be explained by assuming that the East Pacific Barrier of Ekman
(1953) represents a significant barrier that maintains the isolation of these subpopulations.
However, further research is recommended to clearly establish the correlation in the variation of
morphological body colour in this species.
Historical demographic parameters of P. penicillatus from Western/Central Pacific
populations reveal a more stable population history, compared with populations from the Eastern
Pacific. . The expansion of the P. penicillatus population was estimated to have occurred 52,000
to 200,000 years ago for Western/Central Pacific and 41,000 to 68,000 years ago for the Eastern
Pacific during the Pleistocene. The late Pleistocene Period (the past one million years) was
punctuated by a series of large glacial and interglacial changes (Imbrie et al. 1992).
The pattern of mismatch distributions of P. penicillatus differed between Western/Central
Pacific and Eastern Pacific regions, and the expansion age parameter (τ) was lower in the Eastern
Pacific region. Those tendencies may results from higher diversity and size of the population in
the Western/Central Pacific, which could maintain diversity as a metapopulation, while the
Eastern Pacific population is smaller and probably more recent in origin.
Acknowledgments
We are grateful to Dr. Serge Planes, Dr. David Lecchini, Ms. Héloïse Rouzé, Mr. Teva Lechat and colleague (Centre de Recherches Insulaires et Observatoire de l’Environnement de Polynésie Française, CRIOBE, Moorea, French Polynesia) for their invaluable support during spiny lobster sampling at French Polynesia. We also grateful to Mr. Hiroji Ueki (Electromarina Cia. Ltda., Equador), Isoyabussan Ltd. and Mr. Radi Ihlas Albani (Seaweed Culture Program, Gebe, Indonesia) for collecting the spiny lobsters at Isabela Island, Ecuador, Java sea and Gebe Island, Indonesia respectively. We would like to thank Mr. Hiroshi Inoue and Mr. Kensuke Iwamoto (University of the Ryukyus, Japan) for help on lobster sampling at Okinawajima Island. We are also grateful to Dr. Hideo Sekiguchi (Mie University, Japan) for providing a reference. This study was supported in part by grants from the University of the Ryukyus Grants for International Research, the Sasagawa Scientific Research Grant from the Japan Science Society and grant for the Elucidation of ”the Life History and Genetic Population Structure for Important Fisheries Fishes” from Okinawa Prefectural Government.
17
18
19
20
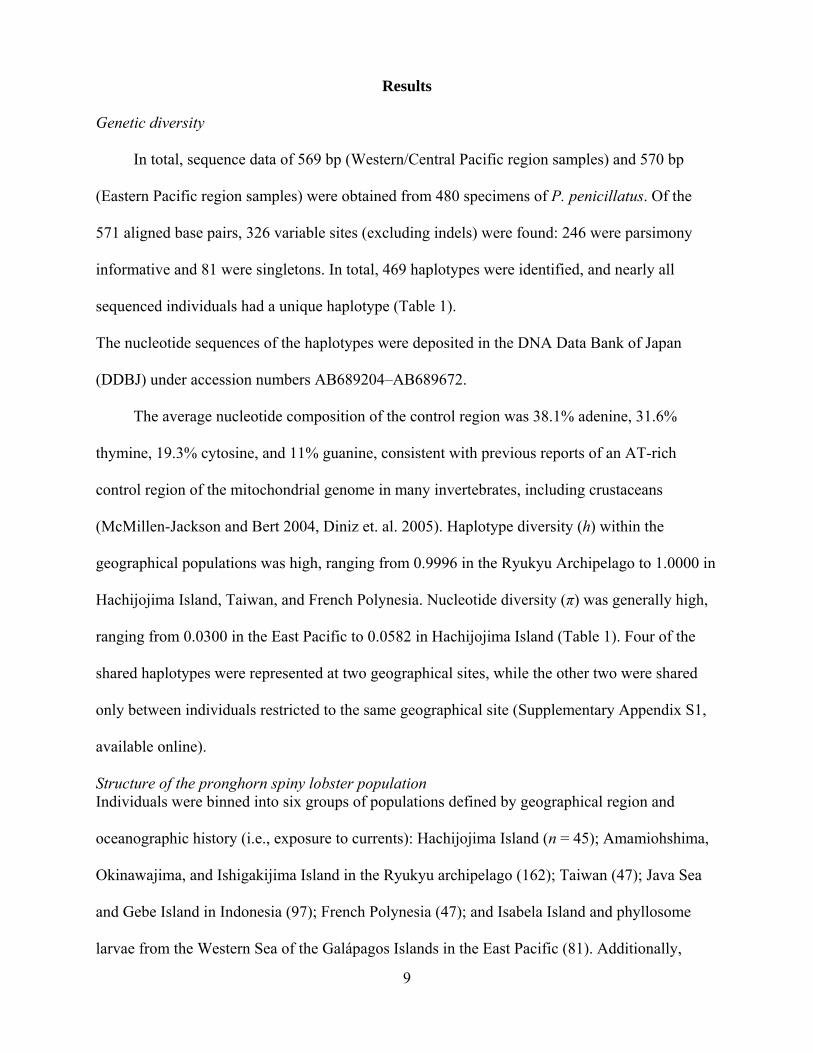
Fig. 1 Map of the Pacific Ocean showing warm (solid lines) and cold currents (dashed lines), including the Oyashio Current (OY), Kuroshio Current (KC), North Equatorial Current (NEC), North Equatorial Counter Current (NECC), South Equatorial Counter Current (SECC), South Equatorial Current (SEC), California Current (CC), and Peru or Humboldt Current (PC). Dash-rectangles indicate grouping population (i.e Ryukyu Archipelago, Indonesia and East Pacific), closed circles indicate Adult samples and triangle refer to phyllosoma samples. Sampling site abbreviations correspond to Table 1. Ocean current was drawn referring to Colling (2001).
21
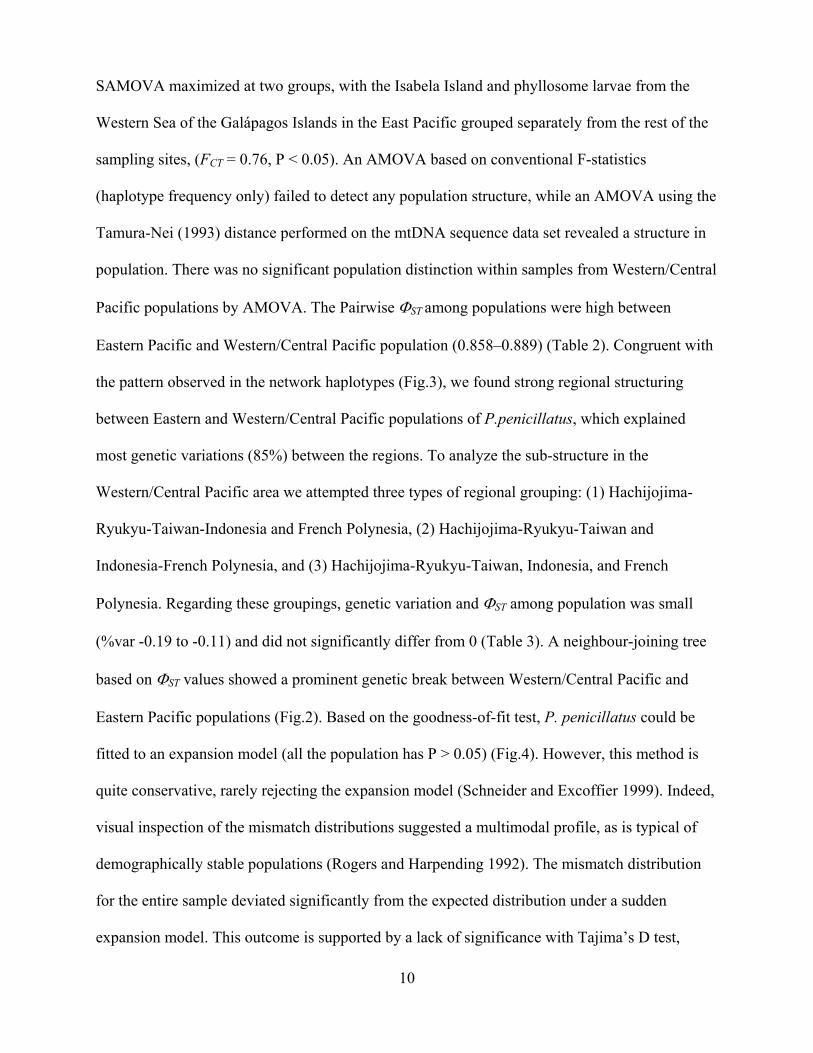
Fig. 2 Neighbor-joining population tree based on ΦST values, illustrating the most probable geographical structure in the analysis of molecular variance (AMOVA). The proportion of genetic variance due to differences between groups (FCT) of Western/Central and Eastern was calculated using SAMOVA. The results suggest that there is high gene flow between populations belonging to the Western/Central Pacific region, whereas restricted gene flow found between populations of the Western/Central Pacific region and Eastern Pacific region of Panulirus penicillatus. The Japanese spiny lobster P. japonicus was used as outgroup.
22
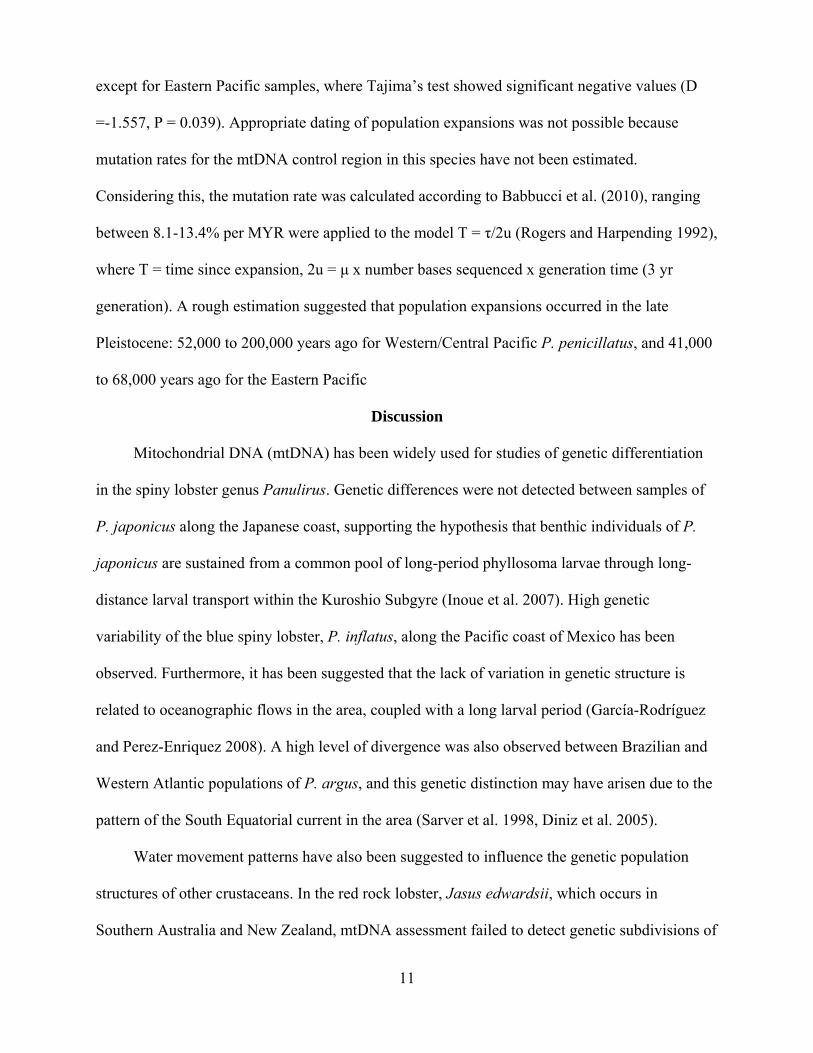
Fig. 3. Panulirus penicillatus body color and haplotype network for individuals sampled from the Pacific region. Sizes of the circles are proportional to the frequency of each haplotype; lengths of the lines are relative to the number of mutations between haplotypes.
23
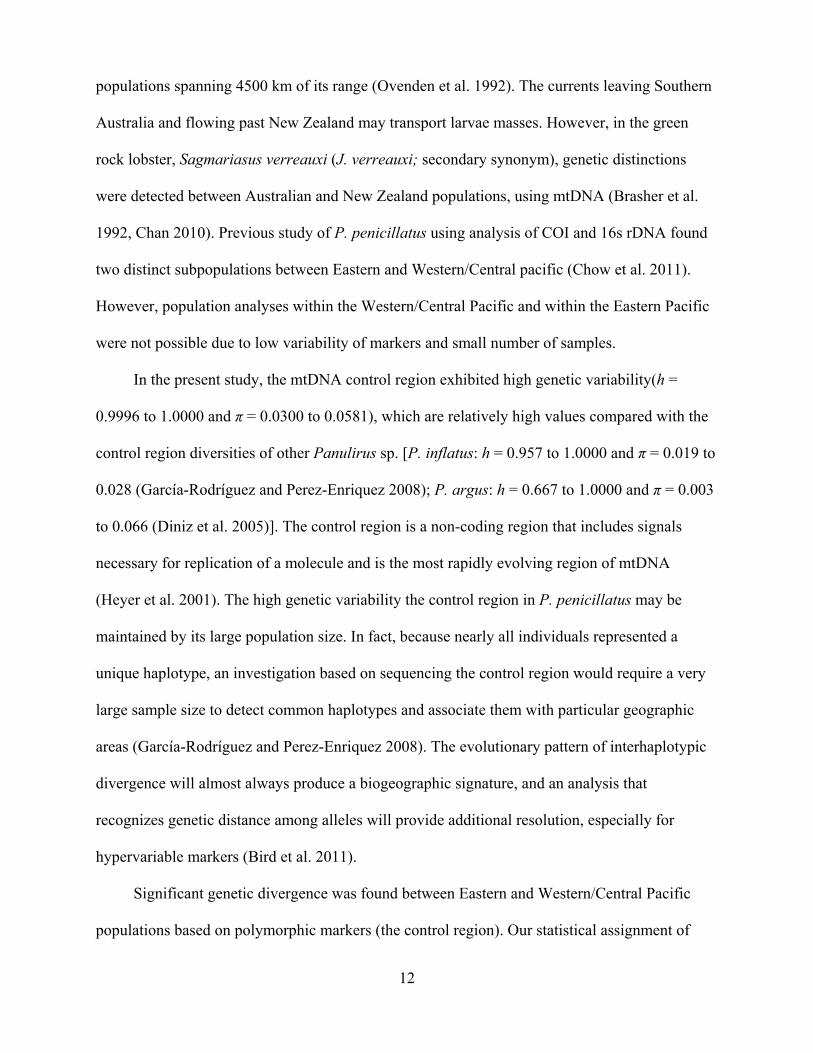
Fig. 4 Mismatch distribution established for Panulirus penicillatus mitochondrial control region. The bars represent the observed frequency of the pairwise differences among haplotypes, while the line shows the expected curve predicted for a population that has undergone a demographic expansion in the past. The parameters of the model of sudden expansion (Rogers and Harpending 1992) are presented as well as goodness-of- fit test to the model: SSD sum of squared deviations; θ0, pre-expansion and θ1, post-expansion population sizes; τ time in number of generations, elapsed since the sudden expansion episode. Tajima’s (1989) D test value and its statistical significance are also given.
24
Literature Cited
Abdullah, M.F., H. Inoue, K. Iwamoto and H. Imai. 2010. A new record of Panulirus longipes
longipes (A. Milne-Edwards, 1868) (Decapoda: Palinuridae) at Okinawajima Island and the
phylogenetic position of the genus Panulirus using RAPD markers. Biol. Mag. Okinawa
48:77–89
Asahida, T., T. Kobayashi, K. Saitoh and I. Nakayama. 1996. Tissue preservation and total DNA
extraction from fish stored at ambient temperature using buffers containing high
concentration of urea. Fish. Sci. 62:727–730
Avise, J.C. 1994. Molecular Markers, Natural History and Evolution. Chapman and Hall,
London
———. 2000. Phylogeography: The History and Formation of Species. Harvard University
Press, Cambridge, Massachusetts
Babbucci, M., S. Buccoli, A. Cau, R. Cannas, R. Goñi, D. Díaz, S. Marcato, L. Zane and T.
Patarnello. 2010. Population structure, demographic history, and selective processes:
contrasting evidences from mitochondrial and nuclear markers in the European spiny lobster
Palinurus elephas (Fabricius, 1787). Mol. Phylogenet. Evol. 56(3):1040-50
Bandelt, H.J., Forster, P. and A. Rohl. 1999. Median-joining networks for inferring intraspecific
phylogenies. Mol. Biol. Evol. 16:37–48
Baums, I.B., Paris, C.B. and L.M. Cherubin. 2006. A biooceanographic filter to larval dispersal
in a reef-building coral. Limnol Oceanogr 51:1969–1981
Bird, C.E., Smouse, P.E., Karl, S.A., and R.J. Toonen. 2011. Detecting and measuring genetic
differentiation. In: Crustacean Issues: Phylogeography and Population Genetics in Crustacea
(eds Koenemann, S., Held, C., Schubart, C.), pp. 31–55. CRC Press, Boca Raton, FL, USA.
Booth, J. D. and B. F. Phillips. 1994. Early life history of spiny lobster. Crustaceana 66: 271–294
25
Botsford, L.W., Brumbaugh, D.R., Grimes, C., Kellner, J.B., Largier, J., O’Farrell, M.R.,
Ralston, S., Soulanille, E., and V. Wespestad. 2009. Connectivity, sustainability, and yield:
bridging the gap between conventional fisheries management and marine protected areas.
Rev. Fish. Biol. Fisheries. 19:69–95
Bowen, B.W., Bass, A.L., Muss, A., Carlin, J, and D.R. Robertson. 2006. Phylogeography of
two Atlantic squirrelfishes (Family Holocentridae): exploring links between pelagic larval
duration and population connectivity. Mar. Biol. 149:899–913
Bradbury, I.R., Laurel, B., Snelgrove, P.V.R., Bentzen, P. and S.E. Campana. 2008. Global
patterns in marine dispersal estimates: the influence of geography, taxonomic category and
life history. Proc. R. Soc. B. 275: 1803-1809
Brasher, D. J., J. R. Ovenden, J. D. Booth and R. W. G. White. 1992. Genetic subdivision of
Australian and New Zealand population of Jasus verreauxi (Decapoda; Palinuridae) –
preliminary evidence from the mitochondrial genome. N.Z.J. Mar. Freshwat. Res. 26:53–58
Butler, IV. M. J., C.B. Paris, J.S. Goldstein, H. Matsuda and R. K. Cowen. 2011. Behavior
constrains the dispersal of long-lived spiny lobster larvae. Mar. Ecol. Prog. Ser. 422: 223–
237
Carvalho, G. R. and L. Hauser. 1995. Molecular genetics and the stock concept in fisheries. In
Carvalho, G. R. and T. J. Pitcher (eds), Molecular Genetics in Fisheries. Chapman and Hall,
London: 55–79
Chan, T. Y. 2010. Annotated checklist of the world's marine lobsters (Custacea: Decapoda:
Astacidea, Glypheidea, Achelata, Polychelida). Raff. Bull. Zool. Suppl. 23: 153–181
Chow, S., N. Suzuki, H. Imai and T. Yoshimura. 2006. Molecular species identification of spiny
lobster phyllosoma larvae of the genus Panulirus from the Northwestern Pacific. Mar.
Biotechnol. 8: 260–267
26
Chow. S., H. Yamada and N. Suzuki. 2006. Identification of mid-to final stage phyllosoma
larvae of the genus Panulirus White 1847 collected in the Ryukyu Archipelago. Crustaceana
79: 745–764
Chow, S., A. Jeff, Y. Miyaeke, K. Konishi, M. Okazaki, N. Suzuki, S. Kimura, M. F. Abdullah,
H. Imai, M. Sasaki, Y. Sasai, T. Wakabayasi and M. Sakai. 2011. Genetic isolation between
the western and eastern Pacific populations of pronghorn spiny lobster Panulirus penicillatus.
PLoS ONE 6(12): e29280. doi:10.1371/journal.pone.0029280
Crandall, E.D., Treml, E.A. and P.H. Barber. 2012. Coalescent and biophysical models of
stepping-stone gene flow in neritid snails. Mol. Ecol. 21 :5579-5598
Colling, A. 2001. Ocean Circulation. 2nd edn. The Open University and Butterworth-
Heinemann, Milton-Keynes, pp 37
Diniz, F. M., N. Maclean, M. Ogawa, I. H. A. Cintra and P. Bentzen. 2005. The hypervariable
domain of the mitochondrial control region in Atlantic spiny lobsters and its potential as a
marker for investigating phylogeographic structuring. Mar. Biotechnol. 7:462–473
Dupanloup, I., S. Schneider and L. Excoffier. 2002. A simulated annealing approach to define
the genetic structure of populations. Mol. Ecol. 11: 2571–2581
Ekman, S. 1953. Zoogeography of the sea. Sidgwick and Jackson, London
Excoffier, L., G. Laval and S. Schneider. 2005. Arlequin ver. 3.0: an integrated software package
for population genetics data analysis. Evol. Bioinform. Online. 1:47–50
FAO. 1989. FAO Yearbook in 1987of fishery statistics, catches and landings. FAO Yearbook
Vol. 64
Felsenstein, J. 2004. PHYLIP (Phylogeny Inference Package) version 3.6. Distributed by the
author. Department of Genome Sciences, University of Washington, Seattle
27
García-Rodríguez, F. J. and R. Perez-Enriquez. 2008. Lack of genetic differentiation of blue
spiny lobster Panulirus inflatus along the Pacific coast of Mexico inferred from the mtDNA
sequences. Mar. Ecol. Prog. Ser. 361:203-212
George, R. W. and A. R. Main. 1967. The evolution of spiny lobsters (Palinuridae): a study of
evolution in the marine environment. Evolution 21:803–820
George, R. W. 2005. Evolution of life cycles, including migration, in spiny lobsters
(Palinuridae). N.Z.J. Mar. Freshwater. Res. 39:503–514
———. 2006. Tethys sea fragmentation and speciation of Panulirus spiny lobsters. Crustaceana
78:1281-1309
Griffin, D. A., J. L. Wilkin, C. F. Chubb, A. F. Pearce and N. Caputi. 2001. Ocean currents and
the larval phase of Australian western rock lobster, Panulirus cygnus. Mar. Freshw. Res. 52:
1187–1199
Hearn, A. and F. C. Murillo. 2008. Life history of the red spiny lobster, Panulirus penicillatus
(Decapoda: Palinulidae), in the Galápagos Marine Reserve, Ecuador. Pac. Sci. 62:191–204
Heyer, E., E. Zietkiewicz, A. Rochowski, V. Yotova, J. Puymirat and D. Labuda. 2001.
Phylogenetic and familial estimates of mitochondrial substitution rates: study of control
region mutations in deep-rooting pedigrees. Am. J. Hum. Genet. 69:1113–1126
Holthuis, L. B. and H. Loesch. 1967 Lobsters of the Galápagos Islands (Decapoda, Palinuridea).
Crustaceana 12:214–222
Holthuis, L. B. 1991. Marine Lobsters of the World: an annotated and illustrated catalogue of
species of interest to fisheries known to date. FAO Fish Synopsis No. 125 vol 13, Rome
Imai, H., Cheng, J.-H., Hamasaki, K. and K.-I. Numachi. 2004. Identification of four mud crab
species (genus Scylla) using ITS-1 and 16S rDNA markers. Aquat. Living Resour., 17: 31–34
28
Imbrie, J., E. A. Boyle, S. C. Clemens, A. Duffy, W. R. Howard, G. Kukla, J. Kutzbach, D. G.
Martinson, A. McIntyre, A. C. Mix, B. Molfino, J. J. Morley, L. C. Peterson, N. G. Pisias, W.
L. Prell, M. E. Raymo, N. J. Shackleton and J. R. Toggweiler. 1992. On the structure and
origin of major glaciation cycles, 1. Linear responses to Milankovitch forcing.
Paleoceanography 7:701–738
Inoue, N., H. Watanabe, S. Kojima and H. Sekiguchi. 2007. Population structure of Japanese
spiny lobster Panulirus japonicus inferred by nucleotide sequence analysis of mitochondrial
COI gene. Fish. Sci. 73:550–556
Johnson, M. W. 1968. Palinurid phyllosoma from the Hawaiian archipelago
(Palinuridae). Crustaceana, Supplement 2:59–79
———. 1974. On the dispersal of lobster larvae into the East Pacific Barrier (Decapoda,
Palinuridea). Fish. Bull. 72:639–647
Kool, J.T., Paris C.B., Barber, P.H., and R.K. Cowen. 2011. Connectivity and the development
of population genetic structure in Indo-West Pacific coral reef communities. Global. Ecol.
Biogeogr. 20:695–706
Matsuda, H., T. Takenouchi and J. S. Goldstein. 2006. The complete larval development of the
pronghorn spiny lobster Panulirus penicillatus (Decapoda: Palinuridae) in culture. J. Crust.
Biol. 26:579–600
McMillen-Jackson, A. L. and T. M. Bert. 2004. Genetic diversity in the mtDNA control region
and population structure in the pink shrimp Farfantepenaeus duorarum. J. Crust. Biol.
24:101–109
Minagawa, M. 1990. Early and middle larval development of Panulirus penicillatus (Olivier)
(Crustacea, Decapoda, Palinuridae) reared in the laboratory. Researches on Crustacea 18:77–
93
29
Mukai, T., S. Nakamura and M. Nishida. 2009. Genetic population structure of a reef
goby, Bathygobius cocosensis, in the northwestern Pacific. Ichthyol. Res. 56:380–387
Ovenden, J. R., D. J. Brasher and R. W. G. White. 1992. Mitochondrial DNA analyses of the red
rock lobster Jasus edwardsii supports an apparent absence of population subdivision
throughout Australasia. Mar. Biol. 112:319–326
Pitcher, C. R. 1993. Spiny Lobster. In: Wright A and Hill L (eds) Nearshore Marine Resources
of the South Pacific. Information for Fisheries Development and Management. IPS
(Suva)/FFA (Honiara)/ICOD (Canada). Chapter 17, pp 539–607
Pollock, D. E. 1995. Notes on the phenotypic and genotypic variability in lobsters. Crustaceana
68:193–202
Prescott, J. 1988. Tropical spiny lobster: an overview of their biology, the fisheries and the
economics with particular reference to the double spined rock lobster P. penicillatus. South
Pacific Commission Workshop. Pacific Inshore Fishery Resources, New Caledonia. WP18:
1–36
Ptacek, M. B., S. K. Sarver, M. J. Childress and W. F. Herrnkind. 2001. Molecular phylogeny of
the spiny lobster genus Panulirus (Decapoda: Palinuridae). Mar. Freshwat. Res. 52:1037–
1047
Riginos, C., Douglas, K.E., Jin, Y., Shanahan, D.F. and E.A. Treml. 2011. Effects of geography
and life history traits on genetic differentiation in benthic marine fishes. Ecography. 34:566–
75
Rodriguez-Lanetty, M. and O. Hoegh-Guldberg. 2002. The phylogeography and connectivity of
the latitudinally widespread scleractinian coral Plesiastrea versipora in the western Pacific.
Mol. Ecol. 11:1177–1189
30
Rogers, A. R. and H. Harpending. 1992. Population growth waves in the distribution of pairwise
genetic differences. Mol. Biol. Evol. 9:552–569
Saccone, C., M. Attimonelli and E. Sbisa. 1987. Structural elements highly preserved during the
evolution of the D-loop-containing region in vertebrate mitochondrial DNA. J. Mol. Evol.
26:205–211
Saitou, N. and M. Nei. 1987. The neighbor-joining method: A new method for reconstructing
phylogenetic trees. Mol. Biol. Evol. 4:406–425
Sarver, S., J. D. Silberman and P. J. Walsh. 1998. Mitochondrial DNA sequence evidence
supporting the recognition of two subspecies or species of the Florida spiny lobster Panulirus
argus. J. Crust. Biol. 18:177–186
Schneider, S. and L. Excoffier. 1999. Estimation of past demographic parameters from the
distribution of pairwise differences when the mutation rates vary among sites: application to
human mitochondrial DNA. Genetics 152:1079–1089
Shaklee, J. B. and P. Bentzen. 1998. Genetic identification of stocks of marine fish and shellfish.
Bull. Mar. Sci. 62:589–621
Shanks, A.L. 2009. Pelagic larval duration and dispersal distance revisited. Biol. Bull. 216:373–
85
Shanks, A.L., Grantham, B.A., and M.H. Carr. 2003. Propagule dispersal distance and the size
and spacing of marine reserves. Ecol. Appl. 13:S159–69.
Tajima, F. 1989. Statistical method for testing the neutral mutation hypothesis by DNA
polymorphism. Genetics 123:585–595
Tamura, K. and M. Nei. 1993. Estimation of the number of nucleotide substitutions in the control
region of mitochondrial DNA in humans and chimpanzees. Molecular Biology and Evolution
10:512-526
31
Tamura, K., Peterson, D., Peterson, N., Stecher, G., Nei, M., and S. Kumar. 2011. MEGA5:
Molecular Evolutionary Genetics Analysis using Maximum Likelihood, Evolutionary
Distance, and Maximum Parsimony Methods. Mol. Biol. Evol. doi:10.1093/molbev/msr121
Thompson, J. D., T. J. Gibson, F. Plewniak, F. Jeanmougin and D. G. Higgins. 1997. The
ClustalX windows interface: flexible strategies for multiple sequence alignment aided by
quality analysis tools. Nucl. Acids. Res. 25:4876–4882
Thorpe, J. P., A. M. Sole´-Cava and P. C. Watts. 2000. Exploited marine invertebrates: genetics
and fisheries. Hydrobiologia 420: 165–184
Tolley, K. A., J. C. Groeneveld, K. Gopal and C. A. Matthee. 2005. Mitochondrial DNA
panmixia in spiny lobster Palinurus gilchristi suggests a population expansion. Mar. Ecol.
Prog. Ser. 297:225–231
Treml, E.A., Halpin, P.N., Urban, D.L. and L.F. Pratson. 2008 Modeling population connectivity
by ocean currents, a graph-theoretic approach for marine conservation. Landscape. Ecol.
23:19–36
Treml, E.A., Roberts, J.J., Chao, Y., Halpin, P.N., Possingham, H.P. and C. Riginos. 2012.
Reproductive output and duration of the pelagic larval stage determine seascape-wide
connectivity of marine populations. Integr. Comp. Biol. doi:10.1093/icb/ics101
Weersing, K. and R.J. Toonen. 2009. Population genetics, larval dispersal, and connectivity in
marine systems. Mar. Ecol. Prog. Ser. 393:1–12
Werner, F.E., Cowen, R.K., and C.B.Paris. 2007. Coupled biological and physical models:
present capabilities and necessary developments for future studies of population connectivity.
Oceanography. Spec. Issue. Marine. Populat. Conn. 20:54–69
White, C., Selkoe, K.A., Watson, J., Siegel, D.A., Zacherl, D.C. and R.J. Toonen. 2010. Ocean
currents help explain population genetic structure. Proc. R. Soc. B. 20:695–706

32
Yasuda, N., S. Nagai, M. Hamaguchi, K. Okaji, K. Gérard and K. Nadaoka. 2009. Gene flow
of Acanthaster planci (L.) in relation to ocean currents revealed by microsatellite
analysis. Mol. Ecol. 18:1574–1
33
Appendix S1. Spatial distribution of control region haplotypes among Panulirus penicillatus from eight localities in the western Pacific and two localities in the eastern Pacific region.