Embed Size (px)
DESCRIPTION
Genetic Theory - Overview. Pak Sham International Twin Workshop Boulder, 2005. The Human Genome. 23 Chromosomes, each containing a DNA molecule (Watson and Crick, 1953) 3 10 9 base pairs , completely sequenced (Human Genome Project, 2003) - PowerPoint PPT Presentation
Citation preview
Genetic Theory - Overview
Pak ShamInternational Twin Workshop
Boulder, 2005
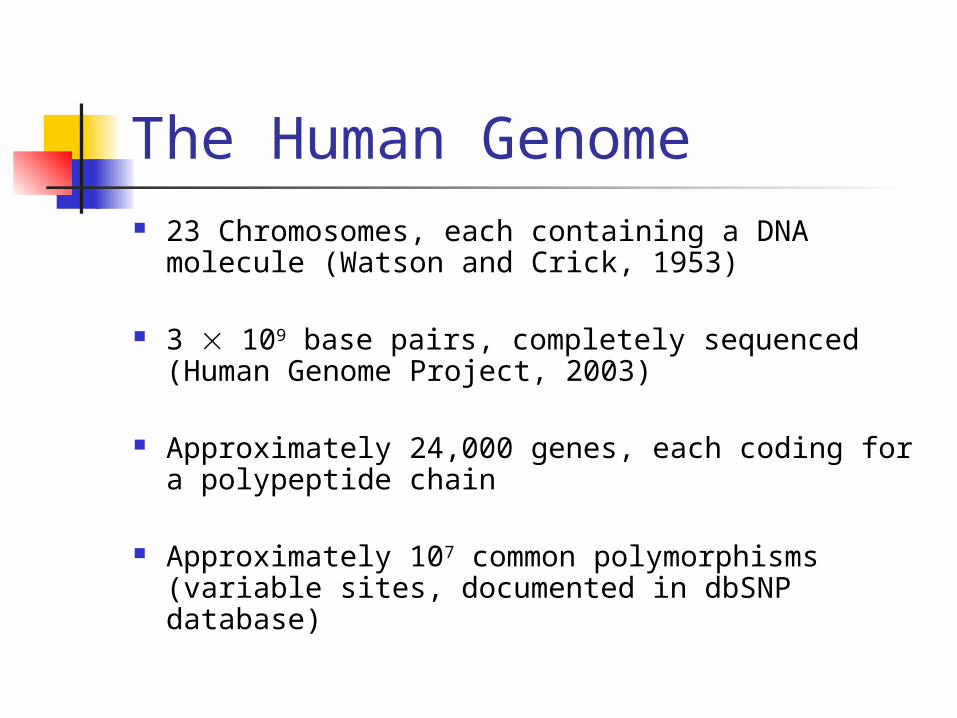
The Human Genome 23 Chromosomes, each containing a DNA
molecule (Watson and Crick, 1953)
3 109 base pairs, completely sequenced (Human Genome Project, 2003)
Approximately 24,000 genes, each coding for a polypeptide chain
Approximately 107 common polymorphisms (variable sites, documented in dbSNP database)
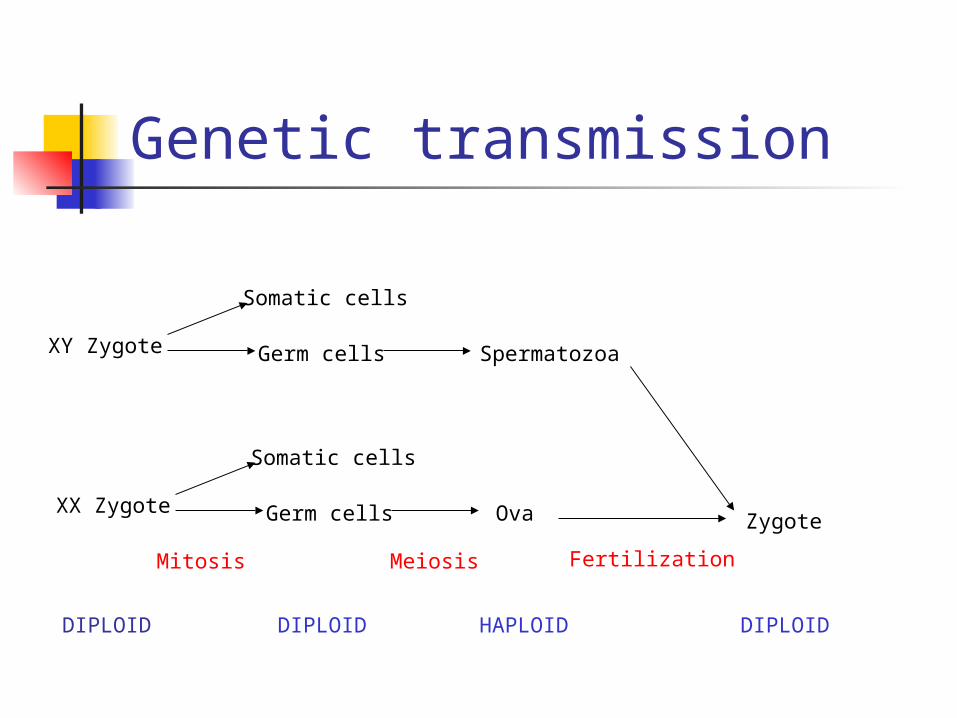
Genetic transmission
XY Zygote
Somatic cells
Germ cells Spermatozoa
XX Zygote
Somatic cells
Germ cells Ova Zygote
Mitosis Meiosis Fertilization
DIPLOID DIPLOID HAPLOID DIPLOID
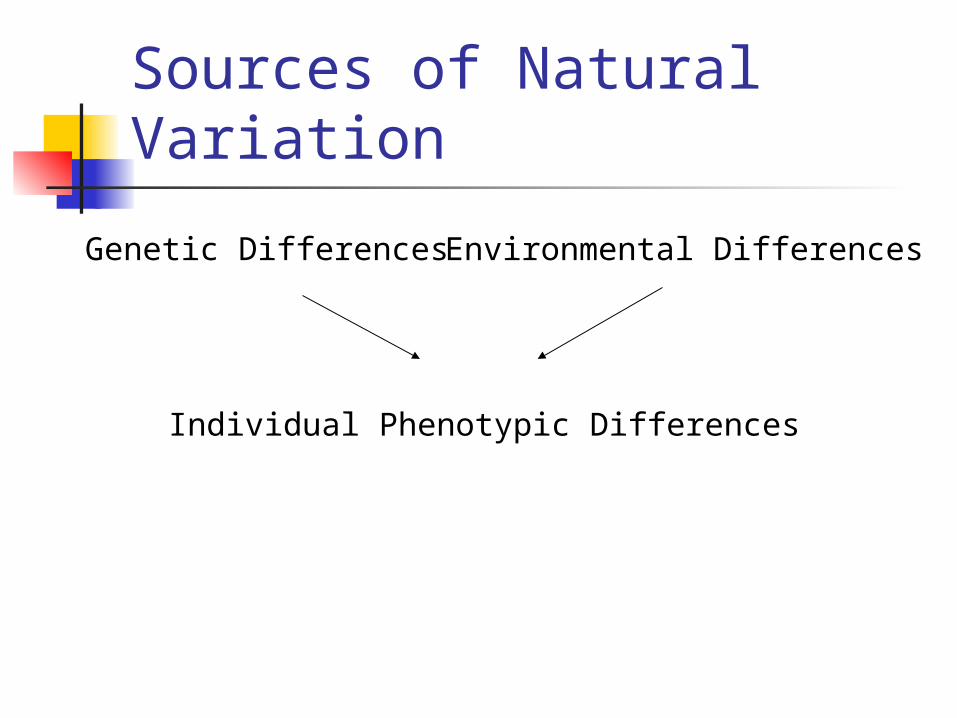
Sources of Natural Variation
Genetic Differences Environmental Differences
Individual Phenotypic Differences
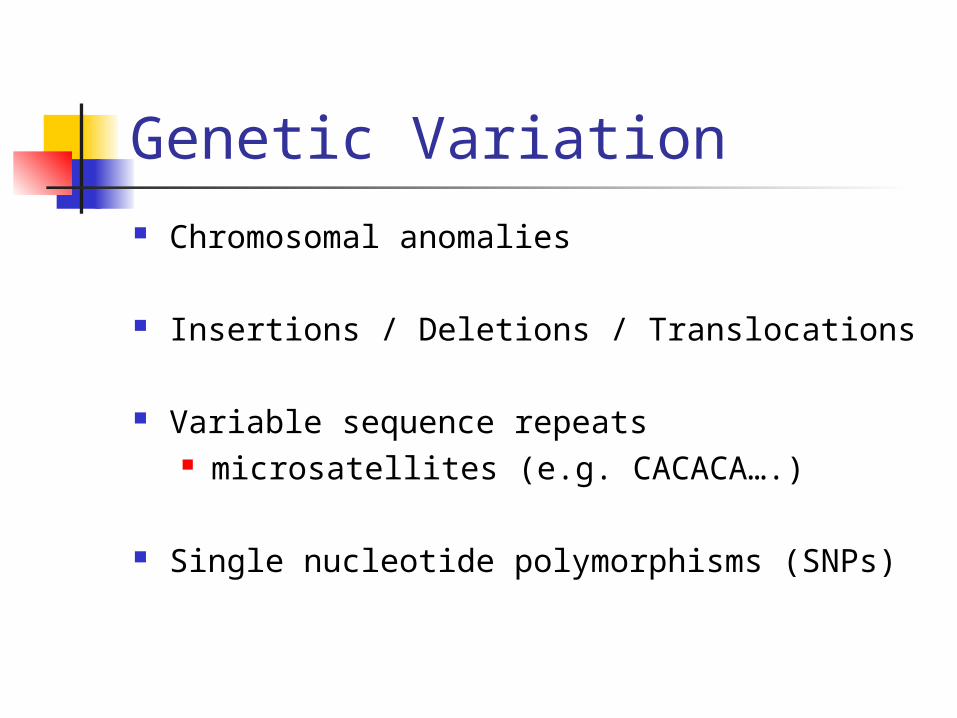
Genetic Variation Chromosomal anomalies
Insertions / Deletions / Translocations
Variable sequence repeats microsatellites (e.g. CACACA….)
Single nucleotide polymorphisms (SNPs)
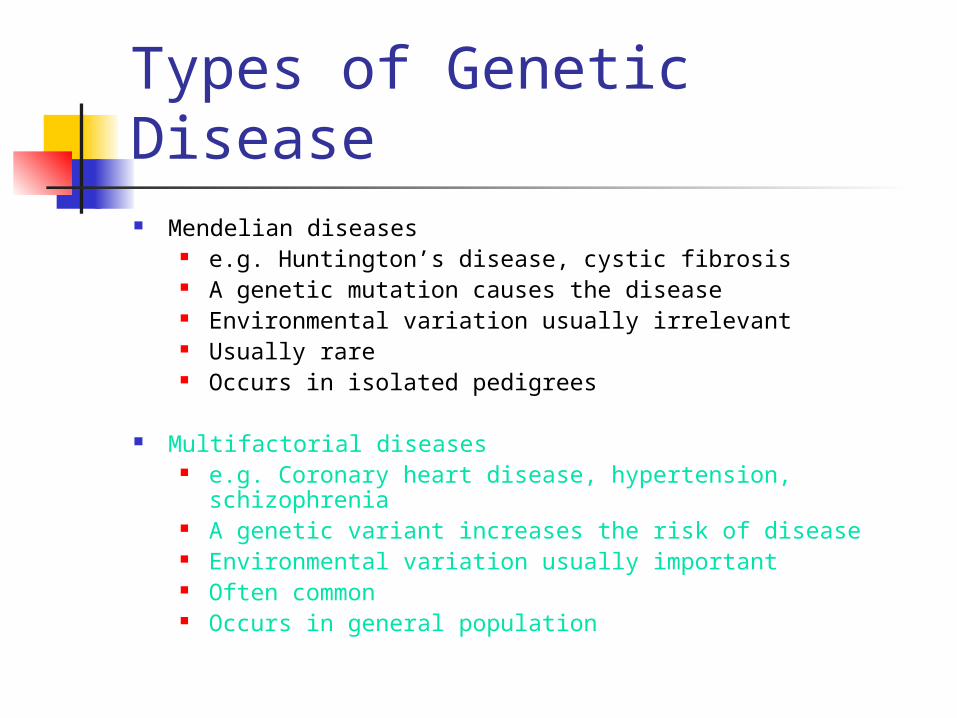
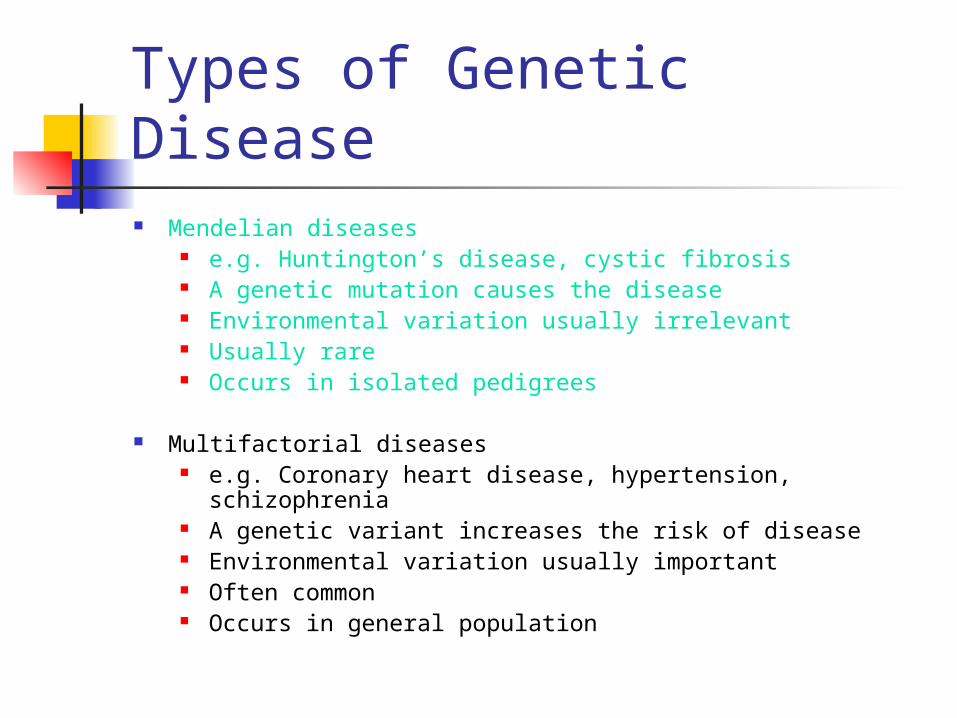
Types of Genetic Disease Mendelian diseases
e.g. Huntington’s disease, cystic fibrosis A genetic mutation causes the disease Environmental variation usually irrelevant Usually rare Occurs in isolated pedigrees
Multifactorial diseases e.g. Coronary heart disease, hypertension, schizophrenia A genetic variant increases the risk of disease Environmental variation usually important Often common Occurs in general population
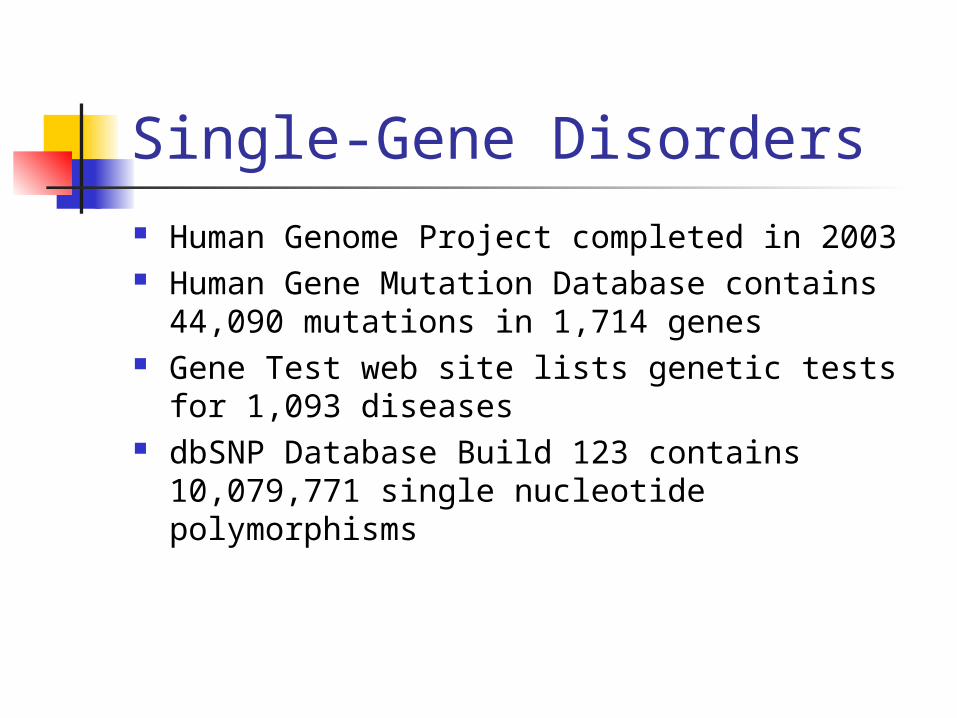
Single-Gene Disorders Human Genome Project completed in 2003 Human Gene Mutation Database contains
44,090 mutations in 1,714 genes Gene Test web site lists genetic tests for 1,093
diseases dbSNP Database Build 123 contains
10,079,771 single nucleotide polymorphisms
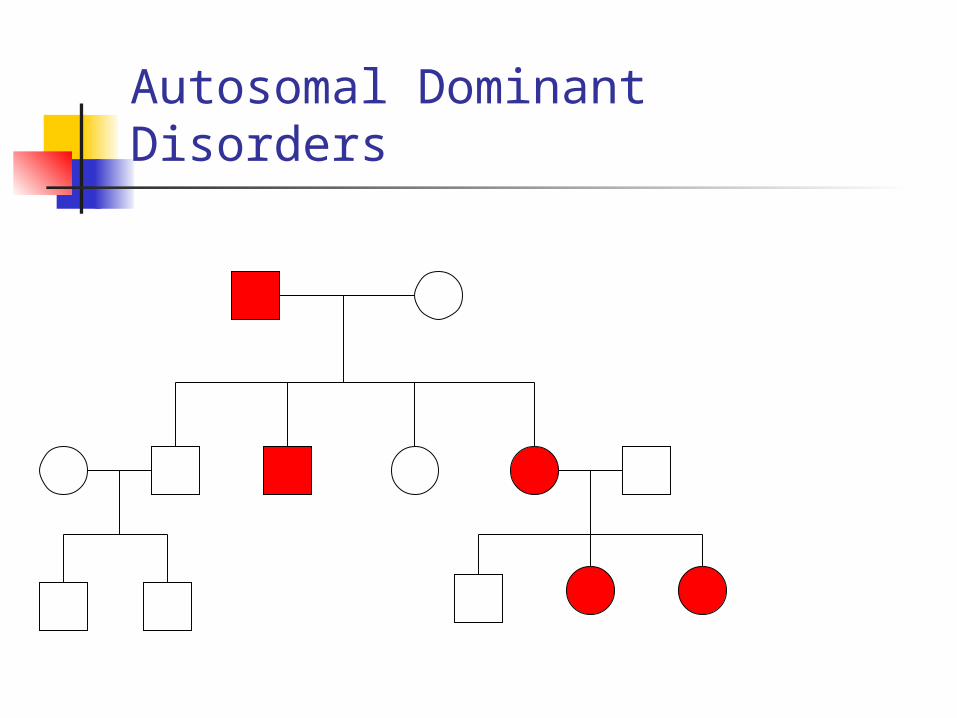
Autosomal Dominant Disorders
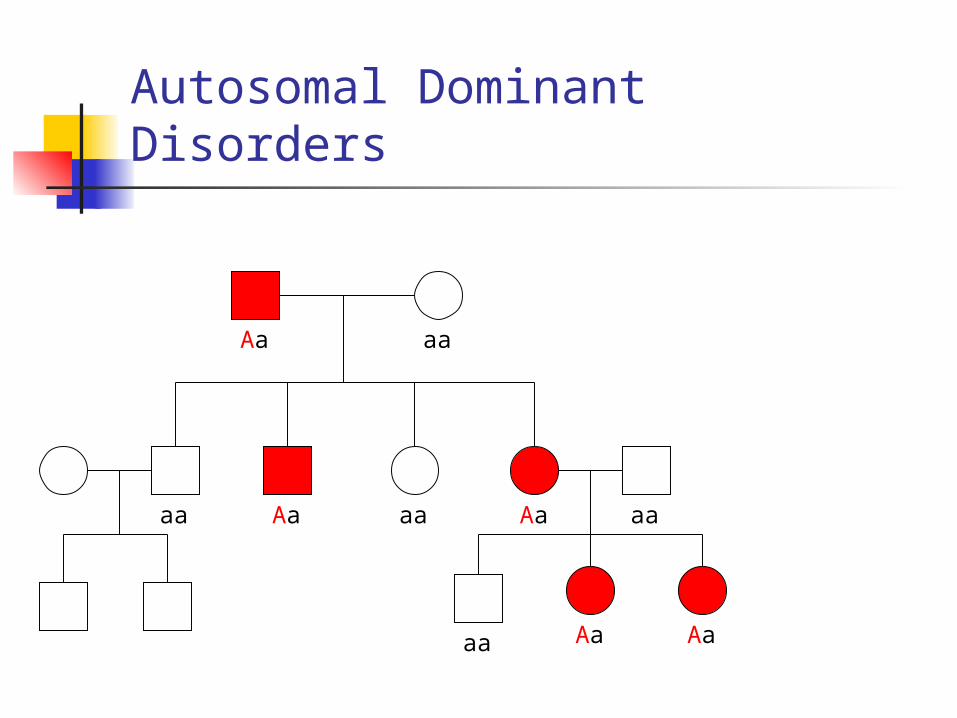
Autosomal Dominant Disorders
Aa aa
Aaaa aa Aa aa
aa Aa Aa
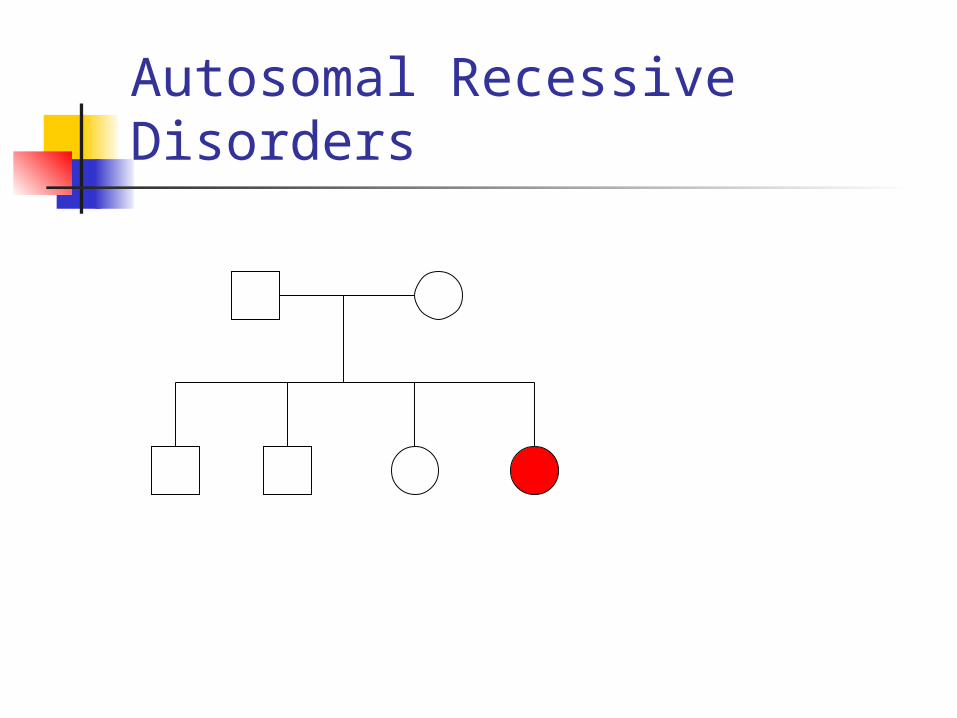
Autosomal Recessive Disorders

Autosomal Recessive Disorders
Aa Aa
aa Aa Aa AA
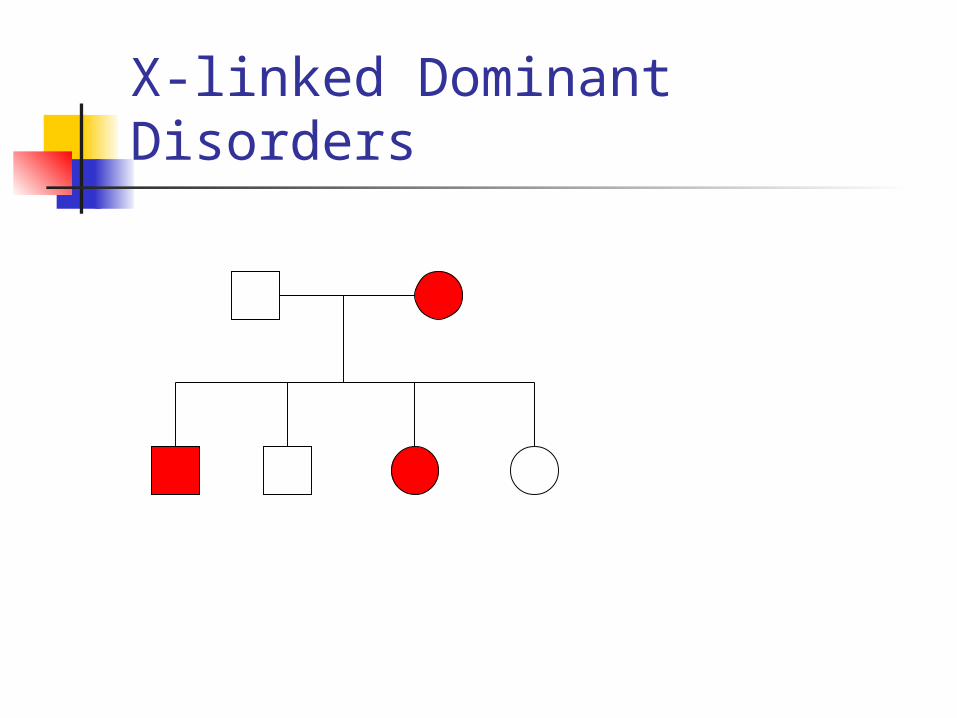
X-linked Dominant Disorders
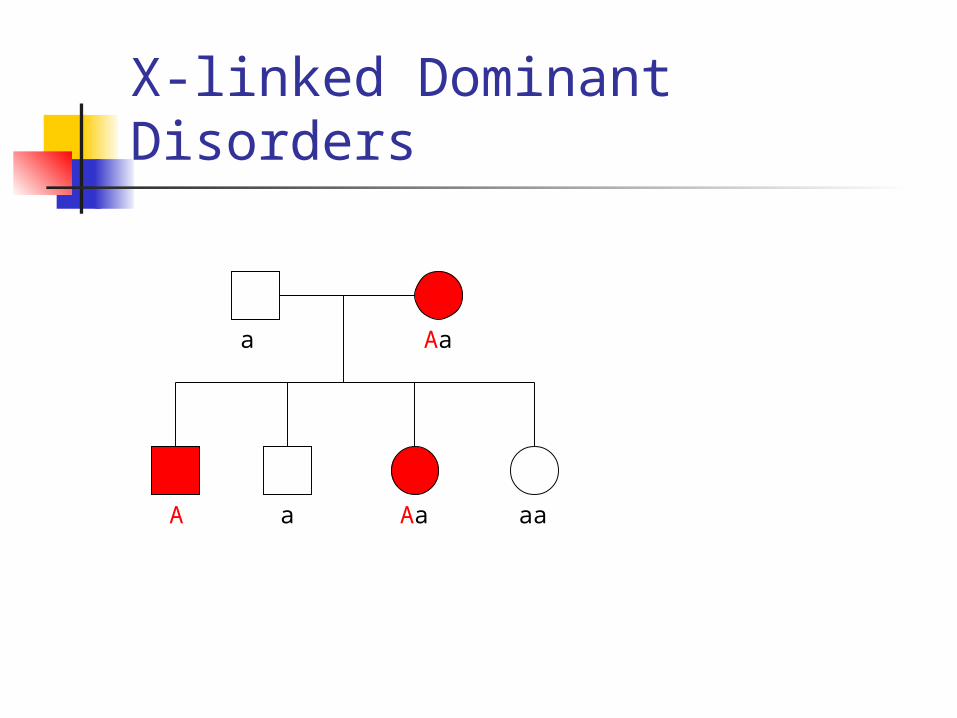
X-linked Dominant Disorders
a Aa
A a Aa aa
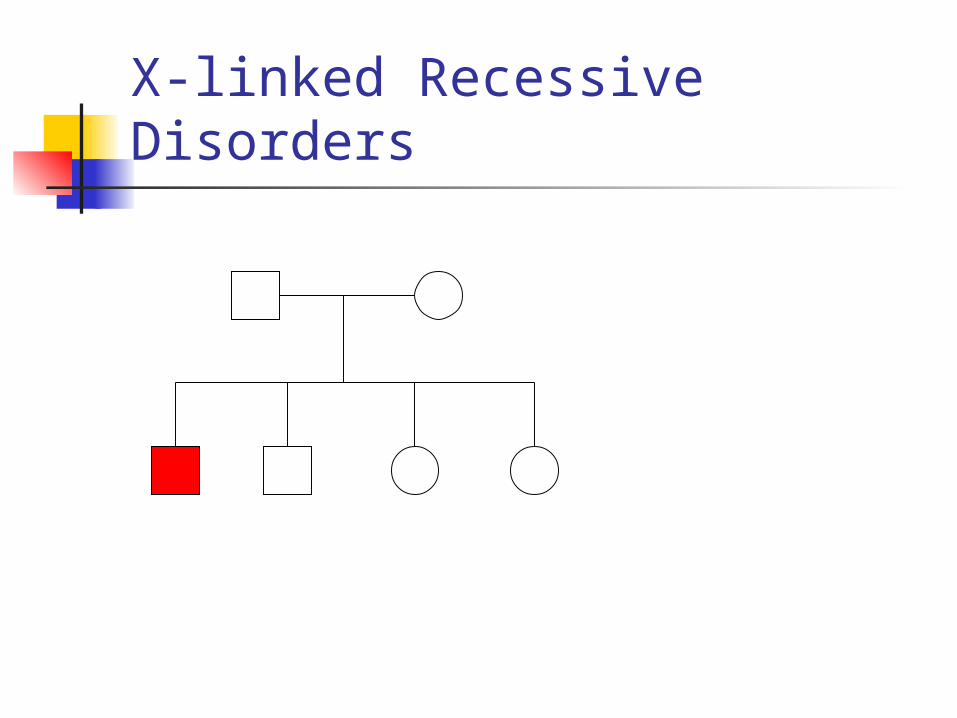
X-linked Recessive Disorders
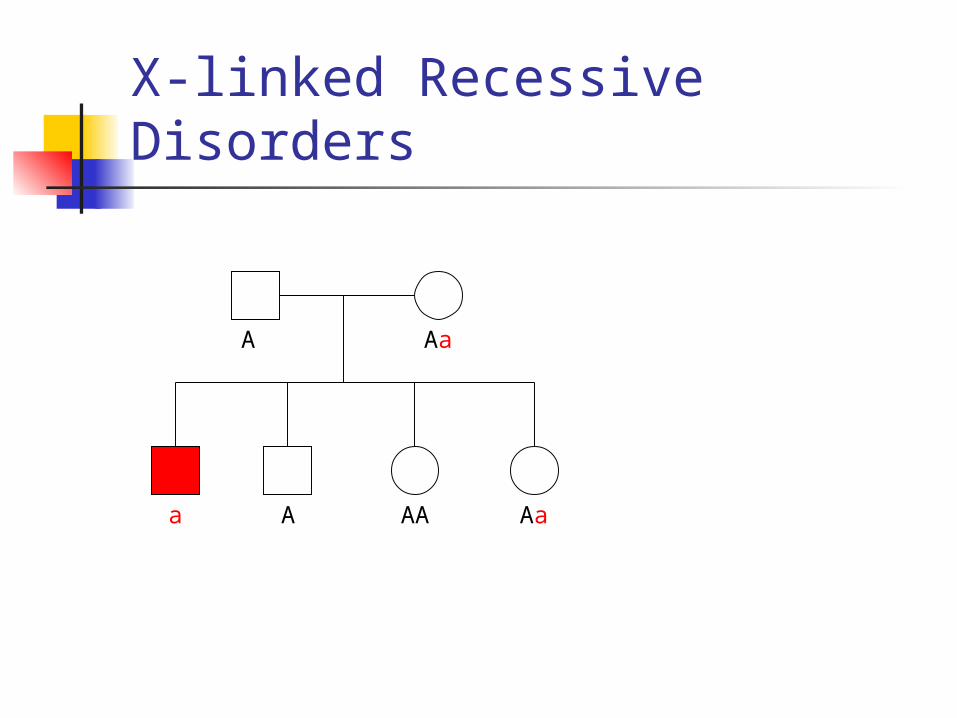
X-linked Recessive Disorders
A Aa
a A AA Aa
Mendelian Segregation
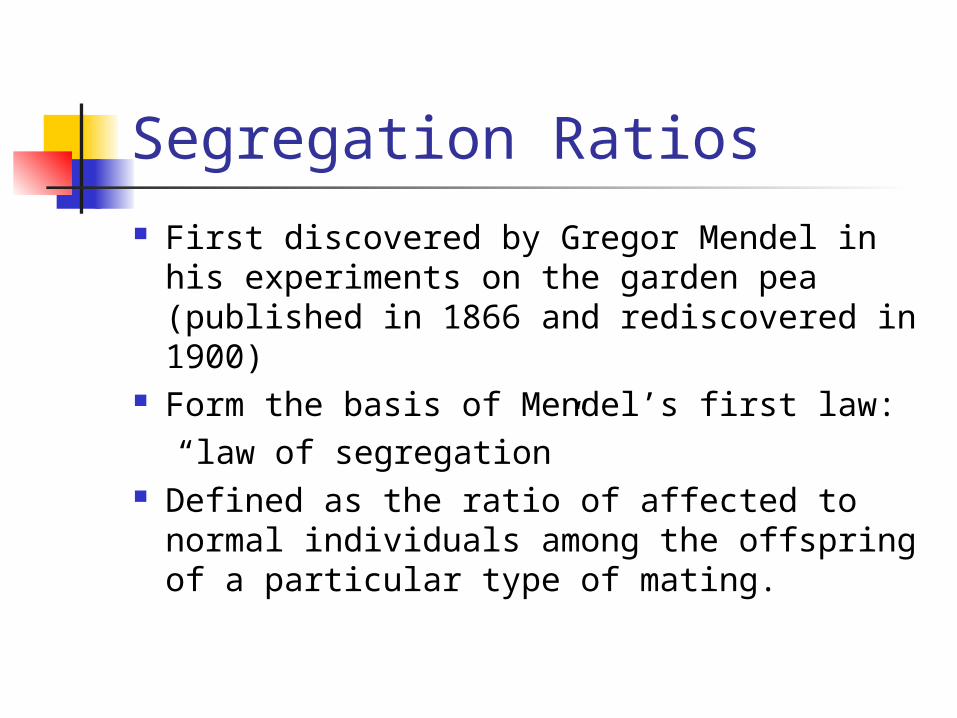
Segregation Ratios First discovered by Gregor Mendel in his
experiments on the garden pea (published in 1866 and rediscovered in 1900)
Form the basis of Mendel’s first law: “law of segregation”
Defined as the ratio of affected to normal individuals among the offspring of a particular type of mating.
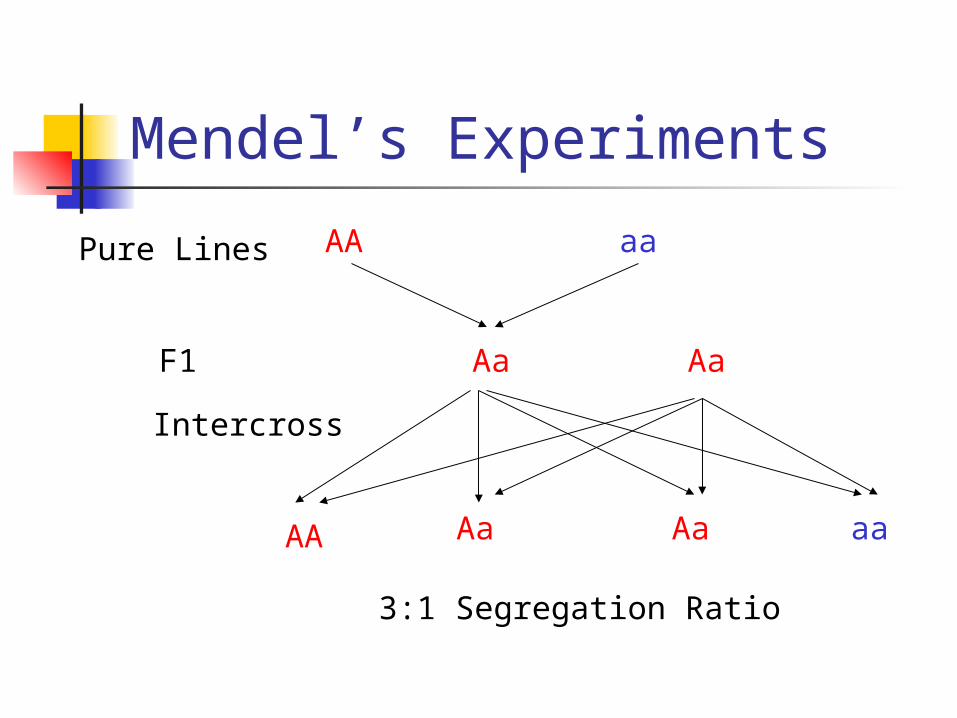
Mendel’s Experiments
Pure Lines AA aa
F1 Aa Aa
AA Aa Aa aa
3:1 Segregation Ratio
Intercross
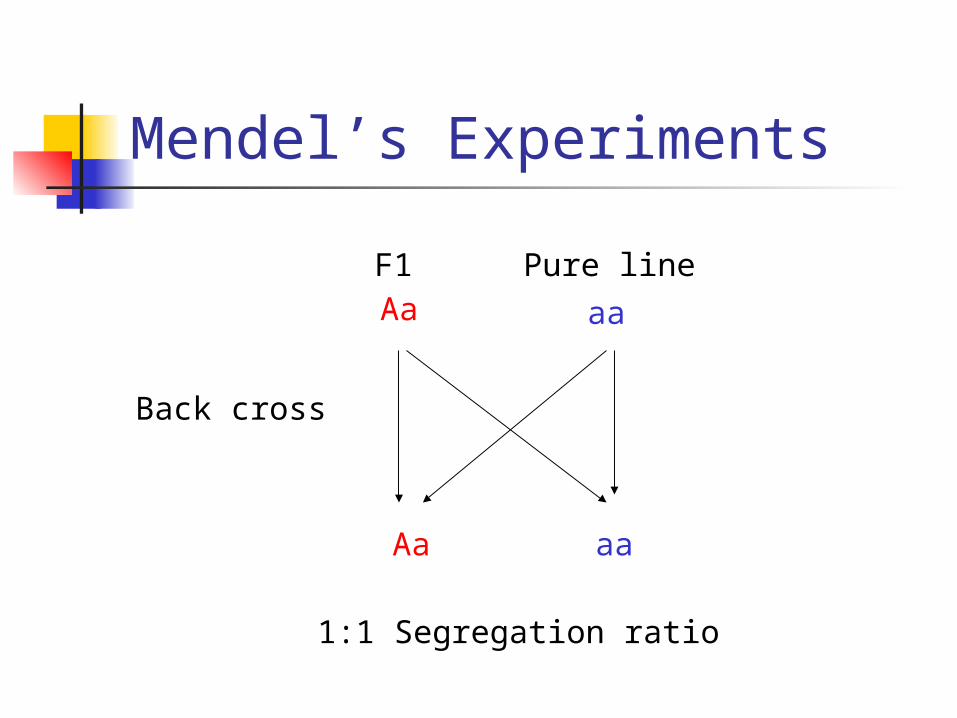
Mendel’s Experiments
Aa aa
Aa aa
F1 Pure line
Back cross
1:1 Segregation ratio

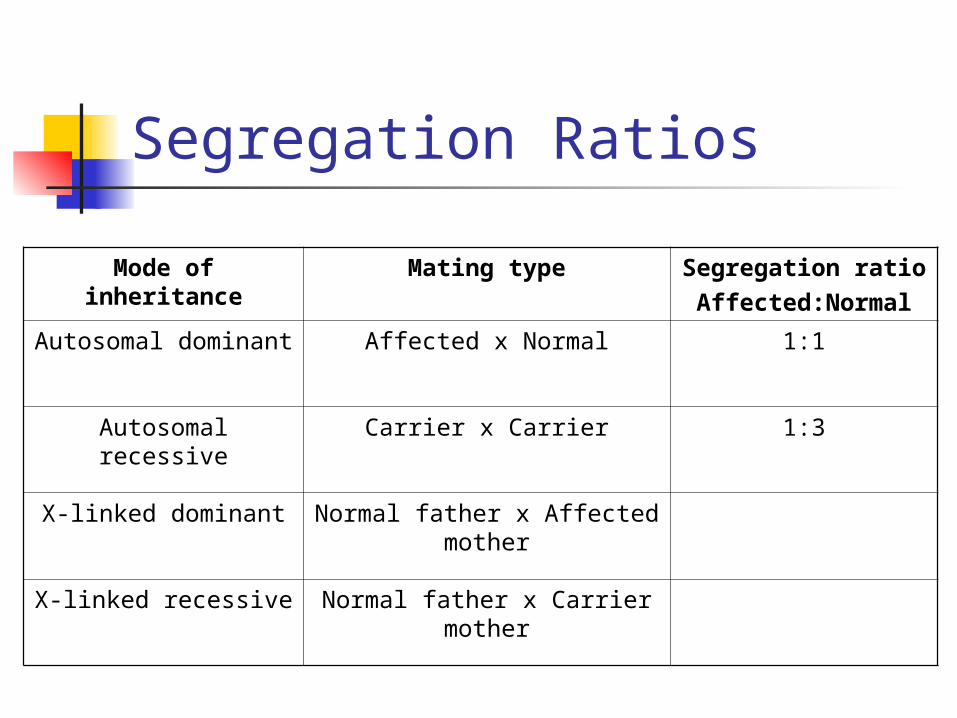
Segregation Ratios
Mode of inheritance
Mating type Segregation ratioAffected:Normal
Autosomal dominant Affected x Normal
Autosomal recessive Carrier x Carrier
X-linked dominant Normal father x Affected mother
X-linked recessive Normal father x Carrier mother

Segregation Ratios
Mode of inheritance
Mating type Segregation ratioAffected:Normal
Autosomal dominant Affected x Normal 1:1
Autosomal recessive Carrier x Carrier
X-linked dominant Normal father x Affected mother
X-linked recessive Normal father x Carrier mother
Segregation Ratios
Mode of inheritance
Mating type Segregation ratioAffected:Normal
Autosomal dominant Affected x Normal 1:1
Autosomal recessive Carrier x Carrier 1:3
X-linked dominant Normal father x Affected mother
X-linked recessive Normal father x Carrier mother

Segregation Ratios
Mode of inheritance
Mating type Segregation ratioAffected:Normal
Autosomal dominant Affected x Normal 1:1
Autosomal recessive Carrier x Carrier 1:3
X-linked dominant Normal father x Affected mother
1:1
X-linked recessive Normal father x Carrier mother
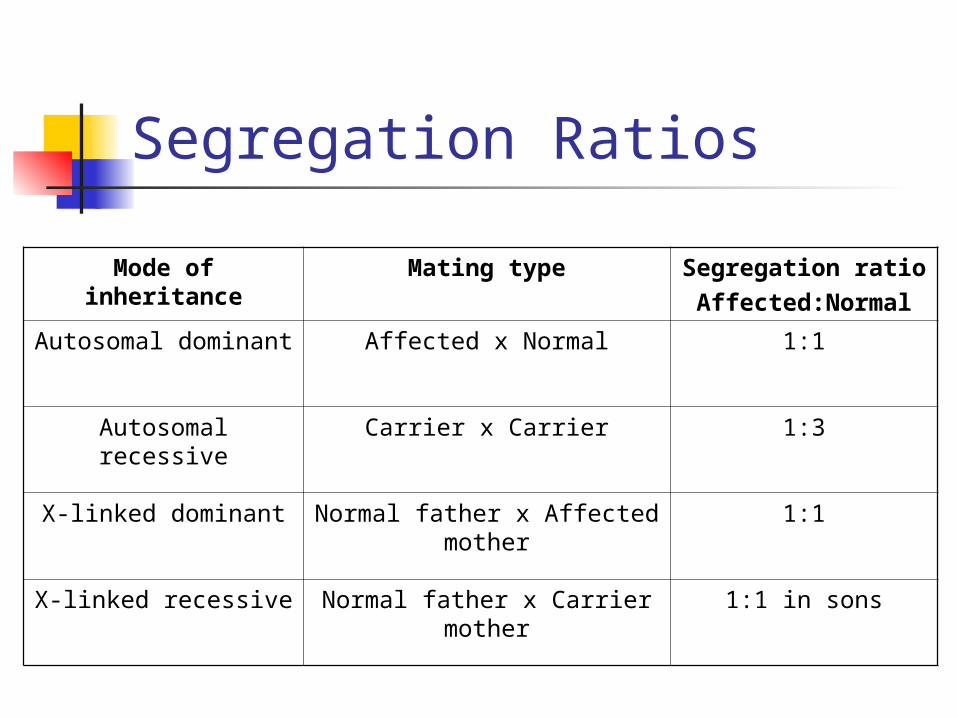
Segregation Ratios
Mode of inheritance
Mating type Segregation ratioAffected:Normal
Autosomal dominant Affected x Normal 1:1
Autosomal recessive Carrier x Carrier 1:3
X-linked dominant Normal father x Affected mother
1:1
X-linked recessive Normal father x Carrier mother
1:1 in sons
Hardy-Weinberg Law
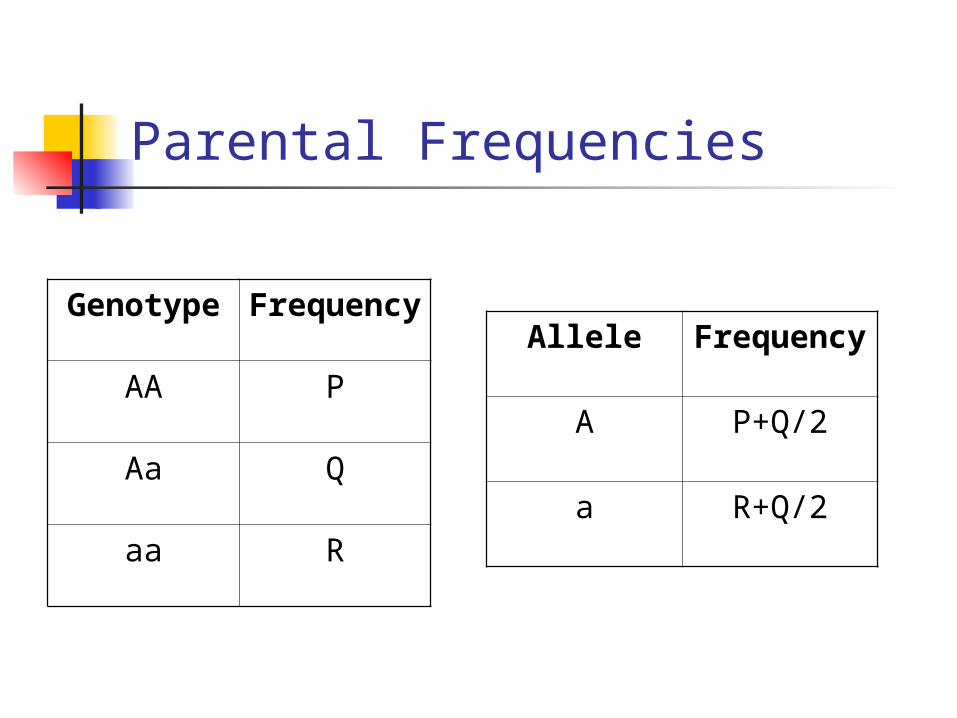
Parental Frequencies
Genotype
Frequency
AA P
Aa Q
aa R
Allele Frequency
A P+Q/2
a R+Q/2
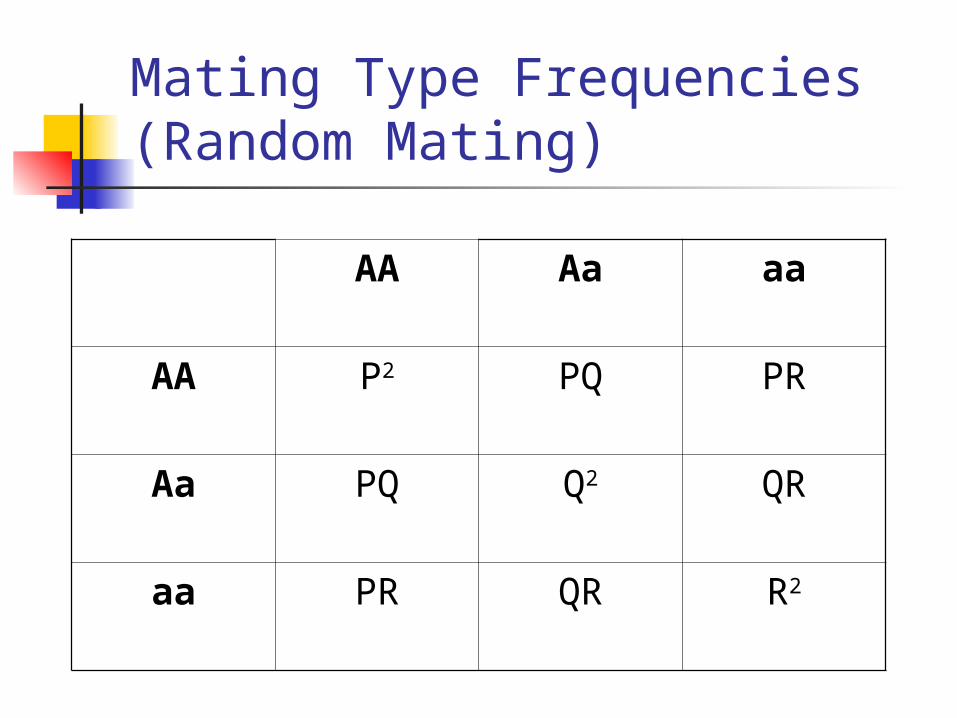
Mating Type Frequencies(Random Mating)
AA Aa aa
AA P2 PQ PR
Aa PQ Q2 QR
aa PR QR R2
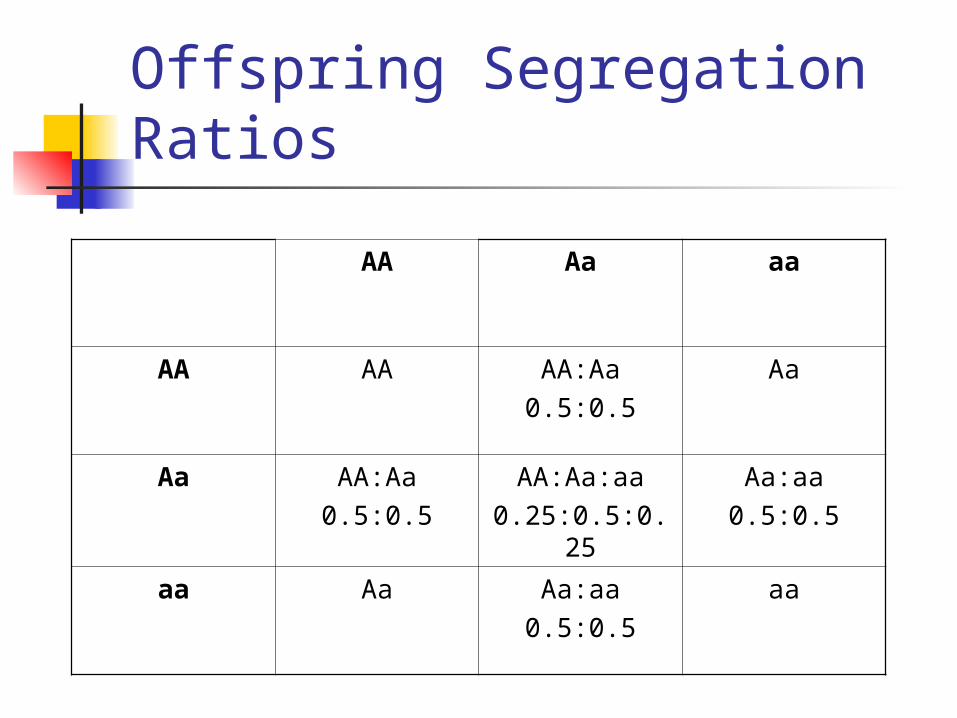
Offspring Segregation Ratios
AA Aa aa
AA AA AA:Aa0.5:0.5
Aa
Aa AA:Aa0.5:0.5
AA:Aa:aa0.25:0.5:0.25
Aa:aa0.5:0.5
aa Aa Aa:aa0.5:0.5
aa
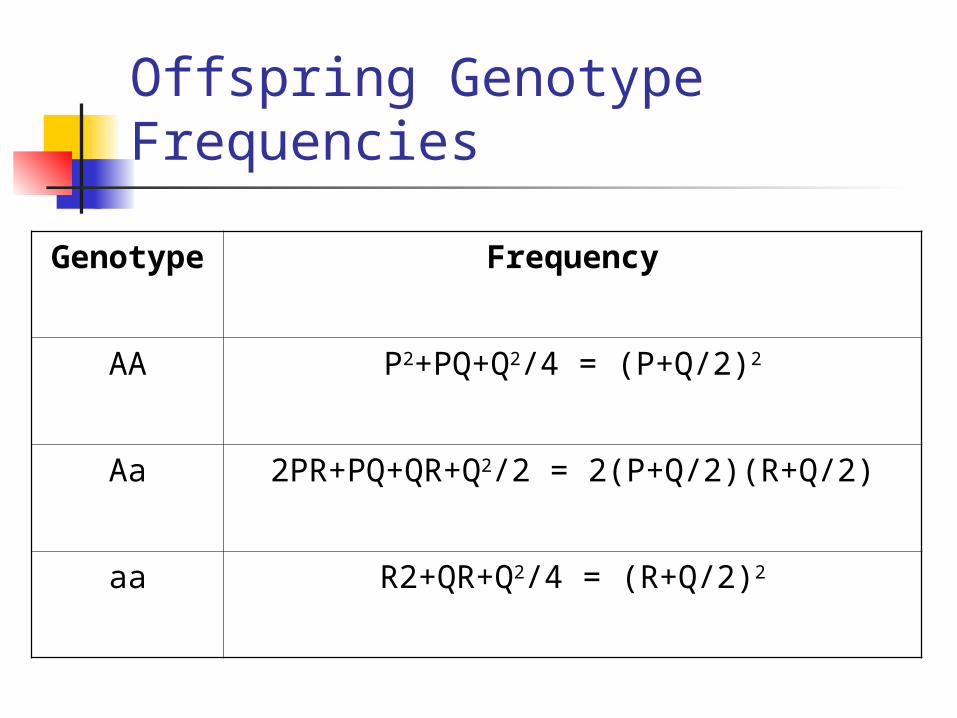
Offspring Genotype Frequencies
Genotype
Frequency
AA P2+PQ+Q2/4 = (P+Q/2)2
Aa 2PR+PQ+QR+Q2/2 = 2(P+Q/2)(R+Q/2)
aa R2+QR+Q2/4 = (R+Q/2)2
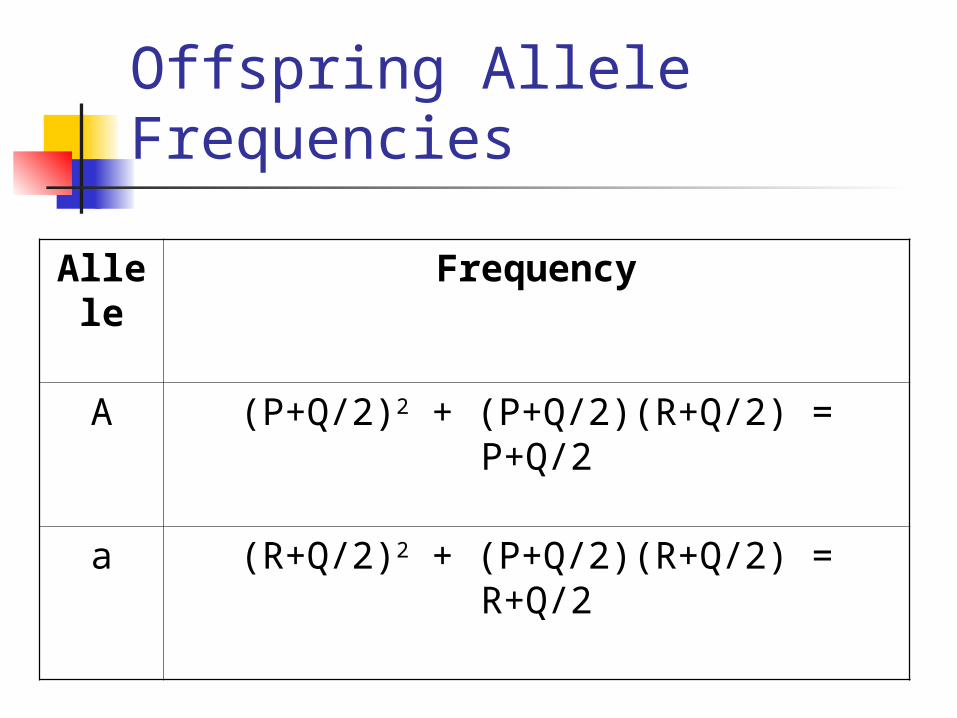
Offspring Allele Frequencies
Allele
Frequency
A (P+Q/2)2 + (P+Q/2)(R+Q/2) = P+Q/2
a (R+Q/2)2 + (P+Q/2)(R+Q/2) = R+Q/2
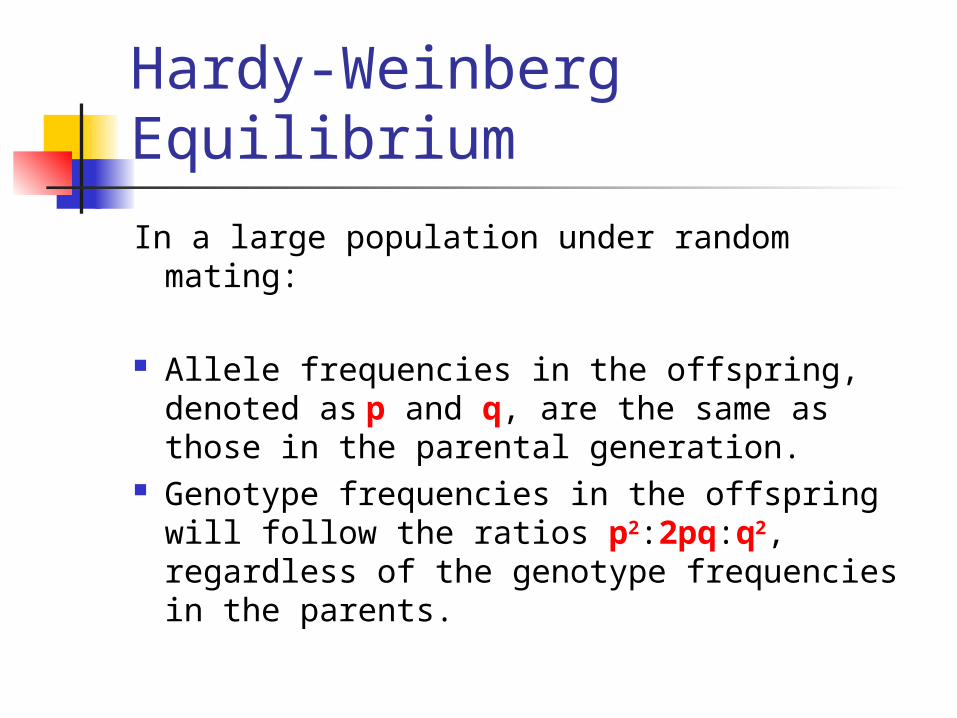
Hardy-Weinberg Equilibrium
In a large population under random mating:
Allele frequencies in the offspring, denoted as p and q, are the same as those in the parental generation.
Genotype frequencies in the offspring will follow the ratios p2:2pq:q2, regardless of the genotype frequencies in the parents.
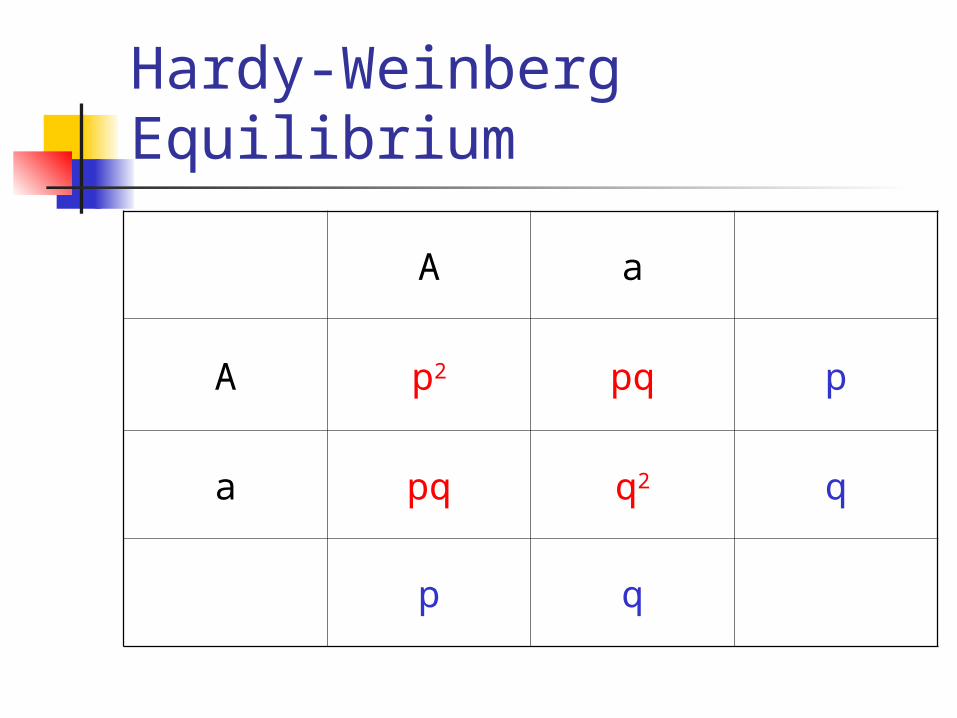
Hardy-Weinberg Equilibrium
A a
A p2 pq p
a pq q2 q
p q
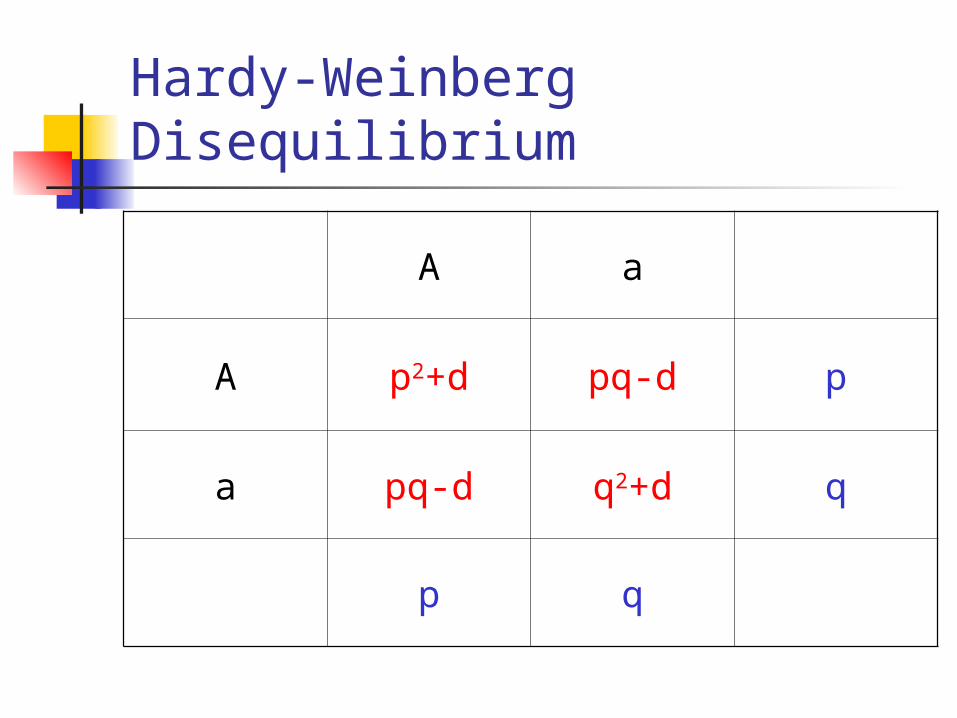
Hardy-Weinberg Disequilibrium
A a
A p2+d pq-d p
a pq-d q2+d q
p q
Genetic Linkage
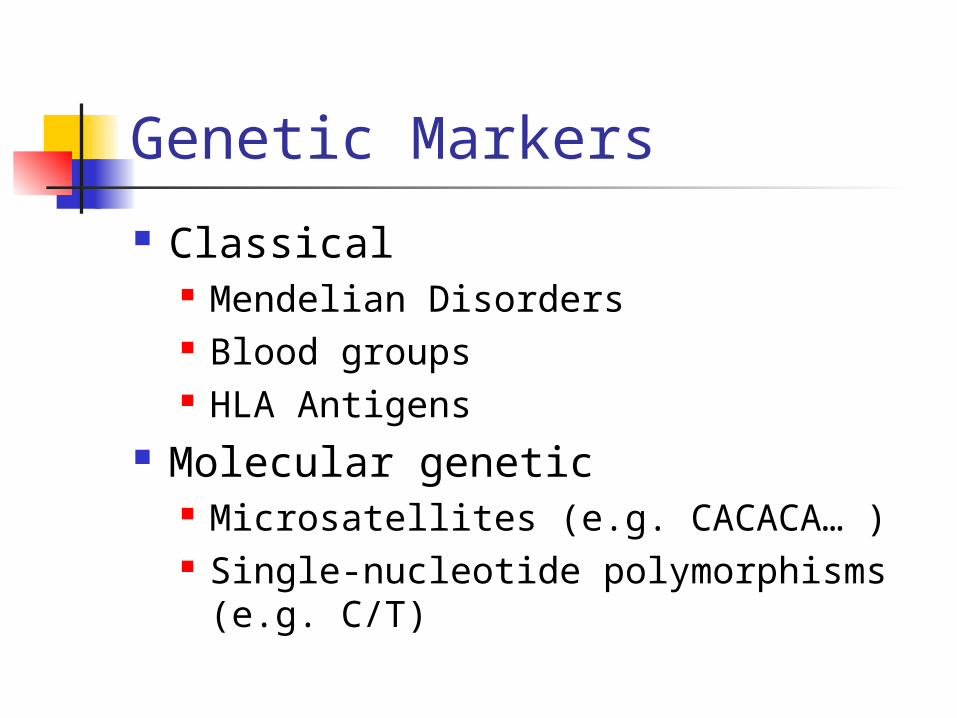
Genetic Markers
Classical Mendelian Disorders Blood groups HLA Antigens
Molecular genetic Microsatellites (e.g. CACACA… ) Single-nucleotide polymorphisms (e.g.
C/T)
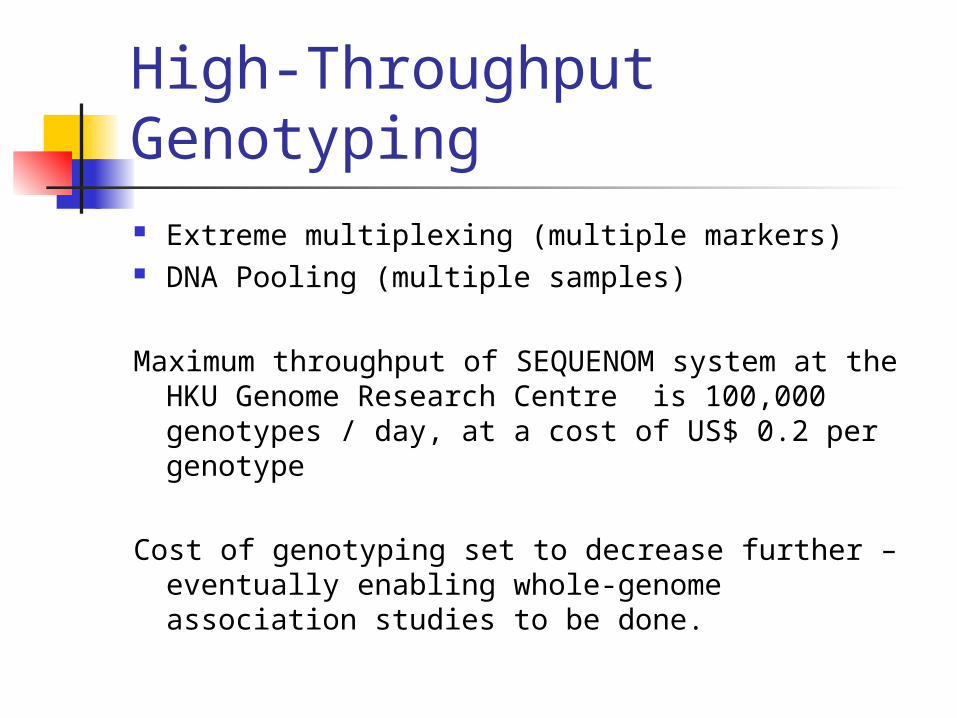
High-Throughput Genotyping Extreme multiplexing (multiple markers) DNA Pooling (multiple samples)
Maximum throughput of SEQUENOM system at the HKU Genome Research Centre is 100,000 genotypes / day, at a cost of US$ 0.2 per genotype
Cost of genotyping set to decrease further – eventually enabling whole-genome association studies to be done.
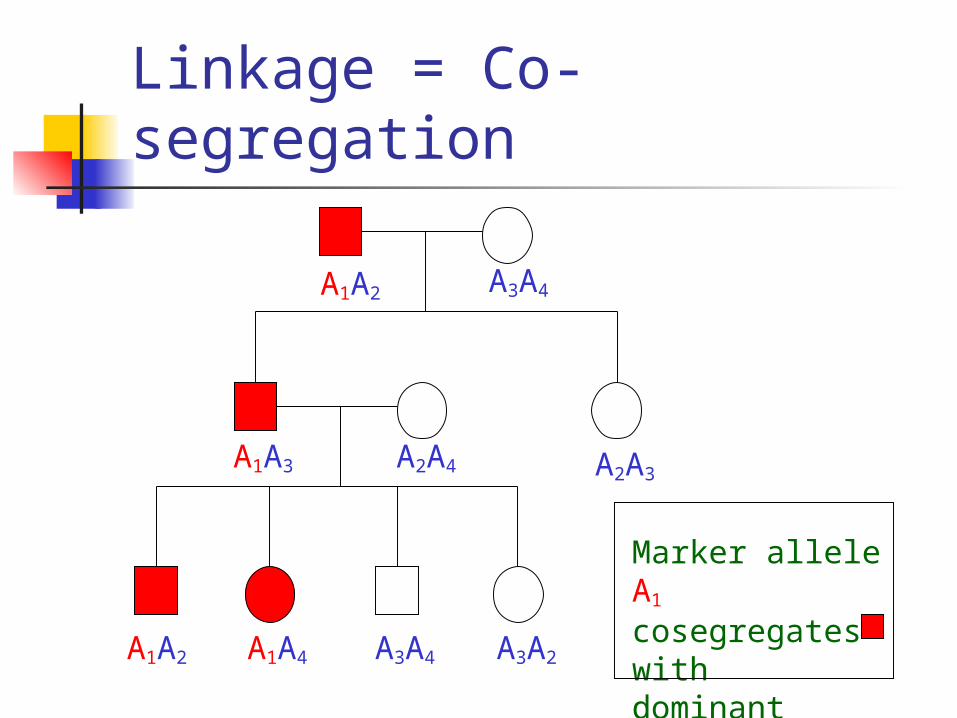
Linkage = Co-segregation
A2A4
A3A4
A1A3
A1A2
A2A3
A1A2 A1A4 A3A4 A3A2
Marker allele A1
cosegregates withdominant disease
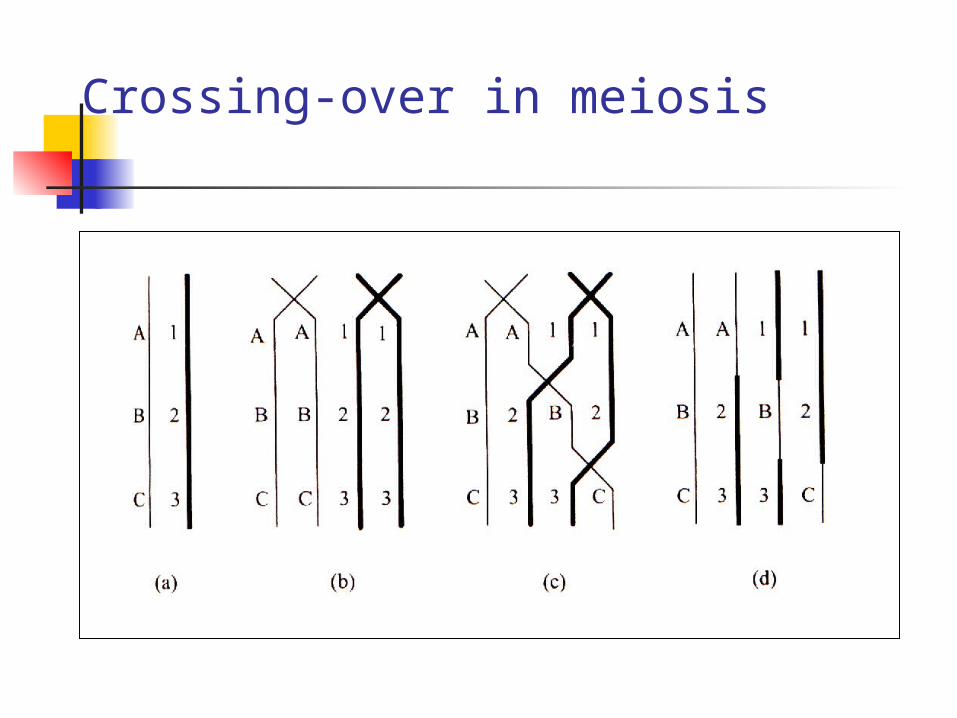
Crossing-over in meiosis
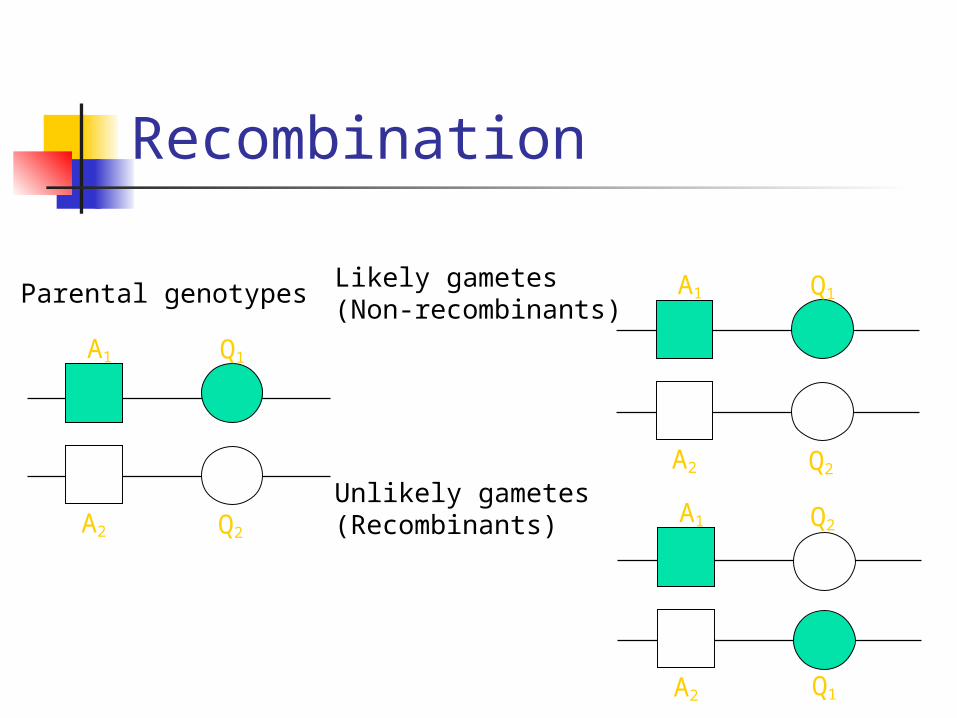
Recombination
A1
A2
Q1
Q2
A1
A2
Q1
Q2
A1
A2 Q1
Q2
Likely gametes(Non-recombinants)
Unlikely gametes(Recombinants)
Parental genotypes
Recombination fraction
Recombination fraction between two loci
= Proportion of gametes that are recombinant with respect to the two loci
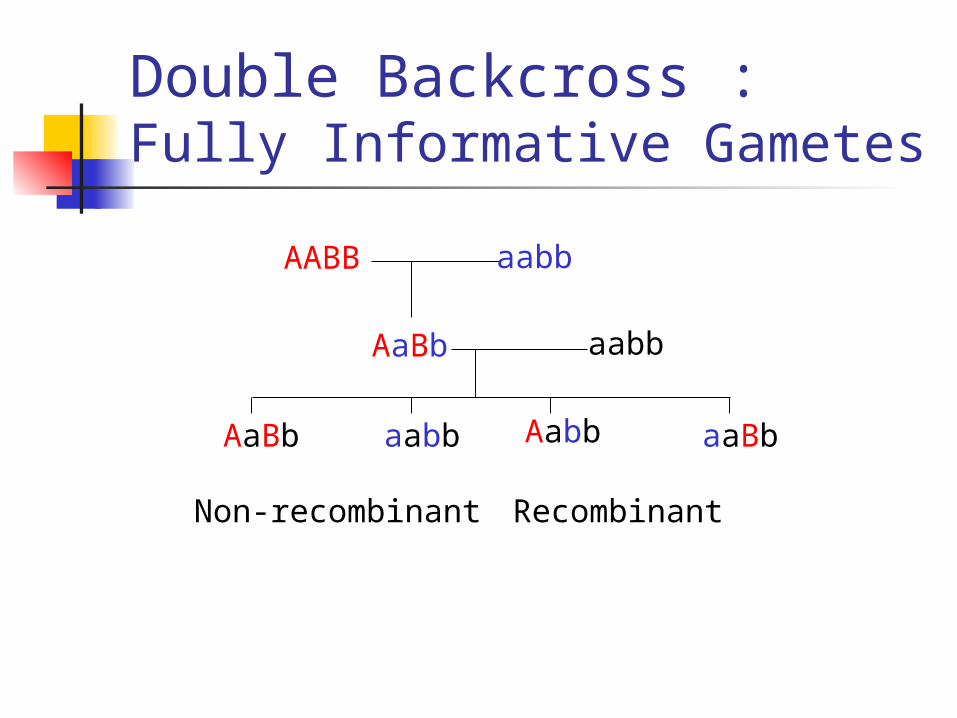
Double Backcross :Fully Informative Gametes
AaBb aabb
AABB aabb
AaBb aabb Aabb aaBb
Non-recombinant Recombinant
Haplotypes
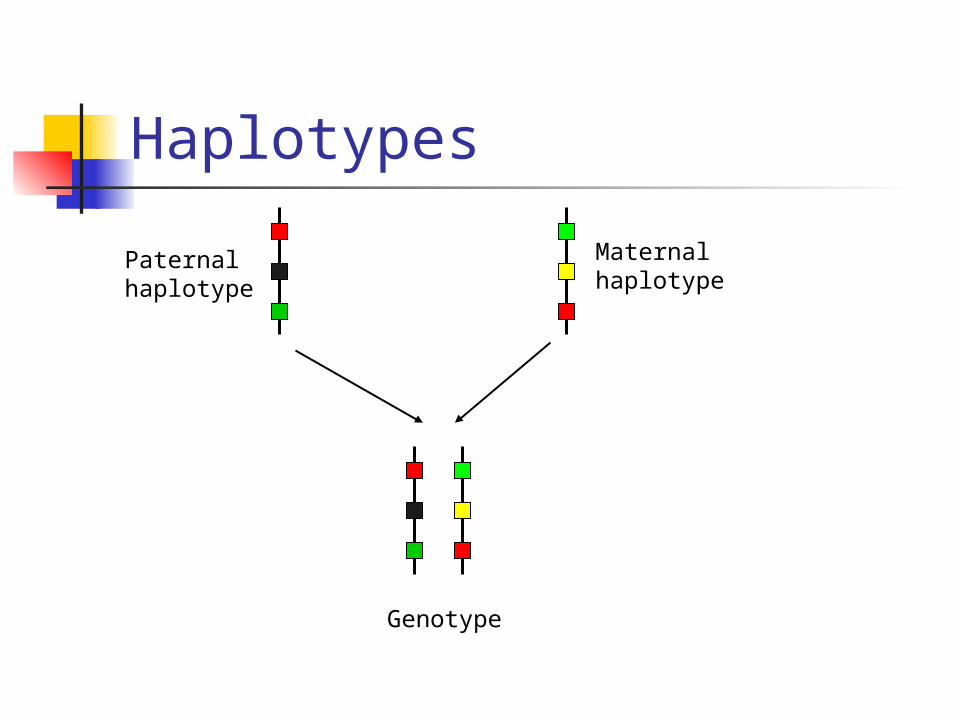
Haplotypes
Paternalhaplotype
Maternalhaplotype
Genotype
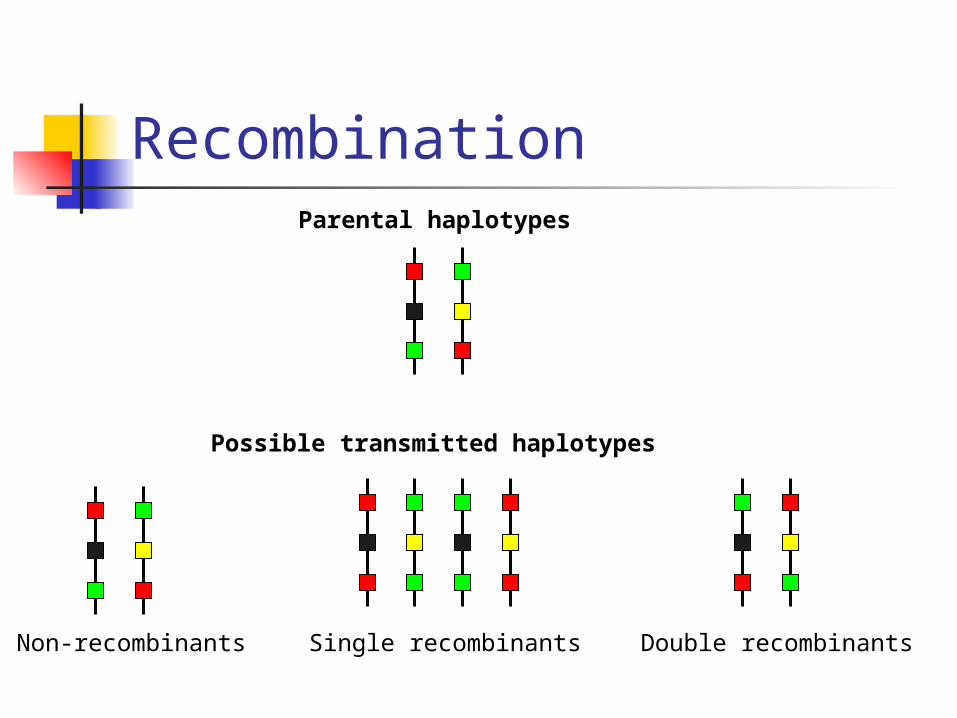
RecombinationParental haplotypes
Non-recombinants Single recombinants Double recombinants
Possible transmitted haplotypes
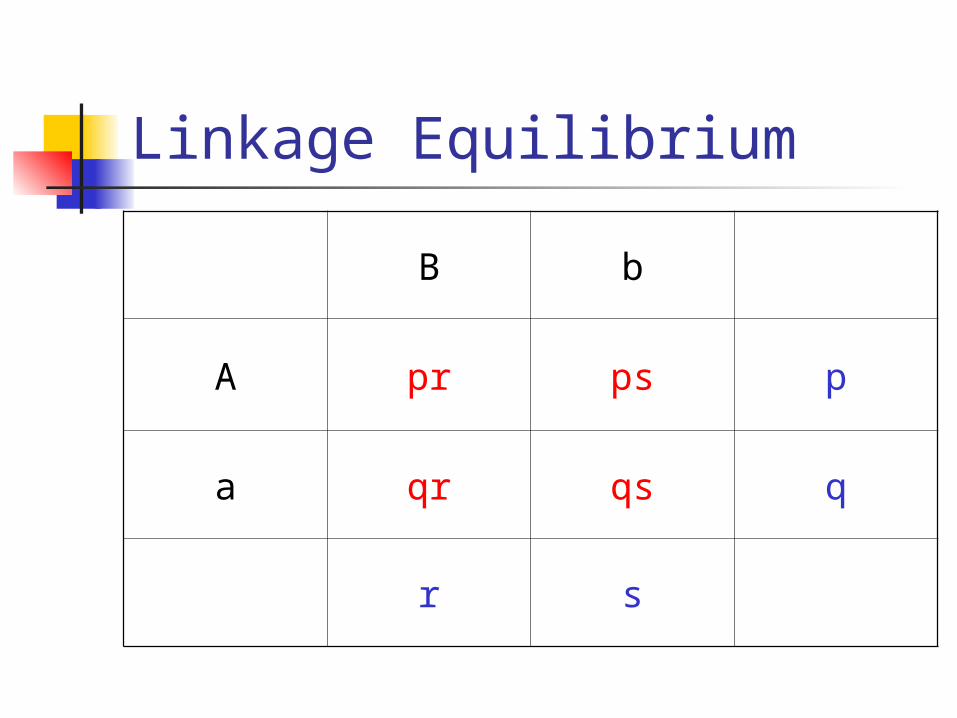
Linkage Equilibrium
B b
A pr ps p
a qr qs q
r s
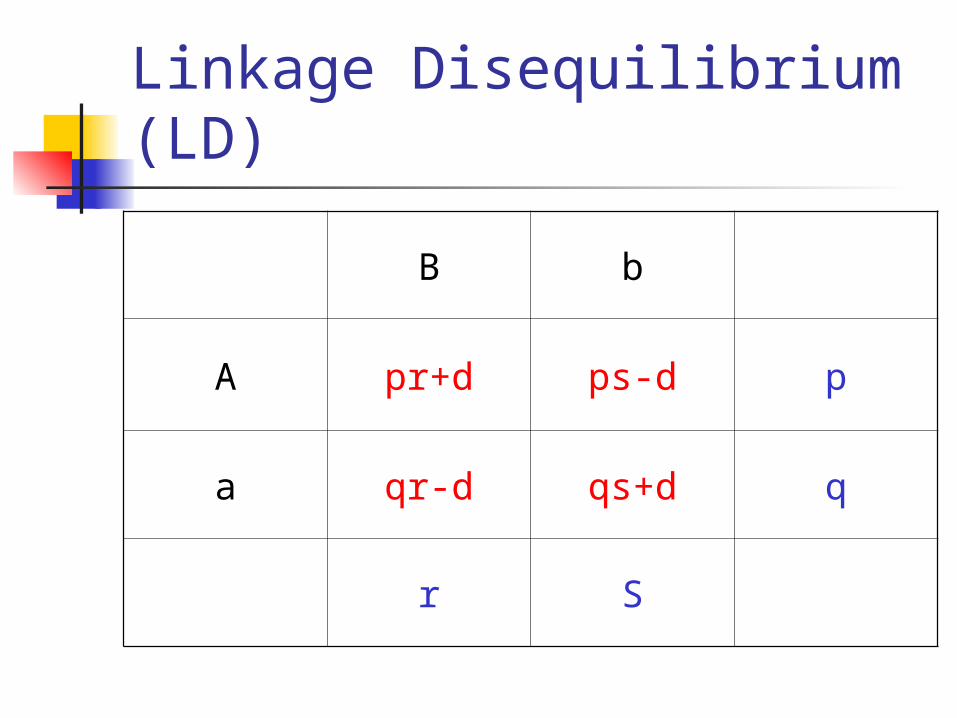
Linkage Disequilibrium (LD)
B b
A pr+d ps-d p
a qr-d qs+d q
r S
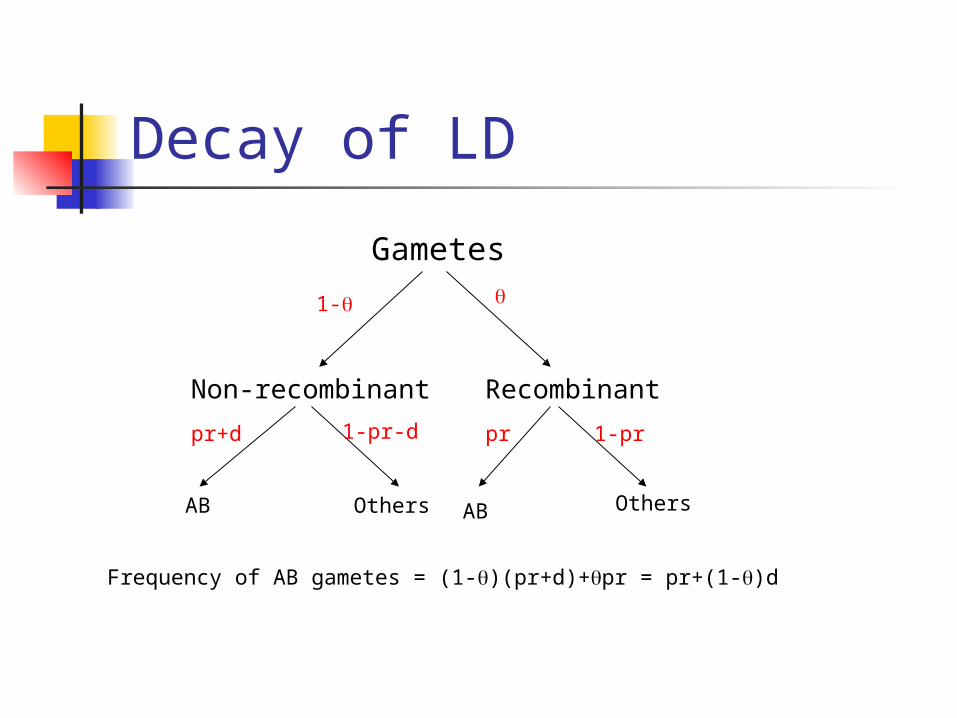
Decay of LD
Gametes
1-
Non-recombinant Recombinant
pr+d 1-pr-d pr 1-pr
AB Others AB Others
Frequency of AB gametes = (1-)(pr+d)+pr = pr+(1-)d
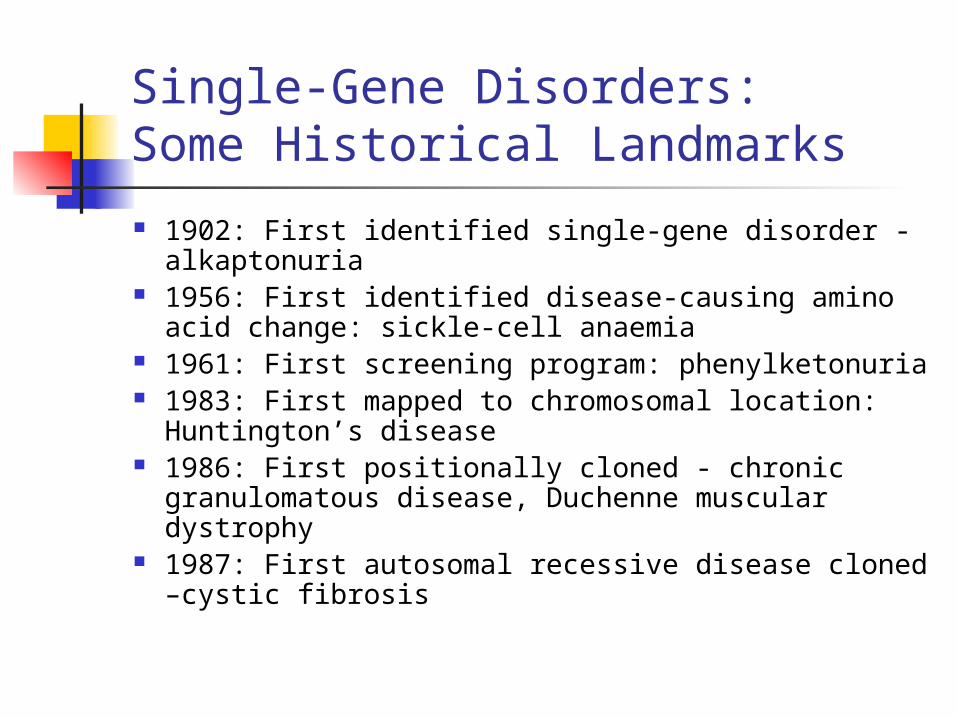
Single-Gene Disorders: Some Historical Landmarks
1902: First identified single-gene disorder - alkaptonuria
1956: First identified disease-causing amino acid change: sickle-cell anaemia
1961: First screening program: phenylketonuria 1983: First mapped to chromosomal location:
Huntington’s disease 1986: First positionally cloned - chronic
granulomatous disease, Duchenne muscular dystrophy
1987: First autosomal recessive disease cloned –cystic fibrosis
Types of Genetic Disease Mendelian diseases
e.g. Huntington’s disease, cystic fibrosis A genetic mutation causes the disease Environmental variation usually irrelevant Usually rare Occurs in isolated pedigrees
Multifactorial diseases e.g. Coronary heart disease, hypertension, schizophrenia A genetic variant increases the risk of disease Environmental variation usually important Often common Occurs in general population
Genetic Study Designs
Family StudiesCase – Control Family Design
Compares risk in relatives of case and controls
Some terminologyProbandSecondary caseLifetime risk / expectancy (morbid risk)
Problem: Familial aggregation can be due to shared family environment as well as shared genes
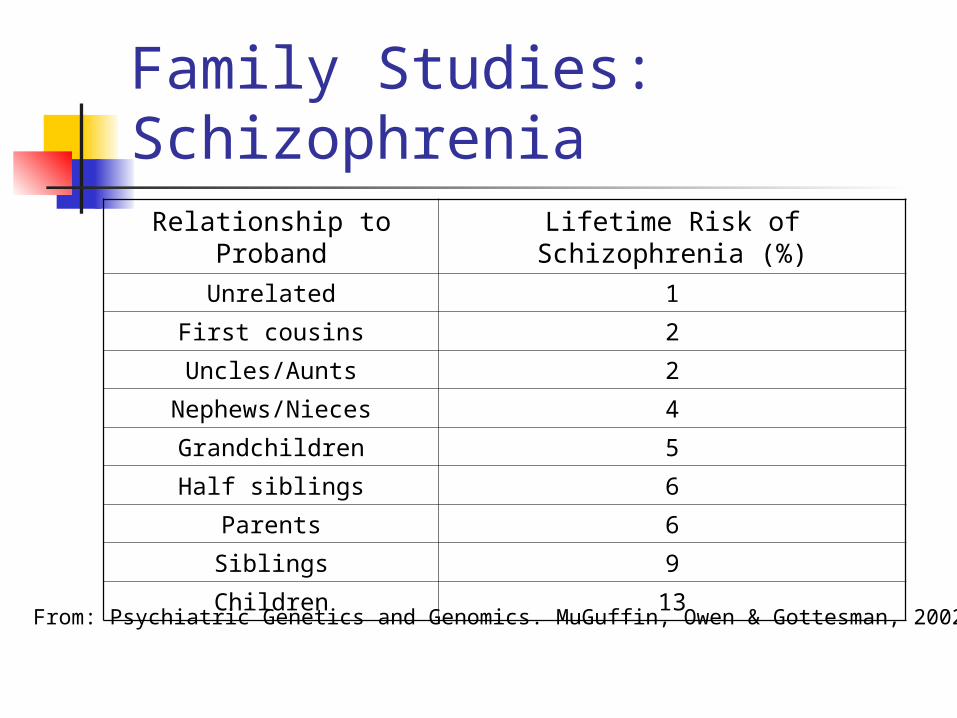
Family Studies: Schizophrenia
Relationship to Proband
Lifetime Risk of Schizophrenia (%)
Unrelated 1
First cousins 2
Uncles/Aunts 2
Nephews/Nieces 4
Grandchildren 5
Half siblings 6
Parents 6
Siblings 9
Children 13From: Psychiatric Genetics and Genomics. MuGuffin, Owen & Gottesman, 2002
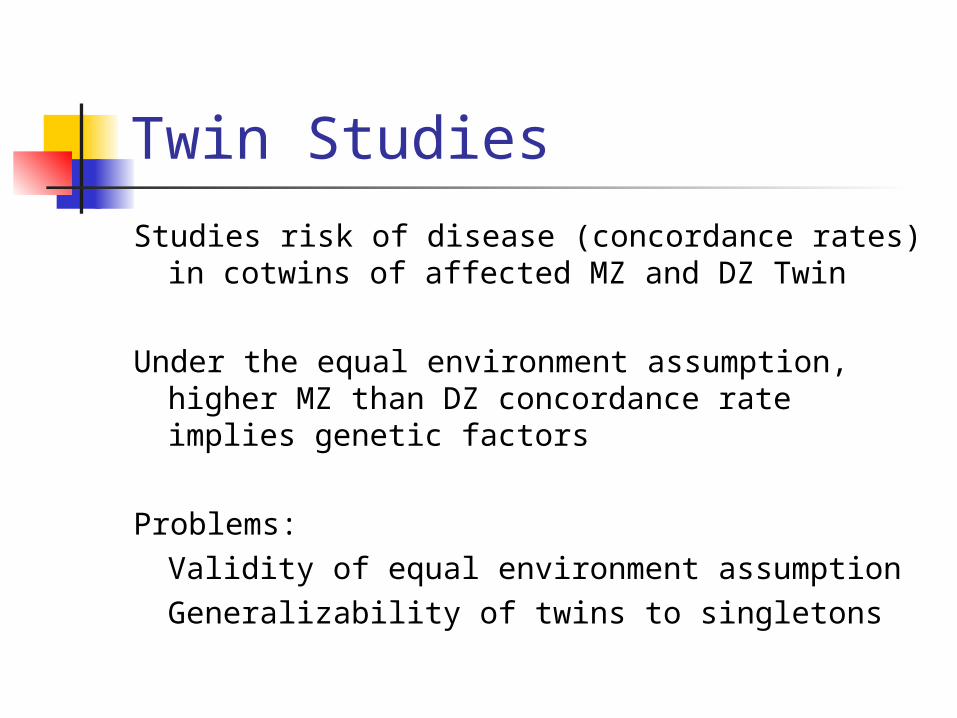
Twin Studies
Studies risk of disease (concordance rates) in cotwins of affected MZ and DZ Twin
Under the equal environment assumption, higher MZ than DZ concordance rate implies genetic factors
Problems:Validity of equal environment assumptionGeneralizability of twins to singletons
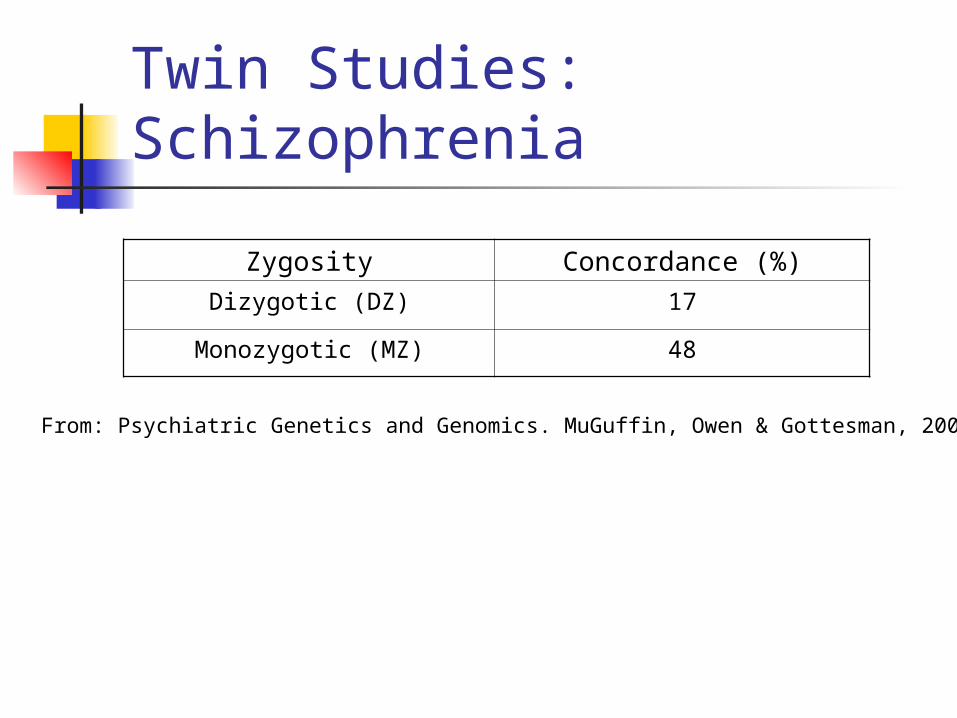
Twin Studies: Schizophrenia
Zygosity Concordance (%)
Dizygotic (DZ) 17
Monozygotic (MZ) 48
From: Psychiatric Genetics and Genomics. MuGuffin, Owen & Gottesman, 2002
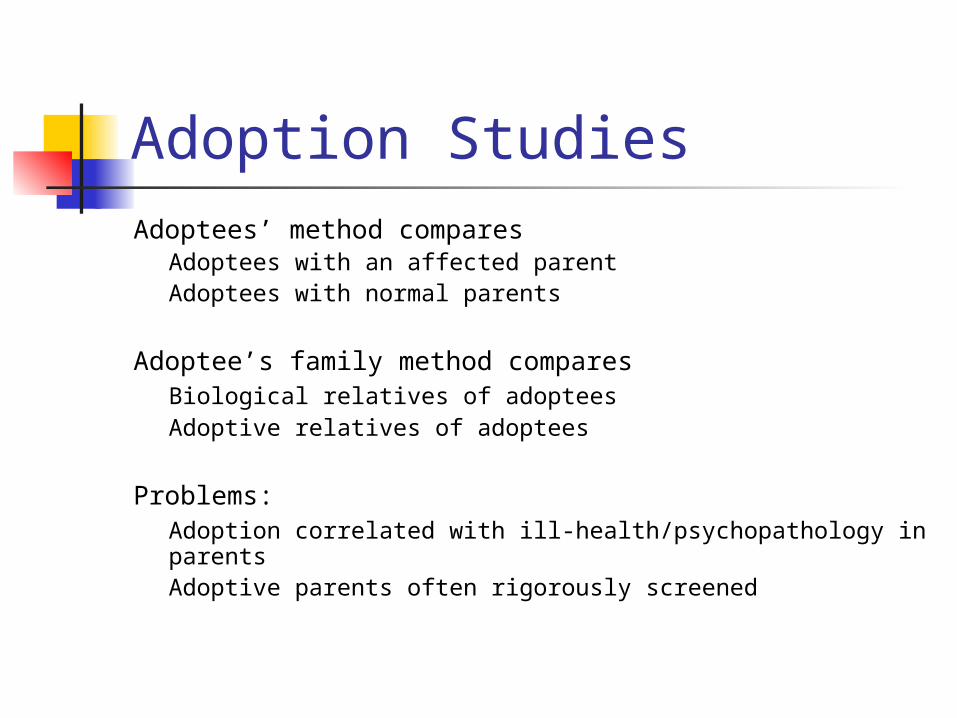
Adoption StudiesAdoptees’ method compares
Adoptees with an affected parentAdoptees with normal parents
Adoptee’s family method comparesBiological relatives of adopteesAdoptive relatives of adoptees
Problems:Adoption correlated with ill-health/psychopathology in parentsAdoptive parents often rigorously screened
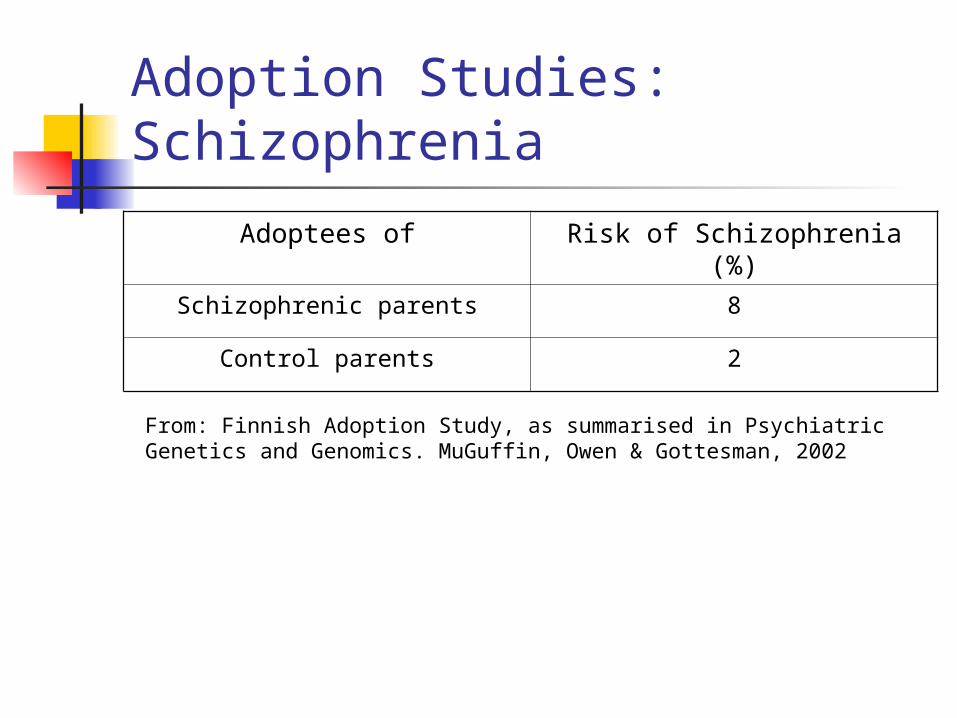
Adoption Studies: Schizophrenia
Adoptees of Risk of Schizophrenia (%)
Schizophrenic parents 8
Control parents 2
From: Finnish Adoption Study, as summarised in Psychiatric Genetics and Genomics. MuGuffin, Owen & Gottesman, 2002
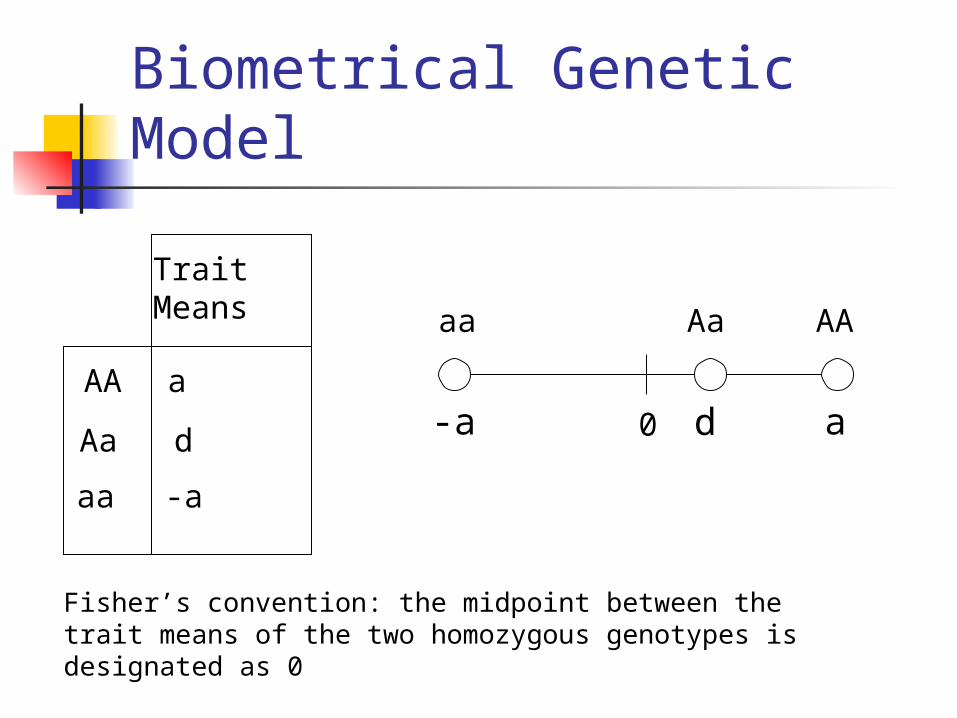
Biometrical Genetic Model
Biometrical Genetic Model
0 d a-a
Trait Means
AA
Aa
aa
a
d
-a
aa Aa AA
Fisher’s convention: the midpoint between the trait means of the two homozygous genotypes is designated as 0
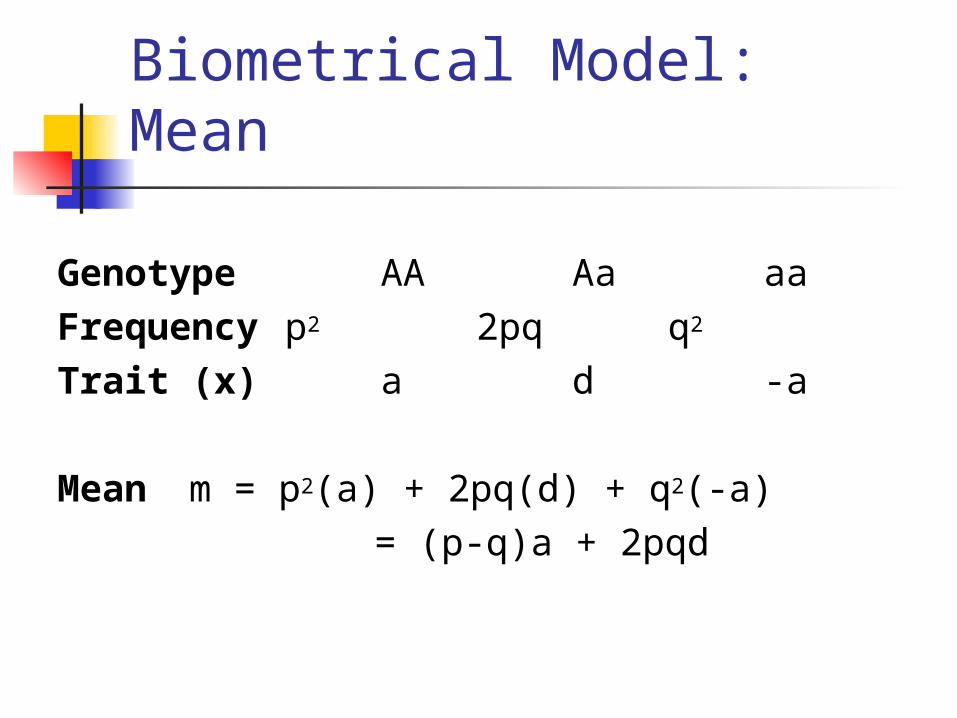
Biometrical Model: Mean
Genotype AA Aa aaFrequency p2 2pq q2
Trait (x) a d -a
Mean m = p2(a) + 2pq(d) + q2(-a) = (p-q)a + 2pqd
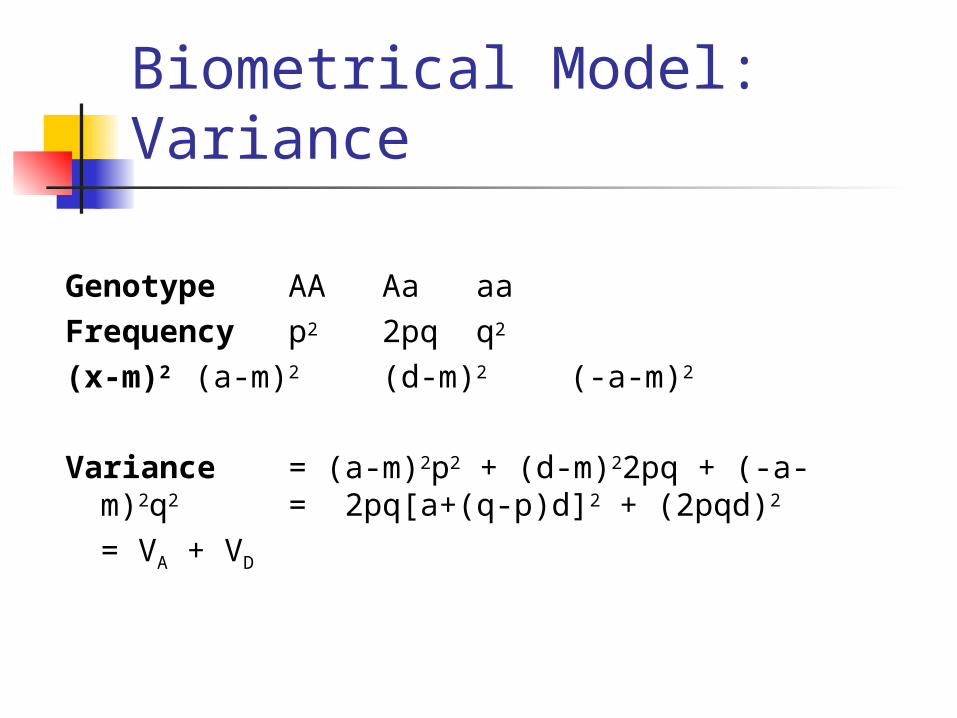
Biometrical Model: Variance
Genotype AA Aa aaFrequency p2 2pq q2
(x-m)2 (a-m)2 (d-m)2
(-a-m)2
Variance = (a-m)2p2 + (d-m)22pq + (-a-m)2q2
= 2pq[a+(q-p)d]2 + (2pqd)2 = VA + VD
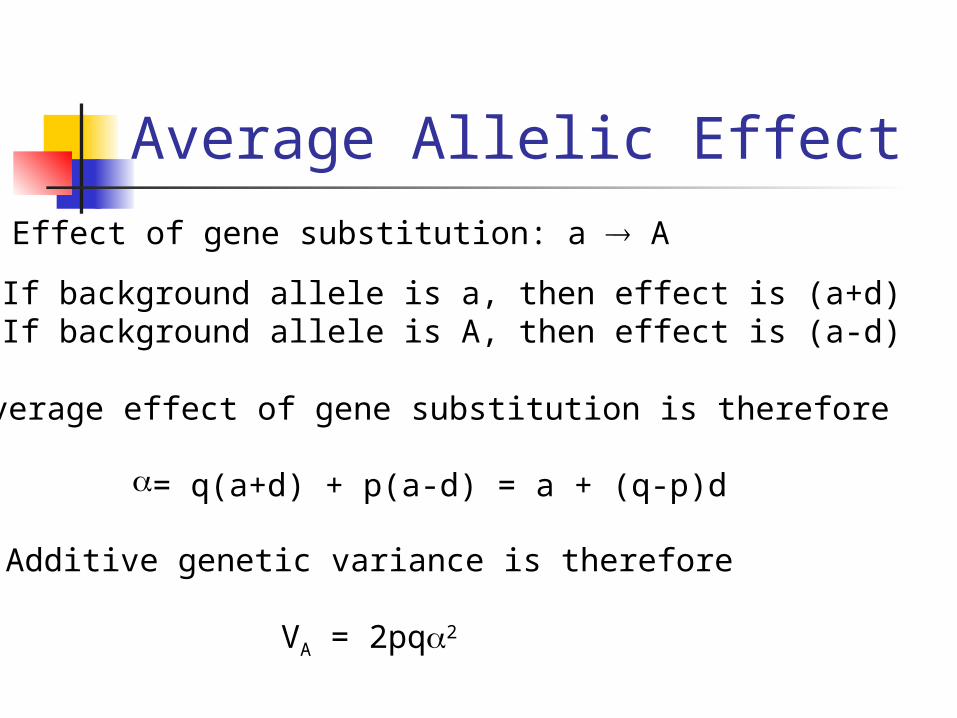
Average Allelic Effect
Effect of gene substitution: a A
If background allele is a, then effect is (a+d)If background allele is A, then effect is (a-d)
Average effect of gene substitution is therefore
= q(a+d) + p(a-d) = a + (q-p)d
Additive genetic variance is therefore
VA = 2pq2
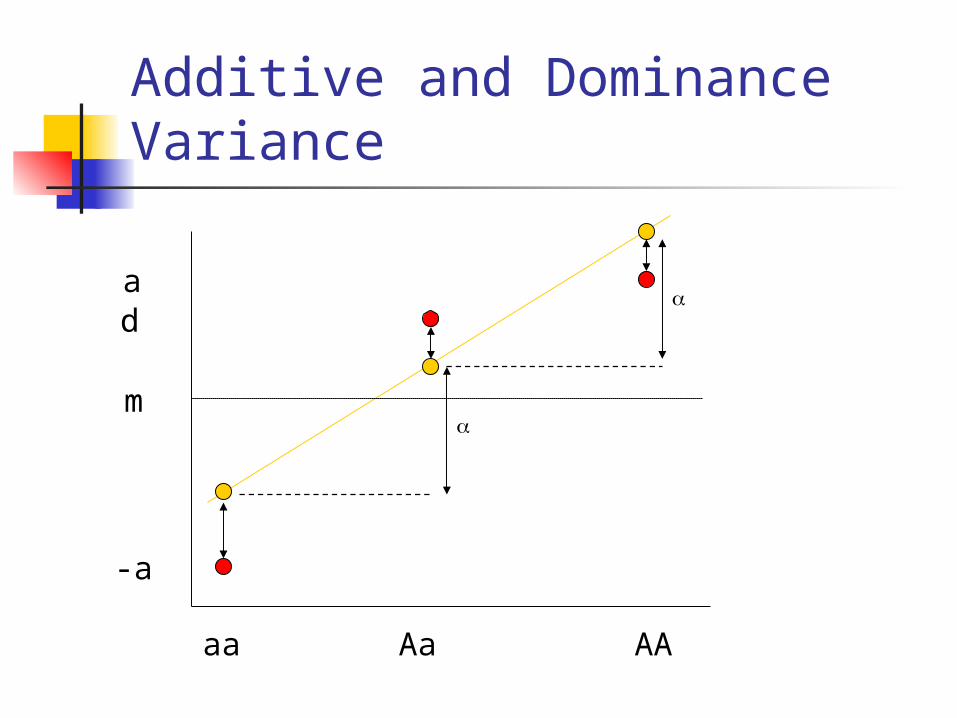
Additive and Dominance Variance
aa Aa AA
m
-a
ad
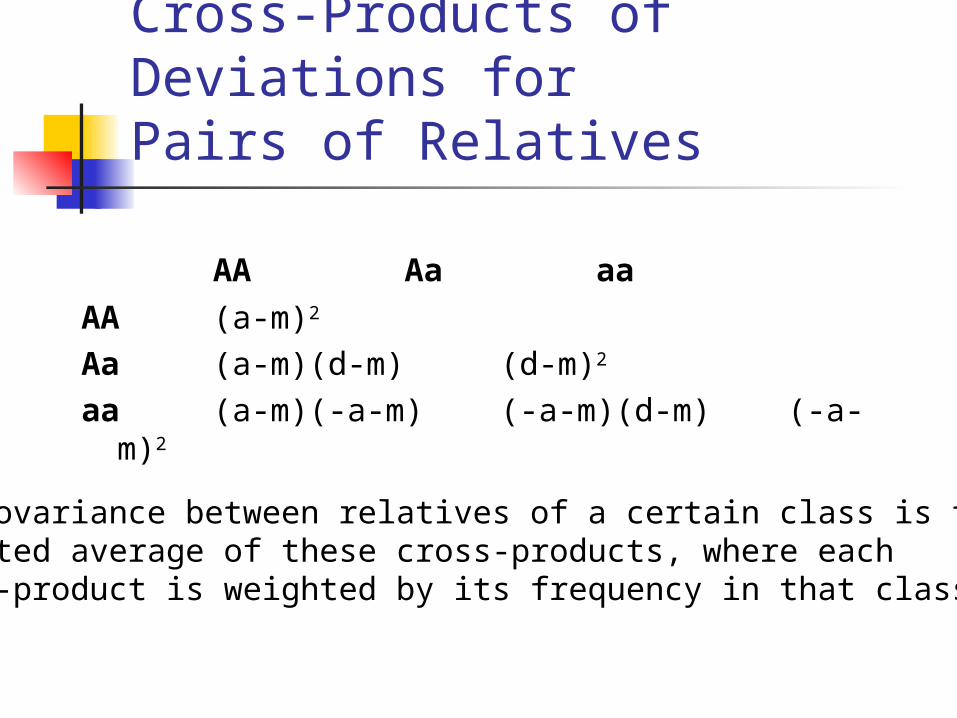
Cross-Products of Deviations for Pairs of Relatives
AA Aa aa
AA (a-m)2
Aa (a-m)(d-m) (d-m)2
aa (a-m)(-a-m) (-a-m)(d-m) (-a-m)2
The covariance between relatives of a certain class is the weighted average of these cross-products, where each cross-product is weighted by its frequency in that class.
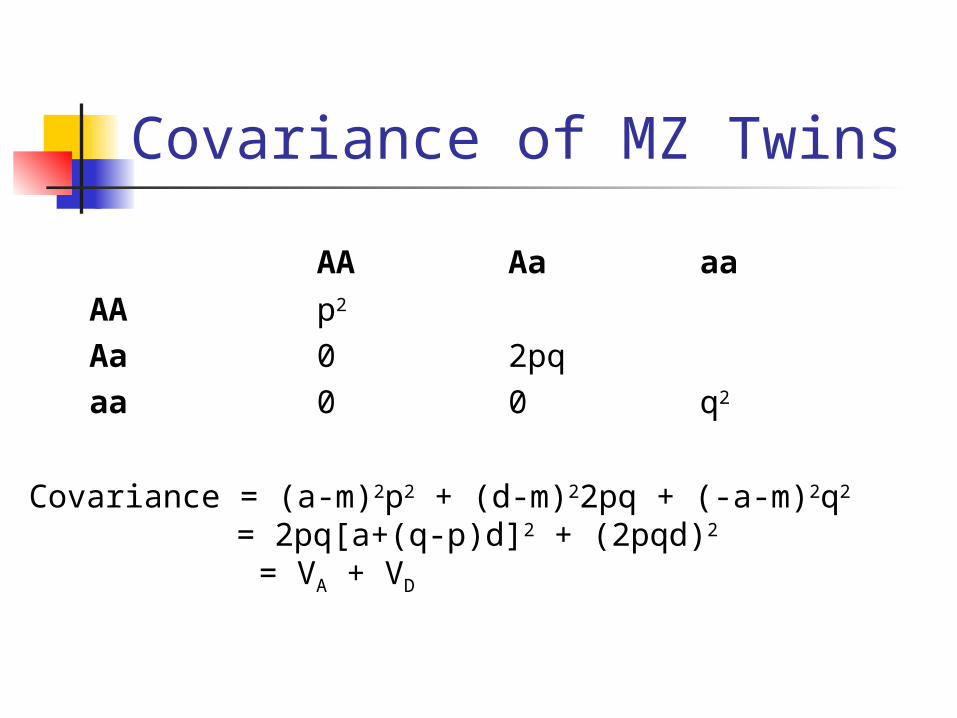
Covariance of MZ Twins
AA Aa aa
AA p2
Aa 0 2pqaa 0 0 q2
Covariance = (a-m)2p2 + (d-m)22pq + (-a-m)2q2
= 2pq[a+(q-p)d]2 + (2pqd)2
= VA + VD
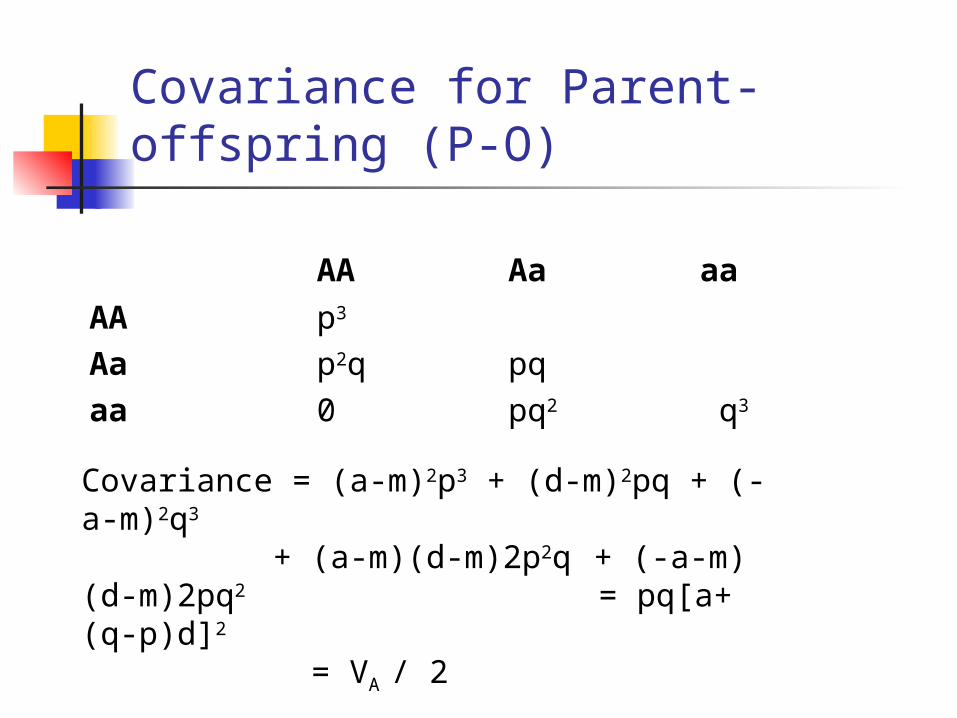
Covariance for Parent-offspring (P-O)
AA Aa aa
AA p3
Aa p2q pqaa 0 pq2 q3
Covariance = (a-m)2p3 + (d-m)2pq + (-a-m)2q3
+ (a-m)(d-m)2p2q + (-a-m)(d-m)2pq2
= pq[a+(q-p)d]2
= VA / 2
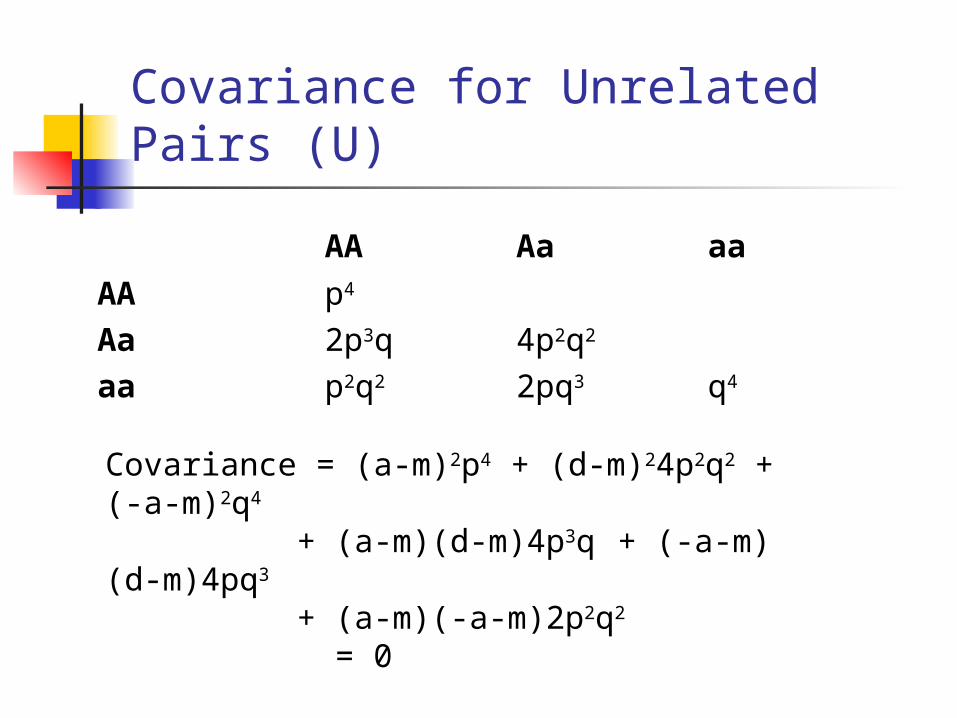
Covariance for Unrelated Pairs (U)
AA Aa aa
AA p4
Aa 2p3q 4p2q2
aa p2q2 2pq3 q4
Covariance = (a-m)2p4 + (d-m)24p2q2 + (-a-m)2q4
+ (a-m)(d-m)4p3q + (-a-m)(d-m)4pq3
+ (a-m)(-a-m)2p2q2
= 0
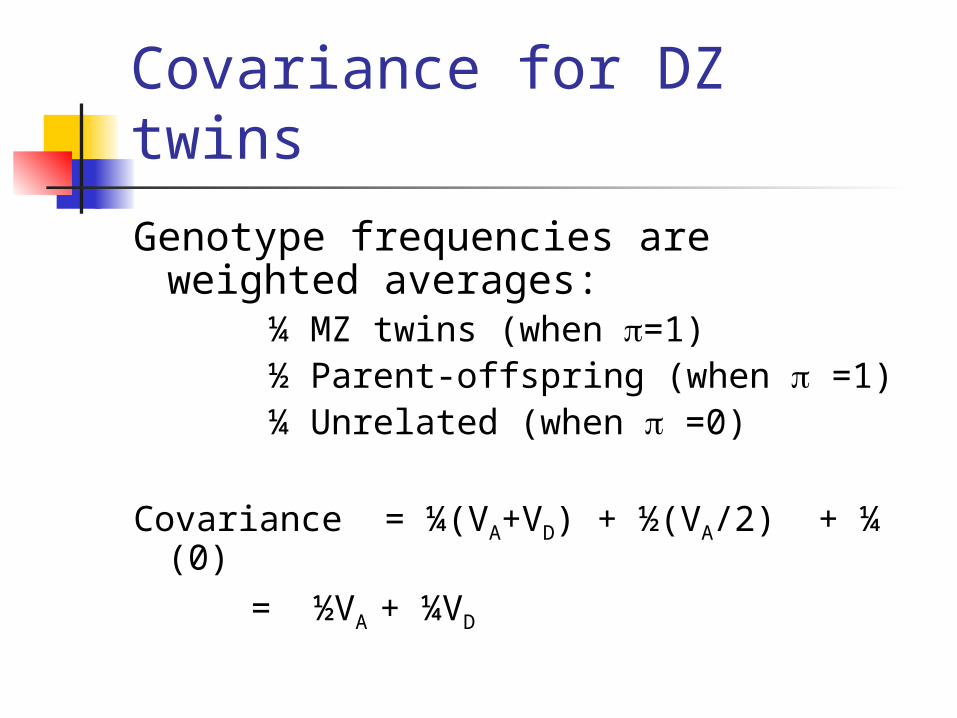
Covariance for DZ twins
Genotype frequencies are weighted averages:
¼ MZ twins (when =1)½ Parent-offspring (when =1)¼ Unrelated (when =0)
Covariance = ¼(VA+VD) + ½(VA/2) + ¼ (0)
= ½VA + ¼VD
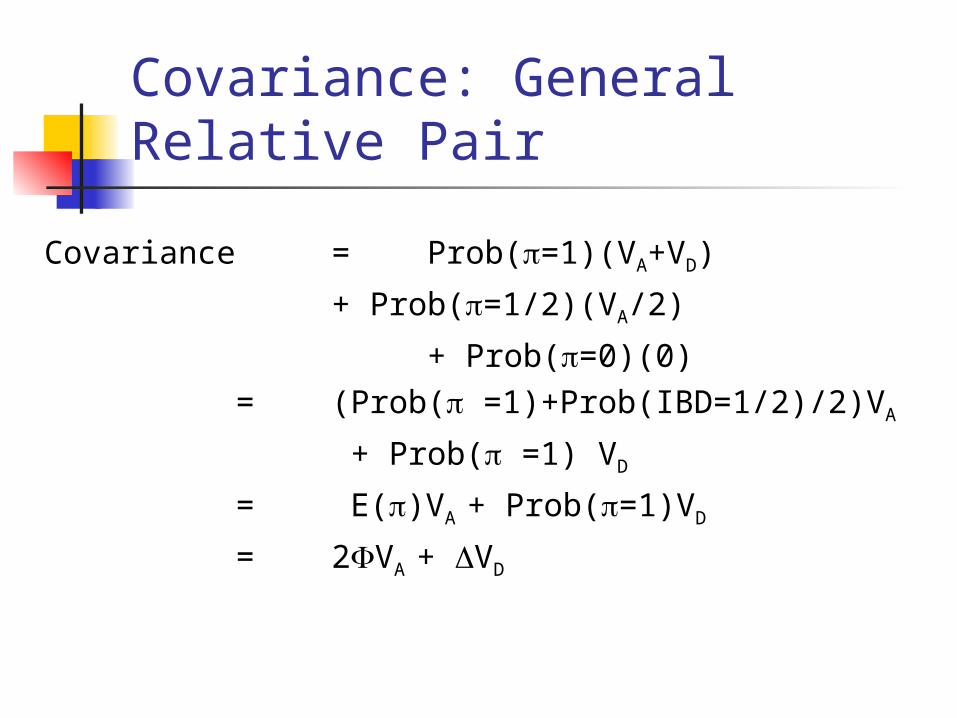
Covariance: General Relative Pair
Covariance = Prob(=1)(VA+VD)
+ Prob(=1/2)(VA/2)
+ Prob(=0)(0)= (Prob( =1)+Prob(IBD=1/2)/2)VA
+ Prob( =1) VD
= E()VA + Prob(=1)VD
= 2VA + VD
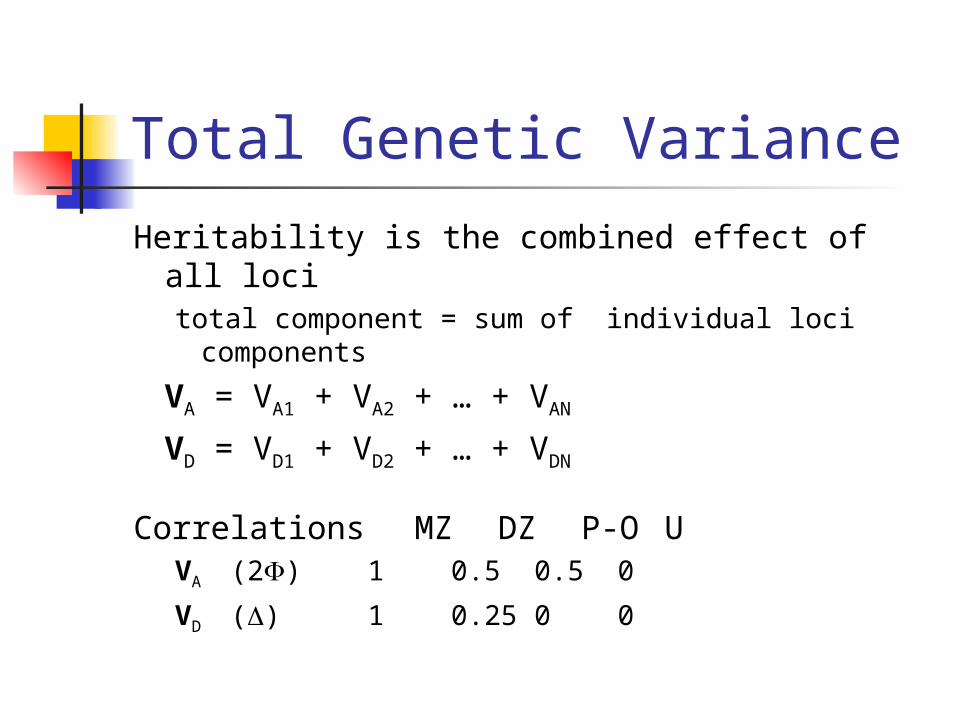
Total Genetic Variance
Heritability is the combined effect of all locitotal component = sum of individual loci
components
VA = VA1 + VA2 + … + VAN
VD = VD1 + VD2 + … + VDN
Correlations MZ DZ P-O UVA (2) 1 0.5 0.5 0
VD () 1 0.25 0 0
Quantitative Genetics
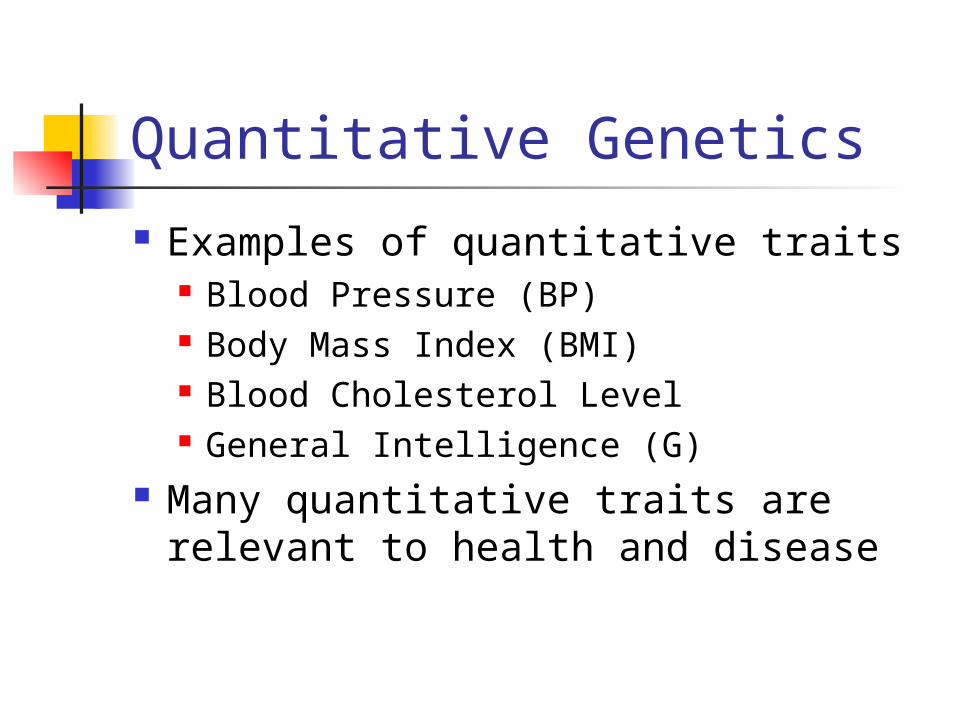
Quantitative Genetics
Examples of quantitative traits Blood Pressure (BP) Body Mass Index (BMI) Blood Cholesterol Level General Intelligence (G)
Many quantitative traits are relevant to health and disease
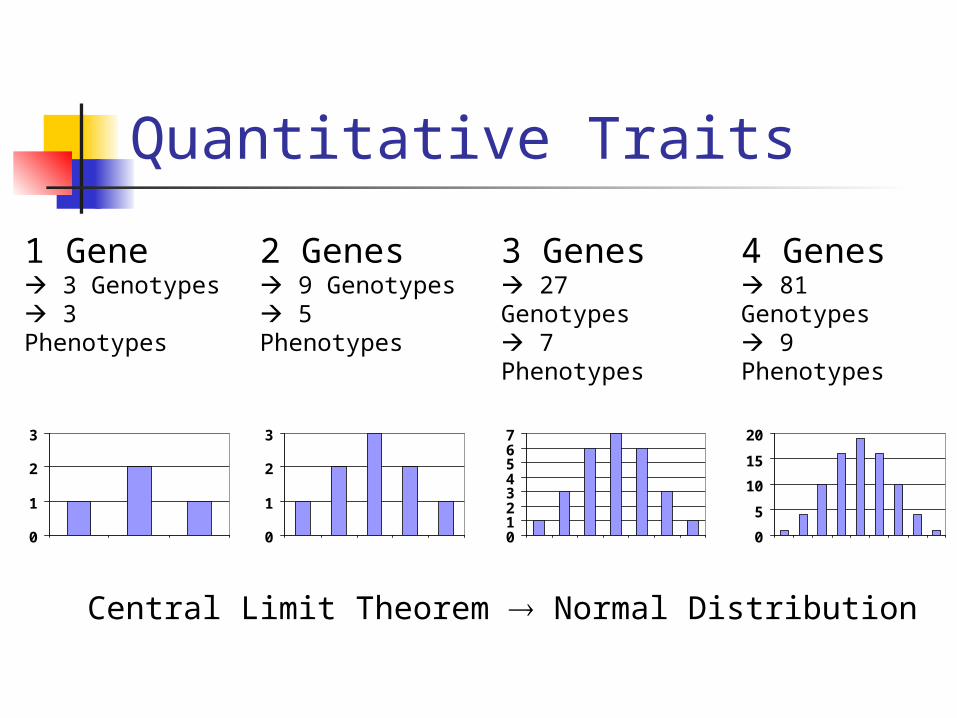
Quantitative Traits
0
1
2
3
1 Gene 3 Genotypes 3 Phenotypes
0
1
2
3
2 Genes 9 Genotypes 5 Phenotypes
01234567
3 Genes 27 Genotypes 7 Phenotypes
0
5
10
15
20
4 Genes 81 Genotypes 9 Phenotypes
Central Limit Theorem Normal Distribution
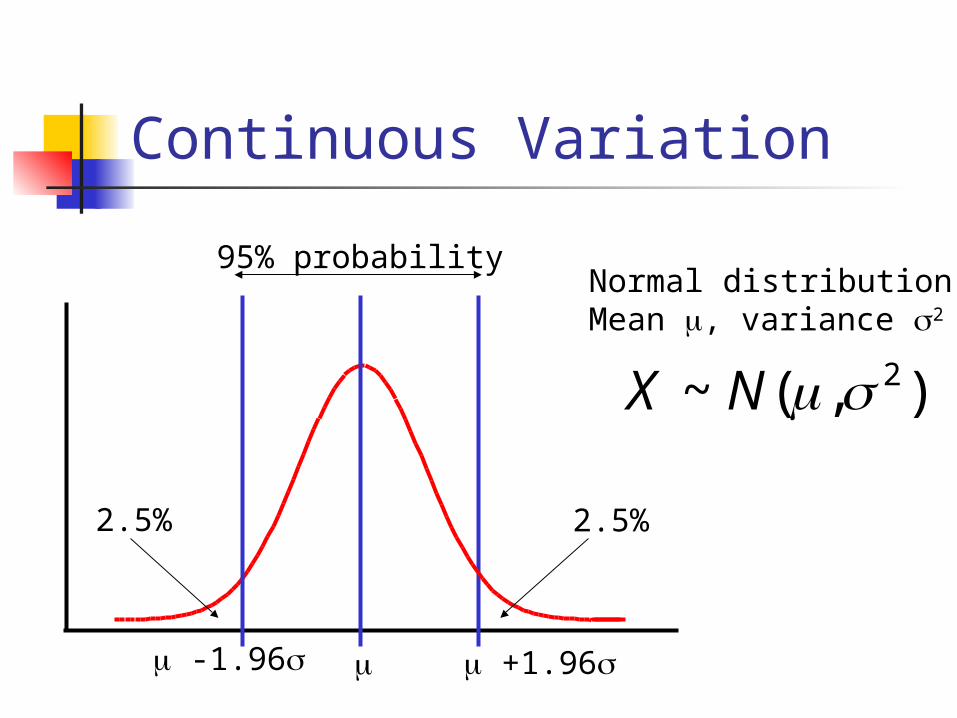
Continuous Variation
+1.96 -1.96
2.5%2.5%
95% probability
),(~ 2NX
Normal distributionMean , variance 2
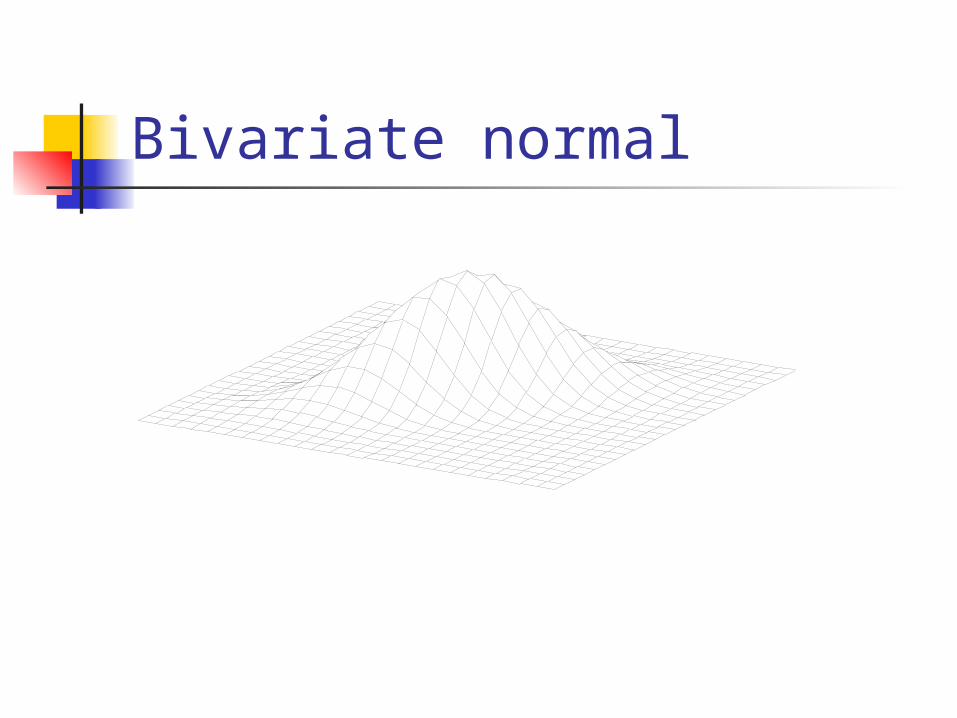
Bivariate normal
-3 -2 -1 0 1 2 3 -3-2
-10
12
3
0.30.40.5
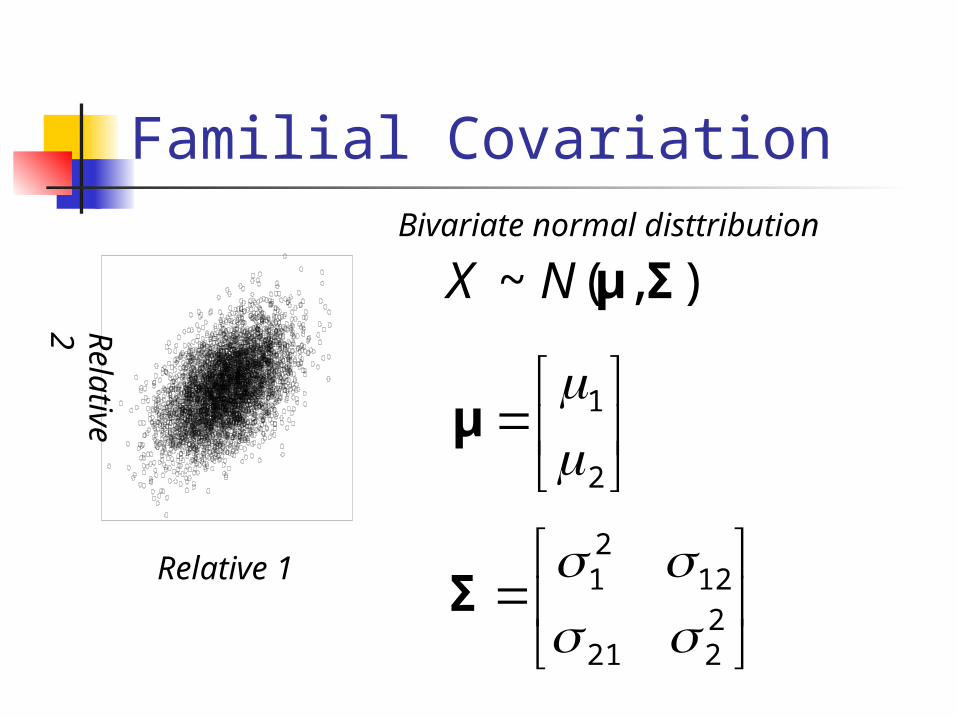
Familial Covariation
s1
s2-5.5 5.5
-5.5
5.5
Relative 1
Relative
2
),(~ ΣμNXBivariate normal disttribution
2
1
μ
2221
1221
Σ
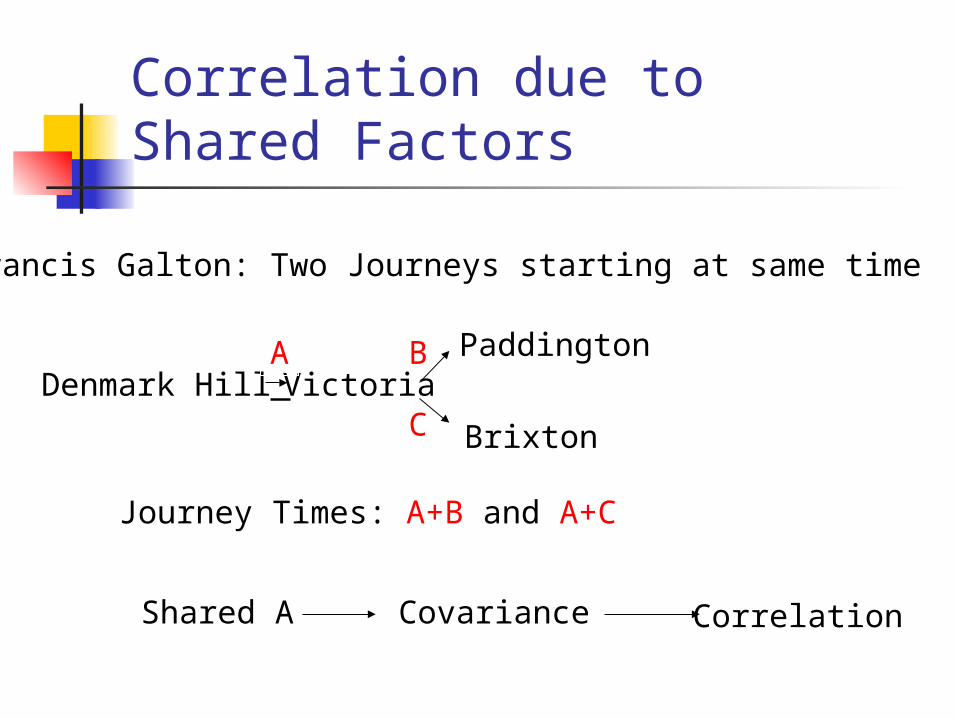
Correlation due to Shared Factors
Francis Galton: Two Journeys starting at same time
Denmark Hill VictoriaPaddington
Brixton
A B
C
Journey Times: A+B and A+C
Shared A Covariance Correlation
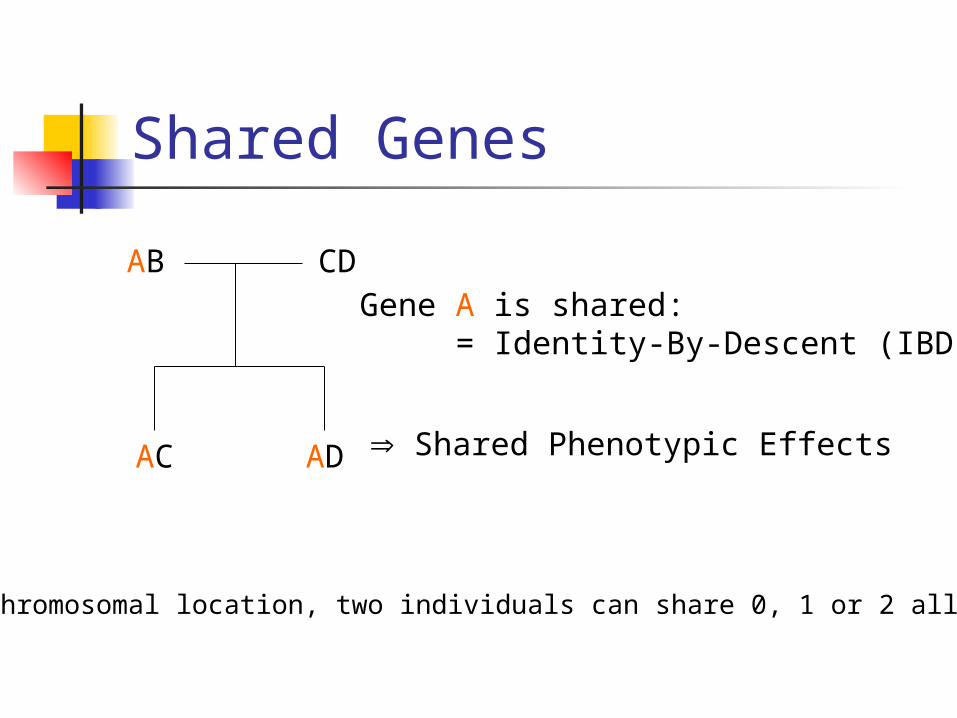
Shared Genes
AB CD
AC AD
Gene A is shared:= Identity-By-Descent (IBD)
Shared Phenotypic Effects
At any chromosomal location, two individuals can share 0, 1 or 2 alleles.
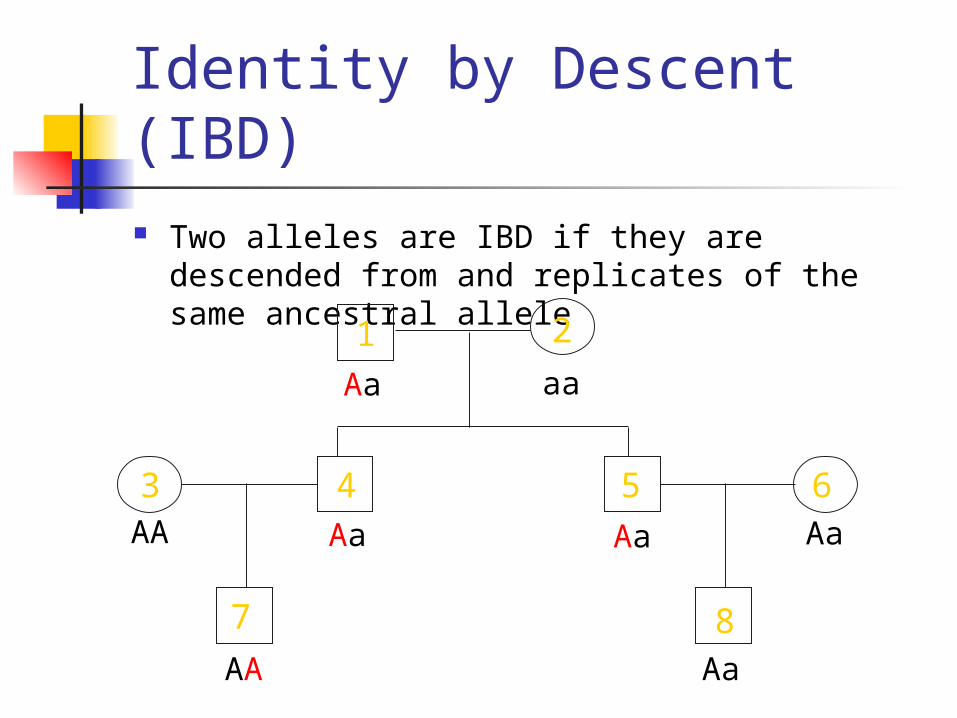
Identity by Descent (IBD) Two alleles are IBD if they are descended from
and replicates of the same ancestral allele
7
Aa
Aa Aa
AA
aa
AA
Aa
Aa
1 2
3 4 5 6
8
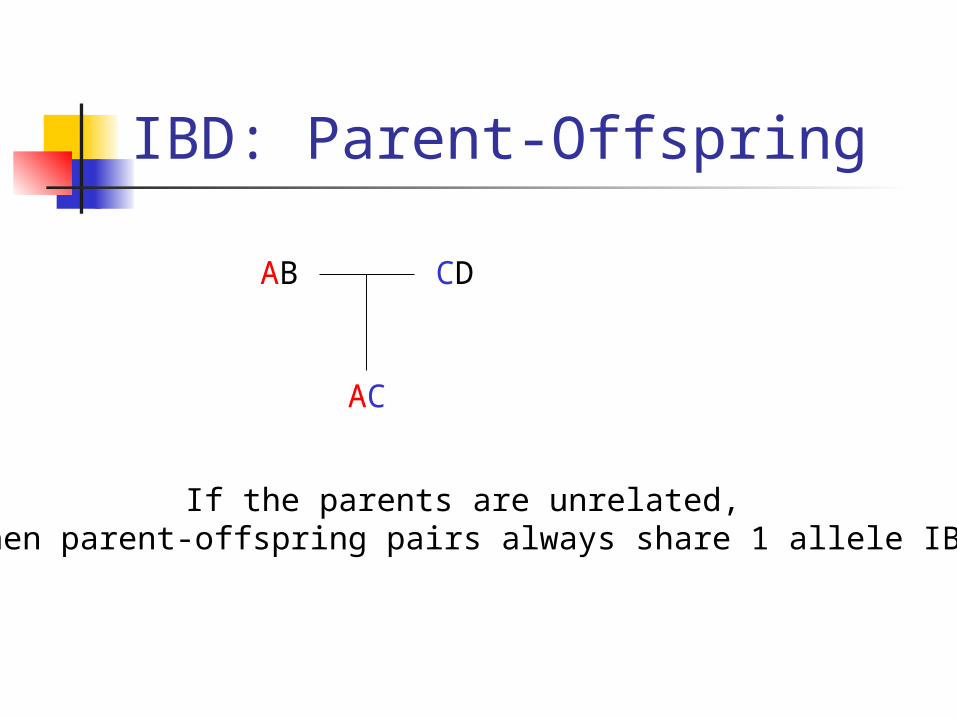
IBD: Parent-Offspring
AB CD
AC
If the parents are unrelated, then parent-offspring pairs always share 1 allele IBD
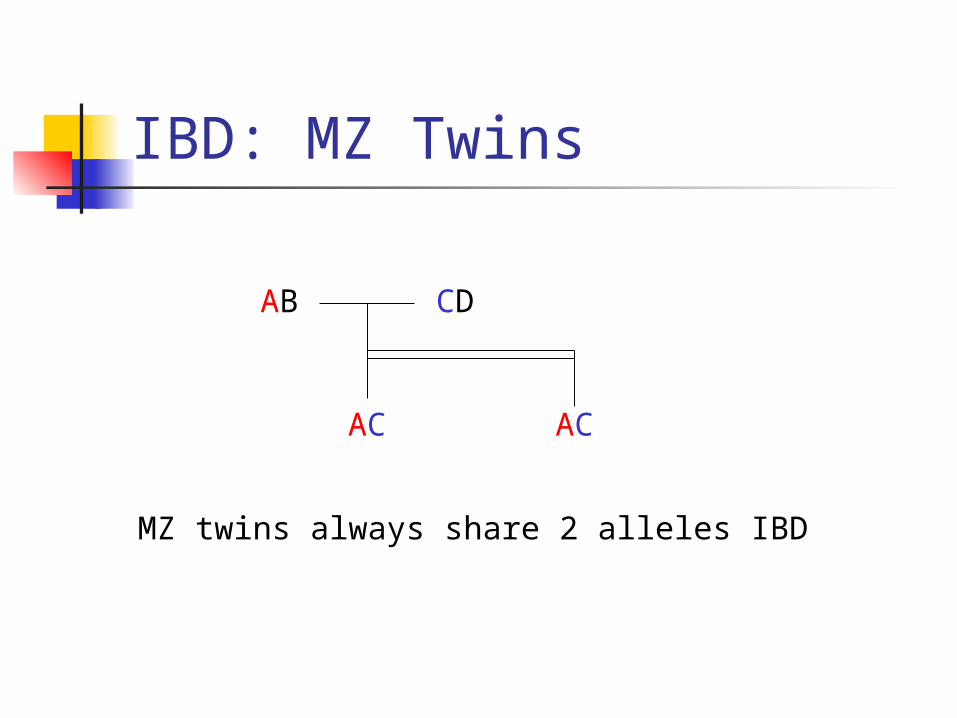
IBD: MZ Twins
AB CD
AC
MZ twins always share 2 alleles IBD
AC
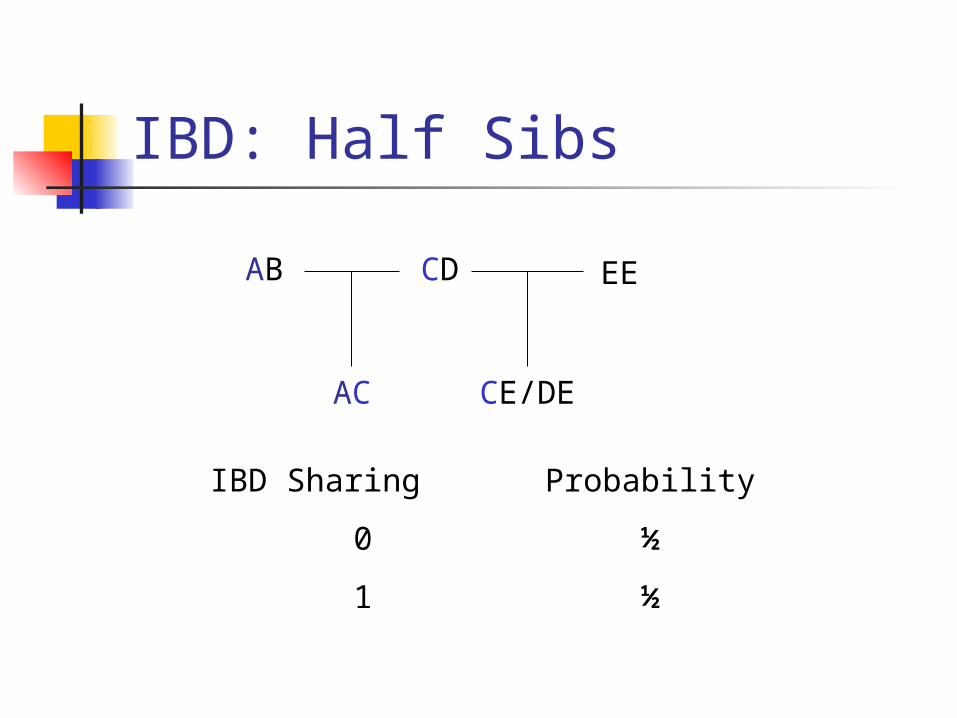
IBD: Half Sibs
AB CD
AC
EE
CE/DE
IBD Sharing Probability
0 ½
1 ½
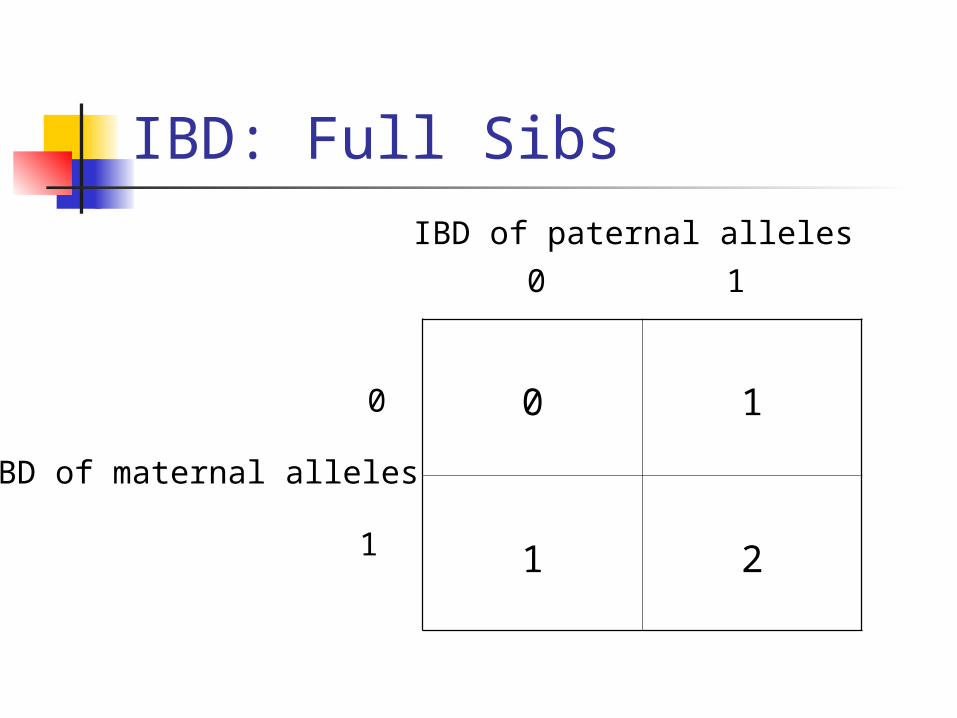
IBD: Full Sibs
0 1
1 2
IBD of paternal alleles
IBD of maternal alleles
0 1
0
1
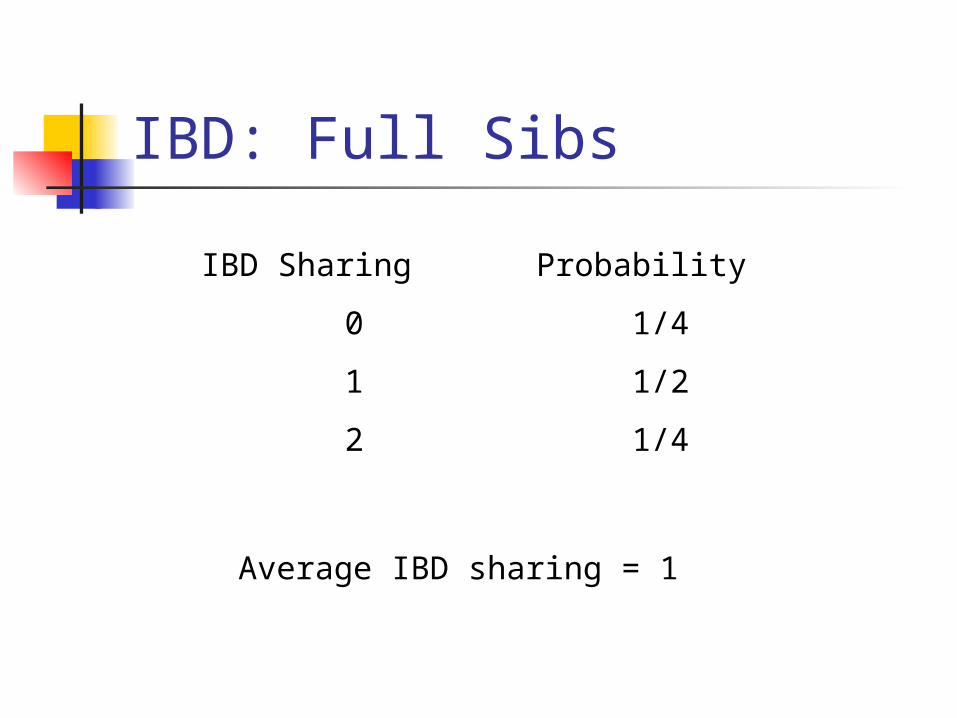
IBD: Full Sibs
IBD Sharing Probability
0 1/4
1 1/2
2 1/4
Average IBD sharing = 1
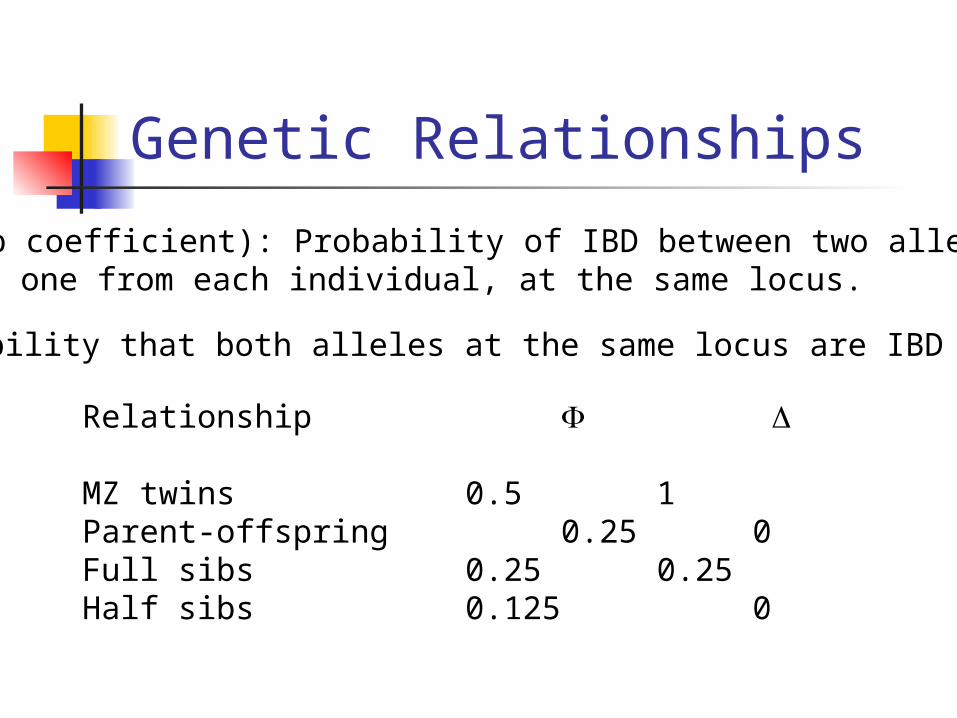
Genetic Relationships
(kinship coefficient): Probability of IBD between two alleles drawnat random, one from each individual, at the same locus.
: Probability that both alleles at the same locus are IBD
Relationship
MZ twins 0.5 1Parent-offspring 0.25 0Full sibs 0.25 0.25Half sibs 0.125 0
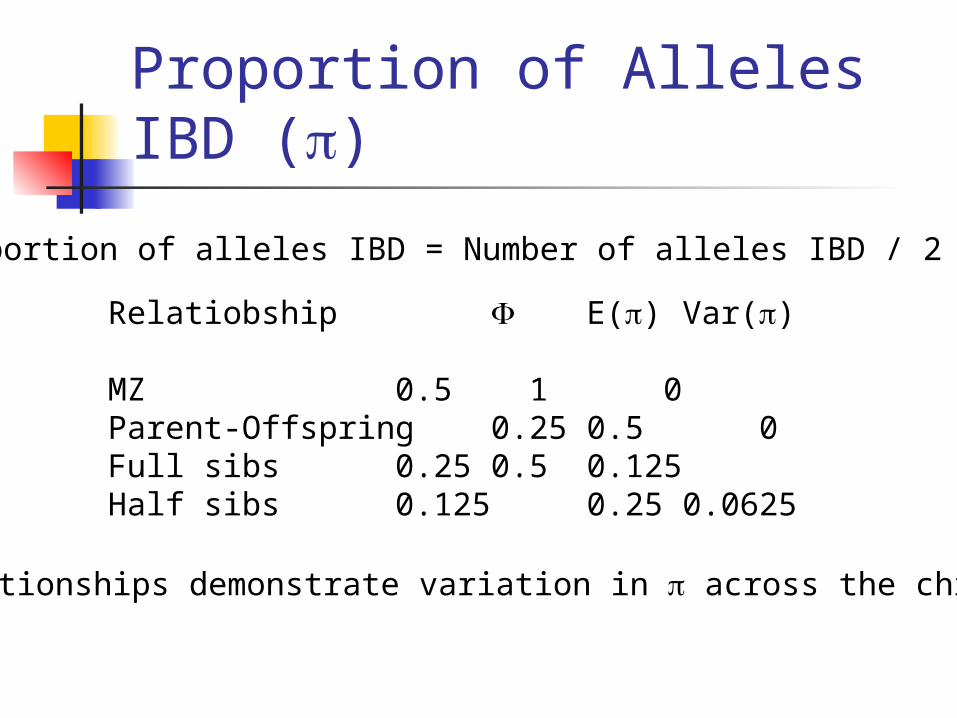
Proportion of Alleles IBD ()
Relatiobship E() Var()
MZ 0.5 1 0Parent-Offspring 0.25 0.5 0Full sibs 0.25 0.5 0.125Half sibs 0.125 0.25 0.0625
Most relationships demonstrate variation in across the chromosomes
Proportion of alleles IBD = Number of alleles IBD / 2
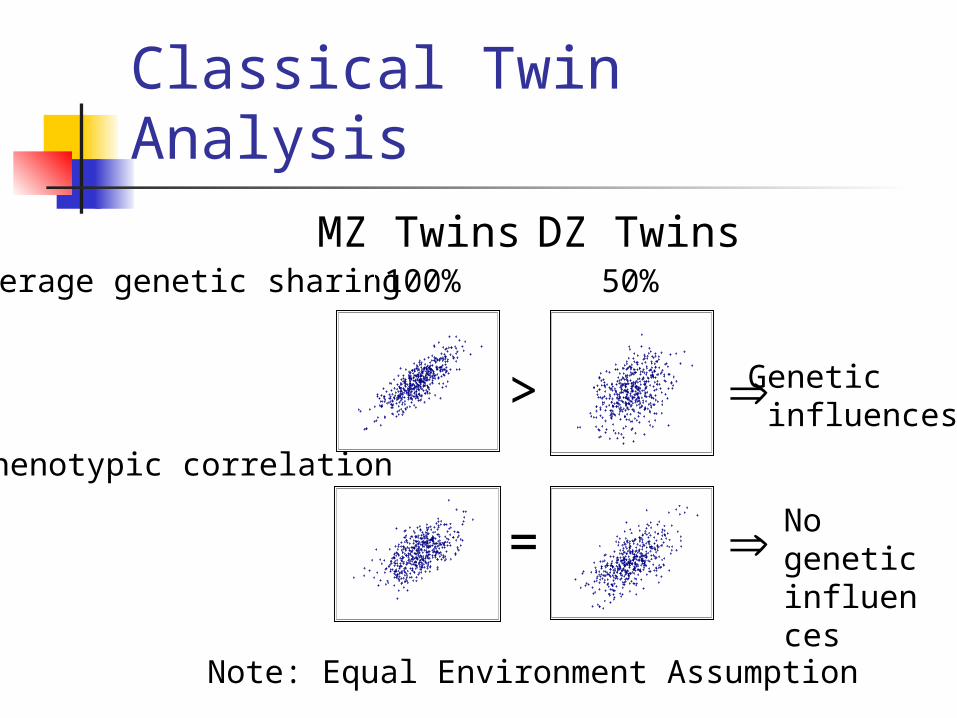
Classical Twin Analysis
MZ Twins DZ TwinsAverage genetic sharing 100% 50%
Phenotypic correlation
=
>
Genetic influences
No genetic influences
Note: Equal Environment Assumption
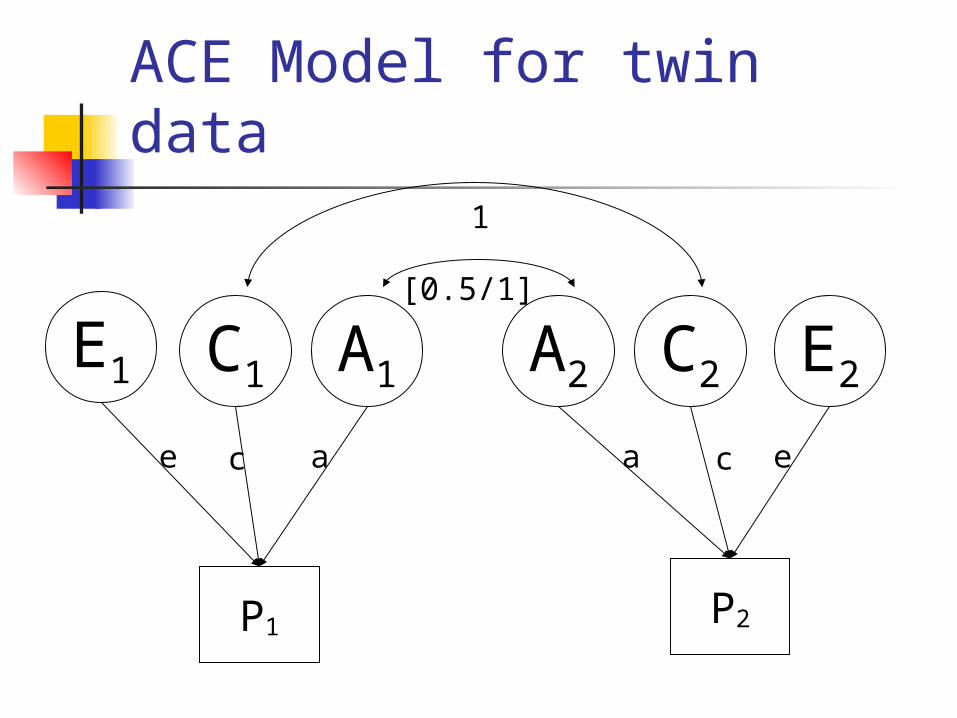
P1
A1C1E1
P2
A2 C2 E2
1
[0.5/1]
e ac eca
ACE Model for twin data
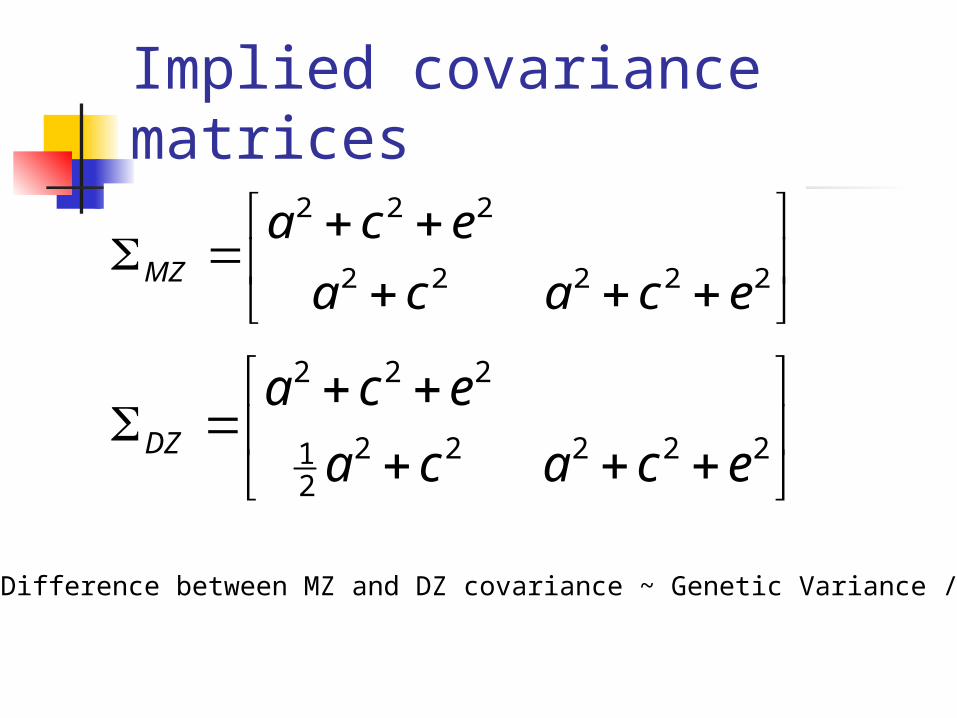
Implied covariance matrices
22222
222
ecaca
ecaMZ
22222
21
222
ecaca
ecaDZ
Difference between MZ and DZ covariance ~ Genetic Variance / 2
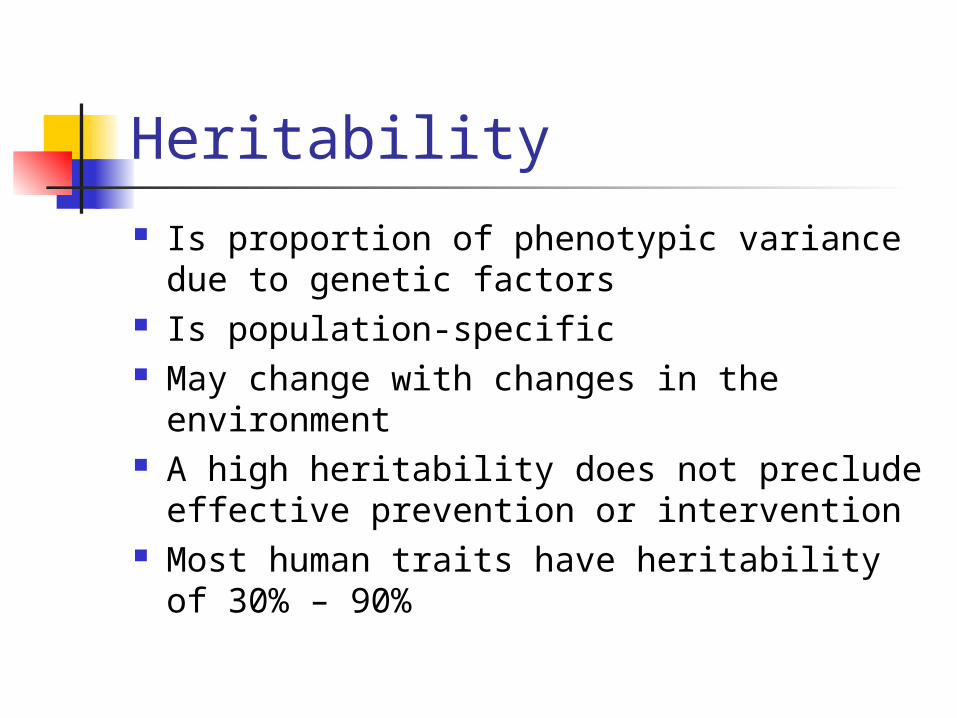
Heritability Is proportion of phenotypic variance due
to genetic factors Is population-specific May change with changes in the
environment A high heritability does not preclude
effective prevention or intervention Most human traits have heritability of
30% – 90%
Liability-Threshold Models

Single Major Locus (SML) Model
Genotype Phenotypef2AA
aa
Aa
Disease
Normal
f1
f0
1- f2
1- f1
1- f0
“Penetrance parameters”
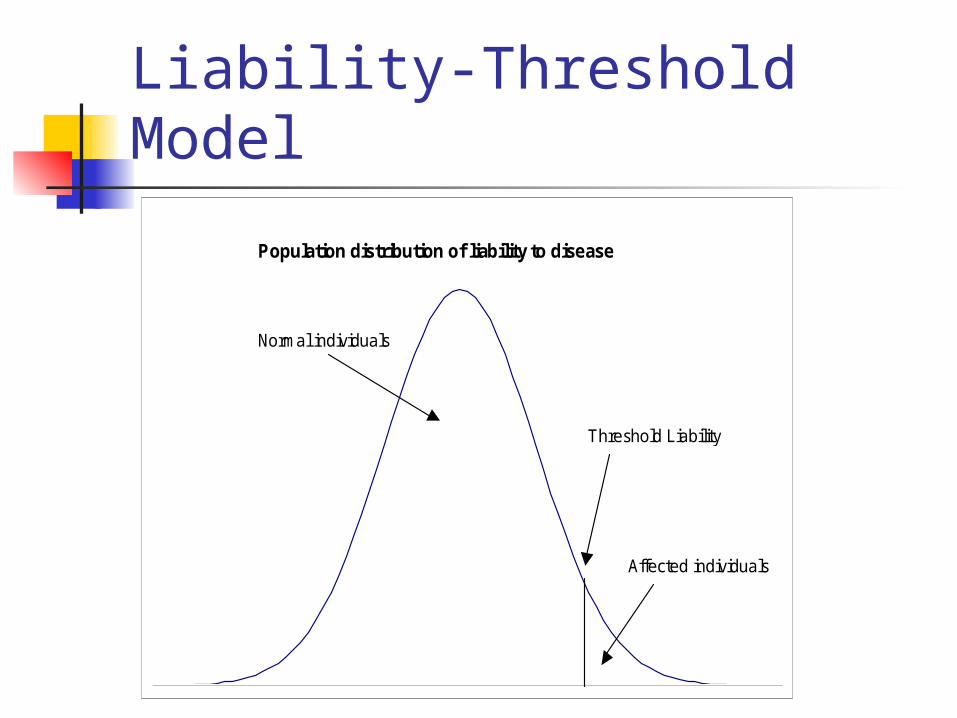
Liability-Threshold Model
Affected individuals
Threshold Liability
Normal individuals
Population distribution of liability to disease
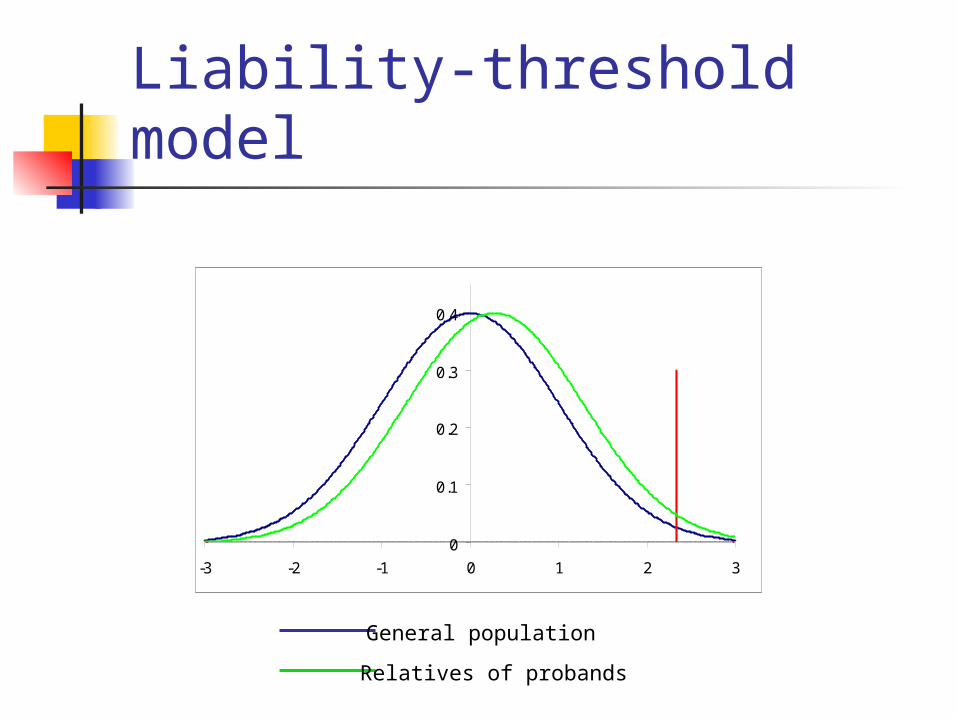
Liability-threshold model
0
0.1
0.2
0.3
0.4
-3 -2 -1 0 1 2 3
General population
Relatives of probands
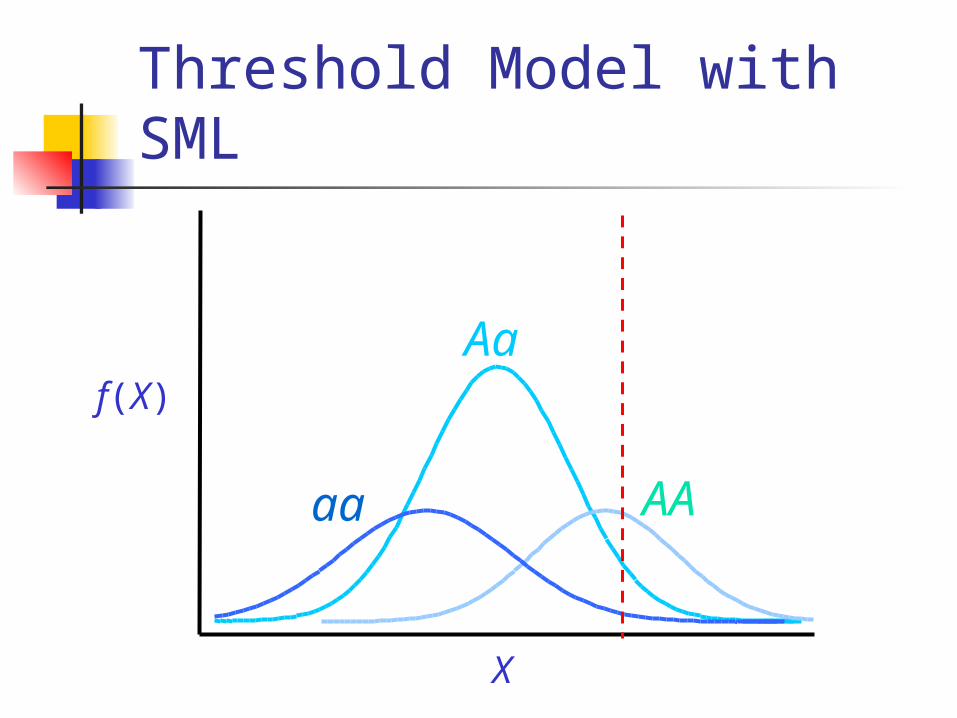
Threshold Model with SML
f(X)
X
AA
Aa
aa
Quantitative Trait Linkage
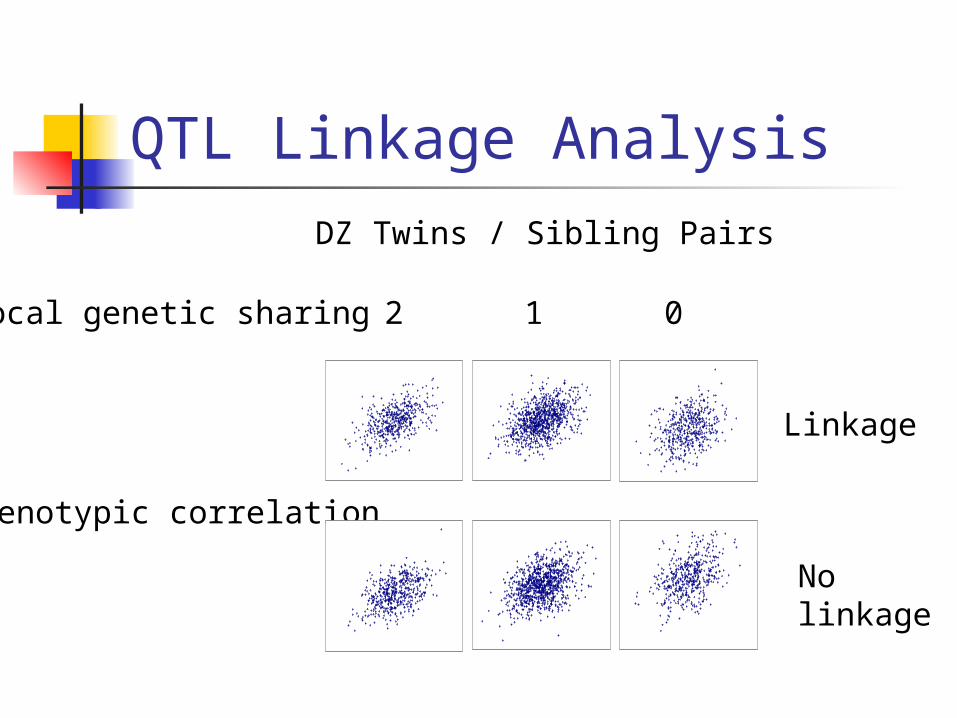
QTL Linkage Analysis
Local genetic sharing 2 1
Phenotypic correlation
Linkage
No linkage
0
DZ Twins / Sibling Pairs
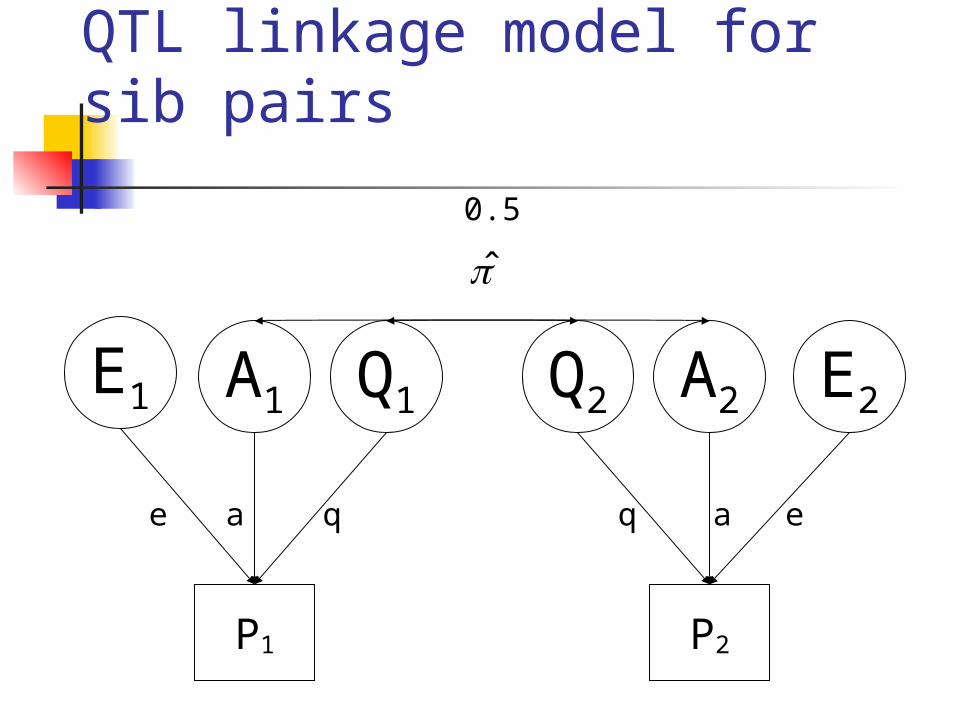
P1
Q1A1E1
P2
Q2 A2 E2
0.5
e qa eaq
QTL linkage model for sib pairs
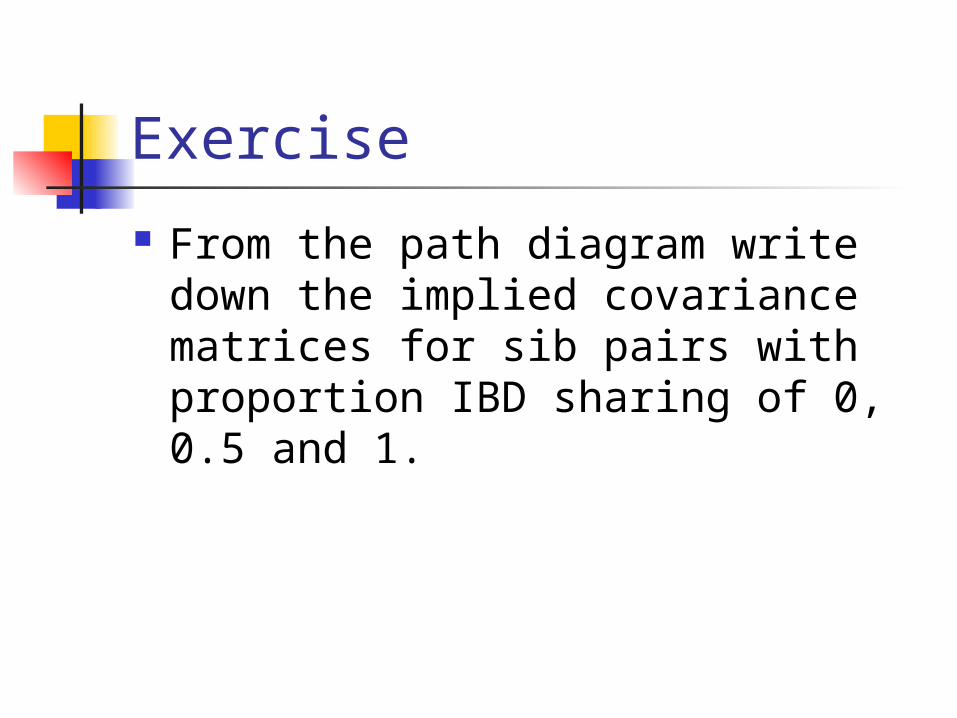
Exercise
From the path diagram write down the implied covariance matrices for sib pairs with proportion IBD sharing of 0, 0.5 and 1.
Quantitative Association
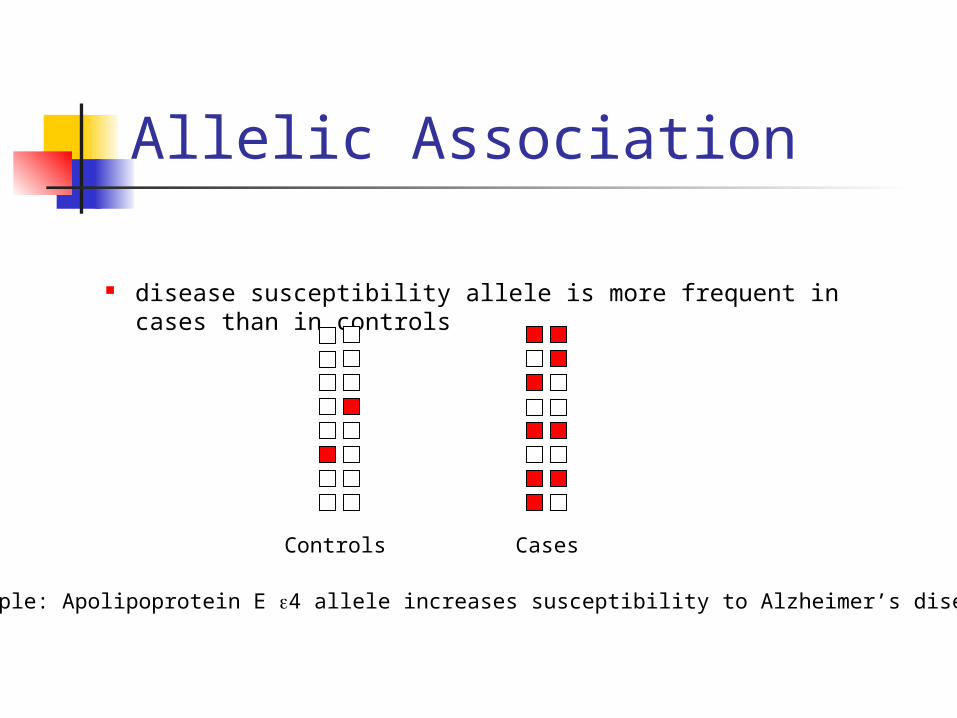
Allelic Association
disease susceptibility allele is more frequent in cases than in controls
Controls Cases
Example: Apolipoprotein E 4 allele increases susceptibility to Alzheimer’s disease
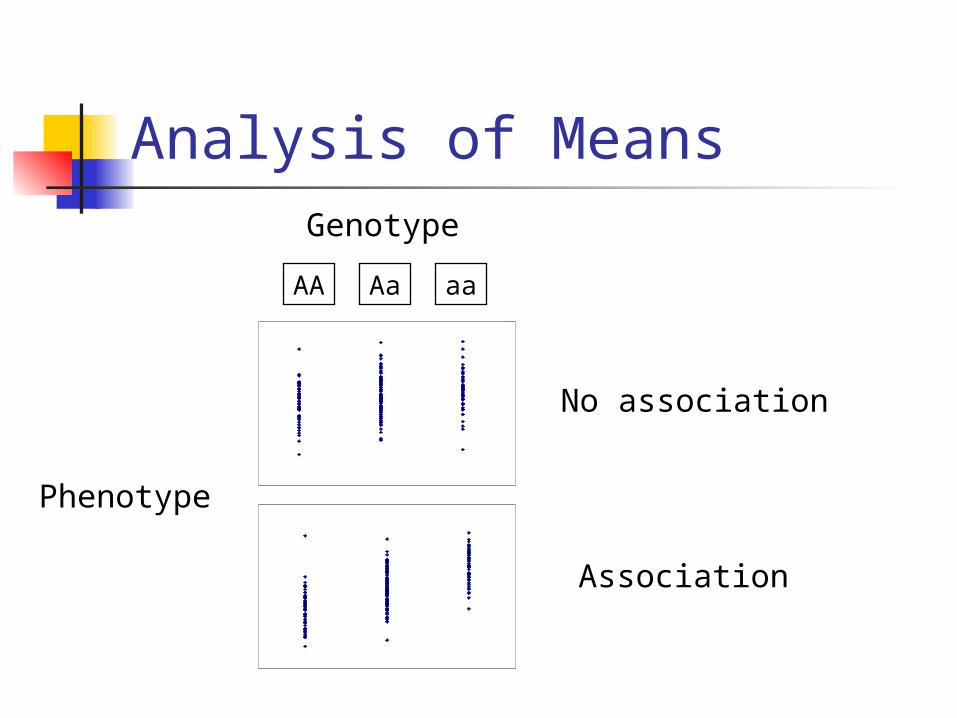
Analysis of Means
AA Aa aa
No association
Association
Phenotype
Genotype
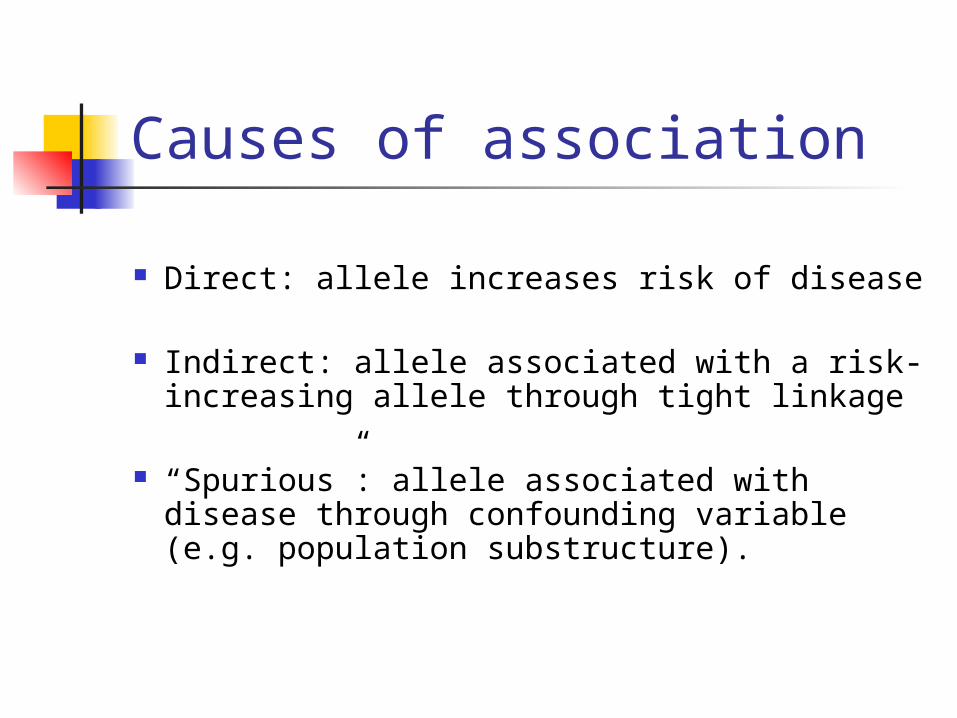
Causes of association
Direct: allele increases risk of disease
Indirect: allele associated with a risk-increasing allele through tight linkage
“Spurious”: allele associated with disease through confounding variable (e.g. population substructure).
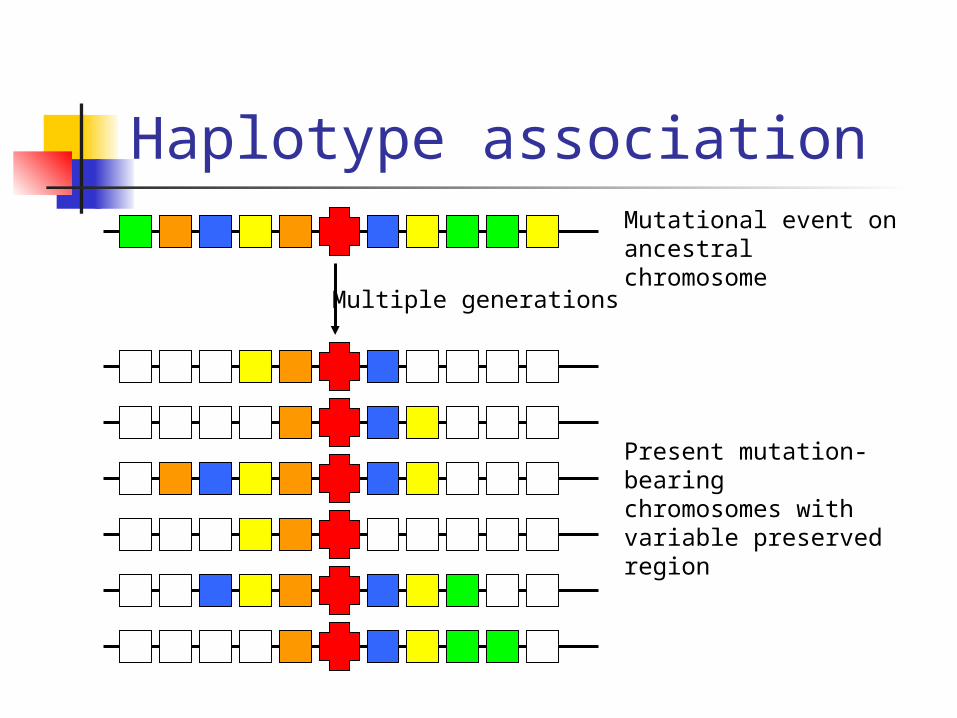
Haplotype associationMutational event on ancestral chromosome
Multiple generations
Present mutation-bearing chromosomes with variable preserved region
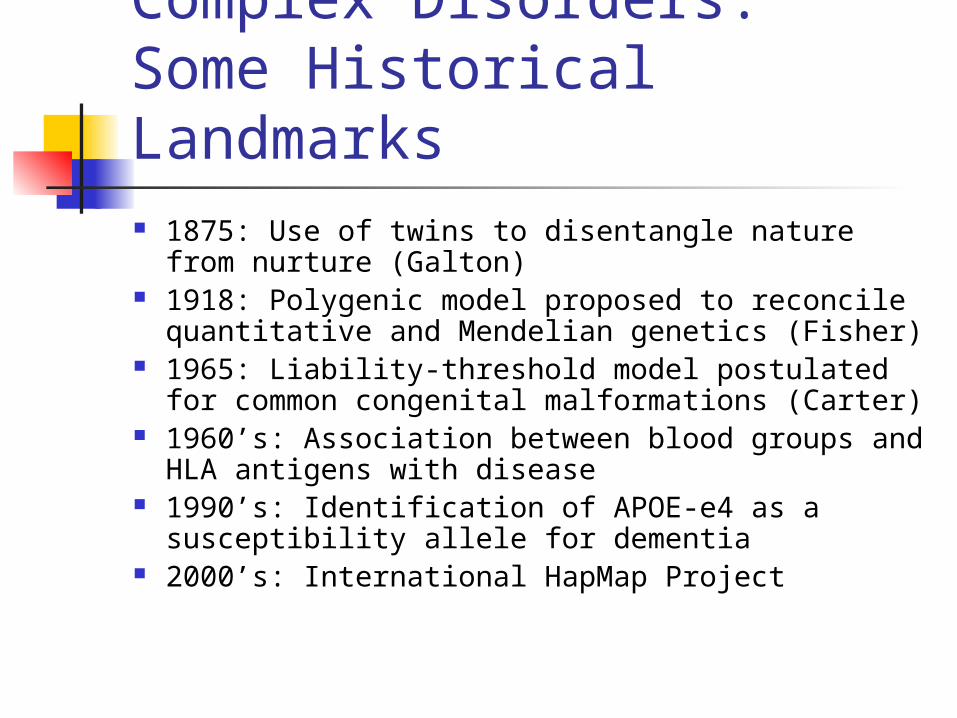
Complex Disorders:Some Historical Landmarks 1875: Use of twins to disentangle nature from
nurture (Galton) 1918: Polygenic model proposed to reconcile
quantitative and Mendelian genetics (Fisher) 1965: Liability-threshold model postulated for
common congenital malformations (Carter) 1960’s: Association between blood groups and
HLA antigens with disease 1990’s: Identification of APOE-e4 as a
susceptibility allele for dementia 2000’s: International HapMap Project

of the Behavior Genetic Association.