Embed Size (px)
Citation preview
1458
ISSN 2286-4822
www.euacademic.org
EUROPEAN ACADEMIC RESEARCH
Vol. V, Issue 2/ May 2017
Impact Factor: 3.4546 (UIF)
DRJI Value: 5.9 (B+)
Genetic Variation among Ompok bimaculatus,
Clupisoma sinensis, Labeo rohita and Puntius
sophore Fishes from Jaikwadi and Vishnupuri
Dams, from Godavari River in System Using
Mitochondrial Cytochrome b Gene
RABEEHA MANKHI JEBUR
Basrah Southern Technical University
College of Health & Medical Technology, Basra, Iraq
Abstract:
Four species of fishes (Ompok bimaculatus, Clupisoma
sinensis, Labeo rohita and Puntius sophore) were collected from two
different location or population (Jaikwadi and Vishnupuri Dams) of
Godavari river in system , twenty samples of each species were passed
through several steps include (DNA isolation , design of specific primes
for cytochrome b gene amplification, Quantification of DNA, PCR
technical where cyt b gene amplified for Ompok bimaculatus &
Clupisoma sinensis in this study was 1066 bp long and 1252 bp long
was for (Labeo rohita and Puntius sophore) and sequencing process of
cyt b gene for each species of fishes finally analysis of sequences to
reveal genetic diversity among these species. The results showed after
sequencing process for Ompok bimaculatus & Clupisoma sinensis
species ,14 samples were analysed for Clupisoma sinensis at
Vishnupuri dam for nucleotide composition and 16 samples for Ompok
bimaculatus at Jaikwadi respectively, A (29.4%), T (U)(27.7%), G
(14.5%), C (28.5%) and A (29.0%), T(U) (26.5%), G(14.4%), C(30.1%).
nucleotide diversity, Pi(t) was 0.09309 between Nanded and Paithan
populations . Two haplotypes of Ompok bimaculatus were formed
while one haplotype of Clupisoma sinensis was formed, This indicates
represent low genetic variation of Ompok bimaculatus. where as
UPGMA cluster analysis showed sequence divergence only in Ompok

Rabeeha Mankhi Jebur- Genetic Variation among Ompok bimaculatus,
Clupisoma sinensis, Labeo rohita and Puntius sophore Fishes from Jaikwadi
and Vishnupuri Dams, from Godavari River in System Using Mitochondrial
Cytochrome b Gene
EUROPEAN ACADEMIC RESEARCH - Vol. V, Issue 2 / May 2017
1459
bimaculatus and no divergence in Clupisoma sinensis. Unfortunately,
rest of two species (Labeo rohita and Puntius sophore) were failed to
get their cyt b gene sequenes due to some technical reasons with trying
of sequencing process.
Key words: Cytochrome b gene, genetic diversity, haplotypes,
nucleotide composition, UPGMA & Pi(t) .
1. INTRODUCTION
Genetic variation describes naturally occurring genetic
differences among individuals of the same species. This
variation permits flexibility and survival of a population in the
face of changing environmental circumstances. When a
population interbreeds, nonrandom mating can sometimes
occur because one organism chooses to mate with another based
on certain traits. In this case, individuals in the population
make specific behavioral choices, and these choices shape the
genetic combinations that appear in successive generations [1].
The physical distribution of individuals affect a population with
broad distribution, rarely it has the same genetic makeup over
its entire range [1]. The individuals in a population living at one
end of the range may live at a higher altitude and encounter
different climatic conditions than others living at the opposite
end at a lower altitude. At this more extreme boundary, the
relative allele frequency may differ dramatically from those at
the opposite boundary. If the individuals at either end of the
range reconnect and continue mating, the resulting genetic
intermixing can contribute to more genetic variation overall.
However, if the range becomes wide enough that interbreeding
between opposite ends becomes less and less likely, and the
different forces acting at either end become more and more
pronounced, and the individuals at each end of the population
Rabeeha Mankhi Jebur- Genetic Variation among Ompok bimaculatus,
Clupisoma sinensis, Labeo rohita and Puntius sophore Fishes from Jaikwadi
and Vishnupuri Dams, from Godavari River in System Using Mitochondrial
Cytochrome b Gene
EUROPEAN ACADEMIC RESEARCH - Vol. V, Issue 2 / May 2017
1460
range may eventually become genetically distinct from one
another. Distribution is one way that genetic variation can be
preserved in large populations over wide physical ranges, as
different forces will shift relative allele frequencies in different
ways at either end. In species composed of large numbers of
migratory individuals, extrinsic barriers to migration imposed
by landscape features are particularly important in
determining population genetic structure.
In recent years, different molecular techniques, using
nuclear and mitochondrial DNA (mtDNA), have provided new
information concerning the genetic variability of wild and
cultivated populations of several fish species (Was, A. and R.
Wenne, 2002). Mitochondrial DNA is maternally inherited
without genetic recombination. The evolutionary rate as well as
the genetic differentiation of mtDNA among populations is
thought to be approximately 5-10 times higher than that
exhibited by nuclear genes (Birky C.W., T. Maruyana and P.
Fuerst, 1983). Mitochondrial DNA represents a significant
marker system for use in population and phylogenetic studies.
An extensive review of the advantages of mt DNA as a tool for
population genetic analysis has been provided (Avise, J.C.,
1991). Among many mitochondrial genes, cytochrome b has
been used successfully to identify genetic variation in many fish
species (McVeigh H. P et.al 1991). Cytochrome b tends to show
intra specific variation mainly in 3rd position of codon which can
be used to identify stocks. Variation in mtDNA Cytochrome b
gene has been used for poplation studies in cyprinidae fishes
(Fayazi J et.al 2006). The genetic diversity of Ompok
bimaculatus was previously studied by Malakar A K et. al in
2012. The aim of present study was to present an assessment of
the genetic variability due to effect of extrinsic barriers. Three
species (Ompok bimaculatus, Labeo rohita and Puntius sophore)
were selected from two populations of Jaikwadi and Vishnupuri
dams which are some of the largest irrigation projects on
Rabeeha Mankhi Jebur- Genetic Variation among Ompok bimaculatus,
Clupisoma sinensis, Labeo rohita and Puntius sophore Fishes from Jaikwadi
and Vishnupuri Dams, from Godavari River in System Using Mitochondrial
Cytochrome b Gene
EUROPEAN ACADEMIC RESEARCH - Vol. V, Issue 2 / May 2017
1461
Godavari river in the Indian state of Maharashtra. n order to
understand the effect of extrinsic barriers on genetic variation
and population structure on fishes, three species were selected
from The hierarchical analysis of genetic variance revealed that
the differentiation was relative high. The geographic pattern of
differentiation was accounted by analysis of molecular variance
within population and among population. The understanding of
genetic differentiation of O. Bimaculatus, L. rohita and P.
sophore populations will play a key role in conservation and
management of the fish species. Yet, the identification of such
barriers and the prediction of their impacts in shaping
intraspecific genetic diversity remain a major challenge in
population biology (Slatkin 1985; Sork et al. 1999; Wiegand et
al. 1999). Studies dealing with the effect of landscape in
shaping population structure have largly focused on the
consequences of habitat fragmentation caused by recent
anthropogenic disturbance (e.g., Aldrich et al. 1998; Gibbs 1998;
Van Dongen et al. 1998). Although obviously relevant, such
studies generally lack a historical perspective on the influence
of landscape structure on temporal dynamics of genetic
connectivity among natural populations (Fahrig and Merriam
1994; McCauley 1995; McCauley et al. 1995). Consequently,
there is a need for detailed empirical studies that
simultaneously quantify the effects of individual landscape
features at various geographic scales (Shaw et al. 1994; Kudoh
and Whigham 1997; Keyghobadi et al. 1999; Sork et al. 1999).
Yet, the identification of such barriers and the prediction of
their impacts in shaping intraspecific genetic diversity remain
a major challenge in population biology (Slatkin 1985; Sork et
al. 1999; Wiegand et al. 1999). Studies dealing with the effect of
landscape in shaping population structure have largely focused
on the consequences of habitat fragmentation caused by recent
anthropogenic disturbance (e.g., Aldrich et al. 1998; Gibbs 1998;
Van Dongen et al. 1998). Although obviously relevant, such

Rabeeha Mankhi Jebur- Genetic Variation among Ompok bimaculatus,
Clupisoma sinensis, Labeo rohita and Puntius sophore Fishes from Jaikwadi
and Vishnupuri Dams, from Godavari River in System Using Mitochondrial
Cytochrome b Gene
EUROPEAN ACADEMIC RESEARCH - Vol. V, Issue 2 / May 2017
1462
studies generally lack a historical perspective on the influence
of landscape structure on temporal dynamics of genetic
connectivity among natural populations (Fahrig and Merriam
1994; McCauley 1995; McCauley et al. 1995). Consequently,
there is a need for detailed empirical studies that
simultaneously quantify the effects of individual landscape
features at various geographic scales (Shaw et al. 1994; Kudoh
and Whigham 1997; Keyghobadi et al. 1999; Sork et al. 1999).
2. MATERIAL AND METHODS
The Godavari River is the second largest river in India
originating in the Western Ghats Trimbakeshwar, in the
Nashik flowing eastwardly across the Deccan Plateau through
the states of Maharashtra with a catchment area of 312,812
km2 and a long-term average annual surface flow of 110 km3.
The Jayakwadi dam near Paithan is one of the largest earthen
dam in India (height 41.30 m and catchment area 21,750 km2).
This dam was built to address the problem of drought in
Marathwada region and problem of flood along the bank of
river. While Vishnupuri dam near Nanded is one of the largest
lift irrigation projects in Asia.( Fig.1)
Figure 1: Location of sampling stations on Godavari river in Marathwada Juridisdiction.
(Map was adopted from Irrigation development corporation Marashtra, India)
Rabeeha Mankhi Jebur- Genetic Variation among Ompok bimaculatus,
Clupisoma sinensis, Labeo rohita and Puntius sophore Fishes from Jaikwadi
and Vishnupuri Dams, from Godavari River in System Using Mitochondrial
Cytochrome b Gene
EUROPEAN ACADEMIC RESEARCH - Vol. V, Issue 2 / May 2017
1463
The four fish species were collected from two sampling stations
(table 1) and fin clip tissue samples having approximate size of
1-4 sq. cm were collected from caudal fin or left side of Pectoral
or pelvic fin without disturbing their morphology. Then this
tissue samples were preserved in 100% ethanol in 1.5ml
microtubes with appropriate code as tagged on specimens. The
Fish specimens were preserved in 70% ethanol.
Srno. Sampling station Impounds Jaikwadi dam Vishnupuri
dam
1 Ompok bimaculatus Godavari river 20 0
2 Clupisoma sinensis Godavari river 0 20
3 Labeo rohita Godavari river 20 20
4 Puntius sophore Godavari river 20 20
Table 1: List of specimens collected from two sampling stations of
Godavari river (MS).
2.1. Sample Processing
The tissue samples were then sub sampled and processed
further for genomic DNA extraction and tissue stock was
preserved at -20⁰c. The Specimens were washed and
permanently preserved in glass jars after morphological
investigations in fresh 70% ethanol at room temperature. The
genomic DNA was extracted by using C-TAB method /
Promega wizard genomic DNA isolation kit . The isolated DNA
was further investigated for quantified by using
spectrophotometer for 20 samples for each species and for
quality check by agarose gel electrophoresis for all species of
fishes and resolved on 1% agarose gels are shown in figures.3 (
a,b,c ,d ).
2.2. DNA Extraction
DNA was extracted from ethanol- preserved fin clips using
CTAB method (Innis et al.1989). was performed as below
1. Dry the alcohol dipped samples, transfer it to micro
centrifuge tube.
Rabeeha Mankhi Jebur- Genetic Variation among Ompok bimaculatus,
Clupisoma sinensis, Labeo rohita and Puntius sophore Fishes from Jaikwadi
and Vishnupuri Dams, from Godavari River in System Using Mitochondrial
Cytochrome b Gene
EUROPEAN ACADEMIC RESEARCH - Vol. V, Issue 2 / May 2017
1464
2. Add 60c prewarmed CTAB (600ul +3ul of Beta-mercapto
ethanol +10ul of 20%SDS ).
3. After crushing add 3ul of proteinase-k and incubated over
night.
4. Vortex each tube for 5 min vigorously.
5. Keep it over night incubation and vortex after interval of 2-
3 hours if possible after incubation cooled samples to room
temperature, and centrifuge at 14.000 rpm for 10 minutes.
6. Take supernatant and discard the pellet.
7. Transfer 400ul of sample into fresh tube.
8. Add equal volume of phenol: chloroform: isomyl alcohol
(25:24:1) and mixed it for 5 minutes (vortex).
9. After mixing, centrifuge at 14.000 rpm for 10 min .
10. Then take supernatant to fresh tube and discard the pellet.
11. Add chloroform: isomyl alcohol(24:1),600ul in each tube ,and
mix it(vortex).
12. Centrifuge at 12.000rpm (10 min ).
13. Take supernatant in fresh tube and discard the debris.
14. Add chilled isopropanol (400ul) and mixed slowly until
white flakes appear(usually does not appear).
15. Then keep it at(- 35 or -50 c) in deep freeze (1 hour).
16. Brought the samples at room temperature.
17. Centrifuge at 10.000 rpm(10 min).
18. Decant the supernatant and add 70% chilled from
refrigerator ethanol(400ul)+ ammonium acetate (100ul)
already liquid. to the pellet for washing.(mild vortexing).
19. Centrifuge at 10.000 rpm(10 min).
20. Decant the supernatant carefully, and add 400ul of absolute
alcohol and centrifuge at 10.000 rpm for (10 min).
21. Decant the supernatant and dry the pellet at room temp.dry
it for 2-3 hours.
22. Dissolve in TE Buffer.( overnight ).

Rabeeha Mankhi Jebur- Genetic Variation among Ompok bimaculatus,
Clupisoma sinensis, Labeo rohita and Puntius sophore Fishes from Jaikwadi
and Vishnupuri Dams, from Godavari River in System Using Mitochondrial
Cytochrome b Gene
EUROPEAN ACADEMIC RESEARCH - Vol. V, Issue 2 / May 2017
1465
2.3. Quantification of DNA
The DNA isolated is quantified by using Nanodrop (260/280
ratio). The contamination of sample with RNA or Phenolic
compounds is detected and samples are processed further for
PCR reaction. (Fig. 2).
Figure 2: DNA quantification for Puntius sophore, Clupisoma sinensis
Ompok Pabda and Labeo rohita using Nanodrop (260/280 ratio).
Fig. (3a): Genomic DNA bands extracted from Ompok bimaculatus on
1% agarose gel.
Fig. (3b): Genomic DNA bands extracted from Labeo rohita on 1%
agarose gel.
Rabeeha Mankhi Jebur- Genetic Variation among Ompok bimaculatus,
Clupisoma sinensis, Labeo rohita and Puntius sophore Fishes from Jaikwadi
and Vishnupuri Dams, from Godavari River in System Using Mitochondrial
Cytochrome b Gene
EUROPEAN ACADEMIC RESEARCH - Vol. V, Issue 2 / May 2017
1466
Fig.(3c): Genomic DNA bands extracted from Clupisoma sinensis on 1%
agarose gel.
Fig. (3d): Genomic DNA bands extracted from Puntius sophore on 1%
agarose gel.
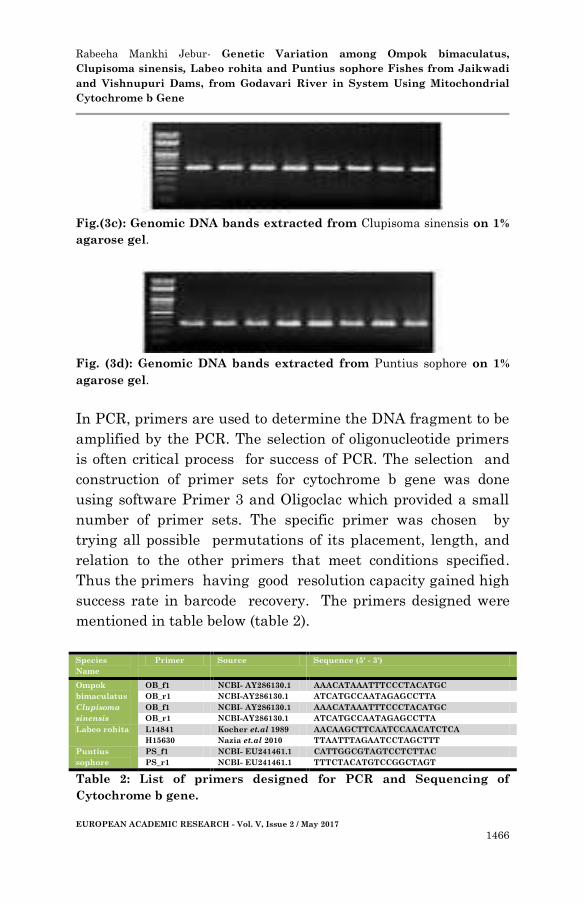
In PCR, primers are used to determine the DNA fragment to be
amplified by the PCR. The selection of oligonucleotide primers
is often critical process for success of PCR. The selection and
construction of primer sets for cytochrome b gene was done
using software Primer 3 and Oligoclac which provided a small
number of primer sets. The specific primer was chosen by
trying all possible permutations of its placement, length, and
relation to the other primers that meet conditions specified.
Thus the primers having good resolution capacity gained high
success rate in barcode recovery. The primers designed were
mentioned in table below (table 2).
Species
Name
Primer Source Sequence (5' - 3')
Ompok
bimaculatus
OB_f1 NCBI- AY286130.1 AAACATAAATTTCCCTACATGC
OB_r1 NCBI-AY286130.1 ATCATGCCAATAGAGCCTTA
Clupisoma
sinensis
OB_f1 NCBI- AY286130.1 AAACATAAATTTCCCTACATGC
OB_r1 NCBI-AY286130.1 ATCATGCCAATAGAGCCTTA
Labeo rohita L14841 Kocher et.al 1989 AACAAGCTTCAATCCAACATCTCA
H15630 Nazia et.al 2010 TTAATTTAGAATCCTAGCTTT
Puntius
sophore
PS_f1 NCBI- EU241461.1 CATTGGCGTAGTCCTCTTAC
PS_r1 NCBI- EU241461.1 TTTCTACATGTCCGGCTAGT
Table 2: List of primers designed for PCR and Sequencing of
Cytochrome b gene.
Rabeeha Mankhi Jebur- Genetic Variation among Ompok bimaculatus,
Clupisoma sinensis, Labeo rohita and Puntius sophore Fishes from Jaikwadi
and Vishnupuri Dams, from Godavari River in System Using Mitochondrial
Cytochrome b Gene
EUROPEAN ACADEMIC RESEARCH - Vol. V, Issue 2 / May 2017
1467
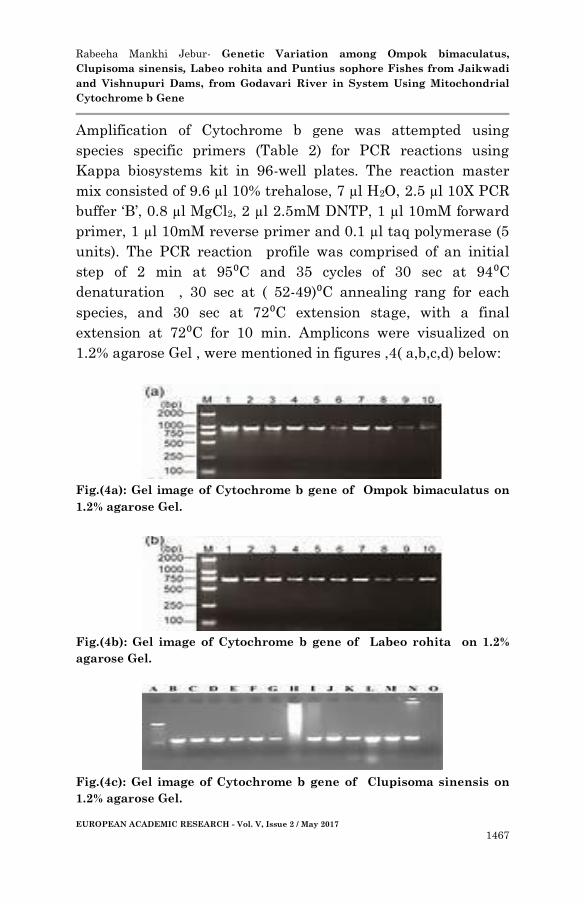
Amplification of Cytochrome b gene was attempted using
species specific primers (Table 2) for PCR reactions using
Kappa biosystems kit in 96-well plates. The reaction master
mix consisted of 9.6 µl 10% trehalose, 7 µl H2O, 2.5 µl 10X PCR
buffer ‘B’, 0.8 µl MgCl2, 2 µl 2.5mM DNTP, 1 µl 10mM forward
primer, 1 µl 10mM reverse primer and 0.1 µl taq polymerase (5
units). The PCR reaction profile was comprised of an initial
step of 2 min at 95⁰C and 35 cycles of 30 sec at 94⁰C
denaturation , 30 sec at ( 52-49)⁰C annealing rang for each
species, and 30 sec at 72⁰C extension stage, with a final
extension at 72⁰C for 10 min. Amplicons were visualized on
1.2% agarose Gel , were mentioned in figures ,4( a,b,c,d) below:
Fig.(4a): Gel image of Cytochrome b gene of Ompok bimaculatus on
1.2% agarose Gel.
Fig.(4b): Gel image of Cytochrome b gene of Labeo rohita on 1.2%
agarose Gel.
Fig.(4c): Gel image of Cytochrome b gene of Clupisoma sinensis on
1.2% agarose Gel.

Rabeeha Mankhi Jebur- Genetic Variation among Ompok bimaculatus,
Clupisoma sinensis, Labeo rohita and Puntius sophore Fishes from Jaikwadi
and Vishnupuri Dams, from Godavari River in System Using Mitochondrial
Cytochrome b Gene
EUROPEAN ACADEMIC RESEARCH - Vol. V, Issue 2 / May 2017
1468
Fig.(4d) : Gel image of Cytochrome b gene of Puntius sophore on
1.2% agarose Gel.
These PCR products were Processed for cleanup to remove un
incorporated nucleotide and residual primers. Sequencing
reactions used PCR forward and reverse primers using the
BigDye Terminator v.3.1 Cycle Sequencing Kit (Applied
Biosystems,Inc.) because it provides robust sequencing
chemistry. It generally produces long reads of 750 base pairs,
even on GC-rich templates. The reaction profile was comprised
of an initial step of 3 min a 96⁰C and 35 cycles of 30 sec at 96⁰C,
15 sec at 55⁰C,and 4 min at 60⁰C. The Cycle sequencing is
followed by sequencing cleanup by ethanol precipitation method
which is then followed by dissolving template in hidi
formamide. These samples were processed for sequencing in
ABI 3130 Genetic analyzer capillary sequencer. This barcode
product is bi directionally sequenced to aid full length barcode
sequence by avoiding problems in signal deterioration that
often occur near the end of a read.
2.4. Sequence analysis
There are varieties of DNA analysis software packages used
widely.
1) DNA Star (Lasergene) provides another platform for
sequence analysis and primer design, DNA map
drawing etc.
2) Codon code Aligner is a leading software program for
DNA sequence analysis. Widely used in evolution
research and biogeography, it offers many features
including ability to compare contigs with ClustalW and

Rabeeha Mankhi Jebur- Genetic Variation among Ompok bimaculatus,
Clupisoma sinensis, Labeo rohita and Puntius sophore Fishes from Jaikwadi
and Vishnupuri Dams, from Godavari River in System Using Mitochondrial
Cytochrome b Gene
EUROPEAN ACADEMIC RESEARCH - Vol. V, Issue 2 / May 2017
1469
muscle, trace sharpening, and base calling with
PHRED, as well as standard features like assembly,
trace and contig editing, end clipping, and mutation
detection.
3) Mega5 is Molecular Evolutionary Genetics Analysis
software that uses maximum likelihood (ML) analyses
for inferring evolutionary trees, =selecting best-fit
substitution models (nucleotide or amino acid),
inferring ancestral states and sequences (along with
probabilities), and estimating evolutionary rates site-by-
site. The MEGA user interface has now been enhanced
to be activity driven to make it easier for the use of both
beginners and experienced scientists.
4) Arlequin is a software for population genetic data
analysis with quite a large set of methods and stastical
tests, in order to extract information on genetic and
demographic features of a collection of population
samples.
3. RESULTS
Cytochrome b gene amplified for Ompok bimaculatus &
Clupisoma sinensis in this study was 1066 bp long. The Ompok
bimaculatus & Clupisoma sinensis was sequenced for
cytochrome b analysis. Unfortunately, rest of two species Labeo
rohita and Puntius sophore were in process of sequencing as
they were failed due to some technical reasons .
The average nucleotide percentage among 40 samples of
two population of was studied. At Vishnupuri dam for
Clupisoma sinensis 14 samples were analysed for nucleotide
composition showing A (29.4%), T (U) (27.7%), G (14.5%), C
(28.5%) and at Jaikwadi for Ompok bimaculatus 16 samples
were studied showing nucleotide composition A (29.0%), T(U)
(26.5%), G(14.4%), C(30.1%). Cyt b gene revealed 100 variable

Rabeeha Mankhi Jebur- Genetic Variation among Ompok bimaculatus,
Clupisoma sinensis, Labeo rohita and Puntius sophore Fishes from Jaikwadi
and Vishnupuri Dams, from Godavari River in System Using Mitochondrial
Cytochrome b Gene
EUROPEAN ACADEMIC RESEARCH - Vol. V, Issue 2 / May 2017
1470
sites and 100 parsimonic informative sites for 1066 bp long
region. The nucleotide diversity, Pi(t) was 0.09309 between
Nanded and Paithan populations. A total of three distinct cyt b
mt DNA haplotypes were identified in two populations of
Ompok pabda (Table 3). that were indicated to DNA
polymorphism observed among two species(Table 4). .
Haplotype Vishnupuri dam Jaikwadi dam
Hap 1 4 0
Hap 2 10 0
Hap 3 0 16
Table 3: Number of haplotypes detected in two different populations
of Ompok bimaculatus at Jaikwadi dam and Clupisoma sinensis
Vishnupuri dam.
Jaikwadi dam
(Clupisoma sinensis)
Vishnupuri dam
(Ompok bimaculatus)
Number of Haplotypes 1 2
Haplotype diversity 0 0.44
Variance of Haplotype
diversity
0 0.01254
Nucleotide diversity 0 0.00159
Table 4: DNA polymorphism observed among two species.
The genetic variation of Clupisoma sinensis was not observed
within species from Jaikwadi dam while in Ompok bimaculatus
genetic diversity was observed in means of haplotype diversity
and nucleotide diversity.
UPGMA Dendrogram based on cyt b gene sequences
shows that, two different clusters of Ompok bimaculatus are
formed (Figures( 5 and 6). Mean genetic distance between
populations observed is 0.01823 thus showing very less genetic
variation among individuals of same species of Nanded dam.

Rabeeha Mankhi Jebur- Genetic Variation among Ompok bimaculatus,
Clupisoma sinensis, Labeo rohita and Puntius sophore Fishes from Jaikwadi
and Vishnupuri Dams, from Godavari River in System Using Mitochondrial
Cytochrome b Gene
EUROPEAN ACADEMIC RESEARCH - Vol. V, Issue 2 / May 2017
1471
Figure 5: UPGMA Dendrogram, based on the nucleotide divergence,
showing the relationship between the Vishnupuri populations of
Ompok bimaculutus.
Figure 6: UPGMA Dendrogram, based on the nucleotide divergence,
showing the relationship between the Jaikwadi population Paithan
and Vishnupuri population Nanded.
4. DISCUSSION
The present study reveals genetic diversity of Ompok
bimaculatus from Jaikwadi dam and Clupisoma sinensis from
Vishnupuri dam of Aurangabad, Maharashtra. Two haplotypes
of Ompok bimaculatus and one haplotype of Clupisoma sinensis
were formed. The diversity indices represent low genetic
Ompok bimaculatus Nanded 17
Ompok bimaculatus Nanded 18
Ompok bimaculatus Nanded 3
Ompok bimaculatus Nanded 4
Ompok bimaculatus Nanded 9
Ompok bimaculatus Nanded 6
Ompok bimaculatus Nanded 14
Ompok bimaculatus Nanded 2
Ompok bimaculatus Nanded 11
Ompok bimaculatus Nanded 8
Ompok bimaculatus Nanded 19
Ompok bimaculatus Nanded 1
Ompok bimaculatus Nanded 10
Ompok bimaculatus Nanded 7
89
0.00000.00050.00100.0015
Clupisoma sinensis Paithan 11
Clupisoma sinensis Paithan 20
Clupisoma sinensis Paithan 4
Clupisoma sinensis Paithan 5
Clupisoma sinensis Paithan 17
Clupisoma sinensis Paithan 19
Clupisoma sinensis Paithan 3
Clupisoma sinensis Paithan 14
Clupisoma sinensis Paithan 9
Clupisoma sinensis Paithan 10
Clupisoma sinensis Paithan 13
Clupisoma sinensis Paithan 18
Clupisoma sinensis Paithan 8
Clupisoma sinensis Paithan 6
Clupisoma sinensis Paithan 15
Clupisoma sinensis Paithan 12
Ompok bimaculatus Nanded 1
Ompok bimaculatus Nanded 7
Ompok bimaculatus Nanded 19
Ompok bimaculatus Nanded 10
Ompok bimaculatus Nanded 14
Ompok bimaculatus Nanded 6
Ompok bimaculatus Nanded 3
Ompok bimaculatus Nanded 9
Ompok bimaculatus Nanded 8
Ompok bimaculatus Nanded 17
Ompok bimaculatus Nanded 2
Ompok bimaculatus Nanded 11
Ompok bimaculatus Nanded 18
Ompok bimaculatus Nanded 4
88
88
100
0.000.050.100.150.200.250.300.35

Rabeeha Mankhi Jebur- Genetic Variation among Ompok bimaculatus,
Clupisoma sinensis, Labeo rohita and Puntius sophore Fishes from Jaikwadi
and Vishnupuri Dams, from Godavari River in System Using Mitochondrial
Cytochrome b Gene
EUROPEAN ACADEMIC RESEARCH - Vol. V, Issue 2 / May 2017
1472
variation of Ompok bimaculatus. While UPGMA cluster
analysis showed sequence divergence only in Ompok
bimaculatus and no divergence in Clupisoma sinensis.
The Labeo rohita and Puntius sophore species are still to
be sequenced and analysed for their diversity indices. Thus
current work determines low diversity of Ompok bimaculatus
and no diversity of Clupisoma sinensis among the population of
Jaikwadi and Vishnupuri dam.
REFERENCES
1) Aldrich, P. R., J. L. Hamrick, P. Charvarriaga, and
G. Kochert.1998. Microsatellite analysis of
demographic genetic structure in fragmented
populations of the tropical tree Symphonia
globulifera. Mol. Ecol. 7:933–944
2) Fahrig, L., and G. Merriam. 1994. Conservation of
fragmented populations. Cons. Biol. 8:50–59.
3) Shaw, P. W., G. R. Carvalho, A. E. Magurran, and
B. H. Sheghers.1991. Population differentiation in
Trinidadian guppies: patterns and problems. J. Fish
Biol. 39:203–209
4) Was, A. and R. Wenne, 2002. Genetic differentiation
in hatchery and wild sea trout (Salmo trutta) in the
Southern Baltic at microsatellite loci. Aquaculture.,
204: 493-506.
5) Birky C.W., T. Maruyana and P. Fuerst, 1983. An
approach to population and evolution genetic theory
for genes in mitochondria and chloroplasts and some
results. Genetics., 103: 513-527.
6) Avise, J.C., 1991. Ten unorthodox perspectives on
evolution prompted by comparative population
Rabeeha Mankhi Jebur- Genetic Variation among Ompok bimaculatus,
Clupisoma sinensis, Labeo rohita and Puntius sophore Fishes from Jaikwadi
and Vishnupuri Dams, from Godavari River in System Using Mitochondrial
Cytochrome b Gene
EUROPEAN ACADEMIC RESEARCH - Vol. V, Issue 2 / May 2017
1473
genetics findings on mitochondrial DNA. Annu. Rev.
Genet., 25: 45-69.
7) McVeigh H. P., S. E. Bartlett and W. S. Davidson,
1991. Polymerase chain reaction/direct sequence
analysis of the cytochrome b gene in Salmo salar.
Aquaculture., 95: 225–233.
8) Fayazi J., M. Moradi, G. Rahimi, R. Ashtyani
and H. Galledari, 2006. Genetic differentiation and
phylogenetic relationships among Barbus
xanthopterus (Cyprinidae) populations in south
west of Iran using mitochondrial DNA markers. Pak
J. Biol. Sci., 9(12): 2249-2254.
9) Seema Sah, Ashoktaru Barat, Veena Pande, Jyoti
Sati and Chirag Goel, 2011. Population Structure of
Indian Hill Trout(Barilius bendelisis) Inferred from
Variation in Mitochondrial Dna Sequences
Advances in Biological Research 5 (2): 93-98.
10) http://www.nature.com/scitable/topicpage/the-
genetic-variation-in-a-population-is-6526354