Embed Size (px)
Citation preview
©FUNPEC-RP www.funpecrp.com.brGenetics and Molecular Research 14 (4): 16827-16839 (2015)
Genetic variation in Rhodomyrtus tomentosa (Kemunting) populations from Malaysia as revealed by inter-simple sequence repeat markers
T.S. Hue1, T.L. Abdullah1, N.A.P. Abdullah2 and U.R. Sinniah1
1Department of Crop Science, Faculty of Agriculture, Universiti Putra Malaysia, Serdang, Selangor, Malaysia2Department of Crop Science, Faculty of Agriculture and Food Sciences, Universiti Putra Malaysia Bintulu Campus Sarawak, Jalan Nyabau, Bintulu, Sarawak, Malaysia
Corresponding author: T.L. AbdullahE-mail: [email protected]
Genet. Mol. Res. 14 (4): 16827-16839 (2015)Received June 15, 2015Accepted September 20, 2015Published December 14, 2015DOI http://dx.doi.org/10.4238/2015.December.14.10
ABSTRACT. Kemunting (Rhodomyrtus tomentosa) from the Myrtaceae family, is native to Malaysia. It is widely used in traditional medicine to treat various illnesses and possesses significant antibacterial properties. In addition, it has great potential as ornamental in landscape design. Genetic variability studies are important for the rational management and conservation of genetic material. In the present study, inter-simple sequence repeat markers were used to assess the genetic diversity of 18 R. tomentosa populations collected from ten states of Peninsular Malaysia. The 11 primers selected generated 173 bands that ranged in size from 1.6 kb to 130 bp, which corresponded to an average of 15.73 bands per primer. Of these bands, 97.69% (169 in total) were polymorphic. High genetic diversity was documented at the species level (HT = 0.2705; I = 0.3973; PPB = 97.69%) but there was a low diversity at population level (HS =
16828T.S. Hue et al.
©FUNPEC-RP www.funpecrp.com.brGenetics and Molecular Research 14 (4): 16827-16839 (2015)
0.0073; I = 0 .1085; PPB = 20.14%). The high level of genetic differentiation revealed by GST (73%) and analysis of molecular variance (63%), together with the limited gene flow among population (Nm = 0.1851), suggests that the populations examined are isolated. Results from an unweighted pair group method with arithmetic mean dendrogram and principal coordinate analysis clearly grouped the populations into two geographic groups. This clear grouping can also be demonstrated by the significant Mantel test (r = 0.581, P = 0.001). We recommend that all the R. tomentosa populations be preserved in conservation program.
Key words: Contracting population; Gene erosion; Molecular marker; Multi-usage; Native plant; Rose myrtle
INTRODUCTION
Rhodomyrtus tomentosa (Aiton) Hassk. of the Myrtaceae family, is an edible, sun-loving flowering shrub that can grow up to 2-3 m tall. Its common name is kemunting (Malay) and apart from Malaysia, it is distributed in southern China, Philippines, Japan, India, Malaysia and Indonesia (Chen, 1984). It is usually found growing at open, often degraded sandy sites, along the seashores and open banks of river (Latiff, 1992) where it is used as an indicator of acidic soil (Wei et al., 2009). Naturally, R. tomentosa is easily propagated through seed dispersalby frugivorous birds and ants (Wei et al., 2004).
R. tomentosa is appreciated for its high value in traditional medicine (Ong and Nordiana, 1999; Wei, 2006), as well as its huge potential as an antibacterial agent against a broad range of gram positive and pathogenic bacteria (Limsuwan et al., 2009). Its showy pinkish five-petal flowers are produced all year round and possess a high aesthetic value. Together with the pinkish blooms which turn white one day after blooming and the exquisite maroon traits of its flowers have made R. tomentosa a suitable candidate as an ornamental and landscaping plant (Zhao et al., 2006). The high content of carbohydrates, fat and energy of its juicy ripened dark purple berries serve to attract birds into the landscape (Liu and Deng, 1997), as well as a filling for making pies and jam (Latiff, 1992). The locals also consume its fruit raw due to the high mineral and vitamin content (Latiff, 1992).
R. tomentosa is still underutilized in Malaysia despite its multiple uses due to lack of exposure and documentation. Its population size in Malaysia has become severely reduced and fragmented in recent years, mainly due to anthropogenic pressures. Where its natural populations are located in areas with heavy human activity, this is causing the population size to decline at a more severe rate compared to if natural populations existed at locations with less human activity. In view of the above matter, immediate effort to collect, conserve and document this valuable plant in Malaysia should be carried out before it goes into the fate of extinction. Before an effective conservation program can be initiated on R. tomentosa, the genetic variation within and between its populations should be studied. According to Falk and Holsinger. (1991), knowledge of genetic variation within and between the populations of a plant species is a prerequisite to formulate an effective and efficient conservation program, where the maximum genetic diversity of the species in the center of its origin and distribution is preserved. Maintenance of maximum and sufficient amounts of genetic diversity, which is the key to the diversity of a species, is crucial for a plant species to buffer sudden environmental changes imposed by unstable surroundings, and it is
16829Genetic variation of Rhodomyrtus tomentosa populations
©FUNPEC-RP www.funpecrp.com.brGenetics and Molecular Research 14 (4): 16827-16839 (2015)
important for the long term survival and evolution of a species (Barrett and Kohn, 1991). The survival and evolutionary capability of a species will be severely restricted with the loss of genetic diversity, occurring mainly through reduction in population size (Barrett and Kohn, 1991). The extent of genetic diversity in natural populations can be accessed through detailed population genetic analyses (Hamrick and Godt, 1996). In addition to assisting in the formulation of an efficient and effective conservation program, the knowledge of genetic diversity within natural populations can also be utilized in future breeding programs where the genetically diverse gene pool of landraces can be employed in hybridization programs to develop improved individuals (Sandhu et al., 2006).
Recently, the potential and applicability of ISSR markers in the study of natural plant populations has been demonstrated and proven (Zhang et al., 2006), owed to its advantages compared with other marker techniques. ISSRs are polymerase chain reactions (PCR) based markers that can be applied without prior knowledge of the plant genome sequence, where it greatly saves time and costs (Wolfe and Liston, 1998). It can be employed using a single primer consisting of a di- or trinucleotide simple sequence repeat, with or without a 3'- or 5'- end anchoring sequence of 1 to 3 nucleotides, targeting microsatellites regions that are abundant and dispersed throughout the genome. This technique exhibits more polymorphic fragment than other dominant markers such as random amplified polymorphic DNA (RAPD) (Qian et al., 2001). Primers are usually 16 to 25 nucleotides long resulting in higher stringency annealing (Wolfe and Liston, 1998) and overcoming the problem of reproducibility encountered by RAPD (Yang et al., 1996).
Previous studies conducted on R. tomentosa have been mainly concentrated on its ecology (Ren et al., 1997), antibacterial activities (Limsuwan et al., 2009), phytochemical analysis (Hiranat et al., 2012) and reproductive biology (Wei et al., 2009). To date, there is no study on the genetic diversity and structure of its natural population in Malaysia. The genetic pressure exerted on R. tomentosa imposed through its declining population size has warranted a thorough study on its population genetic structure, where the knowledge of the partitioning of genetic diversity within and between populations will be important to gain insight into the extent of the severity of population decline. Although R. tomentosa is still not widely exploited economically, however it possesses great future prospects in landscaping as well as in the food and beverage industry, in addition to its potential as natural antibacterial agent and traditional medicine. The once abundant R. tomentosa is more difficult to find in the wild nowadays. Thus, a study has been undertaken where inter simple sequence repeat (ISSR) was utilized to study the genetic variation among populations of R. tomentosa, and subsequently to suggest possible conservation strategies based on its population genetic structure.
MATERIAL AND METHODS
Plant material sampling
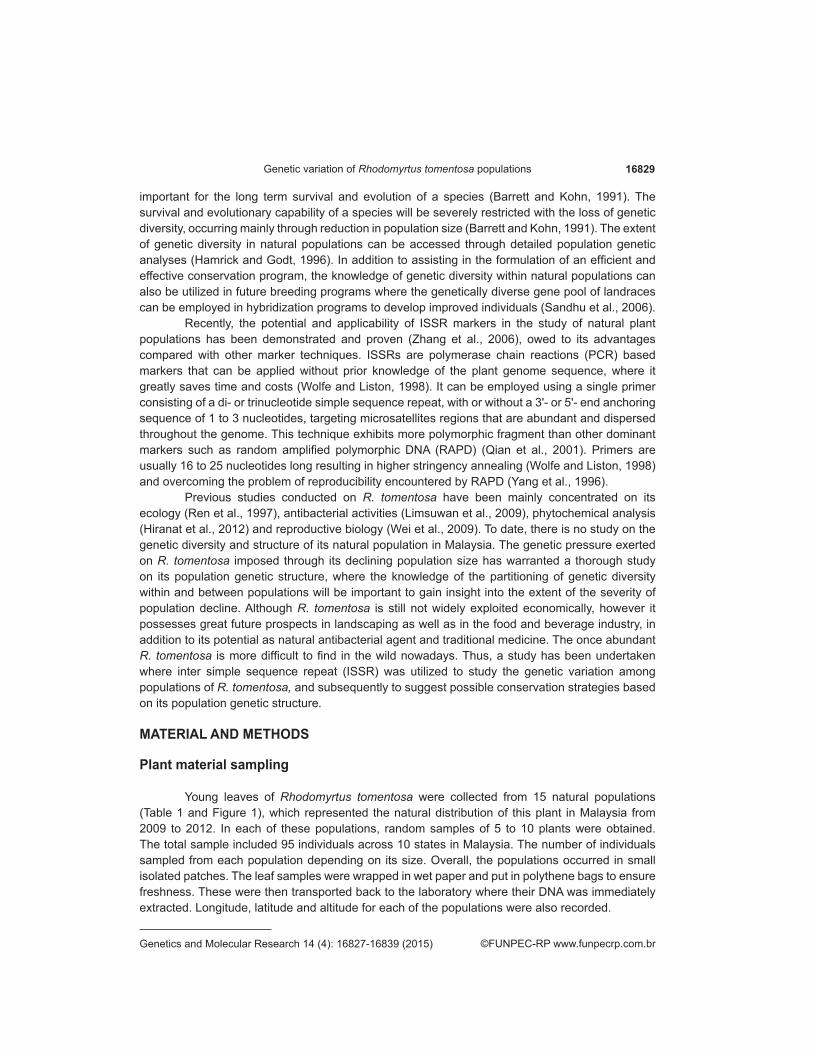
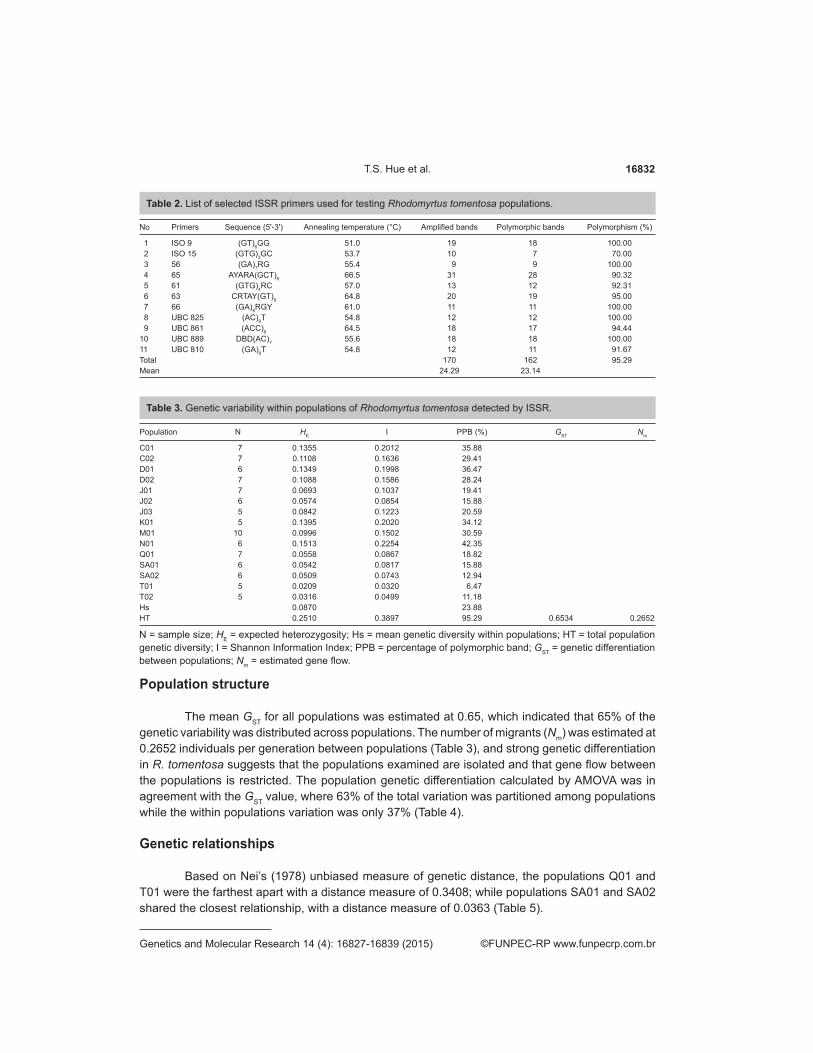
Young leaves of Rhodomyrtus tomentosa were collected from 15 natural populations (Table 1 and Figure 1), which represented the natural distribution of this plant in Malaysia from 2009 to 2012. In each of these populations, random samples of 5 to 10 plants were obtained. The total sample included 95 individuals across 10 states in Malaysia. The number of individuals sampled from each population depending on its size. Overall, the populations occurred in small isolated patches. The leaf samples were wrapped in wet paper and put in polythene bags to ensure freshness. These were then transported back to the laboratory where their DNA was immediately extracted. Longitude, latitude and altitude for each of the populations were also recorded.
16830T.S. Hue et al.
©FUNPEC-RP www.funpecrp.com.brGenetics and Molecular Research 14 (4): 16827-16839 (2015)
DNA extraction and polymerase chain reaction (PCR) amplification
Leaf tissue was ground to powder form in liquid nitrogen. Total genomic DNA was extracted using a GeneAll® DNA extraction kit (GeneAll® Biotechnology, Korea) according to the manufacturer protocol, quantified using Nanodrop 200c spectrophotometer (Thermo Scientific, USA) and quality was determined through electrophoresis on a 0.8% agarose gel. Extracted DNA was stored at -20°C until use. PCR amplifications were performed in a TProfessional Standard Thermocycler (Biometra, Germany) in a total volume of 25 µL, containing 15 ng template DNA, 12.5 µL 2X Type-it Microsatellite PCR Master Mix (Qiagen, Germany), 0.4 µM primer, and 4 µL RNase-free water (Qiagen, 2008). Thermal cycling conditions for amplification were as follows: initial denaturation at 95°C for 5 min followed by 10 touch-down cycles at 95°C for 30 s, 90 s annealing temperature, starting at 5°C above the calculated melting temperature of each of the primers and decreasing 1.0°C per cycle and 30 s at 72°C. The program continued for another 25 cycles using the final annealing temperature of each primer reached in the touchdown phase, and finishing with a final extension step of 10 min at 68°C and kept at 4°C at ∞. A total of 22 primers previously used to study the genetic diversity in Eucalyptus sp of the same family, Myrtaceae (Balasaravanan et al., 2005;
Code State District (Daerah) Location Coordinate Altitude (m.a.s.l)
C01 Pahang Kuantan Kg. Cheroh Paloh 103.37032°E, 03.62414°N 9C02 Pahang Bera Bera 102.62777°E, 03.12892°N 11D01 Kelantan Bachok Kg. Bator Jelawat 102.37170°E, 05.99918°N 10D02 Kelantan Pasir Puteh Jeram Pasu 102.35413°E, 05.82650°N 12J01 Johor Mersing Kg. Tanjung Resang 103.80357°E, 02.57721°N 12J02 Johor Mersing Kg. Sri Pantai 103.87311°E, 02.39302°N 10J03 Johor Mersing Kem Iskandar 103.90732°E, 02.35212°N 8K01 Kedah Padang Terap Kg. Kubang Julok 100.66459°E, 06.14881°N 10M01 Melaka Alor Gajah Ramuan China Kechil 102.04225°E, 02.25844°N 8N01 Negeri Sembilan Jempol Kg. Melor 102.39709°E, 02.93034°N 11Q01 Sarawak Bintulu Tanjung Batu 113.04690°E, 03.20849°N 10SA01 Sabah Kuala Penyu Kg. Tambilik 115.57982°E, 05.58609°N 11SA02 Sabah Kuala Penyu Kg. Purun 115.63286°E, 05.54286°N 8T01 Terengganu Dungun Kg. Kuala Abang 103.39094°E, 04.86243°N 10T02 Terengganu Setiu Rhu Tapai 102.97257°E, 05.51289°N 10
Table 1. List of Rhodomyrtus tomentosa populations collected.
Figure 1. Map showing populations of Rhodomyrtus tomentosa populations sampled.
16831Genetic variation of Rhodomyrtus tomentosa populations
©FUNPEC-RP www.funpecrp.com.brGenetics and Molecular Research 14 (4): 16827-16839 (2015)
Okun et al., 2008) and 19 primers from University of British Colombia (UBC) primer set no. 9 were synthesized and initially screened for amplifications. Each sample was replicated twice to ensure reproducibility. Each PCR run included a negative control. For screening purposes, the 41 primers were initially tested on one individual from each of the population. Amplification products were separated via electrophoresis on 1.5% (w/v) agarose gel with 1X TBE buffer at 70 V for 75 min, stained with GelRedTM Nucleic Acid Stain (Biotium Inc., USA) and visualized under UV light using the Alpha Innotech imaging system (Alpha Innotech, USA). GeneRuler 100bp ladder (Fermentas, Lithuania) was used as DNA molecular weight markers.
Statistical analysis
Since ISSR are dominant markers, it was assumed that each band represented the phenotype at a single biallelic locus. Amplified fragments were scored for presence “1” or absence “0” to construct the binary data matrix. The resulting binary data matrix was analyzed using POPGENE version 1.31 (Yeh et al., 1997) to estimate the following genetic diversity parameters, assuming Hardy-Weinberg equilibrium (HWE): percentage of polymorphic bands (PPB), expected heterozygosity (HE), mean gene diversity within populations (HS), total population gene diversity (HT), Shannon information index (I) (Lewontin, 1972), coefficient of gene differentiation (GST) (Nei, 1973), and gene flow (Nm). Gene flow was calculated from GST according to the equation Nm = (1 / GST - 1) / 4 (Nei, 1973). A dendrogram was generated based on Nei’s (1978) unbiased measure of genetic distance among the populations with the UPGMA algorithm using NTSYS-pc 2.11 (Rohlf, 1998). In order to evaluate the partitioning of genetic variability between and within populations, analysis of molecular variance (AMOVA) was performed. The graphical representation of the relationship of the populations was revealed by principal coordinate analysis (PCoA). A Mantel test (Mantel, 1967) was performed to reveal the correlation between genetic and geographic distances (km) among populations. AMOVA, PCoA, Mantel test results, and geographic distances were calculated using the package GenAlEx 6.1 software (Peakall and Smouse, 2006).
RESULTS
Genetic diversity revealed by ISSR markers
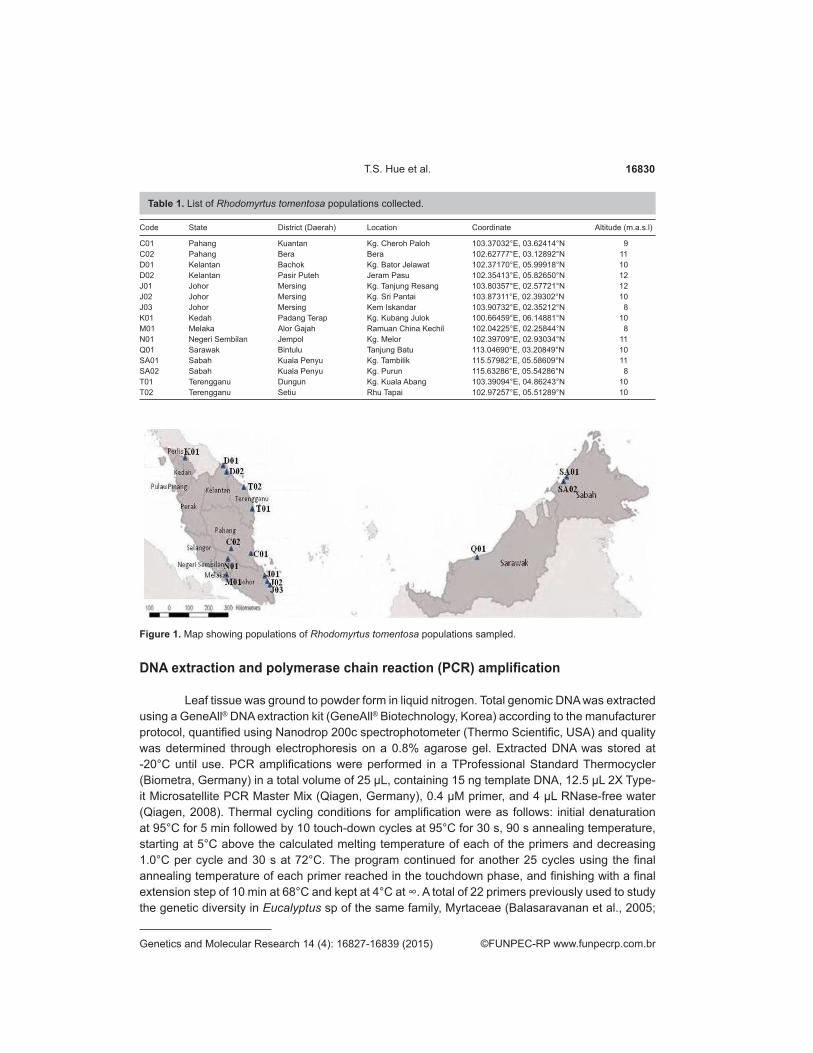
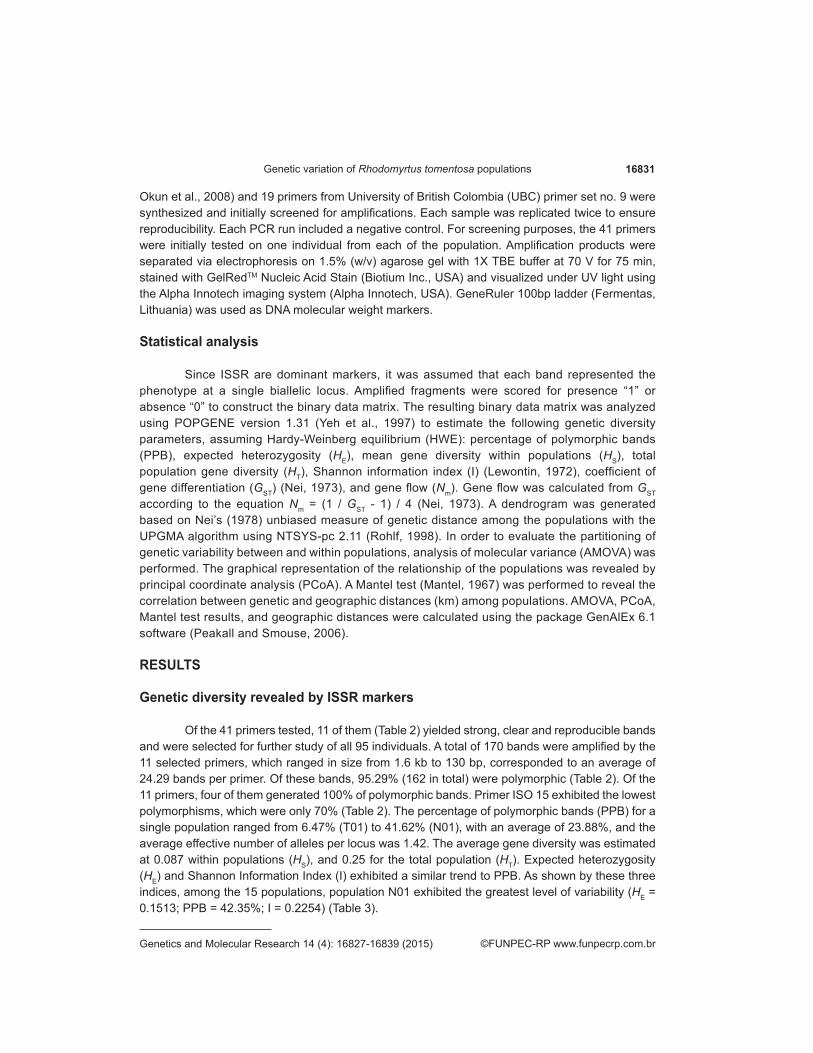
Of the 41 primers tested, 11 of them (Table 2) yielded strong, clear and reproducible bands and were selected for further study of all 95 individuals. A total of 170 bands were amplified by the 11 selected primers, which ranged in size from 1.6 kb to 130 bp, corresponded to an average of 24.29 bands per primer. Of these bands, 95.29% (162 in total) were polymorphic (Table 2). Of the 11 primers, four of them generated 100% of polymorphic bands. Primer ISO 15 exhibited the lowest polymorphisms, which were only 70% (Table 2). The percentage of polymorphic bands (PPB) for a single population ranged from 6.47% (T01) to 41.62% (N01), with an average of 23.88%, and the average effective number of alleles per locus was 1.42. The average gene diversity was estimated at 0.087 within populations (HS), and 0.25 for the total population (HT). Expected heterozygosity (HE) and Shannon Information Index (I) exhibited a similar trend to PPB. As shown by these three indices, among the 15 populations, population N01 exhibited the greatest level of variability (HE = 0.1513; PPB = 42.35%; I = 0.2254) (Table 3).
16832T.S. Hue et al.
©FUNPEC-RP www.funpecrp.com.brGenetics and Molecular Research 14 (4): 16827-16839 (2015)
Population structure
The mean GST for all populations was estimated at 0.65, which indicated that 65% of the genetic variability was distributed across populations. The number of migrants (Nm) was estimated at 0.2652 individuals per generation between populations (Table 3), and strong genetic differentiation in R. tomentosa suggests that the populations examined are isolated and that gene flow between the populations is restricted. The population genetic differentiation calculated by AMOVA was in agreement with the GST value, where 63% of the total variation was partitioned among populations while the within populations variation was only 37% (Table 4).
Genetic relationships
Based on Nei’s (1978) unbiased measure of genetic distance, the populations Q01 and T01 were the farthest apart with a distance measure of 0.3408; while populations SA01 and SA02 shared the closest relationship, with a distance measure of 0.0363 (Table 5).
No Primers Sequence (5'-3') Annealing temperature (°C) Amplified bands Polymorphic bands Polymorphism (%)
1 ISO 9 (GT)6GG 51.0 19 18 100.00 2 ISO 15 (GTG)3GC 53.7 10 7 70.00 3 56 (GA)7RG 55.4 9 9 100.00 4 65 AYARA(GCT)6 66.5 31 28 90.32 5 61 (GTG)4RC 57.0 13 12 92.31 6 63 CRTAY(GT)9 64.8 20 19 95.00 7 66 (GA)8RGY 61.0 11 11 100.00 8 UBC 825 (AC)8T 54.8 12 12 100.00 9 UBC 861 (ACC)6 64.5 18 17 94.4410 UBC 889 DBD(AC)7 55.6 18 18 100.0011 UBC 810 (GA)8T 54.8 12 11 91.67Total 170 162 95.29Mean 24.29 23.14
Table 2. List of selected ISSR primers used for testing Rhodomyrtus tomentosa populations.
Population N HE I PPB (%) GST Nm
C01 7 0.1355 0.2012 35.88 C02 7 0.1108 0.1636 29.41 D01 6 0.1349 0.1998 36.47 D02 7 0.1088 0.1586 28.24 J01 7 0.0693 0.1037 19.41 J02 6 0.0574 0.0854 15.88 J03 5 0.0842 0.1223 20.59 K01 5 0.1395 0.2020 34.12 M01 10 0.0996 0.1502 30.59 N01 6 0.1513 0.2254 42.35 Q01 7 0.0558 0.0867 18.82 SA01 6 0.0542 0.0817 15.88 SA02 6 0.0509 0.0743 12.94 T01 5 0.0209 0.0320 6.47 T02 5 0.0316 0.0499 11.18 Hs 0.0870 23.88 HT 0.2510 0.3897 95.29 0.6534 0.2652
N = sample size; HE = expected heterozygosity; Hs = mean genetic diversity within populations; HT = total population genetic diversity; I = Shannon Information Index; PPB = percentage of polymorphic band; GST = genetic differentiation between populations; Nm = estimated gene flow.
Table 3. Genetic variability within populations of Rhodomyrtus tomentosa detected by ISSR.
16833Genetic variation of Rhodomyrtus tomentosa populations
©FUNPEC-RP www.funpecrp.com.brGenetics and Molecular Research 14 (4): 16827-16839 (2015)
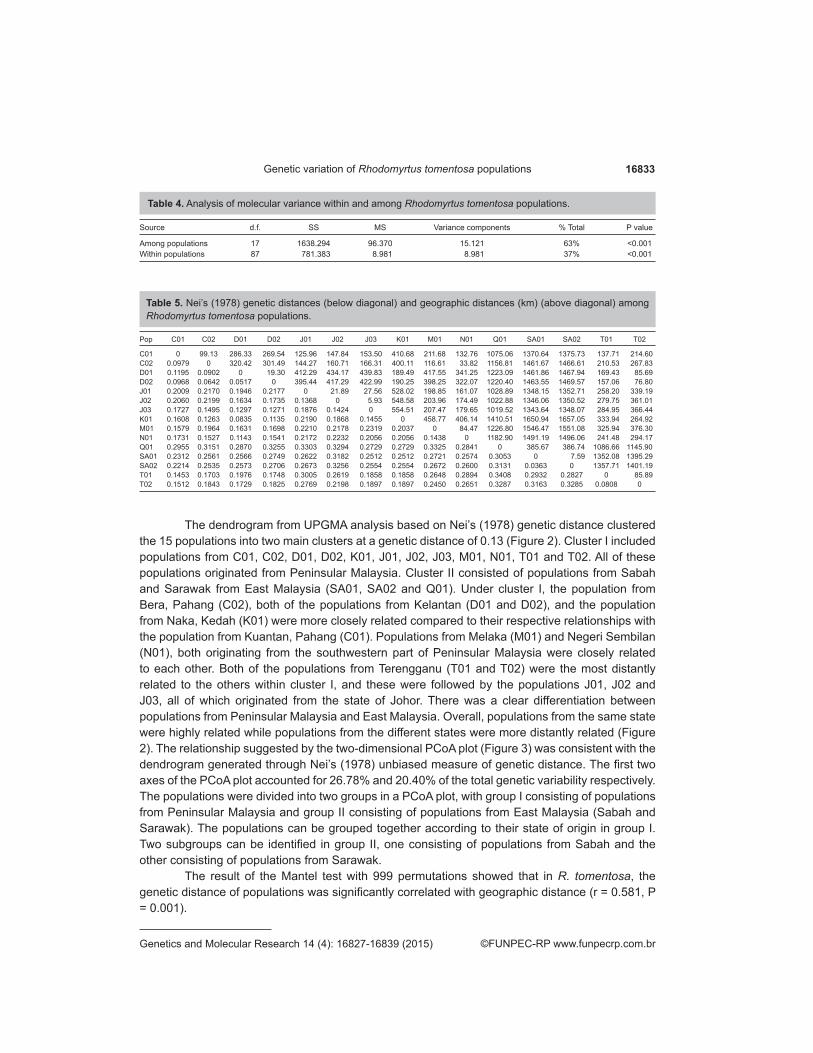
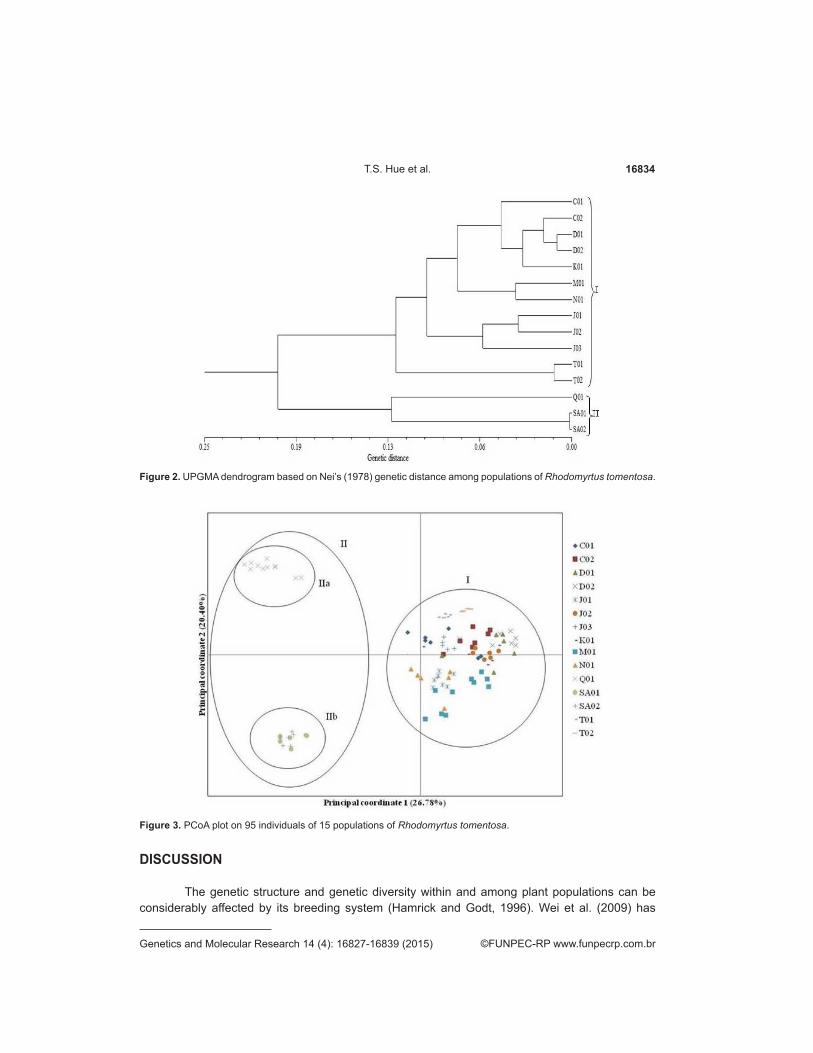
The dendrogram from UPGMA analysis based on Nei’s (1978) genetic distance clustered the 15 populations into two main clusters at a genetic distance of 0.13 (Figure 2). Cluster I included populations from C01, C02, D01, D02, K01, J01, J02, J03, M01, N01, T01 and T02. All of these populations originated from Peninsular Malaysia. Cluster II consisted of populations from Sabah and Sarawak from East Malaysia (SA01, SA02 and Q01). Under cluster I, the population from Bera, Pahang (C02), both of the populations from Kelantan (D01 and D02), and the population from Naka, Kedah (K01) were more closely related compared to their respective relationships with the population from Kuantan, Pahang (C01). Populations from Melaka (M01) and Negeri Sembilan (N01), both originating from the southwestern part of Peninsular Malaysia were closely related to each other. Both of the populations from Terengganu (T01 and T02) were the most distantly related to the others within cluster I, and these were followed by the populations J01, J02 and J03, all of which originated from the state of Johor. There was a clear differentiation between populations from Peninsular Malaysia and East Malaysia. Overall, populations from the same state were highly related while populations from the different states were more distantly related (Figure 2). The relationship suggested by the two-dimensional PCoA plot (Figure 3) was consistent with the dendrogram generated through Nei’s (1978) unbiased measure of genetic distance. The first two axes of the PCoA plot accounted for 26.78% and 20.40% of the total genetic variability respectively. The populations were divided into two groups in a PCoA plot, with group I consisting of populations from Peninsular Malaysia and group II consisting of populations from East Malaysia (Sabah and Sarawak). The populations can be grouped together according to their state of origin in group I. Two subgroups can be identified in group II, one consisting of populations from Sabah and the other consisting of populations from Sarawak.
The result of the Mantel test with 999 permutations showed that in R. tomentosa, the genetic distance of populations was significantly correlated with geographic distance (r = 0.581, P = 0.001).
Source d.f. SS MS Variance components % Total P value
Among populations 17 1638.294 96.370 15.121 63% <0.001Within populations 87 781.383 8.981 8.981 37% <0.001
Table 4. Analysis of molecular variance within and among Rhodomyrtus tomentosa populations.
Pop C01 C02 D01 D02 J01 J02 J03 K01 M01 N01 Q01 SA01 SA02 T01 T02
C01 0 99.13 286.33 269.54 125.96 147.84 153.50 410.68 211.68 132.76 1075.06 1370.64 1375.73 137.71 214.60C02 0.0979 0 320.42 301.49 144.27 160.71 166.31 400.11 116.61 33.82 1156.81 1461.67 1466.61 210.53 267.83D01 0.1195 0.0902 0 19.30 412.29 434.17 439.83 189.49 417.55 341.25 1223.09 1461.86 1467.94 169.43 85.69D02 0.0968 0.0642 0.0517 0 395.44 417.29 422.99 190.25 398.25 322.07 1220.40 1463.55 1469.57 157.06 76.80J01 0.2009 0.2170 0.1946 0.2177 0 21.89 27.56 528.02 198.85 161.07 1028.89 1348.15 1352.71 258.20 339.19J02 0.2060 0.2199 0.1634 0.1735 0.1368 0 5.93 548.58 203.96 174.49 1022.88 1346.06 1350.52 279.75 361.01J03 0.1727 0.1495 0.1297 0.1271 0.1876 0.1424 0 554.51 207.47 179.65 1019.52 1343.64 1348.07 284.95 366.44K01 0.1608 0.1263 0.0835 0.1135 0.2190 0.1868 0.1455 0 458.77 406.14 1410.51 1650.94 1657.05 333.94 264.92M01 0.1579 0.1964 0.1631 0.1698 0.2210 0.2178 0.2319 0.2037 0 84.47 1226.80 1546.47 1551.08 325.94 376.30N01 0.1731 0.1527 0.1143 0.1541 0.2172 0.2232 0.2056 0.2056 0.1438 0 1182.90 1491.19 1496.06 241.48 294.17Q01 0.2955 0.3151 0.2870 0.3255 0.3303 0.3294 0.2729 0.2729 0.3325 0.2841 0 385.67 386.74 1086.66 1145.90SA01 0.2312 0.2561 0.2566 0.2749 0.2622 0.3182 0.2512 0.2512 0.2721 0.2574 0.3053 0 7.59 1352.08 1395.29SA02 0.2214 0.2535 0.2573 0.2706 0.2673 0.3256 0.2554 0.2554 0.2672 0.2600 0.3131 0.0363 0 1357.71 1401.19T01 0.1453 0.1703 0.1976 0.1748 0.3005 0.2619 0.1858 0.1858 0.2648 0.2894 0.3408 0.2932 0.2827 0 85.89T02 0.1512 0.1843 0.1729 0.1825 0.2769 0.2198 0.1897 0.1897 0.2450 0.2651 0.3287 0.3163 0.3285 0.0808 0
Table 5. Nei’s (1978) genetic distances (below diagonal) and geographic distances (km) (above diagonal) among Rhodomyrtus tomentosa populations.
16834T.S. Hue et al.
©FUNPEC-RP www.funpecrp.com.brGenetics and Molecular Research 14 (4): 16827-16839 (2015)
DISCUSSION
The genetic structure and genetic diversity within and among plant populations can be considerably affected by its breeding system (Hamrick and Godt, 1996). Wei et al. (2009) has
Figure 3. PCoA plot on 95 individuals of 15 populations of Rhodomyrtus tomentosa.
Figure 2. UPGMA dendrogram based on Nei’s (1978) genetic distance among populations of Rhodomyrtus tomentosa.
16835Genetic variation of Rhodomyrtus tomentosa populations
©FUNPEC-RP www.funpecrp.com.brGenetics and Molecular Research 14 (4): 16827-16839 (2015)
shown that R. tomentosa possesses a mixed mating system (outcrossing and geitonogamy) with geitonogamy being the predominating system. ISSR assessment of the 15 populations of R. tomentosa from Malaysia revealed that this species contains a relatively high level of genetic diversity among its populations (HT = 0.2510; I = 0.3897; PPB = 95.29%). However, within each population, a rather low level of genetic diversity was observed (HS = 0.087; I = 0.1291; PPB = 23.88%). In addition, a high level of genetic differentiation (GST = 0.6534) and a low level of gene flow (Nm = 0.2652) was also seen among the R. tomentosa populations. The results from GST were further supported by the results from AMOVA, where 63% of the genetic variation was distributed among populations. The above findings concur with Hamrick and Godt (1996) and Nybom and Bartish (2000) who state that selfing species usually possess lower genetic diversity within populations and higher genetic differentiation among populations compared to outcrossing species. This is also comparable to other selfing plant species, such as Sinojackia dolichocarpa C.J. Qi (HE = 0.2255; PPB = 72.99%; I = 0.3453) (Cao et al., 2006) and Tacca chantieri André (h = 0.264; PPB = 90.62%) (Zhang et al., 2006).
R. tomentosa has a wide range of distribution across the South East Asian region, as well as some of the East Asian region (Chen, 1984). It has been reported that the genetic diversity for widespread species is higher than that of rare and endangered species (Verma et al., 2009). In Malaysia, R. tomentosa was once growing profusely with somewhat contiguous large population sizes (Latiff, 1992), contributing to its large gene pool with abundant genetic diversity. During that time, considerable diversity levels had been accumulated. Recently, it has been subjected to habitat destruction due to anthropogenic disturbances and its populations have become fragmented. Despite this, high variability has been and continues to be well conserved in these severely isolated populations, thus leading to the high level of genetic diversity among the populations. According to Zawko et al. (2006), for plant species that experienced isolation of populations and reduction in the population size which was occurring recently due to anthropogenic pressure, insufficient timeframes were provided for genetic diversity to be reduced. The recent occurrence of habitat fragmentation in populations of R. tomentosa can be inferred from the groupings found in the populations from M01 and N01, both from different states. We can assume that previously, populations from each state occurred in a continuous pattern with moderately frequent gene flow, and due to recent development activities, the once continuous distribution of R. tomentosa has been broken down and become genetically subdivided. This can also be understood from the groupings found in the two populations from Sabah, where the genetic variation within populations is low. The close relationships between populations from the same state may be attributed to the close distance between populations sampled from the same state (5.93-99.13 km) as compared with the wider distance between populations sampled from different states (125.96-1792.40 km). However, the possibility of restricted gene flow cannot be rules out due to physical distance and the geitonogamous pollination system of the species leads to closely related populations from the same state and distantly related populations from different states.
Slatkin (1985) has proposed that significant population differentiation may be maintained under strong differential selection, which will occur if the migration rate is less than one successful migrant per generation (Nm < 1). Compared with the RAPD-derived value for selfing plant species (GST = 0.59) (Nybom and Bartish, 2000), the genetic differentiation value obtained from this study was higher (GST = 0.65), indicating significant genetic divergence among populations. Fluctuating population number and size, shifts in distribution, habitat fragmentation and population isolation may be involved in shaping the genetic structure of plant populations (Hamrick and Godt, 1996).
16836T.S. Hue et al.
©FUNPEC-RP www.funpecrp.com.brGenetics and Molecular Research 14 (4): 16827-16839 (2015)
Furthermore, the genetic structure may also be shaped by local adaptations due to genotype x environment interactions (Cao et al., 2006).
Reduced effective population size is a characteristic in selfing species (Ingvarsson, 2002). In small isolated populations, the genetic differentiation caused by genetic drift and inbreeding is more pronounced (Barett and Kohn, 1991). Recent field observations have shown that R. tomentosa occurs in severely fragmented and isolated habitats, with small population sizes. As inferred from the low level of gene flow among populations of R. tomentosa in Malaysia, genetic drift may be a contributing factor to the possible high levels of genetic differentiation in its future populations. Due to the predominant geitonogamous mating system of R. tomentosa, together with the low gene exchange between populations, severe inbreeding may occur in the future thus contributing to the loss of genetic variation within populations. In the long term, genetic drift and the high genetic differentiation will cause alleles to be fixed in isolated populations, which may lead to new variations or the total extinction of the populations depending on whether advantageous or non-advantageous alleles have been fixed. The low gene flow among R. tomentosa populations has also caused lack of hybridization among individuals from other populations leading to a low, within population variability, and restricted gene pool. Together with the homogenous environmental conditions of local habitats, this has caused lack of speciation. In addition, although the highest value of genetic distance recorded among R. tomentosa populations was 0.3408, these populations were still considered to be closely related to each other. The observed genetic variation existing among populations is probably caused by the adaptation of the populations to the local environmental pressures.
Seed dispersal mechanisms also contribute to the genetic structuring of a plant population (Hamrick and Godt, 1996). Hamrick and Godt. (1996) performed a combined analysis of mating systems and seed dispersal mechanism and revealed that for mixed mating species with ingested seed dispersal mechanisms, the genetic differentiation among populations is higher than in species with wind dispersal mechanisms from the same breeding system. The seeds of R. tomentosa are ingested and dispersed by frugivorous birds, mainly bulbul (Pycnonotus sinensis), which consume the juicy ripened berries (Wei et al., 2004). Bulbuls are known to live in pairs or small groups where they have defined territories and small home ranges and thus tend to disperse the seeds within 100 m from the mother plant (Spiegel and Nathan, 2007). The seed dispersal distance by bulbuls rarely exceeds 500 m (Spiegel and Nathan, 2007). In addition to ingested seed dispersal by bulbuls, the seeds of R. tomentosa can also be dispersed by ants, which ‘move’ the seeds from ripened berries fall to the ground or from feces deposited by bulbuls to their colonies. The average maximum dispersal distance by ants is only 4-5 m (Wei et al., 2004). The seed dispersal limitations of bulbuls and ants may have contributed to the patchy populations of R. tomentosa.
Gene flow may also occur via pollen dispersal. Wei et al. (2009) has shown that R. tomentosa is mainly pollinated by bees from the Apidae family with Amegilla florae and Xylocopa nasalis as the primary pollinators. It has been shown that bees belonging to the Apidae family have relatively short foraging distance, averaging 1526.1 m, and they tend to revisit the same plant on which they have fed previously (Tepedino, 2005). The foraging habits of the pollinators are dependent on the properties of the plant population, where the ability of the plant to attract and support pollinators will be affected by its small population sizes (Tepedino, 2005). This condition is further exaggerated by urbanization where the habitat needed to support pollinators is threatened (Tepedino, 2005). In view of the above, the small and fragmented populations of R. tomentosa are a result of urbanization and may not be sustainable for pollinator subsistence in the long run. The limited gene flow as inferred from the short seed dispersal and pollen exchange has led to a higher genetic differentiation among R. tomentosa populations, in line with the findings of Hamrick and Godt (1996).
16837Genetic variation of Rhodomyrtus tomentosa populations
©FUNPEC-RP www.funpecrp.com.brGenetics and Molecular Research 14 (4): 16827-16839 (2015)
It is well known that the amount of gene flow through pollination and seed dispersal can be limited by geographic isolation (Pfeifer and Jetschke, 2006). In R. tomentosa, the short distance of seed dispersal by bulbuls (100-500 m) and ants (4-5 m), and the short pollen dispersal distance by bees (1.5 km) are well below the minimum geographic distance between J02 and J03 (5.93 km). This phenomenon has further exaggerated the high level of genetic differentiation among R. tomentosa populations. The pattern of genetic distance was corresponded to the geographic distance (Mantel test: r = 0.581, P = 0.001). This suggested that apart from genetic drift, isolation by distance (Wright, 1943) could in part contribute to the present observed genetic diversity. Populations from East Malaysia (SA01, SA02 and Q01) and West Malaysia (the remaining populations) are separated by the South China Sea and the genetic distances between populations from the two regions are high as shown by UPGMA dendrogram and the PCoA plot.
From the results of the population genetic structure of R. tomentosa obtained from this study, insights can be gained on conservation strategies for this species in Malaysia. The high level of genetic differentiation and the limited gene flow among R. tomentosa populations suggests that all the extant populations should be preserved to conserve the maximum genetic variability of the species. It is well known that maintaining the genetic diversity is one of the main objectives for a conservation program (Avise and Hamrick, 1996). Keeping this in view, for ex situ conservation, a small number of plants should be sampled from all the populations. The severe habitat fragmentation and small population sizes of R. tomentosa has made it vulnerable to the loss of genetic diversity due to genetic drift and inbreeding. Thus, efforts have to be made to protect its natural habitat and to increase its population size for in situ conservation. Population from Negeri Sembilan (N01) contains a significant amount of the genetic diversity and should be given priority to be conserved both in situ and ex situ. Nevertheless, other populations should not be neglected in the conservation program as they might contain rare alleles that could lead to desired characteristics.
In conclusion, the high level of genetic variation found among the populations and low levels of genetic variation within populations has indicated that R. tomentosa has undergone habitat fragmentation recently, thus efforts should be taken promptly by authorities to ensure the continuing existence of this plant in their natural habitat in the future. The genetic variation exerted by the populations has enabled them to response to the environmental change of their surroundings, but still not enough to trigger the speciation process. Care should be taken during ex situ conservation to ensure that the populations are maintained under the same environments.
ACKNOWLEDGMENTS
The authors are grateful to the Agriculture Officers from the Department of Agriculture of Malaysia in each of the respective districts for their great help in making field collections a success. This study was funded by Ministry of Agriculture and Agro-based Industry (MOA) through Science fund (Project #05-01-04-SF1039).
REFERENCES
Avise JC and Hamrick JL (1996). Conservation genetics: case histories from nature. Chapman and Hall, New York.Balasaravanan T, Chezhian P, Kamalakannan R, Ghosh M, et al. (2005). Determination of inter- and intra-species genetic
relationships among six Eucalyptus species based on Inter-simple sequence repeats (ISSR). Tree Physiol. 25: 1295-1302.
16838T.S. Hue et al.
©FUNPEC-RP www.funpecrp.com.brGenetics and Molecular Research 14 (4): 16827-16839 (2015)
Barrett SC and Kohn JR (1991). Genetic and Evolutionary Consequences of Small Population Size in Plants: Implications for Conservation. In: Genetics and Conservation of Rare Plants (Falk DA and Holsinger KE, eds.). Oxford University Press, New York, 3-30.
Cao PJ, Yao QF, Ding BY, Zeng HY, et al. (2006). Genetic diversity of Sinojackia dolichocarpa (Styracaceae), a species endangered and endemic to China, detected by inter-simple sequence repeat (ISSR). Biochem. Syst. Ecol. 34: 231-239.
Chen J (1984). Flora of China, Tomus 53. Science Press, Beijing.Falk D and Holsinger K (1991). Genetics and conservation of rare plants. Oxford University Press, New York.Hamrick JL and Godt MJW (1996). Effects of life history traits on genetic diversity in plant species. Philos. Trans. R. Soc. Lond.
B 351: 1291-1298.Hiranat A, Chitbankluoi W, Mahabusarakam W, Limsuwan S, et al. (2012). A new flavellagic acid derivative and phloroglucinol
from Rhodomyrtus tomentosa. Nat. Prod. Res. 26: 1904-1909.Ingvarsson PK (2002). A metapopulation perspective on genetic diversity and differentiation in partially self-fertilizing plants.
Evolution 56: 2268-2373.Latiff AM (1992). Rhodomyrtus tomentosa (Aiton) Hassk. In: Plant Resources of South East Asia, No 2: Edible Fruits and Nuts
(Verheij EWM and Coronel RE, eds.). Prosea Foundation, Bogor, 276-277.Lewontin RC (1972). The apportionment of human diversity. In: Evolution Biology. Vol. 6 (Dobzhansky T, Hecht MK and Steere
WC, eds.). Appleton-Century-Crofts, New York, 381-398.Limsuwan S, Trip EN, Kouwen TRHM, Piersma S, et al. (2009). Rhodomyrtone: A new candidate as a natural antibacterial drug
from Rhodomyrtus tomentosa. Phytomedicine 16: 645-651.Liu F and Deng YF (1997). Preparation of Rhodomyrtus tomentosa Juice. Guangxi Forest. Sci. 26: 119-122.Mantel N (1967). The detection of disease clustering and a generalized regression approach. Cancer Res. 27: 209-220.Nei M (1973). Analysis of gene diversity in subdivided populations. Proc. Natl. Acad. Sci. U. S. A. 70: 3321-3323.Nei M (1978). Estimation of average heterozygosity and genetic distance from a small number of individuals. Genetics 89:
583-590.Nybom H and Bartish IV (2000). Effects of life history traits and sampling strategies on genetic diversity estimates obtained with
RAPD markers in plants. Perspect. Plant Ecol. Evol. Syst. 3: 93-114.Okun DO, Kenya EU, Oballa PO, Odee DW, et al. (2008). Analysis of genetic diversity in Eucalyptus grandis (Hill ex Maiden)
seed sources using inter simple sequence repeat (ISSR) molecular markers. Afri. J. Biotechnol. 7: 2119-2123.Ong HC and Nordiana M (1999). Malay ethno-medico botany in Machang, Kelantan, Malaysia. Fitoterapia 70: 502-513.Peakall R and Smouse PE (2006). GENALEX 6: genetic analysis in Excel. Population genetic software for teaching and
research. Mol. Ecol. Notes 6: 288-295.Pfeifer M and Jetschke G (2006). Influence of geographic isolation on genetic diversity of Himantoglossum hircinum
(Orchidaceae). Folia Geobot. 41: 3-20.Qiagen (2008). Type-it microsatellite PCR handbook.Qian W, Ge S and Hong DY (2001). Genetic variation within and among populations of a wild rice Oryza granulata from China
detected by RAPD and ISSR markers. Theor. Appl. Genet. 102: 440-449.Ren H, Peng SL, Sun GC and Yu ZY (1997). The ecological comparison of Psychotria rubra and Rhodomyrtus tomentosa in
South China. Acta Phytoecol. Sin. 21: 386-392.Rohlf FJ (1998). NTSYSpc: numerical taxonomy and multivariate analysis system. Version 2.11. Exeter software, Setauket, NY.Sandhu JS, Singh P and Singh A (2006). Genetic divergence in chickpea in different environments. Trop. Sci. 46: 23-30.Slatkin M (1985). Gene flow in natural populations. Annu. Rev. Ecol. Syst. 16: 393-430.Spiegel O and Nathan R (2007). Incorporating dispersal distance into the disperser effectiveness framework: frugivorous birds
provide complementary dispersal to plants in a patchy environment. Ecol. Lett. 10: 718-728.Tepedino VJ (2005). Final report. Reproduction and pollination of Astragalus from Washington County, southern Utah: A.
holmgreniorum and A. ampullarioides, 2-16. USDA-ARS Bee Biology & Systematics Laboratory, Department of Biology, Utah State University, Logan, Utah, USA.
Verma S, Rana TS and Ranade SA (2009). Genetic variation and clustering in Murraya paniculata complex as revealed by single primer amplification reaction methods. Curr. Sci. 96: 1210-1216.
Wei F (2006). Manufacture of oral liquid contaning traditional Chinese medicine extract for treating gyneacopathy. (Guangxi Huahong Pharmaceutical Co., Ltd., Peop. Rep. China; Shanghai Fosun Pharmaceutical (Group) Co., Ltd.), Faming Zhuanli Shenqing Gongkai Shuomingshu. China Patent No. CN1846715.
Wei MS, Chen ZH, Ren H, Zou FS, et al. (2004). Seed dispersal of the pioneer shrub Rhodomyrtus tomentosa by frugivorous birds and ants. Biodivers. Sci. 12: 494-500.
Wei MS, Chen ZH, Ren H, Zou FS, et al. (2009). Reproductive ecology of Rhodomyrtus tomentosa (Myrtaceae). Nord. J. Bot. 27: 154-160.
16839Genetic variation of Rhodomyrtus tomentosa populations
©FUNPEC-RP www.funpecrp.com.brGenetics and Molecular Research 14 (4): 16827-16839 (2015)
Wolfe AD and Liston A (1998). Contributions of PCR-Based Methods to Plant Systematic and Evolutionary Biology. In: Molecular Systematics of Plants II: DNA Sequencing (Soltis DE, Soltis PS and Doyle JJ, eds.). Kluwer, Norwell, 43-86.
Wright S (1943). Isolation by distance. Genetics 28: 114-138.Yang WA, De-Olivera AC, Godwin I, Schertz K, et al. (1996a). Comparison of DNA marker technologies in characterizing plant
genome diversity: variability in Chinese sorghums. Crop Sci. 36: 1669-1676.Yeh FC, Yang RC, Boyle TBJ, Ye ZH, et al. (1997). POPGENE, the user-friendly shareware for population genetic analysis.
Molecular Biology and Biotechnology Center, University of Alberta, Edmonton, Alberta, Canada.Zawko G, Krauss SL, Dixon KW and Sivasithamparam K (2001). Conservation genetics of the rare and endangered Leucopogon
obtectus (Ericaceae). Mol. Ecol. 10: 2389-2396. Zhang L, Li QJ, Li HT, Chen J, et al. (2006). Genetic diversity and geographic differentiation in Tacca chantrieri (Taccaceae):
an autonomous selfing plant with showy floral display. Ann. Bot. 98: 449-457.Zhao ZG, Cheng W and Guo JJ (2006). Resource utilization and manual breeding of Rhodomyrtus tomentosa. Guangxi Forest.
Sci. 35: 70-72.