Embed Size (px)
Citation preview

© Kamla-Raj 2006 Int J Hum Genet, 6(4): 323-356 (2006)
Genetics of Castes and Tribes of India: SomatometryM. K. Bhasin
Department of Anthropology, University of Delhi, Delhi 110 007, India
KEYWORDS Anthropometry; measurements and indices; biological variation; ethnic groups
ABSTACT The discipline of human population biology incorporates study of biology and environmental factors, aswell as the forces of micro-evolution leading to macro-evolution which ultimately influence the biological structureof human populations. The unit of study in understanding variations in man is a ‘breeding population’ some times alsoreferred to as ‘Mendelian population’. India is inhabited by people of great diversity, different creeds and customsforming what may be designated as multiple (or plural) society. There are about 3000 castes in India, some havegenesis in tribal stock while others are occupational, linguistic, religious and territorial entities. Each caste is a socialunit or what may be called ‘monopolistic guild’ in itself. All these groups are not entirely independent; usually peoplebelong to two or more of such groups at the same time. India is a country with distinct geographical entity and ismarked off from rest of Asia by both mountains and sea. Indian sub-continent may be divided into four natural regions:(1) The Himalayan Mountain Complex, (2) The Indus-Ganga-Brahmaputra Plains, (3) The Peninsular Plateau and(4) The Islands. The climate of India has many regional variations determined by locations, altitude, distance fromthe sea or the mountains and the general relief. India is divided into eight climatic regions based on the monthly valueof temperature and precipitation. India is a Union comprising 25 States and 7 Union Territories and these may becategorised into six zones (North, West, East, Central, South India and Islands). Himalayan region may be divided intothree divisions (Western, Central and Eastern Himalayan Regions). The present paper aims at investigating first thevariation in the people of India in regional (Natural Regions of India, Climatic Regions of India, Political Divisionsof India), ethnic (castes, scheduled castes, scheduled tribes, communities), traditional occupational and linguisticgroups and families with the help somatometry measurement and indices. Second, to study the variation with the helpof biostatistics methods in the region, ethnic groups and linguistic groups. The basic data were collected from theliterature and it was categorized in regional, ethnic, occupational and linguistic groups and coded accordingly for theanalysis on computer.
INTRODUCTION
Biological relationships and distancesbetween human individuals and groups can beassessed by the use of anthropometric data atleast as successfully as this can be done by theuse of serological traits with known modes ofinheritance (Spielman and Smouse 1976). Theobvious reason is that anthropometric dimensionsare also genetically determined even if thepolygenic nature of the genetic control and theenvironmental effect on the development of theirphenotypic manifestation cannot be spelled outin detail (Brace and Hunt 1990; Brace et al. 1991).
Although the effects of physical environmentsuch as temperature, rainfall, humidity, altitudeetc. upon human physique have been widelydiscussed, from the available literature yet it isdifficult to offer definitive explanations in termsof the causations of variations in bodydimensions. As it appears, the variations may becaused by complex interactions of physicalenvironmental factors with others e.g. biological
(diseases—degenerative and contagious),nutritional, economic and cultural (behaviouralnorms and practices relating to habitation, food,diseases etc.) factors.
The environmental changes brought aboutby the factor of ‘migration’ of the original migrantsand their progeny may be responsible formeasurable variations that have been observed.The findings of many investigations are availablein which attempt has been made to isolate theeffect of dietary differences and climatic changesupon human physique.
Shapiro (1939) found that the Hawaiian-bornchildren of Japanese-born immigrants areconsiderably taller than their parents, but theirheads are significantly shorter and broader andthus they have greater stature with pronouncedbrachycephaly.
Mills from his studies on the effects of climateon body growth and development revealed thattemperate climate is more favourable for growthand development than the tropics (Mills 1937)and that dietary modifications and altered vitaminintake in the tropics affect adult dimensions (Mills1942).
Kaplan (1954) has reviewed 25 studies andPostal Address: M. K. Bhasin, B-2 (GF), South City IIGurgaon 122 002, Haryana, India

324 M. K. BHASIN
observed that most of the investigators assumethat bodily changes which they report are notevolutionary in nature, although several of themrefer to long-range secular changes in size. Shepointed out that in fact the changes are notevolutionary, but merely individual responses tothe particular environment and it should bepossible to find the precise facet or facets of theenvironment responsible for the changesobserved. She found that dietary changes are mostfrequently mentioned as important and concludedone wonders, to what extent eating and livinghabits, improvements in housing and sanitaryconveniences, greater attention to personalhygiene, shorter school and working days, or evenpsychological factors play their part.
Tobias (1985) discussed the concept ofsecular trend i.e. long-term systematic or non-random changes in a wide variety of traits insuccessive generations of a population living inthe same territories (Wolanski 1966, 1967). Headded that it is probably analytically more usefulto distinguish between secular changes with aterritorial restriction, and the effects of migrationin general and of urbanization as a special case.He argued that the direction of the secularprocesses should always be specified i.e. firstupward or positive secular trend, second negativesecular trend and third absence of secularchanges, positive or negative. On the basis ofsecular trend data, Tobias suggested a four-foldsubdivision of the world’s populace taking socio-economic status into consideration:
1. Have most (affluent) with absence of seculartrend at present as they have reached upperphenotypic limit set by their genetic potential.
2. Have ample (less affluent) with positivesecular trend at present as they are moving frommiddle to upper reaches of genetically determinedgrowth rate and body size range.
3. Have little (pastoral/agriculture), absent ornegative secular trend as they are moving frommiddle to lower reaches of genetically determinedrange of growth rates and body sizes.
4. Have least (hunters and gatherers) positivesecular trend as they are rising from the lowestreaches of genetic potential towards the middleof the range of growth rates and body sizes.
Tobias pointed out that the biggest challengefacing planners is how to solve the problem oftransforming the negative secular trend of the“has little” sector to the positive secular trend ofthe “have ample” sectors.
The anthropometric studies on the Indianpopulations started in 1868. However systematicsurveys were carried on All India level by Risley(1915), v. Eickstedt (1934) and Guha (1935). Themain emphasis of these studies was to classifythe peoples of India into various ‘Racial Types’.They recognized the existence of more than one‘Racial Type’ and a great deal of anthropometricheterogeneity among the peoples of India. Later,a number of surveys were conducted to studythe regional variations for example among thepeople of Gujarat (Majumdar and Sen 1949), UttarPradesh (Mahalanobis et al. 1949), Maharashtra(Karve and Dandekar 1951), Bengal (Majumdarand Rao 1960), Tamil Nadu (Malhotra et al. 1981),among others. Besides these a good number ofother studies are available, and about 1200population groups reported by different authorsare listed by Bhasin et al. (1992).
There are a rather high number of anthro-pometric studies on populations of India.Unfortunately, technical differences exist, andtherefore sometimes the results are notcomparable. It has been observed that some ofthe measurements on face taken by differentauthors show variation in dimensions whichobviously reflect technical deviations, probablyin the determination of nasion and otherlandmarks. Moreover, the samples are notdistributed homogeneously. Only a few studiesare available from Central India, whereas rests ofthe zones are better represented. For thetechniques, methods and analysis of the data,readers are referred to Martin and Saller (1957),Wiener and Lourie (1969, 1982), Lohman et al.(1988), Knussmann (1988) and Singh and Bhasin(1989, 2004).
The aim of the study is to have a satisfactoryknowledge of micro-evolutionary processes asthey are reflected in genetic and morphologicaltraits in human populations. This variability hasbeen studied in terms of natural regions, climaticfactors, climatic regions, political division of India,ethnic groups, traditional occupations andlinguistic groups (For details see Bhasin 1988;Bhasin et al. 1992, 1994; Bhasin and Walter 2001,Bhasin 2006a).
The studies on Genetics of Castes and Tribeshave been reported on Serum ProteinPolymorphisms KM and GM Systems (Bhasinand Walter 2002); Glucose-6-PhosphateDehydrogenase Deficiency and Haemoglobinvariants (Bhasin 2006b); Red and Green Colour

325GENETICS OF CASTES AND TRIBES OF INDIA: SOMATOMETRY
Vision Deficiency (Bhasin, 2006c); TasteSensitivity (Bhasin 2006d) among the people ofIndia and factors responsible to operate in favourof these traits.
IDENTIFY AND DISTINGUISHTHE PEOPLE
For the biogenetical study of the people ofIndia, researchers have generally used thefollowing criteria to identify and distinguish thepeople: 1. Regional Groups, 2. Ethnic Groups, 3.Linguistic Groups, and 4. Religious Groups (Fordetails see Bhasin et al., 1994; Bhasin and Walter2001; Bhasin 2006)
It should, however, be kept in mind that theseare the convenient units of study, although thereare significant levels of overlapping betweenthem. For example, an occupational grouppursuing traditional job inhabits a region, sharesreligion with other categories, belongs to one orthe other language group and has an aggregationof ethnic properties. But in the human populationgenetic studies, out of these criteria one is chosen(Bhasin 1988).
In the present study an attempt has been madeto analyse the above mentioned biogenetical traitsinto 1. Regional Groups, 2. Ethnic Groups, 3.Traditional Occupational Groups and 4. LinguisticGroups.
I. Regional Groups
These can be divided into the followinggroups:1. Natural Regions of India2. Climatological Factors and Climatic Regions
of India3. Political Division of India
Each region has its own characteristics and abrief description of each one will give an idea ofwhat it constitutes of.
1. Natural Regions of India
The natural regions have broad uniformity intheir characteristics, such as relief, geomor-phological history, drainage, climate, soil, naturalvegetation and wild life. Broadly speaking theIndian sub-continent may be divided in thefollowing natural regions:1. The Himalayan Mountain Complex2. The Indus-Ganga-Brahmaputra Plain
3. The Peninsular Plateau and4. The Islands
2. Climatological Factors and Climatic Regionsof India
Various climatological factors (Rainfall,Humidity, Temperature) and Altitude have beenconsidered to study correlations with differentbiological traits. The values for the climatologicalfactors are after “Climatological Tables ofObservations in 1931-1960” MeteorologicalDepartment, Government of India, New Delhi.
A climatic region generally possesses a broaduniformity in climatic conditions produced bycombined effects of climatic factors. India can bedivided into the following climatic regions afterKöppen’s method, based on the monthly valuesof temperature and precipitation:
(1) Tropical Savannah Type, (2) Monsoon Typewith Short Dry Season, (3) Monsoon Type withDry Season in High Sun Period, (4) Semiarid andSteppe Climate, (5) Hot Desert Type, (6) MonsoonType with Dry Winters, (7) Cold Humid WintersType with Shorter Summer, and (8) Polar Type.
3. Political Division of India
India is a Union of States. Comprising 25States1 and 7 Union Territories, according to theCensus 1991, there are 4689 towns and 587,226inhabited and 47,095 uninhabited villages in thecountry. The country had 466 districts in 1991.
India-Political and Ethnic Zones: Theweighted mean values of various biological traitshave been classified into 25 States and 7 UnionTerritories (U.T.) which have been categorised asfollows (after Bhasin, 1988):
I. North India, II. West India, III. East India,IV. Central India, V. South India, and VI. Islands.Himalayan Region may be divided into threedivisions, i.e., A) Western Himalaya, B) CentralHimalaya, and C) Eastern Himalaya as follows:I. North India:
(A) Western Himalaya (S. No. 1, 2):(1) Jammu and Kashmir, (2) Himachal Pradesh,
(3) Punjab, (4) Chandigarh (U.T.), (5) Haryana,(6) Delhi (U.T.), (7) Uttar Pradesh
(B) Central Himalaya (S.No.7, EightDistricts of Uttar Pradesh)
[(i) Almora, (ii) Chamoli, (iii) Dehra Dun, (iv)Garhwal (Pauri), (v) Naini Tal, (vi) Pithoragarh,(vii) Tehri Garhwal, and (viii) Uttarkashi.] and 8.Rajasthan

326 M. K. BHASIN
II. West India:(1) Gujarat, (2) Maharashtra, (3) Goa2, (4)
Daman and Diu2 (U.T.) and (5) Dadra and NagarHaveli (U.T.)III. East India:
C) Eastern Himalaya: (S. No.1 to 8 andDarjeeling District of West Bengal)
(1) Arunachal Pradesh, (2) Assam, (3)Nagaland, (4) Manipur, (5) Mizoram, (6) Tripura,(7) Meghalaya, (8) Sikkim, (9) West Bengal, (10)Bihar, and (11) OrissaIV. Central India:
(1) Madhya PradeshV. South India:
(1) Karnataka, (2) Andhra Pradesh, (3) TamilNadu, (4) Kerala and (5) Pondicherry (U.T.).VI. Islands:
(1) Lakshadweep (U.T.) and (2) Andaman andNicobar Islands (U.T.).
II. Ethnic Groups
An aggregation of biological and socio-cultural characteristics constitutes an ethnicgroup. Within the category of Ethnic Group, weinclude Castes, Scheduled Castes, ScheduledTribes and Communities (the names of ScheduledCastes and Scheduled Tribes after Manual ofElection Law 1982, Government of India, NewDelhi). Biological anthropological studies of suchethnic groups as well as “Communities” havebeen reported in India. By Community wegenerally refer to a group of people who may haveoccupational, linguistic, religious or regionalcharacteristics (Bhasin 1988).
III. Traditional Occupational Groups
In the traditional society, there were occupa-tional guilds. The Chaturvarna system with itsdivision into Brahman (priestly caste), Kshatriya(warrior caste), Vaishya (land owners and traders)and Sudra (labouring caste) was based onoccupational differentiation. The occupations aregrade manual labour is looked down upon, andthose dealing with swine-herding, scavenging,butchery, removal of night soil are regarded aspolluting (Bhasin 1988). The caste based divisionof occupation is 1. Priesthood, 2. Warfare, 3. Tradeand Commerce, 4. Agriculture, 5. AnimalHusbandry, 6. Artisan and 7. Menial Workers.
IV. Linguistic Groups
Although the Schedule VIII recognizes fifteenlanguages in India, there are innumerable dialectswhich change after few scores of kilometers.Linguistic diversity is an important factor in theformation of regional groups, and it also reflectsthe regional differentiation. The four- fold regionaldivision can be seen for the major languages, i.e.,(i) the Dravidian region of the south; (ii) the Indo-Aryan regions of the north and north-west; (iii)the Mon Khmer and the Tibeto-Burman region ofthe north-east and the Himalayan region; and (iv)the Austric region of the Aravalli-Vindhya-ChotaNagpur complex. These languages are againdivided into sub-families and groups as follows:
Language Classification-—Indian Languages
The family, branch, group and language ofIndia are as follows:I. AUSTRO-ASIATIC FAMILY
Mon-Khmer Group (Mon-Khmer Branch)Munda Group (Munda Branch)
II. TIBETO-CHINESE FAMILYSIAMESE-CHINESE SUB-FAMILYTai GroupTIBETO-BURMAN SUB-FAMILYTibeto-Himalayan BranchBhotia Group (Tibetan Group)Himalayan Group (Pronominalized/Non-
Pronominalized Himalayan Group)North-East Frontier Group (North Assam
Branch)Assam-Burmese BranchBodo Group (Bara or Bodo Group)Naga GroupKachin GroupKuki-Chin GroupBurma Group
III. DRAVIDIAN FAMILYSouth Dravidian GroupCentral Dravidian GroupNorth Dravidian Group
IV. INDO-EUROPEAN FAMILY ARYAN SUB-FAMILY
Dradic (or Pisacha) BranchKafir GroupKhowar GroupDard GroupIndo-Aryan Branch:Outer Sub-BranchNorth-Western Group
327GENETICS OF CASTES AND TRIBES OF INDIA: SOMATOMETRY
Southern GroupEastern GroupBihari Group (Bhojpuri, Maithili & Magahi
Sub-Group)Mediate Sub-Branch/Inner Sub-Branch:Mediate Group/Central Group/Pahari GroupMediate Group/Central GroupPahari GroupEastern PahariCentral PahariWestern Pahari
Mean Weighted Values
To discern the pattern of regional groups,ethnic groups, traditional occupational groupsand linguistic groups using the frequency data,the mean weighted values of the biological traitshave been calculated and estimates for the variousgroups are presented.
1. MEASUREMENT
1.1. Stature
The mean value of stature among Indianpopulations is 163.06 cm (medium), which variesfrom 143.50 cm - very short (among Naya Kurumbaof Tamil Nadu) to 181.90 cm - very tall (inMohammedans from West Punjab). The value ofstature is low (159.75 cm -short) among scheduledtribes as compared to other ethnic groups. In thenatural regions, populations from Himalayanmountain complex are showing lower values(162.13 cm) as compared to other regions exceptfrom Islands from where different scheduled tribesare reported (Table 1), (Bhasin et al. 1994; Bhasinand Walter 2001). The dimension at Himalayanmountain complex is in conformity withBergmann’s and Allen’s rule, which states that inwarm-blooded animals body size, andconsequently surface area/weight, as also thelength of the extremities, are smaller in colder thanin warmer climates to minimize heat loss. Similarobservations have been reported by Harrisonet al. (1969) in their Ethiopian study. Attentionshould also be given to the ideas of Roberts(Roberts 1953, 1973) who asserts that thesesignificant relationships between the temperatureof biome and body size have both direct (responseto temperature) and/or indirect (acting throughfood, genetics etc.) relationship. However, fromthe available literature, it may not be possible to
offer definitive explanations in terms ofcausations by altitudinal variations (as theyreflect temperature values) as it appears that thesevariations may be caused by complex interactionsof physical environment factors with otherbiological, socio-economic and cultural factors(e.g. Walter 1982).
The mean value of stature is highest from semiarid steppe type climatic region (165.39 cm) andlowest from monsoon type with short dry seasonregion (156.80 cm), followed by cold humidwinters with short summers (159.05 cm) whereasfrom monsoon type with dry season, tropicalsavannah type and monsoon type with drywinters region the values show less differences(163.07, 163.06 and 163.66 cm, respectively).Takahashi (1971) also reported geographicalgradients of stature with respect to climaticenvironmental variables and observed that tallerstatures are found in the arid belt of the northernand north-western sectors of the subcontinentwhile shorter statures occur in the humid regionsof the eastern and southern zones. There is agradient of stature distribution from north-westto east and south positions of the Indiansubcontinent.
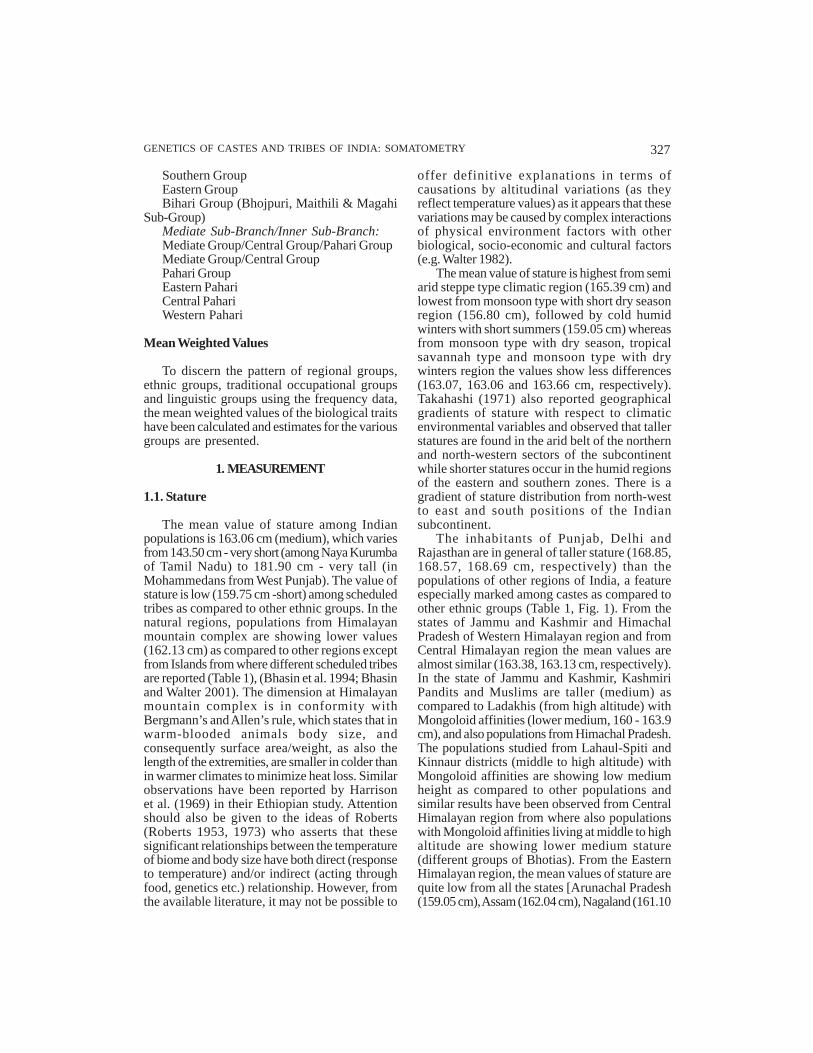
The inhabitants of Punjab, Delhi andRajasthan are in general of taller stature (168.85,168.57, 168.69 cm, respectively) than thepopulations of other regions of India, a featureespecially marked among castes as compared toother ethnic groups (Table 1, Fig. 1). From thestates of Jammu and Kashmir and HimachalPradesh of Western Himalayan region and fromCentral Himalayan region the mean values arealmost similar (163.38, 163.13 cm, respectively).In the state of Jammu and Kashmir, KashmiriPandits and Muslims are taller (medium) ascompared to Ladakhis (from high altitude) withMongoloid affinities (lower medium, 160 - 163.9cm), and also populations from Himachal Pradesh.The populations studied from Lahaul-Spiti andKinnaur districts (middle to high altitude) withMongoloid affinities are showing low mediumheight as compared to other populations andsimilar results have been observed from CentralHimalayan region from where also populationswith Mongoloid affinities living at middle to highaltitude are showing lower medium stature(different groups of Bhotias). From the EasternHimalayan region, the mean values of stature arequite low from all the states [Arunachal Pradesh(159.05 cm), Assam (162.04 cm), Nagaland (161.10

328 M. K. BHASIN
cm), Manipur (160.02 cm), Mizoram (163.26 cm),Tripura (160.17 cm). Meghalaya (158.50 cm),Sikkim (159.97 cm)] inhabited by populations withMongoloid admixture of varying degrees atdifferent altitudes (Table 1, Fig. 1). Among thedifferent ethnic groups from the Himalayanregion the mean value of stature is less than 164(lower medium) with little differences, except fromEastern region where scheduled tribes are havinglow value (160.42 cm) as compared to other ethnicgroups. From Nepal also the various populationshaving Mongoloid admixture in varying degreesand living in middle to low altitudes (Rai, Tamang,Sunwar, Newars, Magars, Gurungs, Gurkhasamong others) show short to low medium stature.
As compared to the North Indian populationswith taller stature (medium category) the valuesof height among populations inhabiting differentstates of West India, Orissa, Madhya Pradeshand States and Union Territories of South India
fall in the category lower medium whereasIslanders have a short stature. Takahashi (1971)attributes this cline to differential diet noting thatthe western and northern inhabitants of SouthAsia include many herding groups who consumehigh quantities of dairy food. Milk products arehigh in protein relative to grains that make updiet of Indians living in eastern and southernhabitats. Among the different ethnic groups,peoples belonging to castes are taller followedby communities as compared to scheduled castes(lower medium) and scheduled tribes (shortstature). Caste groups from North India and EastIndia zones are taller as compared to other zones,whereas tribes from South India and East Indiazones are short in stature (157.69 and 159.62 cm,respectively) as compared to other zones, andthey are falling in lower medium category.Mahalanobis (1927) and Olivier (1963) alsoreported that caste status was positively
Fig. 1. Mean values of stature (in cm) in different regions of India (after Bhasin and Walter 2001)
INDIA
PAKISTAN
AFGHANIS
TAN
CHINATIBET
NEPAL
Lakshadweep (India)
BANGLA-DESH
Andaman
andN
icoba
rIsla
nds(
India)
Stature (in cm)
< 159.9160.0 - 161.9162.0 - 163.9164.0 - 165.9166.0 - 167.9168.0 - 169.9
> 170.0

329GENETICS OF CASTES AND TRIBES OF INDIA: SOMATOMETRY
correlated to stature.From islands, among isolates very short
stature (130.0 to 149.9 cm) is observed amongOnge and Andamanese tribals and short to lowermedium stature in Nicobarese tribals (Table 1, Fig.1). The Andamanese and Onges are consideredto have Negrito affinities and Nicobarese indicatetheir Malayan ancestry (Dutta 1978).
As observed, caste populations are on anaverage taller as compared to scheduled castes.This may be due to genetic differences betweenthese groups since they belong to different racialaffinities—Caucasoid (Aryan and/or Dravidian)in caste populations and Caucasoid and/orAustraloid (Dravidian and/or Pre-Dravidian)among scheduled caste people. Further there is adifference between socio-economic conditionsbetween the two groups. Therefore the tallerstature may be largely but not solely attributableto genetic differences. The tribals who areconsidered to be autochthonous have had alonger stay in their habitat as compared to otherethnic groups. The short stature among tribalgroups suggests in particular that the basicsubstratum of ethnic elements have been infavour of short individuals. In view of theadvantages of the smaller body size in both‘undernourished’ and ‘hot climate’ the smallerstature among the tribals might have developedin the process of adaptation to these conditions.
The mean values of stature correlations withvarious climatic factors and altitude by differentethnic groups although showing significantdifferences are not high except in scheduled tribes,where there are negative correlations of staturewith climatic factors and altitude (Table 6).
For assessment of the environment - bodydimension relationship, Basu et al. (1980) lookedat the correlations between stature, cephalic indexand nasal index on one hand and environmentalvariables like rainfall and temperature on the other.They found that none of them is significant exceptthe correlation between stature and rainfall in theall India sample, and also that this correlationdisappears when they restrict analysis to arelatively less heterogeneous group i.e.Brahmans. From this finding they pointed out thatthe relevant environmental factors are not theclimatic ones they have considered but otherse.g. social (i.e. castes/class), economic, nutritionaletc.
To study the correlations between stature andcaste status, Mahalanobis (1927) ranked castes
in a hierarchical order and showed positivecorrelation between caste status and stature andsought to interpret these relations in terms ofsuccessively greater intrusion of Caucasoidgenes into the higher castes through admixture.Olivier (1963) observed similar results on datafrom Tamil Nadu. Basu et al. (1980) stated that theimmensely elaborate and rigid systems of socialstratification, in which each strata was virtuallyclosed to fresh intrusion at an unknown antiquity,seem to be a plausible enough determinant ofanthropometric variations in India. They addedthat for this hypothesis to assume general validity,findings such as of Mahalanobis (1927) andOlivier (1963) should be repeated from diverseIndian populations, which is however not thecase. They argued that for instance while ananthropometric survey conducted in the state ofUttar Pradesh (Mahalanobis et al. 1949) showsthat castes of comparable hierarchical status tendto cluster together, a similar survey in Bengalshows that the clusters are not necessarilycomposed of castes of similar social status(Majumdar and Rao 1960). Further, the nature ofbiological similarity/differences among castes/subcastes of similar and different hierarchicalstatus lead Karve and Malhotra (1968) to concludethat hierarchical affinity does not oftencorrespond to biological similarity. Also Rakshit’s(1966) study showing wide diversity among theBrahmins also points in the same direction. Theyconcluded that it seems that both the hypotheses(a) of fission of an ancestral social group intocastes/sub-castes, each of the latter having morebiological similarities with the other than with sub-castes of other castes and (b) of coming togetherof social groups of disparate origins withoutfusion of their marital boundaries to constitutecaste clusters/castes, are probable but notsufficient from the point of view of explaining theimmense biological variations among the Indianpopulation. Further in the few regional studies inwhich clusters have been worked out or at leastdistance matrices have been computed(Mahalanobis et al. 1949; Majumdar and Rao 1960;Karve and Malhotra 1968), the similarities/differences do not seem to follow any definitepattern. Mahalanobis et al.’s (1949) study doesshow some clusters which correspond totraditional caste affinities, but even then thereare frequent exceptions. Further, they consideredthe tribal populations only and observed thatvariations among conventional racial categories

330 M. K. BHASINTa
ble
1: S
tatu
re (
in c
m)
Part
icul
ars
Subj
ects
No.
of
Stat
ure
stud
ied
stud
ies
Mea
nM
in M
ax1.
NAT
UR
AL
RE
GIO
NH
imal
ayan
Mou
ntai
n C
ompl
ex84
4612
216
2.13
154.
9016
9.80
Indu
s-G
anga
-Bra
hmap
utra
Pla
ins
2793
230
016
4.15
154.
8018
1.90
Peni
nsul
ar P
late
au49
124
623
162.
7714
3.50
175.
00Is
land
s11
2418
155.
5014
6.80
161.
932.
CL
IMAT
IC R
EG
ION
Mon
soon
Typ
e w
ith S
hort
Dry
5026
8315
6.80
146.
8017
2.50
Seas
onM
onso
on T
ype
with
Dry
Sea
son
2727
5916
3.07
154.
9117
4.00
Trop
ical
Sav
anna
h Ty
pe36
813
379
163.
0614
7.52
174.
00Se
mi A
rid S
tepp
e Ty
pe50
1511
016
5.39
143.
5017
5.00
Hot
Des
ert
Type
-0
--
-M
onso
on T
ype
with
Dry
Win
ters
3598
641
416
3.66
154.
8018
1.90
Col
d H
umid
Win
ters
with
Sho
rt33
85
159.
0515
7.71
160.
86Su
mm
ers
Pola
r Ty
pe72
313
162.
4915
9.45
164.
543.
POL
ITIC
AL
DIV
ISIO
N O
F IN
DIA
I.N
ORT
H I
ND
IAA
.W
este
rn H
imal
aya
(S. N
o. 1
, 2)
1.Ja
mm
u an
d K
ashm
ir98
917
163.
8415
9.96
166.
652.
Him
acha
l Pr
ades
h26
9528
163.
2115
9.45
165.
403.
Punj
ab10
7715
168.
8515
9.78
181.
904.
Cha
ndig
rah
UT
-0
--
-5.
Har
yana
-0
--
-6.
Del
hi U
T74
210
168.
5716
2.59
175.
50B
.C
entr
al H
imal
aya
(S. N
o. 7
, Eig
ht D
istr
icts
of
Utta
r Pr
ades
h)7.
Utta
r Pr
ades
h14
833
161
164.
0715
6.21
171.
918.
Raj
asth
an16
9811
168.
6915
8.80
174.
80II
.WES
T IN
DIA
9.G
ujar
at49
5649
163.
0515
9.02
169.
5110
.Mah
aras
htra
7696
130
163.
1115
8.40
174.
0011
.Goa
, Dam
an a
nd D
iu U
T-
0-
--
12.D
adra
and
Nag
ar H
avel
i U
T-
0-
--
III.
EAST
IN
DIA
C.
East
ern
Him
alay
a (S
. No.
13
to 2
0 an
d D
arje
elin
g D
istr
ict
of W
est
Beng
al)
13.A
runa
chal
Pra
desh
338
515
9.05
157.
7116
0.86
14.A
ssam
4888
7016
2.04
154.
8016
5.08
15.N
agal
and
1021
1816
1.10
155.
8716
5.84
16.M
anip
ur29
76
160.
0215
4.90
167.
4017
.Miz
oram
401
163.
2616
3.26
163.
2618
.Tri
pura
311
516
0.97
155.
7616
0.90
19.M
egha
laya
487
815
8.50
156.
9116
1.26
20.S
ikki
m79
716
159.
9715
5.76
164.
4521
.Wes
t B
enga
l78
2263
164.
1115
7.00
169.
80
Part
icul
ars
Subj
ects
No.
of
Stat
ure
stud
ied
stud
ies
Mea
nM
in M
ax22
.Bih
ar17
048
8416
4.07
147.
5217
1.38
23.O
rissa
3884
5416
0.28
153.
6416
6.30
IV.C
ENTR
AL I
ND
IA24
.Mad
hya
Prad
esh
2578
3716
0.32
156.
1016
4.36
V.SO
UTH
IN
DIA
25.K
arna
taka
2193
4916
3.68
153.
1316
8.70
26.A
ndhr
a Pr
ades
h14
2134
162.
9815
9.10
165.
8027
.Tam
il N
adu
2437
9316
3.73
143.
5017
4.00
28.K
eral
a41
0671
157.
3815
1.50
175.
0029
.Pon
dich
erry
UT
1150
1016
2.80
159.
9516
5.37
VI.I
SLAN
DS
30.L
aksh
adw
eep
UT
-0
--
-31
.And
man
Isl
ands
and
400
1114
8.45
146.
8015
1.80
Nic
obar
Isl
ands
UT
724
715
9.39
156.
7016
1.93
3A. Z
ON
ES
OF
IND
IAI.
Nor
th I
ndia
2203
424
216
4.70
156.
2118
1.90
II.
Wes
t In
dia
1265
217
916
3.09
158.
4017
4.00
III.
East
Ind
ia36
933
330
163.
0514
7.52
171.
38IV
.C
entra
l In
dia
2578
3716
0.32
156.
1016
4.36
V.So
uth
Indi
a11
307
257
161.
2314
3.50
175.
00V
I.Is
land
s11
2418
155.
5014
6.80
161.
93IN
DIA
(TO
TAL)
8662
810
6316
3.06
143.
5018
1.90
3B. R
EG
ION
S O
F H
IMA
LAY
AA
.W
este
rn H
imal
aya
3684
4516
3.38
159.
4516
6.65
B.
Cen
tral
Him
alay
a13
9417
163.
1315
6.21
166.
53C
.Ea
ster
n H
imal
aya
8745
138
161.
2015
4.80
169.
80H
IMA
LAYA
(TO
TAL)
1382
320
016
1.97
154.
8016
9.80
NO
N-H
IMA
LAYA
N R
EGIO
NS
7280
586
316
3.27
143.
5018
1.90
4.E
TH
NIC
GR
OU
PA
.ZO
NES
OF
IND
IA1.
NO
RTH
IN
DIA
Cas
te68
0182
165.
6915
9.71
174.
80Sc
hedu
led
Cas
te35
6348
163.
3015
8.17
167.
47Sc
hedu
led
Trib
e27
9929
163.
1515
6.21
171.
30C
omm
unity
8871
8316
4.99
159.
7818
1.90
II.W
EST
IND
IAC
aste
5401
8616
3.48
159.
8616
7.95
Sche
dule
d C
aste
562
916
1.64
158.
4216
3.68
Sche
dule
d Tr
ibe
2340
2816
1.28
158.
4016
8.22

331GENETICS OF CASTES AND TRIBES OF INDIA: SOMATOMETRYTa
ble
1: C
ontd
......
Part
icul
ars
Subj
cect
sN
o. o
fSt
atur
est
udie
dst
udie
sM
ean
Min
Max
Com
mun
ity43
4956
164.
7615
9.63
174.
00II
I.EAS
T IN
DIA
Cas
te16
671
7516
5.97
156.
2017
1.38
Sche
dule
d C
aste
3982
4216
1.55
157.
7016
5.05
Sche
dule
d Tr
ibe
1277
616
814
7.52
150.
1016
7.40
Com
mun
ity35
0445
163.
4215
5.76
169.
80IV
.CEN
TRAL
IN
DIA
Cas
te10
42
162.
5716
0.91
164.
36Sc
hedu
led
Cas
te-
0-
--
Sche
dule
d Tr
ibe
2424
3416
0.27
156.
1016
3.64
Com
mun
ity50
115
8.17
158.
1715
8.17
V.SO
UTH
IN
DIA
Cas
te35
9180
163.
7915
5.60
170.
10Sc
hedu
led
Cas
te14
7434
160.
9115
2.53
166.
55Sc
hedu
led
Trib
e38
2780
157.
6914
3.50
175.
00C
omm
unity
2415
6316
3.21
153.
1317
4.00
VI.I
SLAN
DS
Cas
te-
0-
--
Sche
dule
d C
aste
-0
--
-Sc
hedu
led
Trib
e11
2418
155.
5014
6.80
161.
93C
omm
unity
-0
--
-IN
DIA Cas
te32
568
325
165.
2515
5.60
174.
80Sc
hedu
led
Cas
te95
8113
316
2.11
152.
5316
7.47
Sche
dule
d Tr
ibe
2529
035
715
9.75
143.
5017
5.00
Com
mun
ity19
189
248
164.
1815
3.13
181.
90B
. RE
GIO
NS
OF
HIM
AL
AYA
A.
Wes
tern
Him
alay
aC
aste
839
916
3.62
160.
7416
5.40
Sche
dule
d C
aste
752
162.
3116
2.11
165.
08Sc
hedu
led
Trib
e14
7014
163.
3015
9.45
164.
75C
omm
unity
1300
2016
3.38
159.
9616
6.65
B.
Cen
tral
Him
alay
aC
aste
602
160.
8516
0.80
160.
89Sc
hedu
led
Cas
te21
32
166.
0516
5.50
166.
53Sc
hedu
led
Trib
e53
66
161.
3515
6.21
163.
33C
omm
unity
585
716
3.93
161.
6116
4.90
C.
East
ern
Him
alay
aC
aste
243
516
3.21
161.
6116
4.61
Sche
dule
d C
aste
1221
1416
2.77
158.
6716
5.05
Sche
dule
d Tr
ibe
5785
9216
0.42
154.
8016
7.40
Com
mun
ity14
9627
162.
6115
5.76
169.
805.
TR
AD
ITIO
NA
L O
CC
UPA
TIO
NPr
iest
hood
1572
678
165.
6415
9.86
168.
50
Part
icul
ars
Subj
cect
s
No.
of
Stat
ure
stud
ied
stud
ies
Mea
nM
in M
axW
arfa
re34
5231
166.
9616
0.44
174.
80Tr
ade
and
Com
mer
ce23
8329
165.
4716
1.20
169.
48A
gric
ultu
re19
5740
163.
5215
9.10
169.
72A
nim
al H
usba
ndry
880
1216
7.17
161.
3717
5.50
Art
isan
s14
6320
162.
7915
9.90
166.
37M
enia
l W
orke
rs65
7172
161.
6615
2.53
166.
33N
o In
form
atio
n54
196
781
162.
0514
3.50
181.
906.
LA
NG
UA
GE
GR
OU
PI.
AUST
RO-A
SIAT
IC F
AMIL
YM
on K
hmer
Gro
up11
8513
158.
7815
6.70
161.
93M
unda
Gro
up63
7965
158.
9114
7.52
164.
40II
.TIB
ETO
-CH
INES
E FA
MIL
Y(i
) Si
ames
e-C
hine
se S
ub-F
amily
Tai
Gro
up85
115
9.90
159.
9015
9.90
(ii)
Tib
eto-
Burm
an S
ub-F
amily
Bho
tia G
roup
2285
2716
2.90
156.
2116
4.90
Him
alay
an G
roup
1039
2015
9.69
156.
3616
9.80
Nor
th E
ast
Fron
tier
Gro
up11
4120
160.
8015
7.52
165.
03B
odo
Gro
up19
8525
161.
4815
4.80
164.
30N
aga
Gro
up12
2824
160.
7915
5.70
167.
40K
achi
n G
roup
131
160.
5016
0.50
160.
50K
uki
Chi
n G
roup
403
916
0.12
154.
9016
3.60
III.
DRA
VID
IAN
FAM
ILY
Sout
h D
ravi
dian
Gro
up11
074
253
161.
1414
3.50
175.
00C
entra
l D
ravi
dian
Gro
up22
1534
160.
6915
6.67
162.
89N
orth
Dra
vidi
an G
roup
3008
1116
2.58
157.
5216
3.40
IV.I
ND
O-E
URO
PEAN
FAM
ILY
Dar
d G
roup
572
616
4.08
162.
1116
6.00
Nor
th W
este
rn G
roup
301
165.
8116
5.81
165.
81So
uthe
rn G
roup
7818
124
163.
0415
8.40
174.
00Ea
ster
n G
roup
2025
3616
0.92
155.
1416
6.30
Bih
ari
2107
511
116
5.35
156.
2017
1.38
Cen
tral
Gro
up21
246
249
164.
6715
8.17
181.
90Pa
hari
Gro
up95
516
163.
1115
5.76
165.
40U
nspe
cifie
d25
62
162.
8416
1.40
163.
33O
ther
Lan
guag
es63
815
154.
6914
6.80
168.
20N
o In
form
atio
n-
0-
--
6A. L
AN
GU
AG
E F
AM
ILY
I.A
ustro
Asi
atic
Fam
ily75
6478
158.
8914
7.52
164.
40II
.Ti
beto
Chi
nese
Fam
ily81
5212
716
1.37
154.
8016
9.80
III.
Dra
vidi
an F
amily
1629
729
816
1.34
143.
5017
5.00
IV.
Indo
Eur
opea
n Fa
mily
5397
754
516
4.52
155.
1418
1.90
Oth
er L
angu
ages
638
1515
4.69
146.
8016
8.20
No
Info
rmat
ion
-0
--
-

332 M. K. BHASIN
i.e., Australoid, Mongoloid, Mundari and Negroidare not significant and concluded that neithercaste as such nor race, therefore, seem to bedeterminant of inter group anthropometricvariability.
The correlation between nutritional factorsand body size showed positive correlationbetween calorie intake and stature, fat intake andheight and fat intake and weight, although nosuch correlation between protein intake andheight or weight seems to exist (Basu et al., 1980).The protein-deprived individuals fail to attain theirfull ontogenetic growth potential and under theseconditions of chronic deficiency stress smallerbody size (of which stature is a critical component)may be highly adaptive for survival. Naturalselection for reduction of body size and massmay continue in a population existing under thesenutritional conditions which may persist overmany generations. However the genotype is notaltered and realization of full ontogeneticdevelopment may be attained in high proportionof the population when adequate protein isintroduced into the diet.
Malhotra (1966) also demonstrated the effectof nutrition on height and weight. Consideringthat nutritional level is strongly influenced byeconomic condition, the source of much of thevariations that are traditionally ascribed to racialproperties can be traced to much less abstrusesocio-economic variables.
A number of small scale studies from all overthe world suggest that growth and maturation ofchildren and adult body dimensions e.g., height,weight etc. are positively related to urbanization,social, economic and professional status andfamily size. Basu et al. (1980) reported that Gangulyconducted a study in 1974 taking these factorsinto consideration and observed that rural/urbanhabitat does not have any effect on any of theanthropometric traits he considered and the wellto do section of the population differssignificantly from the poorer section almost inevery character. They pointed that the weaknessof Ganguly’s (1979) study lies in the fact that theprobable effects of occupational and sexualselection and nutrition on body dimensions havenot been tested by any rigorous method (Basuet al. 1980). The effect of nutrition on height,weight and/or other measures of child growth andadult body dimensions have been more amplydemonstrated by Pachauri et al. (1971), Gopalanet al. (1973), Easwaran et al. (1974), Rao and
Satyanarayana (1974), Rao et al. (1975),Vijayalakashmi and Devaki (1976), Devdas et al.(1977) among others.
Among the higher occupational groups—priesthood, warfare, trade and commerce, thepopulations are taller (165.64, 166.96 and 165.47cm, respectively) as compared to lower groups—artisans and menial groups (162.79 and 161.66 cm,respectively). Mahalanobis (1927) and Olivier(1963) reported positive correlations betweenstature and caste status. Whereas amongpastoralists the value is maximum as compared toother groups (167.17 cm), which may be explaineddue to selection as suggested by Wolpoff (1980).He suggests that tallness was adaptive forprehistoric people, who were nomadic, travellinglong distances in pursuit of game which migratedseasonally to different ecozones. The physicaldemands of the hunting-gathering life style whichinvolved tracking of large and dangerous gameplaced a selective advantage on high muscular-skeletal robusticity and large body size,particularly among males who were involved inprocurement of flesh foods under conditions ofhigh risk and strenuous demands upon physicalstrength and stamina. Selection for large androbust body form was relaxed among sedentaryfood producing populations where the physicaldemands and risks are of a very different sort (inthe present study stature mean value is 163.52among agriculture group). Pastoralism mayinvolve selection for efficiency of long-distancewalking, and the tallest modern South Asians arefrom the northwest sector of the subcontinentwhere herding is a common way of life.
Among the speakers of Mon Khmer group(Austro-Asiatic family) and Tibeto-Chineselanguages the mean value of stature is low (158.78and 161.37 cm, respectively) as compared to Indo-European language groups (Dard group - 164.08and Pahari group - 163.11 cm) from the Himalayanregions among whom most have Mongoloidaffinities. Most of the tribals reported in thepresent study from peninsular region speakMunda group (Austro-Asiatic family) andDravidian language and among them also the meanvalues of stature are low, whereas speakers of Indo-European languages (mostly caste groups) showtaller stature as compared to the speakers of otherlanguages (164.52 cm) (Table 1, Fig. 1) (Bhasinet al. 1994; Bhasin and Walter, 2001).
Indian populations are on an average mediumin stature (163.06 cm) among whom caste people

333GENETICS OF CASTES AND TRIBES OF INDIA: SOMATOMETRY
are taller as compared to scheduled casteswhereas tribals are short in stature, suggestingthat the basic substratum of ethnic elements hasbeen in favour of short individuals. In view of theadvantages of the smaller body size in both‘under-nourished’ and ‘hot climate’ the smallerstature among the tribals might have developedin the process of adaptation to these conditions.The inhabitants of Punjab, Delhi and Rajasthanare in general taller than the populations of otherregions, which show a gradient of staturedistribution from northwest to east and southpositions of Indian subcontinent. Amongoccupational groups, the taller stature is foundamong pastoralists who indicate that pastoralismmay involve selection for efficiency of a longdistance walking. The speakers of Austro-Asiatic,Tibeto-Chinese and Dravidian languages areshorter in stature as compared to Indo-Europeanlanguage speakers.
2. INDICES
2.1. Cephalic Index
The mean value of cephalic index amongIndian populations is 76.06, which is falling intothe mesocephaly category, and it varies from 67.91(hyperdolichocephalic from Kerala, South India)to 90.88 (hyperbrachycephalic in West Bengal,East India). The mean value of cephalic index islow among scheduled tribes (75.81 - dolicho-cephalic) as compared to other ethnic groups.From the natural regions, the population groupsof Indus-Ganga-Brahmaputra plains with loweraverage mean value (75.67 - mesocephalic index)as compared to populations of other naturalregions. The cephalic index from monsoon typewith short dry season and cold humid winterswith short summers climatic region aredolichocephalic as compared to other climaticregions, where mesocephalic index is observed(Table 2) (Bhasin et al. 1994; Bhasin and Walter2001).
There are 244 studies available from NorthIndia and all the populations are showing meanvalues less than 76 which falls in the dolicho-cephaly category, except a few populations withMongoloid affinities from the Himalayanregions—Ladakhi, Changpa, Kashmiri from thestate of Jammu and Kahsmir; Kanets Lahoul,Keonthali of Mahasi, Bunan and Lahauli ofLahaul, Spiti, Tibetans and Nyamslat of Kinaur
of Himachal Pradesh of Western Himalayanregion; Bhotia groups, Tharus, Kewat who aremesocephalics and Burman Mongoloid (83.10brachycephalic) of Central Himalayan region. Thevalue of index is high among scheduled tribes ofNorth India, who are mostly from Himalayanregion with Mongoloid affinities as compared toother ethnic groups from North India. From Nepal,the Old Nepalese and Gurkha are having meso-tobrachycephalic index and there is tendencytowards higher indices in the East. Among thepopulation groups from Eastern Himalayan regionthe mean value of cephalic index is high (78.09)as compared to Western and Central Himalayanregions (74.00 and 76.71, respectively). From thestates of Arunachal Pradesh, Assam, Nagaland,Manipur, Mizoram, Tripura, Meghalaya andSikkim, most of the populations studied showmean average value between 76.0 and 80.9(mesocephaly) except Garo and Abor groups,Kuki Chin, Rengma and Sema Nagas, Kaipeng,Synteng, Pnar Khasi who are falling indolichocephalic category and Ahom, AssameseBrahmin, Ao Naga, Bhutias, Chhetris (Sikkim), Raisand Limboos who are brachycephalics. FromDarjeeling district of West Bengal also brachy-cephalics are observed among Lepchas, Limbus,Khambus, Gurungs, Bhutias population groupswith Mongoloid affinities. From West Bengal inmost of the populations the mean value of indexis falling in mesocephalic category except a fewnamely Mal Pharia, Santal, Mala (tribal groups)and Rajbanshi, Barui, Mashiya, Rishi, Mahato(scheduled castes and caste groups) who aredolichocephalics. From West Bengal incidenceof mesocephalic is predominant amongpopulations belonging to different ethnic groupsand this may be due to Mongoloid racial elementpresent among them in varying degrees.From the states of Bihar and Orissa most of thetribal groups are dolichocephalics as comparedto other ethnic groups who are mesocephalics(For details see Bhasin et al. 1992).
From the states of Gujarat and Maharashtraof West India, the mean values of cephalic indexare quite high (78.89 and 77.79, respectively). Thevalues are high among castes (78.69) andcommunities (78.68) as compared to scheduledtribes (76.55). The brachycephalic index isreported among Brahmin Nagar, Parsis, Ahir,Kunbis, Kshatriyas, Prabhu Pathare whereasdolichocephalic index is observed among Dhanuk,different groups of Bhils, Halbi, Govari, Koli,

334 M. K. BHASIN
Katkari, all scheduled tribes.The mean value of cephalic index is 74.96
among the populations of Central India—who ismostly tribals and speaks Indo-European (Centralgroup), Austro-Asiatic (Munda group) andDravidian (Central Dravidian) languages and isfalling in dolichocephalic category. Similarly fromthe states of Bihar and Orissa among the tribalsthe mean value of cephalic index is less than 76(dolichocephalic) and they belong mainly to thespeakers of Austro-Asiatic (Munda group) andIndo-European (Eastern group) in Bihar andAustro-Asiatic (Munda group) and Dravidian(Central Dravidian) from Orissa.
The value of cephalic index is quite highamong the populations from the states ofKarnataka (78.71), Andhra Pradesh (77.79) ascompared toTamil Nadu (75.71) and Kerala (74.21),from where the mean value is low among
scheduled tribe (74.21 dolichocephaly, varies from69.44 to 78.90) as compared to other ethnic groupswho are mesocephalics and are having almostsimilar values. The brachycephaly (81.0) isobserved among the populations namely—Gauda, Kodagu, Kunchitiga, Brahmin Havig,Pattasali, Gangadikara Vokkaliga from Karnatakastate, Badaru and Kamti from Andhra Pradesh,Sukum Sale and Suka Sale from Tamil Nadu.
Onges and Andamanese of Andaman Islandsare brachycephalics whereas among Nicobaresethe differences are quite wide as observed fromdolichocepalic Car Nicobarese to mesocephalicNicobarese of Choura and Terressa Islands tohyperbrachycephalic Southern Nicobarese(Ganguly 1976). It appears that dolichocephalicsare predominant in North, East and towardsSouthern tip of India, whereas mesocephalics arefrequent in West and parts of South India and
Fig. 2. Frequencies of cephalic index in different regions of India (after Bhasin and Walter 2001)
INDIA
PAKISTAN
AFGHANISTAN
CHINATIBET
NEPAL
Lakshadweep (India)
BANGLA-DESH
Andaman
andN
icoba
rIsla
nds (
India)
Cephalic Index
< 73.974.0 - 74.975.0 - 75.976.0 - 76.977.0 - 77.978.0 - 78.9
> 79.0

335GENETICS OF CASTES AND TRIBES OF INDIA: SOMATOMETRY
Eastern Himalayan region (Table 2, Fig. 2).The correlations of mean value of cephalic
index with various climatic factors and altitudeby different ethnic groups though showingsignificant differences are not high (Table 6).
The brachycephalic element is observedamong the population groups with Mongoloidaffinities from the Himalayan region, particularlyfrom Eastern Himalayan region. From West India,brachycephalics are observed among caste groupsand a migrated community of Parsis and from thestates of West Bengal, Karnataka, Andhra Pradeshand Tamil Nadu also this element is observedamong the caste groups. From the Islands, amongOnges, Andamanese and Nicobarese-Southern,brachycephaly is predominant. It is interestingto note that brachycephalic element, which is ingeneral quite low among populations of India isobserved among populations with Mongoloid
affinities and caste groups of West and SouthIndia and state of West Bengal.
Guha in Census of India 1931 has made acoloured map of the distributions of the head formin India to which Keith (1936) has referred asfollows:
“Guha’s map shows brachycephaly (red)sweeping southwards rounds both ends ofHimalayas. From Pamir it descends throughAfghanistan, Baluchistan and Sind and thenextends continuously along the west, broadeningout from Bombay so far as the whole of Deccan isincluded. The red band sweeps across thepeninsular so as to include the South Madras.Only a small area in South is left as blue(dolichocephalic), it is along the Malabar Coast.From the eastern end of the Himalaya thebrachycephalic (red) area passes from Bhutan andTibet southward through Assam to spread over
Fig. 3. Distribution of type of cephalic index in different regions of India (after Sarkar 1958)
INDIA
PAKISTAN
AFGHANISTAN
CHINATIBET
Lakshadweep (India)
Andaman
andN
icoba
rIsla
nds(
India)
Cephalic Index
HyperdolichocephalsDolichocephalsDolichocephals (Indo Aryan)Brachycephals (Percentage
in Figures)MesocepalsDolichocephals (Mundari)

336 M. K. BHASINTa
ble
2: C
epha
lic I
ndex
Part
icul
ars
Subj
ects
No.
of
Cep
halic
Ind
exst
udie
dst
udie
sM
ean
Min
Max
1.N
ATU
RA
L R
EG
ION
Him
alay
an M
ount
ain
Com
plex
8860
140
76.3
869
.29
86.5
1In
dus-
Gan
ga-B
rahm
aput
ra P
lain
s27
517
294
75.8
770
.80
90.8
8Pe
nins
ular
Pla
teau
4909
659
776
.07
67.9
187
.00
Isla
nds
762
1478
.64
74.3
386
.11
2.C
LIM
ATIC
RE
GIO
NM
onso
on T
ype
with
Sho
rt D
ry42
2372
75.0
067
.91
86.1
1
Seas
onM
onso
on T
ype
with
Dry
Sea
son
3000
6176
.16
70.0
080
.87
Trop
ical
Sav
anna
h Ty
pe34
622
362
76.2
371
.80
87.0
0Se
mi A
rid S
tepp
e Ty
pe49
4510
276
.00
69.0
683
.00
Hot
Des
ert
Type
-0
--
-M
onso
on T
ype
with
Dry
Win
ters
3657
443
176
.01
69.2
990
.88
Col
d H
umid
Win
ters
with
Sho
rt33
85
75.7
973
.23
78.0
6
Sum
mer
sPo
lar
Type
533
1276
.24
73.4
479
.56
3.PO
LIT
ICA
L D
IVIS
ION
OF
IND
IAI.
NO
RTH
IN
DIA
A.
Wes
tern
Him
alay
a (S
. No.
1, 2
)1.
Jam
mu
and
Kas
hmir
1139
2474
.15
69.2
979
.56
2.H
imac
hal
Prad
esh
2294
2473
.92
70.7
078
.54
3.Pu
njab
1077
1573
.60
72.3
074
.40
4.C
hand
igra
h U
T-
0-
--
5.H
arya
na-
0-
--
6.D
elhi
UT
742
1074
.14
72.3
576
.00
B.
Cen
tral
Him
alay
a (S
. No.
7, E
ight
Dis
tric
ts o
f U
ttar
Prad
esh)
7.U
ttar
Prad
esh
1481
316
073
.54
70.8
083
.10
8.R
ajas
than
1698
1173
.85
72.4
076
.50
II.W
EST
IND
IA9.
Guj
arat
4749
5078
.89
74.9
083
.76
10.M
ahar
asht
ra69
6412
277
.79
72.4
083
.15
11.G
oa, D
aman
and
Diu
UT
-0
--
-12
.Dad
ra a
nd N
agar
Hav
eli
UT
-0
--
-II
I.EAS
T IN
DIA
C.
East
ern
Him
alay
a (S
. No.
13
to 2
0 an
d D
arje
elin
g D
istr
ict
of W
est
Beng
al)
13.A
runa
chal
Pra
desh
338
575
.79
73.2
378
.06
14.A
ssam
4846
6678
.11
73.4
782
.83
15.N
agal
and
1700
3577
.83
75.6
981
.87
16.M
anip
ur28
04
75.8
774
.19
77.2
517
.Miz
oram
401
75.1
575
.15
75.1
518
.Tri
pura
312
576
.56
74.9
876
.93
19.M
egha
laya
887
1277
.04
73.4
077
.81
20.S
ikki
m79
716
80.0
676
.46
86.5
121
.Wes
t B
enga
l74
7062
79.9
371
.75
90.8
8
Part
icul
ars
Subj
ects
No.
of
Cep
halic
Ind
exst
udie
dst
udie
sM
ean
Min
Max
22.B
ihar
1602
876
75.1
172
.40
78.2
023
.Oris
sa37
0053
75.2
372
.22
78.4
0IV
.CEN
TRAL
IN
DIA
24.M
adhy
a Pr
ades
h25
2536
74.9
671
.80
79.8
0V.
SOU
TH I
ND
IA25
.Kar
nata
ka21
8748
78.7
173
.10
83.0
026
.And
hra
Prad
esh
1426
3477
.79
72.8
987
.00
27.T
amil
Nad
u26
3590
75.7
169
.16
82.2
028
.Ker
ala
3665
6474
.01
67.9
178
.40
29.P
ondi
cher
ry U
T11
618
76.2
672
.44
80.8
7VI
.ISL
AND
S30
.Lak
shad
wee
p U
T-
0-
--
31.A
ndm
an I
slan
ds a
nd18
78
82.6
581
.18
84.8
0N
icob
ar I
slan
ds U
T57
56
77.3
374
.33
86.1
13A
. ZO
NE
S O
F IN
DIA
I.N
orth
Ind
ia21
763
244
73.6
569
.29
83.1
0II
.W
est
Indi
a11
713
172
78.2
472
.40
83.7
6II
I.Ea
st I
ndia
3639
833
576
.82
71.7
590
.88
IV.
Cen
tral
Indi
a25
2536
74.7
671
.80
79.8
0V.
Sout
h In
dia
1107
424
476
.07
67.9
187
.00
VI.
Isla
nds
762
1478
.64
74.3
386
.11
IND
IA (
TOTA
L)84
235
1045
76.0
667
.91
90.8
83B
. RE
GIO
NS
OF
HIM
AL
AYA
A.W
este
rn H
imal
aya
3433
4874
.00
69.2
979
.56
B.
Cen
tral
Him
alay
a13
9417
76.7
171
.13
83.1
0C
.Ea
ster
n H
imal
aya
9766
153
78.0
973
.23
86.5
1H
IMA
LAYA
(TO
TAL)
1459
321
877
.00
69.2
986
.51
NO
N-H
IMA
LAYA
N R
EGIO
NS
6964
282
775
.86
67.9
190
.88
4.E
TH
NIC
GR
OU
PA
.ZO
NES
OF
IND
IA1.
NO
RTH
IN
DIA
Cas
te68
0382
73.4
069
.88
77.5
0Sc
hedu
led
Cas
te35
5847
73.2
671
.00
75.3
0Sc
hedu
led
Trib
e24
2827
75.0
171
.14
79.8
9C
omm
unity
8974
8873
.62
69.2
983
.10
II.W
EST
IND
IAC
aste
4656
7878
.69
74.5
083
.76
Sche
dule
d C
aste
561
977
.42
76.5
178
.64
Sche
dule
d Tr
ibe
2107
2776
.55
72.4
080
.27

337GENETICS OF CASTES AND TRIBES OF INDIA: SOMATOMETRYTa
ble
2: C
ontd
......
Part
icul
ars
Subj
cect
sN
o. o
fC
epha
lic I
ndex
stud
ied
stud
ies
Mea
nM
in M
axC
omm
unity
4389
5878
.68
75.2
083
.15
III.
EAST
IN
DIA
Cas
te16
721
7676
.51
72.9
990
.88
Sche
dule
d C
aste
3927
4278
.03
73.8
980
.48
Sche
dule
d Tr
ibe
1259
817
576
.25
71.7
586
.51
Com
mun
ity31
5242
79.2
373
.77
84.3
0IV
.CEN
TRAL
IN
DIA
Cas
te10
42
74.8
374
.30
75.5
3Sc
hedu
led
Cas
te-
0-
--
Sche
dule
d Tr
ibe
2371
3374
.96
71.8
079
.80
Com
mun
ity50
175
.17
75.1
775
.17
V.SO
UTH
IN
DIA
Cas
te32
9582
76.9
871
.43
87.0
0Sc
hedu
led
Cas
te13
3732
76.5
073
.10
83.0
0Sc
hedu
led
Trib
e33
1665
74.2
169
.44
78.9
0C
omm
unity
3126
6576
.89
67.9
181
.70
VI.I
SLAN
DS
Cas
te-
0-
--
Sche
dule
d C
aste
-0
--
-Sc
hedu
led
Trib
e76
214
78.6
474
.33
86.1
1C
omm
unity
-0
--
-IN
DIA Cas
te31
579
320
76.2
069
.88
90.8
8Sc
hedu
led
Cas
te93
8313
075
.96
71.0
083
.00
Sche
dule
d Tr
ibe
2358
234
175
.81
69.4
486
.51
Com
mun
ity19
691
254
76.1
767
.91
84.3
0B
. RE
GIO
NS
OF
HIM
AL
AYA
A.
Wes
tern
Him
alay
aC
aste
858
1073
.78
69.8
877
.50
Sche
dule
d C
aste
701
71.8
771
.87
71.8
7Sc
hedu
led
Trib
e10
9812
74.4
371
.14
78.5
4C
omm
unity
1407
2573
.90
69.2
979
.56
B.
Cen
tral
Him
alay
aC
aste
602
75.6
674
.82
76.8
4Sc
hedu
led
Cas
te21
32
74.2
173
.69
74.8
0Sc
hedu
led
Trib
e53
66
77.3
373
.90
79.8
9C
omm
unity
585
777
.16
71.1
383
.10
C.
East
ern
Him
alay
aC
aste
243
579
.08
77.0
881
.41
Sche
dule
d C
aste
1221
1478
.22
75.7
880
.12
Sche
dule
d Tr
ibe
6811
108
77.5
773
.23
86.5
1C
omm
unity
1491
2680
.19
77.9
684
.30
5. T
RA
DIT
ION
AL
OC
CU
PAT
ION
Prie
stho
od15
528
7675
.60
70.7
081
.56
Part
icul
ars
Subj
cect
s
No.
of
Cep
halic
Ind
exst
udie
dst
udie
sM
ean
Min
Max
War
fare
3491
3374
.45
69.8
881
.81
Trad
e an
d C
omm
erce
2383
2977
.18
71.3
081
.40
Agr
icul
ture
1950
3975
.34
71.8
780
.12
Ani
mal
Hus
band
ry88
012
73.8
572
.40
81.2
8A
rtis
ans
710
1177
.33
72.9
882
.20
Men
ial
Wor
kers
6409
7176
.27
71.0
080
.48
No
Info
rmat
ion
5288
477
476
.27
67.9
190
.88
6.L
AN
GU
AG
E G
RO
UP
I.AU
STRO
-ASI
ATIC
FAM
ILY
Mon
Khm
er G
roup
1436
1677
.34
74.3
386
.11
Mun
da G
roup
5441
5875
.18
71.7
580
.48
II.T
IBET
O-C
HIN
ESE
FAM
ILY
(i)
Siam
ese-
Chi
nese
Sub
-Fam
ilyTa
i G
roup
851
78.4
878
.48
78.4
8(i
i) T
ibet
o-Bu
rman
Sub
-Fam
ilyB
hotia
Gro
up20
9827
77.3
470
.38
86.5
1H
imal
ayan
Gro
up10
3920
79.6
672
.98
85.0
4N
orth
Eas
t Fr
ontie
r G
roup
1111
1978
.11
73.2
382
.83
Bod
o G
roup
1983
2476
.89
73.7
480
.13
Nag
a G
roup
1901
3977
.90
75.6
981
.87
Kac
hin
Gro
up13
176
.06
76.0
676
.06
Kuk
i C
hin
Gro
up38
88
75.5
573
.40
77.2
5II
I. D
RAVI
DIA
N F
AMIL
YSo
uth
Dra
vidi
an G
roup
1083
624
076
.06
67.9
187
.00
Cen
tral
Dra
vidi
an G
roup
2031
3375
.41
71.8
079
.80
Nor
th D
ravi
dian
Gro
up30
0911
73.6
772
.30
75.7
9IV
.IN
DO
-EU
ROPE
AN F
AMIL
YD
ard
Gro
up65
210
74.0
569
.88
76.2
0N
orth
Wes
tern
Gro
up30
182
.91
82.9
182
.91
Sout
hern
Gro
up70
6411
577
.93
74.3
081
.81
East
ern
Gro
up18
9234
76.2
072
.40
78.4
0B
ihar
i20
718
109
76.9
472
.99
90.8
8C
entra
l G
roup
2085
324
974
.49
70.8
083
.76
Paha
ri G
roup
969
1674
.10
69.2
981
.49
Uns
peci
fied
256
276
.46
73.9
077
.33
Oth
er L
angu
ages
430
1279
.29
74.2
984
.80
No
Info
rmat
ion
-0
--
-6A
. LA
NG
UA
GE
FA
MIL
YI.
Aus
tro A
siat
ic F
amily
6877
7475
.63
71.7
586
.11
II.
Tibe
to C
hine
se F
amily
8616
139
77.6
770
.38
86.5
1II
I.D
ravi
dian
Fam
ily15
876
284
75.5
267
.91
87.0
0IV
.In
do E
urop
ean
Fam
ily52
434
536
75.9
969
.29
90.8
8O
ther
Lan
guag
es43
012
79.2
974
.29
84.8
0N
o In
form
atio
n-
0-
--

338 M. K. BHASIN
Bengal and to end in Orissa. The actual data onwhich Guha based his map has not beenpublished. So Guha’s map cannot be studied orchecked by other researchers”.
Sarkar et al. (1955) made an attempt to findout whether brachycephaly is restricted to certainzones or it has sweeping distribution as shownin Guha’s map. In their paper, they placed thedata into four tables and found the followingzones with highest concentration ofbrachycephaly (Fig. 3).
Zone A: North West Frontier Provinces(NWFR), Punjab, Rajputana, and SouthernExtension
Zone B: Himalayan foot hillZone C: Chittagao Hill Tracks, Bengal and
AssamOthers excluding zones A, B, and C in which
states are Uttar Pradesh, Bihar and then fromMelghat Orissa, Nilgiri Hills, Travancore,Tinnevalley.
It has been observed that brachycephalyconfines more or less to certain zones and thesezones are not interrelated. It does not appear asclear sweeping continued and evenly distributedstrain as reported by Guha (1931).
In Zone A, the highest value is 76.8 per centof Northwest Frontier Provinces to about 60 percent in Punjab and Baluchistan and then it fallsby 1 to 2 per cent in certain groups. The southwardextension of the above is justified because of theabsence of the high percentage of brachycephalysimilar to N.W.F.P., only in Prabhu highest is 52per cent which falls to 46 in Nagar Brahmin and40 per cent in Vadnagar Nagar Brahmin. The othergroups of these areas show very low percentageof brachycephaly. They suggested that Pamirhave always been recognized as centre ofbrachycephaly and the same is true for Hindukushregion. It would therefore be not out of place toassume that N.W.F.P. brachycephaly has itssource in the above region.
In Zone B, high brachycephaly has been withLimbu of Nepal (82 per cent). This appears to beof Mongoloid origin.
Zone C has the highest brachycephaly amongChakama (76 per cent). It therefore appears thatwhatever brachycephaly is found in this area hasits origin in the east and this is all the more evidentin the absence of any influx of brachycephalyfrom the Zone B.
The latter argument of Sarkar et al. (1955) isborn out of the fact that the brachycephaly
appears to decrease appreciably and significantlyin the region further from the nucleus. TheKayasthas (Uttar Radhi) of Bengal have only 10per cent of brachycephaly and it has been foundto be very low in the western region of Bengal.They observed that the source of thisbrachycephaly is Southeast Asia, which ispredominantly brachycephalic and closer toEastern India.
Sarkar et al. (1955) have not grouped in anycategory the people of Tinnevalley in the southerntip of peninsula among whom they found fairlyhigh brachycephaly (Parwars and Shanars, whoshow 34.0 ± 6.7 and 51 ± 4.9 per cent ofbrachycephaly, respectively). Hornwell (1923)who has studied them in course of his researchon the origin and ethnological significance ofIndian Boat was of the opinion that there havebeen separate waves migrations from SoutheastAsia and the first wave was of Polynesian andsecond of Malayanesians. He emphasized thesimilarities between the Sharnas andMalayanesian people of Java. It is therefore notimprobable that Malayan element has beenresponsible for the brachycephaly in East Indiato a certain extent. (Basu et al. 1980).
Among the higher occupational groups—priesthood and warfare, the mean value ofcephalic index is low (75.60 and 74.45) and aredolichocephalics as compared to the artisans andmenial workers who are mesocephalics. Howeveramong all these occupational groups thedifferences in the mean values are not high andthe values are either dolichocephalic or near thelower range of mesocephaly (76.0 to 80.9), whichindicates gene flow among them, as also observedfor other biological traits (Table 2) (Bhasin et al.1994; Bhasin and Walter 2001).
Among the speakers of Munda group ofAustro-Asiatic and North and Central Dravidiangroups of Dravidian languages, the predominantelement present is dolichocephaly and they aremostly tribals. The mean value of cephalic indexis high among speakers of Mon Khmer group(Austro-Asiatic family), Bhotia group, Himalayangroup, North East Frontier group, Naga group(Tibeto-Chinese family) and Northwestern group(Indo-European family) languages who arehaving Mongoloid affinities. The speakers ofCentral group are dolichocephalics as comparedto Bihari, Eastern (East India) and Southern groups(Maharashtra) who are mesocephalics (Table 2)(Bhasin et al. 1994; Bhasin and Walter 2001).

339GENETICS OF CASTES AND TRIBES OF INDIA: SOMATOMETRY
In India, cephalic index value varies fromdolichocephaly to mesocephaly barring a fewpopulation groups from West, East, South andIslands among whom brachycephaly has beenobserved; the mean value of the index is 76.06which are mesocephaly. In various zones, thedistribution of cephalic index is mostlydolichocephaly in North and Central India andbrachycephaly is absent; West, East and SouthIndia are predominantly mesocephalic with lowfrequency of brachycephaly, while thebrachycephaly element is prominent from Islands.In the Hiamalayan region the low mean value ofcephalic index is observed from Western regionwhich is dolichocephalic than in Central andEastern regions which fall in mesocephaly class.The value is low in the scheduled tribe ethnicgroups as compared to others in all zones andIndia except in North India, where it is higher thanother groups. No correlation is observed withclimatic factors and altitude with different ethnicgroups. Among the different occupational groupsvalue of cephalic index is low among priesthoodand warfare groups as compared to artisans andmenial workers groups but the differences are notsignificant. Among the language families, highvalue of the index is observed among speakers ofTibeto-Chinese languages who are havingMongoloid affinities whereas low value is record-ed in Central and North Dravidian (Dravidianfamily) and Munda group (Austro-Asiatic family)speakers who are mostly tribals.
2.2. Nasal Index
The nose, like the dentition, is more directlyregulated by the forces of selection than is truefor other aspects of cranial morphology (Brace1964; Brace and Hunt 1990; Brace et al. 1991).
Global variation in the human nasal index iswidely viewed as the result of an adaptiveresponse to climatic variability. Thomson andBuxton (1923) first, and many later investigators(Davies 1932; Weiner 1954; Crognier 1981; Beals
Zone IncidenceHigh Medium Low
North India Dolichocephaly - Meso-and BrachycephalyCentral India Dolichocephaly Mesocephaly -West India Mesocephaly - Brachy-and DolichocephalyEast India Mesocephaly Dolichocephaly BrachycephalySouth India Mesocephaly Dolichocephaly BrachycephalyIslands Brachycephaly - Meso-and Dolichocephaly
et al. 1984) found that nasal indices are positivelyassociated with both temperature and humidity.Nasal indices are also related to latitude, whichunderlies variation in temperature and humidity(Newman 1953; Kelso 1970). In addition, nasalheight and breadth, the components of the index,have been studied with respect to climate (Wolpoff1968; Hiernaux and Froment 1976; Corgnier 1981).Nasal height is more strongly associated withtemperature, covarying negatively, whereas nasalbreadth is most strongly associated with humidity,covarying positively. However, the nasal indexshows a higher correlation with climatic gradientsthan do either nasal height or nasal breadth alone.These patterns have been explained as evolution-ary adaptations optimizing respiratory heat andmoisture exchange in nasal mucosa, primarily toprevent ciliary and lung alveoli damage, as wellas to moderate body water loss and maintainthermal equilibrium (e.g., Thomson and Buxton1923; Davies 1932; Weiner 1954).
Despite the associations described above, thenasal index is not universally accepted as areflection of climatic adaptation (Hoyme 1965; St.Hoyme and Iscan 1989).
The mean value of nasal index is 75.53 amongIndian populations (varies from 51.40 - hyperlepto-rhinae in Jain Pancham of Maharashtrato 96.75 -chamaerhinae in Garo or Mande of Assam).
The value is high (79.40 - mesorhinae) amongscheduled tribes as compared to other ethnicgroups (scheduled caste - 75.61; caste - 74.78 andcommunity - 71.57).The value of index is low inHimalayan mountain complex region (70.68)followed by Indus-Ganga-Brahmaputra plains(72.13) and then gradually increases towardspeninsular plateau (78.01) and islands region(79.98). From the climatic regions, the value islowest from polar region (66.38) and startsincreasing towards cold humid winters with shortsummers (71.31) and monsoon type with drywinters (72.11) regions and reach quite highvalues in tropical savannah type (78.05) tomaximum in monsoon type with short dry season

340 M. K. BHASINTa
ble
3: N
asal
Ind
exPa
rtic
ular
sSu
bjec
tsN
o. o
fN
asal
Ind
exst
udie
dst
udie
sM
ean
Min
Max
1.N
ATU
RA
L R
EG
ION
Him
alay
an M
ount
ain
Com
plex
8408
129
70.6
860
.83
92.8
6In
dus-
Gan
ga-B
rahm
aput
ra P
lain
s22
844
249
72.1
350
.90
96.7
5Pe
nins
ular
Pla
teau
4648
056
378
.01
51.4
095
.90
Isla
nds
751
1379
.98
69.5
893
.01
2.C
LIM
ATIC
RE
GIO
NM
onso
on T
ype
with
Sho
rt D
ry41
7968
80.6
265
.70
93.0
1
Seas
onM
onso
on T
ype
with
Dry
Sea
son
2827
4876
.75
67.9
295
.10
Trop
ical
Sav
anna
h Ty
pe34
389
354
78.0
551
.40
95.9
0Se
mi A
rid S
tepp
e Ty
pe47
6892
76.1
064
.52
92.9
0H
ot D
eser
t Ty
pe-
0-
--
Mon
soon
Typ
e w
ith D
ry W
inte
rs31
449
375
72.1
159
.00
96.7
5C
old
Hum
id W
inte
rs w
ith S
hort
338
571
.31
70.3
472
.90
Su
mm
ers
Pola
r Ty
pe53
312
66.3
862
.18
68.4
63.
POL
ITIC
AL
DIV
ISIO
N O
F IN
DIA
I.N
ORT
H I
ND
IAA
.W
este
rn H
imal
aya
(S. N
o. 1
, 2)
1.Ja
mm
u an
d K
ashm
ir92
615
64.7
461
.75
75.5
42.
Him
acha
l Pr
ades
h22
9424
65.8
160
.83
74.1
03.
Punj
ab10
3513
69.7
864
.71
75.2
04.
Cha
ndig
rah
UT
-0
--
-5.
Har
yana
-0
--
-6.
Del
hi U
T74
010
67.9
665
.92
71.1
7B
.C
entr
al H
imal
aya
(S. N
o. 7
, Eig
ht D
istr
icts
of
Utta
r Pr
ades
h)7.
Utta
r Pr
ades
h12
232
123
71.0
159
.00
86.1
08.
Raj
asth
an16
9811
73.6
370
.03
84.1
0II
.WES
T IN
DIA
9.G
ujar
at47
5050
73.5
365
.84
80.8
010
.Mah
aras
htra
6935
120
77.4
551
.40
94.8
011
.Goa
, Dam
an a
nd D
iu U
T-
0-
--
12.D
adra
and
Nag
ar H
avel
i U
T-
0-
--
III.E
AST
IND
IAC
.Ea
ster
n H
imal
aya
(S. N
o. 1
3 to
20
and
Dar
jeel
ing
Dis
tric
t of
Wes
t Be
ngal
)13
.Aru
nach
al P
rade
sh33
85
71.3
170
.34
72.9
014
.Ass
am48
4766
76.0
565
.69
96.7
515
.Nag
alan
d16
9935
77.4
664
.42
92.8
616
.Man
ipur
280
475
.93
70.8
480
.95
17.M
izor
am40
169
.98
69.9
869
.98
18.T
ripu
ra31
15
72.9
270
.63
75.3
119
.Meg
hala
ya88
712
79.1
673
.58
87.6
320
.Sik
kim
797
1670
.13
65.1
578
.20
21.W
est
Ben
gal
5378
5572
.18
65.4
094
.70
Part
icul
ars
Subj
ects
No.
of
Nas
al I
ndex
stud
ied
stud
ies
Mea
nM
in M
ax22
.Bih
ar15
650
7078
.46
58.8
095
.90
23.O
rissa
3700
5381
.53
70.4
691
.81
IV.C
ENTR
AL I
ND
IA24
.Mad
hya
Prad
esh
2504
3582
.09
72.9
292
.20
V.SO
UTH
IN
DIA
25.K
arna
taka
2149
4776
.60
65.2
092
.62
26.A
ndhr
a Pr
ades
h14
2634
75.3
069
.70
81.9
027
.Tam
il N
adu
2323
6876
.72
64.5
290
.81
28.K
eral
a36
3261
81.3
165
.70
95.1
029
.Pon
dich
erry
UT
1161
876
.04
70.8
281
.21
VI.I
SLAN
DS
30.L
aksh
adw
eep
UT
-0
--
-31
.And
man
Isl
ands
and
176
784
.15
71.6
093
.01
N
icob
ar I
slan
ds U
T57
56
78.7
069
.58
83.8
73A
. ZO
NE
S O
F IN
DIA
I.N
orth
Ind
ia18
925
196
70.1
359
.00
86.1
0II
.W
est
Indi
a11
685
170
75.8
651
.40
94.8
0II
I.Ea
st I
ndia
3392
732
277
.07
58.8
096
.75
IV.
Cen
tral
Indi
a25
0435
82.0
972
.92
92.2
0V.
Sout
h In
dia
1069
121
877
.99
64.5
295
.10
VI.
Isla
nds
751
1379
.98
69.5
893
.01
IND
IA (
TOTA
L)78
483
954
75.5
351
.40
96.7
53B
. RE
GIO
NS
OF
HIM
AL
AYA
A.
Wes
tern
Him
alay
a32
2039
65.5
160
.83
75.5
4B
.C
entr
al H
imal
aya
1157
1572
.85
65.7
883
.00
C.
East
ern
Him
alay
a97
6515
375
.56
64.4
296
.75
HIM
ALA
YA (
TOTA
L)14
142
207
73.0
560
.83
96.7
5N
ON
-HIM
ALA
YAN
REG
ION
S64
341
747
76.0
751
.40
95.9
04.
ET
HN
IC G
RO
UP
A.
ZON
ES O
F IN
DIA
1.N
ORT
H I
ND
IAC
aste
6290
6870
.27
59.0
084
.28
Sche
dule
d C
aste
2638
3875
.16
63.0
086
.10
Sche
dule
d Tr
ibe
2389
2671
.20
62.1
884
.10
Com
mun
ity76
0864
67.9
260
.83
83.4
0II
.WES
T IN
DIA
Cas
te46
5678
74.9
865
.84
82.8
1Sc
hedu
led
Cas
te56
29
78.8
674
.79
81.9
0Sc
hedu
led
Trib
e21
0827
80.0
469
.27
94.8
0

341GENETICS OF CASTES AND TRIBES OF INDIA: SOMATOMETRYTa
ble
3: C
ontd
....
Part
icul
ars
Subj
ects
No.
of
Nas
al I
ndex
stud
ied
stud
ies
Mea
nM
in M
axC
omm
unity
4359
5674
.39
51.4
087
.56
III.
EAST
IN
DIA
Cas
te14
694
6976
.34
58.8
090
.16
Sche
dule
d C
aste
3684
4074
.44
66.3
988
.70
Sche
dule
d Tr
ibe
1255
117
279
.95
64.4
296
.75
Com
mun
ity29
9841
71.8
765
.40
82.0
6IV
. CEN
TRAL
IN
DIA
Cas
te10
42
79.2
672
.92
85.1
4Sc
hedu
led
Cas
te-
0-
--
Sche
dule
d Tr
ibe
2350
3282
.30
75.9
092
.20
Com
mun
ity50
177
.91
77.9
177
.91
V. S
OU
TH I
ND
IAC
aste
3199
7576
.03
65.7
085
.50
Sche
dule
d C
aste
1304
3078
.45
69.7
082
.31
Sche
dule
d Tr
ibe
3183
6281
.34
64.5
295
.10
Com
mun
ity30
0551
76.3
362
.50
92.6
2VI
ISL
AND
SC
aste
-0
--
-Sc
hedu
led
Cas
te-
0-
--
Sche
dule
d Tr
ibe
751
1379
.98
69.5
893
.01
Com
mun
ity-
0-
--
IND
IA Cas
te28
943
292
74.7
858
.80
90.1
6Sc
hedu
led
Cas
te81
8811
775
.61
63.0
092
.31
Sche
dule
d Tr
ibe
2333
233
279
.49
62.1
896
.75
Com
mun
ity18
020
213
71.5
751
.40
92.6
2B
. RE
GIO
US
OF
HIM
AL
AYA
A. W
este
rn H
imal
aya
Cas
te81
88
64.9
062
.11
74.1
0Sc
hedu
led
Cas
te70
165
.39
65.3
965
.39
Sche
dule
d Tr
ibe
1059
1166
.48
62.1
875
.54
Com
mun
ity12
7319
65.0
960
.83
69.5
8B.
Cen
tral
Him
alay
aC
aste
602
69.1
768
.54
70.0
6Sc
hedu
led
Cas
te21
32
79.9
875
.98
83.0
0Sc
hedu
led
Trib
e53
66
72.0
965
.78
79.5
0C
omm
unity
348
570
.73
66.3
073
.14
C.
East
ern
Him
alay
aC
aste
243
569
.08
65.6
970
.17
Sche
dule
d C
aste
1221
1473
.34
66.3
983
.70
Sche
dule
d Tr
ibe
9810
108
76.6
964
.42
96.7
5C
omm
unity
1491
2673
.27
65.7
582
.06
5. T
RA
DIT
ION
AL
OC
CU
PAT
ION
Prie
stho
od14
940
7075
.89
58.8
082
.81
Part
icul
ars
Subj
ects
No.
of
Nas
al I
ndex
stud
ied
stud
ies
Mea
nM
in M
axW
arfa
re31
1426
69.0
162
.11
82.4
8Ta
de a
nd C
omm
erce
1937
2673
.16
63.0
079
.60
Agr
icul
ture
1846
3372
.74
64.0
083
.70
Ani
mal
Hus
band
ry47
810
71.3
265
.74
78.9
5A
rtis
ans
708
1171
.94
63.0
081
.71
Men
ial
Wor
kers
5359
6475
.98
64.0
088
.70
No
Info
rmat
ion
5000
171
476
.08
51.4
096
.75
6. L
AN
GU
AG
E G
RO
UP
I. AU
STRO
-ASI
ATIC
FAM
ILY
Mon
Khm
er G
roup
1436
1679
.57
69.5
887
.63
Mun
da G
roup
5395
5582
.28
69.0
095
.00
II.
TIBE
TO-C
HIN
ESE
FAM
ILY
(i) S
iam
ese-
Chi
nese
Sub
-Fam
ilyTa
i G
roup
851
77.2
677
.26
77.2
6(ii
) Ti
beto
-Bur
man
Sub
-fam
ilyB
hotia
Gro
up17
7423
66.0
560
.83
75.5
4H
imal
aya
Gro
up10
3920
71.3
365
.15
78.5
0N
orth
Eas
t Fr
ontie
r G
roup
1111
1974
.05
69.6
690
.58
Bod
o G
roup
1982
2477
.64
68.5
496
.75
Nag
a G
roup
1901
3977
.96
64.4
292
.86
Kac
hin
Gro
up13
181
.26
81.2
681
.26
Kuk
i C
hin
Gro
up38
88
75.6
969
.98
82.6
7II
I. D
RAVI
DIA
N F
AMIL
YSo
uth
Dra
vidi
an G
roup
1045
421
578
.04
64.5
295
.10
Cen
tral
Dra
vidi
an G
roup
2010
3282
.06
73.6
791
.81
Nor
th D
ravi
dian
Gro
up30
0911
72.8
267
.00
89.1
2IV
. IN
DO
-EU
ROPE
AN F
AMIL
YD
ard
Gro
up57
26
63.3
462
.11
66.5
0N
orth
Wes
tern
Gro
up30
173
.58
73.5
873
.58
Sout
hern
Gro
up70
5711
476
.77
51.7
088
.40
East
ern
Gro
up18
9234
81.3
070
.46
93.6
0B
ihar
i18
294
9975
.29
58.8
088
.70
Cen
tral
Gro
up18
438
210
72.1
359
.00
94.8
0Pa
hari
Gro
up92
914
67.4
362
.42
77.9
3U
nspe
cifie
d25
62
77.0
569
.10
79.5
0O
ther
Lan
guag
es41
810
79.9
5-
93.0
1N
o In
form
atio
n-
0-
--
6A. L
AN
GU
AG
E F
AM
ILY
I. A
ustro
Asi
atic
Fam
ily68
3171
81.7
269
.00
95.9
0II
. Ti
beto
Chi
nese
Fam
ily82
9313
573
.87
60.8
396
.75
III.
Dra
vidi
an F
amily
1547
325
877
.55
64.5
295
.10
IV. I
ndo
Euro
pean
Fam
ily47
468
480
74.2
351
.40
94.8
0O
ther
Lan
guag
es41
810
79.9
569
.10
93.0
1N
o In
form
atio
n-
0-
--
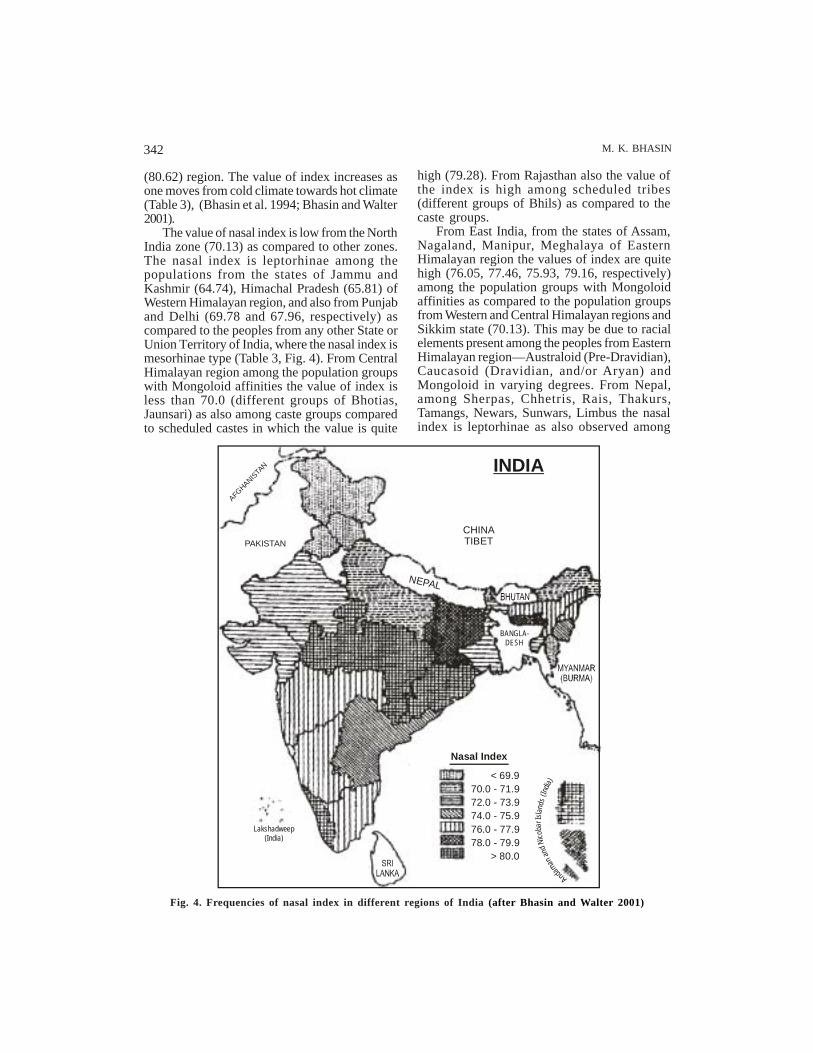
342 M. K. BHASIN
(80.62) region. The value of index increases asone moves from cold climate towards hot climate(Table 3), (Bhasin et al. 1994; Bhasin and Walter2001).
The value of nasal index is low from the NorthIndia zone (70.13) as compared to other zones.The nasal index is leptorhinae among thepopulations from the states of Jammu andKashmir (64.74), Himachal Pradesh (65.81) ofWestern Himalayan region, and also from Punjaband Delhi (69.78 and 67.96, respectively) ascompared to the peoples from any other State orUnion Territory of India, where the nasal index ismesorhinae type (Table 3, Fig. 4). From CentralHimalayan region among the population groupswith Mongoloid affinities the value of index isless than 70.0 (different groups of Bhotias,Jaunsari) as also among caste groups comparedto scheduled castes in which the value is quite
high (79.28). From Rajasthan also the value ofthe index is high among scheduled tribes(different groups of Bhils) as compared to thecaste groups.
From East India, from the states of Assam,Nagaland, Manipur, Meghalaya of EasternHimalayan region the values of index are quitehigh (76.05, 77.46, 75.93, 79.16, respectively)among the population groups with Mongoloidaffinities as compared to the population groupsfrom Western and Central Himalayan regions andSikkim state (70.13). This may be due to racialelements present among the peoples from EasternHimalayan region—Australoid (Pre-Dravidian),Caucasoid (Dravidian, and/or Aryan) andMongoloid in varying degrees. From Nepal,among Sherpas, Chhetris, Rais, Thakurs,Tamangs, Newars, Sunwars, Limbus the nasalindex is leptorhinae as also observed among
Nasal Index
< 69.970.0 - 71.972.0 - 73.974.0 - 75.976.0 - 77.978.0 - 79.9
> 80.0
INDIA
PAKISTAN
AFGHANISTA
N
CHINATIBET
NEPAL
Lakshadweep (India)
BANGLA-DESH
Andaman
and N
icoba
r Is l a
nds (
India)
Fig. 4. Frequencies of nasal index in different regions of India (after Bhasin and Walter 2001)

343GENETICS OF CASTES AND TRIBES OF INDIA: SOMATOMETRY
different populations from Sikkim among whomNepalis are in majority.
From West India the value of the index is 75.86(mesorhinae) and quite high value is foundamong the populations from Maharashtra (77.45)as compared to Gujarat (73.53). The value ishighest among the scheduled tribes (80.04 -mesorhinae) followed by scheduled castes (78.86)as compared to other ethnic groups. From WestIndia, however, the value of index below 70(leptorhinae) is observed among a few castes(Brahmin, Rajput, Khatri, Jain) and Parsis - amigrant community from Southwest Asia.
Among the populations from Central India(Madhya Pradesh) the value of index is quite high(82.09) followed by the states of Orissa (81.53)and Bihar (78.46) from which the studies are onscheduled tribes. From these states, as well asfrom West Bengal, the values of index are quitehigh (above 85) among tribals (e.g. Santal, Munda,Oraon, Paharia, Gond, Muria) and low (less than70) among caste groups (mostly Brahmin).
The mean value of nasal index is again highfrom the states of South India (77.99) and in thiszone also, the value is highest among scheduledtribes (81.34) followed by scheduled castes(78.45), as also observed from West India zone.The low values (less than 70) are observed amonga few populations—Curgs, Lambadi-nomadsmigrated from North India, Toda, Kaku andMohammadans. Whereas quite high values (morethan 85) have been reported among Kuruba,Yeruvas, Sholega, Siddi (a community with blackancestry), Kadar, Malasar, Paniyan, Malavetan,Ulladan, Muthuvan, Urali, Nayadi, Malser,Malapulayan, Malayarayan. From this zone, thestudies available on different caste populationsare falling in mesorhinae class.
From Islands, among Andamanese from Northand South the nasal index is quite high (morethan 85), whereas others are falling in mesorhinaeclass except Nicobarese Southern who are havingleptorhinae nasal index.
In general, it has been observed that the valueof nasal index is low among population groupsfrom the Himalayan region, however, differencesare observed among the peoples from westernand central Himalayan regions who are havingCaucasoid (Aryans) affinities and Caucasoid(Aryan) and Mongoloid admixture in varyingdegrees in which value of nasal index is low whilethat of Eastern Himalayan region who are havingadmixture of Australoid (Pre-Dravidian),
Caucasoid (Dravidian and/or Aryans) andMongoloid racial elements in varying degreeshave high value.
As one moves towards Indus-Ganga-Brahma-putra plains region, the value of nasal indexincreases a little whereas among castes andcommunities who are Caucasoid (Aryans) thevalue of index is low as compared to scheduledcastes and scheduled tribes and they are havingCaucasoid (Aryan, Dravidian) and Austraoloid(Pre-Dravidian) racial elements in varying degrees.
In the peninsular region, the value of the indexincreases sharply and it has been observed thatin West India, Central India and state of Orissa,the mean values are quite high among scheduledtribes and scheduled castes who are havingmostly Australoid and/or Caucasoid (Dravidian)admixture, albeit higher caste groups from thisregion are having leptorhinae type of nose. InSouth India, among Dravidians, the value of nasalindex is quite high among all the ethnic groupswith highest in scheduled tribes who are havingAustraloid (Pre-Dravidian) and/or Caucasoid(Dravidian) racial element (s).
The nasal index shows a correlation withclimatic gradients, but as it appears from theabove discussion, the differences observed arealso due to different racial elements present amongthem and due to various ethnic groups from thesame natural regions.
Further when nasal index correlations arecalculated with various climatic factors andaltitude by different ethnic groups significantdifferences are observed but correlations are nothigh (Table 6). Therefore it appears difficult toevaluate to what extent there is an association ofthe nasal index with climatic adaptation.
The value of nasal index among differentoccupational groups is low in warfare (69.01 -leptorhinae), animal husbandry (71.32) andartisans (71.94) followed by agriculture (72.74) andtrade and commerce (73.16) group as comparedto priesthood and menial workers among whomthe values are quite high (75.89 and 75.98,respectively) (Table 3), (Bhasin et al. 1994; Bhasinand Walter 2001). Most of the studies reportedon priesthood group are from West Bengal, WestIndia and South India among whom the value ofnasal index is observed high as compared to othergroups, particularly warfare group. The socialstratification is most clearly shown in the nasalindex—with increasing social rank the nasal indexbecome slower i.e. nose becomes narrower and

344 M. K. BHASIN
more pronounced (Risley 1915; v. Eickstedt 1952;Büchi 1968). However in present study it is notso with the highest rank i.e. priesthood.
The value of the index is high among thespeakers of Mon Khmer group (79.57) of AustroAsiatic; Bodo group (77.84), Naga group (77.96),Kachin group (81.26), Kuki Chin group (75.69),Tai group (77.26) and North East Frontier group(74.05) of Tibeto-Chinese languages from EasternHimalayan region who are having Mongoloidaffinities as compared to Dard group (63.34),Pahari group (67.43) of Indo-European and Bhotiagroup (66.05), Himalayan group (71.33) of Tibeto-Chinese languages from Western and CentralHimalayan regions and state of Sikkim. Amongthe speakers of Eastern group of Indo-European,Munda group of Austro-Asiatic and CentralDravidian group of Dravidian languages whobelong mostly to tribals the values are quite high(81.30, 82.28 and 82.06). In general, the values ofnasal index are low among the speakers of Tibeto-Chinese (73.87) and Indo-European (74.23)languages as compared to others (Table 3)(Bhasin et al. 1994; Bhasin and Walter 2001).
In India, the nasal index is observed ofmesorhinae type (75.53) among various populationgroups of India. The mean value of the index isobserved high in Central India and Islands fromwhere mostly scheduled tribe groups are reported,followed by South, East, West and North India.The value of nasal index is high in Eastern region(mesorhinae) as compared to Western and Centralregions of Himalaya. In general, the high value ofnasal index is observed among scheduled tribegroups followed by scheduled caste as comparedto caste and community from various zones andregions. The value is high in Austro-Asiaticfollowed by Dravidian language speakers ascompared to Indo-European and Tibeto-Chineselanguage speakers. No correlations are observedwith various climatic factors and altitude bydifferent ethnic groups. Leptorhinae type of noseis observed mostly from North India and in fewcaste groups from West and East India, althougha few cases have also been reported from SouthIndia among inbreeding groups (Muhammadansand Curg), small ethnic groups (Kapu and Toda)and a group which is originally not from SouthIndia (Lambadi) and chamaerhinae type of nose isreported generally among scheduled tribe andscheduled caste groups from West, East, SouthIndia and Islands zones.
2.3. Facial Index
The mean value of facial index is 86.34(mesoprosopic) among Indian populations, whichvaries from 75.00 (hypereuryprosopic type amongNaga Sundan of Nagaland) to 122.80 (hyperlepto-prospic in Bhil Khandesh of Maharashtra). Amongall the ethnic groups the index falls in mesopro-sopic class (84.0 - 87.9) with low value in schedul-ed caste (85.79) and high in community (86.58).The facial index is leptoprosopic among popu-lation groups from Himalayan mountain complexnatural region (88.33) and as one moves towardssouth the value starts decreasing gradually asobserved in Indus-Ganga-Brahmaputra plains(87.00 - mesoprosopic) and peninsular plateau(85.84 - mesoprosopic) whereas in Islands region,the value is quite low among Andamanese whoare having Negrito affinities (83.48 - eurypro-sopic) and high among Nicobarese (86.10 -mesoprosopic) among whom Mongoloid elementis present. From the climatic regions—polar type,monsoon type with short dry season andmonsoon type with dry season, the facial index isabove 88.0 (leptoprosopic) followed by monsoontype with dry winters (87.21) as compared to semiarid steppe type and tropical savannah typeregions where the values are low (84.78 and 85.34,respectively) (Table 4), (Bhasin et al. 1994; Bhasinand Walter 2001).
The facial index is leptoprosopic among thepopulations of North India zone as compared toother zones from where it is falling in mesopro-sopic class. The values are quite high among thepopulations from the states of Jammu andKashmir (90.71 - leptoprosopic) and HimachalPradesh (89.50 - leptoprosopic) of WesternHimalayan region (89.92 - leptoprosopic) ascompared to Central Himalayan region (87.71 -mesoprosopic). From East India in the EasternHimalayan region the value of index is low (85.47- mesoprosopic) as compared to Western andCentral Himalayan regions. However, a fewexceptions have been observed from Manipur,Mizoram and Tripura states where the value ofindex is above 88 (leptoprosopic) which may bedue to smaller number of studies reported fromthese states. From West Bengal the value of indexis high (88.43) as most of the studies are amongthe caste and community populations ascompared to Bihar and Orissa states from wherethe tribals are studied in majority (86.74 and 84.88,respectively). Among the scheduled tribes from

345GENETICS OF CASTES AND TRIBES OF INDIA: SOMATOMETRY
Central India the value of index is high (87.31) ascompared to that observed from East and WestIndia tribals (85.29 and 86.69, respectively).
Among the scheduled tribes from the Westand South India zones, the mean values of facialindex are high (86.69 and 89.49, respectively) ascompared to other ethnic groups from thesezones. From West India, the value of index is low(84.52) as compared to other zones and the indexis euryprosopic among caste populations in thiszone. In different states of South India zones themean value varies from 83.99 (Karnataka) to 90.01(Kerala); the value of index is quite high amongthe tribals of Kerala (in most cases above 88) ascompared from other states.
In general the value of index is high inNorthern India and decreases towards peninsularregion (Table 4, Fig. 5).
The facial index correlations with variousclimatic factors and altitude by different ethnicgroups though showing significant differencesare not high (Table 6).
The values of facial index among priesthood,agriculture, artisans and menial workers traditionaloccupational groups are almost similar (86.03,86.21, 85.30 and 86.04, respectively) as comparedto warfare, trade and commerce and animalhusbandry groups which have high values (87.93,87.51 and 86.76, respectively). However, thedifferences observed are not significant whichindicates gene flow among these groups as alsoobserved for other traits (Bhasin et al., 1994;Bhasin and Walter 2001).
Among the speakers of Dard group, Paharigroup of Indo-European and Bhotia group andHimalayan group of Tibeto-Chinese languages,
Facial Index< 83.9
84.0 - 84.985.0 - 85.986.0 - 86.987.0 - 87.988.0 - 88.9
> 89.0
INDIA
PAKISTAN
AFGHANISTA
N
CHINATIBET
NEPAL
Lakshadweep (India)
BANGLA-DESH
Andaman
and N
icoba
r Is la
nds (
India)
Fig. 5. Frequencies of facial index in different regions of India (after Bhasin and Walter 2001)

346 M. K. BHASINTa
ble
4: F
acia
l In
dex
Part
icul
ars
Subj
ects
No.
of
Faci
al I
ndex
stud
ied
stud
ies
Mea
nM
in M
ax1.
NAT
UR
AL
RE
GIO
NH
imal
ayan
Mou
ntai
n C
ompl
ex49
0771
88.3
375
.00
99.0
0In
dus-
Gan
ga-B
rahm
aput
ra P
lain
s10
526
106
87.0
079
.65
93.9
0Pe
nins
ular
Pla
teau
2343
332
085
.64
79.9
712
2.80
Isla
nds
596
886
.10
82.0
888
.91
2.C
LIM
ATIC
RE
GIO
NM
onso
on T
ype
with
Sho
rt D
ry14
5520
88.4
882
.08
110.
99Se
ason
Mon
soon
Typ
e w
ith D
ry S
easo
n14
6611
88.4
784
.50
90.7
5Tr
opic
al S
avan
nah
Type
1748
623
885
.34
79.9
712
2.80
Sem
i Arid
Ste
ppe
Type
2662
4784
.78
80.2
487
.71
Hot
Des
ert
Type
-0
--
-M
onso
on T
ype
with
Dry
Win
ters
1555
217
387
.21
75.0
099
.00
Col
d H
umid
Win
ters
with
Sho
rt33
85
87.1
384
.35
90.1
0Su
mm
ers
Pola
r Ty
pe50
311
90.0
388
.25
92.0
03.
POL
ITIC
AL
DIV
ISIO
N O
F IN
DIA
I.N
ORT
H I
ND
IAA
.W
este
rn H
imal
aya
(S. N
o. 1
, 2)
1.Ja
mm
u an
d K
ashm
ir89
514
90.7
188
.25
99.0
02.
Him
acha
l Pr
ades
h16
7919
89.5
088
.01
94.1
53.
Punj
ab19
94
90.6
987
.30
93.9
04.
Cha
ndig
rah
UT
-0
--
-5.
Har
yana
-0
--
-6.
Del
hi U
T10
01
88.9
588
.95
88.9
5B
.C
entr
al H
imal
aya
(S. N
o. 7
, Eig
ht D
istr
icts
of
Utta
r Pr
ades
h)7.
Utta
r Pr
ades
h31
8639
87.2
780
.80
92.8
38.
Raj
asth
an72
25
86.5
786
.34
87.4
0II
.WES
T IN
DIA
9.G
ujar
at31
6030
83.9
981
.40
86.1
810
.Mah
aras
htra
5440
101
84.8
379
.97
122.
8011
.Goa
, Dam
an a
nd D
iu U
T-
0-
--
12.D
adra
and
Nag
ar H
avel
i U
T-
0-
--
III.
EAST
IN
DIA
C.
East
ern
Him
alay
a (S
. No.
13
to 2
0 an
d D
arje
elin
g D
istr
ict
of W
est
Beng
al)
13.A
runa
chal
Pra
desh
338
587
.13
84.3
590
.10
14.A
ssam
4104
4385
.29
79.6
591
.23
15.N
agal
and
704
1483
.89
75.0
097
.37
16.M
anip
ur10
01
88.1
588
.15
88.1
517
.Miz
oram
401
90.5
090
.50
90.5
018
.Tri
pura
312
588
.73
87.3
290
.72
19.M
egha
laya
860
1184
.99
82.0
088
.89
20.S
ikki
m80
187
.75
87.7
587
.75
21.W
est
Ben
gal
3653
3088
.43
82.9
891
.68
Part
icul
ars
Subj
ects
No.
of
Faci
al I
ndex
stud
ied
stud
ies
Mea
nM
in M
ax22
.Bih
ar33
6933
86.7
481
.59
92.1
023
.Oris
sa30
8139
84.8
880
.59
95.3
0IV
.CEN
TRAL
IN
DIA
24.M
adhy
a Pr
ades
h21
8929
87.4
580
.45
90.5
8V.
SOU
TH I
ND
IA25
.Kar
nata
ka18
4039
83.9
980
.24
87.6
026
.And
hra
Prad
esh
490
884
.39
82.7
687
.30
27.T
amil
Nad
u15
84
87.6
383
.50
89.9
428
.Ker
ala
901
1390
.01
82.1
011
0.99
29.P
ondi
cher
ry U
T12
668
88.7
486
.99
90.7
5VI
.ISL
AND
S30
.Lak
shad
wee
p U
T-
0-
--
31.A
ndm
an I
slan
ds a
nd22
283
.48
83.3
883
.54
Nic
obar
Isl
ands
UT
574
686
.20
82.0
888
.91
3A. Z
ON
ES
OF
IND
IAI.
Nor
th I
ndia
6781
8288
.33
80.8
099
.00
II.
Wes
t In
dia
8600
131
84.5
279
.97
122.
80II
I.Ea
st I
ndia
1664
118
386
.27
75.0
097
.37
IV.
Cen
tral
Indi
a21
8929
87.4
580
.45
90.5
8V.
Sou
th I
ndia
4655
7286
.61
80.2
411
0.99
VI.
Isla
nds
596
886
.10
82.0
888
.91
IND
IA (
TOTA
L)39
462
505
86.3
475
.00
122.
803B
. RE
GIO
NS
OF
HIM
AL
AYA
A.
Wes
tern
Him
alay
a25
7433
89.9
288
.01
99.0
0B
.C
entr
al H
imal
aya
659
1087
.71
86.2
689
.15
C.
East
ern
Him
alay
a66
3882
85.4
775
.00
97.3
7H
IMA
LAYA
(TO
TAL)
9871
125
86.7
875
.00
99.0
0N
ON
-HIM
ALA
YAN
REG
ION
S29
591
380
86.2
079
.97
122.
804.
ET
HN
IC G
RO
UP
A.
ZON
ES O
F IN
DIA
1.N
ORT
H I
ND
IAC
aste
2781
2887
.29
80.8
090
.63
Sche
dule
d C
aste
207
488
.53
87.8
692
.83
Sche
dule
d Tr
ibe
1344
1888
.53
86.2
692
.29
Com
mun
ity24
4932
89.3
786
.32
99.0
0II
.WES
T IN
DIA
Cas
te26
6453
83.6
679
.97
92.4
1Sc
hedu
led
Cas
te46
28
81.7
480
.71
84.2
9Sc
hedu
led
Trib
e14
3620
86.6
980
.24
122.
80

347GENETICS OF CASTES AND TRIBES OF INDIA: SOMATOMETRYTa
ble
4: C
ontd
......
Part
icul
ars
Subj
cect
sN
o. o
fFa
cial
Ind
exst
udie
dst
udie
sM
ean
Min
Max
Com
mun
ity40
3850
84.6
380
.18
120.
60II
I. EA
ST I
ND
IAC
aste
3504
4187
.95
82.4
191
.68
Sche
dule
d C
aste
2679
2486
.80
80.7
591
.41
Sche
dule
d Tr
ibe
8835
101
85.2
975
.00
97.3
7C
omm
unity
1623
1787
.05
83.9
591
.43
IV.C
ENTR
AL I
ND
IAC
aste
104
288
.98
88.3
089
.61
Sche
dule
d C
aste
-0
--
-Sc
hedu
led
Trib
e20
3526
87.3
180
.45
90.5
8C
omm
unity
501
89.8
389
.83
89.8
3V.
SOU
TH I
ND
IAC
aste
1509
3086
.17
80.2
490
.75
Sche
dule
d C
aste
543
1083
.21
80.3
887
.66
Sche
dule
d Tr
ibe
854
1389
.49
83.5
011
0.99
Com
mun
ity17
4919
86.6
580
.65
89.7
4VI
.ISL
AND
SC
aste
-0
--
-Sc
hedu
led
Cas
te-
0-
--
Sche
dule
d Tr
ibe
596
886
.10
82.0
888
.91
Com
mun
ity-
0-
--
IND
IA Cas
te10
562
154
86.4
579
.97
92.4
1Sc
hedu
led
Cas
te38
9146
85.7
980
.38
92.8
3Sc
hedu
led
Trib
e15
100
186
86.2
675
.00
122.
80C
omm
unity
9909
119
86.5
880
.18
120.
60B
. RE
GIO
NS
OF
HIM
AL
AYA
A.
Wes
tern
Him
alay
aC
aste
575
590
.12
89.7
590
.60
Sche
dule
d C
aste
-0
--
-Sc
hedu
led
Trib
e72
69
89.1
388
.01
92.0
0C
omm
unity
1273
1990
.29
88.2
599
.00
B.
Cen
tral
Him
alay
aC
aste
602
88.8
888
.50
89.1
5Sc
hedu
led
Cas
te-
0-
--
Sche
dule
d Tr
ibe
280
487
.08
86.2
687
.75
Com
mun
ity31
94
88.0
587
.25
88.7
5C
. Ea
ster
n H
imal
aya
Cas
te10
12
87.5
484
.06
91.2
3Sc
hedu
led
Cas
te10
9811
85.3
083
.90
87.7
2Sc
hedu
led
Trib
e45
5259
85.3
275
.00
97.3
7C
omm
unity
887
1086
.18
83.9
590
.25
5. T
RA
DIT
ION
AL
OC
CU
PAT
ION
Prie
stho
od34
8351
86.0
380
.80
91.6
8
Part
icul
ars
Subj
cect
s
No.
of
Faci
al I
ndex
stud
ied
stud
ies
Mea
nM
in M
axW
arfa
re20
3019
87.9
383
.02
91.5
4Tr
ade
and
Com
mer
ce70
911
87.5
181
.37
90.5
6A
gric
ultu
re78
113
86.2
182
.40
88.9
5A
nim
al H
usba
ndry
193
486
.76
82.7
393
.90
Art
isan
s38
54
85.3
082
.52
87.8
4M
enia
l W
orke
rs28
9928
86.0
480
.71
91.4
1N
o In
form
atio
n28
982
375
86.2
975
.00
122.
806.
LA
NG
UA
GE
GR
OU
PI.
AUST
RO-A
SIAT
IC F
AMIL
YM
on K
hmer
Gro
up13
5415
85.3
382
.00
88.9
1M
unda
Gro
up40
5635
85.7
980
.59
95.3
0II
.TIB
ETO
-CH
INES
E FA
MIL
Y(i
) Si
ames
e-C
hine
se S
ub-F
amily
Tai
Gro
up85
185
.81
85.8
185
.81
(ii)
Tib
eto-
Burm
an S
ub-F
amily
Bho
tia G
roup
1508
1888
.69
86.2
692
.00
Him
alay
an G
roup
216
489
.49
87.7
592
.29
Nor
th E
ast
Fron
tier
Gro
up96
412
86.9
783
.95
90.2
5B
odo
Gro
up17
8818
85.4
580
.27
91.1
5N
aga
Gro
up87
216
83.0
975
.00
97.3
7K
achi
n G
roup
-0
--
-K
uki
Chi
n G
roup
181
488
.56
83.5
490
.50
III.
DRA
VID
IAN
FAM
ILY
Sout
h D
ravi
dian
Gro
up45
1071
86.6
080
.24
110.
99C
entra
l D
ravi
dian
Gro
up18
7129
86.0
880
.45
90.5
8N
orth
Dra
vidi
an G
roup
752
787
.37
81.8
789
.45
IV.I
ND
O-E
URO
PEAN
FAM
ILY
Dar
d G
roup
502
590
.29
89.7
691
.88
Nor
th W
este
rn G
roup
301
81.4
081
.40
81.4
0So
uthe
rn G
roup
5110
9184
.23
79.9
712
0.60
East
ern
Gro
up11
4919
85.2
180
.75
89.6
1B
ihar
i61
7063
87.5
583
.90
91.6
8C
entra
l G
roup
7561
8486
.63
80.8
012
2.80
Paha
ri G
roup
561
890
.38
89.5
094
.15
Uns
peci
fied
-0
--
-O
ther
Lan
guag
es22
24
85.4
183
.38
86.3
7N
o In
form
atio
n-
0-
--
6A. L
AN
GU
AG
E F
AM
ILY
I. A
ustro
Asi
atic
Fam
ily54
1050
85.6
880
.59
95.3
0II
. Ti
beto
Chi
nese
Fam
ily56
1473
86.4
775
.00
97.3
7II
I.D
ravi
dian
Fam
ily71
3310
786
.54
80.2
411
0.99
IV. I
ndo
Euro
pean
Fam
ily21
083
271
86.4
279
.97
122.
80O
ther
Lan
guag
es22
24
85.4
183
.38
86.3
7N
o In
form
atio
n-
0-
--

348 M. K. BHASIN
the value of facial index is above 88(leptoprosopic) who are inhabiting Western,Central Himalayas as also among Lepcha, Bhutiasof Sikkim state, whereas from Eastern Himalayanregion the value of index varies between 84.0 and87.9 (mesoprosopic) as observed among thespeakers of Mon Khmer group (85.33) of Austro-Asiatic and North East Frontier group (86.97),Bodo group (85.45) and Naga group (83.09) ofTibeto-Chinese languages except Kuki Chingroup speakers (88.56). In the Southern groupsof Indo-European language speakers the valueof index is low as observed from the West ascompared to the Eastern group (85.21) and Biharigroup from Eastern India (87.55). Among thespeakers of Munda group the value of index iseither low (85.79) as compared to North Dravidiangroup (87.37) or similar to Central Dravidian group,who are mostly tribals. However, in general, thedifferences among the speakers of differentlanguages are not significant (Bhasin et al. 1994;Bhasin and Walter, 2001).
The mesoprosopic facial index is observedamong various population groups of India andfrom all the zones of India except North India(Leptoprosopic). In the Himalayan regionmesoprosopic type is predominant except inWestern Himalayan region where leptoprosopictype is found. The value of index is high in theHimalayan region and it gradually starts decliningtowards South. Leptoprosopic facial index isobserved among caste groups from West Bengaland Tamil Nadu, Kerala and Pondicherry of SouthIndia. Euryprosopic type of facial index isobserved among caste groups of Gujarat andscheduled caste groups of West and South Indiazones. However, generally a high frequency isobserved among Community or Caste>Caste orCommunity>Scheduled Tribe> Scheduled Casteexcept from West and South India where highvalue is observed among scheduled tribes. Nocorrelations are observed with various climaticfactors and altitude by different ethnic groups.The differences observed in the various languagefamilies for facial index are not significant(Dravidian>Tibeto-Chinese>Indo-European>Austro-Asiatic).
Considering India as a whole, the biogeneticaltraits distribution is seen to follow a pattern thatmight have been expected from the complexstructure of its people. Indian populations areliving in different natural and climatic regions.The composition of Indian populations is
multiethnic consisting of elements ofautochthonous (Pre-Dravidian/Australoids),Caucasoids (Dravidians) who are inhabitingSouth of India and to some extent Central India,Caucasoids (mostly Aryans) in the North andNorthwest India, Mongoloids in the Himalayanregion, mostly in North East and East India andNegrito/Negroids in the Andaman Islands. Exceptfor the Caucasoids, the other three groups mainlyinvolve tribal populations and are numericallyrelatively smaller. The Caucasoids, Mongoloidsand autochthonous elements have interbred invarying degrees to give mixtures which aredifficult to unravel. The peoples are categorizedinto caste (on the basis of their traditionaloccupation, who are considered to have come insuccessive waves of immigration of known andsometimes unknown antiquity) and tribal (mostof them are considered to be original inhabitantsof India). The existence of caste and tribal systemsmade the Indian population genetically isolated.Indians speak different languages of variousfamilies—Austro-Asiatic, Tibeto-Chinese,Dravidian and Indo-European, which arerepresented within specific boundaries. Inaddition other factors that have influenced thedistribution of biological traits in India are geneticdrift, mutation and selection.
It is rather difficult to evaluate the effect ofenvironmental factors on the somatometric traitsas observed from the foregoing text. Generally inthe Himalayan region, the populations are of lowermedium stature, head and nose indices aremesocephalic and mesorhinae with leptoprosopicfacial index, but the differences are observedbetween the peoples from Western and CentralHimalayas and that of Eastern Himalayas, whichare due to genetic composition i.e. different racialelements present among these populations (Table5). Again from the Indus-Ganga-Brahmaputraplains region the differences are well markedbetween the population groups from the states ofPunjab, Haryana, Uttar Pradesh (North India) andthat of Bihar and West Bengal (East India) whichare due to different racial elements present in thesetwo regions. Further in latter two states, along withOrissa and Madhya Pradesh (peninsular region),the scheduled tribes are in majority and havingAustraloid (Pre-Dravidian) racial element showsignificant differences with the other ethnic groupswho are predominantly Caucasoid (Aryan).Towards West of India also scheduled tribes whospeak Indo-European languages show significant

349GENETICS OF CASTES AND TRIBES OF INDIA: SOMATOMETRY
Particulars Stature Cephalic Index Nasal Index Facial IndexINDIA L. Med. (163.06) Meso (76.06) Meso(78.53) Meso (88.34)Natrual Region
Himalayan L. Med. (162.13) Meso (76.38) Meso (70.68) Lepto (88.33)Mountain ComplexIndus-Ganga-. Med. (164.15) Dolicho (75.87) Meso (72.13) Meso (87.00)Brahmaputra PlainsPeninsular Plateau L. Med. (162.77) Meso (76.07) Meso (78.01) Meso (85.64)Islands Short (155.50) Meso (78.64) Meso (79.98) Meso (86.10)
Zones of IndiaNorth India Med. (164.70) Dolicho (73.65) Meso (70.13) Lepto (88.33)West India L. Med. (163.09) Meso (78.24) Meso (75.86) Meso (84.52)East India L. Med. (163.05) Meso (76.82) Meso (77.06) Meso (86.27)Central India L. Med. (160.32) Dolicho (74.96) Meso (82.09) Meso (87.45)South India L. Med. (161.23) Meso (76.07) Meso (77.99) Meso (86.61)Islands Short (155.50) Meso (78.64) Meso (79.98) Meso (86.60)
Regions of HimalayaWestern Himalaya L. Med. (163.38) Dolicho (74.00) Lepto (65.51) Meso (89.92)Central Himalaya L. Med. (163.13) Meso (76.71) Meso (72.85) Meso (87.71)Eastern Himalaya L. Med. (161.20) Meso (78.09) Meso (75.56) Meso (85.47)
Ethnic GroupsCaste Med. (165.25) Meso (76.20) Meso (74.78) Meso (86.45)Scheduled Caste L. Med. (162.11) Dolicho (75.96) Meso (75.61) Meso (85.79)Scheduled Tribe Short (157.75) Dolicho (75.81) Meso (74.49) Meso (86.26)Community Med. (164.18) Meso (76.17) Meso (71.57) Meso (86.58)
Language FamilyAustro-Asiatic Short (158.89) Dolicho (75.63) Meso (81.72) Meso (85.68)FamilyTibeto-Chinese L. Med. (161.37) Meso (77.67) Meso (73.87) Meso (86.47)FamilyDravidian Family L. Med. (161.34) Dolicho (75.52) Meso (77.55) Meso (86.54)Indo-European Med. (164.52) Dolicho (75.99) Meso (74.23) Meso (86.42)Family
L. = Lower, Med. = Medium
Table 5: Classification of stature and indices
Mean Annual TemperatureCaste 0.025 0.098 0.1261 0.027Scheduled Caste -0.110 0.081 0.033 -0.007Scheduled Tribe -0.1512 -0.2093 0.2673 -0.107Community 0.002 0.084 0.2052 -0.4703
Total 0.0681 0.027 0.0821 -0.1793
Mean Annual RainfallCaste 0.023 -0.1411 0.011 0.3143
Scheduled Caste -0.2492 0.2472 -0.031 0.4002
Scheduled Tribe -0.2723 0.3173 -0.1572 0.052Community -0.1872 0.078 0.016 0.1891
Total -0.3313 0.055 0.1263 0.1763
Mean Annual HumidityCaste -0.052 -0.028 0.088 0.1901
Scheduled Caste -0.2532 0.3213 -0.025 0.215Scheduled Tribe -0.3083 0.2523 -0.1702 -0.040Community -0.2062 0.1561 0.129 0.2612
Total -0.2963 0.1253 0.0932 0.1031
Mean AltitudeCaste -0.089 0.065 -0.010 -0.1691
Scheduled Caste 0.1771 -0.2362 0.174 -0.4182
Scheduled Tribe 0.2013 0.078 -0.1732 0.045Community -0.068 -0.086 -0.021 0.1921
Total -0.047 -0.022 0.015 -0.0041. Significant at P < 0.05 2. Significant at P < 0.01 3. Significant at P < 0.001
Table 6: Correlations with climatic factors and ethnic groups
Ethnic groups SomatometryStature Cephalic Index Nasa Index Facial Index

350 M. K. BHASIN
differences with other ethnic groups. As one movestowards South India, there are a number ofscheduled tribes which are numerically smaller ascompared to the tribes from the adjoining states ofWest India, Madhya Pradesh and Orissa. Thoughthey speak Dravidian languages, they are showingsignificant differences from other ethnic groups ofSouth India who are Caucasoids (Dravidian). Itappears that they are basically Australoid (Pre-Dravidian) having some admixture with Caucasoid(Dravidians) and adopted their language. FromIslands, Andaman is inhabited by Andamaneseand Onges who are considered to be Negritos andNicobarese and Shompens, who are havingMongoloid affinities. The differences which areobserved among the various populations of Indiaare due to different racial elements present amongthem and the division of the peoples into casteand tribal systems i.e. different ethnic groups. Thedifferences are well marked between tribals andother populations whereas among caste, scheduledcaste and community the differences are invariablyin relation to their proximate category e.g. betweencastes and scheduled castes between communitiesand castes etc. This may be explained as castesystem is based on traditional occupational groupsand it has been observed that there is gene flowamong them as the differences observed betweenvarious occupational groups are not high, whereascommunities are those which are not identifiableon the basis of caste system or are not denoted astribes and which are much more heterogeneousthan either a caste group or a tribe. Further thedifferences observed between scheduled tribesand other ethnic groups can also be explained bythe fact that they are the oldest inhabitants in theirecological niches as compared to other ethnicgroups who have migrated to this area only a fewthousand years back. The effect of different climaticfactors (temperature, rainfall, humidity) and altitudeon stature and different indices in relation to ethnic
groups shows significant differences butcorrelations observed are not high.
The differences observed among Indianpopulations are mainly due to the presence ofvarious racial elements and prevailing of ethnicgroups among them. Differences due to climaticfactors are observed but no association isestablished between biological traits and climaticfactors since the values of correlations observedare not high.
3. GENETIC DISTANCES
For anthropometric measurement (stature) andindices the number of investigations is maximumfrom East India (about 45 per cent for EasternHimalayan region) followed by North and SouthIndia.
The distribution of the available studiesshows that about 30 per cent of the total reportsare on scheduled tribes followed by castes,communities and scheduled castes. Again in allthe zones of India, in general, more studies areavailable among scheduled tribes (around 35 percent), followed by castes (about 26 per cent),communities and scheduled castes (about 13 percent) except from North India where thedistribution is high in castes, communities,scheduled castes followed by scheduled tribes.Further about 50 per cent of the caste groupsstudied from India belong to North India zoneand scheduled tribes to East India zone.
In the language families—the maximumstudies are from Indo-European family followedby Dravidian, Tibeto-Chinese and Austro-Asiaticfamilies.
The dendrograms generated on the basis ofanthropometric for various Indian populationssubdivided by zones (North, West, East, Centraland South India) are represented in figure 6. Thetrend observed in the dendrogram is that West,
Fig. 6. Dendrograms of anthropometric traits according to different zones of India(after Bhasin and Walter 2001)
36 32 28 24 20 16 12 8 4ZONES

351GENETICS OF CASTES AND TRIBES OF INDIA: SOMATOMETRY
East, South and Central India together form onemajor cluster and separating out from them isNorth India. It is noted that from North India,maximum studies are available among castes andcommunities and it has been reported by Balakri-shnan (1978) that considerable homogeneity hasbeen demonstrated among populations of North-West India and it has been further pointed out byBalakrishnan (1981) that homogeneity isincreased in certain regions by excluding the tribalpopulations.
Figure 7 shows dendrograms for variousIndian populations based on social ranking. It isobserved that caste group is invariably clusteredwith the scheduled caste and the community,while the scheduled tribe is distinct from all. Anexplanation of this phenomenon can be found inthe fact that the scheduled castes may have inthem a substantial contribution of gene flow fromthe higher castes in past generations (Majumdar,1965). Since the communities are grouped on thebasis of religion, occupation etc. they representa fairly heterogeneous group. The distribution ofmajor ethnic components may be present in theproportions similar to those observed in castegroups as the groups forming the communities inone way or the other are the offshoot of the majorIndian ethnic stock (mainly the groups based onVarna system of Manu) at different periods oftime in Indian history. The scheduled tribes, whorepresent mainly the Australoid (Pre-Dravidian),or Mongoloid strain, understandably are distinctfrom all the other groups subdivided by socialranking. Similar findings have also been reportedby many other investigators (for exampleBalakrishnan 1978; Bhasin et al. 1986; Char et al.1989; Chakraborty et al. 1986; Danker-Hopfe et al.1988; Mukherjee et al. 1979, 1989; Roychoudhury1984; Saha et al. 1976; Walter et al. 1993).
The dendrogram for different Indianpopulations subdivided by language families arepresented in figure 8. As observed, from thedendrograms, the speakers of Tibeto-Chineselinguistic group show small differences with theIndo-European linguistic group and they are closerto Austro-Asiatic and Dravidian linguistic groups.From this dendrogram it is reasonable to believethat the current population of Indian Region is theproduct of differential admixture of Austro-Asiaticwith Dravidian, Dravidian with Indo-Aryan andTibeto-Chinese with Indo-European and also withDravidian and Austro-Asiatic.
Clustering of the population groups of India
subdivided by geographical proximity and socialranking on the basis of anthropometric distances isclearly seen in the dendrogram presented in figure 9.
It has been observed that except for NorthIndia, where all the four ethnic groups fall nearerto each other in social rank— caste, communityor/and scheduled caste and scheduled tribe whilefor the rest of the zones it is generally observedthat caste, scheduled caste and communitygroups are closer to each other, whereasscheduled tribe groups are nearer to one another.The ethnic groups of West India are closer toSouth India as observed before and scheduledtribes of East India and South India. Thus, overallthe various ethnic groups of North India areshowing less difference, different ethnic groupsof West India and South India are falling nearerto each other and scheduled tribes of East Indiaand South India are showing small distances and,in general, scheduled tribes are falling apart fromthe other ethnic groups.
In the dendrogram generated on the basis ofanthropometric traits (Fig. 10) for Indianpopulations classified by language families andsocial-ranking it has been observed that Tibeto-Chinese join the main cluster which consists ofIndo-European and Dravidian speaking peopleand Austro-Asiatic (Scheduled Tribe) make acluster with Dravidian (Scheduled Tribe) and Indo-European (Scheduled Tribe). This isunderstandable, since as reported earlier theTibeto-Chinese speakers are dominating EasternHimalayan region in Eastern India and this zoneis the meeting ground of three ethnic groups:people with Mongoloid elements from theNortheastern region, non-tribals of Caucasoidorigin from Northwestern region and tribals fromthe Southern and Southwestern regions.Whereas Austro-Asiatic (Scheduled Tribe) makea cluster with Dravidian (Scheduled Tribe) andIndo-European (Scheduled Tribe) and these areshowing small differences with the Tibeto-Chinese (Scheduled Tribe) speakers. It has alreadybeen established that Austro-Asiatic speakingtribals are predominating in Bihar, Orissa, as wellas also in Central India, Assam and NicobarIslands, and admixture has taken place amongthem and other linguistic groups—Dravidian,Indo-European and Tibeto-Chinese, as well asbetween these groups in varying degrees. TheIndo-European and Dravidian speakers areshowing small distances and it has beensuggested that the Dravidians who entered

352 M. K. BHASIN
Fig. 8. Dendrograms of anthropometric traits according to different language families of India(after Bhasin and Walter 2001)
Fig. 9. Dendrogram of anthropometric traits according to different zones and ethnic groups of India(after Bhasin and Walter 2001)
Fig. 7. Dendrograms of anthropometric traits according to different ethnic groups of India(after Bhasin and Walter 2001)
36 32 28 24 20 16 12 8 4
36 32 28 24 20 16 12 8 4
32 28 24 20 16 12 8 4

353GENETICS OF CASTES AND TRIBES OF INDIA: SOMATOMETRY
Indian region early and moved southward withthe arrival of Aryans have had admixture withthem.
The above discussion was based on thedendrograms generated from different Indianpopulations subdivided by geographical regions,social status and linguistic division that have beenconsidered separately as well as in combinationviz., geographical regions/zones with social ranksand social ranks with linguistic groups. From thedendrograms derived from various geographicalregions/zones (North, West, East, Central andSouth India) it has been observed that there is ageneral tendency of correlation betweenmorphological distance with geographic distance.The dendrograms based on social ranking andmorphological traits show that the scheduledtribes are distant from all the other groups andcaste group is invariably clustered with thescheduled caste and the community, which showsthat scheduled caste population may have in thema substantial trace of gene flow from upper castesor/and from communities, who are grouped onthe basis of religion, occupation, region, etc.Considering now India as a whole, the biological
trait distribution is seen to follow a simpler patternthan that might have been expected from thecomplex history of its people. The scheduled tribegroups stand out as a uniform and uniquepopulation, showing less similarity with theneighbouring peoples and certainly much lesswhen compared to the caste groups of India.From the dendrograms based on differentlinguistic groups, it has been observed thatAustro-Asiatic, Dravidian and Indo-Europeanlinguistic categories form one cluster and Tibeto-Chinese category stand out separately. It may beconcluded that the current population of India isthe product of differential admixture betweenthree distinct population entities viz., Austro-Asiatic (Australoid or Pre-Dravidian), Dravidianand Indo-European (Caucasoid) linguisticgroups, whereas the Tibeto-Chinese linguisticgroup along the northeastern and northernperipheries of the subcontinent is the product ofadmixture between Mongoloids and Australoidand Caucasoid populations in varying degrees.
The migration of early Homo sapiens sapiensfrom Africa to Asia and Pacific might be throughIndian subcontinent. Modern humans are believ-
Fig. 10. Dendrogram of anthropometric traits according to different language families and ethnicgroups of India (after Bhasin and Walter 2001)
28 24 20 16 12 8 4

354 M. K. BHASIN
ed to have arisen in Africa and subsequentlymigrated to the rest of the world beginningaround 100, 000 years ago. India may be in thepath of this and subsequent migration eventsout of Africa and thus these migrants were theancestors of the original inhabitants of Indiansubcontinent (Mourant 1983; Cavalli-Sforzaet al. 1994).
Descendants of Paleolithic expansion intoIndia believed to have contributed substantiallyto tribal populations, which constitute 8.1percent of the total population of India (Censusof India, 1991).
Later migration events spread Austrics –Austro-Asiatic (may be either from Indo-Chinaand South China or a very off-shoot of theMediterranean people who came to India fromthe West even before the Dravidian), Dravidian,Tibeto-Chinese (the area of the speechesstretches from Baltistan in the West to the northeastern frontiers of the country and furtherreaching up to southern most portions of Assam)followed by Indo-European speakers in to theIndian subcontinent. The Indo-Europeanspeakers introduced the caste system, a socialhierarchy that strictly governs marriage andmating practices. The later migrants i.e., Indo-European speakers of North India had lessinfluence on Dravidian speakers of South India,therefore both the groups are genetically andlinguistically distinct from each other (Bhasin etal., 1994; Bhasin and Walter 2001).
The genetic diversity of caste and tribalpopulation groups is well established (Bhasin etal. 1994, Bhasin and Walter 2001; Cordaux et al.2004).
NOTES
1. Three more states have come into existence recently.Now Bihar has been divided into Bihar andJharkhanda; from Madhya Pradesh have resultedthe states of Madhya Pradesh and Chattisgarh; theearlier state of Uttar Pradesh is now divided intoUttar Pradesh and Uttaranchal. The states in italicsare newer ones. India at present comprises 28 states.
2. The frequency distributions for the State of Goa andUnion Territory of Daman and Diu have been listedunder Goa, Daman and Diu.
REFERENCES
Balakrishnan V 1978. A preliminary study of geneticdistances among some populations of the Indiansub-continent. J Hum Evol, 7: 67-75.
Balakrishnan V 1981. Genetic distance studies in India.Acta Anthropogenet, 5: 57-65.
Basu A, Majumdar PP, Ghosh AK and Biswas SK 1980.Human biological variations in Asia with specialreference to India. pp. 197-224. In: J. Hiernaux(Ed.). Human Biological Diversity. Paris: Masson.
Beals KL, Smith CL, Dodd SM 1984. Brain size, cranialmorphology, climate and time machines. CurrAnthropol, 25: 301-330.
Bhasin MK 1988. Biology of the Peoples of Indian Region(Bangladesh, Bhutan, India, Maldives, Nepal,Pakistan, Sri Lanka). A Classified andComprehensive Bibliography. Delhi: Kamla-RajEnterprises.
Bhasin MK 2006a. Genetics of Castes and Tribes of India:Indian Population Milieu. Int J Hum Genet, 6(3):233-274.
Bhasin MK 2006b. Genetics of Castes and Tribes of India:Glucose-6-Phosphate Dehydrogenase Deficiency andAbnormal Haemoglobins (HBS and HBE). Int J HumGenet, 6(1): 49-72.
Bhasin MK 2006c. Genetics of Castes and Tribes of India:A Review of Population Differences in Red and GreenColour Vision Deficiency in India. Int J Hum Genet,6(1): 81-88.
Bhasin MK 2006d. Genetics of Castes and Tribes of India:Taste Sensitivity. Int J Hum Genet, 6(2): 145-151
Bhasin MK, Walter H 2001. Genetics of Castes and Tribesof India. Delhi: Kamla-Raj Enterprises.
Bhasin MK, Walter H 2002 Genetics of Castes and Tribesof India: Serum Protein Polymorphisms KM andGM Systems. Int J Hum Genet, 2(2): 119-138.
Bhasin MK, Walter H, Danker-Hopfe H 1994. Peopleof India. An Investigation of Biological Variabilityin Ecological, Ethno-Economic and LinguisticGroups. Delhi: Kamla-Raj Enterprises.
Bhasin MK, Walter H and Danker-Hopfe H 1992. TheDitribution of Genetical, Morphological andBehavioural Traits among the People of IndianRegion (Bangladesh, Bhutan, India, Maldives,Nepal, Pakistan, Sri Lanka). Kamla-Raj Enterprises,Delhi.
Bhasin MK, Walter H, Chahal SMS, Bhardwaj V, SudhakarK, Danker-Hopfe H, Dannewitz A, Singh IP, BhasinV, Shil AP, Sharma MB, Wadhavan D 1986. Biologyof the people of Sikkim, India: 1. Studies in thevariability of genetic markers. Z Morph Anthrop,77: 49-86.
Brace CL 1964. A nonracial approach towards theunderstanding of human diversity. In: The Conceptof Race. A. Montagu (Ed.). New York: The FreePress of Glencoe, pp. 103-152.
Brace CL, Hunt KD 1990. A non-racial craniofacialperspective on human variation: A (ustralia) to Z(uni). Am J Phys Anthrop, 83: 341-460.
Brace CL, Smith SL, Hunt KD 1991. What big teeth youhad Grandma! Human tooth size, past and present.In: Advances in Dental Anthropology. M.A. Kelleyand C.S. Larsen (Eds.). New York: Wiley Liss, pp.33-57.
Büchi, EC 1968. Rassengeschichte des indopakistanischenSubkontinents. In: K Saller (Hrg.), Rassengeschichteder Menschheit, 1. Lieferung. München-Wien:Oldenbourg, pp. 109-184.
Cavalli-Sforza LL, Piazza A, Menozzi P 1994. TheHistory and Geography of Human Genes. Princeton,

355GENETICS OF CASTES AND TRIBES OF INDIA: SOMATOMETRY
New Jersey: Princeton University Press.Census of India 1991. Series-1, Paper 1 of 1991.
Provisional Population Totals. New Delhi: Officeof the Registrar General & Census Commissioner,India.
Chakraborty R, Walter H, Mukherjee BN, Malhotra KC,Sauber P, Banerjee S, Roy M 1986. Genedifferentiation among ten endogamous groups ofWest Bengal, India. Am J Phys Anthrop, 71: 295-309.
Char KSN, Lakshmi P, Gopalam KB, Sastry JG, Rao PR1989. Genetic differentiation among someendogamous populations of Andhra Pradesh, India.Am J Phys Anthrop, 78: 421-429.
Cordaux R, Aunger G, Bentley G, Nazidze I, SirajuddinSM, Stoneking M 2004. Independent orgins of Indiancaste and tribal paternal lineages. Curr Biol, 14:231-235.
Corgnier F 1981. Climate and anthropometric variationsin Europe and the Mediterranean area. Ann HumBiol, 8: 99-107.
Danker-Hopfe H, Das BM, Walter H, Das PB, Das R1988. Anthropological studies in Assam, India. 6.Differentiation processes among Assamesepopulations. Anthrop Anz, 46: 159-184.
Davies A 1932. A re-survey of the morphology of thenose in relation to climate. J Roy Anthrop Inst, 62:337-359.
Devdas RP, Easwaran PP, Ponnammal, K 1977. Diet andnutrition in the first year of life. Part II. Cross-sectional and semi-longitudinal study of physicalmeasurements. Ind J Nutr Diet, 14: 361-365.
Dutta PC 1978. The Great Andamanese Past andPresent. Calcutta: Anthropological Survey of India.
Easwaran PP, Saktivelmani A, Devdas RP 1974. Heightsand weight of 7, 8 and 9 year old children in selectedschools of Coimbatore city. Ind J Nutr Dietet, 11:63-71.
Eickstedt E Frh v 1934. Rassenkunde und Rassen-geschichte der Menschheit. Stuttgart: Ferdinand EnkeVerlag.
Eickstedt E Frh v 1952. Rassentypen und Typendynamikvon Asien. In: 1. F. Valjavec (Ed.). Historia Mundi.Volume. München, pp. 147-166.
Ganguly P 1976. Physical Anthropology of theNicobarese. Memoir No. 34, Calcutta: Anthropo-logical Survey of India.
Ganguly P 1979. Progressive decline in stature in India.A study of sixty population groups. In: WA Stini(Ed.). Physiological and Morphological Adaptationand Evolution. The Hague: Mutton, pp. 315-337.
Gopalan C, Swaminathan MC, Krishnakumari VK Rao,HD, Vijayraghavan K 1973. Effect of caloriesupplementation on growth of undernourishedchildren. Am J Clin Nutr, 26: 563-566.
Guha BS 1935. Racial affinities of the people of India.Census of India, 1931. Report,Vol. 1, Pt. IIIEthnographical. Sec. A. Government of India, Simla.
Harrison GA, Küchemann CF, Moore CMAS, Boyce, AJBaju T, Mourant AE, Godber MJ, Glasgow BG, KopecAC, Tills D, Clegg, EJ 1969. The effects ofaltitudinal variation in Ethopian populations. PhilTrans R Soc, B 256: 147-182.
Hiernaux J, Froment, A 1976. The correlations betweenanthropological and climatic variables in sub-SaharanAfrica. Revised estimates. Hum Biol, 48: 757-767.
Hornwell J 1923. The origins and ethnologicalsignificance of Indian boat designs. Mem Asiat SocBeng, 7: 139-256.
Hoyme LE 1965. The nasal index and climate: A spuriouscase of natural selection in man. Abstract. Am JPhys Anthrop, 23: 336-337.
Kaplan BA 1954. Environment and Human Plasticity.Am Anthrop, 56: 780-800.
Karve I, Dandekar, VM 1951. Anthropometric Measure-ments of Maharashtra. Deccan College MonographS. No. 8. Poona: Decean College.
Karve I, Malhotra, KC 1968. A biological comparison ofeight endogamous groups of the same rank. CurrAnthrop, 9: 109-124.
Keith A 1936. Review of B.S. Guha’s The Racial Affinitiesof the Peoples of India. Man, 36: 28-30.
Kelso AJ 1970. Physical Anthropology: An Introduction.Philadelphia: J.B. Lippincott Co.
Knussmann R (Ed.) 1988. Anthropologie, Handbuch dervergleichenden Biologie des Menschen Band I:Wesen und Methoden der Anthropologie 1. Teil:Wissenschaftstheorie, Geschichte, morphologischeMethoden. Stuttgart, New York: Gustav Fischer
Lohman, TG, Roche, AF and Martorell, R 1988.Anthropometric Standardization Reference Manual.Illinois: Human Kinetics Books Champaign.
Mahalanobis PC 1927. Analysis of race mixture in Bengal.J. Asiat Soc Beng, 23: 301-333.
Mahalanobis PC, Majumdar DN, Rao CR 1949.Anthropometric survey of the United Provinces,1941. A statistical study. Sankhya, 9: 89-324.
Majumdar DN 1965. Races and Cultures of India. NewDelhi: Asia Publishing House, 4th Edition.
Majumdar DN and Sen AR 1949. Racial elements inGujarat. J. Gujarat Res. Soc., 11: 118.
Majumdar DN, Rao CR 1960. Race Elements in Bengal.A Quantitative Study. Calcutta: Asia Publishing House.
Malhotra KC, Balakrishnan V, Karve I 1981.Anthropometric variation in Tamil Nadu. In: L.D.Sanghvi, Balakrishnan and I. Karve (Eds.). Biologyof the People Tamil Nadu. Calcutta: Indian Societyof Human Genetics and Indian AnthropologicalSociety, pp. 50-74.
Malhotra MS 1966a. People of India, including primitivetribes. A survey on physiological adaptation, physicalfitness and nutrition. In: P.T. Baker and J.S. Weiner(Eds.). The Biology of Human Adaptability. NewDelhi: Oxford, pp. 329-355.
Martin R, Saller K 1957. Lehrbuch der Anthropologie.Volumes I and II. Gustav Fischer Verlag, Stuttgart.
Mills CA 1937. Geographic and time variations in bodygrowth and age at menarche. Hum Biol, 9: 43-56.
Mills CA 1942. Climatic effect on growth and develop-ment with particular reference to the effects oftropical residence. Am Anthrop, 44: 1-14.
Mourant AE 1983. Blood Relations, Blood Groups andAnthropology. Oxford: Oxford University Press.
Mukherjee BN, Majumdar PP, Malhotra KC, Das SK,Kate SL, Chakraborty, R 1979. Genetic distanceanalysis among nine endogamous population groupsof Maharashtra, India. J Hum Evol, 8: 567-570.
Mukherjee BN, Malhotra KC, Roy M, Banerjee S, WalterH, Chakraborty R 1989. Genetic heterogeneity andpopulation structure in eastern India: Red cell enzymevariability in ten Assamese populations. Z MorphAnthrop, 77: 287-296.

356 M. K. BHASIN
Newman MT 1953. The application of ecological rulesto the racial anthropology of the New World. Am.Anthrop., 55: 311-327.
Olivier, G 1963. Anthropological Repercussions of theCaste System. Anthropology on the March, SocialSciences Association, Madras.
Pachauri S, Marwah SM, Rao NSN 1971. A multifactorialapproach to the study of the factors influencingbirth weight in the urban community of New Delhi.Ind J Med Res, 59: 1318-1341.
Rakshit HK 1966. The Brahmans of India: Ananthropometric study. Man in India, 46: 33-58.
Rao DH, Satyanarayana K 1974. Nutritional status oftribal pre-school children of Andhra Pradesh. Ind JNutr Diet, 11: 328.
Rao DH, Satyanarayana K, Vijayaraghavan K, Sastry JG,Naidu AN, Swaminathan MC 1975. Evaluation ofthe special nutrition programme in the tribal areasof Andhra Pradesh. Ind J Med Res, 63: 652-660.
Risley H Sir 1969. The People of India. (1915). Delhi:Orient Book Reprint Corporation, Reprinted.
Roberts DF 1953. Body weight, race and climate. Am JPhys Anthrop, 11: 533-558.
Roberts DF 1973. Climate and Human Variability.Addison Wesley Module in Anthropology, 34.
Roychoudhury AK 1984. Genetic relationships of Indianpopulations. In: Human Genetics and Adaptation.Volume 1. KC Malhotra, A. Basu (Eds.). Calcutta:Indian Statistical Institute, pp. 146-174.
St. Hoyme LE, Iscan MY 1989. Determination of sexand race: Accuracy and assumptions. In: MY Iscan,KAR Kennedy (Eds.). Reconstruction of Life fromthe Skeleton. New York: Alan R. Liss, pp. 59-93.
Saha N, Kirk RL, Shanbhag S, Joshi SR, Bhatia HM 1976.Population genetic studies in Kerala and the Nilgiris(South-West India). Hum. Hered, 26: 175-197.
Sarkar SS, Deka U, Agarwal KK 1955. Brachycephaly inIndia. Man in India, 35: 257.
Shapiro HL 1939. Migration and Environment. NewYork: Oxford University Press.
Singh IP, Bhasin MK 1989. Anthropometry. Kamla-RajEnterprises, Delhi, first published in 1968.
Singh IP, Bhasin MK 2004 A Manual on BiologicalAnthropology. Delhi: Kamla-Raj Enterprises.
Spielman RS, Smouse PE 1976. Multivariate classificationof human populations. 1. Allocation of YanomamaIndians to villages. Am J Hum Genet, 28: 317-331.
Takahashi E 1971. Geographic distribution of humanstature and environmental factors- an ecologic study.Anthrop Soc Nippon, 79: 259-286.
Thomson A, Buxton LHD 1923. Man’s nasal index inrelation to certain climatic conditions. Roy AnthropInst, 53: 92-122.
Tobias, Ph V 1985.: The negative secular trend. J HumEvol, 14: 347-356.
Vijayalakshmi R, Devaki, SR 1976. Nutritional status ofexpectant mothers belonging to two different incomelevels. Ind J Nutr Dietet, 13: 63-66.
Walter H 1982. Human physique and climate. AnthropKözl, 26: 99-111.
Walter H, Bhasin MK, Danker-Hopfe H, Khanna A,Hahm U, Witt I 1993. Genetic studies on elevenpopulations of Jammu and Kashmir, India. J HumEcol, 4: 1-14.
Weiner JS 1954. Nose shape and climate. Am J PhysAnthrop, 12: 1-4.
Weiner JS, Lourie JA 1969. Human Biology. A Guide toField Methods. Oxford and Edinburg: BlackwellScientific Publications.
Weiner JS, Lourie JA 1981. Practical Human Biology.London: Academic Press.
Wolanski N 1966. The secular trend; microevolution,physiological adaptation and migration, and theircausative factors. Problems of World Nutrition. In:Proceedings of the 7th International Congress ofNutrition, Hamburg, pp. 96-108.
Wolanski N 1967. Basic problems in physicaldevelopment in man in relation to the evaluation ofdevelopment of childern and youth. Curr Anthrop,8: 35-60.
Wolpoff MH 1968. Climatic influence on the nasalaperture. Am J Phys Anthrop, 29: 405-423.
Wolpoff MH 1980. Palaeoanthropology. New York:Knopf.