Embed Size (px)
Citation preview

Genetics of type 1 diabetes with particular
focus on the major histocompatibility complex
Doctoral thesis by Morten Christoph Eike
Institute of Immunology Faculty Division Rikshospitalet,
University of Oslo, Oslo, Norway
2008

© Morten Christoph Eike, 2008 Series of dissertations submitted to the Faculty of Medicine, University of Oslo No. 711 ISBN 978-82-8072-775-6 All rights reserved. No part of this publication may be reproduced or transmitted, in any form or by any means, without permission. Cover: Inger Sandved Anfinsen. Printed in Norway: AiT e-dit AS, Oslo, 2008. Produced in co-operation with Unipub AS. The thesis is produced by Unipub AS merely in connection with the thesis defence. Kindly direct all inquiries regarding the thesis to the copyright holder or the unit which grants the doctorate. Unipub AS is owned by The University Foundation for Student Life (SiO)
TABLE OF CONTENTS
ACKNOWLEGDEMENTS .............................................................................................................................. 5
COMMONLY USED ABBREVIATIONS ....................................................................................................... 6
LIST OF PUBLICATIONS ............................................................................................................................... 7
INTRODUCTION ............................................................................................................................................. 9
GENETICS OF COMPLEX DISEASES .................................................................................................................. 10 Genetic signposts and aids: Linkage, linkage disequilibrium and association ........................................ 10 Tag SNPs and assumptions of association screens ................................................................................... 12 Design and scale of genetic studies of complex disease ........................................................................... 13
MHC: A MAJOR T1D SUSCEPTIBILITY REGION ............................................................................................... 13 The DRB1-DQA1-DQB1 association in T1D ........................................................................................... 15 Additional susceptibility loci in the MHC: the problem of hitchhikers .................................................... 16 The T1DGC MHC fine-mapping project .................................................................................................. 18
AUTOIMMUNE DISEASES: COMMON FACTORS? ............................................................................................... 18
AIMS ................................................................................................................................................................. 20
METHODOLOGICAL CONSIDERATIONS .............................................................................................. 21
ISSUES OF CLINICAL HETEROGENEITY ............................................................................................................ 21 Testing in clinical subgroups .................................................................................................................... 22 Age at T1D onset and LADA .................................................................................................................... 22
QUALITY CONTROLS IN ASSOCIATION STUDIES ............................................................................................... 23 Abiding genetic laws of inheritance ......................................................................................................... 23 Association and population stratification ................................................................................................ 24 The importance of HWE in control populations ....................................................................................... 25 Additional measures of quality ................................................................................................................. 27
PROBABILITIES AND STATISTICAL POWER ....................................................................................................... 28 Type I errors and study designs ................................................................................................................ 29 Type II errors and statistical power ......................................................................................................... 30
CONDITIONAL ANALYSES: CONTROLLING FOR LD .......................................................................................... 30 Defining the primary locus ....................................................................................................................... 30 Main effects tests ...................................................................................................................................... 31 Regression modelling ............................................................................................................................... 32 Haplotype-based tests .............................................................................................................................. 33 Complementarity: regression and haplotype methods ............................................................................. 34
SUMMARY OF PAPERS ................................................................................................................................ 36
3
DISCUSSION ................................................................................................................................................... 39
MARKER DENSITY AND COVERAGE OF THE MHC ........................................................................................... 39 CONVENTIONAL ASSOCIATION TESTS: LD IN THE MHC .................................................................................. 41
Dependent associations ............................................................................................................................ 41 Masking of independent association ......................................................................................................... 42 A take-home message ................................................................................................................................ 43
“PEELING OFF” THE EFFECTS OF LD: CONDITIONAL MHC ANALYSES ............................................................. 44 Telomeric class I region - unresolved questions ....................................................................................... 45 The 8.1 and 18.2 ancestral haplotypes and T1D risk ............................................................................... 48 HLA-B: a strong candidate for a primary locus ....................................................................................... 49 Does the central MHC contain unidentified T1D susceptibility factors? ................................................. 50 HLA-DPB1 or additional/alternative factors? ......................................................................................... 52
FCRL3 AND AID: SMALL EFFECTS AND STATISTICAL POWER .......................................................................... 53 CONCLUSIONS ................................................................................................................................................ 53 FUTURE PERSPECTIVES ................................................................................................................................... 54
REFERENCES ................................................................................................................................................. 55
4

5
ACKNOWLEGDEMENTS This thesis is mainly based on work performed at the Institute of Immunology (IMMI),
Faculty Division Rikshospitalet, University of Oslo and Rikshospitalet University Hospital,
Oslo, Norway, in the period September 2004 to August 2008. Part of the work was also
performed at CIGENE, Ås, Norway. Main financial support was obtained from the Juvenile
Diabetes Research Foundation (grant 1-2004-793), with additional funds received from the
NovoNordisk foundation and the Norwegian Diabetes Association. In addition, this thesis
(in particular, Paper I, II and III) utilizes resources provided by the Type 1 Diabetes
Genetics Consortium (T1DGC), a collaborative clinical study sponsored by the National
Institute of Diabetes and Digestive and Kidney Diseases (NIDDK), National Institute of
Allergy and Infectious Diseases (NIAID), National Human Genome Research Institute
(NHGRI), National Institute of Child Health and Human Development (NICHD), and
Juvenile Diabetes Research Foundation International (JDRF) and supported by U01
DK062418.
A special thank you to Benedicte A. Lie, my supervisor, mentor and discussion partner.
Your integrity, leadership, cleverness, open mind and good humour are forever an inspira-
tion, and I could not wish for any better. Thank you also to my other supervisors; Erik
Thorsby, for excellent advice and inspiration for greatness; Dag E. Undlien, for your
thorough comments and for giving me a lesson about HWE.
To my colleagues on the T1DGC project; Marita Olsson, Keith Humphreys and Tim Becker:
thank you for all our inspirational discussions and patience with a non-statistician; without
you, this would never have been possible. A big thank you to Linda Haugse for all the hard
work you put into the HLA genotyping, always as a perfectionist, and to Paul R. Berg at
CIGENE and Beate Skinningsrud and Kristina Gervin at Ullevål for all your assistance. To
all my other colleagues at IMMI and in particular in the Immgen group: thank you for all
your enthusiasm, giving discussions, warm spirit and for making IMMI a good place to be.
Finally, I would like to thank my family and friends, including the wonderful crowd that is
Oslo kammerorkester, for all the support and for taking care of my other selves. To Elisabet,
my free spirit: thank you for all your understanding, patience and love, and for giving me a
shoulder to lean on to.

COMMONLY USED ABBREVIATIONS AFBAC affected family-based
controls AH ancestral haplotype AID autoimmune disease AIF1 allograft inflammatory
factor 1 CD Crohn’s disease CNV copy number variant COL11A2 collagen type XI alpha 2 CTLA4 cytotoxic T-lymphocyte-
associated protein 4 FCRL3 Fc receptor-like 3 GAD65 glutamate decarboxylase 2
(GAD2) GWAS genome-wide association
study HLA human leukocyte antigen HM haplotype method HWE Hardy-Weinberg equilib-
rium IA2 protein tyrosine phosphatase
receptor type N (PTPRN) IBD inflammatory bowel disease indel insertion/deletion INS insulin JIA juvenile idiopathic arthritis kb kilobases KIR killer-cell immunoglobulin-
like receptor LADA latent autoimmune diabetes
in adults LD linkage disequilibrium MAF minor allele frequency MAS1L MAS1 oncogene-like Mb megabase MHC major histocompatibility
complex NBMDR Norwegian Bone Marrow
Donor Registry NK natural killer NOD non-obese diabetic NT non-transmitted
PSC primary sclerosing cholangi-tis
PTPN22 protein tyrosine phosphatase non-receptor type 22
RA rheumatoid arthritis RING1 RING [really interesting
new gene] finger protein 1 SLE systemic lupus
erythematosus SNP single nucleotide polymor-
phism T transmitted T1D type 1 diabetes T1DGC T1D genetics consortium TDT transmission-disequilibrium
test TNF tumour necrosis factor UBD ubiquitin b UC ulcerative colitis
6

LIST OF PUBLICATIONS I. Eike MC, Becker T, Humphreys K, Olsson M, and Lie BA. Conditional analyses on
the T1DGC MHC dataset: novel associations with type 1 diabetes around HLA-G and
confirmation of HLA-B. Genes Immun In press.
II. Eike MC, Humphreys K, Becker T, Olsson M, Lie BA, and the T1DGC. Three
microsatellites from the T1DGC MHC dataset show highly significant association with type
1 diabetes, independently of the HLA-DRB1, -DQA1 and -DQB1 genes. Manuscript
(submitted).
III. Eike MC, Olsson M, Undlien DE, Dahl-Jørgensen K, Rønningen KS, Joner G,
Thorsby E, and Lie BA. HLA-A, HLA-B and SNPs in the AIF1 gene show independent
association with type 1 diabetes in Norwegian trio families. Manuscript (submitted).
IV. Eike MC, Nordang GB, Karlsen TH, Boberg KM, Vatn MH on behalf of the IBSEN
study group, Dahl-Jørgensen K, Rønningen KS, Joner G, Flatø B, Bergquist A, Thorsby E,
Førre O, Kvien TK, Undlien DE, and Lie BA. The FCRL3 -169T>C polymorphism is
associated with rheumatoid arthritis and shows suggestive evidence of involvement with
juvenile idiopathic arthritis in a Scandinavian panel of autoimmune diseases. Ann Rheum
Dis 2008; 67(9): 1287-1291.
7

8

INTRODUCTION Type 1 diabetes (T1D) is a chronic and irreversible condition of insulin deficiency that
affects about 0.3% of Caucasian populations, with onset most commonly occurring at a
young age. Until the 1930’s, when insulin was first isolated from animal pancreases and
successfully used for treatment of human patients, the T1D diagnosis was a death sentence.
Today, approximately 70% of the insulin is produced by genetically engineered bacteria,
representing one of the first and largest success stories of modern biotechnology, and most
patients live relatively normal lives. However, T1D still represents enormous health
challenges, as insulin dysregulation frequently causes vascular complications that increase
risk for severe, secondary diseases; including, but not limited to, kidney damage (nephropa-
thy), blindness (retinopathy), nerve damage (neuropathy) and myocardial infarction.1
Moreover, the incidence rate of T1D is increasing at an alarming rate worldwide,2 installing
an escalating need for determining its causes.
T1D develops as a result of an autoimmune process where the patient’s own immune system
specifically attacks and eventually completely destroys the insulin-producing islet �-cells of
the pancreas. This process is characterised by lymphocytic infiltration of the islets (“insu-
litis”),3 most likely involving autoreactive CD4+ and CD8+ T-cells as key players (4; 5;
reviewed in 6; 7) and presence of autoantibodies to islet cells, glutamate decarboxylase 2
(GAD65), protein tyrosine phosphatase receptor type N (islet antigen 2; IA2) and/or insulin
(reviewed in 8). Moreover, as determined by the presence and predictive power of multiple
autoantibodies in prediabetic patients, the autoimmune process may extend over several
years before the disease becomes overt.9 Little is known about the initiating factors and
details of progression to T1D, although it has become clear that both genetic and environ-
mental factors must be involved. Twin studies have identified concordance rates of 21-70%
between monozygotic twins (depending on sampling approaches and time frames), whereas
the rate in dizygotic twins is 0-13%, with a similar rate of about 6% in non-twin siblings.10;
11 Thus, although T1D has a strong genetic component, the fact that a high number of
monozygotic twins are discordant means that environmental factors, such as infections by
certain viruses (reviewed in 12; 13), must play a significant role. Whatever the causes, genetic
studies are an integral part of any endeavour to unravel the aetiology of this disease. Direct
benefits include more accurate diagnostic procedures and identification of individuals at
high risk, but more importantly, mapping the genetic contribution to T1D provides strong
9
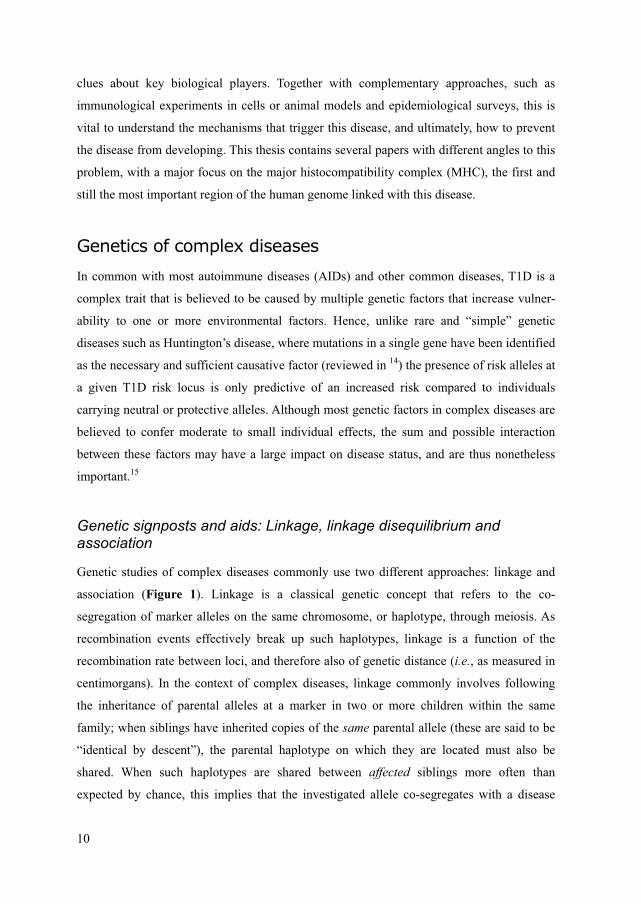
clues about key biological players. Together with complementary approaches, such as
immunological experiments in cells or animal models and epidemiological surveys, this is
vital to understand the mechanisms that trigger this disease, and ultimately, how to prevent
the disease from developing. This thesis contains several papers with different angles to this
problem, with a major focus on the major histocompatibility complex (MHC), the first and
still the most important region of the human genome linked with this disease.
Genetics of complex diseases
In common with most autoimmune diseases (AIDs) and other common diseases, T1D is a
complex trait that is believed to be caused by multiple genetic factors that increase vulner-
ability to one or more environmental factors. Hence, unlike rare and “simple” genetic
diseases such as Huntington’s disease, where mutations in a single gene have been identified
as the necessary and sufficient causative factor (reviewed in 14) the presence of risk alleles at
a given T1D risk locus is only predictive of an increased risk compared to individuals
carrying neutral or protective alleles. Although most genetic factors in complex diseases are
believed to confer moderate to small individual effects, the sum and possible interaction
between these factors may have a large impact on disease status, and are thus nonetheless
important.15
Genetic signposts and aids: Linkage, linkage disequilibrium and association
Genetic studies of complex diseases commonly use two different approaches: linkage and
association (Figure 1). Linkage is a classical genetic concept that refers to the co-
segregation of marker alleles on the same chromosome, or haplotype, through meiosis. As
recombination events effectively break up such haplotypes, linkage is a function of the
recombination rate between loci, and therefore also of genetic distance (i.e., as measured in
centimorgans). In the context of complex diseases, linkage commonly involves following
the inheritance of parental alleles at a marker in two or more children within the same
family; when siblings have inherited copies of the same parental allele (these are said to be
“identical by descent”), the parental haplotype on which they are located must also be
shared. When such haplotypes are shared between affected siblings more often than
expected by chance, this implies that the investigated allele co-segregates with a disease
10

locus nearby.16 “Nearby” in this context is relative, and typically involves distances ranging
from 100 to several thousand kilobases (kb).17 Hence, linkage does not measure the effect of
a trait locus directly. In contrast, association is the over- or underrepresentation of a
particular genetic variant in a population of patients relative to healthy controls, and can
therefore provide a direct measure of the effect of a trait locus when the locus itself is
genotyped (“direct” association in Figure 1). However, making a priori predictions about
the location of such loci are difficult, and genotyping of all the genetic variation in a region
is rarely feasible with current methods. Therefore, association studies aiming to identify
novel susceptibility loci mostly rely on linkage disequilibrium (LD), the non-random
association between alleles at two or more loci in a population. This makes it possible to
detect association even when the responsible variant itself is not genotyped, given that the
LD with neighbouring (genotyped) markers is strong enough (“indirect” association in
Figure 1).
Figure 1: Concepts of linkage and association. D: disease; G: genetic susceptibility locus; M: marker. Dashed lines represent linkage or association signals, while unidirectional arrows indicate causation. Adapted from 16.
LD is related to linkage, in that it (usually) involves a tendency for alleles at proximal
markers to be inherited together on the same haplotype. Therefore, LD also depends partly
on the recombination rate between loci. For instance, for the commonly used LD measures
D’ and r2 (uni- and bidirectional measures between two markers, ranging from -1 to 1 and
from 0 to 1, respectively; |1| represents complete LD, 0 no LD), values are based on
comparison of observed versus expected haplotype frequencies, where the expected
haplotype frequency is given as the product of the frequencies of the involved alleles at each
of the loci; that is, the haplotype frequency you would expect if there was non-restricted
recombination betweeen the loci (and thus, no LD). Unlike linkage, however, LD and
11

association are measured at a population level, which means that LD is additionally
governed by forces such as genetic drift, selection, migration, population admixture and the
number of generations since the original mutation event that gave rise to a particular genetic
variant.16 Whereas linkage involves only a single generation when measured by identical by
descent alleles in siblings, association studies of complex traits typically involve haplotypes
that have been shaped over thousands of generations (so-called ancestral haplotypes).18
Therefore, LD usually decays very rapidly with physical distance. This results in a substan-
tially shorter range for detection of association due to LD compared to linkage, with one
estimate setting the average upper limit at about 3 kb in the human genome.18 This usually
makes association better suited for fine-mapping studies than linkage (especially if the
underlying susceptibility variant is common, see below), as increased proximity reduces the
number of markers that can possibly constitute the primary locus. However, due to the many
possible variables that govern LD patterns and strengths, LD is notoriously difficult to
predict. As demonstrated in the first three papers in this thesis, and as shown by others,19 LD
in certain regions of the genome may be much stronger and of longer range than the
average, which can substantially complicate such fine-mapping efforts.
Tag SNPs and assumptions of association screens
Despite the unpredictable nature of LD, remarkably conserved patterns are often observed in
different human populations, as demonstrated by the Haplotype Map (HapMap) project.20
These patterns have been used for generating subsets of tag single nucleotide polymor-
phisms (SNPs) that convey most of the genetic information offered by the original SNP set
genotyped. This is a central concept in the current wave of genome-wide association studies
(GWAS), as reducing the number of SNPs under study has been crucial to keep genotyping
costs at affordable levels. However, certain assumptions underlie the use of tag SNPs and
screening approaches. One is the common-variant/common-disease hypothesis (e.g. 21-24),
which states that most of the genetic variants involved in common diseases are likely to be
present at substantial frequencies also in the normal population. Both the HapMap project
and most screening studies operate with a minor allele frequency limit of 5% for inclusion
of markers in further analyses (in the papers of this thesis the limit was 1% or below), thus
excluding rare variants present at lower frequencies. Another, related assumption is that
there is only one or very few disease conferring variants at a particular locus. If instead there
is high “allelic heterogeneity”, i.e. multiple alleles or multiple polymorphic sites in a
12

particular gene that are all directly involved in disease risk (commonly observed for rare
variants), the power of detecting indirect association by LD may be substantially diminished
(25; 26). Moreover, most tag SNPs are currently being selected on the basis of only a small
share of the total number of common SNPs in the genome, and local variations in LD in
different populations is bound to leave some polymorphisms unmarked. This has also been
demonstrated by studies where complete resequencing has been performed (e.g.,27; 28).
Despite these concerns, however, the GWAS approach has already proven its power to
detect novel susceptibility loci.29-34
Design and scale of genetic studies of complex disease
GWAS represent a new approach that only has become possible with the introduction of
high-throughput, array-based technologies where a large number of SNPs (currently up to 1
million) are genotyped in each sample simultaneously. However, genome-wide screening
approaches were introduced as early as the 1980’s, using linkage rather than association. As
the physical range for detecting significant signals generally is much larger for linkage, and
linkage screens often have used multiallelic microsatellites that are more informative than
biallelic SNPs, only a small fraction of the total number of markers necessary in GWAS is
needed to cover the genome. However, genome-wide linkage screens did not meet the initial
expectations, as results were prone to false-positives, and conversely, the power to detect
signals with genome-wide significance levels were unexpectedly low.16 A much more
successful approach has been to focus on candidate genes, chosen for their functional
characteristics and hypothesised involvement in disease. This approach has lead to, e.g., the
identification of polymorphisms associated with T1D and multiple other AIDs in the MHC
(discussed in the next section), in the cytotoxic T-lymphocyte-associated protein 4 (CTLA4)
and protein tyrosine phosphatase non-receptor type 22 (PTPN22) genes, and the discovery
of the T1D involvement of a polymorphism in the insulin (INS) gene (reviewed in 35). In
fact, until the beginning of the GWAS era, the candidate gene approach was the only
successful approach for identification of novel genetic variants involved in T1D.
MHC: a major T1D susceptibility region
The first genetic association with T1D was reported with a locus in the MHC in 1973,36
representing a radical turn in our understanding of this disease.37 Thirty-five years later, the
13

MHC is still regarded as the most important genetic region for T1D, with estimates that this
region alone accounts for about 40-50% of the familial clustering in T1D.38; 39. An illustra-
tive example of this role is the result of a recent genome-wide linkage screen in 1435 T1D
families, where the MHC yielded a nominal P-value of 2.0x10-52, whereas none of the other
identified regions reached significance below 1.0x10-5.40 This remarkable region, in humans
also termed the human leukocyte antigen (HLA) complex, occupies about 3.5 megabases
(Mb) on the short arm of chromosome 6 and harbours over a hundred expressed genes. Of
these, an estimated 40% are involved in immune responses,41 with a tendency for clustering
by function (Figure 2).
Figure 2: Overview of important immune-system genes in the classical MHC. Main functional class is indicated with colour code. MHC region class is indicated below the figure (only the class I, II and III regions are regarded as part of the classical MHC); exI and exII: extended class I and II regions, respectively (extending beyond the figure in both directions). Positions are along chromosome 6 (build 36). Source: 41
The genes that gave the complex its original name, the HLA genes in the class I and II
regions, are highly polymorphic, each with up to several hundred alleles identified to date
(http://www.anthonynolan.org.uk/research/hlainformaticsgroup/). In addition, the class II
molecules are dimers of � and � chains encoded by separate loci (e.g., HLA-DQA1 and -
DQB1 for the DQ molecule), further increasing the potential number of different molecules.
Both classes of genes are central in the adaptive immune response. Class I molecules
present peptide-fragments of antigens from the endogenous environment to CD8+ T-cells,
and are present in most nucleated cells. In contrast, class II molecules are found mostly on
professional antigen presenting cells, where they present peptide-fragments from exogenous
antigens to CD4+ T-cells. The peptide-binding grooves are encoded by exons 2 and 3 in
class I genes and exon 2 of the � and � genes of the class II loci. These sequences account
for most of the polymorphism in these genes and also form the basis for assignment of
alleles. The class I molecules are in addition involved in innate immune responses by
14

operating as ligands for natural killer (NK) cell receptors, similar to the molecules encoded
by the MHC class I polypeptide-related sequence genes (MICA and MICB). The immune-
response genes in the class III region are also mostly part of the innate system, encoding
inflammatory cytokines, stress response proteins and complement factors. In total, the class
III region contains about 60 expressed genes, making it the most gene-dense region in the
human genome.42 Notably, the tumour necrosis factor (TNF) gene in this region is a target
for immunosuppressive treatments of several AIDs.
Considering the high concentration of immune-system genes, it is not surprising that not
only T1D, but also a great number of other diseases with a heritable component - including
most AIDs - map to this complex.43; 44 Consequently, the MHC is one of the most intensely
studied regions of the human genome.
The DRB1-DQA1-DQB1 association in T1D
Soon after the first discovery of a T1D-associated locus in the MHC it became clear that the
major part - although not all - of the T1D association in this region could be attributed to
variants in the MHC class II loci HLA-DRB1, -DQA1 and -DQB1. This characteristic is
shared with a number of other AIDs (p. 18). T1D associations with these loci have been
connected with particular haplotypes spanning all three loci rather than individual genes.
These haplotypes follow a risk-continuum from the highest risk DRB1*03-DQA1*0501-
DQB1*0201 and DRB1*0401-DQA1*0301-DQB1*0302 haplotypes to the almost domi-
nantly protective DRB1*15-DQA1*0102-DQB1*0602 haplotype in all populations studied
(e.g. 45; 46). An even higher risk is observed in heterozygous individuals carrying both of the
two highest risk haplotypes, compared to individuals homozygous for either haplotype (e.g. 45-47). This may stem from a particularly high-risk configuration of the peptide-binding
groove of the DQ � and � chains encoded in these heterozygotes, allowing more efficient
binding of auto-antigens when dimers are formed in trans (i.e. DQA1*0501 with
DQB1*0302 and DQA1*0301with DQB1*0201 as opposed to the cis-encoded dimers
DQA1*0501-DQB1-0201 and DQA1*0301-DQB1*0302). Although the primary auto-
antigen in T1D remains unidentified, this possibility is supported by efficient presentation of
gluten peptides by the same trans-dimers in celiac patients.48 Observations such as these
could suggest that the HLA-DQA1 and -DQB1 genes are the strongest primary contenders
among the three. These are also better functionally characterised, and comparisons of crystal
15

structures and binding affinities with orthologues in the non-obese diabetic (NOD) mouse
model of T1D have revealed striking similarities of predisposing or protective alleles (49;
reviewed in 50). However, it is also well-known that the risk conferred by the DQ encoding
genes is strongly modified by the HLA-DRB1 gene, particularly by DRB1*04 subtypes. For
instance, DQA1*0301-DQB1*0302 haplotypes carrying DRB1*0401 or DRB1*0405 confer
high risk across all populations studied, whereas the risk conferred by the same DQA1-
DQB1 haplotype carrying DRB1*0404 is much lower, and with DRB1*0403 strongly
protective (e.g. 45; 46; 51). Thus, genetic studies involving these genes usually operate with
haplotypes of all three loci, or at the very least, HLA-DRB1 and HLA-DQB1 (as these genes
effectively convey most of the information of the HLA-DQA1 gene due to strong LD).
Additional susceptibility loci in the MHC: the problem of hitchhikers
Although the risk impact of the DRB1-DQA1-DQB1 loci outconquers any other T1D-
associated locus in the genome, many studies have strongly implicated the existence of at
least one, and probably more, risk loci in addition to these genes within the MHC (see
Paper III; reviewed in 52) Perhaps the most compelling evidence for this comes from a
prospective study of healthy siblings of T1D patients, all carrying the highest-risk
DRB1*03-DQA1*0501-DQB1*0201/DRB1*0401-DQA1*0301-DQB1*0302 heterozygous
genotype: of the healthy children that in addition to this genotype shared both haplotypes
identical by descent (see p. 10) with their diagnosed siblings, 55% were at high risk for
developing T1D by the age of 12. In contrast, only 7% of those that shared zero or one
haplotype identical by descent (but still the same genotype) were in this high-risk group
(34% and 5%, respectively, had already developed the disease at the time the study was
published).53 This extreme risk of T1D cannot be ascribed to the DRB1-DQA1-DQB1 loci
alone, as all siblings shared the same high-risk genotype. Rather, some locus, or loci, linked
with these haplotypes is needed as an additional explanatory factor.
Despite substantial efforts, however, the identification of these loci has proven difficult,
owing to several unusual characteristics of this region. One is that the strong immunogenetic
role and high density of genes in the MHC makes for an abundance of good candidate
genes, making a priori predictions difficult. Another is the high number of functional
polymorphisms in the HLA genes, as well as the MICA/B genes, which has made genotyping
a demanding task and often has resulted in incomplete characterisation. More seriously, the
16

haplotype structure of the MHC partly consists of highly conserved, ancestral haplotypes,
present at high frequencies in the population and only separated by defined hotspots of
recombination, which results in unusually strong and extensive LD.54; 55 This makes fine-
mapping of disease-associated variants difficult, as allelic variants may “hitchhike” on
haplotypes carrying primary (directly involved) variants at other loci, resulting in detection
of indirect associations over large distances. An illustrative example of this effect is that the
first discovered T1D-associated genetic variants were the B*08 and B*15 alleles (originally
termed HL-A8 and W15) of the HLA-B gene;36; 56; 57 only later did it became clear that most,
if not all, of the association of these alleles could be explained by LD with the high-risk
DRB1*03-DQA1*0501-DQB1*0201 and DRB1*0401-DQA1*0301-DQB1*0302 haplo-
types, respectively. These loci are located over 1.2 Mb apart, exceeding the average
estimates of useful LD range for association studies by a factor of more than 400.
The B*08 and DRB1*03-DQA1*0501-DQB1*0201 alleles are present on a haplotype
known as the 8.1 ancestral haplotype (AH), which also includes, among others, the A*01
and C*07 alleles of the HLA-A and -C genes, respectively. This haplotype is quite frequent,
present at about 10% in Caucasian populations (7.7% in the Norwegian population), and has
been shown to be completely conserved for as long as 9 Mb in some individuals.58; 59 AH8.1
has been strongly associated with numerous diseases, including T1D and other AIDs (60; 61;
reviewed in 62). Another AH that has attracted considerable attention is the AH18.2, which
carries the same DRB1-DQA1-DQB1 alleles as the AH8.1, but extends to, among others,
B*18 and C*05, and with less conservation telomeric of the HLA-B gene. This haplotype
shows a higher T1D risk than that conferred by AH8.1 and other DRB1*03-DQA1*0501-
DQB1*0201 extended haplotypes.63; 64 This implies that some additional locus or loci on the
AH18.2 and AH8.1 modify the high risk of the DRB1*03-DQA1*0501-DQB1*0201
haplotype, in predisposing and possibly protective directions, respectively.
Similar to other, non-MHC loci that have been identified in T1D, additional susceptibility
loci in the MHC are believed to confer small individual effects relative to the DRB1-DQA1-
DQB1 genes. This adds to the difficulties of genetic studies in the MHC, as indirect
associations due to LD with these genes will also tend to be strong, effectively masking or
confounding the effects of other loci. These characteristics basically render conventional
association strategies useless, as any association detected within the MHC by all probabili-
ties is attributable to LD with the DRB1-DQA1-DQB1 loci. However, several conditional
17

approaches have been developed, representing different ways of “peeling off” the LD effects
of the DRB1-DQA1-DQB1 loci to identify independent effects (p. 30).
The T1DGC MHC fine-mapping project
A problem with conditional approaches is that they often involve a large number of parame-
ters, in particular when controlling for multiallelic loci such as DRB1-DQA1-DQB1,
resulting in small strata or high degrees of freedom when testing for independent effects. In
combination with small expected effect sizes, this can quickly result in insufficient statisti-
cal power. One approach to this problem is to include as many individuals as possible
through collaborative efforts involving multiple research centres. This is what has been done
in the Type 1 Diabetes Genetics Consortium (T1DGC) MHC fine-mapping project, which
has generated genotypes for almost 3000 markers covering the entire classical MHC region,
in over 2300 T1D families (the T1DGC MHC dataset). The T1DGC is a large collaborative
effort aiming to collect a large multiplex (at least two affected siblings) family material,
with a stated goal of achieving enough power to perform a definite genome-wide linkage
screen in T1D. In addition, the T1DGC provides characterised samples and cell lines for
researchers worldwide, and several large-scale, collaborative projects are under way. The
MHC fine-mapping project is the first major project under the auspices of the T1DGC,
where ten independent research groups have been allowed early access to this data. Along
with colleagues from Sweden, Germany and Norway, I am part of one of these groups,
resulting in Paper I and II in this thesis, as well as the replication study in Paper III.
Autoimmune diseases: common factors?
T1D is only one among many diseases believed to have an autoimmune cause. Examples of
such diseases are rheumatic diseases such as rheumatoid arthritis (RA), juvenile idiopathic
arthritis (JIA) and ankylosing spondylitis; diseases of the digestive system such as celiac
disease, Crohn’s disease (CD) and ulcerative colitis (UC); systemic diseases such as
systemic lupus erythematosus (SLE), myasthenia gravis, sarcoidosis and multiple sclerosis;
and organ-specific diseases such as primary sclerosing cholangitis (PSC), autoimmune
thyroid disease and psoriasis. Although the variation in clinical manifestations of these
diseases is large, there are certain common characteristics; the most frequent being the
presence of one or more types of autoantibodies.65 Moreover, familial clustering of different
18

19
AIDs is known to occur,66 and co-occurrence of AIDs in the same patient is observed more
often than expected by chance, e.g. RA and T1D with autoimmune thyroid disease,67 and
PSC with CD and UC, celiac disease and autoimmune hepatitis.68; 69 This indicates that there
may be shared genetic factors among these diseases, and indeed, several genetic variants
have been reported associated with more than AID. Most notably, all of the above men-
tioned diseases map with variable strength to the MHC, and many with the genes in the
class II region encoding antigen-presenting molecules. In fact, this is often used as one of
the arguments for assigning an autoimmune status to a particular disease. In addition,
genome-wide linkage studies have revealed several regions with overlapping linkage signals
for more than one AID,70 and the T1D-associated variants of the CTLA4 and PTPN22 genes
have also been reported associated with multiple other AIDs.35 In this thesis, a recently
proposed variant common to AIDs is investigated in Paper IV.
AIMS The overall aim of the work presented in this thesis was to dissect the genetic predisposition
to T1D in the MHC, with an added goal of investigating possible factors common to AIDs.
Specifically, we wanted to address the following issues:
1. Which loci other than the DRB1-DQA1-DQB1 loci are responsible for the T1D risk
conferred by the MHC (addressed particularly in Paper I and II)?
2. Can previously reported associations with T1D and other AIDs in the MHC be
explained by LD with other loci, or do they represent primary associations (addressed
particularly in Paper III)?
3. Is the Fc receptor-like 3 (FCRL3) -169T>C SNP a risk factor in T1D and the other
AIDs RA, JIA, SLE, UC, CD and PSC (Paper IV)?
20

METHODOLOGICAL CONSIDERATIONS The use of families or case-controls represents two fundamentally different designs of
association studies, each having strengths and weaknesses. As will be discussed in this
section, however, some issues relating to the quality of a study pertains to all association
studies, regardless of design. In the papers of this thesis, all investigations of T1D (Paper I-
IV) involved families, whereas the other investigated AIDs in Paper IV involved case-
control designs.
Issues of clinical heterogeneity
The presence of atypical patients in an otherwise homogenous patient material can reduce
power to detect associations. An important issue in genetic studies is therefore how the
patient materials under study were selected and diagnosed. Such issues are particularly
pertinent when considering combined materials collected at different locations, such as the
T1DGC family material. The T1DGC MHC dataset, used in Paper I, II and III, consists of
two main collections (~50% of samples each): families collected for the explicit purpose of
the T1DGC and families collected previously under the auspices of various institutes, most
notably the Human Biological Data Interchange (HBDI) and British Diabetic Association
(BDA) Warren I cohorts. For the former collection, diagnostic criteria and information
gathered was uniform and subject to consortium guidelines. For the latter collection, some
patients lacked certain information, such as autoantibody status and ethnic origin, and
diagnostic criteria may have been subject to differing guidelines. Thus, the latter collection
is likely more heterogeneous than the first. Similarly, although the Norwegian families and
Scandinavian patients investigated in Paper III and IV were collected under standardised
guidelines, diagnosis may still vary depending on the admitting physician or medical centre.
However, such issues are difficult to avoid in studies involving many patients, and some
heterogeneity is therefore bound to exist. A possible solution would be to examine different
cohorts separately, but such procedures may well reduce statistical power more than the
presence of heterogeneous samples. Also, repeated testing in different parts of the dataset
introduces issues of multiple testing, which may inflate the type I error (false positive) rate
(see p. 29). Therefore, in the papers of this thesis, this strategy was limited to a particular
issue of ethnic stratification (p. 33) and one instance of clinical heterogeneity, described in
the next section.
21
Testing in clinical subgroups
Even if the same diagnostic criteria are applied to all patients, some diseases display varying
incidences of clinical subcategories. In this thesis, this particularly applied to the RA, JIA
and PSC patients included in Paper IV. For such diseases, a common strategy is to test
genetic variants in defined clinical subcategories of the patients. This may reveal whether
there are specific disease traits involved, which are valuable for inferring underlying
biological mechanisms. In addition, associations may be detected that are not visible in the
total patient material, due to involvement of biological mechanisms not present in other
subgroups. However, due to issues related to multiple testing, this strategy should be used
with caution. In general, such testing is not warranted unless 1) there is a significant
association in the total patient material, or 2) if there are reasons to believe that specific
subcategories are more likely to be involved. Tests performed in clinical subgroups of JIA in
Paper IV abided by the second of these rules; although the association in the total JIA
material was not significant (P=0.062), there was a tendency for an association comparable
to that observed for the significant association in RA patients. Moreover, the polyarthritis
subgroup of JIA have several clinical characteristics in common with adult RA that could
indicate shared aetiological factors.71
Age at T1D onset and LADA
Onset of T1D can occur at any age, but is most frequently observed in the younger popula-
tion. In the T1DGC MHC dataset, the mean age of onset was 11.75 [sd 8.71] years, but 16%
of patients had an age of onset greater than 20 years (in comparison, all patients in the
Norwegian family material was diagnosed before the age of 15). This may have introduced
some heterogeneity, as an atypical, slowly progressing manifestation of T1D more common
in older patients, termed latent autoimmune diabetes in adults (LADA; about 5–10% of
newly diagnosed non-insulin-requiring diabetes), may have different underlying causes (72;
reviewed in 73; 74). One of the discriminating factors of LADA is infrequent presence of IA2
autoantibodies.73 However, among T1DGC patients characterised for IA2, 61% (n = 143) of
patients with age of onset >20 years were IA2 positive, compared to 52% (n = 1061) of
patients with age of onset 20 years or younger. Although this difference was significant
(P=0.011), the higher frequency of IA2 autoantibodies in the older age of onset group
indicates that the incidence of LADA among the T1DGC patients was rare. Therefore,
22

heterogeneity due to presence of LADA was not likely to have had a major impact on our
analyses.
Quality controls in association studies
In addition to clinical heterogeneity, other, more adverse sources of heterogeneity in
association studies relate to genotyping errors and presence of substructures in control
populations. Such problems do not only reduce statistical power, but may also create false
positive results. Therefore, several measures are commonly employed to reduce their
impact.
Abiding genetic laws of inheritance
Genotyping errors can arise for a multitude of reasons, e.g. poor DNA sample quality,
incomplete reference sequence information such as duplicate sequences or unidentified
polymorphisms in a probe or primer target, unforeseen interactions between primers or
probes in a multiplex assay, poorly designed reaction conditions, or just plain human error.
Family studies have the advantage that such errors may be identified through violations of
Mendelian inheritance, as only certain combinations of alleles in offspring are possible
given the genotypes of the parents. Although Mendelian errors can account for only a
portion of the total genotyping errors in a study (depending in part on marker polymorphy;
e.g., for biallelic markers the rate may be as low as 25%75), such errors still can provide
strong clues about presence and specific problems with the genotyping procedure. Com-
monly, violating genotypes are simply removed before performing statistical tests. This
strategy may introduce some bias, particularly for multiallelic markers: as the power to
detect Mendelian errors relies partly on allele frequencies, such removal may involve some
alleles more often than others, resulting in disproportionate frequencies in the edited dataset.
Therefore, alternative association tests that allow for inclusion of such errors have been
proposed.76; 77 However, as such methods seem somewhat immature and in little current use,
we instead removed genotypes for the affected marker in the entire family in which a
Mendelian inconsistency was encountered (this was only necessary in the Norwegian
families, as the T1DGC MHC dataset was already “cleaned” before being made available to
the research groups).
23

Mendelian tests are not possible for the unrelated individuals in case-control studies, which
instead often rely on the possibility for detecting genotyping errors by deviations from
Hardy-Weinberg equilibrium (HWE).78 HWE is the constant proportion of genotype
frequencies of a non-mutant marker under no selection in a homogenous population that is
under random mating, i.e. the genotype proportions you would expect to find in a properly
sampled control population. Genotyping errors can create distortions in allele frequency
distributions, which, given sufficient statistical power, may be detected by such tests.
Testing for HWE is also possible in family materials, usually by examination of genotypes
in parents.79 However, families are selected on the basis of at least one diseased family
member, and therefore are not likely to be representative of the population as a whole.
Therefore, the requirement of HWE in family studies is often not applied as stringently as
for control populations in case-control studies, except when the validity of the statistical
procedure is contingent on such equilibrium (e.g. the AFBAC procedure described below).
Association and population stratification
Association tests in a case-control study involve the simple null hypothesis H0: no associa-
tion between the marker and the disease. However, this is under the assumption that cases
and controls are sampled at random from the same, genetically homogenous and randomly
mating population, i.e. strongly related to HWE. Consequently, spurious associations may
arise when a population is stratified, e.g. due to admixture of ethnically diverse populations.
Partly for this reason, family-based tests were devised where transmitted (T) and non-
transmitted (NT) alleles to affected offspring act as cases and controls, respectively (re-
viewed in 80). This leads to an efficient matching of the test populations, as each pair of T
and NT alleles share genetic background, with the added benefit that environmental
exposure tend to be more homogenous within families. The most widely used of these tests
is the transmission-disequilibrium test (TDT),81 involving T/NT from heterozygous parents,
or one of its many extensions such as the extended TDT (ETDT),82 which tests for transmis-
sion distortion of multiple alleles simultaneously. Alternative designs include the affected
family-based control (AFBAC) design, where the controls are formed by NT parental alleles
also from homozygous parents (never-transmitted in mulitplex families),83 and designs that
consider relative risks conferred by specific genotypes conditional on parental genotypes
(e.g. 84; 85). The latter approach involves conditional logistic regression, which allows for
inclusion of other parameters such as accounting for missing parents, 86 parent-of-origin or
24

epistatic effects,87; 88 or the effects of other markers in LD with the investigated marker
(described in detail on p. 31). In common for all of these approaches is that they are based
on testing within families, thereby reducing or even eliminating the impact of population
structure. Significant findings in a family-based test most often also implies linkage (in
addition to association),80; 89 which unlike LD is not influenced by population genetics (p.
10). Moreover, even in cases where population stratification is an issue (e.g., see p. 34),
unlike case-control designs, the use of families represents a matched design, which in the
face of an unmatched test caused by stratification is likely to lead to reduced power rather
than false positives.90 Therefore, family-based designs are generally considered more robust
to population stratification than case-control designs, which continues to be one of the key
arguments for their use.
For case-control designs, an alternative solution is to test, once again, for compliance with
HWE. In the absence of genotyping errors, deviations from HWE in patients can be a sign
of disease involvement of a marker.91 In contrast, deviations in a healthy control population
can arise when these consist of subpopulations with different ancestral origin and population
history, which often exhibit differences in genotype frequencies; i.e., in the presence of
population stratification.92 As the following case will show, HWE deviations may also arise
for no identifiable reason, but may still reveal important issues.
The importance of HWE in control populations
An illustrative example of the importance of HWE in controls was encountered in the work
behind Paper IV in this thesis, where the Fc receptor-like 3 (FCRL3) -169T>C SNP was
examined using TaqMan technology (Applied Biosystems). Initially, we genotyped a control
material recruited from the Norwegian Bone Marrow Donor Registry (NBMDR; n = 650).
These controls were in marked deviation from expected HWE frequencies for this SNP
(P<0.01), similar to a deviation observed in parents from the T1D families. To test for the
possibility of genotyping errors, we retyped a representative subset of these controls (12%;
16 CC, 30 CT and 28 TT) by DNA sequencing. However, this revealed no discrepancies.
The TaqMan genotyping assay performed well with no signs of clustering anomalies (see p.
28), and was the same as that used in the original report for this SNP (Applied Biosystems,
personal communication), where no deviation from HWE was observed.93 Moreover, there
was no evidence of additional polymorphisms within the sequences covered by the assay
25

primers and probe (ibid.), and our sequencing results did not reveal any unknown SNPs in
the 459 basepair region amplified by our primers. Finally, only two Mendelian inconsisten-
cies were observed in our 425 T1D families, with an implied error rate much too low to
explain the observed deviation (<0.7% for a 25% discovery rate). Hence, genotyping error
could be excluded as a possible cause of the observed deviation from HWE.
An alternative explanation could be population stratification, but the Norwegian population
is generally considered genetically homogeneous, and HLA genotype profiles in these
controls matched those of the total NBMDR material (consisting of ~20000 individuals),
making ascertainment bias unlikely. Also, parts of the NBMDR control material and the
T1D family material used in this study were previously genotyped for a number of other
polymorphisms without showing deviation from HWE.94-101
Hence, none of the usual explanations for HWE deviation seemed to apply to our study. We
therefore at first interpreted this as a sign that this SNP simply was not in HWE in the
Norwegian population. However, considering that a marker under no selection pressure and
no mating bias (which there was no reason to suspect in this case) is expected to reach HWE
after a single generation, this notion is highly unlikely. In addition, the select status of the
T1D families means that the deviation observed here may not be considered as independent
evidence for such a deviation in the normal population. Therefore, another, independent
control material was genotyped (Paper IV). This time, the controls were in HWE, and in
addition showed more similar genotype frequencies to those reported in other Caucasian
populations. This also resulted in striking changes in the results of the study, from initial
significantly increased risk of the FCRL3 -169 CC genotype for the UC, PSC and SLE
patient populations and reduced risk for the RA population, to significantly increased risk
for the CC genotype in the RA population only (Table 1).
Hosking et al. (2004)104 performed a detailed investigation of 36 SNPs deviating from HWE
(from a panel of 313 assays with minor allele frequency [MAF] >0.05). However, the
deviations for 10 of these SNPs could apparently not be explained by either genotyping
errors or population stratification. This shows that deviations from HWE may occur quite
frequently, even when conditions for proper study design and accurate genotyping are met.
The cause of such deviations are unclear, but may be purely stochastic in nature, such that
for any given study population, some markers will not be in HWE by pure chance. To date,
such problems have either been ignored78; 105 or resulted in markers being omitted from
26

Table 1: Comparison of association results for the FCRL3 -169T>C SNP depending on HWE in controls.
Material n Genotype frequency CC vs. CT + TT with Controls #1 (not in HWE)
CC vs. CT + TT with Controls #2 (in HWE)
CC CT TT OR (95% CI) P-value OR (95% CI) P-value
RA 713 0.21 0.50 0.29 0.78 (0.60-1.00) 0.052 1.30 (1.01-1.67) 0.040 JIA 320 0.20 0.49 0.31 0.74 (0.54-1.03) 0.075 1.30 (0.99-1.70) 0.062 SLE 163 0.15 0.57 0.28 0.50 (0.32-0.81) 0.0037 0.87 (0.55-1.38) 0.55 UC 326 0.15 0.53 0.32 0.52 (0.36-0.73) 0.0002 0.89 (0.63-1.26) 0.51 CD 142 0.19 0.51 0.30 0.69 (0.43-1.08) 0.10 1.18 (0.75-1.85) 0.47 PSC 360 0.18 0.49 0.33 0.64 (0.47-0.89) 0.0071 1.11 (0.81-1.52) 0.53 Controls #1 631 0.26 0.43 0.31 - - - - Controls #2 982 0.17 0.51 0.32 - - - -
n: number of genotyped individuals. RA: rheumatoid arthritis; JIA: juvenile idiopathic arthritis; SLE: systemic lupus erythematosus; UC: ulcerative colitis; CD: Crohn’s disease; PSC: primary sclerosing cholangitis; Controls #1: NBMDR, not in HWE (P<0.01); Controls #2: Norwegian blood donors (used in Paper IV). �2 tests applied to allelic counts assumes HWE102; 103 and are therefore not shown.
further analyses (e.g. 20). Our results demonstrate that the former strategy is dangerous, as it
may lead to false results. The latter strategy seems to be a far better alternative, although
genotyping of an independent control material is preferable in cases where the SNP is of
particular interest.
Additional measures of quality
In addition to investigating Mendelian errors and HWE deviations, most genetic studies
involve additional measures to correct for potential errors. The T1DGC MHC dataset used
in Paper I-III had already been subject to a range of methods relating to genotyping quality
(most notably at the well-renowned deCODE and Sanger institutes for the microsatellites
and SNPs, respectively) and identification of potential errors in family structure before
being made available to the research groups. In addition, we implemented a procedure to
evaluate the number of recombinations between loci; when estimates of haplotypes show
unusually high numbers of apparent recombinations within a single family, this is likely to
point to errors in pedigree structure, e.g. the inclusion of genetically unrelated individuals or
misspecification of parents and children. Similarly, family structures in the Norwegian T1D
families were evaluated by examining a large number of genotyped markers simultaneously,
and identifying those families where Mendelian errors appeared to be overrepresented. In
some cases, such procedures can point to a sample-switch, which is easily corrected by
applying the correct sample number. In other cases, the offending sample or the entire
family (when the former is ambiguous) must be removed from analysis altogether.
27

For genotyping quality, a common measure is to examine genotyping success rates, both in
relation to samples and markers. In the first case, removing samples that perform poorly is
not only likely to remove genotyping errors relating directly to these samples, but can also
significantly improve the genotype quality of other samples: many assays, such as TaqMan,
SNPlex and array-based methods rely on clustering of genotypes from many individuals
simultaneously, and low-quality samples will tend to contribute towards poorly defined
borders between these clusters. In the second case, removing genotypes for markers with
low success rates will tend to improve overall genotype quality, as poorly performing assays
are usually prone to genotyping errors.
Another important measure is to check the integrity of the reference sequence on which the
assays were originally designed. The human genome reference sequence is constantly being
updated, and each update can reveal inconsistencies in previous builds. Similarly, the
National Center for Biotechnology Information (NCBI) SNP database (dbSNP;
http://www.ncbi.nlm.nih.gov/SNP/) contains information about most of the SNPs discov-
ered to date, with frequent updates. Control searches in this database for SNPs included in a
study may, only months after the study was initiated, reveal newly discovered alleles or
multiple hits at different loci in the genome. Such characteristics can introduce errors in
genotyping, and may therefore reveal errors that otherwise had gone unnoticed.
Probabilities and statistical power
Association tests involve the null hypothesis H0: no association between a marker and a
disease. Rejection of the null is determined by the significance threshold, which is com-
monly set at P=0.05 for single tests. However, in complex studies involving multiple
parameters, the suitability of a significance threshold is contingent on probabilities for two
main classes of statistical errors: the type I error rate, which is the probability of rejecting
the null when there is no true association (false positive), and the type II error rate, which is
the probability of not rejecting the null when there in fact is a true association (false
negative). The probabilities for such errors are heavily influenced by the size of the study
population and of the risk effect, and the allele frequency of the risk conferring variant
(lower probabilities for large populations, high risk effects and frequencies closer to
50%).106 Depending on these parameters, the threshold significance level can adjust the
28

balance for these two types of errors; lower thresholds will reduce the type I error rate, but
increase the probability for type II errors.
Type I errors and study designs
An added complexity of type I errors is that they also are influenced by the design of a
study: investigating a large number of markers without a prior evaluation of the likely
involvement of these markers with disease (e.g. genome-wide screens) is more likely to
yield false positives than investigation of a single marker that has been implicated through
functional studies, biological role or prior reports of association (i.e., candidate studies).
This is due to mainly two issues: differences in the prior odds of “hitting the right spot”
among the millions of common variants that are present in the genome, and issues when
testing multiple markers at the same time for a single hypothesis.
The prior odds are, obviously, not possible to calculate accurately, but testing different
models has shown that the odds in a candidate approach can be as much as a 100 times
better than in a hypothesis-free screening approach.106 As such, the studies in Paper III and
IV in this thesis were closest to the mark, as polymorphisms in these studies were selected
on the basis of earlier reports involving both functional and genetic studies. In contrast,
Paper I and II describe screens of the entire MHC using a high-density SNP panel or
microsatellite markers. Although the prior odds in these studies is much better than in
genome-wide approaches, due to limiting the focus to a region that already has a high
likelihood of containing T1D risk factors, they will be significantly worse than for the
candidate studies in Paper III and IV.
A similar, but separate issue influencing type I error rates relates to the testing of multiple
markers for a single hypothesis, e.g. the existence of an additional T1D susceptibility locus
within the MHC (relates to Paper I and II, and to a lesser degree to Paper III). In contrast
to a single test, where a significance level of P<0.05 may be adequate, each added test of the
same hypothesis (represented by each of the tested markers) increases the likelihood of
observing associations at this level by pure chance. A widely used measure to reduce the
impact of these issues is to apply Bonferroni correction, which is the simple division of a
significance value (e.g. P=0.05) with the number of tests performed to arrive at a new
threshold. Although Bonferroni correction does not consider dependencies between markers
due to LD and therefore is considered conservative, particularly when the number of tests is
29
large, it is computationally simple and generally considered to be sensitive.107 Moreover, in
the context of the studies conducted in Paper I and II, which involved parameter- and work
intensive methods, these procedures helped to reduce the workload, but still leaving a
substantial number of significant markers.
Type II errors and statistical power
Statistical power is the probability that a study will detect a true association with the
markers studied, and is therefore inversely related to the type II error rate. Power calcula-
tions are often applied prior to performing a study (e.g. in Paper IV), to determine if the
available study population is large enough to detect associations of a marker with an
expected risk impact. In the studies of Paper I-III, such calculations were difficult, as the
use of conditional approaches and the unusual LD characteristics of the MHC can influence
these estimates in unpredictable ways. However, an estimate by Nejentsev et al. (2008),
using 850 of the T1DGC families in a similar study to ours showed a 98% power to detect a
relative risk of 2.0 at �=1.0x10⁻⁵ and MAF=0.10, 60% for MAF=0.05 and 32% for a relative
risk of 1.5 at MAF=0.10.108 As our studies included over 2300 families and higher threshold
P-values (conditional main effects tests; �=2.2x10⁻⁵ for the SNPs in Paper I and �=8.5x10⁻⁴
for the microsatellites in Paper II), we should have had ample power to detect loci with
moderate risk sizes.
Conditional analyses: controlling for LD
The unusual LD characteristics of the MHC (p. 17) demands special measures to identify
independent effects, particularly of LD with the DRB1-DQA1-DQB1 loci. Several ap-
proaches to this problem have been proposed, mainly divided into methods based on logistic
regression and methods based on estimates of extended haplotypes (described further
below).
Defining the primary locus
Irrespective of method chosen, a first and essential step is how to define the risk conferred
by the HLA-DRB1, -DQA1 and -DQB1 loci. A problem with analyses conditional on these
loci is the large number of alleles at each locus, which, if each locus is treated separately,
can rapidly result in very high numbers of variables. Although this strategy has been in
30

common use (albeit usually ignoring the HLA-DQA1 locus), it requires some form of
grouping of alleles to reduce complexity. This may be done by function (e.g. similar to the
“shared epitope” hypothesis in RA109), by broad risk categories (e.g. high, low, interme-
diate), or under a certain frequency threshold. However, these strategies may be difficult due
to incomplete information, too inaccurate given the complex risk of the DRB1-DQA1-DQB1
loci, or result in grouping of alleles with differential risk. Still other methods do not consider
all DRB1-DQA1-DQB1 haplotypes, but only those with very high risk impact (e.g. the
homozygous parent TDT, p. 33).
Our approach to this problem, applied in Paper I-III, was to take advantage of the high LD
between the DRB1-DQA1-DQB1 loci by constructing phased haplotypes (i.e. assigning each
allele to one of the two chromosome copies) covering all three loci and using these haplo-
types as alleles at one “super-locus”. This simplified the analyses substantially (leaving one
instead of two/three conditional loci), while keeping most of the information of the individ-
ual loci intact. Moreover, due to the known haplotype-specific and modifying effects
between these loci (p. 15), considering the haplotypes rather than individual loci should
capture the risk more accurately. When also considering that LD patterns from alleles of the
individual loci are likely to vary from those of haplotypes spanning all three, the use of
haplotypes more effectively addressed the main task in our analyses: to control for secon-
dary association due to LD with the DRB1-DQA1-DQB1 loci. This approach, and its
possible shortcomings, is described in detail in Supplementary methods of Paper I.
Main effects tests
Logistic regression is a flexible framework that allows for incorporation of a multitude of
variables. The approach used in this thesis (Paper I-III), described by Cordell & Clayton
(2002),110 considers the overall combination of genotypes at two or more loci, allowing for
testing of effects at an additional locus while controlling for confounding (i.e., due to LD) at
a primary locus. Specifically, this involves comparison of a regression model that includes
the effects of both loci with a model where only the effects of the primary locus is included;
when the effect of the first model is significantly different from that of the second, this
implies that the additional locus confers an effect that is independent of the primary locus.
This is the “main effects” test, which was used as a first step in the analyses in Paper I-III.
31

This method can be used both in case-control and family materials, with the difference that
the first involves unconditional whereas the second involves conditional logistic regression.
In particular, when applied to families, as in this thesis, the incidence of particular genotypes
or alleles (depending on model) in affected children is compared with the incidence in
“pseudo-controls”, by conditioning on parental genotypes and affection status (similar to the
genotype relative risk approach 84; 85). The pseudo-controls are constructed from the possible
parental genotypes not transmitted to affected children, resulting in a matched design that,
similar to many other family-based designs, is robust to population stratification. Moreover,
this design means that each case allows for up to three pseudo-controls from the three other
possible combinations of haplotypes from the parents. However, this requires parental phase
to be known, otherwise only one pseudo-control is possible. Although phase assignment in
the parents can be improved by including unaffected siblings, as was possible with the
T1DGC families, this procedure partly depends on the number of alleles at the test locus:
because biallelic markers (e.g. SNPs) contain less information and are more likely to be
homozygous than multiallelic markers (e.g. HLA loci and microsatellites), this usually
results in more pseudo-controls for multiallelic markers.
Regression modelling
Due to the possible existence of more than one additional T1D susceptibility locus in the
MHC, adjusting only for the known effects of the DRB1-DQA1-DQB1 loci may not be
sufficient, as each additional locus may add its own confounding factor. When, as in this
case, the additional loci are unknown, a multistep approach may offer a solution: adjustment
is first made for the primary disease locus, and secondly for all loci identified with signifi-
cant results in the first step. This way, even if the additional risk loci are not genotyped
and/or are unknown, the sum of markers included in the second step should nonetheless pick
up a large part of the confounding effects of these loci. The method used in Paper I-III in
this thesis, also described in Cordell and Clayton (2002),110 is a simple extension of the
main effects test procedure above, where testing of a set of loci is performed in a stepwise
manner. This involves adding additional loci, one at a time, to a model already including
DRB1-DQA1-DQB1 (forward stepwise selection), or similarly subtracting loci from the
model including all of the loci (backward stepwise selection). For each of the steps, changes
in the observed effect are considered, such that in the final model (the “best” model), adding
additional markers does not add significantly to the effect, or conversely, removing any of
32

the markers already in the model results in a significantly worse fit of the model. Thus, the
final model represents a minimum set of markers needed to explain the observed association
of all the markers initially tested.
Haplotype-based tests
In contrast to the regression approaches described above, which consider overall marker
effects, haplotypes provide information about the LD background in a region. This can be
used for mapping of alleles at the test loci on the different DRB1-DQA1-DQB1 haplotypes,
and, by applying conditional tests, also for determining which particular alleles that are
likely to be responsible for the independent effects observed in the regression analyses.
A common strategy in haplotype-based analyses is to evaluate additional effects of a marker
on individual conditional haplotypes. An example is the homozygous parent TDT,111 where
only families with parents that are homozygous for a particular allele at a primary risk locus,
e.g. the DRB1*03-DQA1*0501-DQB1*0201 haplotype, are included. This results in an
efficient control for associations secondary to LD on this haplotype, meaning that any
association observed at a test locus is indicative of an additional effect. However, both the
limitation of homozygous parents and the further demand that the tested marker must be
heterozygous for the TDT to be informative can quickly result in small datasets. The method
used in this thesis (Paper I-III) is reminiscent of this strategy, but with consideration of all
individual DRB1-DQA1-DQB1 haplotypes irrespective of risk impact. Ours is a variant of
the haplotype method (HM),112; 113 which involves comparison of relative frequencies of
alleles at a test locus on haplotypes that are identical at a primary locus. For example, in a
simple case involving two biallelic markers A and B in LD, where A is a known primary
locus with predisposing allele A1 and protective allele A2 and B has the alleles B1 and B2,
then under the null that A defines all the risk:
)_()_(
)_()_(
21NT
21T
11NT
11T
BAfBAf
BAfBAf
�
where f T (.) and f NT (.) represent T and NT frequencies, respectively (“_” represents the
haplotype connection). That is, although the predisposing risk conferred by A1 means that
the transmitted haplotypes carrying A1 will be more frequent than the non-transmitted
haplotypes, there should be no difference in the ratios of T/NT haplotypes depending on the
33

allele of B (the protective allele A2 will give the same result, but with opposite risk).
Conversely, deviations from these expected ratios imply that an additional effect is marked
by B (i.e. additional risk is conferred by B itself or a marker in high LD with B).
A generalised formula as it applies to multiallelic loci and details of our method are given in
Supplementary methods to Paper I. Briefly, phasing of haplotypes prior to performing
these tests were done using the program FAMHAP,114 which allows for separating T and NT
haplotypes from heterozygous parents. An important note is that assignment of haplotypes
within a family is weighted on haplotype frequency estimates across all parents,114; 115 which
therefore assumes random mating and HWE in the founder population. Hence, unlike the
conventional TDT (p. 24) but similar to other variants of the HM,113; 116 the results of this
procedure may be influenced by population stratification. Although, as previously noted (p.
25), a stratified population is more likely to result in reduced power than in false positives in
family-based designs, analyses should therefore be performed in as homogenous popula-
tions as possible (e.g. for the T1DGC MHC dataset, tests were performed in subpopulations
defined by areas of European ancestry, in addition to the whole dataset; Paper I and II).
Complementarity: regression and haplotype methods
None of the above conditional methods is perfect, but using them both can reduce some of
the shortcomings inherent in each method. In general, the haplotype method we used was
generally laborious, with frequent demand of manual inspection. This was particularly the
case for analyses of more than one additional locus, which, although can reveal important
information about connections between allelic associations between separate loci on the
same DRB1-DQA1-DQB1 haplotype, generally result in small strata with limited power. In
comparison, incorporation of multiple loci in a regression model is relatively unproblematic.
Therefore, the regression approach was better suited for initial screening of the datasets to
narrow down a set of candidate markers, which proved particularly useful for the large
number of markers in the T1DGC MHC dataset.
A more specific issue is that the main effects test does not consider haplotype effects. For
instance, for two biallelic loci with alleles A/a and B/b, respectively, the two genotype
combinations ab/AB and aB/Ab are considered equivalent. If these loci are not real aetio-
logical loci, but merely act as proxies due to LD (which is always a likely situation in
screening studies), these combinations may influence the results in different ways.110 A full
34

35
genotype model would allow for this distinction to be included, but this results in tests with
much higher degrees of freedom.110 As the number of parameters already represented a
problem with the main effects test in our analyses, this was not attempted. Therefore, the use
of the haplotype method described above was important to validate the results from the
regression analyses.
A related issue is that the regression approach is limited when it comes to handling rare
alleles; although multiallelic markers can improve phase assignment and thus increase
power, the increased information of these markers also results in a higher number of
parameters and degrees of freedom, which can affect statistical power in the other direction.
Many parameters can also introduce problems in the analyses, especially in large datasets
where the incidence of unique, rare alleles may be higher than in smaller datasets. This was
also demonstrated in the analyses of the HLA loci and microsatellites in the T1DGC MHC
dataset (Paper I and II, respectively), where initial analyses using the original set of
families produced unreliable results. This was particularly evident for the test needed to
account for dependency between multiple affected siblings (the Wald test) in this dataset.
Therefore, the dataset was recoded for analyses of the multiallelic markers to contain only
one affected child per family (the “proband” dataset), to allow for an alternative (likelihood
ratio) test. This did not solve all of the problems with rare alleles, however, resulting in
grouping of alleles with frequencies less than 1% (0.1% for the microsatellites) for all
multiallelic markers, including the DRB1-DQA1-DQB1 haplotype code. To keep analyses
comparable, this was also done equally for the DRB1-DQA1-DQB1 haplotypes in the
dataset used for analyses of the SNPs (the “all affecteds” dataset). As noted in the section
above, such grouping is not unproblematic, as the grouped alleles may not confer the same
risk, and is therefore likely to result in a heterogeneous group. Therefore, appropriate
measures must be applied to ensure validity of results. In our case, the haplotype method
proved a valuable asset also in this respect, due to its capability for revealing the particular
alleles and DRB1-DQA1-DQB1 haplotypes involved. In some of these cases, the association
primarily mapped to the grouped alleles, which is likely to have resulted in artefacts in the
regression analyses. Therefore, these results were discarded. This issue, particularly as it
pertains to the grouping of rare DRB1-DQA1-DQB1 haplotypes, is discussed further in
Supplementary methods of Paper I.

SUMMARY OF PAPERS
Paper I: Conditional analyses on the T1DGC MHC dataset: novel associations with type 1 diabetes around HLA-G and confirmation of HLA-B.
In this first and major paper of this thesis, we used the data on SNPs and HLA loci from the
large T1DGC MHC dataset in a comprehensive scan for additional T1D risk factors in the
MHC. Our approach employed two complementary conditional methods, involving
conditional logistic regression and allelic tests conditional on haplotypes, and consisted of
stepwise identification of increasingly smaller subsets of markers that could explain all of
the observed association in the previous steps. All steps included adjustment for LD effects
with the DRB1-DQA1-DQB1 loci, but in addition, the later steps also included adjustment
for LD effects with significantly associated loci from the previous steps. Thereby, we were
able to identify a subset of markers with associations that were not only independent of LD
with DRB1-DQA1-DQB1 haplotypes, but also likely to be independent of other, additional
T1D risk factors in the MHC. This subset contained polymorphisms concentrated in three
separate, demarcated regions of the MHC and pointed to T1D risk factors involving
polymorphisms in or around the HLA-G, -B and -DPB1 genes, respectively. In particular, the
evidence for the B*39 and B*18 alleles of the HLA-B gene strongly suggested that these are
primary T1D risk factors. Still, our results suggested that these HLA-B alleles are not the
only risk factors in this particular region of the MHC, and that HLA-C or neighbouring loci
might also be involved. For the regions in the vicinity of the HLA-G and -DPB1 genes, the
complexity of the observed associations suggested that the primary risk factors remain
unidentified. As many of our findings also are novel, this means that further fine-mapping
and replication in independent datasets are needed before results may be considered
conclusive.
Paper II: Three microsatellites from the T1DGC MHC dataset show highly significant association with type 1 diabetes, independently of the HLA-DRB1, -DQA1 and -DQB1 genes.
The T1DGC MHC dataset also included genotype data for 66 microsatellites throughout the
MHC. The relatively high polymorphy of these markers (e.g. compared to SNPs) results in
increased numbers of parameters, in particular in conditional analyses involving other loci
with high polymorphy. Therefore, we treated the microsatellites separately from the other
markers. The analyses in this paper followed a similar strategy to that of Paper I, using two
36

complementary conditional approaches adjusting for LD with DRB1-DQA1-DQB1, but with
no adjusting for LD between the identified markers. Due to problems imposed by the high
number of variables, especially when involving rare alleles, these results were throuroughly
validated using different input variables. Three markers in two regions emerged from these
analyses. One of these, D6S2773, is located close to HLA-G, thus strengthening the results
from Paper I for this region. The two other microsatellites, DG6S398 and D6S2989, are
located close to each other and within the same gene, C6orf10. However, especially
conisdering the results from Paper I, further analyses are needed to rule out LD with other
candidate markers.
Paper III: Genetic variants of HLA-A, HLA-B and AIF1 show independent MHC associa-tion with type 1 diabetes in Norwegian families.
Numerous studies have suggested genetic risk factors shared between more AIDs, despite a
large variety of clinical manifestations. A strong candidate region for such common factors
is the MHC, where many AIDs show strong disease associations, often with indications of
multiple susceptibility loci as in T1D. Therefore, we investigated a selection of markers in
genes that previously have been implicated in T1D and/or other AIDs in a Norwegian T1D
family material. The conditional strategy we used in this paper is similar to that used in the
Paper I. By these means, we confirmed the independent association of HLA-B alleles B*18
and B*39 with T1D, thus further consolidating the status of these alleles as primary T1D
risk factors. Moreover, we found evidence of independent T1D association of HLA-A alleles
A*01, A*24 and A*31, which overlaps with findings in earlier reports, but contrasts with a
negative finding in Paper I. In addition, we found a novel association with the SNP
rs2259571 in the AIF1 gene that could not be explained by LD with any of the other
investigated markers. Although this association could not be confirmed in a replication
attempt in the T1DGC MHC dataset, we did demonstrate common haplotypic associations,
which may indicate that alleles at an unidentified locus in high LD with this SNP in both
datasets were responsible for the association. The results of this study also demonstrated the
importance of adjusting for LD effects across the entire MHC region, as none of the other
previously suggested associations were confirmed, most notably promoter polymorphisms
of the TNF gene.
37

38
Paper IV: The FCRL3 -169T>C polymorphism is associated with rheumatoid arthritis and shows suggestive evidence of involvement with juvenile idiopathic arthritis in a Scandina-vian panel of autoimmune diseases.
In addition to the MHC, several loci in other regions of the genome have been suggested as
common AID risk factors. One of the more recently suggested loci is the FCRL3 -169T>C
SNP, which has been reported associated with RA, SLE, autoimmune thyroid diseases,
Addison’s disease and multiple sclerosis. However, results have been conflicting, also for
RA, despite a very strong association in the initial Japanese report. We therefore investi-
gated this SNP in a Scandinavian panel of AIDs, which included patients with RA, JIA,
SLE, UC, PSC and CD, in addition to the T1D families investigated in Paper III. This
resulted in positive findings for the RA patients and novel evidence of suggestive associa-
tion for the JIA patients, the latter of which appeared to be connected to the polyarticular
subgroup. Notably, this is also the clinical subgroup of JIA that has the most characteristics
in common with RA, and therefore may point to common disease mechanisms. However, no
evidence for association was found for the other investigated diseases, and we could not
confirm a previously reported interaction with the PTPN22 1858C>T SNP, another sug-
gested common AID risk factor. Therefore, our results did not support the notion that the
FCRL3 -169T>C SNP is a risk factor common to all AIDs. However, in combination with
recent meta-analyses, our results also indicated that the risk conferred by this SNP in RA is
much smaller than initially suggested. This means that many studies may have been
underpowered, potentially explaining the conflicting results.
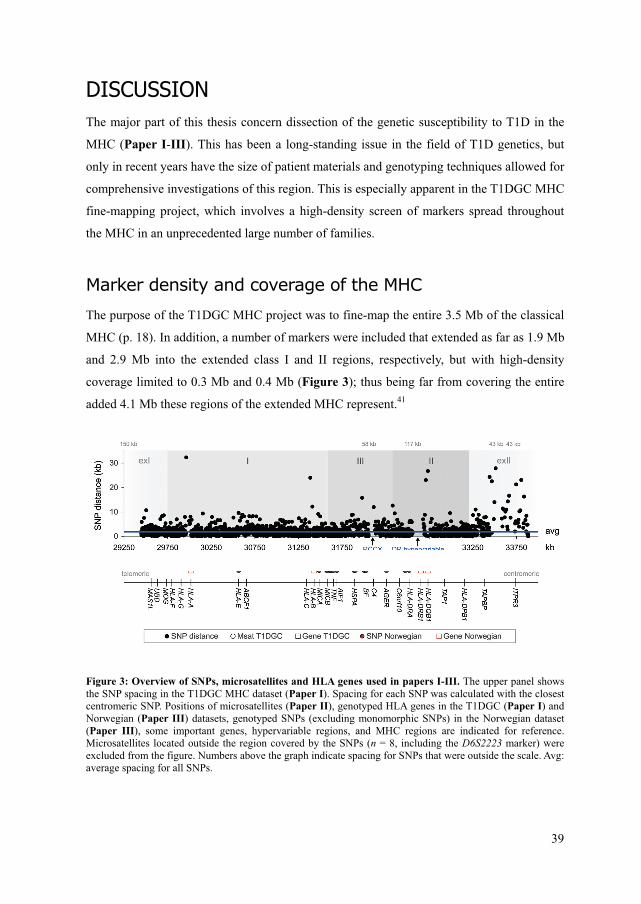
DISCUSSION The major part of this thesis concern dissection of the genetic susceptibility to T1D in the
MHC (Paper I-III). This has been a long-standing issue in the field of T1D genetics, but
only in recent years have the size of patient materials and genotyping techniques allowed for
comprehensive investigations of this region. This is especially apparent in the T1DGC MHC
fine-mapping project, which involves a high-density screen of markers spread throughout
the MHC in an unprecedented large number of families.
Marker density and coverage of the MHC
The purpose of the T1DGC MHC project was to fine-map the entire 3.5 Mb of the classical
MHC (p. 18). In addition, a number of markers were included that extended as far as 1.9 Mb
and 2.9 Mb into the extended class I and II regions, respectively, but with high-density
coverage limited to 0.3 Mb and 0.4 Mb (Figure 3); thus being far from covering the entire
added 4.1 Mb these regions of the extended MHC represent.41
Figure 3: Overview of SNPs, microsatellites and HLA genes used in papers I-III. The upper panel shows the SNP spacing in the T1DGC MHC dataset (Paper I). Spacing for each SNP was calculated with the closest centromeric SNP. Positions of microsatellites (Paper II), genotyped HLA genes in the T1DGC (Paper I) and Norwegian (Paper III) datasets, genotyped SNPs (excluding monomorphic SNPs) in the Norwegian dataset (Paper III), some important genes, hypervariable regions, and MHC regions are indicated for reference. Microsatellites located outside the region covered by the SNPs (n = 8, including the D6S2223 marker) were excluded from the figure. Numbers above the graph indicate spacing for SNPs that were outside the scale. Avg: average spacing for all SNPs.
39

In the core region, however, the coverage was good, with an average SNP spacing less than
2 kb - well within the genome average limit of about 3 kb estimated as useful for detecting
indirect association.18 Moreover, this limit it likely to be substantially larger in the MHC,
considering the unusually strong LD compared to the rest of the genome. Adding to this are
the microsatellites (dispersed at an average interval of 159 kb) and the genotyping of many
of the classical HLA genes, for which the large number of alleles gives a high level of
information. However, some regions were less well covered. In particular, two regions
known to contain variable number of gene copies, RCCX (class III region; including the
C4A/B, CYP21A1P, and TNXA genes)117 and the DR hypervariable region (class II region;
including the (pseudo)genes HLA-DRB2 through -DRB8)118 contained very few genotyped
SNPs (Figure 3), probably due to the fact that copy-number variations create unpredictable
results with standard genotyping methods. In addition, a large stretch of 32 kb between the
HLA-G and -A genes and another of 24 kb between HLA-C and -B, respectively, were
devoid of genetic markers. These regions contained several SNPs in the original dataset, but
were excluded in quality controls due to low minor allele frequencies, high failure rates
and/or departures from HWE. The latter two characteristics may indicate problems with the
genotyping procedure, for instance due to copy-number variations, regions with high
homology to other areas of the genome, or repetitive sequences, all of which make genotyp-
ing difficult.
Of the excluded regions and genes, particularly the C4A/B genes have attracted a lot of
attention, with several reports of associations with T1D (e.g.,119) and SLE (e.g.,120), in
particular with the C4A*Q0 and C4B*Q0 null (deletion) alleles. However, these alleles
show strong ties to the AH8.1 and AH18.2 haplotypes (e.g.,121; 122), respectively, extending
from the DRB1*03-DQA1*0501-DQB1*0201 haplotype that is also strongly associated
with both of these diseases (p. 17). Therefore, as adjustment for LD effects seems absent in
these studies of C4A/B (e.g. see 120 for a recent example), these associations are most likely
not primary. A mention should also be given to the MICA and MICB genes, which have been
proposed as candidate genes for T1D and/or other AIDs by several studies (e.g.,61; 123; 124).
Although a number of SNPs in and around these genes were genotyped, the high polymor-
phy of these genes means that they must be considered poorly characterised with the present
marker set. Although a recent, well-powered study using sequence-based typing of these
genes was not able to find a T1D association independent of the HLA-DRB1 and -DQB1
genes,125 an interesting proposition may be to analyse these genes in terms of their role as
40

ligands for receptors on NK cells (NKG2D receptors), suggested by findings in other AIDs
and in studies of NOD mice, the mouse model for T1D (reviewed in 126).
In sum, although the coverage of the classical MHC by the markers in the T1DGC MHC
dataset was not complete, excluded regions do not seem critical.
Conventional association tests: LD in the MHC
Due to the known confounding effects of LD in the MHC, results of conventional associa-
tion analyses of the markers in this region were only treated in a summary manner in Paper
I-III. However, the overall picture of these results is useful for making several points about
a recurring theme in this thesis (and especially in Paper III): the importance of adjusting for
LD when searching for disease associated variants in the MHC.
Dependent associations
Figure 4 depicts conventional (E)TDT results for the SNPs, microsatellites and HLA loci
genotyped in the T1DGC MHC dataset (a similar plot of the results in Norwegian families is
given in Figure 1a of Paper III).
Figure 4: Conventional association results of markers in the T1DGC MHC dataset. Data was analysed in the proband dataset (cf. Paper I) using the TDT implemented in PLINK127 for the SNPs and the ETDT implemented in UNPHASED90 for the microsatellites and HLA loci. Positions of genes mentioned especially in the text and MHC regions are indicated for reference. Association results for DRB1-DQA1-DQB1 were too strong for a P-value to be generated.
Note the extreme significance levels in these results: given the threshold set in a recent
GWAS,30 an astounding 784 markers, or 33% of all studied markers, would have been
41
considered highly significant at a genome-wide level (P<5x10⁻⁷). The main cause of these
results is quite clearly demonstrated by the location of the peak of association; in fact, the P-
value for the DRB1-DQA1-DQB1 loci was unattainable, as the significance level exceeded
the limit of the analysis program. However, a rough guess would be that it would be in the
order of <10-200 in this dataset (comparative results in the Norwegian dataset, Paper III,
was P=5.8x10-101 for DRB1-DQA1-DQB1 and P=3.7x10⁻²⁶ for HLA-B). Note also the slopes
from this peak, with a steeper descent in the centromeric than in the telomeric direction, but
with a marked drop in significance telomeric of HLA-B. This picture matches well with the
known haplotype architecture of the MHC, with particularly long-range LD and high
conservation in the telomeric direction, and known recombination hotspots telomeric of
HLA-B and centromeric of HLA-DPB1.55; 128 In addition, the extreme conservation and high
frequency of the high-risk AH8.1 (p. 17) is likely to have made a large impact on these
results.
A notable observation is that the P-value of the HLA-B locus was almost as strong as the
markers surrounding DRB1-DQA1-DQB1, and many orders of magnitude stronger than
other markers in its own region. It is tempting to speculate that this reflects the likely
primary status of alleles at this gene, as shown in Paper I and III. However, the unusually
strong LD observed between the HLA-B allele B*08 and the DRB1*03-DQA1*0501-
DQB1*0201 haplotype (D’=0.76, r2=0.45 in the T1DGC dataset; e.g. compared to D’=0.55,
r2=0.13 for the HLA-C allele C*07, which is also located on the AH8.1 haplotype) may have
boosted the results more than for surrounding markers.
Masking of independent association
Perhaps somewhat counter-intuitive, given the highly significant associations in the tests
adjusted for LD with DRB1-DQA1-DQB1, seven of the nine best SNPs identified in the
T1DGC MHC screen were actually only marginally significant or non-significant by
conventional TDT, even by lenient standards (values close to or exceeding P=0.05;
rs4122198, rs1619379, rs1611133 and rs2394186 close to HLA-G; rs3130695 close to HLA-
C; rs4713468 in MICB and rs439121 close to RING1). This serves to show how LD with the
DRB1-DQA1-DQB1 loci not only can cause “dependent” associations, but can also lead to a
masking of real effects (as noted previously by others; e.g.,52). To illustrate, given a marker
B that represents a real, independent effect of a (primary) locus A, and LD between A and B:
42

if predisposing alleles at locus A are located on haplotypes with protective alleles at locus B,
then the indirect association of B due to LD with A can potentially mask the direct associa-
tion at the B locus (cf. Figure 1, p. 11). That is, overrepresentation in patients of predispos-
ing alleles at the B locus will be counter-weighted by LD between the protective alleles at
locus B and the predisposing alleles (that are also overrepresented in patients) at locus A. In
the case of the MHC, with the presence of conserved ancestral haplotypes and the complex,
multi-haplotype T1D association of the DRB1-DQA1-DQB1 loci, such effects are unlikely
to be evident from global LD values (which are the most commonly used, with estimates
across all alleles). For instance, for the above mentioned SNPs around HLA-G, global D’
with DRB1-DQA1-DQB1 was <0.32, but all of the SNPs were in stronger LD with the high-
risk, high-frequent haplotype DRB1*03-DQA1*0501-DQB1*0201. Crucially, the alleles in
positive LD with this haplotype were all protective (D’=0.36 to D’=0.63), thus matching
well with the above hypothetical situation. Moreover, when the effect at the primary locus A
is disproportionately large, as is evidently the case for the DRB1-DQA1-DQB1 effect in the
MHC, the LD does not even have to be very strong for such masking to occur.
A take-home message
The above discussion sums up to two important points. Firstly, results of conventional
association methods in the MHC are likely to provide no other information that an indirect
confirmation the DRB1-DQA1-DQB1 association with T1D, an association that has been
known for over three decades. Secondly, exclusive use of such methods is also likely to lead
to an inadvertent exclusion of markers with a real involvement in T1D. Although the picture
in other diseases with a primary association in the MHC will vary from that in T1D
depending on the strength of this association, neither the extreme LD in this region nor the
consequent problems with confounding are unique to T1D. Even so, conventional associa-
tion studies are still being published, also in high-ranking journals, with little or no regard to
this problem. Some of these studies are elaborate, with sophisticated genotyping techniques
and/or analysis methods, but with surprisingly primitive handling of the LD problem. The
perhaps most persistent of the associations reported in this way is the TNF -308 SNP (cf.
Paper III), which is known to be located on the high-risk haplotype AH8.1. A more recent
example is a large MHC screen showing an unconditional association between a variant in
the ITPR3 gene (at the centromeric end in Figure 4) and T1D,129 which later was shown to
be due to LD with the DRB1-DQA1-DQB1 loci.130 It is only to hope that the gravity of this
43

problem will seep through to the outside of the “inner circle” of researchers devoted to
MHC genetics, eventually diminishing the rate at which such reports are published.
“Peeling off” the effects of LD: conditional MHC analyses
Compared to the unadjusted association
results, the conditional main effects tests
yielded relatively modest P-values.
However, associations were still quite
strong, in particular in the large T1DGC
dataset (Paper I and II). Overall, the
results of the initial main effects test of
the SNPs in the T1DGC dataset
(adjusted for DRB1-DQA1-DQB1) very
clearly demonstrated the presence of
additional T1D susceptibility loci within
the MHC; plotting these results in an
overall quantile-quantile plot showed a marked deviation from the 45-degree line represent-
ing the null hypothesis of no DRB1-DQA1-DQB1 independent association (Figure 5). As
presented in Paper I, these results clustered in what appeared to be (at least) four separate
regions of the MHC, a picture that was roughly maintained also when adding consideration
of the results for the microsatellites from the same dataset (Paper II) and the candidate
markers in the Norwegian families (Paper III). Figure 6 gives a summary of the positions
Figure 5: Quantile-quantile plot of DRB1-DQA1-DQB1 independent associations of SNPs in the T1DGC MHC dataset (cf. Paper I).
Figure 6: Positions of and possible dependencies between DRB1-DQA1-DQB1 independent associations (best markers) from Paper I, II and III. Markers with signs of artefacts were excluded. Positions of closest genes, MHC region class and regions from Paper I are indicated for reference. Arrows indicate direction of explanatory power.
44

of the best DRB1-DQA1-DQB1 independent associations from all three papers, with
indications of possible dependencies between the reported associations.
Telomeric class I region - unresolved questions
In both Paper I and II, we identified novel DRB1-DQA1-DQB1 independent associations
for four SNPs and a microsatellite located in the vicinity of the HLA-G gene in the telomeric
part of the MHC class I region (region 1; Figure 6), which also appeared to be intercon-
nected. In addition, in Paper III, a significant association was found for HLA-A, which is
located relatively close to HLA-G (0.1 Mb) in the same region. Although interpreting
proximal distance as a sign that associations represent the same effect can be dangerous in
the MHC, distance is still a factor to consider, as demonstrated by the association “slope”
from DRB1-DQA1-DQB1 in Figure 4. For the associations in and around the HLA-A and
HLA-G genes, the notion that they represent the same effect was further supported by the
observation of strong LD between associated alleles showing the same risk directions of all
of the SNPs and HLA-A (Paper I). Moreover, the same appeared to be the case for HLA-A
and the microsatellite D6S2773 close to HLA-G (identified in Paper II), especially between
the predisposing alleles A*24 and D6S2773*227 (D’=0.99; r2=0.67) and the protective
alleles A*01 or A*31 and D6S2773*212 (D’=0.99; r2=0.03 and D’=1; r2<0.01, respec-
tively). Taking into account that the HLA-A gene was no longer significantly associated in
the T1DGC MHC dataset once the effects of the other HLA genes or the best SNP markers
had been adjusted for (Paper I; no markers telomeric of HLA-A were genotyped in the
Norwegian dataset, thus not allowing this hypothesis to be tested), the combined evidence
presented in this thesis is in favour of a location of an aetiological locus closer to HLA-G
than to HLA-A.
Previous findings for HLA-A
In contrast to our results, results clearly in favour of the HLA-A as the aetiological locus in
this region were presented in a recent, well-powered study by Nejentsev et al. (2007),108
including replication in two independent case-control materials. There are several differ-
ences between this and our studies that may have influenced the results:
First, although the case-control materials in Nejentsev’s study were large (up to almost 2000
cases and 3000 controls), the power was likely significantly less than in the 2321 multiplex
45

families (having at least two affected and one unaffected sibling in each family, in addition
to parents) of the T1DGC dataset, which had a potential of over 2300 cases (more than
doubled when all affected siblings were considered) and 7000 pseudo-controls.
Second, there were several differences in how the conditional analyses were performed.
Nejentsev et al. employed a recursive partitioning procedure for defining a subset of risk
strata at the HLA-DRB1 and -DQB1 loci (excluding HLA-DQA1), with subsequent treatment
of these loci independently in the regression procedures. Although these procedures were
likely to accurately capture the risk at each individual locus, it is questionable if the full risk
spectrum of these loci can be captured if not also considering the information that is
contained in specific combinations of alleles at these loci (pp. 15 and 30; Supplementary
methods of Paper I). In any case, differences in this procedure and ours could potentially
have introduced differences in the regression models. Similarly, the regression modelling
analyses performed in Paper I included a number of markers from all of the regions
identified, thus involving a larger number of parameters than the analyses in Nejentsev et
al., which adjusted only for HLA-DRB1, -DQB1 and HLA-B. Whereas our strategy is likely
to have resulted in better control for additional confounding by loci other than the DRB1-
DQA1-DQB1 genes, a drawback is that there were likely more loci included in the models
than strictly necessary, and some of these loci were later also identified as artefacts. Exactly
how and to what degree this could have influenced the results is difficult to predict, but it is
likely that these choices have made some kind of impact, at least on statistical power.
Third, the marker spacing in the study by Nejentsev et al. was higher than in the T1DGC
MHC dataset (1475 SNPs covering a total of 10 Mb; average spacing >6 kb compared to <2
kb in the latter dataset). Adding that none of the eight significant region 1 SNPs in the
T1DGC MHC dataset was included in Nejentsev’s study, this means that the association in
this region could possibly have been missed in the latter study. Moreover, in Nejentsev’s
study, the DRB1-DQB1 independent SNP associations in the telomeric class I region peaked
telomeric of HLA-A, in an area that overlaps with the narrower region 1 identified in the
T1DGC dataset, and several of the SNPs in this region showed significance levels
P<1.0x10⁻⁴ in Nejentsev’s study once also the effects of HLA-B had been accounted for.
Hence, it is possible that a weaker effect in this region was detected also in Nejentsev’s
study.
46

Finally, there may be differences between the sampled populations, as also Nejentsev et al.
arrived at a non-significant result for HLA-A in the subset of T1DGC families included in
their study (n = 850). One possibility includes population specific effects to British cases,
alternatively that subtle forms of population stratification was present in the case-control
populations used in Nejentsev’s study; although the T1DGC families are likely much more
stratified than these, the family-design of our studies should be robust to these issues (pp. 24
and 32).
In summary, both studies present strengths and weaknesses. In addition, there is a definite
possibility that the aetiological locus remains unidentified, and that both studies are actually
picking up the same effect, but but on slightly different haplotype backgrounds. Therefore, it
is apparent that a resolution to this question must involve further fine-mapping and replica-
tion studies in independent datasets.
Associations in the extended class I region
In addition to the HLA-A and HLA-G genes, several previous reports have indicated T1D
susceptibility loci in the extended class I region, telomeric of HLA-G; most notably, the
D6S2223 microsatellite marker (2.1 Mb from HLA-G),63; 111; 131-133 and two SNPs in the
UBD/MAS1L gene region (~0.3 Mb from HLA-G).58 However, although a marginally
significant DRB1-DQA1-DQB1 independent effect of D6S2223 was seen in the Northern
European subpopulation of the T1DGC MHC dataset, possibly indicating a population
specific effect or haplotype with a nearby aetiological locus, no association was detected in
the total dataset (Paper II). Moreover, a recent screen in this region indicates that the
variant responsible for the originally identified D6S2223 association is located telomeric of
this microsatellite (Viken, MK, Blomhoff, A, Olsson, M, Akselsen, HE, Pociot, F, et al.;
unpublished). Therefore, these effects are unlikely to be responsible for the effects observed
around the HLA-G locus in the T1DGC dataset.
The two SNPs in the UBD/MAS1L gene region identified in a recent study by Aly et al.
(2008) were not replicated in either Nejentsev’s study or ours, even if some of same families
were involved (Paper I). Also, the results presented by Aly et al. may be questioned: Firstly,
the starting point was a conventional association screen, with further focus on the region
including these two SNPs based solely on distance to the DRB1-DQA1-DQB1 loci. Sec-
ondly, the subsequent conditional analyses treated the HLA-DRB1 and -DQB1 loci sepa-
47

rately, as in Nejentsev’s study, but used grouping of alleles under a certain frequency
threshold instead of recursive partitioning. As noted in both our studies (particularly in
Supplementary methods of Paper I; see also p. 35) and by Nejentsev et al., this can
introduce artefacts in the regression analyses, which should therefore be validated using
alternative methods. A more serious concern is that Aly et al. apparently made no distinction
between DRB1*04 subtypes, which are known to confer very different risks and display
dissimilar LD patterns.128 Especially the DRB1*0401 and DRB1*0404 alleles are quite
common (22% and 6% in their dataset, respectively), potentially having a large impact on
their analyses. Adding to this is the observation that two of the SNPs we identified in region
1, as well as the D6S2773 microsatellite marker, mapped to the DRB1*0401-DQA1*0301-
DQB1*0302 haplotype, and that the SNPs showed strong LD with one of the SNPs
identified by Aly et al. (Paper I). Therefore, it seems likely that the associations identified
by Aly et al. were not primary, and possibly an artefact of their DRB1-DQB1 grouping
procedure.
The 8.1 and 18.2 ancestral haplotypes and T1D risk
The AH8.1 and AH18.2 have been strongly associated with increased risk for T1D in
numerous reports (p. 17), with an apparent higher risk for the latter relative to the former. As
the DRB1*03-DQA1*0501-DQB1*0201 haplotype is shared between these two, this
implies that differential risk, independent of DRB1-DQA1-DQB1, is conferred by one or
more loci located on these haplotypes. From the work presented in this thesis and that of
others, it is tempting to speculate that the B*18 allele at the HLA-B locus that gave this
haplotype its name is itself the second primary variant on the AH18.2 haplotype, as the
evidence for an independent association of this allele was compelling, both in the T1DGC
MHC dataset (Paper I) and in the Norwegian families (Paper III). In contrast, the B*08
allele on the AH8.1 haplotype does not seem to be involved with T1D in a primary way, as
no evidence for independent association was detected in the Norwegian families. Moreover,
although the results in the T1DGC MHC dataset showed a significantly decreased risk for
B*08 on the DRB1*03-DQA1*0501-DQB1*0201 haplotype, tendencies for associations in
the opposite direction were also observed on some of the other DRB1-DQA1-DQB1
haplotypes. Rather, it seems that the A*01 allele of HLA-A or a variant in high LD with this
allele is a better marker than B*08 for the decreased risk relative to DRB1*03-DQA1*0501-
DQB1*0201 on this haplotype. For example, in the Norwegian T1D families, although
48
A*01 was mostly located together with B*08 on the DRB1*03-DQA1*0501-DQB1*0201
haplotype (124 informative transmissions vs. only 7 with other HLA-B alleles), B*08 was
also located with other HLA-A alleles (75 informative transmissions), and only A*01 yielded
a significant transmission distortion on this haplotype (P=7.4x10⁻³ vs. P=0.62 for B*08). In
the T1DGC families, B*08 reached significance on this haplotype (OR 0.77; P=1.0x10⁻³),
but again, A*01 was mostly located together with B*08 but not vice versa (61 and 593
informative transmissions with other alleles, respectively, vs. 1282 with both), and the
association with HLA-A was much stronger (OR 0.69; P=1.5x10⁻⁶). Two of the SNPs in
region 1 (close to HLA-G) that showed association on this haplotype, rs1619379 and
rs1611133, both showed a stronger association than both A*01 and B*08 on this haplotype
(OR 0.67 P=9.0x10⁻⁷ and OR 0.63 P=1.0x10⁻⁸ for the protective alleles). However, this
picture was complicated by the apparent dependence of B*18 for the predisposing alleles of
these two SNPs. In contrast, the third SNP in this region with an association on this
haplotype, rs4122198, appeared to be associated independently of B*18, but showed a
weaker association (although stronger effect) than A*01 (OR 0.53 P=3.7x10⁻³). Interest-
ingly, though, a significant amount of DRB1*03-DQA1*0501-DQB1*0201 haplotypes with
the protective rs4122198*A allele also carried B*18 (16%; 92% of B*18-DRB1*03-
DQA1*0501-DQB1*0201 haplotypes), which is in stark contrast to A*01 (<1% with B*18)
and the protective alleles of the other two SNPs (4%/20% and 1%/6% for rs1619379 and
rs1611133, respectively). Thus, the effect of B*18 on this haplotype is therefore likely to
have masked some of the statistical effect for rs4122198, even if there is no functional
relationship between the alleles. In sum therefore, the apparently less predisposing effect of
the AH8.1 haplotype compared to other DRB1*03-DQA1*0501-DQB1*0201 haplotypes
could be explained by A*01, but more likely by some locus telomeric of HLA-A, marked by
rs4122198*A.
HLA-B: a strong candidate for a primary locus
The results presented for the HLA-B locus in Paper I and III are the most robust of any of
the results in this thesis, with consistent independence demonstrated both of DRB1-DQA1-
DQB1 and of a number of other MHC markers, in two independent datasets. Moreover, the
evidence in particular for the B*18 and B*39 alleles seem consistent across different
studies.58; 108; 134-136 Other alleles, such as the B*13 allele identified in Paper I, could also be
involved, but present evidence does not seem conclusive. It is notable that the identified
49
effects appear to be relatively rare; the B*18 allele was present in only 8.0% and 3.6% of
the parents in the T1DGC MHC dataset (Paper I) and the Norwegian families (Paper III),
respectively, whereas the B*39 allele was even more uncommon, only 2.9% and 2.8%.
Hence, both alleles partly fall beneath the 5% limit that is often used in genetic association
studies involving SNPs. The increased presence of the B*18 allele in the T1DGC MHC
dataset compared to the Norwegain dataset is most probably due to the inclusion of families
from Southern Europe (especially Sardinia), where this allele is more common than in
Caucasians in general.64
It is somewhat ironic that after over three decades of research that started with identification
of HLA-B as a T1D-associated locus, this gene is once again identified as a strong candidate
for a primary involvement in T1D, although the alleles most probably involved have
changed. It is important to stress, though, that although the genetic evidence for this locus is
very compelling, firm establishment of this locus as a primary risk locus can only come
after further functional characterisation and establishment of disease mechanisms.
Does the central MHC contain unidentified T1D susceptibility factors?
In addition to HLA-B, several signs of independent associations were found for the HLA-C
gene in the T1DGC MHC dataset, in addition to the SNP rs3130695 located in the vicinity
of this gene (Paper I). Both of these markers appeared to be at least partly independent of
the HLA-B gene, in addition to the DRB1-DQA1-DQB1 genes. The function of the HLA-C
gene is similar to the HLA-B gene, and so it would not be a big surprise if this gene was also
involved in T1D. However, any effect of this gene appears to be smaller than for the HLA-B
locus. Moreover, inconsistent results across different studies have been reported with
regards to the specific alleles involved. Although our study indicated an independent role for
the C*01, C*02 and C*04 alleles, these results will have to be confirmed in replication
studies.
An interesting possibility is to analyse the HLA genes in terms of their role as ligands for
NK cell receptors, in this case so-called killer-cell immunoglobulin-like receptors (KIRs).
These receptors govern inhibition or activation of NK cells, which could have an important
role in the autoimmune-mediated destruction of �-cells. For instance, an association was
found between aggressive insulitis and presence of NK cells in the infiltrate of NOD
mice.137 Unlike the highly polymorphous variation in the HLA genes in terms of their
50
interaction with T-cells, only two alleles for each of the HLA-A, -C and -B genes have been
identified when defined in terms of interaction with KIRs. As the HLA-C gene showed a
much more complex haplotype association pattern than the HLA-B gene in the T1DGC
MHC dataset, we actually performed such analyses for HLA-C, but this classification did
not appear to explain the global association better than the classical coding of HLA-C alleles
(data not shown). However, the possibility still remains that analyses of interactions with
specific KIRs could reveal processes relevant for T1D, as has already been suggested by
others.138; 139
In Paper III, a SNP in the AIF1 gene of the MHC class III region, centromeric of HLA-B,
was identified as independently associated with T1D in Norwegian families, both of DRB1-
DQA1-DQB1 and of HLA-B, but no association was found in the T1DGC MHC dataset.
However, haplotype analyses revealed similar association patterns on the different DRB1-
DQA1-DQB1 haplotypes, indicating that this SNP marked the same effect in both datasets.
Although this indicates that this SNP is not a primary locus, other variants in the vicinity
could be involved. The class III region is extremely gene-dense, and many of the genes in
this region are strong candidates for T1D involvement. Although associations of the
promoter polymorphisms in the TNF gene (e.g. TNF -308), which are among the most
intensely studied variants in this region, have yet to demonstrate convincing, independent
association with T1D, other variants in this region could still be involved. However, from
the results and discussion presented in Paper III, it seems clear that earlier reports of
associations in this region should be treated with caution, as few have performed proper
adjustment for known risk factors elsewhere in the MHC. Moreover, the close proximity to
the HLA-B gene makes it likely that future T1D studies in this region should, at the very
least, adjust for LD effects of both DRB1-DQA1-DQB1 and HLA-B. The importance of this
procedure was clearly demonstrated in the case of the two SNPs (rs4713468 and rs2246626)
identified in the MICB gene in the T1DGC MHC dataset, which, although appeared
independent in the regression analyses showed clear signs of connections with associated
alleles of the HLA-B gene.
A similar effect was seen as far away as the C6orf10 gene, located on the telomeric border
of the class II region (0.9 Mb centromeric of HLA-B); this gene seems an unlikely candidate
for T1D involvement, but still three of the best identified markers with DRB1-DQA1-DQB1
independent associations mapped to this gene (rs3132959 in Paper I and DG6S398 and
51

D6S2889 in Paper II; in addition, six more SNPs in this gene showed significant DRB1-
DQA1-DQB1 independent association in the first main effects tests of Paper I). The SNP
association in this gene was, as already suggested, determined to be dependent on HLA-B,
but investigations of possible relationships with HLA-B were not done for the microsatellites
(Paper II). However, the latter markers are much more polymorphic than the SNP, and
showed associations on more independent DRB1-DQA1-DQB1 haplotypes in the haplotype
analyses. Therefore, the possibility remains that an aetiological locus independent of HLA-B
is located in the vicinity of these microsatellites. However, this can only be determined by
investigation of, first, the relationship with HLA-B, and second, by further fine-mapping of
the surrounding region. Of note, a SNP in the BTNL2 gene, which has been reported
associated with the autoimmune disease sarcoidosis and is located in the vicinity of the
C6orf10 gene,140; 141 does not seem a likely candidate, as neither we (Paper III, also, no
association was seen in the T1DGC MHC dataset; unpublished) nor others have found
independent association of this SNP in T1D,142 or in other AIDs.142-144
HLA-DPB1 or additional/alternative factors?
In Paper I, the DRB1-DQA1-DQB1 independent associations identified for alleles at the
HLA-DPB1 locus and two SNPs just inside the border of the extended class II region
appeared to be partly redundant. This could indicate that neither of these markers are
primary loci, but rather that all mark a primary locus in the vicinity. The COL11A2 and
RING1 genes closest to the two SNPs do not seem to be good candidates for T1D-
involvement, as functional characterisation suggests that they encode a minor fibrillar
collagen [GeneID: 1302] and a transcriptional repression relevant for developmental
processes involving polycomb-group genes [GeneID: 6015], respectively. However the
retinoic acid receptor beta (RXRB) gene located between these two genes, which also
demonstrated suggestive evidence in a recent study,145 could be a promising candidate; the
rs2076310 located in intron 3 of this gene was also among the 76 SNPs identified with
DRB1-DQA1-DQB1 independent association in the first main effects test in Paper I
(P=5.6x10⁻⁶).
52

FCRL3 and AID: small effects and statistical power
In contrast to the results for the MHC, no evidence for association was detected between
T1D and the FCRL3 -169T>C SNP, which is in concordance with the negative findings in
four recent studies.146-149 Moreover, the additional negative results for SLE, UC, CD and
PSC, also in concordance with recent results reported by others (except PSC for which ours
is the only report so far),150-152 indicated that this SNP is not common to all AIDs. However,
the risk conferred by this locus in RA also appears to be much smaller than initially
suggested, opening up the possibility that negative findings may be type II errors. This can
be a variant of the “winner’s curse” phenomenon, originally coined for competitive
situations such as auctions when a successful buyer finds that he or she has paid too much
for a commodity of uncertain value (e.g. 153): in genetics, the term is applied to the tendency
for first reports of novel disease associated variants to overestimate the risk effect of this
variant.24 Hence, much larger study populations may be needed than what was included in
our study to get definitive results. A good example of this are the variants in the CTLA4
gene, which were only definitely confirmed as associated with T1D after performing a large
study that included 3671 T1D families, with odds ratios only around 1.15.100
Conclusions
In conclusion, the work presented in this thesis clearly demonstrate the importance of
adjusting for LD effects in association studies in the MHC, and provides a strategy for how
this can be done. Using this strategy, the first three papers of this thesis present novel
evidence for T1D-associated factors in the MHC, and either confirmation or demonstration
of the likely non-involvement in T1D of previously suggested variants. Moreover, the good
statistical power and coverage of the classical MHC offered by the T1DGC MHC dataset
makes it likely that most of the T1D-associated variants in this complex have been, at least
indirectly, identified with this dataset. However, determining the exact location of the
aetiological loci, with a probable exception for the HLA-B locus, will depend on further
fine-mapping in the suggested regions. In addition, we confirmed the association with RA
for a SNP in the promoter region of the FCRL3 gene, but the sum of our results and those of
others suggest that this is not a risk variant common to all AIDs.
53

54
Future perspectives
In the wake of GWAS and other elaborate screens such as the T1DGC MHC fine-mapping
project, involving simultaneous characterisation of a large number of genetic markers, it
seems clear that follow-up studies focused on smaller regions pinpointed by these studies
are needed. Even if the marker density is good as in the T1DGC MHC dataset, these
represent only a fraction of the total genetic variation, leaving ample possibilities for
missing the true aetiological locus. In addition, problems caused by strong LD in identifying
the true aetiological variants are not limited to the MHC. In such situations, methods similar
to what we have used in the first three papers of this thesis are highly relevant.
For future genetic fine-mapping for T1D susceptibility factors in the MHC, the need for
proper adjustment for LD effects is increasingly acknowledged. With the results presented
in Paper I, II and III in this thesis, as well as the work of others, a picture is emerging of
narrow, defined regions that should be targeted for further fine-mapping. This represents a
huge improvement compared to the patchy and uncertain picture of associations in this
region that has been the case before. The process further is likely to be stepwise, with
increasing confidence in the true disease involvement of identified risk factors. In turn, the
process of adjusting for LD confounding is likely to become more accurate, as the precise
risk alleles may be included in the analyses instead of proximal factors. Hence, the power to
detect true associations is also likely to increase with subsequent studies. Already, the
evidence for HLA-B is so compelling that possible LD effects from this locus, in particular
the B*18 and B*39 alleles, should be investigated in all analyses of additional effects in the
MHC, and at the least in the regions closest to this locus (i.e. the class III and centromeric
class I region). Moreover, the T1DGC is already well on its way in efforts to phase alleles of
most of the major HLA loci across the MHC in the individuals of the T1DGC MHC dataset,
which will lead to a deeper knowledge of the haplotype patterns in this population. As
demonstrated by the comparatively simple haplotype analyses presented in this thesis, such
knowledge will be an invaluable complement to other methods, such as conditional
regression analyses. With further narrowing down of genetic susceptibility regions, the
employment of targeted and disease-specific functional studies also becomes feasible, which
will be a necessity for firm establishment of the disease involvement of proposed loci.

REFERENCES 1. The Diabetes Control and Complications Trial Research Group. The effect of intensive treatment of
diabetes on the development and progression of long-term complications in insulin-dependent diabe-tes mellitus. N Engl J Med 1993; 329(14): 977-986.
2. DIAMOND Project Group. Incidence and trends of childhood Type 1 diabetes worldwide 1990-1999. Diabet Med 2006; 23(8): 857-866.
3. Gepts W. Pathologic anatomy of the pancreas in juvenile diabetes mellitus. Diabetes 1965; 14(10): 619-633.
4. Pinkse GG, Tysma OH, Bergen CA, Kester MG, Ossendorp F, van Veelen PA et al. Autoreactive CD8 T cells associated with beta cell destruction in type 1 diabetes. Proc Natl Acad Sci U S A 2005; 102(51): 18425-18430.
5. Arif S, Tree TI, Astill TP, Tremble JM, Bishop AJ, Dayan CM et al. Autoreactive T cell responses show proinflammatory polarization in diabetes but a regulatory phenotype in health. J Clin Invest 2004; 113(3): 451-463.
6. Roep BO. The role of T-cells in the pathogenesis of Type 1 diabetes: from cause to cure. Diabetologia 2003; 46(3): 305-321.
7. Faideau B, Larger E, Lepault F, Carel JC & Boitard C. Role of beta-cells in type 1 diabetes patho-genesis. Diabetes 2005; 54(Suppl 2): S87-96.
8. Taplin CE & Barker JM. Autoantibodies in type 1 diabetes. Autoimmunity 2008; 41(1): 11-18. 9. Verge CF, Gianani R, Kawasaki E, Yu L, Pietropaolo M, Jackson RA et al. Prediction of type I
diabetes in first-degree relatives using a combination of insulin, GAD, and ICA512bdc/IA-2 autoanti-bodies. Diabetes 1996; 45(7): 926-933.
10. Redondo MJ, Rewers M, Yu L, Garg S, Pilcher CC, Elliott RB et al. Genetic determination of islet cell autoimmunity in monozygotic twin, dizygotic twin, and non-twin siblings of patients with type 1 diabetes: prospective twin study. BMJ 1999; 318(7185): 698-702.
11. Redondo MJ, Yu L, Hawa M, Mackenzie T, Pyke DA, Eisenbarth GS et al. Heterogeneity of type I diabetes: analysis of monozygotic twins in Great Britain and the United States. Diabetologia 2001; 44(3): 354-362.
12. Knip M, Veijola R, Virtanen SM, Hyoty H, Vaarala O & Akerblom HK. Environmental triggers and determinants of type 1 diabetes. Diabetes 2005; 54(Suppl 2): S125-136.
13. Yoon JW & Jun HS. Viruses cause type 1 diabetes in animals. Ann N Y Acad Sci 2006; 1079: 138-146.
14. Walker FO. Huntington's disease. Lancet 2007; 369(9557): 218-228. 15. Rao DC. An Overview of the Genetic Dissection of Complex Traits. Adv Genet 2008; 60: 3-34. 16. Borecki IB & Province MA. Linkage and Association: Basic Concepts. Adv Genet 2008; 60: 51-74. 17. Risch NJ. Searching for genetic determinants in the new millennium. Nature 2000; 405(6788): 847-
856. 18. Kruglyak L. Prospects for whole-genome linkage disequilibrium mapping of common disease genes.
Nat Genet 1999; 22(2): 139-144. 19. Reich DE, Cargill M, Bolk S, Ireland J, Sabeti PC, Richter DJ et al. Linkage disequilibrium in the
human genome. Nature 2001; 411(6834): 199-204. 20. The International HapMap Consortium. A haplotype map of the human genome. Nature 2005;
437(7063): 1299-1320. 21. Pritchard JK & Cox NJ. The allelic architecture of human disease genes: common disease-common
variant...or not? Hum Mol Genet 2002; 11(20): 2417-2423. 22. Peng B & Kimmel M. Simulations provide support for the common disease-common variant
hypothesis. Genetics 2007; 175(2): 763-776. 23. Lander ES. The new genomics: global views of biology. Science 1996; 274(5287): 536-539. 24. Lohmueller KE, Pearce CL, Pike M, Lander ES & Hirschhorn JN. Meta-analysis of genetic
association studies supports a contribution of common variants to susceptibility to common disease. Nat Genet 2003; 33(2): 177-182.
55

25. Terwilliger JD & Hiekkalinna T. An utter refutation of the "Fundamental Theorem of the HapMap". Eur J Hum Genet 2006; 14(4): 426-437.
26. Fisher SA & Lewis CM. Power of Genetic Association Studies in the Presence of Linkage Disequilib-rium and Allelic Heterogeneity. Hum Hered 2008; 66(4): 210-222.
27. Lie BA, Viken MK, Akselsen HE, Flam ST, Pociot F, Nerup J et al. Association analysis in type 1 diabetes of the PRSS16 gene encoding a thymus-specific serine protease. Hum Immunol 2007; 68(7): 592-598.
28. Sabater-Lleal M, Almasy L, Martinez-Marchan E, Martinez-Sanchez E, Souto R, Blangero J et al. Genetic architecture of the F7 gene in a Spanish population: implication for mapping complex dis-eases and for functional assays. Clin Genet 2006; 69(5): 420-428.
29. Todd JA, Walker NM, Cooper JD, Smyth DJ, Downes K, Plagnol V et al. Robust associations of four new chromosome regions from genome-wide analyses of type 1 diabetes. Nat Genet 2007; 39(7): 857-864.
30. Wellcome Trust Case Control Consortium. Genome-wide association study of 14,000 cases of seven common diseases and 3,000 shared controls. Nature 2007; 447(7145): 661-678.
31. Hakonarson H, Grant SF, Bradfield JP, Marchand L, Kim CE, Glessner JT et al. A genome-wide association study identifies KIAA0350 as a type 1 diabetes gene. Nature 2007; 448(7153): 591-594.
32. Burton PR, Clayton DG, Cardon LR, Craddock N, Deloukas P, Duncanson A et al. Association scan of 14,500 nonsynonymous SNPs in four diseases identifies autoimmunity variants. Nat Genet 2007; 39(11): 1329-1337.
33. Parkes M, Barrett JC, Prescott NJ, Tremelling M, Anderson CA, Fisher SA et al. Sequence variants in the autophagy gene IRGM and multiple other replicating loci contribute to Crohn's disease suscepti-bility. Nat Genet 2007; 39(7): 830-832.
34. The International Multiple Sclerosis Genetics Consortium. Risk Alleles for Multiple Sclerosis Identified by a Genomewide Study. N Engl J Med 2007; 357(9): 851-862.
35. Pearce SH & Merriman TR. Genetic progress towards the molecular basis of autoimmunity. Trends Mol Med 2006; 12(2): 90-98.
36. Singal DP & Blajchman MA. Histocompatibility (HL-A) antigens, lymphocytotoxic antibodies and tissue antibodies in patients with diabetes mellitus. Diabetes 1973; 22(6): 429-432.
37. Gale EA. The discovery of type 1 diabetes. Diabetes 2001; 50(2): 217-226. 38. Rich SS. Mapping genes in diabetes. Genetic epidemiological perspective. Diabetes 1990; 39(11):
1315-1319. 39. Risch N. Assessing the role of HLA-linked and unlinked determinants of disease. Am J Hum Genet
1987; 40(1): 1-14. 40. Concannon P, Erlich HA, Julier C, Morahan G, Nerup J, Pociot F et al. Type 1 diabetes: evidence for
susceptibility loci from four genome-wide linkage scans in 1,435 multiplex families. Diabetes 2005; 54(10): 2995-3001.
41. Horton R, Wilming L, Rand V, Lovering RC, Bruford EA, Khodiyar VK et al. Gene map of the extended human MHC. Nat Rev Genet 2004; 5(12): 889-899.
42. Xie T, Rowen L, Aguado B, Ahearn ME, Madan A, Qin S et al. Analysis of the gene-dense major histocompatibility complex class III region and its comparison to mouse. Genome Res 2003; 13(12): 2621-2636.
43. Klein J & Sato A. The HLA system. Second of two parts. N Engl J Med 2000; 343(11): 782-786. 44. Thorsby E. Invited anniversary review: HLA associated diseases. Hum Immunol 1997; 53(1): 1-11. 45. Thomson G, Valdes AM, Noble JA, Kockum I, Grote MN, Najman J et al. Relative predispositional
effects of HLA class II DRB1-DQB1 haplotypes and genotypes on type 1 diabetes: a meta-analysis. Tissue Antigens 2007; 70(2): 110-127.
46. Erlich H, Valdes AM, Noble J, Carlson JA, Varney M, Concannon P et al. HLA DR-DQ Haplotypes and Genotypes and Type 1 Diabetes Risk: Analysis of the Type 1 Diabetes Genetics Consortium Families. Diabetes 2008; 57(4): 1084-1092.
47. Koeleman BP, Lie BA, Undlien DE, Dudbridge F, Thorsby E, de Vries RR et al. Genotype effects and epistasis in type 1 diabetes and HLA-DQ trans dimer associations with disease. Genes Immun 2004; 5(5): 381-388.
56

48. Tollefsen S, Arentz-Hansen H, Fleckenstein B, Molberg O, Raki M, Kwok WW et al. HLA-DQ2 and -DQ8 signatures of gluten T cell epitopes in celiac disease. J Clin Invest 2006; 116(8): 2226-2236.
49. Cucca F, Lampis R, Congia M, Angius E, Nutland S, Bain SC et al. A correlation between the relative predisposition of MHC class II alleles to type 1 diabetes and the structure of their proteins. Hum Mol Genet 2001; 10(19): 2025-2037.
50. Jones EY, Fugger L, Strominger JL & Siebold C. MHC class II proteins and disease: a structural perspective. Nat Rev Immunol 2006; 6(4): 271-282.
51. Undlien DE, Friede T, Rammensee HG, Joner G, Dahl-Jorgensen K, Sovik O et al. HLA-encoded genetic predisposition in IDDM: DR4 subtypes may be associated with different degrees of protec-tion. Diabetes 1997; 46(1): 143-149.
52. Thomson G, Barcellos LF & Valdes AM. Searching for Additional Disease Loci in a Genomic Region. Adv Genet 2008; 60: 253-292.
53. Aly TA, Ide A, Jahromi MM, Barker JM, Fernando MS, Babu SR et al. Extreme genetic risk for type 1A diabetes. Proc Natl Acad Sci U S A 2006; 103(38): 14074-14079.
54. Degli-Esposti MA, Leaver AL, Christiansen FT, Witt CS, Abraham LJ & Dawkins RL. Ancestral haplotypes: conserved population MHC haplotypes. Hum Immunol 1992; 34(4): 242-252.
55. Miretti MM, Walsh EC, Ke X, Delgado M, Griffiths M, Hunt S et al. A high-resolution linkage-disequilibrium map of the human major histocompatibility complex and first generation of tag single-nucleotide polymorphisms. Am J Hum Genet 2005; 76(4): 634-646.
56. Cudworth AG & Woodrow JC. Letter: HL-A antigens and diabetes mellitus. Lancet 1974; 2(7889): 1153.
57. Nerup J, Platz P, Andersen OO, Christy M, Lyngsoe J, Poulsen JE et al. HL-A antigens and diabetes mellitus. Lancet 1974; 2(7885): 864-866.
58. Aly TA, Baschal EE, Jahromi MM, Fernando MS, Babu SR, Fingerlin TE et al. Analysis of SNPs Identifies Major Type 1A Diabetes Locus Telomeric of the MHC. Diabetes 2008; 57(3): 770-776.
59. Aly TA, Eller E, Ide A, Gowan K, Babu SR, Erlich HA et al. Multi-SNP analysis of MHC region: remarkable conservation of HLA-A1-B8-DR3 haplotype. Diabetes 2006; 55(5): 1265-1269.
60. Valdes AM, Wapelhorst B, Concannon P, Erlich HA, Thomson G & Noble JA. Extended DR3-D6S273-HLA-B haplotypes are associated with increased susceptibility to type 1 diabetes in US Cau-casians. Tissue Antigens 2005; 65(1): 115-119.
61. Bilbao JR, Martin-Pagola A, Perez De Nanclares G, Calvo B, Vitoria JC, Vazquez F et al. HLA-DRB1 and MICA in autoimmunity: common associated alleles in autoimmune disorders. Ann N Y Acad Sci 2003; 1005: 314-318.
62. Price P, Witt C, Allcock R, Sayer D, Garlepp M, Kok CC et al. The genetic basis for the association of the 8.1 ancestral haplotype (A1, B8, DR3) with multiple immunopathological diseases. Immunol Rev 1999; 167: 257-274.
63. Johansson S, Lie BA, Todd JA, Pociot F, Nerup J, Cambon-Thomsen A et al. Evidence of at least two type 1 diabetes susceptibility genes in the HLA complex distinct from HLA-DQB1, -DQA1 and -DRB1. Genes Immun 2003; 4(1): 46-53.
64. Urcelay E, Santiago JL, de la Calle H, Martinez A, Mendez J, Ibarra JM et al. Type 1 diabetes in the Spanish population: additional factors to class II HLA-DR3 and -DR4. BMC Genomics 2005; 6(1): 56.
65. Tozzoli R. Recent advances in diagnostic technologies and their impact in autoimmune diseases. Autoimmun Rev 2007; 6(6): 334-340.
66. Tait KF, Marshall T, Berman J, Carr-Smith J, Rowe B, Todd JA et al. Clustering of autoimmune disease in parents of siblings from the Type 1 diabetes Warren repository. Diabet Med 2004; 21(4): 358-362.
67. Somers EC, Thomas SL, Smeeth L & Hall AJ. Autoimmune diseases co-occurring within individuals and within families: a systematic review. Epidemiology 2006; 17(2): 202-217.
68. Floreani A, Rizzotto ER, Ferrara F, Carderi I, Caroli D, Blasone L et al. Clinical course and outcome of autoimmune hepatitis/primary sclerosing cholangitis overlap syndrome. Am J Gastroenterol 2005; 100(7): 1516-1522.
57

69. Lawson A, West J, Aithal GP & Logan RF. Autoimmune cholestatic liver disease in people with coeliac disease: a population-based study of their association. Aliment Pharmacol Ther 2005; 21(4): 401-405.
70. Becker KG, Simon RM, Bailey-Wilson JE, Freidlin B, Biddison WE, McFarland HF et al. Clustering of non-major histocompatibility complex susceptibility candidate loci in human autoimmune dis-eases. Proc Natl Acad Sci U S A 1998; 95(17): 9979-9984.
71. Ravelli A & Martini A. Juvenile idiopathic arthritis. Lancet 2007; 369(9563): 767-778. 72. Cervin C, Lyssenko V, Bakhtadze E, Lindholm E, Nilsson P, Tuomi T et al. Genetic similarities
between latent autoimmune diabetes in adults, type 1 diabetes, and type 2 diabetes. Diabetes 2008; 57(5): 1433-1437.
73. Naik RG & Palmer JP. Latent autoimmune diabetes in adults (LADA). Rev Endocr Metab Disord 2003; 4(3): 233-241.
74. Leslie RD, Williams R & Pozzilli P. Clinical review: Type 1 diabetes and latent autoimmune diabetes in adults: one end of the rainbow. J Clin Endocrinol Metab 2006; 91(5): 1654-1659.
75. Gordon D, Heath SC & Ott J. True pedigree errors more frequent than apparent errors for single nucleotide polymorphisms. Hum Hered 1999; 49(2): 65-70.
76. Gordon D, Haynes C, Johnnidis C, Patel SB, Bowcock AM & Ott J. A transmission disequilibrium test for general pedigrees that is robust to the presence of random genotyping errors and any number of untyped parents. Eur J Hum Genet 2004; 12(9): 752-761.
77. Gordon D, Heath SC, Liu X & Ott J. A transmission/disequilibrium test that allows for genotyping errors in the analysis of single-nucleotide polymorphism data. Am J Hum Genet 2001; 69(2): 371-380.
78. Xu J, Turner A, Little J, Bleecker ER & Meyers DA. Positive results in association studies are associated with departure from Hardy-Weinberg equilibrium: hint for genotyping error? Hum Genet 2002; 111(6): 573-574.
79. Wigginton JE & Abecasis GR. PEDSTATS: descriptive statistics, graphics and quality assessment for gene mapping data. Bioinformatics 2005; 21(16): 3445-3447.
80. Ewens WJ & Spielman RS. What is the significance of a significant TDT? Hum Hered 2005; 60(4): 206-210.
81. Spielman RS, McGinnis RE & Ewens WJ. Transmission test for linkage disequilibrium: the insulin gene region and insulin-dependent diabetes mellitus (IDDM). Am J Hum Genet 1993; 52(3): 506-516.
82. Sham PC & Curtis D. An extended transmission/disequilibrium test (TDT) for multi-allele marker loci. Ann Hum Genet 1995; 59(Pt 3): 323-336.
83. Thomson G. Mapping disease genes: family-based association studies. Am J Hum Genet 1995; 57(2): 487-498.
84. Schaid DJ. General score tests for associations of genetic markers with disease using cases and their parents. Genet Epidemiol 1996; 13(5): 423-449.
85. Schaid DJ & Sommer SS. Genotype relative risks: methods for design and analysis of candidate-gene association studies. Am J Hum Genet 1993; 53(5): 1114-1126.
86. Weinberg CR. Allowing for missing parents in genetic studies of case-parent triads. Am J Hum Genet 1999; 64(4): 1186-1193.
87. Weinberg CR. Methods for detection of parent-of-origin effects in genetic studies of case-parents triads. Am J Hum Genet 1999; 65(1): 229-235.
88. Cordell HJ, Barratt BJ & Clayton DG. Case/pseudocontrol analysis in genetic association studies: A unified framework for detection of genotype and haplotype associations, gene-gene and gene-environment interactions, and parent-of-origin effects. Genet Epidemiol 2004; 26(3): 167-185.
89. Laird NM & Lange C. Family-Based Methods for Linkage and Association Analysis. Adv Genet 2008; 60: 219-252.
90. Dudbridge F. Pedigree disequilibrium tests for multilocus haplotypes. Genet Epidemiol 2003; 25(2): 115-121.
91. Wittke-Thompson JK, Pluzhnikov A & Cox NJ. Rational inferences about departures from Hardy-Weinberg equilibrium. Am J Hum Genet 2005; 76(6): 967-986.
58
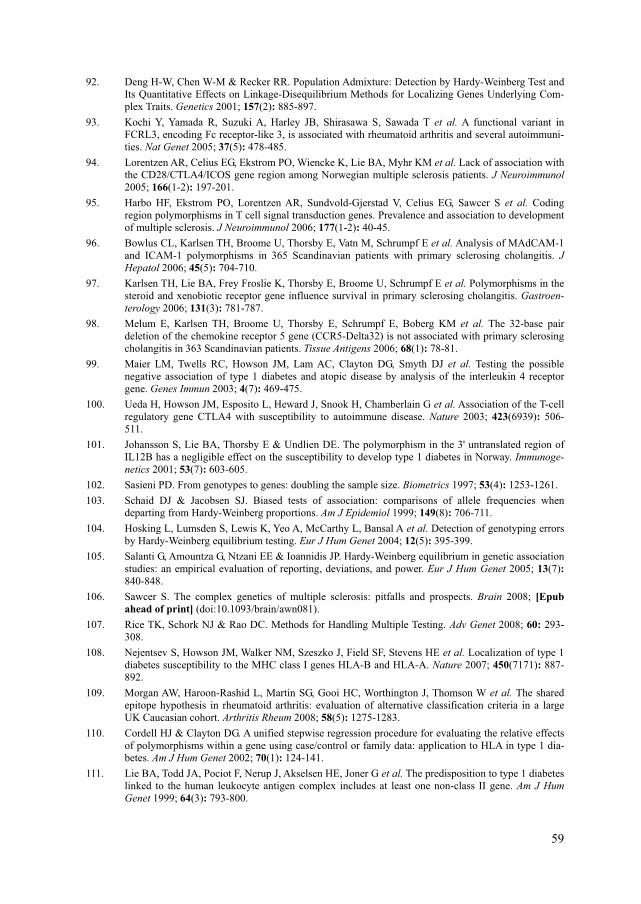
92. Deng H-W, Chen W-M & Recker RR. Population Admixture: Detection by Hardy-Weinberg Test and Its Quantitative Effects on Linkage-Disequilibrium Methods for Localizing Genes Underlying Com-plex Traits. Genetics 2001; 157(2): 885-897.
93. Kochi Y, Yamada R, Suzuki A, Harley JB, Shirasawa S, Sawada T et al. A functional variant in FCRL3, encoding Fc receptor-like 3, is associated with rheumatoid arthritis and several autoimmuni-ties. Nat Genet 2005; 37(5): 478-485.
94. Lorentzen AR, Celius EG, Ekstrom PO, Wiencke K, Lie BA, Myhr KM et al. Lack of association with the CD28/CTLA4/ICOS gene region among Norwegian multiple sclerosis patients. J Neuroimmunol 2005; 166(1-2): 197-201.
95. Harbo HF, Ekstrom PO, Lorentzen AR, Sundvold-Gjerstad V, Celius EG, Sawcer S et al. Coding region polymorphisms in T cell signal transduction genes. Prevalence and association to development of multiple sclerosis. J Neuroimmunol 2006; 177(1-2): 40-45.
96. Bowlus CL, Karlsen TH, Broome U, Thorsby E, Vatn M, Schrumpf E et al. Analysis of MAdCAM-1 and ICAM-1 polymorphisms in 365 Scandinavian patients with primary sclerosing cholangitis. J Hepatol 2006; 45(5): 704-710.
97. Karlsen TH, Lie BA, Frey Froslie K, Thorsby E, Broome U, Schrumpf E et al. Polymorphisms in the steroid and xenobiotic receptor gene influence survival in primary sclerosing cholangitis. Gastroen-terology 2006; 131(3): 781-787.
98. Melum E, Karlsen TH, Broome U, Thorsby E, Schrumpf E, Boberg KM et al. The 32-base pair deletion of the chemokine receptor 5 gene (CCR5-Delta32) is not associated with primary sclerosing cholangitis in 363 Scandinavian patients. Tissue Antigens 2006; 68(1): 78-81.
99. Maier LM, Twells RC, Howson JM, Lam AC, Clayton DG, Smyth DJ et al. Testing the possible negative association of type 1 diabetes and atopic disease by analysis of the interleukin 4 receptor gene. Genes Immun 2003; 4(7): 469-475.
100. Ueda H, Howson JM, Esposito L, Heward J, Snook H, Chamberlain G et al. Association of the T-cell regulatory gene CTLA4 with susceptibility to autoimmune disease. Nature 2003; 423(6939): 506-511.
101. Johansson S, Lie BA, Thorsby E & Undlien DE. The polymorphism in the 3' untranslated region of IL12B has a negligible effect on the susceptibility to develop type 1 diabetes in Norway. Immunoge-netics 2001; 53(7): 603-605.
102. Sasieni PD. From genotypes to genes: doubling the sample size. Biometrics 1997; 53(4): 1253-1261. 103. Schaid DJ & Jacobsen SJ. Biased tests of association: comparisons of allele frequencies when
departing from Hardy-Weinberg proportions. Am J Epidemiol 1999; 149(8): 706-711. 104. Hosking L, Lumsden S, Lewis K, Yeo A, McCarthy L, Bansal A et al. Detection of genotyping errors
by Hardy-Weinberg equilibrium testing. Eur J Hum Genet 2004; 12(5): 395-399. 105. Salanti G, Amountza G, Ntzani EE & Ioannidis JP. Hardy-Weinberg equilibrium in genetic association
studies: an empirical evaluation of reporting, deviations, and power. Eur J Hum Genet 2005; 13(7): 840-848.
106. Sawcer S. The complex genetics of multiple sclerosis: pitfalls and prospects. Brain 2008; [Epub ahead of print] (doi:10.1093/brain/awn081).
107. Rice TK, Schork NJ & Rao DC. Methods for Handling Multiple Testing. Adv Genet 2008; 60: 293-308.
108. Nejentsev S, Howson JM, Walker NM, Szeszko J, Field SF, Stevens HE et al. Localization of type 1 diabetes susceptibility to the MHC class I genes HLA-B and HLA-A. Nature 2007; 450(7171): 887-892.
109. Morgan AW, Haroon-Rashid L, Martin SG, Gooi HC, Worthington J, Thomson W et al. The shared epitope hypothesis in rheumatoid arthritis: evaluation of alternative classification criteria in a large UK Caucasian cohort. Arthritis Rheum 2008; 58(5): 1275-1283.
110. Cordell HJ & Clayton DG. A unified stepwise regression procedure for evaluating the relative effects of polymorphisms within a gene using case/control or family data: application to HLA in type 1 dia-betes. Am J Hum Genet 2002; 70(1): 124-141.
111. Lie BA, Todd JA, Pociot F, Nerup J, Akselsen HE, Joner G et al. The predisposition to type 1 diabetes linked to the human leukocyte antigen complex includes at least one non-class II gene. Am J Hum Genet 1999; 64(3): 793-800.
59

112. Thomson G, Robinson WP, Kuhner MK, Joe S, MacDonald MJ, Gottschall JL et al. Genetic heterogeneity, modes of inheritance, and risk estimates for a joint study of Caucasians with insulin-dependent diabetes mellitus. Am J Hum Genet 1988; 43(6): 799-816.
113. Valdes AM & Thomson G. Detecting disease-predisposing variants: the haplotype method. Am J Hum Genet 1997; 60(3): 703-716.
114. Becker T & Knapp M. Maximum-likelihood estimation of haplotype frequencies in nuclear families. Genet Epidemiol 2004; 27(1): 21-32.
115. Becker T & Knapp M. A powerful strategy to account for multiple testing in the context of haplotype analysis. Am J Hum Genet 2004; 75(4): 561-570.
116. Cucca F, Dudbridge F, Loddo M, Mulargia AP, Lampis R, Angius E et al. The HLA-DPB1--associated component of the IDDM1 and its relationship to the major loci HLA-DQB1, -DQA1, and -DRB1. Diabetes 2001; 50(5): 1200-1205.
117. Yang Z, Mendoza AR, Welch TR, Zipf WB & Yu CY. Modular variations of the human major histocompatibility complex class III genes for serine/threonine kinase RP, complement component C4, steroid 21-hydroxylase CYP21, and tenascin TNX (the RCCX module). A mechanism for gene deletions and disease associations. J Biol Chem 1999; 274(17): 12147-12156.
118. Bergström TF, Erlandsson R, Engkvist H, Josefsson A, Erlich HA & Gyllensten U. Phylogenetic history of hominoid DRB loci and alleles inferred from intron sequences. Immunol Rev 1999; 167: 351-365.
119. Lhotta K, Auinger M, Kronenberg F, Irsigler K & Konig P. Polymorphism of complement C4 and susceptibility to IDDM and microvascular complications. Diabetes care 1996; 19(1): 53-55.
120. Yang Y, Chung EK, Wu YL, Savelli SL, Nagaraja HN, Zhou B et al. Gene copy-number variation and associated polymorphisms of complement component C4 in human systemic lupus erythematosus (SLE): low copy number is a risk factor for and high copy number is a protective factor against SLE susceptibility in European Americans. Am J Hum Genet 2007; 80(6): 1037-1054.
121. Skanes VM, Barnard J, Farid N, Marshall WH, Murphy L, Rideout D et al. Class III alleles and high-risk MHC haplotypes in type I diabetes mellitus, Graves' disease and Hashimoto's thyroiditis. Mo-lecular biology & medicine 1986; 3(2): 143-157.
122. Fernando MM, Stevens CR, Walsh EC, De Jager PL, Goyette P, Plenge RM et al. Defining the role of the MHC in autoimmunity: a review and pooled analysis. PLoS Genet 2008; 4(4): e1000024.
123. Van Autreve JE, Koeleman BP, Quartier E, Aminkeng F, Weets I, Gorus FK et al. MICA is associated with type 1 diabetes in the Belgian population, independent of HLA-DQ. Hum Immunol 2006; 67(1-2): 94-101.
124. Gonzalez S, Rodrigo L, Lopez-Vazquez A, Fuentes D, Agudo-Ibanez L, Rodriguez-Rodero S et al. Association of MHC class I related gene B (MICB) to celiac disease. Am J Gastroenterol 2004; 99(4): 676-680.
125. Field SF, Nejentsev S, Walker NM, Howson JM, Godfrey LM, Jolley JD et al. Sequencing-based genotyping and association analysis of the MICA and MICB genes in type 1 diabetes. Diabetes 2008; 57(6): 1753-1756.
126. Caillat-Zucman S. How NKG2D ligands trigger autoimmunity? Hum Immunol 2006; 67(3): 204-207. 127. Purcell S, Neale B, Todd-Brown K, Thomas L, Ferreira MA, Bender D et al. PLINK: a tool set for
whole-genome association and population-based linkage analyses. Am J Hum Genet 2007; 81(3): 559-575.
128. Blomhoff A, Olsson M, Johansson S, Akselsen HE, Pociot F, Nerup J et al. Linkage disequilibrium and haplotype blocks in the MHC vary in an HLA haplotype specific manner assessed mainly by DRB1*03 and DRB1*04 haplotypes. Genes Immun 2006; 7(2): 130-140.
129. Roach JC, Deutsch K, Li S, Siegel AF, Bekris LM, Einhaus DC et al. Genetic mapping at 3-kilobase resolution reveals inositol 1,4,5-triphosphate receptor 3 as a risk factor for type 1 diabetes in sweden. Am J Hum Genet 2006; 79(4): 614-627.
130. Qu HQ, Marchand L, Szymborski A, Grabs R & Polychronakos C. The association between type 1 diabetes and the ITPR3 gene polymorphism due to linkage disequilibrium with HLA class II. Genes Immun 2008; 9(3): 264-266.
131. Lie BA, Sollid LM, Ascher H, Ek J, Akselsen HE, Ronningen KS et al. A gene telomeric of the HLA class I region is involved in predisposition to both type 1 diabetes and coeliac disease. Tissue Antigens 1999; 54(2): 162-168.
60

132. Koeleman BV, De Groot KN, Van Der Slik AR, Roep BO & Giphart MJ. Association between D6S2223 and type I diabetes independent of HLA class II in Dutch families. Diabetologia 2002; 45(4): 598-599.
133. Herr M, Dudbridge F, Zavattari P, Cucca F, Guja C, March R et al. Evaluation of fine mapping strategies for a multifactorial disease locus: systematic linkage and association analysis of IDDM1 in the HLA region on chromosome 6p21. Hum Mol Genet 2000; 9(9): 1291-1301.
134. Nejentsev S, Reijonen H, Adojaan B, Kovalchuk L, Sochnevs A, Schwartz EI et al. The effect of HLA-B allele on the IDDM risk defined by DRB1*04 subtypes and DQB1*0302. Diabetes 1997; 46(11): 1888-1892.
135. Valdes AM, Erlich HA & Noble JA. Human leukocyte antigen class I B and C loci contribute to Type 1 Diabetes (T1D) susceptibility and age at T1D onset. Hum Immunol 2005; 66(3): 301-313.
136. Nejentsev S, Gombos Z, Laine AP, Veijola R, Knip M, Simell O et al. Non-class II HLA gene associated with type 1 diabetes maps to the 240-kb region near HLA-B. Diabetes 2000; 49(12): 2217-2221.
137. Poirot L, Benoist C & Mathis D. Natural killer cells distinguish innocuous and destructive forms of pancreatic islet autoimmunity. Proc Natl Acad Sci U S A 2004; 101(21): 8102-8107.
138. van der Slik AR, Alizadeh BZ, Koeleman BP, Roep BO & Giphart MJ. Modelling KIR-HLA genotype disparities in type 1 diabetes. Tissue Antigens 2007; 69 Suppl 1: 101-105.
139. van der Slik AR, Koeleman BP, Verduijn W, Bruining GJ, Roep BO & Giphart MJ. KIR in type 1 diabetes: disparate distribution of activating and inhibitory natural killer cell receptors in patients ver-sus HLA-matched control subjects. Diabetes 2003; 52(10): 2639-2642.
140. Valentonyte R, Hampe J, Huse K, Rosenstiel P, Albrecht M, Stenzel A et al. Sarcoidosis is associated with a truncating splice site mutation in BTNL2. Nat Genet 2005; 37(4): 357-364.
141. Rybicki BA, Walewski JL, Maliarik MJ, Kian H & Iannuzzi MC. The BTNL2 gene and sarcoidosis susceptibility in African Americans and Whites. Am J Hum Genet 2005; 77(3): 491-499.
142. Orozco G, Eerligh P, Sanchez E, Zhernakova S, Roep BO, Gonzalez-Gay MA et al. Analysis of a functional BTNL2 polymorphism in type 1 diabetes, rheumatoid arthritis, and systemic lupus erythe-matosus. Hum Immunol 2005; 66(12): 1235-1241.
143. Simmonds MJ, Heward JM, Barrett JC, Franklyn JA & Gough SC. Association of the BTNL2 rs2076530 single nucleotide polymorphism with Graves' disease appears to be secondary to DRB1 exon 2 position beta74. Clin Endocrinol (Oxf) 2006; 65(4): 429-432.
144. Traherne JA, Barcellos LF, Sawcer SJ, Compston A, Ramsay PP, Hauser SL et al. Association of the truncating splice site mutation in BTNL2 with multiple sclerosis is secondary to HLA-DRB1*15. Hum Mol Genet 2006; 15(1): 155-161.
145. van der Slik AR, van den Eng I, Eerligh P, Doxiadis, II, Koeleman BP, Roep BO et al. Sequence variation within the major histocompatibility complex subregion centromeric of HLA class II in type 1 diabetes. Tissue Antigens 2007; 69(4): 348-353.
146. Owen CJ, Kelly H, Eden JA, Merriman ME, Pearce SH & Merriman TR. Analysis of the Fc-Receptor Like-3 (Fcrl3) Locus in Caucasians with Autoimmune Disorders Suggests a Complex Pattern of Dis-ease Association. J Clin Endocrinol Metab 2007; 92(3): 1106-1111.
147. Smyth DJ, Howson JM, Payne F, Maier LM, Bailey R, Holland K et al. Analysis of polymorphisms in 16 genes in type 1 diabetes that have been associated with other immune-mediated diseases. BMC Med Genet 2006; 7(1): 20.
148. Turunen JA, Wessman M, Kilpikari R, Parkkonen M, Forsblom C & Groop PH. The functional variant -169C/T in the FCRL3 gene does not increase susceptibility to Type 1 diabetes. Diabet Med 2006; 23(8): 925-927.
149. Duchatelet S, Caillat-Zucman S, Dubois-Laforgue D, Blanc H, Timsit J & Julier C. FCRL3 -169CT functional polymorphism in type 1 diabetes and autoimmunity traits. Biomed Pharmacother 2008; 62(3): 153-157.
150. Choi CB, Kang CP, Seong SS, Bae SC & Kang C. The -169C/T polymorphism in FCRL3 is not associated with susceptibility to rheumatoid arthritis or systemic lupus erythematosus in a case-control study of Koreans. Arthritis Rheum 2006; 54(12): 3838-3841.
151. Martínez A, Núñez C, Martín MC, Mendoza JL, Taxonera C, Díaz-Rubio M et al. Epistatic interaction between FCRL3 and MHC in Spanish patients with IBD. Tissue Antigens 2007; 69(4): 313–317.
61

62
152. Sanchez E, Callejas JL, Sabio JM, de Haro M, Camps M, de Ramon E et al. Polymorphisms of the FCRL3 gene in a Spanish population of systemic lupus erythematosus patients. Rheumatology (Ox-ford) 2006; 45(8): 1044-1046.
153. Bazerman MH & Samuelson WF. I Won the Auction But Don't Want the Prize. J Conflict Resolut 1983; 27(4): 618-634.